1. Introduction
Adopting sustainable development measures is now more imperative than ever before. According to the UN Intergovernmental Panel on Climate Change (IPCC) report, global warming will exceed 1.5 degrees Celsius by the 21st century if greenhouse gas emissions are not substantially reduced in the coming decades. As a result, addressing climate change and promoting a transition to a low-carbon economy has become a worldwide consensus. The European Commission formally put forward A Proposal for a Directive on Corporate Sustainability Due Diligence on 23 February 2022, aiming to formulate legally binding regulations that impose sustainable and responsible obligations on supply chain enterprises. Numerous supply chains are now highly aware of the significance of sustainability and are thus starting to produce more sustainable products. Coal-fired power plants still play an essential role in the power sector of developing countries, but they are the main source of air pollution emissions [
1]. To reduce greenhouse gas emissions, governments around the world have adopted a series of specific policies, among which the carbon emission tax policy is of the greatest significance, which can also be viewed as a government penalty on pollution from enterprises [
2].
Strict regulations require coal-fired power plants to reduce carbon emissions and pollutants, but coal-fired power plants often lack the power to internalize environmental externalities by investing in green technology due to a cost disadvantage [
3,
4,
5]. Industry evidence suggests that many products with poor sustainability in the market are competing with sustainable products [
6], and the power sector is no exception. Sustainable products are increasingly favored by green consumers [
7,
8], and from the perspective of the commodity attribute of electricity, its sustainability will be of concern to a wide range of electricity users. Eighty-two percent of Chinese households are willing to pay more for more sustainable power, according to surveys [
9]. However, due to information asymmetries, consumers have no access to the real production information of products, thus they often rely on signals from enterprises, but these signals cannot always accurately convey the real performance of those enterprises in the green dimension [
10]. Therefore, low-carbon development may be hindered by information asymmetry, as less sustainable supply chains may offset efforts made by more sustainable ones [
11,
12].
As a representative technology of the fourth technological revolution, blockchain technology is a highly effective solution to the above issues. Specifically, it is a distributed ledger database designed to verify and record transactions between parties [
13,
14]. Due to its consensus mechanism, blockchain technology can effectively curb unethical behavior in the supply chain and enable information transparency and traceability for sustainable production. This implies that sustainability in the supply chain domain will be verified more reliably, without exaggeration or false propaganda [
15,
16,
17]. Moreover, when consumers make purchasing decisions, the trustworthy sustainable information provided by blockchain technology will strengthen their purchase intention [
18]. Blockchain technology is also widely applied in the power sector. For example, Filament has developed an experimental blockchain-based system for publishing and sharing energy data. And Slock.it, a blockchain startup, has collaborated with German company RWE to launch a blockchain-based peer-to-peer electric vehicle charging project [
19]. Grid+ is an energy supplier that offers real-time metering and settlement services through blockchain technology, allowing consumers to purchase and pay for electricity automatically using smart contracts. Enerchain is a blockchain-based electricity trading platform that enables direct trading between energy companies without intermediaries. Additionally, IBM has partnered with Pacific Power to track renewable energy sources using blockchain technology, ensuring their authenticity. All in all, blockchain technology has great application potential in the energy and power sector, which is significant for enhancing business efficiency, trustworthiness, and transparency in the power sector.
Blockchain technology provides numerous benefits to the electric power industry, particularly in terms of cybersecurity. Firstly, it offers tamper-resistant data management, ensuring that records of electricity production, transmission, distribution, and sales are secure and complete. In addition, the data of power companies are usually highly confidential, and the encryption algorithms used in blockchain systems can protect the privacy of the data. Secondly, it enables transparency and traceability of transactions, making it easier to identify liability and resolve disputes. Thirdly, the decentralized nature of blockchain systems ensures greater security and reliability by preventing data leakage or transaction errors. Finally, smart contracts on the blockchain automate the execution of contractual terms, reducing the risk of human error and increasing operational efficiency. Therefore, blockchain technology enables electric utilities to manage and track transactions and data in a secure, transparent, and automated manner.
The architecture of the power blockchain system is shown in
Figure 1. Power companies place power generation, transmission, distribution, and consumption information on the blockchain, creating shared data ledgers. The blockchain provides internal control operations and external application services to power companies in an open, transparent, low-cost, and highly efficient manner so as to achieve the integration and sharing of data flow, business flow, energy flow, and other information.
On the basis of reliable on-chain data information, power sales enterprises and consumers can develop their own power sales and consumption strategies, respectively. Smart contracts can facilitate energy trading and scheduling, enabling the efficient matching of transactions between different parties. Key information queries can be conducted on the blockchain platform for transaction vouchers signed between power-selling enterprises and users, enabling traceability of power generation, transmission, and distribution processes. At the same time, information such as transaction time, transaction subject, transaction price, and electricity quantity can be obtained.
To expand their market share and business scope, improve their competitiveness, and promote the development of renewable energy, electric power enterprises are extending their reach upstream and downstream of the supply chain. They seek opportunities for vertical integration by collaborating with their upstream and downstream partners to jointly develop and apply new technologies and share resources and information. However, differences in resources and goals between power generating and selling enterprises often result in independent decision-making, which fails to improve the environmental sustainability of the electric power industry as a whole in the context of increasingly strict pollution emission control.
Therefore, it is of great practical significance to study cooperative emission reduction strategies between power generation and electricity selling companies under pollution emission control. This paper examines the potential benefits of combining blockchain technology with electricity consumption data to improve trust and transparency in the power industry, given consumers’ green preferences and distrust of green information. In addition to the adoption of blockchain technology to ensure open and transparent information about the power production process, the level of sustainability will be influenced by the coordination within the supply chain. The improvement of coordination methods may effectively enhance suppliers’ efforts in production and sustainability. Consequently, not only was the impact of blockchain application on the level of sustainability of the power supply chain examined, the impact of various coordination methods with blockchain technology on the level of green technology investment was also examined. We combined blockchain with different coordination methods and compared the different decision-making strategies by exploring the impact of blockchain technology on user trust and the impact of the share of on-chain electricity consumption information on the profitability of the power sector and the level of carbon emissions. This paper aims to find the optimal decision-making approach under the background of carbon tax policy.
The remainder of this paper is structured as follows.
Section 2 provides a literature review. Different emission reduction game models were constructed in
Section 3, including the basic model and game comparison results under three different scenarios.
Section 4 conducts numerical simulations of the model presented in this article. Finally,
Section 5 summarizes the research conclusions and proposes management insights.
3. Model Setup and the Solution
3.1. Strategies Introduction
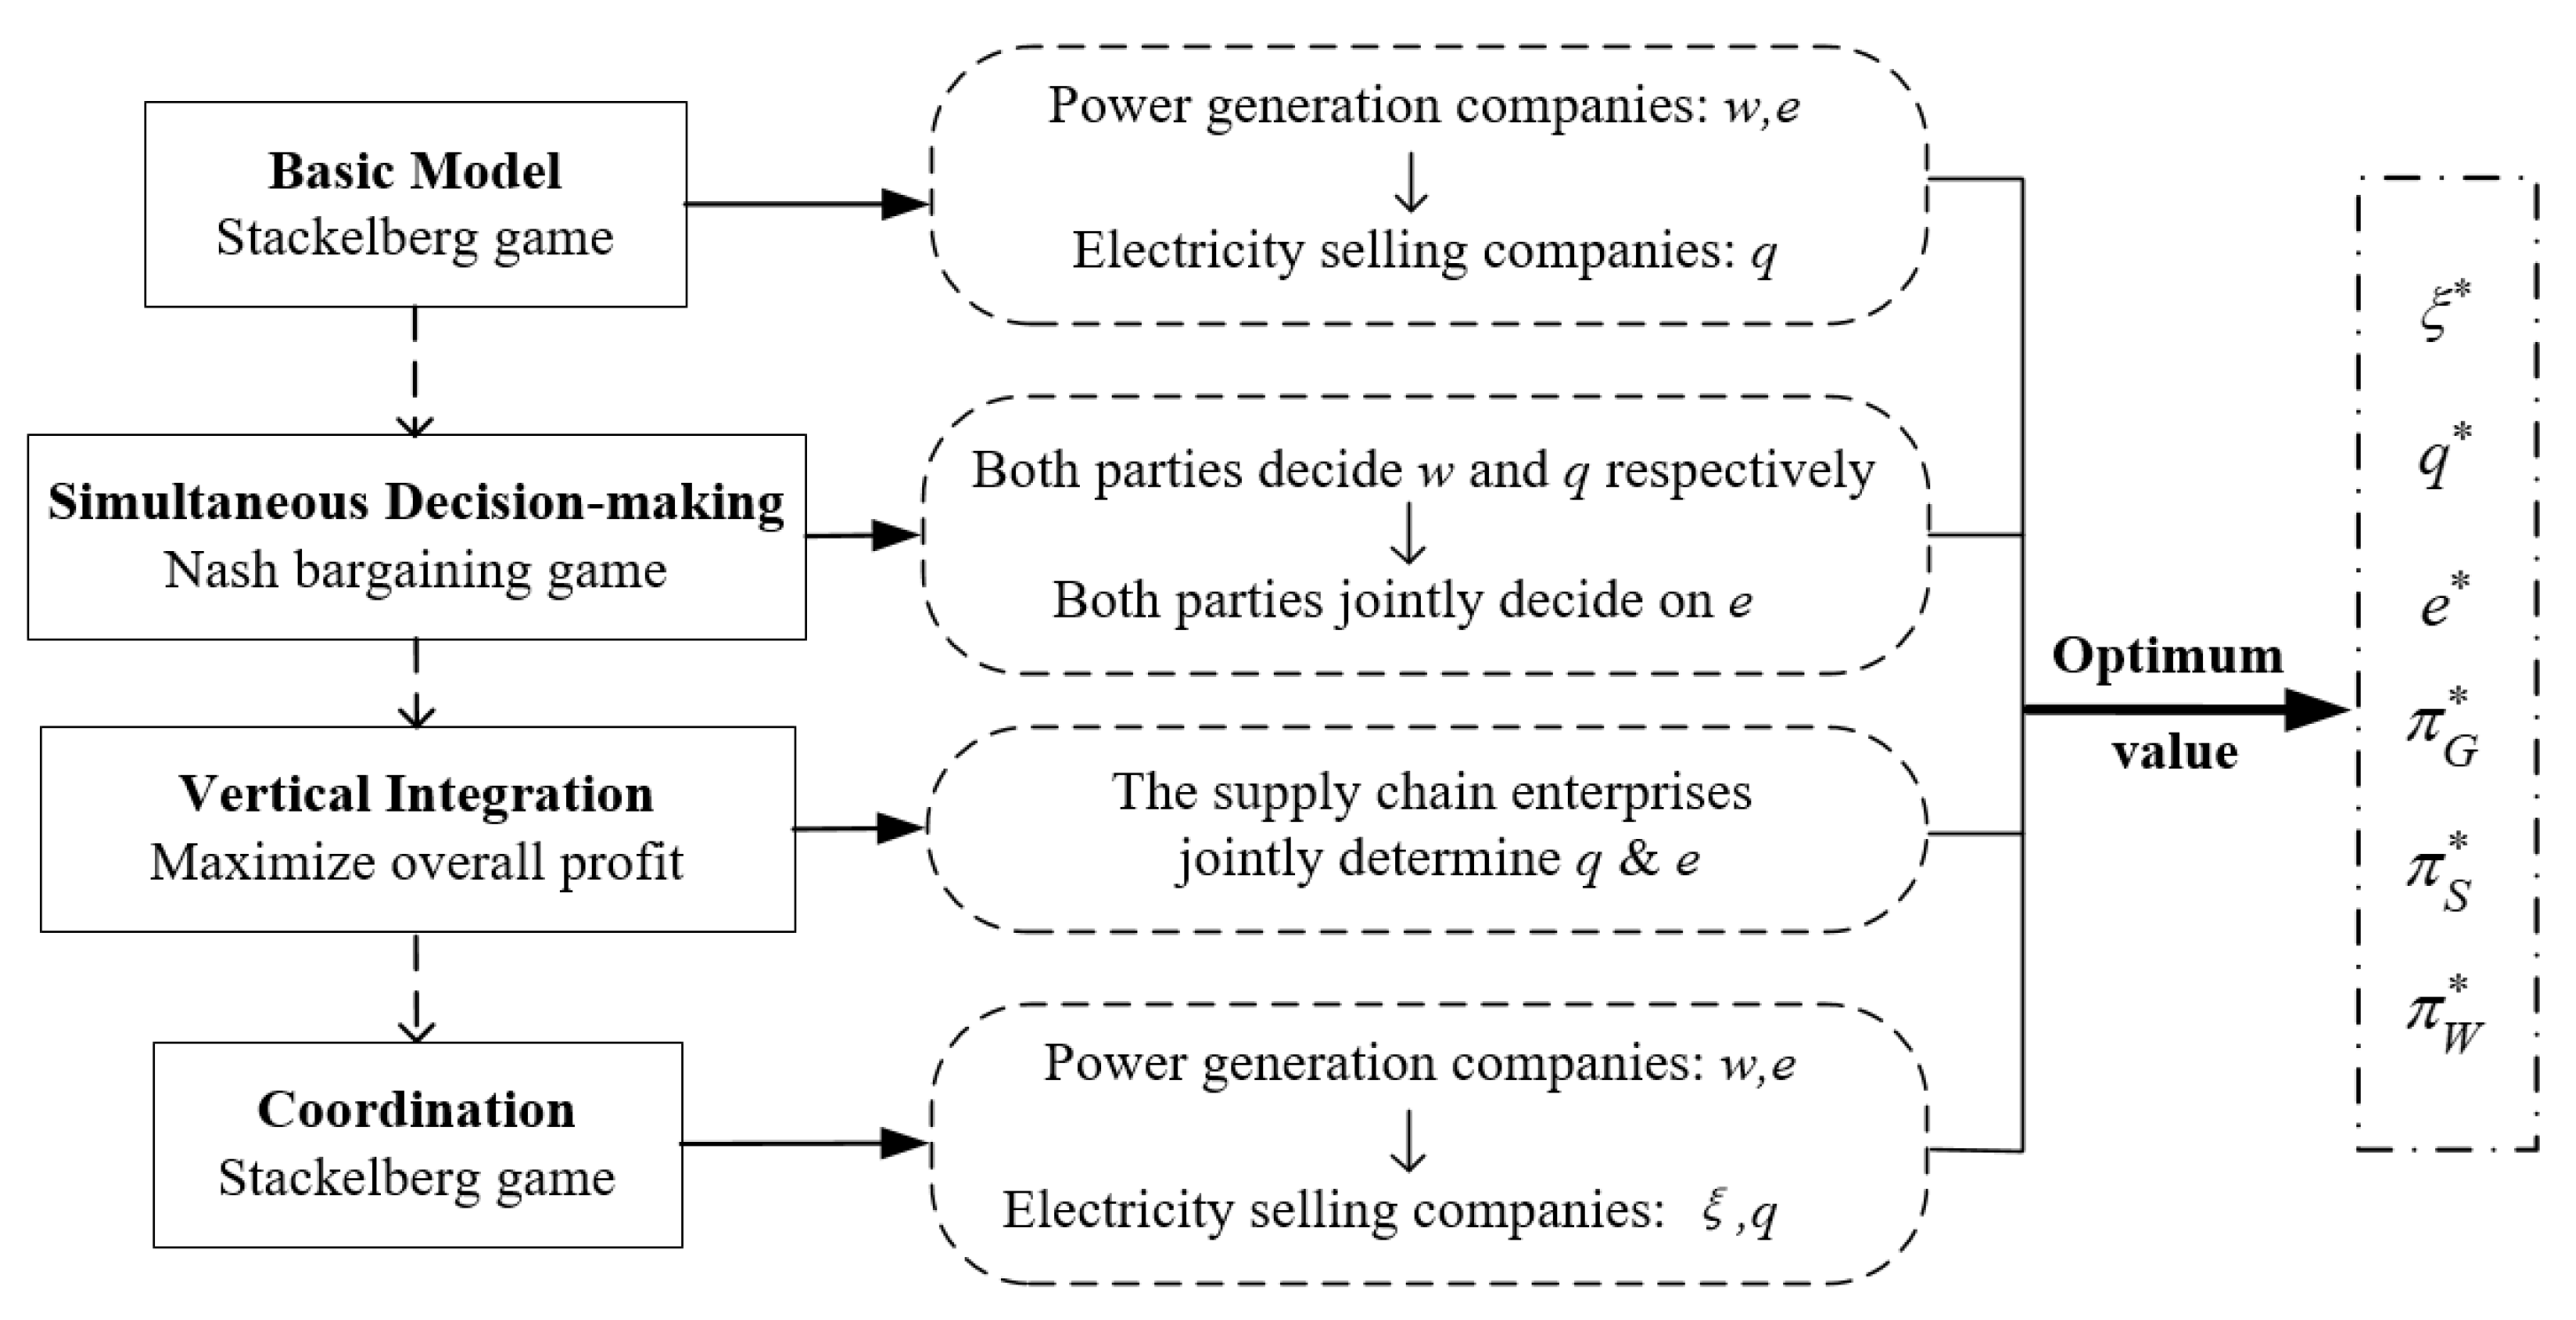
This paper examines four different strategies in the context of the power supply chain. Firstly, we analyzed the Stackelberg game (ST), where power generation enterprises dominate and decide the wholesale electricity price and emission reduction levels to maximize their profits, while electricity selling companies purchase electricity based on these decisions. Secondly, we compared and analyzed changes in corporate profits and carbon emission abatement under the Nash bargaining game (BA), where both decision-makers independently determine the wholesale electricity price and transaction volume, followed by jointly deciding on the carbon emission reduction level. Thirdly, we studied the decision outcome under mutual investment and acquisition sprees between power producers and sellers, also known as vertical integration (VI), where the two groups jointly decide on the transaction volume and emission reduction level, treating themselves as a single entity. Finally, we investigated the coordination contract (CO) between power generators and sellers, where electricity selling companies share a certain proportion of the power generators’ emission reduction costs. Through comparing the optimal values of the results of these four strategies, we explored different decision-making approaches and analyzed the changes in profits and sustainability levels when the power sales enterprises share the carbon abatement costs. As shown in
Figure 2, the model’s architecture and the decision-making sequence under various game approaches are as follows.
3.2. Basic Model and Assumptions
This study assumes that carbon emissions are generated by power producers. The decision sequence of the model is as follows: at the first stage, the power generation enterprises aim at profit maximization, and determine the sales price of electricity to the power sales enterprises w (i.e., wholesale price), and the investment level in carbon abatement technology e. is used to represent the cost of investment in carbon abatement technology by the power generation enterprises, where represents the corresponding cost coefficient, and the higher the , the lower the unit investment efficiency. Meanwhile, the unit cost of power generation is assumed to be k. In addition, the power generation enterprises include revenue to represent the unit carbon trading revenue, where can be interpreted as the unit cost reduction factor of power generation. At the second stage, the power sales enterprises make decisions on the amount of power supply q to maximize profits.
With the increasing concern of power users about carbon emission issues, the green level not only affects the cost of power enterprises, but also affects the demand of the power market. Assuming that its demand function is:
In the above equation, a is the initial market potential, b indicates the user’s price sensitivity coefficient (b > 0), and refers to the preference coefficient of the customer for the level of green technology of the power producer ( > 0).
A higher proportion of carbon emissions reduction information uploaded to the blockchain by power supply chain enterprises increases the transparency, reliability, and interactivity of the information, leading to a stronger willingness among users to consume emission-reduced electricity. This indicates that electricity consumers have a greater preference for such electricity. Therefore,
can be expressed by a primary function as
where
is the coefficient of the impact of blockchain technology on the degree of users’ trust in low-carbon information, and
indicates the proportion of on-chain electricity consumption information.
refers to the initial degree of user preference for emission-reduced electricity when the blockchain is not applied.
The model’s parameters and their definitions are summarized in
Table 1 for a clearer description of the model.
Assuming information symmetry between power producers and power sellers, and that both pursue profit maximization, the profit functions of power producers, power sellers and the overall power supply chain can be obtained as follows:
The Stackelberg game model dominated by power generation enterprises is used as the benchmark model, which is solved by using the inverse induction method first when both power producers and sellers play a full information dynamic game. For a power sales enterprise, the reaction function of its power sales
q is
Solving
,
simultaneously and obtain:
After substituting (7) and (8) into (6), and (6) into (3)–(5), collate to obtain
3.3. Simultaneous Decision-Making by Power Producers and Power Sellers
In addition to the sequential game, this subsection investigates the situation where both upstream and downstream enterprises in the power supply chain play simultaneously, utilizing the logic of the Nash bargaining game to solve the model, abbreviated as BA. In this game, the power generation and sales enterprises, respectively, set the corresponding wholesale tariff w and the quantity of sold electricity q, and finally both parties bargain and determine the level of carbon abatement for the power generation enterprise e.
Using the inverse induction method similarly for the power sales enterprises, let
, to obtain
, which is substituted into the profit function of the generation enterprises, let
, to obtain
Substituting the results into (3) and (4), find the profit functions of the power generation and sales enterprises, respectively, with respect to
e:
In decision-making, the problem of profit maximization of both parties is to solve
, such that
, giving:
Substituting (17) in (14), (15), and (16), respectively, collate to obtain
Theorem 1. When power producers and power sellers work together to decide the carbon reduction level through the Nash bargaining game, the green level of power producers and the energy sales of power sellers are greater than those in the Stackelberg game dominated by power producers. For the profits of power producers and power sellers, there are , .
Proof of Theorem 1. Observe and to obtain from . Similarly, obtain , , . □
Theorem 1 suggests that when power producers and power sellers make decisions simultaneously, power producers will negotiate with power sellers for higher levels of carbon abatement from the perspective of increasing electricity sales. The higher level of sustainability by the power generation enterprise promotes market demand, but the wholesale price of electricity rises due to the higher cost of generation. Although the quantity of electricity sold increased, the technical costs associated with carbon emissions reduction are higher, resulting in a decrease in profits for both producers and sellers compared to decentralized decision-making.
3.4. Vertical Integration Decision for Power Supply Chain Enterprises
Unlike master–slave games and simultaneous decision-making, where there are two game entities, in the vertical integration decision-making of power supply chain enterprises, the power producers and sellers merge to make decisions on selling electricity quantity
q and carbon emission reduction technology investment level
e. The overall profit function
, solving
and
simultaneously and obtain
Substitute
to get
Theorem 2. Under the vertical integration decision, power generation enterprises and power-selling enterprises can achieve higher levels of electricity sales and carbon emissions reduction compared to the Stackelberg game, and the overall profit of the supply chain is also higher compared to the Stackelberg game dominated by power generation enterprises.
Proof of Theorem 2. Observe and , with , is obtained, and similarly ; with , is obtained. □
Theorem 2 demonstrates that, compared to the master–slave game, vertical integration decision-making by power generation and sales enterprises can achieve higher levels of electricity demand and carbon reduction overall. This is due to the fact that independent decision-making by power generation and sales enterprises in Stackelberg games can lead to both parties neglecting the overall profits of the power industry, resulting in a dual marginal effect for power supply chain enterprises. By vertically integrating power generation and electricity sales, enterprises can extend their own industrial chain upstream and downstream while achieving higher levels of carbon emissions reduction. Proposition 2 confirms that under the trend of mutual investment and acquisition between power generation and sales enterprises in the power industry, this approach has a promoting effect on improving the carbon emission reduction level of the industry.
3.5. Cooperative Abatement Contract
The aforementioned game outcomes demonstrate that under the Nash bargaining game decision of both power producers and power sellers, even though the level of sustainability can be improved, the supply chain also loses some profits, so power producers and power sellers cannot reach cooperation. Independent decision-making will have a dual marginal effect, resulting in lower overall profits in the supply chain compared to vertical integration models. Both parties can only establish and maintain a strong cooperative relationship if the benefits of cooperation are allocated fairly, thus a new cooperation contract is designed herein between power producers and sellers to reduce carbon emissions.
This contract is based on the Stackelberg game strategy dominated by the power generation enterprises, and the power sales enterprises choose to share the expenses of carbon reduction in the proportion of
(
), at which point the power generation and sales enterprises have the following profit functions:
As solved in the basic model, the reaction function of power sales
with the wholesale tariff and the green level can be obtained for power sales enterprises as
Substituting into (24), solving
,
simultaneously, and substituting the result into (25) to solve
, and obtain:
Substituting
,
,
, and
, and obtain:
Theorem 3. Under the cooperative carbon reduction contract between power producers and power sellers, the proportion of carbon reduction costs that power sellers may bear decreases as the carbon reduction cost rises, and increases as the unit generation cost reduction factor , the influence factor of blockchain technology on customer trust , and the proportion of on-chain electricity consumption information rise.
Proof of Theorem 3. The first-order conditions of on , , and are solved, respectively, and obtain , , , , and . □
Theorem 3 suggests that when power producers invest in high-cost carbon abatement technologies, power sellers can only bear a lower proportion of carbon abatement costs. However, when the level of sustainability has a greater impact on customer market demand, power sales enterprises will voluntarily bear a larger proportion of carbon abatement costs for profits. When making an investment in abatement, the larger the unit power generation cost reduction factor, the smaller the investment cost for power generation generators and sellers, and thus the higher the carbon reduction cost that power sales enterprises are willing to bear. In addition, the greater the degree of integration between supply chain production and operation and blockchain technology, and the higher the proportion of emission-reduced electricity information uploaded to the blockchain, the stronger the preference of users for emission-reduced electricity. As a result, power sales enterprises are willing to bear a higher proportion of carbon emissions reduction costs, indicating that the application of blockchain technology in the power sector has a positive impact on both the power market and carbon emissions reduction.
Theorem 4. In the cooperative abatement decision between power producers and power sellers, the output of power producers, the green level, and the profit of both sides of the decision are higher than those in the Stackelberg game dominated by power producers.
Proof of Theorem 4. , and similarly , , and . □
Theorem 4 suggests that the participation of power sales enterprises in bearing the carbon reduction costs of power generation enterprises increases both the revenue and the green level of power generation enterprises, as every portion of abatement costs borne by the power sellers can directly contribute to the reduction of the expenditure of power producers. The higher level of sustainability of power generation enterprises also brings a greater market demand for power sales enterprises. The increase in revenue from the increased sales volume is greater than the cost borne by electricity sales enterprises, which ultimately leads to an increase in the profits of both decision-making parties. Therefore, cooperation in the power industry can help achieve carbon emissions reduction goals, and local governments where electricity sales enterprises are located should adopt incentive policies to encourage carbon emissions reduction cooperation and promote the green development of the industry.
Theorem 5. Under the cooperative emissions reduction contract, Pareto improvement of each member of the power supply chain can be achieved when the cost-sharing ratio of carbon abatement by the power sales enterprises meets .
Proof of Theorem 5. Solve and simultaneously, and substitute the results into (24) and (25) to obtain and . When , > 0; when , get . In summary, the supply chain can achieve the overall Pareto improvement between power producers and sellers by establishing cooperative abatement contracts when the cost-sharing ratio of power sales enterprises meets . □
Theorem 5 shows that when the cost-sharing ratio of carbon abatement by power sales enterprises is within a certain range, power producers and power sellers are willing to reach this cooperative abatement contract. This is because by allowing the power seller to share part of the abatement costs, both parties can benefit from the decision, in addition to increasing the level of power sales and carbon abatement, thus achieving win–win cooperation among supply chain members.
4. Numerical Analysis
To provide a more vivid and concrete demonstration of the impact of each exogenous variable on the equilibrium outcome of the power supply chain, this paper conducted a numerical analysis to validate the model presented above. Specifically, this paper used Python 3.7 as the programming language and PyCharm as the integrated development environment (IDE) for conducting the simulations.
With the help of the data from the cost study of technology update by He et al. [
51] for power enterprises, the cost of technology update for 2300 MW coal-fired units is 4051 RMB/kW, and the enterprises can reduce 10–30% of carbon emissions from power production after carbon abatement technology update. Using the capacity of coal-fired units to express the level of investment in carbon abatement technology
, according to its update cost
, the investment parameter
= 5.3 was obtained, and the current carbon emission per unit of coal-fired power supply was 0.96 kg/kW-h.
In this paper, the case is considered that a power producer can reduce 20% of carbon emissions by upgrading a 2300MW coal-fired unit with a carbon price of 50 RMB/t, and obtain a unit cost reduction coefficient for power generation = 4.3 × 10⁻⁷, and fixed exogenous variables a = 5000, b = 0.3, k = 0.55, and = 0.7.
In order to make it easier and more intuitive for readers to understand the numerical analysis results of this article, a nomenclature table has been added to the following numerical analysis chart:
| Abbreviation | Meaning |
| ST | Stackelberg game led by power producers |
| BA | Both power producers and sellers make Nash bargaining decisions simultaneously |
| VI | Vertical integration decision-making of power supply chain |
| CO | Decision on emission reduction through cooperation between power producers and sellers |
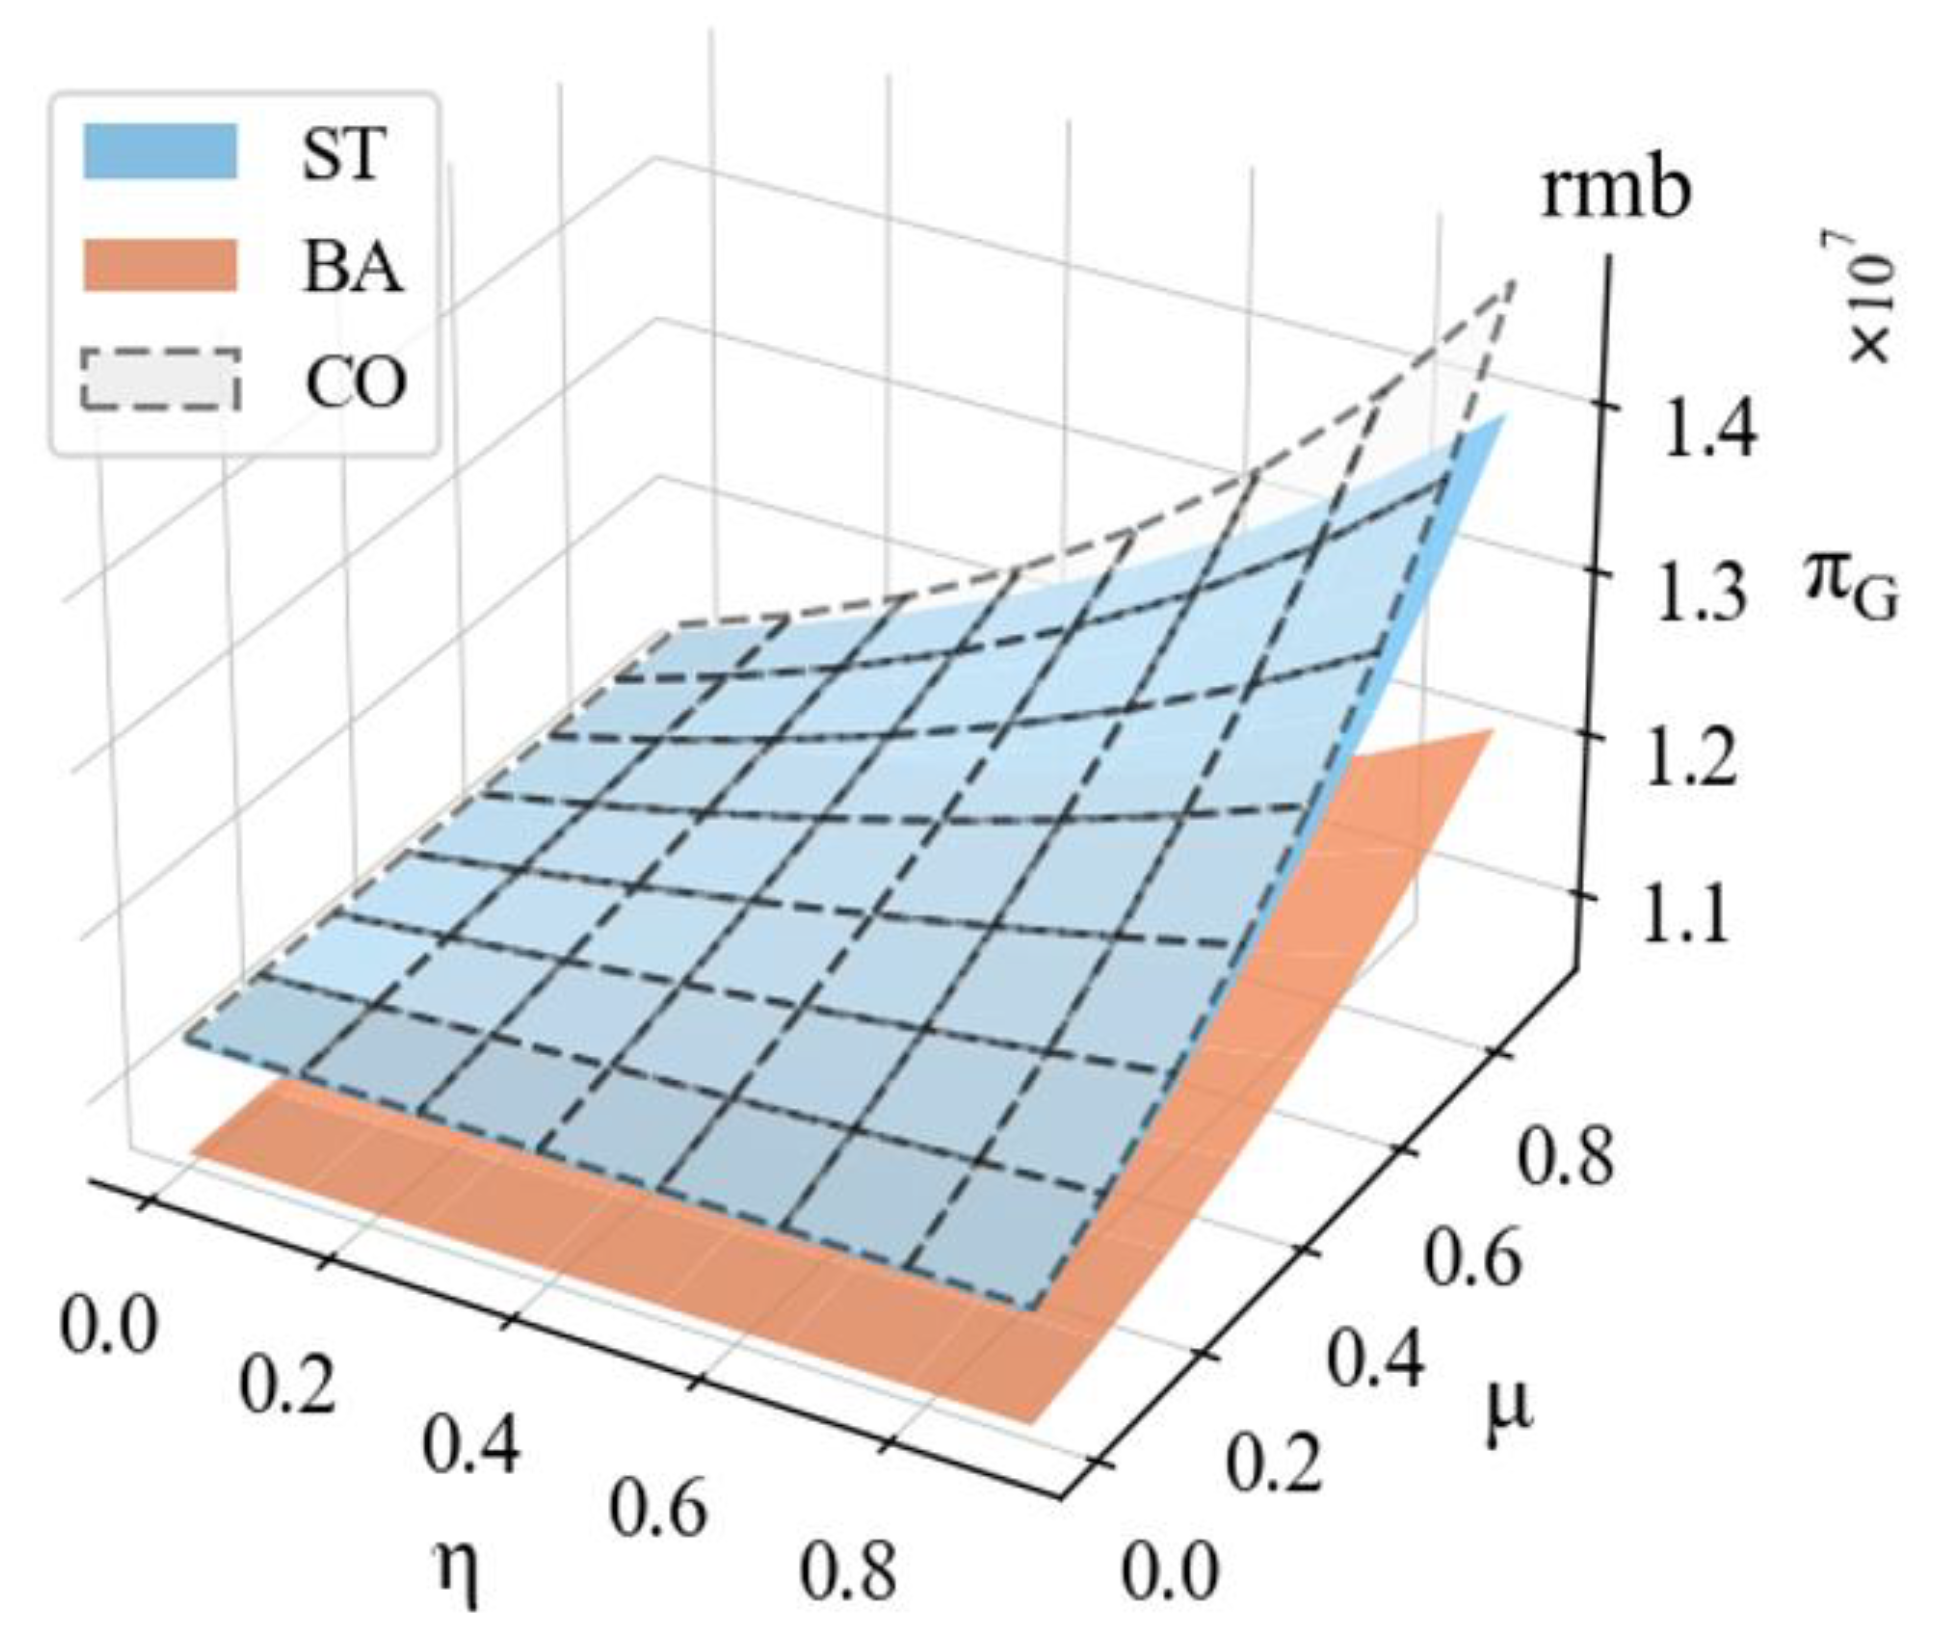
Firstly, the impacts of the influence coefficient of blockchain technology
and the “on-chain” proportion of electricity information
are discussed. Taking
and
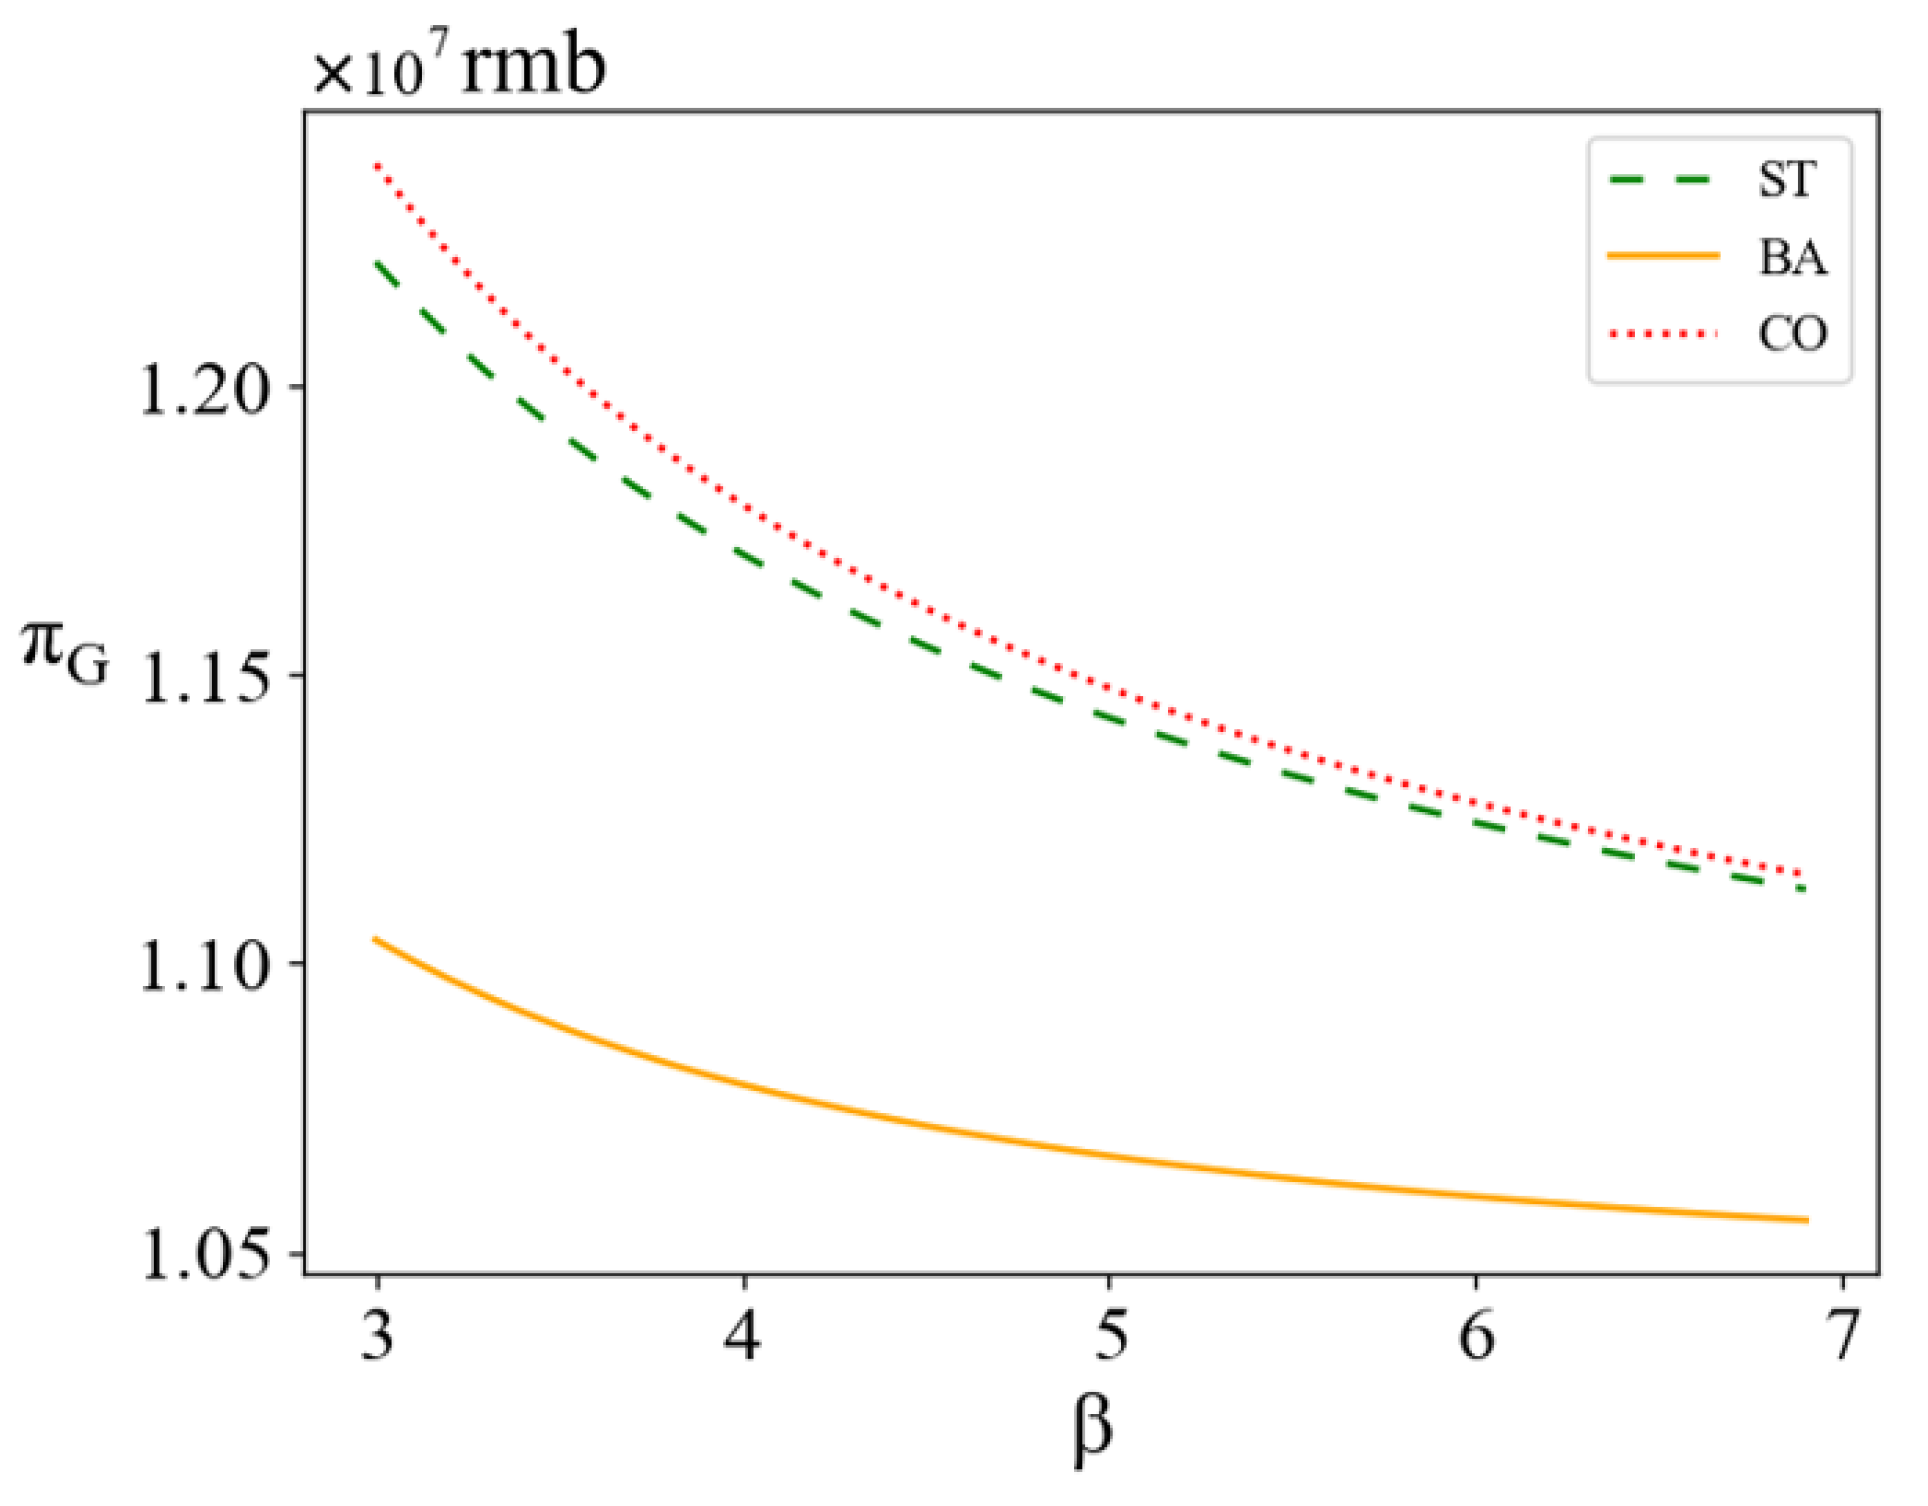
, we can obtain the trend of profit of power generation enterprises (
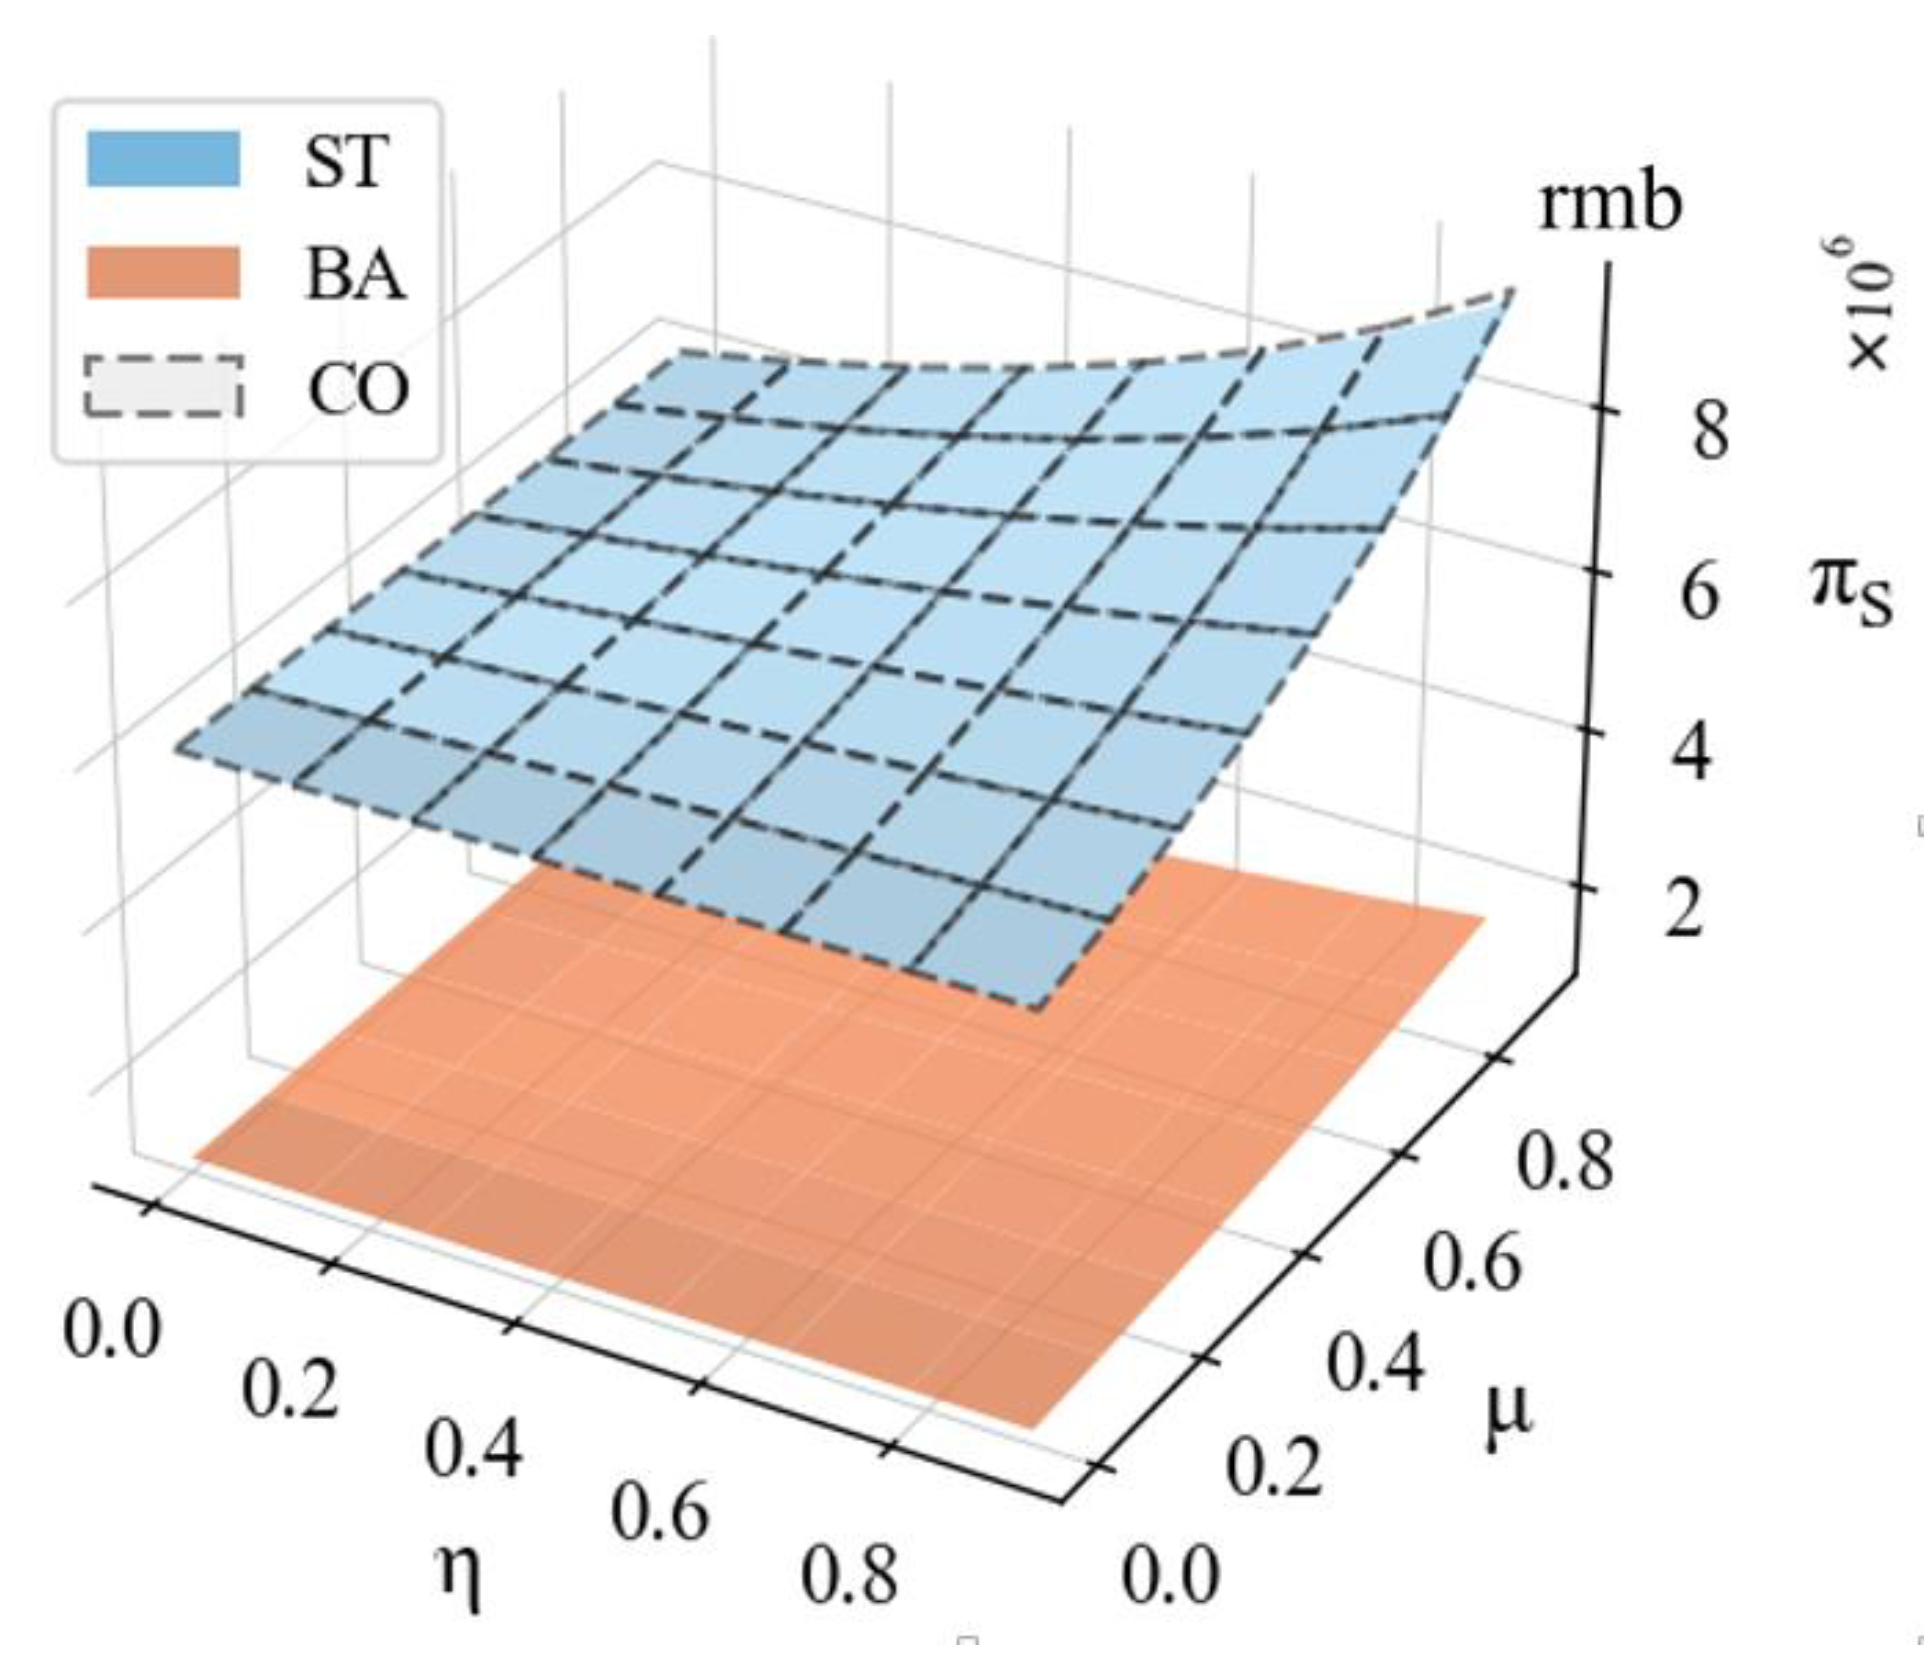
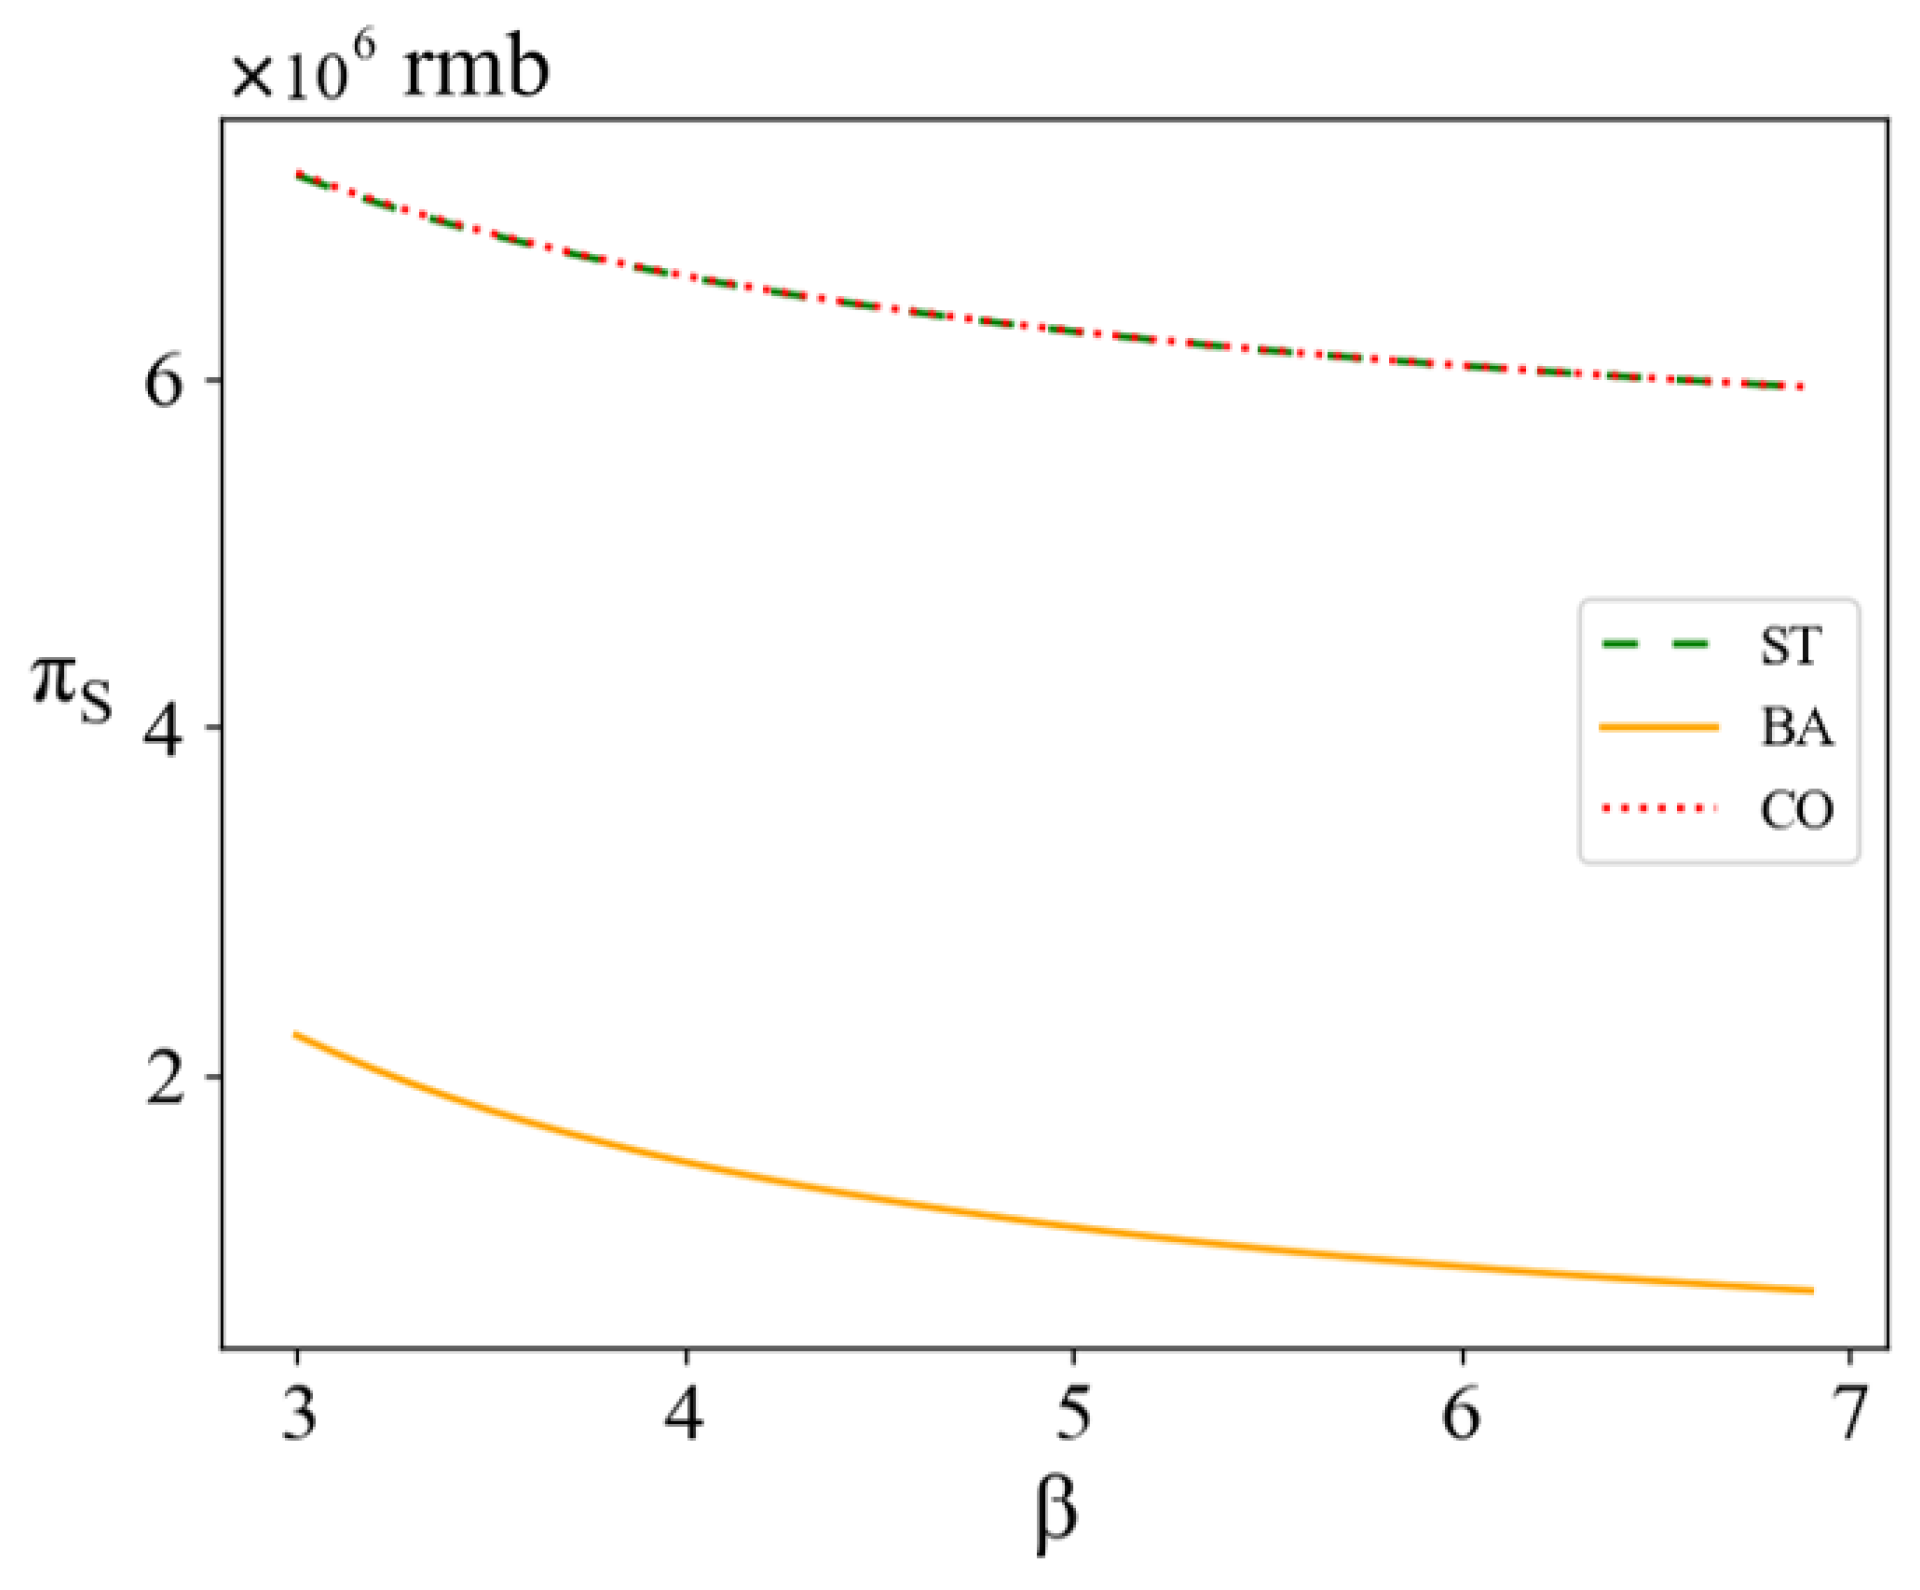
Figure 3), profit of power sales enterprises (
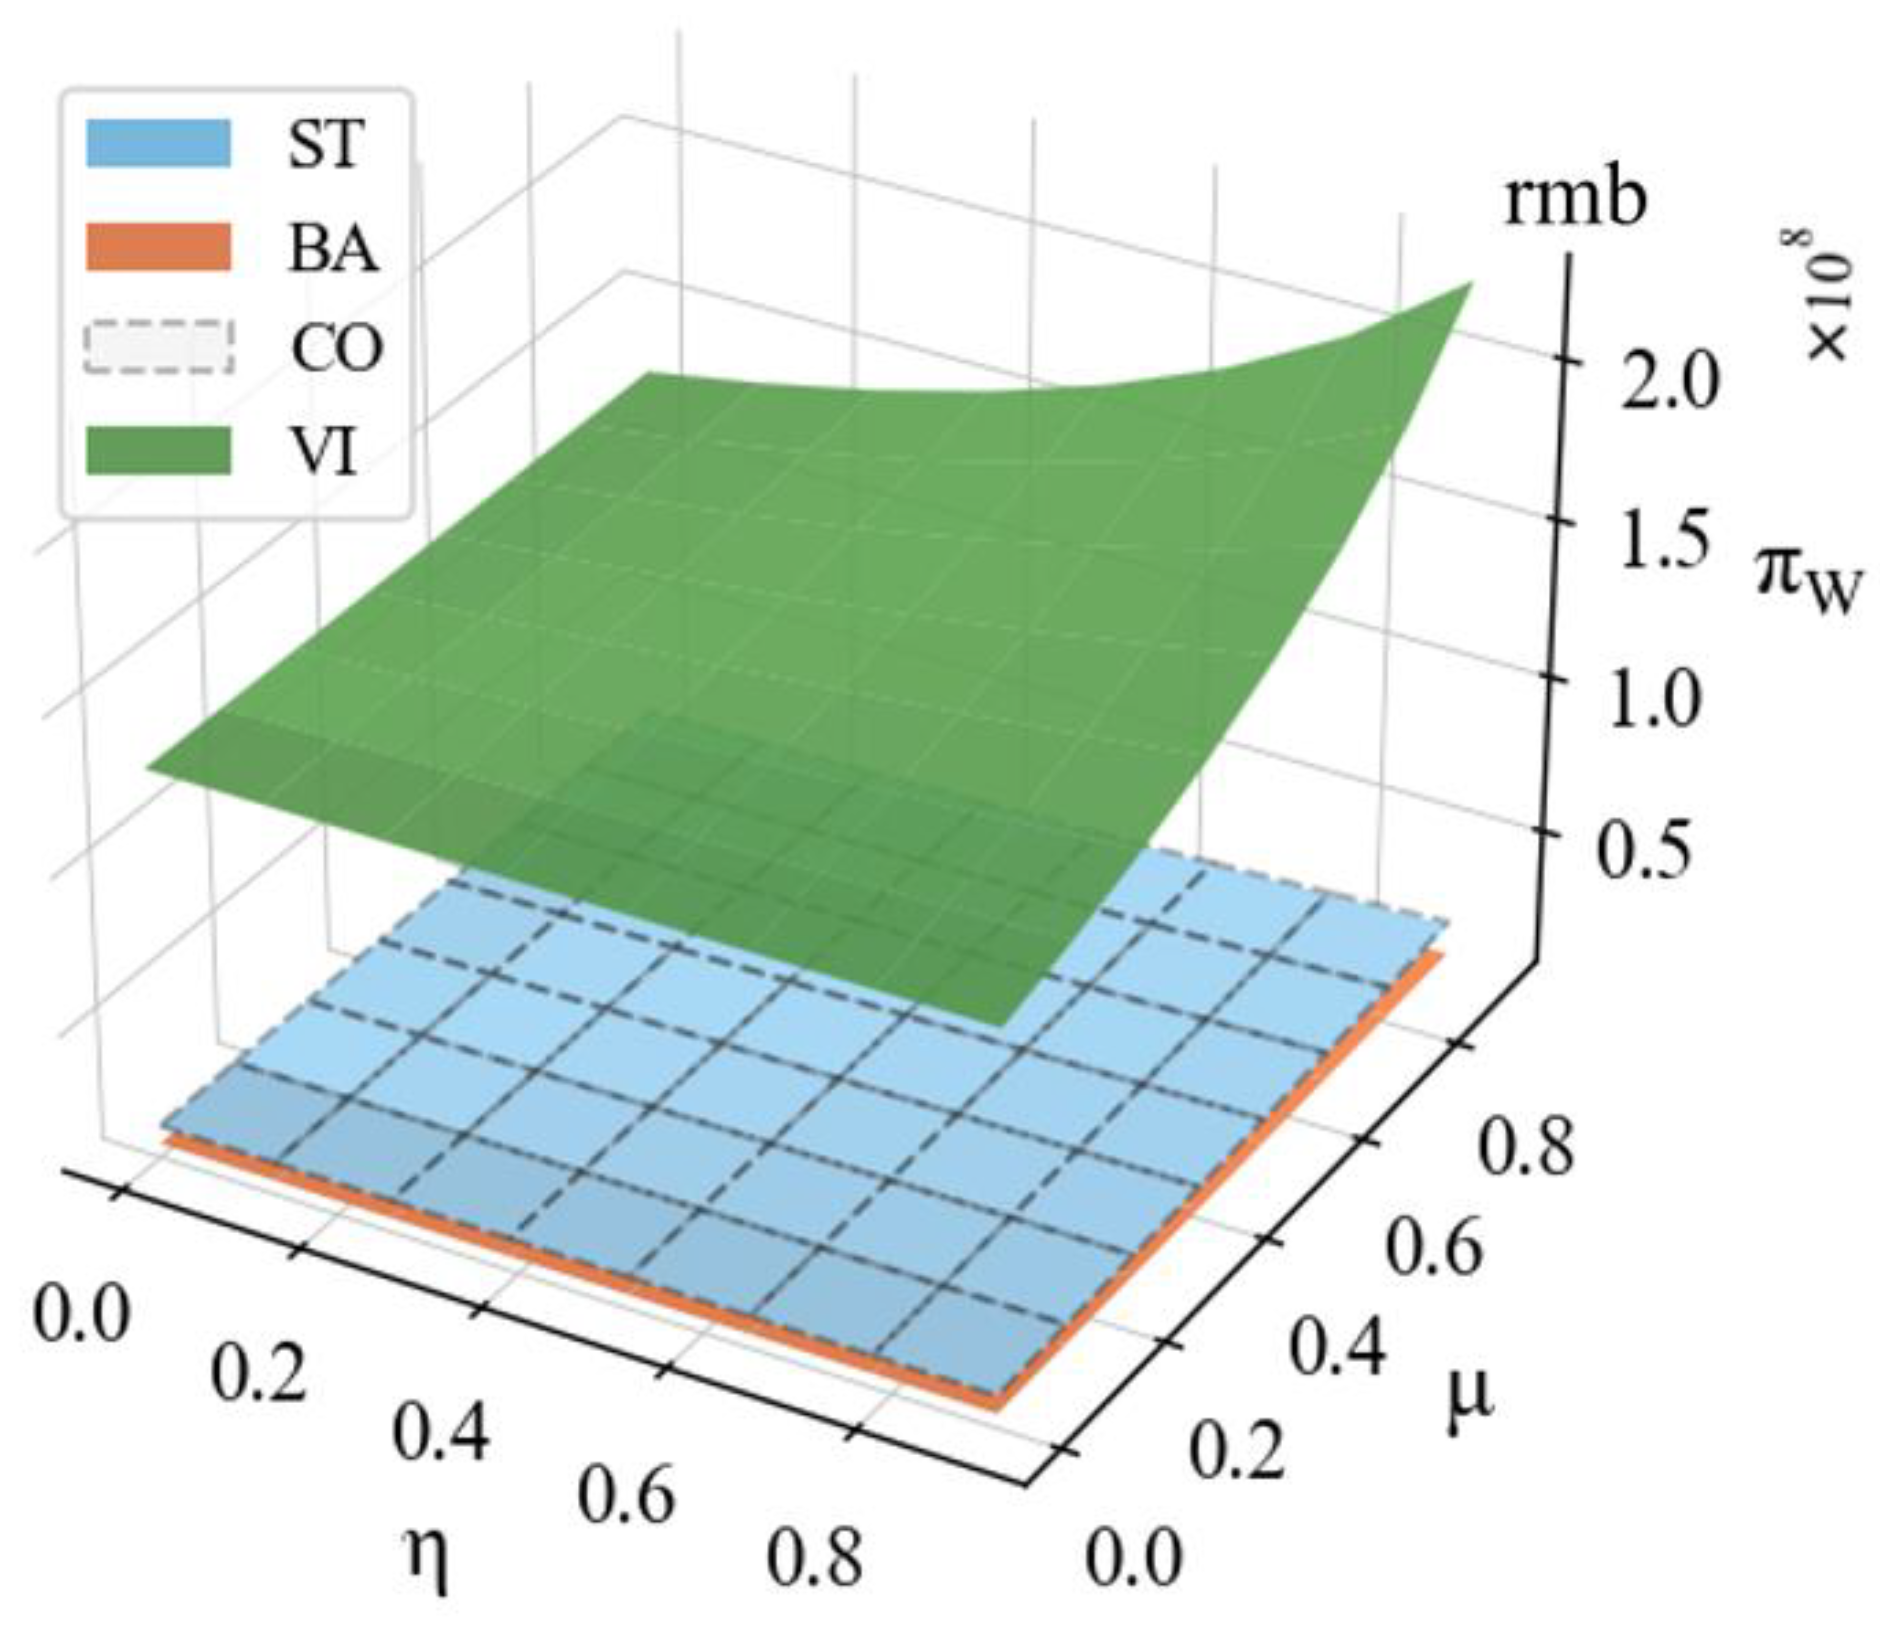
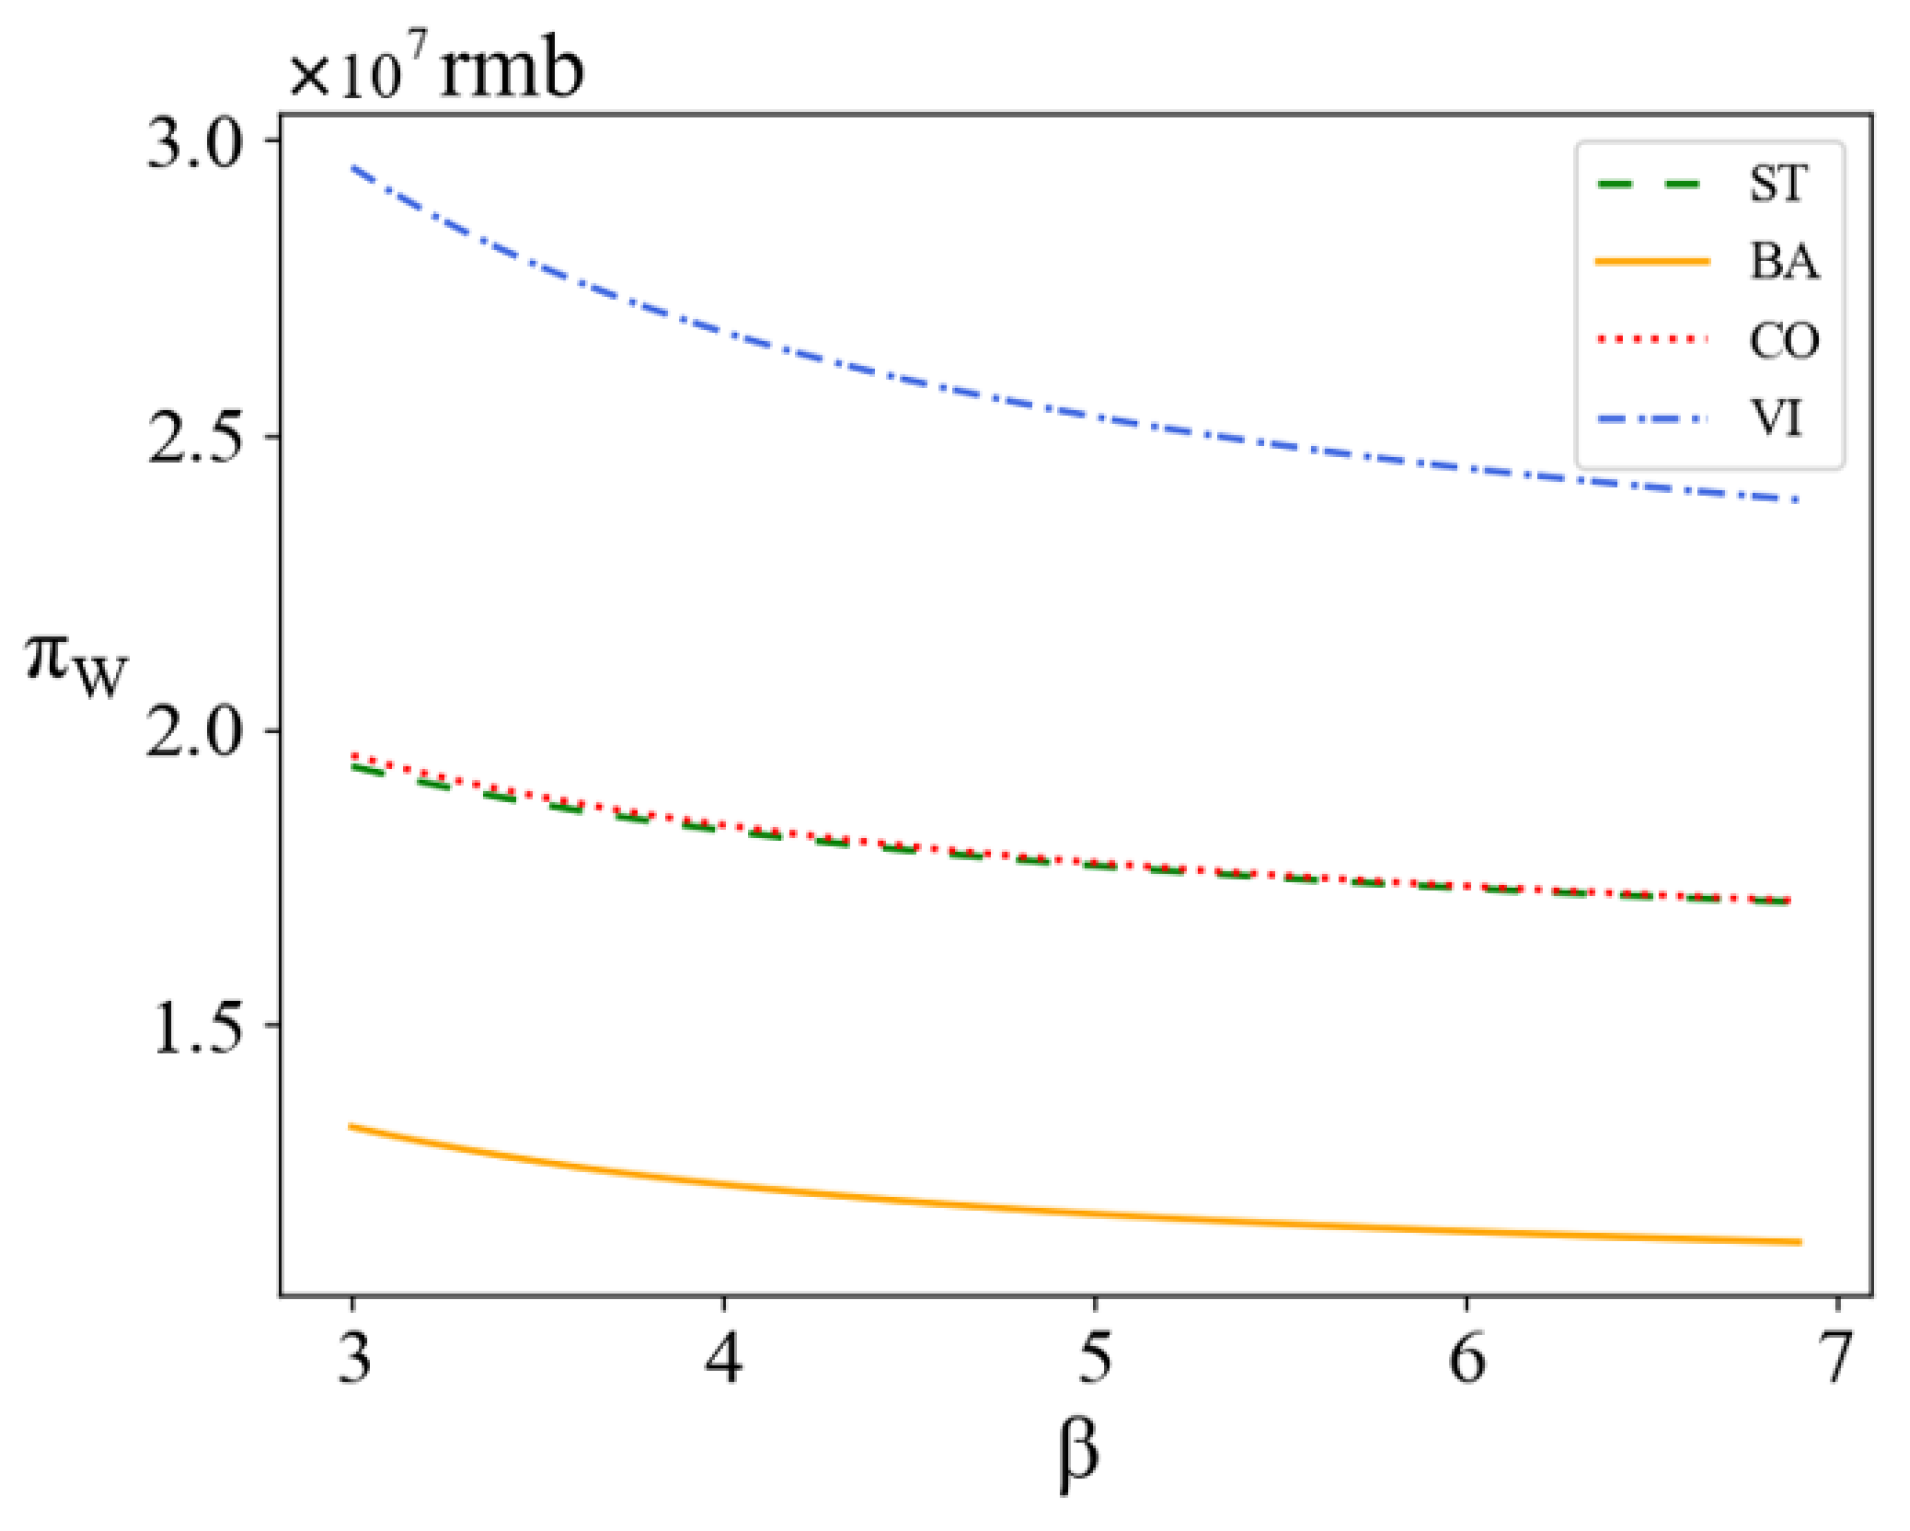
Figure 4), overall profit of power generation and sales enterprises (
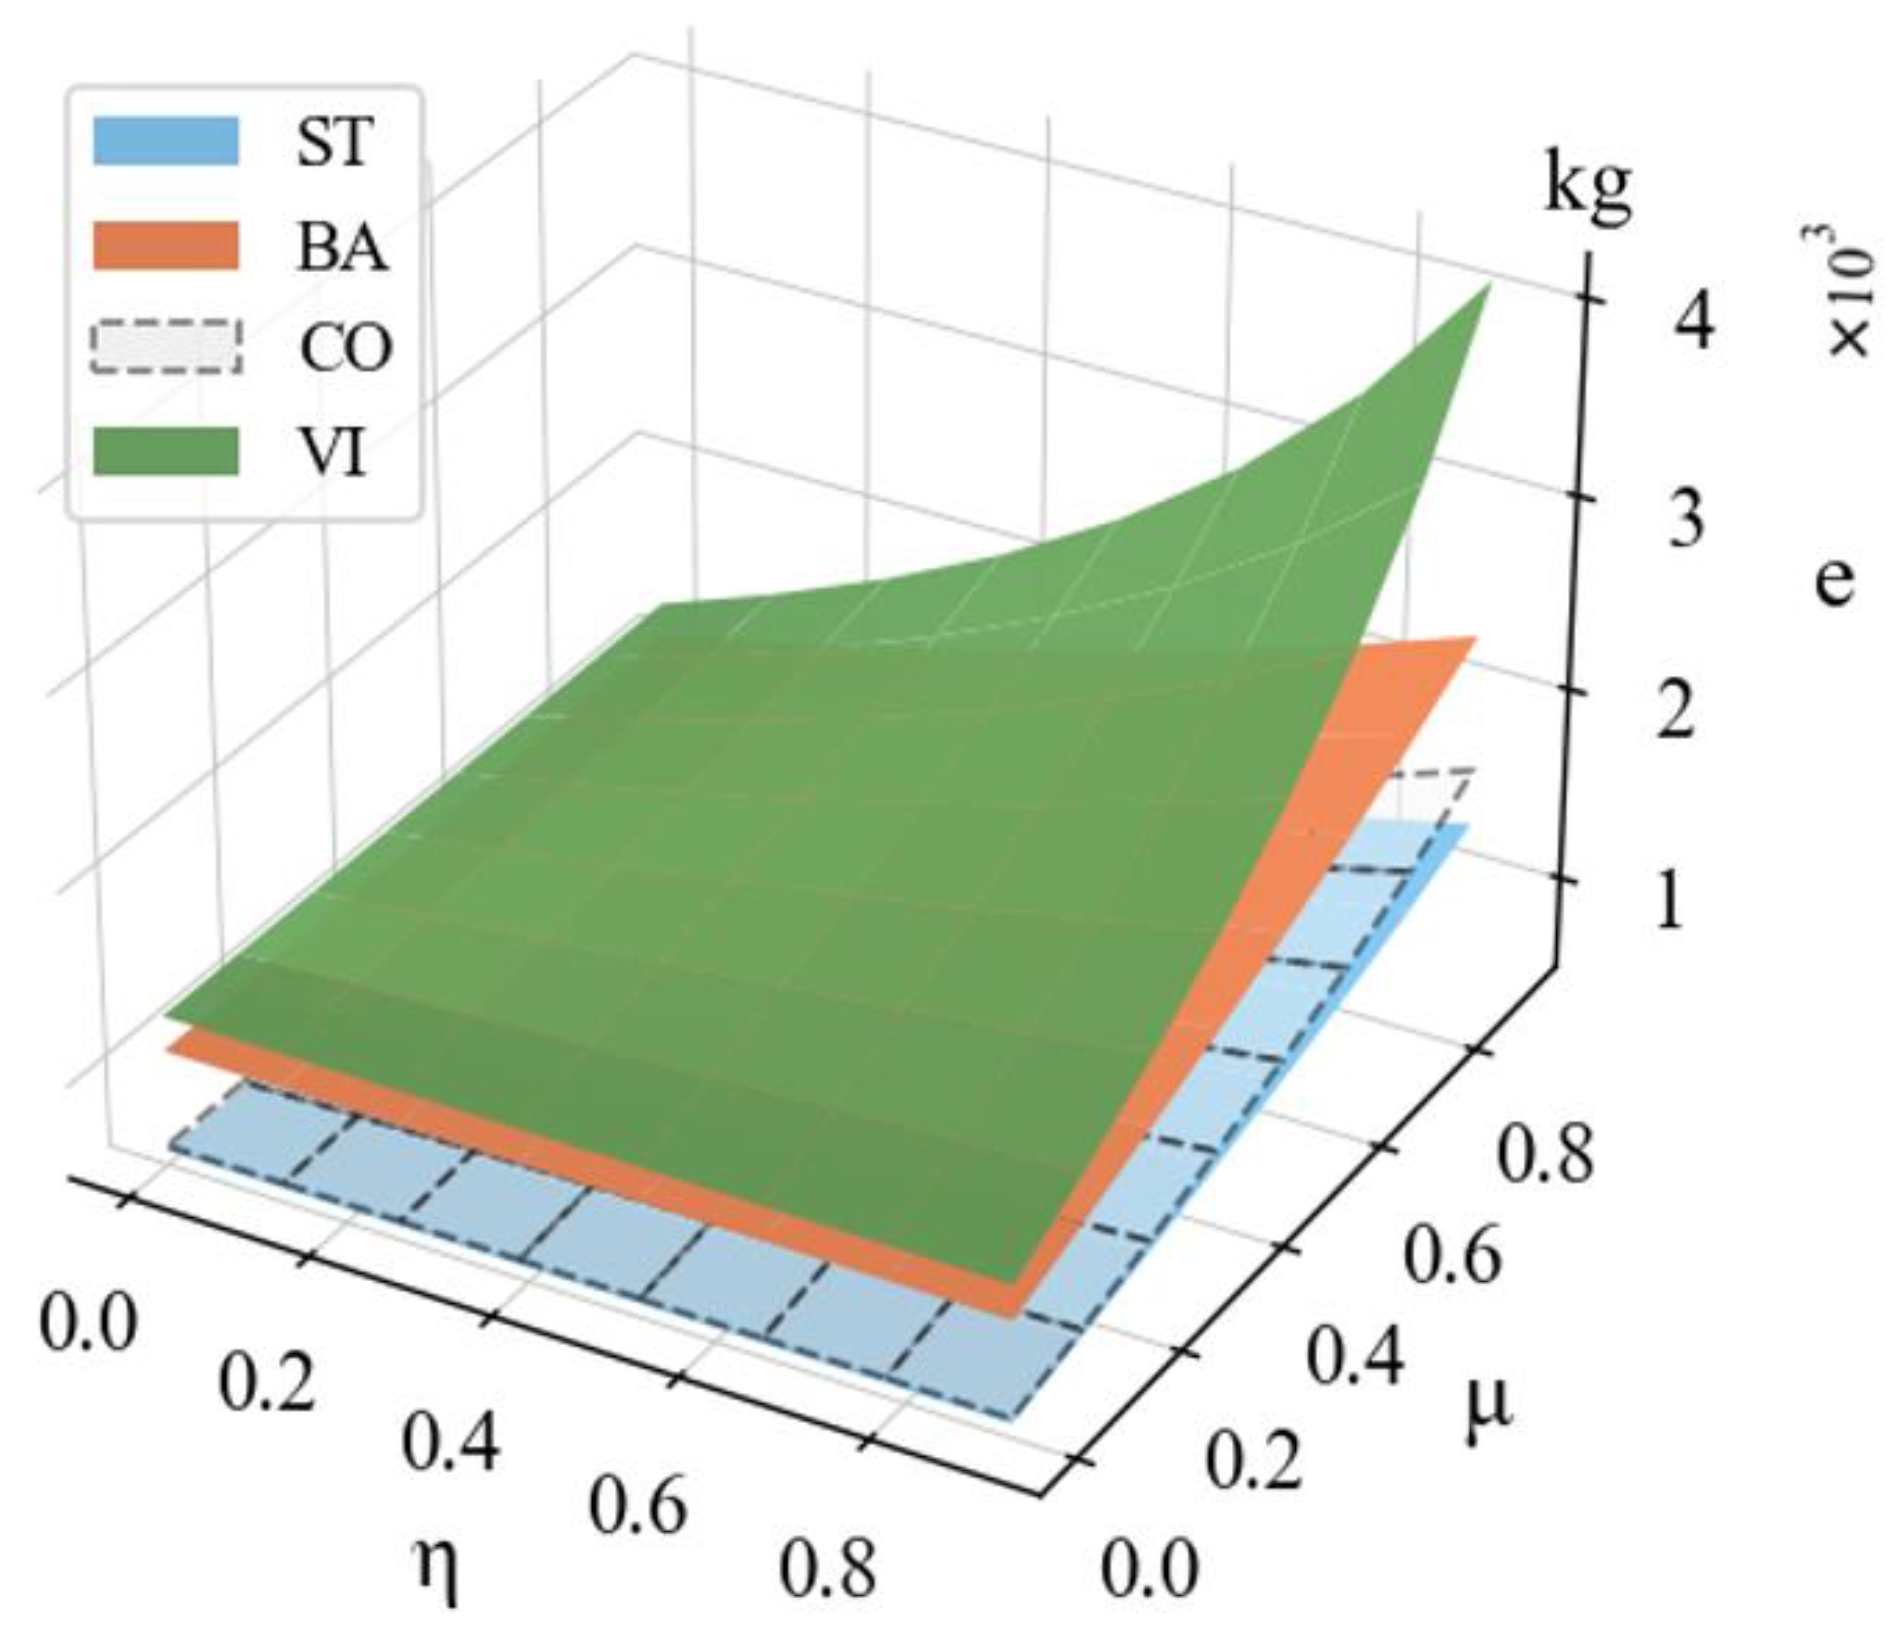
Figure 5) and the sustainability level of power generation enterprises (
Figure 6) under different decisions with the degree of influence of users on blockchain technology and the changes of on-chain proportion.
From
Figure 3,
Figure 4,
Figure 5 and
Figure 6, it can be seen that the preference of power users for blockchain technology and the proportion of on-chain low-carbon power information can have a significant impact on the profit and green level of both decision-makers. By popularizing the technical characteristics of power blockchain to users, the trust of users can be increased, and with the implementation of power blockchain, the increasing proportion of on-chain electricity information can make the power industry develop in a green and sustainable direction.
By comparing
Figure 3,
Figure 4, and
Figure 6, it can be observed that under simultaneous decision-making, although the industry’s sustainability level is increased compared to the case of cooperative reduction, the increase in the reduction level implies a significant cost, resulting in less profitability for both decision-makers than in the case of decentralized decision-making. This is inconsistent with the viewpoint presented in reference [
64], which suggests that in the absence of coordination mechanisms, decentralized decision-making results in lower profits and service levels compared to centralized decision-making.
In addition to the profits on both sides of the decision, the green level under the cooperative abatement contract also increases compared to the Stackelberg game model dominated by power producers. As analyzed in the previous section, each carbon abatement cost borne by the power sales enterprise causes an increase in the profit of the power generation enterprise, and the increase in the profit of the power sales enterprise due to the increase in power sales is far greater than the abatement cost borne by it, which verifies the rationality and effectiveness of the cooperative abatement strategy proposed in the text.
Reference [
65] suggests that horizontal collaboration between members of two supply chains can lead to higher profits, but the green quality level of the products is still not ideal. Therefore, this paper considers achieving the aforementioned dual objectives through vertical collaboration within the supply chain. From
Figure 5 and
Figure 6, it can be seen that the overall profit and sustainability levels are higher in the case of vertical integration decisions of power producers and sellers compared with other decisions, indicating that the trend of mutual acquisition and vertical integration among power supply chain enterprises is beneficial to the green development of the power industry, and the vertical integration decision is the optimal decision to maximize the sustainability level and overall profit of the power industry. This is consistent with the research conclusion in reference [
66].
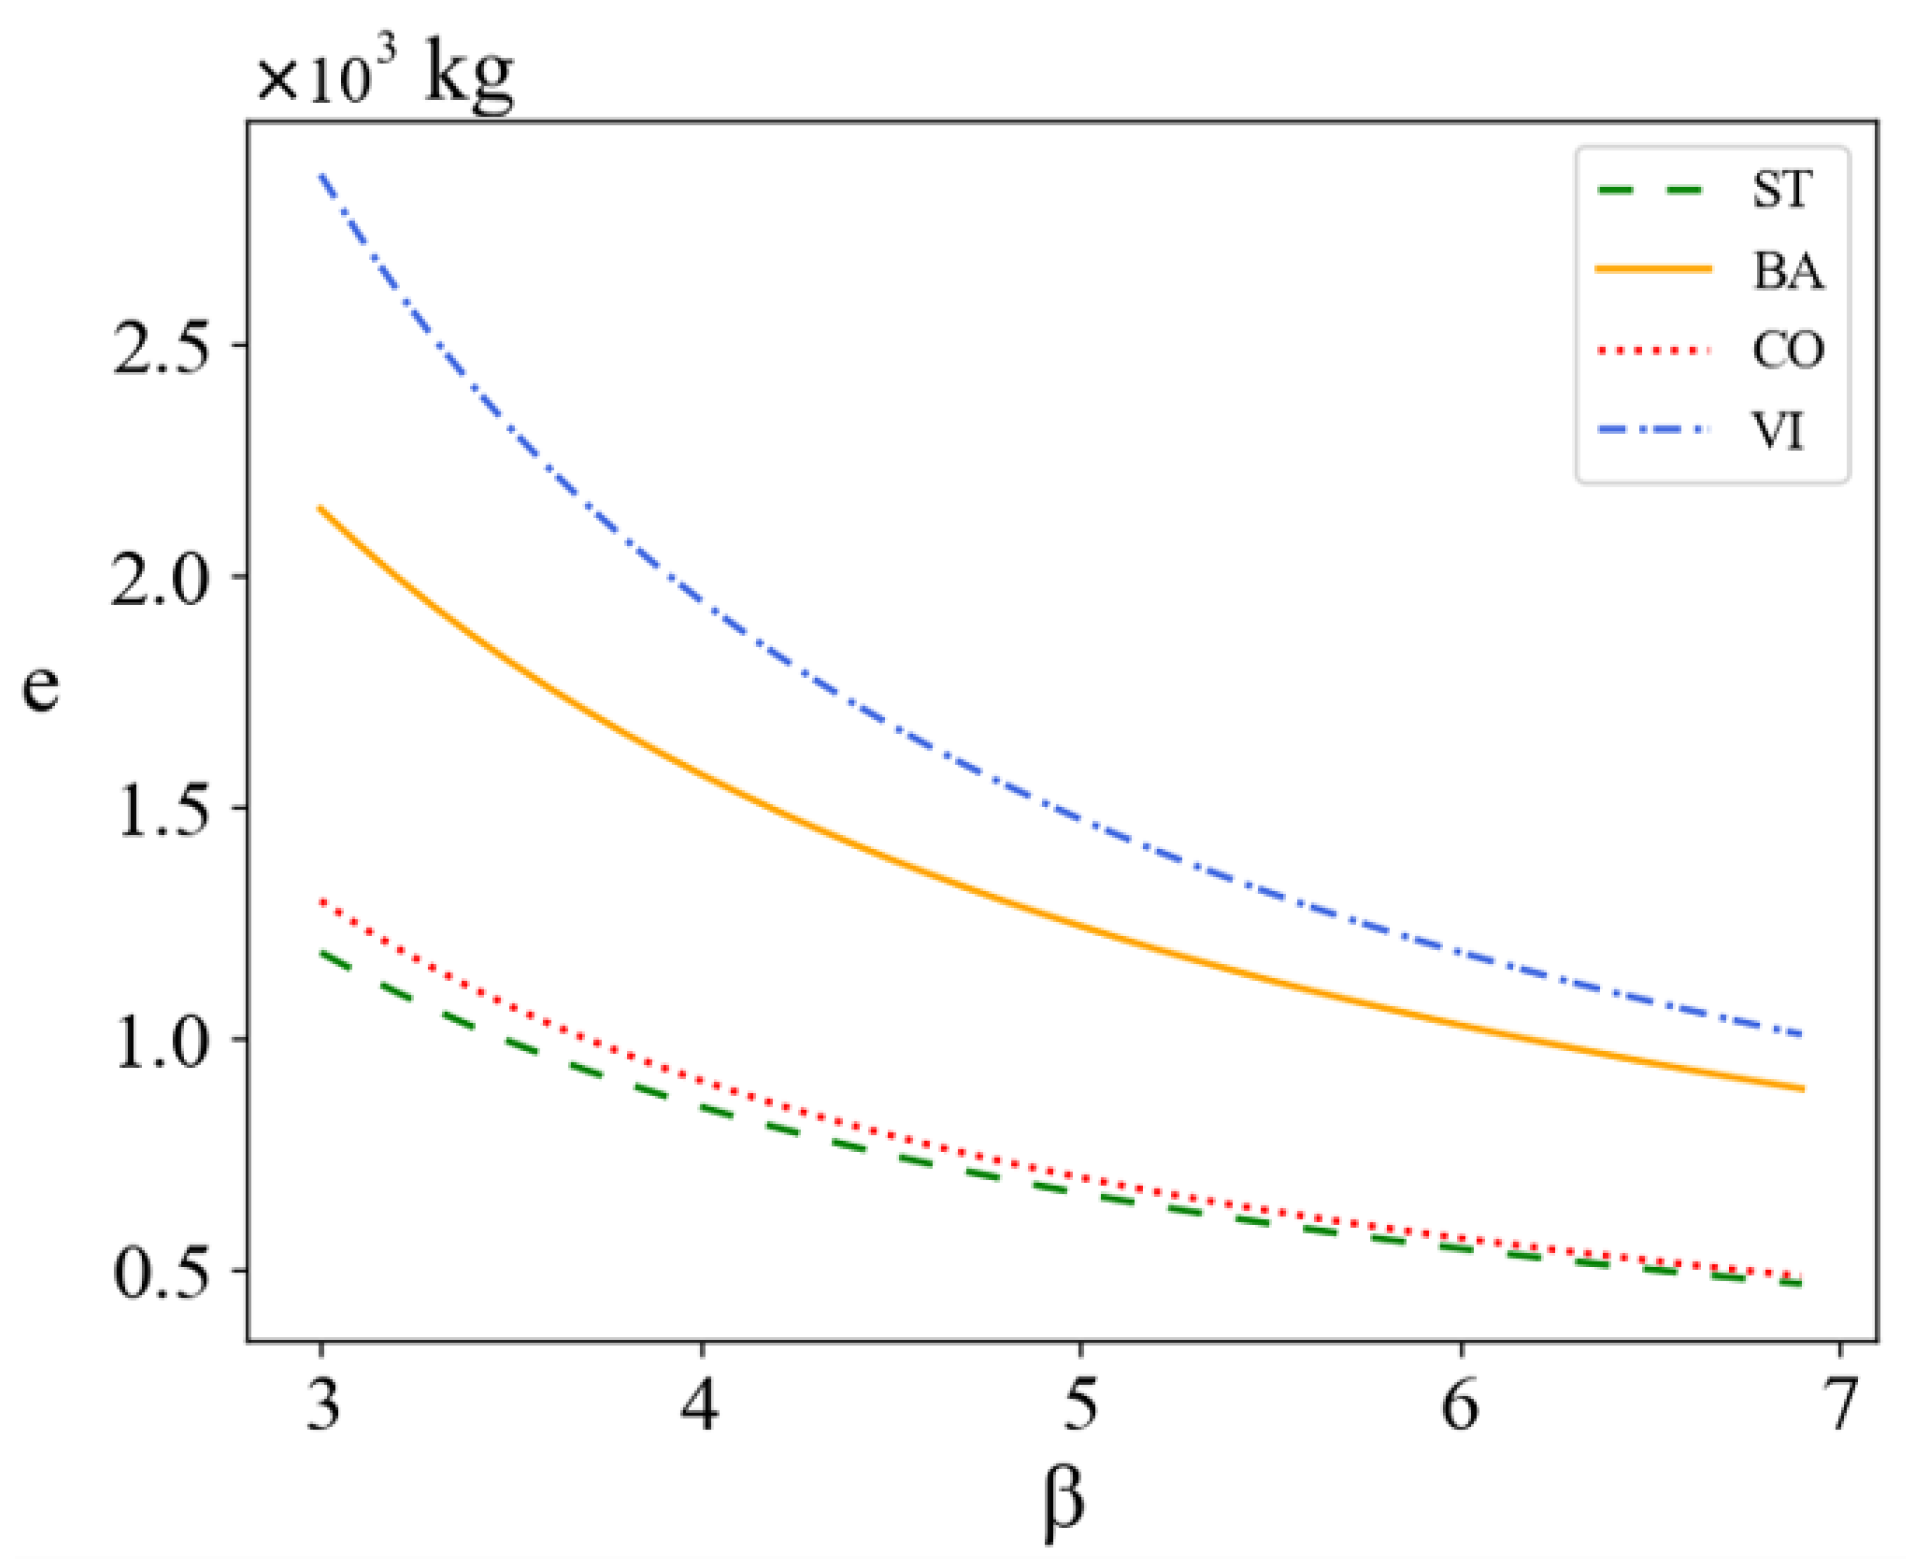
Different carbon abatement costs may have some influence on the results. In this paper,
indicates the corresponding cost coefficient, and higher
indicates lower unit investment efficiency. Fixing the exogenous variables
= 0.2,
= 0.2, and taking
, obtain the trends of the profit of power generation enterprises (
Figure 7), profit of power sales enterprises (
Figure 8), overall profit of power generation and sales enterprises (
Figure 9), and green level of power generation enterprises (
Figure 10) under different decisions with the change of carbon abatement cost.
Figure 7,
Figure 8,
Figure 9 and
Figure 10 also verify the results of the above proposition. Specifically, compared with master–slave games and simultaneous decision-making, the profits of power producers and sellers under cooperative abatement decisions are higher. As shown in
Figure 10, the green level of power generation enterprises under vertical integration decision-making will reach the highest.
By observing
Figure 7,
Figure 8,
Figure 9 and
Figure 10, it can be seen that as the carbon emissions reduction costs of power generation enterprises increase, the profits of power generation enterprises, power sales enterprises, overall profits, and carbon emissions reduction levels of power generation enterprises tend to converge between decentralized decision-making and cooperative reduction decision-making.
The overall decreasing trend of the lines in the above figures indicates that the profits of power enterprises decrease as the difficulty of carbon abatement increases. Therefore, to achieve a higher level of sustainability while ensuring the profitability of power enterprises, the government should provide guidance on the research and development (R&D) of abatement technologies to reduce the investment costs of enterprises.
5. Conclusions
In this paper, the problem of cooperative abatement in the secondary power supply chain consisting of power producers and sellers under the carbon tax policy is studied, and four game models were established, respectively, where the supply chain enterprises could adopt blockchain technology to improve the transparency of carbon abatement information, the power generation enterprises could decide the level of abatement technology in the power generation process and reduce the carbon tax expenditure through abatement, and the power sales enterprises could benefit from the abatement effect to increase their power sales and choose to bear a certain proportion of the abatement cost. This paper compares the four game strategies to provide ideas for power supply chain cooperation and put forward relevant policies.
5.1. Research Findings
Based on our analysis, it is evident that the preference of electricity users for blockchain technology and the proportion of low-carbon electricity information uploaded to the blockchain can significantly influence decision-makers’ profits and the green level. Therefore, implementing blockchain technology in the power sector has the potential to promote sustainable and greener development. Blockchain technology has the potential to enhance energy traceability and facilitate carbon emission, accounting for electricity transactions, leading to improved energy efficiency, waste reduction, and lower carbon emissions, ultimately contributing to environmental protection. Transparency and fairness in the electricity market are crucial for both consumers and suppliers, and blockchain technology can enable traceability and transparency in electricity transactions, ensuring market justice and preventing fraud and misconduct. By leveraging blockchain technology, governments can regulate the electricity market, safeguard the rights and interests of consumers and suppliers, and promote the healthy development of the market.
This paper’s comparison of the Nash simultaneous decision-making and shared emission reduction cost decision-making revealed that the sustainability level of the power supply chain is higher under Nash simultaneous decision-making. However, numerical analysis results showed that the decision-makers’ profits in the Nash bargaining game model are lower than those in shared emission reduction cost decision-making. This suggests that while simultaneous decision-making can improve sustainability, it may not be the most economically feasible option. This paper also validates the effectiveness of collaborative emission reduction strategies. In comparison with the Stackelberg game model dominated by power producers, collaborative emission reduction leads to an improvement in the green level. Additionally, numerical analysis results demonstrate that the overall profit and sustainability level is higher under the vertical integration decision-making of power producers and sellers than other decision-making structures. This suggests that mutual acquisition and vertical integration trends among power supply chain enterprises can promote the green development of the power industry. As the carbon emission reduction cost of power generation enterprises increases, this paper’s research findings indicate that the profits and carbon emission reduction levels of both decentralized and collaborative decision-making tend to converge. This convergence implies that with an increase in emission reduction difficulty and cost, the differences between the two decision-making structures will decrease.
In summary, the development of effective coordinated policies can enhance the profitability of the power industry and promote its sustainable growth. However, the implementation of such policies may encounter challenges associated with the absence of macro-level control. Thus, it is crucial for the government to offer guidance and support from a macro perspective, encouraging power companies to adopt these strategies.
5.2. Management Enlightenment
Under the situation of high-intensity carbon emissions in the power sector, power producers and sellers should actively engage in carbon abatement actions and work together to reduce emissions. The level of sustainability under the Nash bargaining game with both decision-makers simultaneously is higher than that in the master–slave game, but the profits of both decision-makers decrease, so it is suggested that the energy management agency or energy coordination unit offer incentives to encourage power enterprises to cooperate in reaching the Nash bargaining game decision.
The application of blockchain technology can enhance users’ attention to and trust level for green information. Users’ preference for blockchain and the proportion of on-chain electricity consumption information are important factors affecting the profits and sustainability levels of the supply chain, so the industry and information technology sector should promote supply chain enterprises to apply blockchain technology in production and operation by taking the lead in building blockchain platforms and actively promoting blockchain technology.
The investment cost of carbon abatement technology is the most important influencing factor for power generation enterprises in deciding the level of investment, and the science and technology sector can provide guidance on R&D to reduce the cost of abatement technology or improve its abatement efficiency. In addition, low carbon awareness among users is the most essential source of incentives for enterprises to reduce carbon emissions. The environmental protection and publicity departments should carry forward the concept of green development and actively guide users to establish green consumption concepts.
5.3. Limitations and Extensions
It is worth noting that there are some limitations to this study. In our model, it is assumed that green costs are continuous variables, but in real life, investment decisions for green technologies tend to be discrete rather than continuous. In terms of controlling pollution emissions, the government’s carbon tax policy has successfully reduced carbon emissions through proper implementation, but government subsidies are also effective measures that play an important role. Subsequent studies could consider combining subsidies with carbon tax mechanisms. Furthermore, in addition to green product preferences, green marketing efforts are another important influencing factor in user decisions. Future research could focus on designing systematic abatement measures in the context of supply chain cooperation. Finally, the implementation of the entire process can be improved by encouraging greater participation and cooperation among stakeholders. This includes engaging various stakeholders such as government agencies, investors, consumers, and non-governmental environmental protection organizations in the decision-making process and promoting collaboration among them. Such an approach can make the decision-making process more comprehensive and inclusive, taking into account different viewpoints and interests. However, due to length constraints, these issues will be addressed in subsequent studies.


