To develop statistically significant machining parameters and calculate the percentage impact of the milling of the GFRP parameter on the Df, Ra, and MRR, analysis of variance was performed. Each experiment was run twice, as previously mentioned. The average values of each parameter are presented in
Table 5 along with the experimental findings for each run. For each L27 experiment, the individual values of Df, Ra, and MRR can be utilised to calculate the values of machining performance (see
Table 5). MINITAB, version 15 statistical software was used to complete this process. In this experiment, a
p-value of less than 0.05 was used to determine the significance of each effect along with a 95% confidence interval. In the following section, the ANOVA results regarding Df, Ra, and MRR are systematically discussed in sequence. The results of the ANOVA show that the most significant factors with respect to all the responses are the cut speed, feed rate, and Axial DOC (as shown in
Table 6a), each of which present
p-values that are within an interval of less than 0.05. However, it is possible that another factor or factors could also have had an impact on the adequacy of this process. Analogous computations were made to determine Df, Ra, and MRR. In the Taguchi technique, the difference between the experimental value and the predicted value is determined using a loss function. The signal-to-noise (S/N) ratio is a further transformation of this loss function. There are three different S/N ratios based on the attributes in question. These S/N ratios are as follows: smaller-the-better (STB), larger-the-better (LTB), and nominal-the-better (NTB). The results regarding surface delamination (Df), surface roughness (Ra), and the material removal rate (MRR) in relation to GFRP milling reveal that the processes are more efficient when they are of a smaller scale.
3.1.1. Analysis of Surface Roughness (Ra)
Using the Roughness Tester equipment and a data-equating system, surface roughness during milling was measured and processed for statistical analysis. NOVA was used to determine the impact of the process parameters on surface roughness during the end milling of GFRP, for which surface roughness (Ra) was used as a response variable. The related main effects plots and ANOVA results are shown in
Figure 4 and
Table 6a.
Surface roughness was found to be most significantly influenced by the fibre glass pattern, type of resin, spindle speed, feed, and axial depth of cut. Through our analysis of variance, it is evident that the surface roughness was lowest with a roving fibre pattern, ER, a cutting speed of 2500 rpm, a depth of cut of 1 mm, and a feed rate of 0.13 mm/rev.
End-milling precision is greatly influenced by surface finish, which is significant in many domains. Even though there are numerous elements that can affect the surface quality of a machined component, cutting parameters like spindle speed, feed, fibre glass pattern, resin type, and axial depth of cut can significantly affect surface roughness in relation to a given machine tool and workpiece.
Milling with a uniform speed, feed, depth of cut, and fibre pattern also leads to reduced surface roughness according to the S/N ratio for surface roughness shown in
Table 6b.
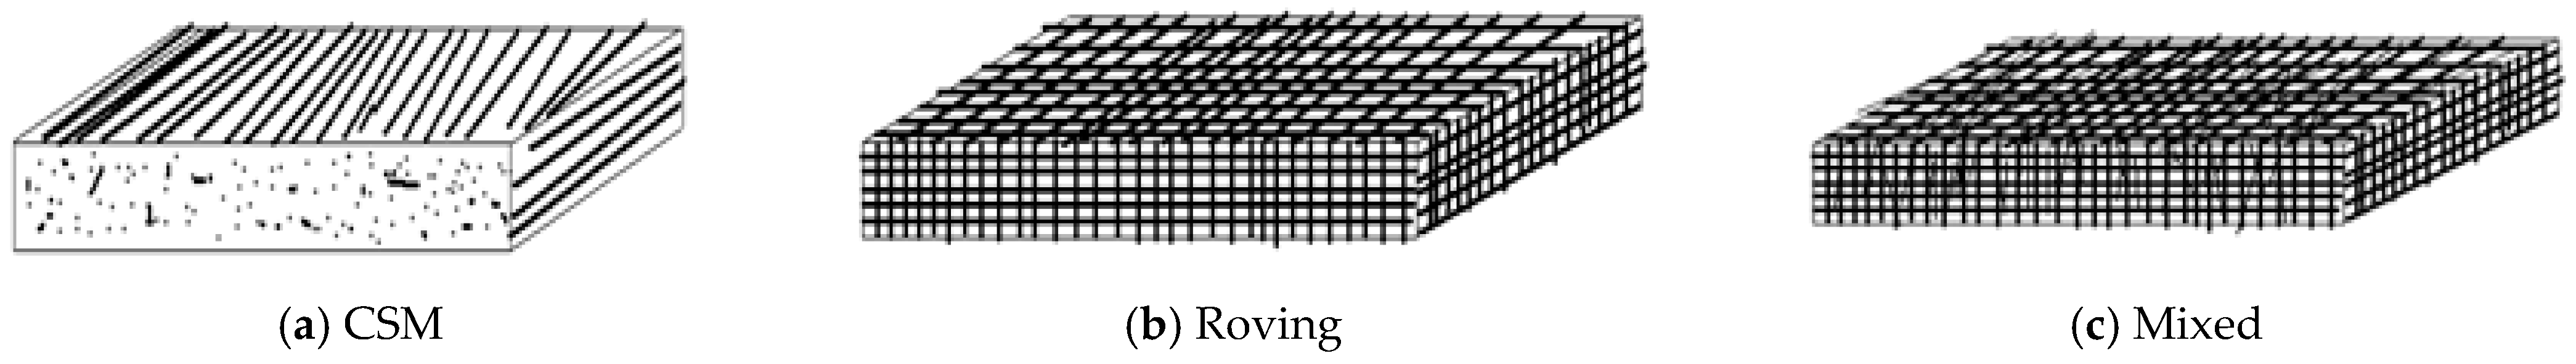
Several factors influence the surface roughness of fibreglass-reinforced composites, including the type of glass fibre pattern present in the specimen. Due to instances mini-fibre fractures, pull-outs, and the matrix shattering into smaller pieces, long fibres have a more uniform degree of surface roughness. At lower feed rates and cutting speeds, the severity of the fractures is less intense and more controllable, allowing for finer surface roughness.
Surface roughness can be affected by machining parameters such as the axial depth of cut, cutting speed, and feed rate.
Figure 4 depicts how increasing the axial depth of cut causes an increase in surface roughness. As a result, an axial depth of cut of 1 mm is recommended since it greatly reduces surface roughness.
Furthermore, increasing the cutting speed has a limited impact on decreasing surface roughness. According to
Figure 4, a cutting speed of 3500 rpm would result in the least amount of surface roughness. An increased feed rate, on the other hand, may result in increased surface roughness. The surface roughness was increased with a feed rate of 0.13 mm/rev, as seen in
Figure 4. As a result, we recommend using a decreased feed rate to reduce surface roughness.
Finally, the selection of fibreglass pattern and resin type is critical in determining surface roughness.
Figure 4 demonstrates that a mixed fibreglass design with PER resin results in increased surface roughness. As a result, choosing the appropriate mix of fibreglass design and resin type is critical for producing the necessary surface quality. More experimentation and analysis may be required to determine the best combination of these factors for a specific application.
The variation in surface roughness with regard to feed was observed for all the fibre patterns with different types of resin at varying values of speed and depth of cut. The link between surface roughness and fibre glass pattern, type of resin, spindle speed, feed, and axial depth of cut is depicted for each slot based on the results. As the results have been obtained with respect to variable speed,
Figure 5 represents the corresponding results regarding surface roughness. The combination of a constant feed value of 0.13 mm/rev, a cutting speed of 1500 rpm, and PER with a roving glass fibre pattern produces the best results. A normal probability plot is a graphical tool for determining whether a dataset’s distribution is roughly normal. The main line of the plot reflects the predicted distribution of a normal random variable. If the plotted points lie nearly along this line, the data are probably regularly distributed.
A normal probability plot is used in this study to analyse the dispersion of the experimental data around a mean value. However, not all of the points precisely match the main line. This indicates that the model’s fit is moderate. The goodness-of-fit statistic, which is near 90%, confirms this. A goodness-of-fit statistic quantifies the difference between expected and observed values, and a score of 90% indicates that the model fits the data reasonably well. Overall, the normal probability plot is an effective tool for determining a dataset’s normality and the goodness-of-fit of a statistical model. However, to ensure that a plot’s conclusions are valid, it must be interpreted in conjunction with other statistical measures (
Figure 6).
3.1.2. Analysis of Surface Delamination (Df)
The response variable used in this study is delamination (Df), and ANOVA (analysis of variance) was used to explore the effect of process factors on delamination in GFRP composite end milling. The corresponding main effect plot and ANOVA findings are shown in
Figure 7 and
Table 7. It was determined that the most significant parameters that effect delamination were the fibre glass pattern, type of resin, spindle speed, feed, and axial depth of cut. The ANOVA results show that minimal delamination was observed at a cutting speed of 3500 rpm, a feed rate of 0.13 mm/rev, and an axial depth of cut of 3 mm for a chopped strand mat (CSM) fibre pattern and epoxy resin (ER). These results imply that this combination of parameters is optimal for minimising delamination during GFRP composite end milling.
Furthermore, at a 95% confidence interval, the feed rate has a significant effect on delamination. This suggests that the feed rate is a critical process parameter that should be carefully evaluated when milling GFRP composites in order to avoid delamination. The table shows the ideal parameter combination allowing for the optimum value of delamination, indicating that the appropriate selection of process parameters can greatly affect delamination in GFRP composite end milling. As a result, it is critical to carefully analyse the effect of process parameters on delamination and choose the best parameter combinations to reduce delamination during milling.
The axial depth of cut has a significant impact on surface delamination during GFRP composite end milling. The likelihood of surface delamination increases as the axial depth of cut increases. This relationship is illustrated in
Figure 7, which indicates that an axial depth of cut of 3 mm results in the greatest degree of delamination. It is vital to notice that delamination increases linearly as the axial depth of cut increases.
The cutting speed of the tool employed was also discovered to be an important element influencing surface delamination. The amount of delamination on the surface tends to grow as the cutting speed increases.
Figure 7 indicates that the degree of surface delamination is very modest at a cutting speed of 1500 rpm and while employing a mixed glass fibre pattern, indicating an ideal value.
Figure 7 shows that changing the glass fibre pattern from CSM to mixed and roving reduces surface delamination at cutting speeds of 2500 rpm and 3500 rpm. To avoid delamination, the cutting speed and glass fibre pattern must be carefully chosen. It is also worth noting that the feed rate has a considerable effect on delamination, as attested by the corresponding 95% confidence interval. However, the optimal feed rate is determined by other factors such as the axial depth of cut, cutting speed, and resin type.
Table 7 shows the optimal combination of these parameters that allows one to achieve the best value of delamination based on the ANOVA results.
According to
Table 8, resin type is the most influential parameter, whereas feed rate is the least influential. Regarding the effects of fibreglass pattern and resin type on surface delamination in GFRP composite end milling, it is crucial to remember that different patterns of glass fibre and types of resin have distinct mechanical properties and cutting force behaviours.
In general, a mixed glass fibre pattern with PER resin exhibits the least amount of surface delamination, which is most likely due to the mechanical properties of both the glass fibres and the resin. A CSM glass fibre pattern with Epoxy resin, on the other hand, exhibits the greatest amount of delamination, which may be due to the epoxy resin’s brittleness and reduced toughness.
To minimise surface delamination, it is critical to carefully consider the combination of glass fibre pattern and resin type when selecting materials for the end milling of GFRP composites. More testing and analysis may be required to determine the best combination of these factors for a given application.
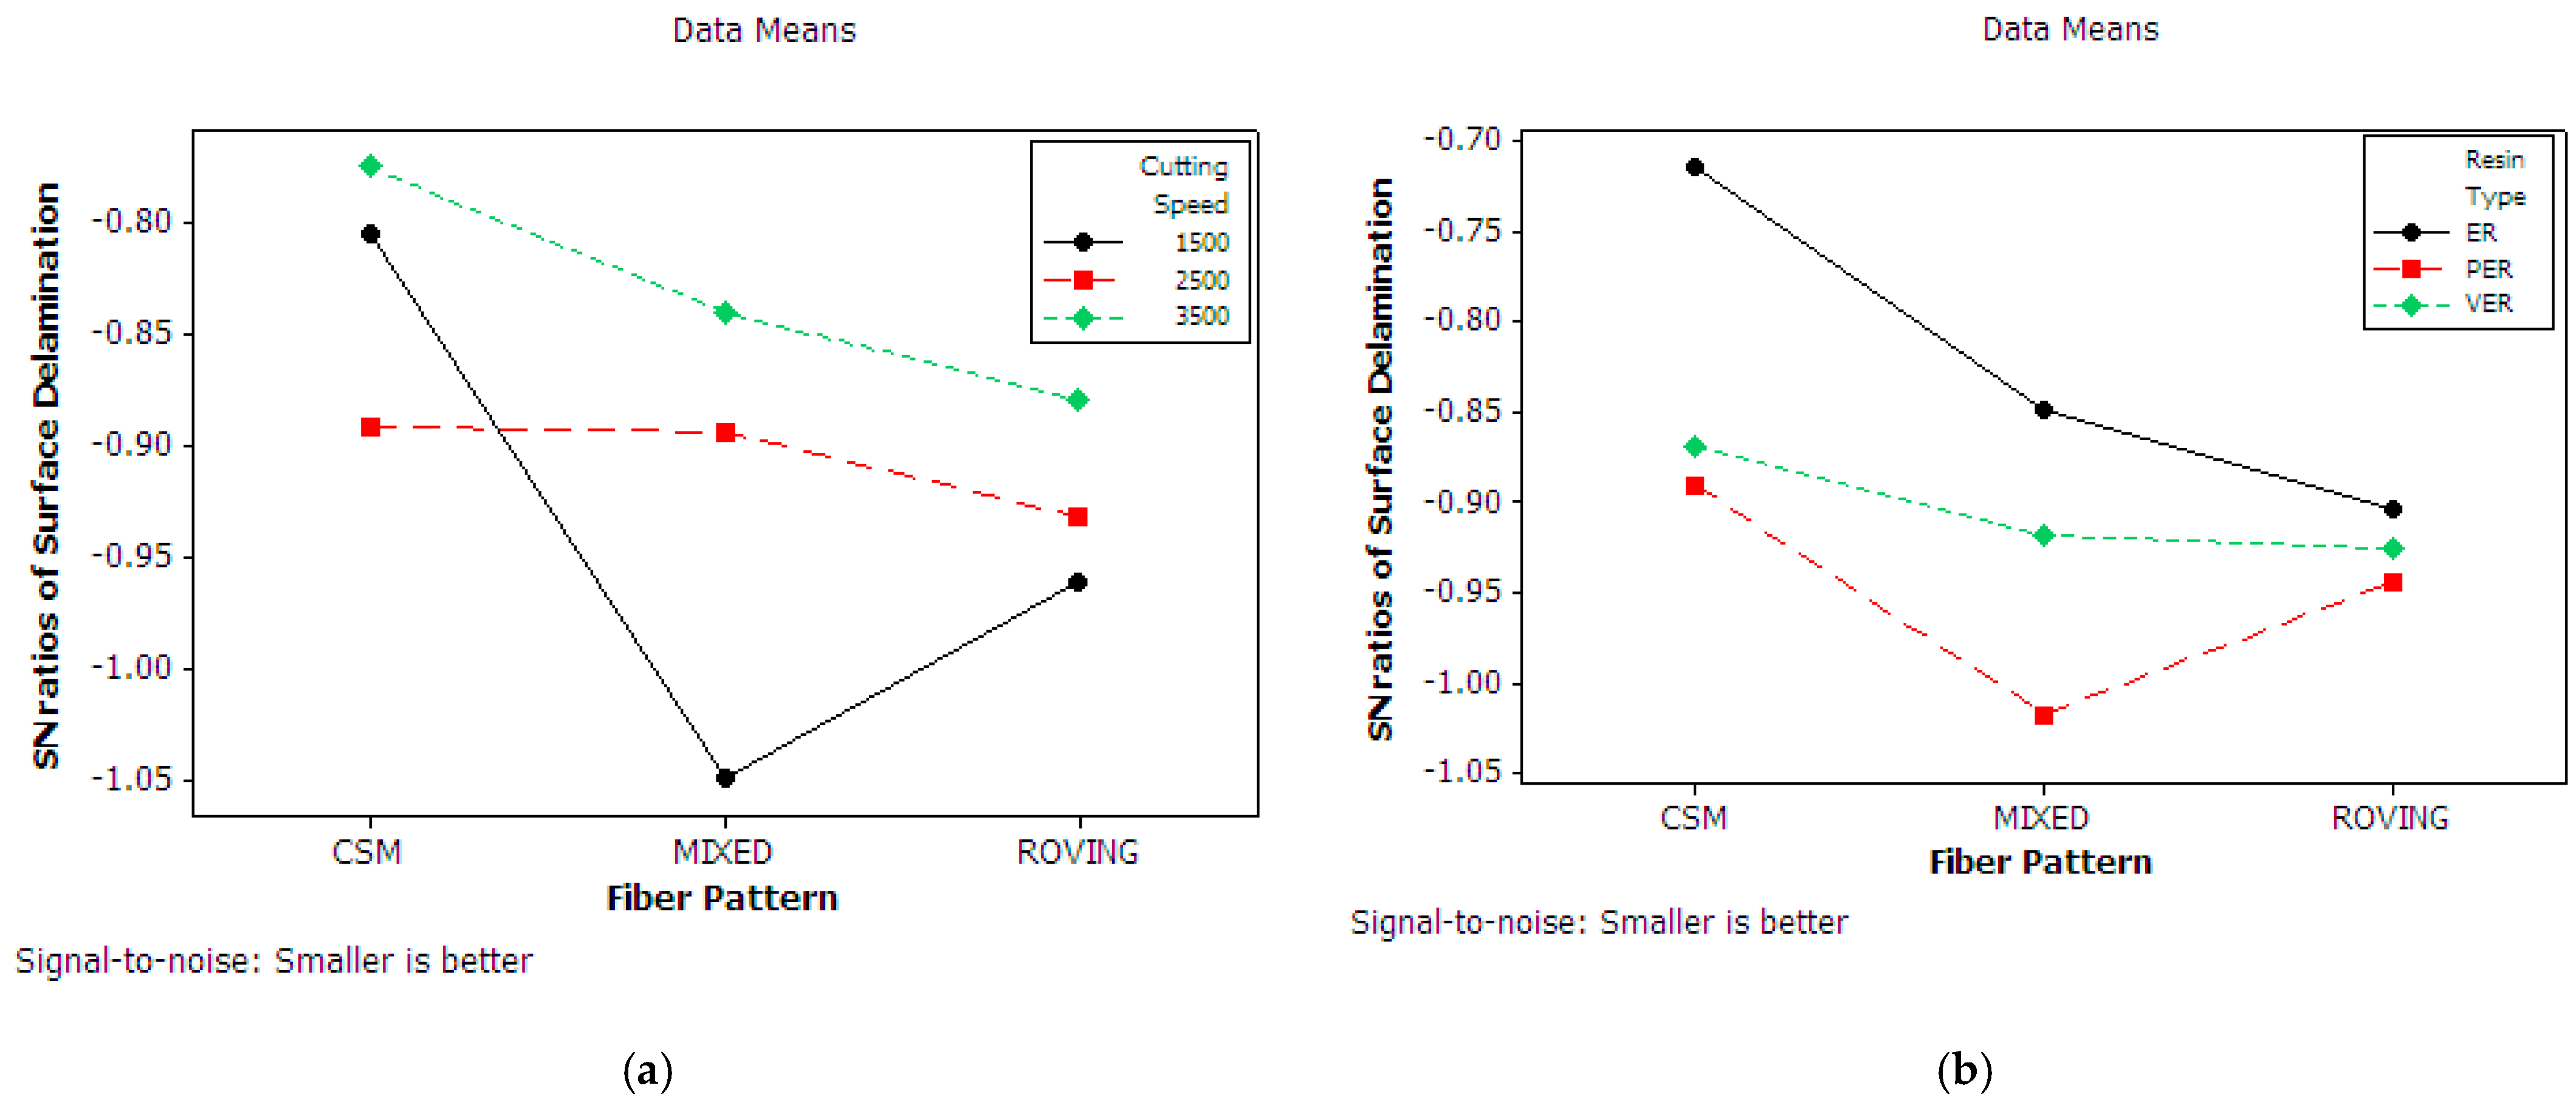
Figure 8a,b exhibit interactive graphs regarding surface delamination with respect to cutting speed and s/n means of surface delamination with respect to resin type, respectively. A normal probability plot is used to determine whether a piece of data has a normal distribution. If the data points lie closely along the main line in this scenario, then the data are regularly distributed, which is desired for statistical analysis. If the points depart significantly from the line, this indicates that the data are not regularly distributed, which may impair the validity of any statistical tests conducted on the data.
The fact that the points on the normal probability plot do not exactly match the main line in this analysis, as illustrated in
Figure 9, implies that the data are not completely normally distributed. However, the fact that the points continue to follow a general trend along the line suggests that the data are still somewhat normally distributed, which means that statistical tests could still be performed with some confidence. The R-squared value (about 90%) also suggests that the model’s fit is moderate, further supporting this conclusion.
3.1.3. Analysis of Material Removal Rate
The value of the material removal rate can be obtained using Equation (2)
where
is the cutting velocity in m/min,
is the feed rate in mm/rev, and
is the depth of the cut in mm. It is important to note that the ANOVA results indicate that all the process parameters (fibreglass pattern, resin type, spindle speed, feed rate, and depth of cut) have a significant effect on the material removal rate (MRR) of GFRP composites. In particular, the ANOVA results suggest that the combination of a mixed fibreglass pattern and PER resin, a spindle speed of 3500 rpm, and a feed rate of 0.13 mm/rev are conducive to the generation of the maximum MRR. However, it is important to note that this result is based on the specific experimental conditions applied in this study and may not hold true for all situations.
Further analysis and experimentation may be required to determine the optimal combination of process parameters for a given application.
Fibreglass pattern and resin type have a considerable impact on the material removal rate (MRR) in GFRP composite end milling.
Figure 10a,b depict the interactions between these two parameters. The S/N ratio of the MRR for the ER type of resin and the roving type of glass fibre pattern is relatively low, indicating that this combination is not suitable for achieving a high MRR. On the other hand, for all types of fibre patterns, the largest material removal rate was recorded for the VER and PER resins, and these combinations demonstrate a consistent and larger S/N ratio with respect to the MRR.
This finding implies that the choice of resin type and fibreglass pattern is critical for achieving a high MRR in GFRP composite end milling. The stiffness and toughness of the composite material are affected by the resin type, whilst the fibreglass pattern governs the orientation and distribution of fibres within the material. As a result, it is critical to choose the best resin type and fibreglass pattern to attain the appropriate mechanical qualities while also allowing for effective material removal during machining.
Overall, our research reveals that VER or PER resin and a fibreglass pattern, which yield the requisite mechanical properties for the specific application, constitute the best combination of process parameters for obtaining a high MRR in the end milling of GFRP composites.
To elaborate on the influence of the feed rate on the material removal rate (MRR) in the end milling of GFRP composites, the main effect plot (
Figure 5) shows that as the feed rate increases from 0.05 to 0.13 mm/rev, the value of the MRR increases slightly. However, after a certain point, increasing the feed rate no longer results in a significant increase in the MRR. Furthermore, at a 95% confidence interval, the resin type has a significant effect on the material removal rate. However, other factors such as the axial depth of cut, cutting speed, and feed rate influence the best resin type. Based on the findings of the ANOVA, the ideal combination of these factors for achieving the optimum material removal rate is indicated in
Table 9.
Table 10 shows that the axial depth of cut is the most influential parameter with respect to the material removal rate, while the fibre pattern is the least influential element. This tendency can be explained by the fact that a higher feed rate results in a larger amount of material removed per unit time, which raises the MRR. However, at high feed rates, the cutting forces and temperature generated during the machining process increase as well, which can result in tool wear, chipping, and other issues that can affect the quality of the machined surface and reduce the MRR. To achieve the required balance of MRR and surface quality, it is critical to carefully select the optimal feed rate for a specific combination of material, cutting tool, and machining parameters.


 ,
, 


