Hypothesis

Analysis of Consumers’ Green Consumption Behavior against the Background of “Carbon Peak, Carbon Neutrality”—Based on Survey Data from Anhui Province

1
Business School, Suzhou University, Suzhou 234000, China
2
School of Management, Suzhou University, Suzhou 234000, China
*
Author to whom correspondence should be addressed.
Sustainability 2023, 15(16), 12296; https://doi.org/10.3390/su151612296
Submission received: 25 July 2023 / Revised: 5 August 2023 / Accepted: 9 August 2023 / Published: 11 August 2023

Abstract

:
With the proposal of the goal of “carbon peak, carbon neutrality”, the concept of environmental protection has become increasingly popular. To explore the characteristics and influencing factors of consumers’ green consumption behavior against a dual-carbon background, this study proposed research variables and hypotheses about green consumption behavior and influencing factors. With the research purpose, research variables, and hypotheses, a questionnaire was designed. Consumers in Anhui Province were chosen as research samples. SPSS26.0 was employed to conduct reliability and validity analysis, correlation analysis, and stepwise linear regression analysis of the questionnaire data to evaluate the factors affecting consumers’ green consumption behavior; through these measures, it was verified that there existed a significant relationship between green consumption behavior and the influencing factors of purchase motivation, channel factor, consumer innovation, and price factor. And it was also verified that the influence of incentive factors and psychological factors was not significant. Based on this, the current study proposes countermeasures and suggestions for setting up environmental awareness, reducing the price of green products, expanding green consumption channels, and stimulating consumer innovation.

1. Introduction

Excessive carbon dioxide emissions have caused many problems in the global environment [1,2]. In September 2020, China announced to the world the “double carbon” goal, that is, striving to reach peak carbon dioxide emissions before 2030 and achieve carbon neutrality before 2060 [3], which fully reflects China’s responsibility; it is a concrete embodiment of practical actions designed to promote the building of a community with a shared future for humankind and has drawn wide attention and high recognition from the international community. Indeed, 2021 is known as the first year of “carbon neutrality”. Driven by the “double carbon goal”, the task of low-carbon green transformation in China has become extremely urgent, and the popularization of green consumption is at the core of promoting the transformation of sustainable economic development to low-carbon green development, so as to achieve the double carbon goal [4]. Based on this, the present article attempts to explore the nature of the consumer green consumption situation against the “double carbon” background. What factors influence consumers’ green consumption behavior? Research on relevant scientific issues can enrich the research theory of the low-carbon economy and consumption behavior while also providing decision-making references for local governments and industrial enterprises which they can use to develop low-carbon green development policies and strategies.
Both domestic and foreign scholars have carried out a great deal of research on green and low-carbon energy consumption. Yang Menghua et al. [5] collected 286 green consumption policy documents issued at the national level in China from 1989 to 2019 and analyzed the release stage of the documents, the intergovernmental relationship network of policy-issuing units, and the evolution of the green consumption policy system. Khan et al. [6] identified the accelerators of the sharing economy to achieve sustainable development by adopting green consumption.
Yan et al. [7] discussed how psychological feelings of power affect consumers’ preferences for green products. Yue et al. [8] adopted a questionnaire survey method to discuss the impact of environmental responsibility on green consumption and considered the mediating role of environmental concern and the regulating role of price sensitivity. Mei et al. [9] studied the effects of self-control and moral promotion on green consumption behavior. Raiswa et al. [10] found that, among the consumers they surveyed, those with high-intensity environmental knowledge and peer influence were more willing to become sustainably conscious consumers. Anu Gupta et al. [11] studied the driving factors behind millennials’ green consumption behavior and analyzed the driving factors of green consumption by using structural modeling methods. Le Hai Yen et al. [12] conducted a study on green consumption in emerging markets based on environmental behavior and analyzed the relationship between consumers’ willingness to pay and their purchase behavior, using value theory, identity theory, and self-regulation theory; the authors also confirmed the impact of value orientation on self-regulation through environmental identity.
Beatson et al. [13] applied social practice theory to green consumption, conducted in-depth interviews with Australian consumers, and made recommendations for reducing perceived barriers to the green consumption process. Gupta et al. [14] conducted in-depth interviews with young Indian consumers and analyzed the factors influencing green consumption, focusing on three dimensions: personal, social, and environmental. Sreen et al. [15] used Indian consumers as research objects and established an institutional framework to examine the effects of government and social pressure on the intention to purchase green products. Swetarupa et al. [16] constructed a framework with which to measure the impact of green consumption value, reasons for buying green products, and reasons against buying green products on consumers’ attitudes toward green products and green purchase intention; they also conducted an empirical study with Indian consumers as research objects. Arora [17] conducted a questionnaire survey, tested the green consumption models of two types of products using multiple regression analysis, and explored and analyzed different factors that determine green consumption behavior in India. Moreover, Kwon et al. [18] used partial least squares structural equation modeling to analyze a sample of green hotel customers in Malaysia, finding that attitude and perceived behavioral control had a positive impact on desire, which in turn significantly affected behavioral intention. Added to this, Lan Nguyen et al. [19] empirically analyzed the factors influencing Vietnamese consumers’ green consumption. Wang et al. [20] conducted a face-to-face survey of Chinese consumers and applied a structural equation model to analyze the data. The results showed that the reasons for green consumption only indirectly affected the consumers’ willingness to consume, whereas the reasons for green consumption directly affected intention and bypass attitude. Minmin et al. [21] discussed the formation mechanism and internal driving force of Chinese consumers’ green consumption; they also expounded on the impact of consumers’ environmental awareness on green consumption, as well as the moderating effects of perceived cost, policy incentives, and face culture. Moreover, Tao Shipeng [22] studied the green consumption behaviors of college students’ families in Shanghai in combination with the “two-carbon” goal and found that the “intent–behavior” gap existed objectively.
Rustam et al. [23] explored the potential impact of corporate environmental sustainability reporting on green consumerism. These findings suggest that firms’ sustainable exposure and environmental responsiveness play game-changing roles in green consumption behavior, ultimately becoming the threshold for changing rational and consumer green choices. Elsewhere, Yang et al. [24] discussed the influence of Chinese enterprises’ green marketing behavior on consumers’ green consumption intentions, while Yang Shuli [25] collected and analyzed data through a questionnaire survey and found that the enterprises’ green marketing behavior had a positive impact on consumers’ green consumption intention. Moreover, Xu et al. [26] analyzed how enterprises persuade consumers to engage in green consumption from the perspective of brand logo design. In addition to the existing scale, they further developed a scale for the green marketing activities of enterprises.
Among the existing literature, green consumption has been a hot topic in academic research over recent years, and a great deal of work has been carried out, showing a blooming trend. However, there are still some challenges: the factors influencing green consumption are diverse and the internal mechanisms are very complex. Researchers have studied different indicators and achieved varying results, and no universal factor models have been developed. Therefore, it is necessary to explore the factors influencing green consumption and to enrich the relevant theories. Carbon neutrality is a low-carbon development commitment that has been implemented in China; therefore, studying green consumption in this context is of great significance. It can support the government in making relevant decisions and provide a reference that can be used by industrial enterprises to develop relevant strategies and tactics.

2. Related Theories and Research Hypotheses

2.1. Related Theories

2.1.1. The “Two-Carbon” Plan

“Double carbon” is short for carbon peak and carbon neutrality. The carbon peak that China has promised to achieve before 2030 refers to the realization of the carbon dioxide peak, after which emissions will steadily decline [27]. Carbon neutrality by 2060 refers to net-zero emissions of all greenhouse gases, not just carbon dioxide. The “two-carbon” plan is also an inherent requirement of China’s high-quality economic development, as well as the orientation and constraints of production and consumption.

2.1.2. Circular Economy Theory

The complete expression of a circular economy is a resource-recycling economy characterized by recycling and resource conservation, as well as an economic development model in harmony with the environment. All material and energy resources are used rationally and sustainably in this ongoing economic cycle to reduce the impact of economic activities on the natural environment as much as possible. The circular economy is usually measured by resource consumption, waste disposal [28,29], economic and social development, ecological environment quality, etc. [30]. The “two-carbon” plan is an extension of the circular economy.

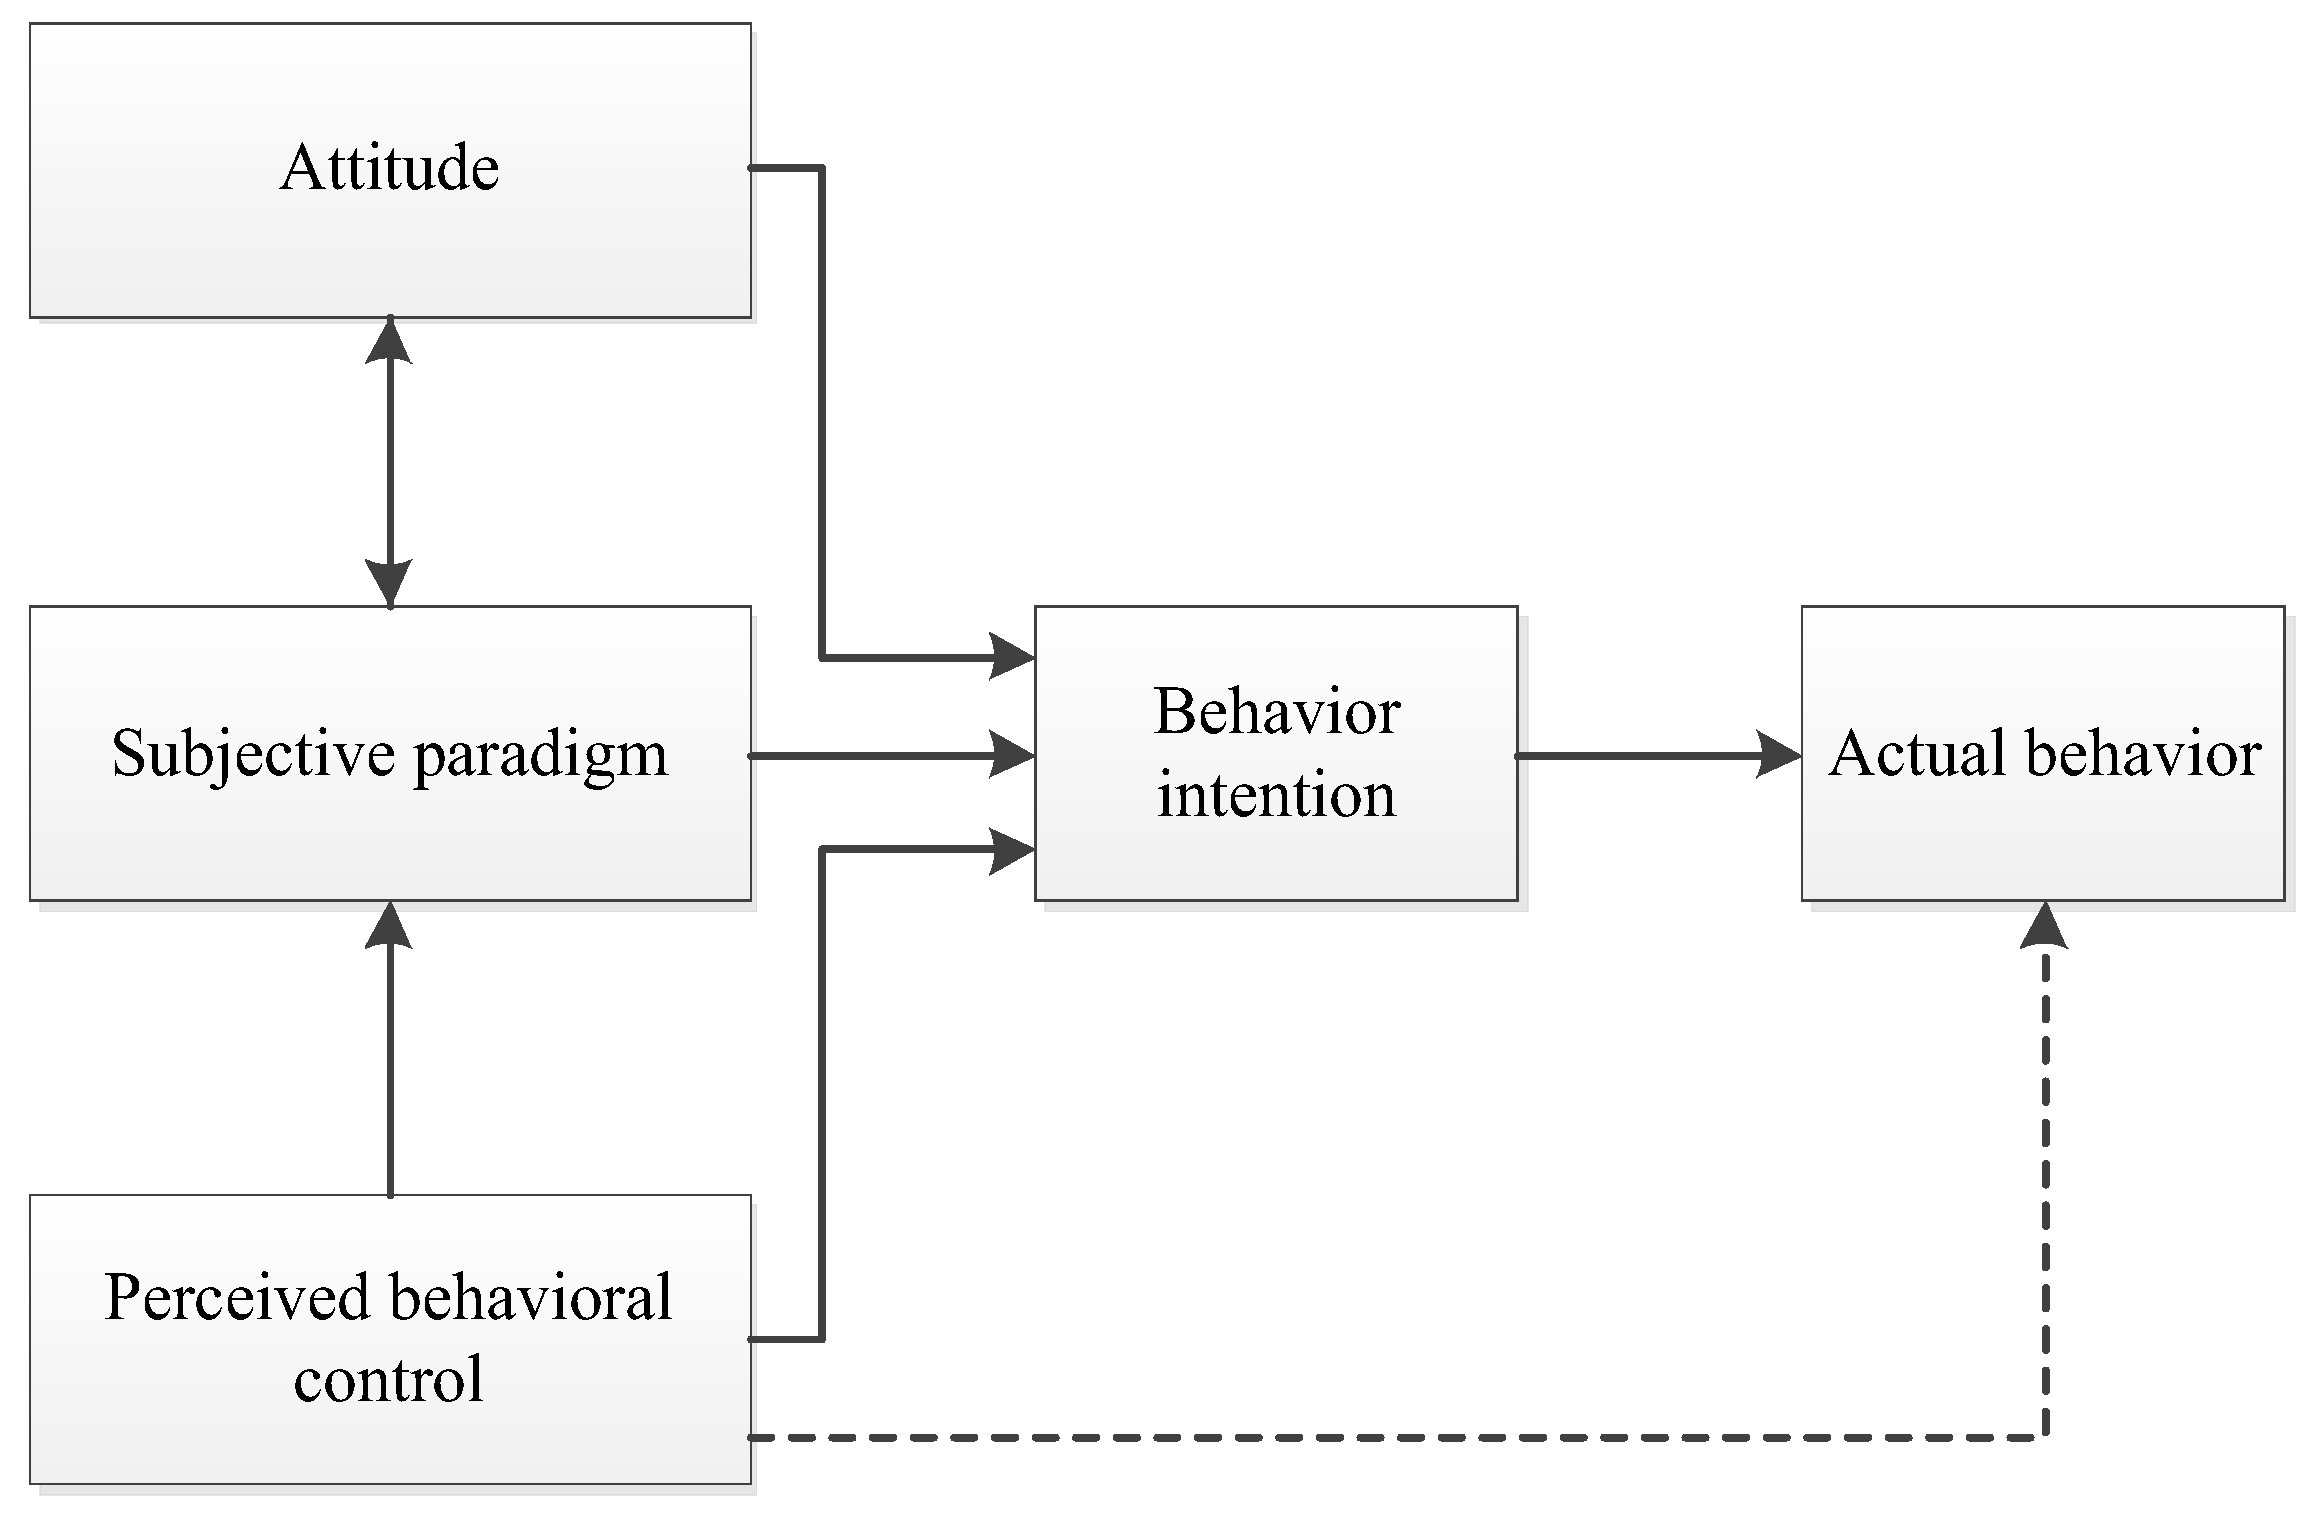
2.1.3. Planned Behavior Theory

The theory of planned behavior was proposed by Ajzen around the 1990s. According to this theory, people usually make rigorous plans before they engage in certain behavior; therefore, people’s behavioral intentions affect their actual behaviors, and behavioral intentions are closely related to attitudes, subjective norms, and perceived behavioral control [31]. The theory of planned behavior is widely used in research on the consumption of green food [32,33], green housing [34], and green traffic [35]. Based on the theory of planned behavior, the research on various behavioral intentions and behaviors mostly shows high reliability and validity [36]. Planned behavior model is shown in Figure 1:

2.2. Research Hypothesis

To better analyze the factors influencing consumers’ green consumption behavior, relevant research hypotheses were proposed for the independent variables. Based on relevant research conclusions regarding the factors influencing green consumption behavior, this study defines relevant variables, as shown in Table 1.

2.2.1. Purchase Motive

Consumer psychology holds that people have purchase demand under certain environmental stimuli and that purchase demand stimulates purchase motivation, which eventually leads to purchase behavior [37]. In this study, purchase motivation refers to the willingness and original intention of consumers when it comes to buying green products under the guidance of the “double carbon” goal. The purchasing motivation was measured from four aspects: (1) environmentally friendly; (2) more cost-effective; (3) more in line with future trends; (4) more advanced than others. Based on this, we propose research hypothesis H1:
H1. 
Purchase motivation has a significantly positive impact on consumers’ green consumption behavior.

2.2.2. Motivating Factors

Enterprises and merchants can stimulate consumers’ green consumption behavior through incentives. Green consumption, in the narrow sense, has far-reaching significance in promoting the realization of the carbon peak goal because when consumers buy green products, they will implement green consumption in their daily life; conversely, enterprises will be prompted to carry out green production and marketing, creating a benign market mechanism and completing green and environmentally sustainable transformation [4]. Four items were designed to measure motivating factors: “(1) rewarding; (2) promotion of advertising; (3) public media and social organizations’ advocation; (4) the national policy requirement”. Accordingly, this study proposes research hypothesis H2:
H2. 
Incentive factors have a significantly positive impact on consumers’ green consumption behavior.

2.2.3. Psychological Factors

Factors at the three levels of cognition, motivation, and consciousness form different green consumption psychologies, and different low-carbon consumption psychologies have contrasting degrees of impact on green consumption behaviors [39]. Consumers’ personal psychology will affect green consumption behavior to a large extent, with examples including blindly following the trend, herd psychology, impulse psychology, and the pursuit of trends, which will stimulate consumers to undertake green consumption. Some consumers advocate rationality, even if they know that green consumption is conducive to environmental protection, but due to some reasons, they temporarily give up green consumption. Psychological factors were measured by the following: ”(1) follow suit; (2) conformity; (3) impulsive mind; (4) pursue fashion; (5) goal-driven”. Accordingly, the following research hypothesis is proposed:
H3. 
Psychological factors have a significant positive impact on consumers’ green consumption behavior.

2.2.4. Price Factors

The formulation of reasonable product pricing strategies can not only help enterprises increase product sales and expand profit margins, but also meet the diverse and distinctive needs of consumers [40]. The lower the price of green products, the stronger the consumers’ willingness to buy; price determines consumers’ green consumption behavior to some extent. We used three items, namely “(1) lower price, (2) reasonable pricing, and (3) price focus”, to measure price factors. Accordingly, the following research hypothesis is proposed:
H4. 
Price has a significant negative impact on consumers’ green consumption behavior.

2.2.5. Channel Factors

The leading role of consumption channels has increased. Consumers choose and decide on channels, and the expansion and upgradation of channels prompt consumers to consume [41]. Green products are distributed in a wide range of places, such as supermarkets, green product franchises, and convenience stores. Consumers generally believe that there are many channels through which green products can be purchased and that different channels lead to different consumer purchasing behaviors. Three items, namely“(1) offline channel, (2) online channel, and (3) channel consistency”, were used to measure channel factors. Accordingly, the following research hypothesis is proposed:
H5. 
Channel factors have a significantly positive impact on consumers’ green consumption behavior.

2.2.6. Consumer Innovation

Consumer innovation refers to the subjective initiative of consumers to accept new ideas and actively try new products, as well as their willingness to understand and obtain the information characteristics of new products, which can be divided into realistic and original innovation. Realistic innovation means that customers study innovative products carefully before making consumption decisions so that they can ensure that those decisions are innovative. Inherent innovation refers to innovation determined by personal characteristics; however, it is difficult to explain and quantify [44]. Consumer innovation was measured by six items: “(1) try new products; (2) obtain new product information; (3) learn new product knowledge; (4) buy new products; (5) the degree to which new products are purchased; (6) like new features”. Accordingly, the following research hypothesis is proposed:
H6. 
Consumer innovation has a significant positive impact on green consumption behavior.

3. Data Collection and Sample Descriptive Statistics

3.1. Questionnaire Design

The questionnaire consisted of three parts: (1) basic information on the respondents, (2) consumers’ green consumption behavior, and (3) factors affecting consumers’ green consumption behavior.
A preliminary survey was conducted prior to administering the questionnaire. The main problem is that most respondents do not pay much attention to the “double carbon” goal and do not understand the meaning of consumers’ green consumption behavior. To address these issues, we supplemented and improved the questionnaire. The first part recorded the respondents’ basic information and screened for gender, age, occupation, education, family monthly income, current residence, and choice of green products. The second part consisted of designed scale items pertaining to consumers’ green consumption behavior; this part assessed consumers’ green consumption tendencies through their daily consumption behavior. The third part addressed the factors that affect consumers’ green consumption behavior, including purchase motivation, incentive factors, psychological factors, price factors, channel factors, and consumer innovation. A 5-level Likert scale was used to set up the questionnaire questions. The scale, from 1 to 5, indicates completely inconsistent to completely consistent. At the same time, the lie detector statement “I think the environmental features of green products are worthy of trust/not worthy of trust” was included in the questionnaire to screen out invalid samples.

3.2. Data Collection

This study took Anhui Province consumers as the survey object, with the help of the QuestionStar platform and a mutual questionnaire, which the participants—specifically 503 in total—filled in filled using WeChat and QQ. With the proposal of the “double carbon” goal, the concept of environmental protection has been advocated, and green and low-carbon consumption behaviors have gradually gained popularity. In recent years, the economic development trend of Anhui Province has been stable and progressive, and the prospect is good, meaning that it is a good representative for the study of consumer green consumption behavior based on the background of the “two-carbon” plan. To improve the sample validity, the questionnaire included multiple screening indicators. After screening for invalid samples, 466 valid samples were obtained, with an effective recovery rate of 92.64%.

3.3. Reliability and Validity Analysis

Reliability reflects the stability or reliability of the questionnaire and is usually expressed by Cronbach α. SPSS26.0 was used to analyze the reliability and validity of the questionnaire data. In the field of social science, the reliability coefficient of the scale or questionnaire should be above 0.8 to be considered as a measurement tool with high reliability. This is also acceptable if the value is between 0.7 and 0.8. The result of reliability analysis is shown in Table 2. According to the results, the Cronbach α of this scale was 0.892, indicating high reliability of the questionnaire.
Validity indicates whether the design of the item is scientific and reasonable. The higher the validity, the more the measurement results of the designed questionnaire can reflect the key to the research problem. The validity analysis was mainly based on the KMO test and the Bartlett sphericity test. KMO is used to check the partial correlation between variables; the value ranges from 0 to 1. The closer the KMO value is to 1, the stronger the bias correlation between variables, and the better the effect of factor analysis. The Bartlett sphericity test can help us judge whether the correlation matrix conforms to the characteristics of the identity matrix. If the p-value is less than 0.05, it indicates that there is a significant correlation between the variables; otherwise, it is considered that the variables are independent of each other. It can also be used to verify whether the data obey the spherical distribution, so as to ensure the reliability and accuracy of the experimental results.
The analysis results are shown in Table 3.
As shown in Table 3, the KMO value was 0.911 and the significance level was 0.000, indicating that the questionnaire had good validity.
As shown in Table 4, there were no missing values in the questionnaire data.

3.4. Analysis of Demographic Characteristics

SPSS26.0 was used to analyze the data. First, a descriptive analysis of the demographic characteristics of the sample population was conducted to understand the basic situation of the sample distribution, as shown in Table 5.
As shown in Table 5, 36.3% of the survey participants were male and 63.7% were female; the proportion of females was higher than that of males, indicating that the overall gender distribution was not uniform. In terms of date of birth, the survey participants were mainly concentrated in the age group of 1990–2000. With regard to occupation, students accounted for 59.9%, company employees accounted for 18.7%, self-employed households accounted for 9.7%, civil servants accounted for 4.9%, enterprises and public institutions accounted for 4.9%, and others accounted for 1.9%, with a wide range of occupation types. From the perspective of educational background, undergraduates accounted for 66.1%, which was the largest proportion. From the perspective of monthly household income, the income range was mainly concentrated in the two ranges of 3000–5000 and 5000–8000. Monthly family income continues to increase with the development of the national economy. Regarding current residence, the proportion of big cities is the largest at 34.1%, which is in line with the increasing urbanization rate; the proportion of counties and rural areas is also large, which is related to the relatively backward economic level of Anhui Province. In terms of the perspective of green product purchase channels, supermarkets accounted for 46.1%, followed by farmers’ markets (25.8%), convenience stores, green product franchises, and other places, reflecting the universality of places when it comes to buying green products.

3.5. Descriptive Statistics

SPSS26.0 software was used for descriptive statistical analysis, as shown in Table 6.
It can be seen from Table 6 that all the mean values are above 3.0, which means that the respondents generally approve of green consumption. The standard deviation is generally between 0.828 and 1.175, and there are few obvious extreme values, indicating that the sample distribution is concentrated and the discrete state is good; thus, the next analysis can be carried out.

4. Data Analysis and Hypothesis Testing

4.1. Correlation Analysis

Pearson’s correlation analysis was used to measure the strength of the linear relationship between two variables. The coefficient of correlation between two variables is calculated and is usually denoted by the symbol r. The r-values range from −1 to 1, where −1 indicates a completely negative correlation, +1 indicates a completely positive correlation, and 0 indicates no linear correlation. In general, the closer the correlation coefficient r is to −1 or +1, the stronger the linear relationship between the two variables. In this study, Pearson’s correlation analysis was used to clarify the correlations among all factors, and the correlation coefficients of each factor are listed in Table 7.
As shown in Table 7, purchase motivation, incentive factors, psychological factors, price factors, channel factors, and consumer innovation are significantly positively correlated with green consumption behavior; however, the correlation between the variables is not equal to a causal relationship between the variables. To further test the research hypothesis, further linear regression analysis is needed.

4.2. Hypothesis Testing

This study uses a stepwise linear regression method to test the hypothesis, taking purchase motivation, incentive factors, psychological factors, price factors, channel factors, and consumer innovation as independent variables and green consumption behavior as the dependent variable.

4.2.1. Residual Statistics and Normal Distribution

The residual statistics and normal distribution of the data were analyzed using software.
We can judge whether the data have strong influence points by looking at Cook’s distance (Cook’s value), as listed in Table 8. If the maximum value of Cook’s distance is greater than 1, then the data are checked for outliers. If the maximum value of Cook’s distance is less than 1, there is no strong influence point in the data, and the next analysis can be performed. The maximum value of Cook’s distance in Table 8 is 0.123 < 1. The data met the requirements of multiple stepwise linear regression analysis.

4.2.2. Fitting Equation Model

Using the step method in linear regression, individual variables were eliminated.
As shown in Table 9, a total of four equation models were fitted in this multiple linear step-by-step regression analysis. The variables in the model include price, channel, purchase, and consumer innovation, and the input method was a step-by-step method.

4.2.3. Goodness-of-Fit Analysis

The below summary of the analysis model by software gives a number of indicators.
In Table 10, R, R-square, and adjusted R-square represent the goodness of fit, which estimates the degree to which the model fits the observed values. The value ranges from 0 to 1; the larger the value, the better the performance. It can be seen from the model summary in Table 10 that the maximum R-square value of the model is 0.163, and the goodness of fit needs to be improved. However, there is no fixed standard in actual research because, most of the time, we care more about whether X has an influence on Y. The Durbin–Watson index indicates the independence between the dependent variables; the closer it is to 2, the better, and the Durbin–Watson value in Table 10 is 1.921, indicating an ideal state. The goodness-of-fit adjusted R-square values of regression models 1, 2, 3, and 4 are 0.132, 0.150, 0.155, and 0.163, respectively, while the final adjusted R-square in Table 10 is 0.163, indicating that the independent variable can explain 16.3% of the change in the dependent variable in total. At the same time, because stepwise regression analysis was used, the R-square of models 1, 2, 3, and 4 gradually increased, and the standard error gradually decreased.

4.2.4. Analysis of Variance

SPSS (version 26.0) was used to conduct ANOVA to determine the degree of influence of the independent variables on the dependent variables.
As shown in Table 11, the F values of models 1, 2, 3, and 4 are 71.887, 41.992, 29.516, and 23.591, respectively, while the p values are all less than 0.001. If the Sig. value corresponding to the F value is <0.05, then the regression equation can be considered valid. Sig < 0.05, so the regression equation is valid.

4.2.5. Regression Result Analysis

Stepwise linear regression was carried out using SPSS, and the regression results were obtained.
Based on the regression results, the final model includes purchase motivation, price factors, channel factors, and consumer innovation. A p value of less than 0.05 indicates that the independent variable has a significant impact on the dependent variable. B is a non-standardized coefficient, and if B is positive, this indicates that the independent variable has a positive impact on the dependent variable. If negative, this suggests that the independent variable has a negative effect on the dependent variable. To make the analysis more accurate, the standard coefficient beta is still needed, and the larger the value, the greater the influence of the independent variable on the dependent variable. The variance inflation factor (VIF) is lower than 5, which means that all variables involved in this study are free of multicollinearity.
As shown in Table 12, the independent variables of significance (p < 0.05) include purchasing motivation, price, channel, and consumer innovation, indicating that these four variables can significantly affect the purchasing behavior related to green products. Furthermore, the regression coefficients of purchasing motivation, price factors, channel factors, and consumer innovation are all positive, which means that these four variables have a significant impact on the purchasing behavior toward green products; That is, the more rational the purchasing motivation, the more rational the purchasing behavior, the wider the channels, the more innovative consumers are, and the more they can stimulate green product purchasing behavior. The regression coefficient of the price factor is negative, which means that this variable has a significant negative impact on the purchasing behavior of green products; that is, the higher the price of green products, the lower the consumer purchasing behavior related to green products. Moreover, the lower the price of green products, the more consumers buy them.
According to the results in Table 12, hypothesis H1 is supported, since purchase motivation has a significant positive impact on consumers’ green consumption behavior (B = 0.154, SE = 0.059, Beta = 0.143, t = 2.611, p < 0.05). With regard to H4, the price factor has a significant negative impact on consumers’ green consumption behavior (B = −0.122, SE = 0.054, Beta = −0.112, t = −2.246, p < 0.05), thus supporting H4. In terms of H5, channel factors have a significant positive impact on consumers’ green consumption behavior (B = 0.172, SE = 0.057, Beta = 0.175, t = 3.017, p < 0.05), and so it is supported. In relation to H6, consumer innovation has a significant positive impact on consumers’ green consumption behavior (B = 0.201, SE = 0.053, Beta = 0.220, t = 3.810, p < 0.05), thus supporting the said hypothesis.
The Sig. values of the T test for H1, H4, H5, and H6 are all lower than 0.05, thus meaning that the null hypothesis is rejected. Therefore, a linear regression relationship between purchasing motivation, price factors, channel factors, consumer innovation, and green product purchasing behavior is established; that is, hypotheses H1, H4, H5, and H6 are established, and the influence of consumer innovation is the strongest. The channel factors, purchase motivation, and price factors are closely related.
Unsuitable variables in the data were eliminated through analysis.
As shown in Table 13, two independent variables—motivation and psychological factors—are excluded from the analysis. With regard to H2, incentive factors had a significant positive impact on consumers’ green consumption behavior (Beta = −0.045, t = −0.739, p > 0.05). Therefore, incentive factors have no significant positive impact on consumers’ green consumption behavior. Thus, hypothesis H2 is not valid. With regard to H3, i.e., that psychological factors have a significant positive impact on consumers’ green consumption behavior (Beta = 0.078, t = 1.692, p > 0.05), it is found that psychological factors have no significant positive impact on consumers’ green consumption behavior; that is, H3 is not valid. The results of the hypothesis testing are presented in Table 14.
Based on the above analysis, the quantitative relationship (regression equation) between green product purchase behavior, purchase motivation, price factors, channel factors, and consumer innovation is as follows: green product buying behavior = 1.754 + 0.154 × purchase motivation + 0.172 × channel factor + 0.201 × consumer innovation − 0.122 × price factor. We recode the variables as follows: Y stands for green consumption behavior; F1 is the purchase motivation; F2 is channel factors; F3 is consumer innovation; F4 is price factors. The regression equation is shown as follows:
Y = 1.754 + 0.154 × F1 + 0.172 × F2 + 0.201 × F3 − 0.122 × F4

5. Discussion and Suggestions

5.1. Establish Consumers’ Awareness of Environmental Protection through Publicity and Education

With regard to H1, i.e., that purchasing motivation has a significant positive impact on consumers’ green consumption behavior, it can be seen that if consumers’ purchasing motivation is positive and environmentally friendly, they tend to buy green products with high safety, low carbon, and environmental protection. The stronger the environmental awareness, the stronger the green purchase motivation. Therefore, consumers’ awareness regarding environmental protection must be established. Governments, schools, and enterprises in related industries should actively promote and educate consumers to establish environmental awareness. Through green consumption and other environmental public welfare activities, consumers participate and become environmental protection participants, posting and displaying environmental signs in a more prominent position and over a wider range. We urge all types of media to disseminate more information on environmental protection. The government and enterprises subsidize the green consumption of consumers and promote their green consumption from a practical perspective.

5.2. Vigorously Develop Green Production Technologies and Reduce the Prices of Green Products

Our hypothesis (H4) that price factor has a significant negative impact on consumers’ green consumption behavior is established since it can be seen that the lower the price of green products, the more active consumers will be in green consumption. Green products are relatively expensive because of their small production scale, large labor input, high risk costs, and high transportation costs. High prices restrict consumers’ desire and ability to buy, resulting in people, even if they want to protect the ecological environment through green consumption, being deterred by the high price of green products and limited personal income. The government should encourage the research and development of green product production technologies, improve the production efficiency of green products, and reduce the price of unit products. Subsidies for the production and consumption of green products will increase in order to reduce the burden of green consumption on consumers. Vigorously developing a green economy and creating a scale effect can reduce the price of green products and promote green consumption.

5.3. Expand Channels for Green Consumption

Of note here is our hypothesis (H5) that channel factors have a significant positive impact on consumers’ green consumption behavior, and it can be inferred that the sales location, sales form, and service scope of green products will affect consumers’ green consumption. Therefore, we should increase the number of locations for green product consumption and set up a wide range of green product consumption locations in urban and rural areas so that consumers can buy green products anytime and anywhere and improve the convenience of green consumption. Green consumption is not limited to offline stores; the online market should also be developed. Nowadays, online shopping is generally popular; there are many online consumption channels, and the system is perfect. Online sales of green products can allow consumers all over the country, and even all over the world, to conveniently undertake green consumption.

5.4. Stimulate Consumer Innovation

Based on the hypothesis that consumer innovation has a significant positive impact on green consumption behavior, it can be concluded that the more advanced consumers’ consumption concepts are, the more willing they are to try innovative products and services, and the more green consumption behavior will occur. Therefore, it is necessary to comprehensively promote the transformation and upgrading of green and low-carbon consumption and deeply integrate the green concept into all fields of consumption. It is also essential to encourage consumers to use green products and reduce their expected purchase risks through product certification and increased service commitment. This would effectively improve the quality, performance, and stability of green products so that consumers can truly feel the superiority of green products to achieve normal green consumption from trial. The innovation of consumers has far-reaching significance for implementing new development concepts, promoting high-quality development, and realizing the goal of “double carbon”.

6. Conclusions

This study collected data through a questionnaire survey, used SPSS26.0 for data processing and analysis, and drew the following conclusions:
First, purchase motivation, price factors, channel factors, and consumer innovation have significant positive impacts on consumers’ green consumption behavior. The relationship between the four variables and green product purchasing behavior is as follows: green product buying behavior = 1.754 + 0.154 × purchase motivation + 0.172 × channel factor + 0.201 × consumer innovation − 0.122 × price factor.
Second, consumers’ attitudes toward buying green products are generally positive. The vast majority of people who buy green products think that they are low-carbon, environmentally friendly, and safe; pay attention to the quality of green products; and are willing to actively try to use new green products, reflecting that the subjective motivation of consumers’ green consumption behavior is positive and supports green consumption.
Third, consumer innovation is the main factor influencing green consumption behavior. According to the results of the linear regression analysis, the significance of consumer innovation’s effect on green consumption behavior is 0.000, which is highly significant. Consumers are increasingly innovative, e.g., trying to use new green products and reading information about new green products; they like to learn about new green products, are interested in buying new green products, and have high expectations for green consumption.
This study has two main limitations. First, the study primarily focused on consumers in Anhui Province as the research object. Whether the results of the paper can widely represent the green consumption behaviors of consumers in various regions of China against the background of “dual carbon” needs to be further verified. Second, this study mainly selected factors that affect consumers’ green consumption, such as price, psychology, channels, purchase motivation, and consumer innovation, but did not consider factors such as regional policies or publicity efforts.
Green consumption is not only a response to the “double carbon” policy, but also the norm and pursuit of our people and even all humankind for a long time. The implementation of green consumption is conducive to the adjustment of the economic structure, optimal allocation of factors, improvement of the quality and quantity of economic growth, and promotion of high-quality economic development in our country.

Author Contributions

Conceptualization, F.H. and S.Z.; methodology, F.H. and Y.Y.; software, S.Z.; validation, F.H., S.Z. and Y.Y.; formal analysis, S.Z.; investigation, S.Z.; resources, K.W.; data curation, K.W.; writing—original draft preparation, F.H. and S.Z.; writing—review and editing, F.H.; visualization, K.W.; supervision, K.W.; project administration, F.H.; funding acquisition, F.H. All authors have read and agreed to the published version of the manuscript.

Funding

This research was supported by the Anhui Provincial Philosophy and Social Sciences Planning Project: Research on the spatiotemporal coupling evolution and green-coordinated development of carbon emissions in the Yangtze River Delta region (AHSKY2022D081), Key Project of Anhui University Outstanding Talents Plan (gxyqZD2020108).

Institutional Review Board Statement

Not applicable.

Informed Consent Statement

Not applicable.

Data Availability Statement

All data generated or analyzed during this study are included in this published article.

Conflicts of Interest

The authors declare no conflict of interest.

References

  1. Nan, S.; Wang, Z.; Wang, J.; Wu, J. Investigating the role of green innovation in economic growth and carbon emissions nexus for China: New evidence based on the PSTR model. Sustainability 2022, 14, 16369. [Google Scholar] [CrossRef]
  2. An, Y.; Zhou, D.; Yu, J.; Shi, X.; Wang, Q. Carbon emission reduction characteristics for China’s manufacturing firms: Implications for formulating carbon policies. J. Environ. Manag. 2021, 284, 112055. [Google Scholar] [CrossRef] [PubMed]
  3. Zhuang, G.; Dou, X.; Wei, M. Scientific explanation and path analysis of carbon peaking carbon neutrality. J. Lanzhou Univ. (Soc. Sci.) 2022, 50, 57–68. [Google Scholar]
  4. Xiong, P.; Zhao, Z.; Chen, H. Research on the Influencing Factors of public green consumption behavior under the carbon peaking target. J. Comm. Econ. 2022, 15, 52–56. [Google Scholar]
  5. Yang, M.; Chen, H.; Long, R.; Hou, C. Overview, evolution and thematic analysis of China’s green consumption policies: A quantitative analysis based on policy texts. Sustainability 2020, 12, 8411. [Google Scholar] [CrossRef]
  6. Khan, R.; Awan, T.M.; Fatima, T.; Javed, M. Driving forces of green consumption in sharing economy. Manag. Environ. Qual. Int. J. 2020, 32, 41–63. [Google Scholar] [CrossRef]
  7. Yan, L.; Keh, H.T.; Wang, X. Powering sustainable consumption: The roles of green consumption values and power distance belief. J. Bus. Ethics 2021, 169, 499–516. [Google Scholar] [CrossRef]
  8. Yue, B.; Sheng, G.; She, S.; Xu, J. Impact of consumer environmental responsibility on green consumption behavior in China: The role of environmental concern and price sensitivity. Sustainability 2020, 12, 2074. [Google Scholar] [CrossRef] [Green Version]
  9. Li, M.; Tan, M.; Wang, S.; Li, J.; Zhang, G.; Zhong, Y. The effect of preceding self-control on green consumption behavior: The moderating role of moral elevation. Psychol. Res. Behav. Manag. 2021, 14, 2169–2180. [Google Scholar] [CrossRef]
  10. Raiswa, S.; Manjula, N.; Ramesh, K.; Dinesh, S. Impact of peer influence and environmental knowledge on green consumption: Moderated by price premium. Int. J. Soc. Ecol. Sustain. Dev. 2022, 13, 1–16. [Google Scholar]
  11. Gupta, A.; Verma, H.; Jain, V.K.; Kumar, P. Modelling drivers of millennials’ green consumption behavior: An interpretive structural modelling approach. Int. J. Econ. Bus. Res. 2022, 24, 73–90. [Google Scholar] [CrossRef]
  12. Le, Y.H.; Manh, T.N. Antecedents of pro-environmental behaviors: A study on green consumption in an emerging market. Int. J. Asian Bus. Inf. Manag. 2022, 13, 1–17. [Google Scholar] [CrossRef]
  13. Beatson, A.; Gottlieb, U.; Pleming, K. Green consumption practices for sustainability: An exploration through social practice theory. J. Soc. Mark. 2020, 10, 197–213. [Google Scholar] [CrossRef]
  14. Gupta, M.; Acharya, A. Answering key questions on green consumption: A qualitative study among Indian youth. Int. J. Nonprofit Volunt. Sect. Mark. 2019, 24, e1661. [Google Scholar] [CrossRef]
  15. Sreen, N.; Yadav, R.; Kumar, S.; Gleim, M. The impact of the institutional environment on green consumption in India. J. Con. Mark. 2021, 38, 47–57. [Google Scholar] [CrossRef]
  16. Swetarupa, C.; Naman, S.; Sadarangani Pradip, H.; Jyoti, G.B. Impact of green consumption value, and context-specific reasons on green purchase intentions: A behavioral reasoning theory perspective. J. Glob. Mark. 2022, 35, 285–305. [Google Scholar]
  17. Arora, C. Determinants of green consumption behavior: Empirical evidence from India. Appl. Ecol. Environ. Sci. 2022, 10, 472–487. [Google Scholar] [CrossRef]
  18. Kwon, J.; Ahn, J. Socio-demographic characteristics and green consumption behavior in developing countries: The case of Malaysia. Soc. Respons. J. 2021, 17, 1213–1231. [Google Scholar] [CrossRef]
  19. Nguyen, L.; Van Thien, N.; Uyen Thu, H. Factors influencing consumer behavior towards green consumption: An empirical study in Vietnam. J. Asian Fin. Econ. Bus. 2021, 8, 197–205. [Google Scholar]
  20. Wang, J.; Shen, M.; Chu, M. Why is green consumption easier said than done? Exploring the green consumption attitude-intention gap in China with behavioral reasoning theory. Cleaner Respons. Consumption 2021, 2, 100015. [Google Scholar] [CrossRef]
  21. Shen, M.; Wang, J. The impact of pro-environmental awareness components on green consumption behavior: The moderation effect of consumer perceived cost, policy incentives, and face culture. Front. Psychol. 2022, 13, 580823. [Google Scholar] [CrossRef] [PubMed]
  22. Tao, S. Study on Influencing Factors of Low Carbon Consumption Behavior of University Students’ Families in Shanghai Under the Background of “Double Carbon”. Master’s Thesis, Shanghai Second Polytechnic University, Shanghai, China, 2022. [Google Scholar]
  23. Rustam, A.; Wang, Y.; Zameer, H. Environmental awareness, firm sustainability exposure and green consumption behaviors. J. Cleaner Prod. 2020, 268, 122016. [Google Scholar] [CrossRef]
  24. Yang, S.; Chai, J. The influence of enterprises’ green marketing behavior on consumers’ green consumption intention—Mediating role and moderating role. Sustainability 2022, 14, 15478. [Google Scholar] [CrossRef]
  25. Yang, S. Study on the Influence of Green Marketing Behavior on Consumers’ Green Consumption Intention. Master’s Thesis, University of Electronic Science and Technology of China, Chengdu, China, 2020. [Google Scholar]
  26. Xu, L.; Yu, F.; Ding, X. Circular-looking makes green-buying: How brand logo shapes influence green consumption. Sustainability 2020, 12, 1791. [Google Scholar] [CrossRef] [Green Version]
  27. Chen, X. Peak carbon is not a carbon charge. Economy 2022, 3, 1. [Google Scholar]
  28. Li, D.; Zhang, W. “Circular Economy Evaluation Index System” Research. Stat. Res. 2006, 9, 23–26. [Google Scholar] [CrossRef]
  29. Zhang, B.; Huang, X. Research and empirical evaluation of circular economy development index system. China Popul. Resour. Environ. 2005, 03, 22–25. [Google Scholar]
  30. Geng, Y.; Fu, J.; Sarkis, J.; Xue, B. Towards a National Circular Economy Indicator System in China: An Evaluation and Critical Analysis. J. Clean. Prod. 2012, 23, 216–224. [Google Scholar] [CrossRef]
  31. Ajzen, I. The theory of planned behavior. Organ. Behav. Hum. Decis. Process. 1991, 50, 179–211. [Google Scholar] [CrossRef]
  32. Emanuel, A.S.; McCully, S.N.; Gallagher, K.M.; Updegraff, J.A. Theory of Planned Behavior explains gender difference in fruit and vegetable consumption. Appetite 2012, 59, 693–697. [Google Scholar] [CrossRef] [Green Version]
  33. Vermeir, I.; Verbeke, W. Sustainable food consumption among young adults in Beigium: Theory of planned behavior and the role of confidence and values. Ecol. Econ. 2008, 64, 542–553. [Google Scholar] [CrossRef]
  34. Fekadu, Z.; Kraft, P. Self-identity and in Planned Behavior Perspective: Past behavior and its moderating effects on self-identity-intention relations. Soc. Behav. Personal. 2001, 29, 671–686. [Google Scholar] [CrossRef]
  35. Chen, H.S.; Chen, C.Y.; Chen, H.K.; Hsieh, T. A study of Relationships among Green Consumption Attitude, Perceived Risk, Perceived Value toward Hydrogen-Electric Motorcycle Purchase Intention. Aasri Procedia 2012, 2, 163–168. [Google Scholar] [CrossRef]
  36. Wang, X.; Cheng, A. Review of research on green consumption behavior based on Planned behavior theory. Shandong Text. Econ. 2014, 05, 5–6. [Google Scholar]
  37. Wang, F. Study on the Influencing Factors of Rural Residents’ Purchase Motivation of Small Property Houses from the Perspective of Social Psychology. Master’s Thesis, Wuhan Institute of Technology, Wuhan, China, 2022. [Google Scholar]
  38. Chen, Y. The Impact of Government Incentive Policies on the Development of Green Buildings. Master’s Thesis, Dongbei University of Finance and Economics, Dalian, China, 2022. [Google Scholar]
  39. Cao, Y.; Gou, Y.; Yang, Z. Study on the influence of college students’ low-carbon consumption psychology on low-carbon consumption behavior. Investig. Entrep. 2022, 33, 210–213. [Google Scholar]
  40. Wang, Y. Study on Discount Pricing Strategy of F Fashion Brand Considering Consumer Psychology. Master’s Thesis, Donghua University, Shanghai, China, 2022. [Google Scholar]
  41. Shuo, F.; Yao, Q. The influence of the change of consumer channels on the traditional retail industry. J. Comm. Econ. 2022, 837, 76–78. [Google Scholar]
  42. Liu, D. A Study on Influencing Factors of Consumer Green Product Purchasing Behavior. Master’s Thesis, Harbin Institute of Technology, Harbin, China, 2020. [Google Scholar]
  43. Hu, X. Green Consumption; China Environmental Press: Beijing, China, 2016. [Google Scholar]
  44. Xue, B.; Ji, W. Analysis on the formation mechanism of customers’ green consumption behavior under the target of carbon peak. J. Comm. Econ. 2021, 20, 83–86. [Google Scholar]
Figure 1. Planned behavior model.
Sustainability 15 12296 g001
Table 1. Definition of relevant variables.
VariablesSpecific MeaningItemsReference
Purchase motiveConsumer psychology holds that individuals produce purchase demand under certain environmental stimuli, purchase demand produces purchase motivation, and purchase motivation will eventually stimulate people’s purchase behavior.(1) Environmentally friendly;
(2) More cost-effective;
(3) More in line with future trends;
(4) More advanced than others.
Wang Fang [37]
Motivating factorMotivation is a psychological state that stimulates individuals’ subjective initiative and active participation with the help of a series of guiding methods, stimulates individuals or organizations to produce certain behaviors, supports follow-up actions, and engages those individuals in certain types of activities. It is the core of management and an effective way to achieve goals.(1) Rewarding;
(2) Promotion of advertising;
(3) Public media and social organizations’ advocation;
(4) The national policy requirement.
Chen Yuting [38]
Psychological factorGreen consumption psychology mainly includes green consumption cognition, motivation, and consciousness. Some people are impulsive and some are rational.(1) Follow suit;
(2) Conformity;
(3) Impulsive mind;
(4) Pursue fashion;
(5) Goal-driven.
Cao Yidi et al. [39]
Price factorThe setting of product prices and the fluctuation of product prices will make the psychological feelings of consumers change.(1) Lower price;
(2) Reasonable pricing;
(3) Price focus.
Wang Yuhan [40]
Channel factorThe channel function is judged by the choice of consumers, and the consumption experience and after-sales service form an important standard for the channel function.(1) Offline channel;
(2) Online channel;
(3) Channel consistency.
Feng Shuo [41]
Consumer innovationThe subjective initiative of consumers to accept new ideas and actively try new products, as well as their willingness to understand and acquire the information characteristics of new products.(1) Try new products;
(2) Obtain new product information;
(3) Learn new product knowledge;
(4) Buy new products;
(5) The degree to which new products are purchased;
(6) Like new features.
Liu Diya [42]
Green consumption behaviorThe broad sense of green consumption refers to the consumption behavior characterized by saving resources and protecting the environment, and the narrow sense of green consumption means that consumers buy environmentally friendly or pure natural products.(1) Rarely use disposable utensils, buy bottled drinks, etc.;
(2) Often bring shopping bag;
(3) Use new energy products;
(4) Buy energy-saving appliances.
Xiong Ping et al. [4]
Hu Xueping [43]
Table 2. Reliability analysis.
Cronbach αItems
0.89229
Table 3. Results of KMO test and Bartlett sphericity test.
TestItemResult
KMO testKMO value0.911
Approximate chi-square4709.978
Bartlett sphericity testDegree of freedom300
Significance level0.000
Table 4. Summary of the disposition of cases.
Cases Number%
Casevalid466100
eliminated a00
total466100
a Column deletion based on all variables in the procedure.
Table 5. Descriptive analysis of demographic characteristics of the sample.
CategoryItemFrequencyProportion (%)
GenderMale16936.3
Female29763.7
Date of birthBefore 19894810.3
1990–200027659.2
After 200114230.5
OccupationStudent27959.9
Company staff8718.7
Individual household459.7
Civil servant234.9
Enterprises and public institutions234.9
Others91.9
Education backgroundPrimary and below30.6
Junior high school/technical secondary school/high school/vocational4810.3
Junior college337.1
Bachelor’s degree20866.1
Master’s degree or above7415.9
Family monthly incomeBelow CNY 30005010.7
3000 to 500012226.2
5000 to 800013729.4
8000 to 15,0009620.6
More than 15,0006113.1
Present addressMedium and large cities15934.1
Outskirts7816.7
County13027.9
Village9921.2
Channels for buying green productsSupermarket21546.1
Convenience store5712.2
Green products store6513.9
Farmers’ market12025.8
Others91.9
Table 6. Descriptive statistical analysis.
CodeSpecific ContentMean ValueStandard Deviation
Q1I rarely use disposable utensils or buy bottled drinks3.261.086
Q2I often bring my own shopping bag3.281.203
Q3I use new energy products3.431.140
Q4I bought energy-saving appliances3.201.065
X1I buy green products because they are more environmentally friendly than traditional products4.220.842
X2I buy green products because they are more cost-effective than traditional products4.330.828
X3I buy green products because I think they are more in line with future trends4.190.854
X4I buy green products because I think they are more advanced than others3.571.018
X5Rewarding green consumption will encourage me to carry out green consumption3.601.033
X6The promotion of advertising about green products or service will encourage me to carry out green consumption4.200.806
X7Public media and social organizations advocate green consumption, and I will do more green consumption4.090.869
X8The national policy calls for green consumption, and I will do more green consumption4.160.821
X9I think I’m behind The Times if I don’t do green consumption4.270.828
X10People around me are green consumers, and I will carry out more green consumption3.461.175
X11Sometimes when I see products with environmental protection and green characteristics, I can’t control to buy them3.441.163
X12I think green consumption is a fashion3.401.220
X13I want to make a contribution to environmental protection, so I do more green consumption3.481.138
X14I think the lower price of green products will promote green consumption behavior3.991.005
X15If the price of green products or services is reasonable, I will have green buying behavior4.020.975
X16I’m more concerned about the price of green products3.551.087
X17If it is convenient to buy green products or services in offline places such as supermarkets and convenience stores, I will often make green consumption3.960.886
X18If I can easily buy green products or services online, I will often make green purchases3.610.945
X19If I can buy the same high-quality green products or services from different channels, I will often make green consumption3.321.047
X20I like to try new green products4.010.898
X21I like to read all kinds of information about new green products3.831.025
X22I like to learn the changes and features of new green products3.880.887
X23I like to buy new green products3.681.002
X24Even if a new green product or service comes on the market at a higher price, I will still buy and try new products3.661.005
X25Compared with traditional products, many new functions of green products encourage me to consume green products3.730.964
Number of valid cases (column) 466
Table 7. Correlation matrix of influencing factors.
CorrelationGreen Consumption BehaviorBuying MotiveMotivating FactorPsychological FactorPrice FactorChannel FactorConsumer Innovation
Green consumption behavior1
Buying motive0.296 **1
Motivating factor0.221 **0.666 **1
Psychological factor0.172 **0.255 **0.290 **1
Price factor0.111 *0.478 **0.464 **0.339 **1
Channel factor0.340 **0.511 **0.500 **0.309 **0.426 **1
Consumer innovation0.366 **0.532 **0.513 **0.241 **0.364 **0.633 **1
** At level 0.01 (two-tailed), the correlation was significant. * At level 0.05 (two-tailed), the correlation was significant.
Table 8. Residual statistics.
MinimumMaximumMeanStandard DeviationNumber of Cases
Predicted value2.11293.9483.29020.30589466
Standard predicted value−3.8492.1501466
Standard error of the predicted value0.0330.2210.0660.024466
Adjusted estimates2.08723.95723.29110.3065466
Residual error−2.193262.2541700.67609466
Standard residual−3.233.3200.996466
Studentized residuals−3.2813.407−0.0011.002466
Elimination residuals−2.26262.37399−0.000880.68542466
Studentization eliminated residuals−3.3163.447−0.0011.005466
Mahalanobis distance0.11948.23.9914.387466
Cook distance00.1230.0030.009466
Median leverage00.1040.0090.009466
Dependent variable: green consumption behavior.
Table 9. Input/removed variables.
ModelInput VariableRemoved
Variable
Method
1Consumer innovation Step (condition: the probability of F to be entered ≤ 0.050, the probability of F to be removed ≥ 0.100).
2Channel factor Step (condition: the probability of F to be entered ≤ 0.050, the probability of F to be removed ≥ 0.100).
3Buying motive Step (condition: the probability of F to be entered ≤ 0.050, the probability of F to be removed ≥ 0.100).
4Price factor Step (condition: the probability of F to be entered ≤ 0.050, the probability of F to be removed ≥ 0.100).
Dependent variable: green consumption behavior.
Table 10. Model summary.
ModelRR-SquareAdjusted R-SquareErrors in Standard EstimatesDurbin–Watson
10.366 a0.1340.1320.69125
20.392 b0.1540.150.6842
30.401 c0.1610.1550.68198
40.412 d0.170.1630.679021.921
a Predictor: (constant), consumer innovation; b predictor: (constant), consumer innovation, channel factors; c predictive variables: (constant), consumer innovation, channel factors, and purchase motivation; d predictive variables: (constant), consumer innovation, channel factors, purchase motivation, and price factors; dependent variable: green consumption behavior.
Table 11. ANOVA.
Table 11. ANOVA.
Model Sum of SquaresDegrees of FreedomMean SquareFSignificance
1Regression34.349134.34971.8870.000 a
Residual error221.7094640.478
Total256.058465
2Regression39.315219.65841.9920.000 b
Residual error216.7434630.468
Total256.058465
3Regression41.183313.72829.5160.000 c
Residual error214.8754620.465
Total256.058465
4Regression43.508410.87723.5910.000 d
Residual error212.554610.461
Total256.058465
Dependent variable: green consumption behavior; a predictor: (constant), consumer innovation; b predictor: (constant), consumer innovation, channel factors; c predictive variables: (constant), consumer innovation, channel factors, and purchase motivation; d predictive variables: (constant), consumer innovation, channel factors, purchase motivation, and price factors.
Table 12. Regression coefficients.
Model Non-Normalized CoefficientStandardization CoefficienttSignificanceCollinearity Statistics
BStandard ErrorBeta ToleranceVIF
1(constant)2.0370.151 13.4690
Consumer innovation0.3350.040.3668.479011
2(constant)1.7720.17 10.4040
Consumer innovation0.2310.0510.2524.56700.5991.67
Channel factor0.1770.0540.183.2570.0010.5991.67
3(constant)1.5580.201 7.7640
Consumer innovation0.1970.0530.2163.72200.541.852
Channel factor0.1470.0560.152.6180.0090.5571.796
Buying motive0.1130.0560.1052.0040.0460.6661.501
4(constant)1.7540.218 8.0440
Consumer innovation0.2010.0530.223.8100.5391.854
Channel factor0.1720.0570.1753.0170.0030.5361.867
Buying motive0.1540.0590.1432.6110.0090.6021.662
Price factor−0.1220.054−0.112−2.2460.0250.7261.377
Dependent variable: green consumption behavior.
Table 13. Excluded variables.
Model Input BetatSignificancePartial CorrelationCollinearity Statistics
ToleranceVIFMinimum Tolerance
1Buying motive0.141 b2.7820.0060.1280.7171.3950.717
Motivating factor0.046 b0.9070.3650.0420.7371.3560.737
Psychological factor0.088 b1.9930.0470.0920.9421.0620.942
Price factor−0.026 b−0.5520.582−0.0260.8681.1520.868
Channel factor0.180 b3.2570.0010.150.5991.670.599
2Buying motive0.105 c2.0040.0460.0930.6661.5010.54
Motivating factor0.003 c0.060.9520.0030.6861.4570.548
Psychological factor0.061 c1.3620.1740.0630.9011.110.573
Price factor−0.071 c−1.4990.135−0.070.8041.2440.555
3Motivating factor−0.066 d−1.1070.269−0.0510.511.960.495
Psychological factor0.052 d1.1620.2460.0540.8911.1220.54
Price factor−0.112 d−2.2460.025−0.1040.7261.3770.536
4Motivating factor−0.045 e−0.7390.46−0.0340.4952.0190.476
Psychological factor0.078 e1.6920.0910.0790.851.1760.526
Dependent variable: green product purchasing behavior; b predictive variable in the model: (constant), consumer innovation; c predictive variables in the model: (constant), consumer innovation, channel factors; d predictive variables in model: (constant), consumer innovation, channel factors, and purchase motivation; e predictive variables in model: (constant), consumer innovation, channel factors, purchase motivation, and price factors.
Table 14. Results of hypothesis testing.
HypothesisBetatSignificanceVIFResult
H1. Purchase motivation has a significant positive impact on consumers’ green consumption behavior0.1432.6110.0091.662supported
H2. Incentive factors have a significant positive impact on consumers’ green consumption behavior−0.045−0.7390.0462.019rejected
H3. Psychological factors have a significant positive impact on consumers’ green consumption behavior0.0781.6920.0911.176rejected
H4. Price has a significant negative impact on consumers’ green consumption behavior−0.112−2.2460.0251.377supported
H5. Channel factors have a significant positive impact on consumers’ green consumption behavior0.1753.0170.0031.867supported
H6. Consumer innovation has a significant positive impact on consumers’ green consumption behavior0.2203.8100.0001.854supported
Disclaimer/Publisher’s Note: The statements, opinions and data contained in all publications are solely those of the individual author(s) and contributor(s) and not of MDPI and/or the editor(s). MDPI and/or the editor(s) disclaim responsibility for any injury to people or property resulting from any ideas, methods, instructions or products referred to in the content.

