Article

Identifying the Distribution and Frequency of Dust Storms in Iran Based on Long-Term Observations from over 400 Weather Stations

1
Interdisciplinary Graduate School of Engineering Sciences, Kyushu University, Fukuoka 816-8580, Japan
2
Faculty of Engineering Sciences, Kyushu University, Fukuoka 816-8580, Japan
*
Author to whom correspondence should be addressed.
Sustainability 2023, 15(16), 12294; https://doi.org/10.3390/su151612294
Submission received: 21 June 2023 / Revised: 7 August 2023 / Accepted: 10 August 2023 / Published: 11 August 2023

Abstract

:
Middle Eastern countries suffer from dust events due to extended arid areas. Among them, Iran is a country experiencing a high record of dust events each year causing major environmental challenges. Although there are previous studies of the present situations of dust storm occurrences in Iran, most studies have analyzed the meteorological dataset in limited weather stations and areas in Iran. To understand the nationwide trends of the distributions and frequencies of dust storm events, comprehensive statistical evaluations of dust storm events, based on different dust categories, are required. Therefore, this study analyzes 12-year meteorological databases obtained at 427 stations in Iran to clarify the distribution of dust events and occurrence frequencies of the dust in a recent decade by classifying the dust events into suspended dust, rising dust, and dust storm. The highest record of the days belongs to rising dust, which surpassed 150 days per year, followed by suspended dust with over 100 days per year, and, finally, dust storms with a frequency of 30 days per year as annual statistics of dust events. In contrast, there were some stations that recorded minimal occurrences of dust events during the observation periods. To prove the spatial nonuniformity of the dust events, suspended dust events showed a distinct concentration in the western regions of the country, while rising dust tended to occur more frequently in the southern, eastern, and central parts of Iran. Accordingly, seasonal analyses indicate that the highest number of dust events occurred during the spring season, with the number of stations experiencing dust events being greater than during other seasons in all three categories. Nonetheless, annual analyses of dust events do not demonstrate any significant trends, with only 2012 having the highest record of dust events across all three categories. In terms of monthly analyses, dust events tended to increase from late spring to early summer in the suspended dust and rising dust categories. These analyses demonstrate the importance of studying numerous weather station datasets to clarify spatial trends of dust events with long-term variations.

1. Introduction

Sand and dust storms are atmospheric phenomena that result from the process of wind blowing small particles from the land surface [1]. The transformation of these particles depends on various factors, such as the physical properties of the soil, wind velocity, particle size, and land cover. Physical features of the soil, such as soil texture, soil fertility, cohesiveness of particles, and soil moisture, can determine whether the particles can be aerosolized [2]. Wind velocity can decrease soil humidity, leading to a loss of particle cohesiveness. In addition, land cover or land surface conditions, such as vegetation cover and surface roughness, are other important factors that affect the emission of particles. The lack of vegetation is a critical factor that can cause dust emissions, as it leads to a lack of protein and humidity in the soil, making it more prone to erosion. In short, the combination and interaction of different factors cause soil erosion, which ultimately leads to sand and dust storms.
In addition to numerous factors causing soil erosion, the particle formation is also complex physical phenomena. The size of sand particles is determined by their diameter, affecting how high and how long the wind can carry the particles [3]. Therefore, particle dynamical motions are classified into three modes depending on their size: suspension, saltation, and creep. If the size of particles is not bigger than 0.1 mm, they can be carried to longer distances and higher altitudes and remain suspended in the air. If the size of particles is between 0.1 and 0.5 mm, they can be lifted up by wind but cannot remain in a suspended condition and fall back to the ground. The repeated lifting and falling of particles are called saltation, which causes abrasion on the surface. Finally, particles that are too heavy to be lifted by wind, with a size between 0.5 and 3 mm, roll on the ground and are pushed by the wind [4]. These complex phenomena also hinder employing numerical predictions of the dust events as well as highlight the importance of the investigation of the field measurement datasets.
Sand and dust storms are recognized as major hazards due to their numerous and wide-ranging impacts, which are not limited to arid areas. These storms have both natural and anthropogenic effects, and their impacts are not always negative; they can also have positive effects, such as providing minerals to oceans and terrestrial ecosystems [5]. However, the negative effects of dust storms, such as desertification, degradation of landscapes, and crop loss, cannot be ignored [6,7,8]. Dust storms also have common effects, such as impacts on human health and economic losses [9,10,11,12]. As a result, they have become a global concern in recent decades, as they can impede the sustainable development of developing countries [1]. Therefore, it is crucial to address the impacts of sand and dust storms on socio-economy, human health, and the environment, to mitigate their effects and ensure sustainable development.
Major and larger dust sources are predominantly located in the northern hemisphere. The Middle East and Western Asia are globally recognized as major contributors to sand and dust storms [9]. These regions are highly susceptible to dust storms due to synoptic systems and regional climate fluctuations, which can result in up to 20% of global dust storms [13,14]. Through this area, large amounts of dust are emitted from the Arabian Peninsula, Iraq, and Syria and delivered to neighboring countries, the Red Sea, the Persian Gulf, and the northern Indian Ocean [3,15]. Furthermore, the Middle East has experienced increased desertification and drought, particularly in Iraq and Syria, which are caused by natural processes in Iraq and anthropogenic activities in Syria, such as the control of rivers and the construction of dams [16,17]. Numerous studies have indicated that Syria and Iraq are the primary sources of dust storms in the western part of Iran. Boloorani et al. [18] used multiple methods to determine the source of dust storms that affect the western part of Iran and concluded that they originate from Iraq, the Iraq–Jordan borders, and Syria. Javadian et al. [19] revealed that southern and central Iraq are the main sources of dust storms in the western part of Iran, using the HYSPLIT model. The Arabian Peninsula is also a significant source of dust storms in the Middle East, with a large proportion of its land area consisting of desert plains, which can cause dust storms over the Persian Gulf and southern areas of Iran [20]. Recent studies have concluded that the Arabian Peninsula ranks second, after the Sahara Desert, as a major source of dust storms in the dry belt.
Numerous studies have been conducted to investigate sand and dust storms in Iran, utilizing various methodologies such as remote sensing techniques, mineral dust sampling, and statistical and spatial analysis. Hamzeh et al. [21] examined dust events at five meteorology stations in the southwest of Iran and concluded that a significant portion of dust events originate from transboundary sources, rather than from within Iran. Modarres and Sadeghi [22] analyzed the number of dusty days occurring in 22 stations in the desert regions of Iran and found that the highest variation of dust days was observed in the southeastern part of the country, with a high frequency in the summer and spring seasons. Mesbahzadeh et al. [23] analyzed 35 meteorology stations across Iran and determined that Zabol and Zahedan were the stations most affected by dust events, while they [24] analyzed 37 meteorology stations from 1999 to 2018 and found that dust days were most common in the summer and spring seasons, with Zabol, Zahedan, and Arak stations experiencing a high frequency of dusty days. Further, Baghbanan et al. [25] examined 44 stations across Iran and concluded that the highest frequency of dust storm occurrence was observed in the months of July, June, and May, with spring and summer being the peak seasons for dust storms. Additionally, Beyranvand et al. [26], investigating dust events over Iran between 1987 and 2016 for 44 stations, found that the frequency of suspended dust was particularly high in the southwest region of Iran, with Zabol station experiencing a high frequency of rising dust and dust storms in the eastern regions. Finally, a comprehensive analysis by Alizadeh-Choobari et al. [27] of more than 300 stations across Iran from 1991 to 2010 revealed that suspended dust occurred more frequently in the western part of the country compared to other areas and that it was particularly prevalent during the spring season.
Although these studies provide valuable insights into the prevalence and characteristics of sand and dust storms in Iran, we think two aspects are missing to entirely understand sand and dust storms in Iran. The first is that these studies have analyzed the datasets obtained at a small number of meteorology stations located in well-known dust-storm areas. To understand the comprehensive situation of sand and dust storms within the nation, weather stations covering the entire nation need to be considered. The second is that continued monitoring is essential to understand the long-term trend. Therefore, this study aims to investigate dust events of three categories of suspended dust, rising dust, and dust storm at 427 stations over Iran covering a period of 12 years. In Section 2, the general climate in Iran along with data used in research are discussed. In Section 3, the general trend, occurrence frequency, and spatial distribution of dust events in each category across Iran are discussed. In Section 4, the seasonal spatial distribution of each dust category is discussed, followed by Section 5, which is about the long-term (monthly and annually) variation of dust events for three classes.

2. Details of Meteorological Datasets

2.1. Local Climate in Iran

Iran is situated in the dust belt which has an arid and semi-arid climate except for northern coastal areas and some parts of the west. Summers (from June to August) are hot and warm with little rainfall and relatively low humidity. Monthly precipitation is less than 40 mm even in the winter season, showing the very arid weather condition throughout a year. The climate of the region is characterized as continental, exhibiting hot and dry summers along with cold winters. The annual temperature range spans from 22 °C to 26 °C. In terms of precipitation, the average annual amount is approximately 240 mm. However, significant variations exist among different areas. The northern region experiences the highest amount of precipitation, reaching up to 1800 mm, while the Zagros slopes receive around 480 mm [28].
Iran is characterized by drylands and deserts where aeolian processes are prevalent and wind-eroded mineral dust is prevalent [13,29]. As a result, it contains numerous dust sources, which are active on a local scale. Desiccated and seasonal lakes, such as Urmia Lake, Hawr-al-azim Wetland, Jazmurian Lake, Hamoun Lakes, and Marshes, are one of the key contributors to dust storms in Iran. According to Papi et al. [30], Iran, Iraq, and Turkey have witnessed the highest reduction in groundwater levels, with the highest dust storm sources in Iran and Iraq, respectively. In recent years, numerous studies have highlighted the significant role of shrinking water bodies in triggering dust storms in Iran [13,31,32]. Zucca et al. [33] identified the drivers of sand and dust storms and found that the desiccation of lakes in Iran is a direct cause of dust storms.
Thus, dust storms in Iran can be classified into two types: direct and indirect. Indirect storms occur in neighboring countries and enter Iran, while direct storms are created within Iran due to local factors. The increasing frequency of direct and indirect dust storms in Iran underscores the need to examine the long-term trends, inter-seasonal to inter-annual variations, and temporal evolution of dust storms in Iran, which hold great significance. In short, Iran is located in the regions where dust events can easily occur in terms of local climate conditions as well as geographical conditions.

2.2. Meteorological Stations and Datasets

The meteorology data for a period from 2010 to 2021, with a 3 h interval, for 427 stations were obtained from the meteorology organization of Iran. Figure 1 depicts the location of the stations. The data collection encompasses a range of additional physical quantities, including temperature, precipitation, wind speed, evaporation, relative humidity, soil temperature, sea level pressure, cloud height, and others. These fundamental weather variables are systematically gathered and recorded. In addition to these essential meteorological measurements, the datasets also incorporate the classification codes associated with dust events. Those are data pertaining to suspended dust, rising dust, and dust storm, with present weather codes of 06, 07, and 33–35, respectively, were included. The selection of dust event data was based on the definition of the World Meteorological Organization (WMO). The details of the dust classification are explained in the next section.

2.3. Classification Codes of Dust Events

There are several classification codes to represent the dust events based on weather data defined in WMO. Among them, we categorized them into three types. First, the code for suspended dust (06) represents dust suspended in the air but not raised by the wind near the station at the time of observation. The second, the code for rising dust (07), represents sand or dust raised by the wind at or near the station. The severe dust storms are coded into three categories as 33, 34, and 35, based on the severity of the dust event at the time of observation [34]. To record dust events codes at the time of observation, factors such as horizontal visibility, wind speed, and precipitation need to be considered. There should be no precipitation at the time of observation. However, the values of wind speed and horizontal visibility may vary depending on the different categories, which are described in Table 1.
As previously mentioned, the data were collected every three hours per day, resulting in a maximum of eight dust events being recorded per day. To count the total days experienced with any dust events categorized above, only one reported sand and dust storm was considered as a dusty day in the following statistical analyses. Thus, repeated values from the same class for certain days were omitted, leaving only a single representation of each day’s dustiness. In addition, in the dust storm category, all three codes 33, 34, and 35 were considered as one category. Although they represent a dust storm in different intensities, the criteria for recording these events remain the same.

3. General Trends of the Dust Events in Entire Countries

3.1. Occurrence Frequency of Dust Events

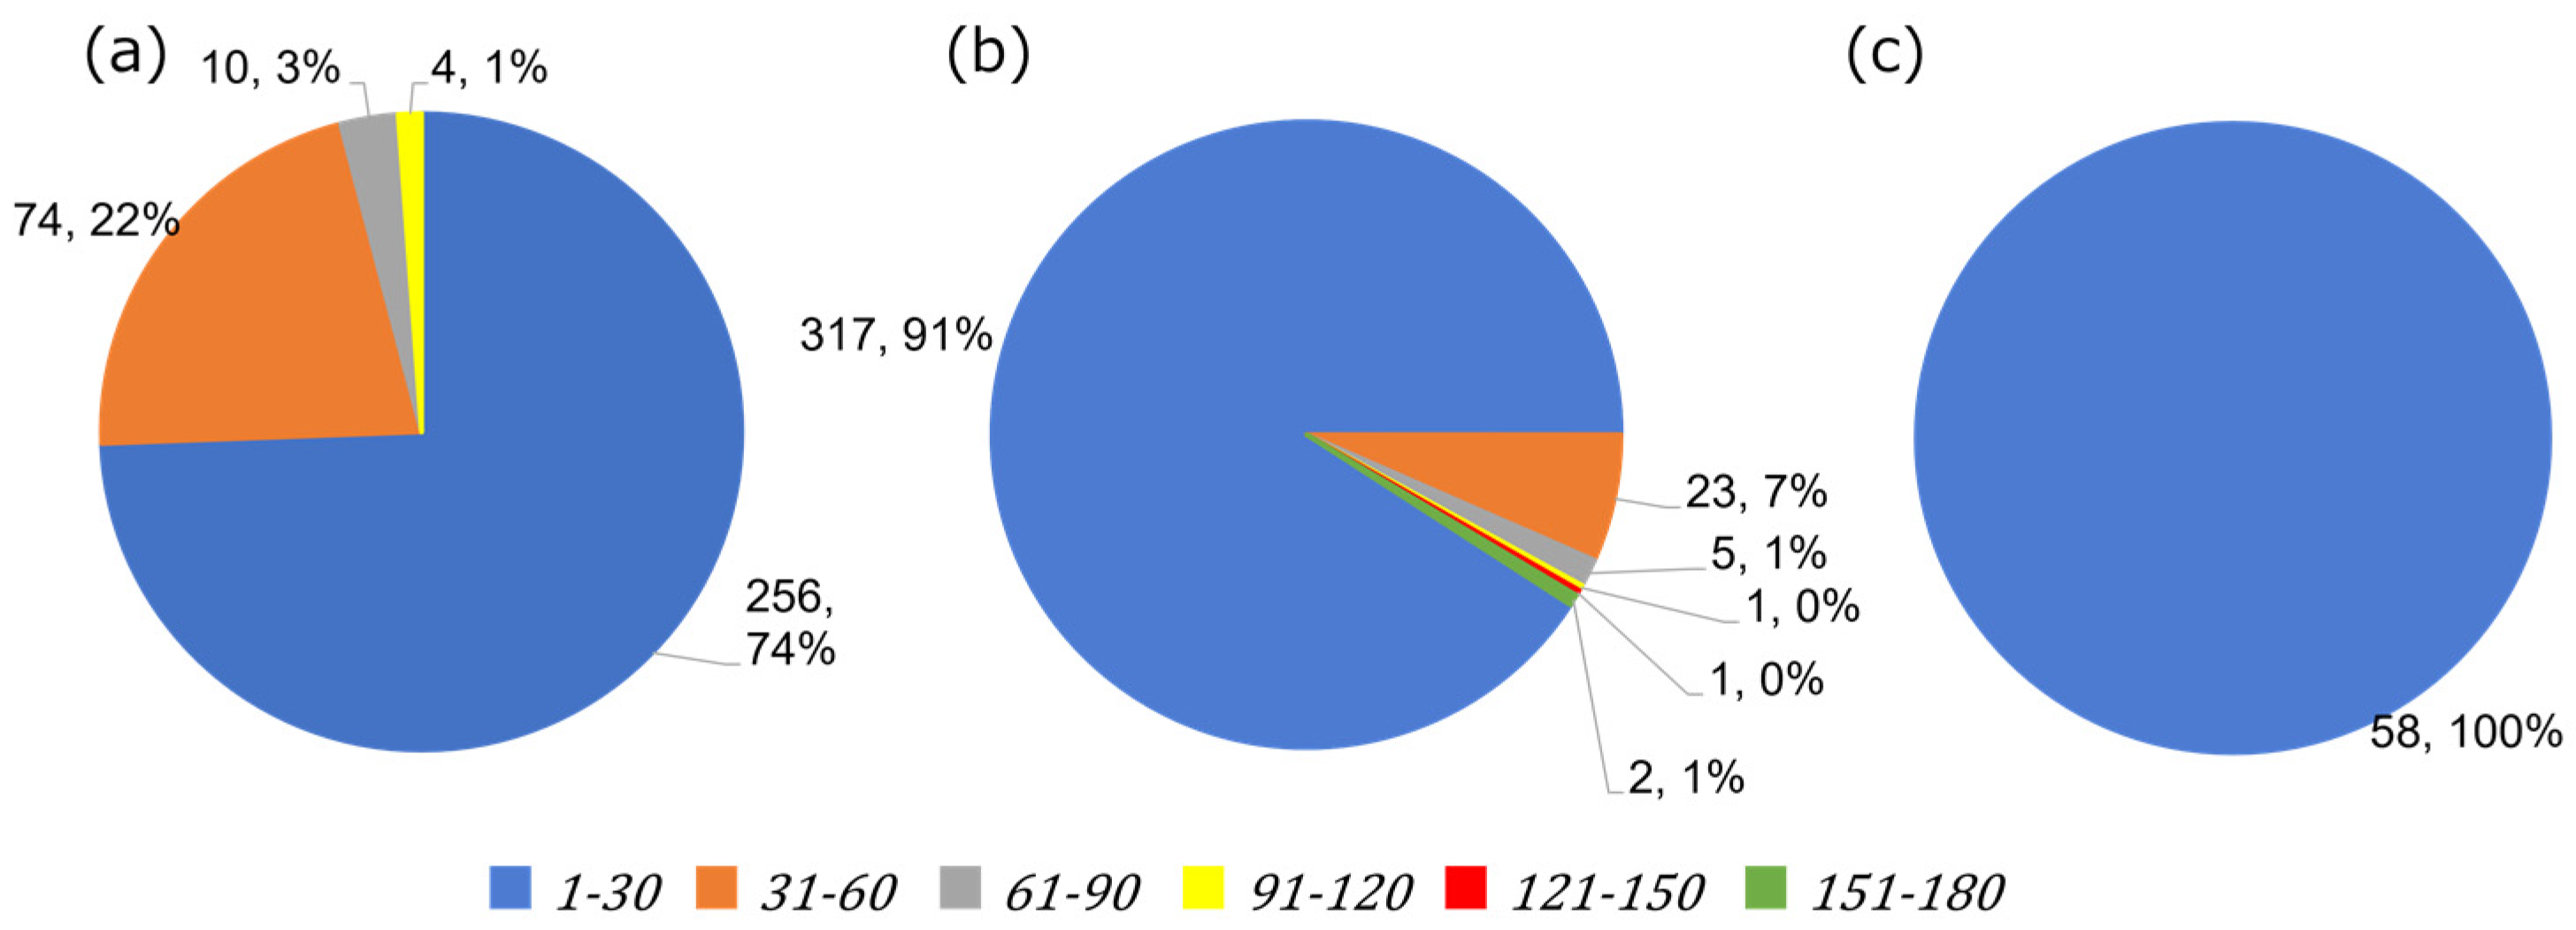
To statistically understand the general trends of the dust events based on the long-term meteorological dataset, Figure 2 depicts the occurrence frequency of dust events in each category. The frequency indicates the expected days per year classified from a month (30 days) to half a year (180 days). The investigation into the occurrence frequency of suspended dust (Figure 2a), rising dust (Figure 2b), and dust storms (Figure 2c) reveals that over 300 stations encounter suspended dust, and a similar number experience rising dust each year among all the stations, whereas nearly 60 stations are affected by dust storms. Although the number of stations that experience suspended dust and rising dust each year is almost identical, the duration and frequency of dust events differ in each category. In most stations, the frequency of dust events in all three categories is 30 days, indicating that 256 stations (74% of stations) experience dust events for almost 30 days each year in the suspended dust category, 91% or 317 stations in the rising dust category, and 100% or 58 stations in the dust storm category. Moreover, 74 stations (22% of stations) experience suspended dust for almost 60 days each year, while only 7% of stations (23 stations) experience rising dust for almost 60 days each year. To summarize these analyses, the mild dust events categorized as suspended and rising dusts occur more frequently, while more severe dust storms also happen, though the frequency is less than that of mild dust events. More detailed breakdowns of the occurrence frequencies in less than one month are discussed in Section 3.3.

3.2. Spatial Distribution of Dust in Three Categories

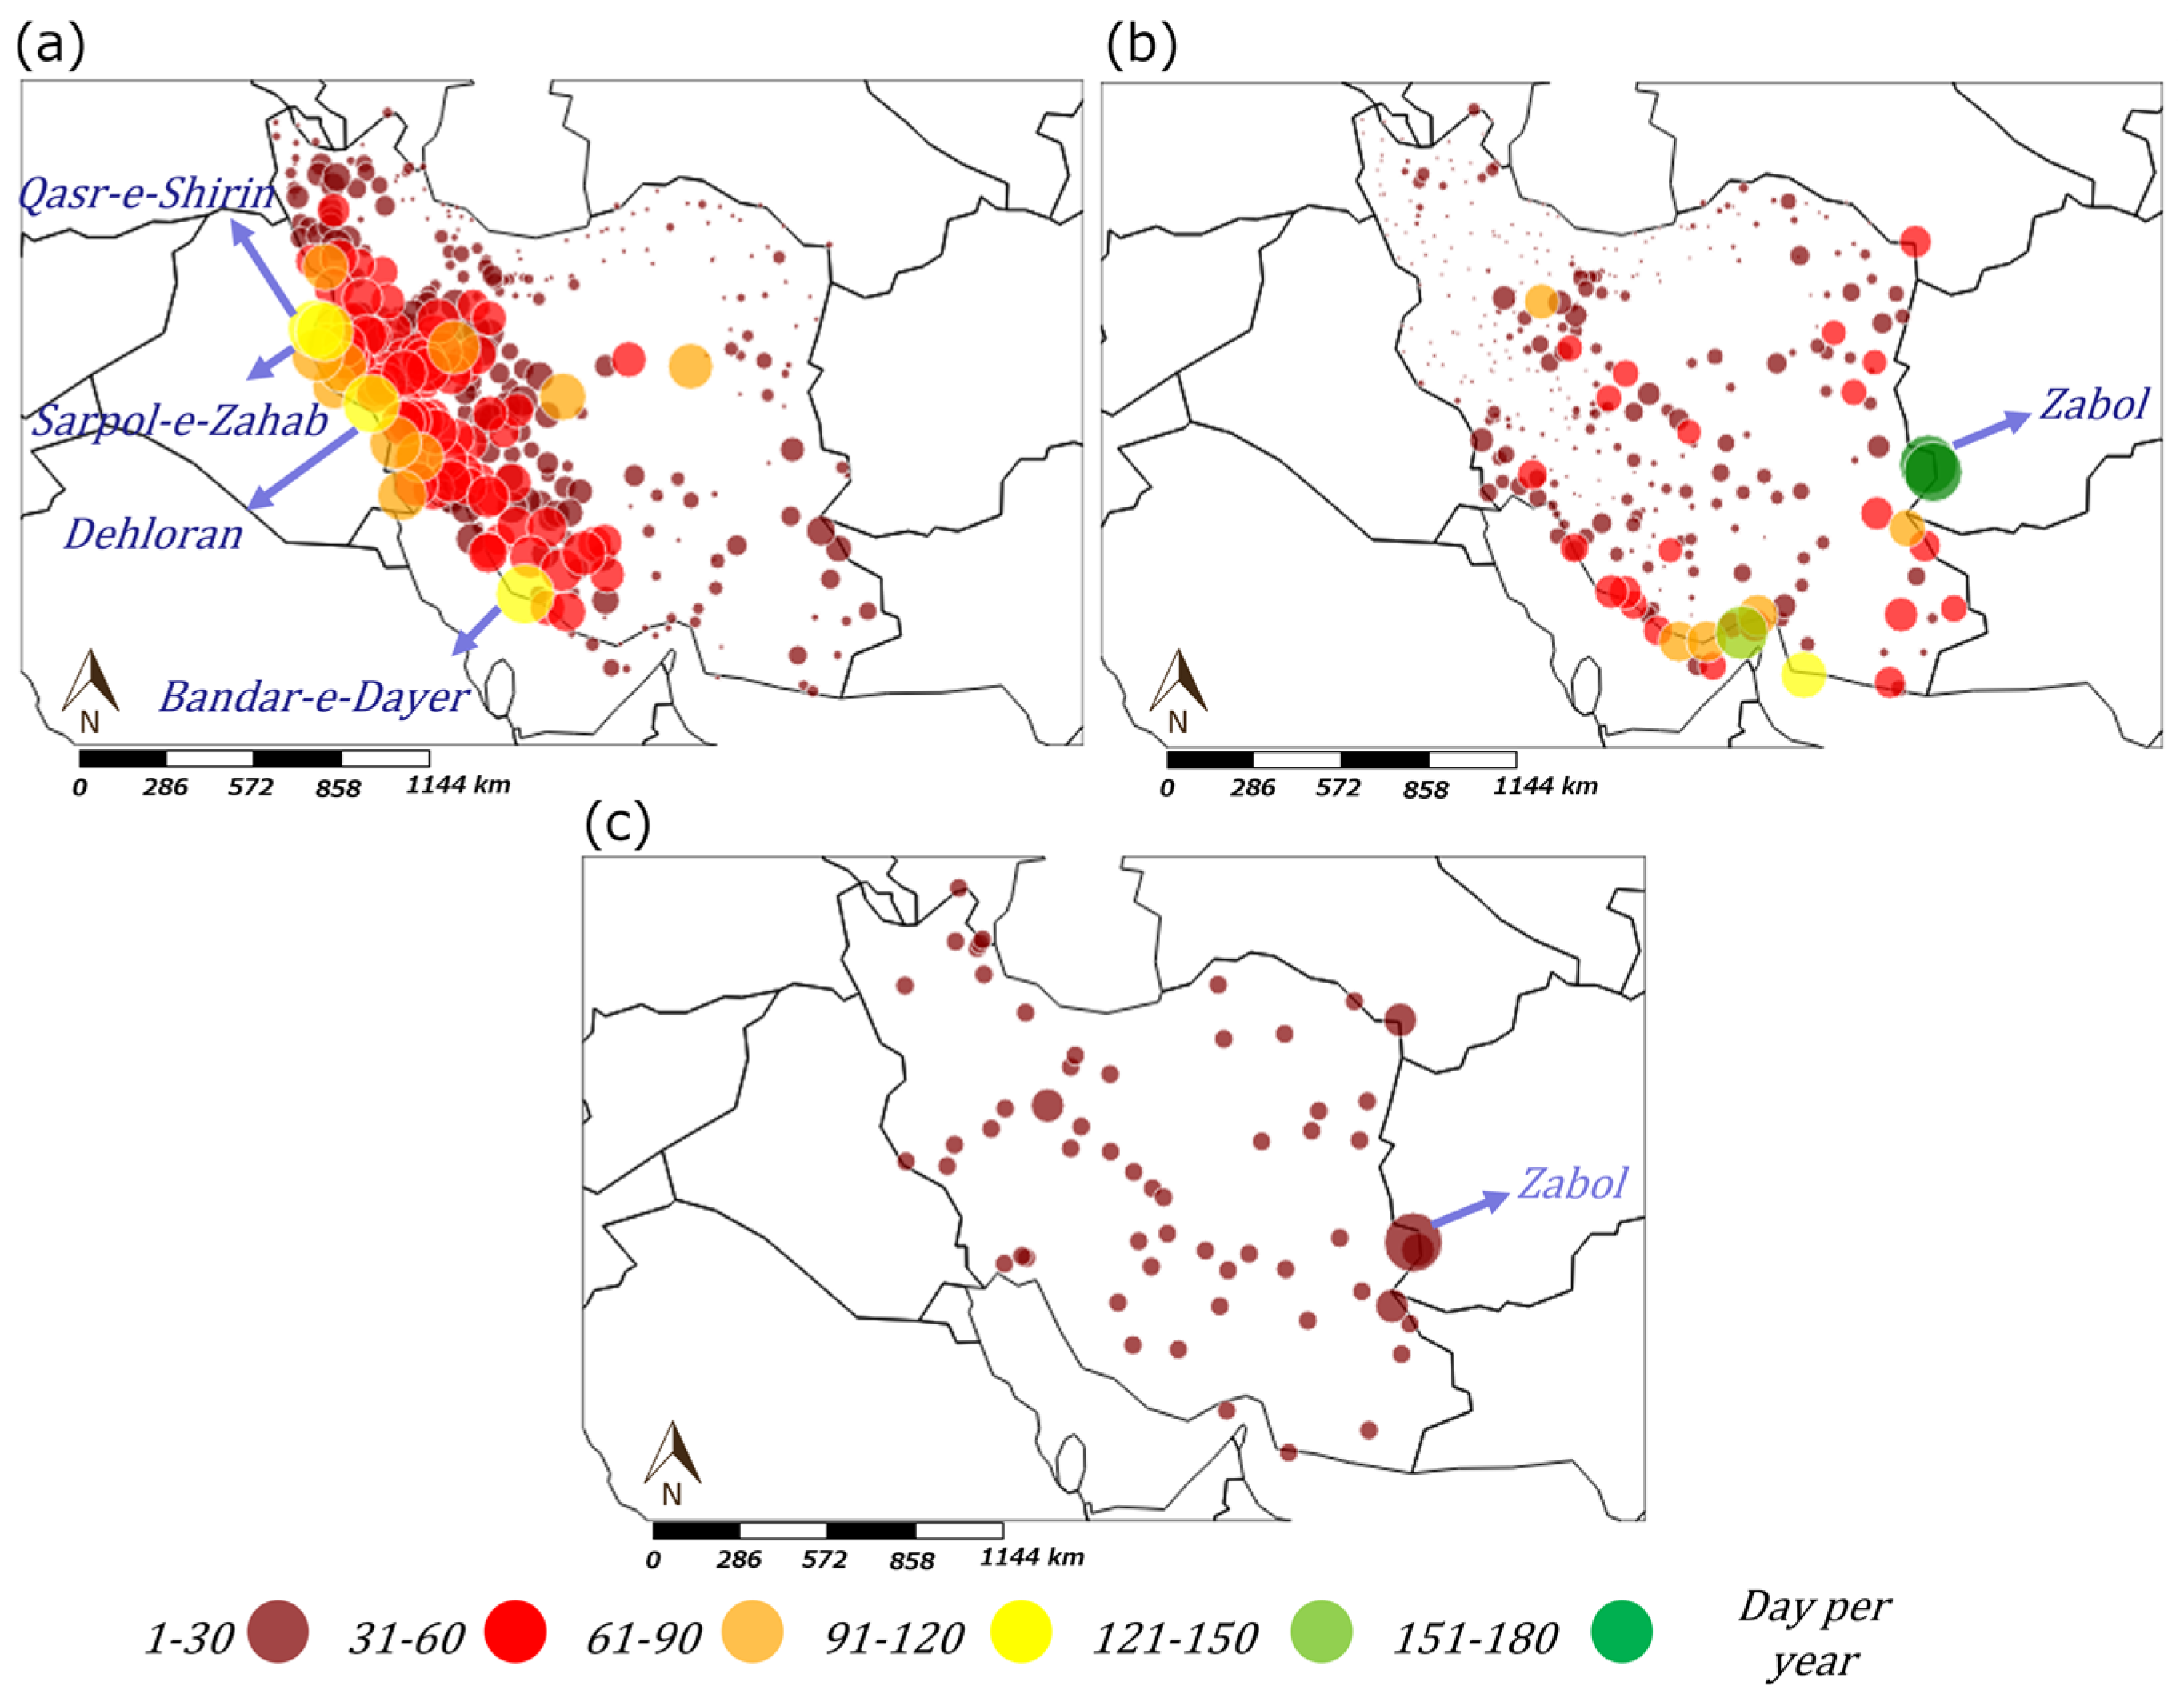
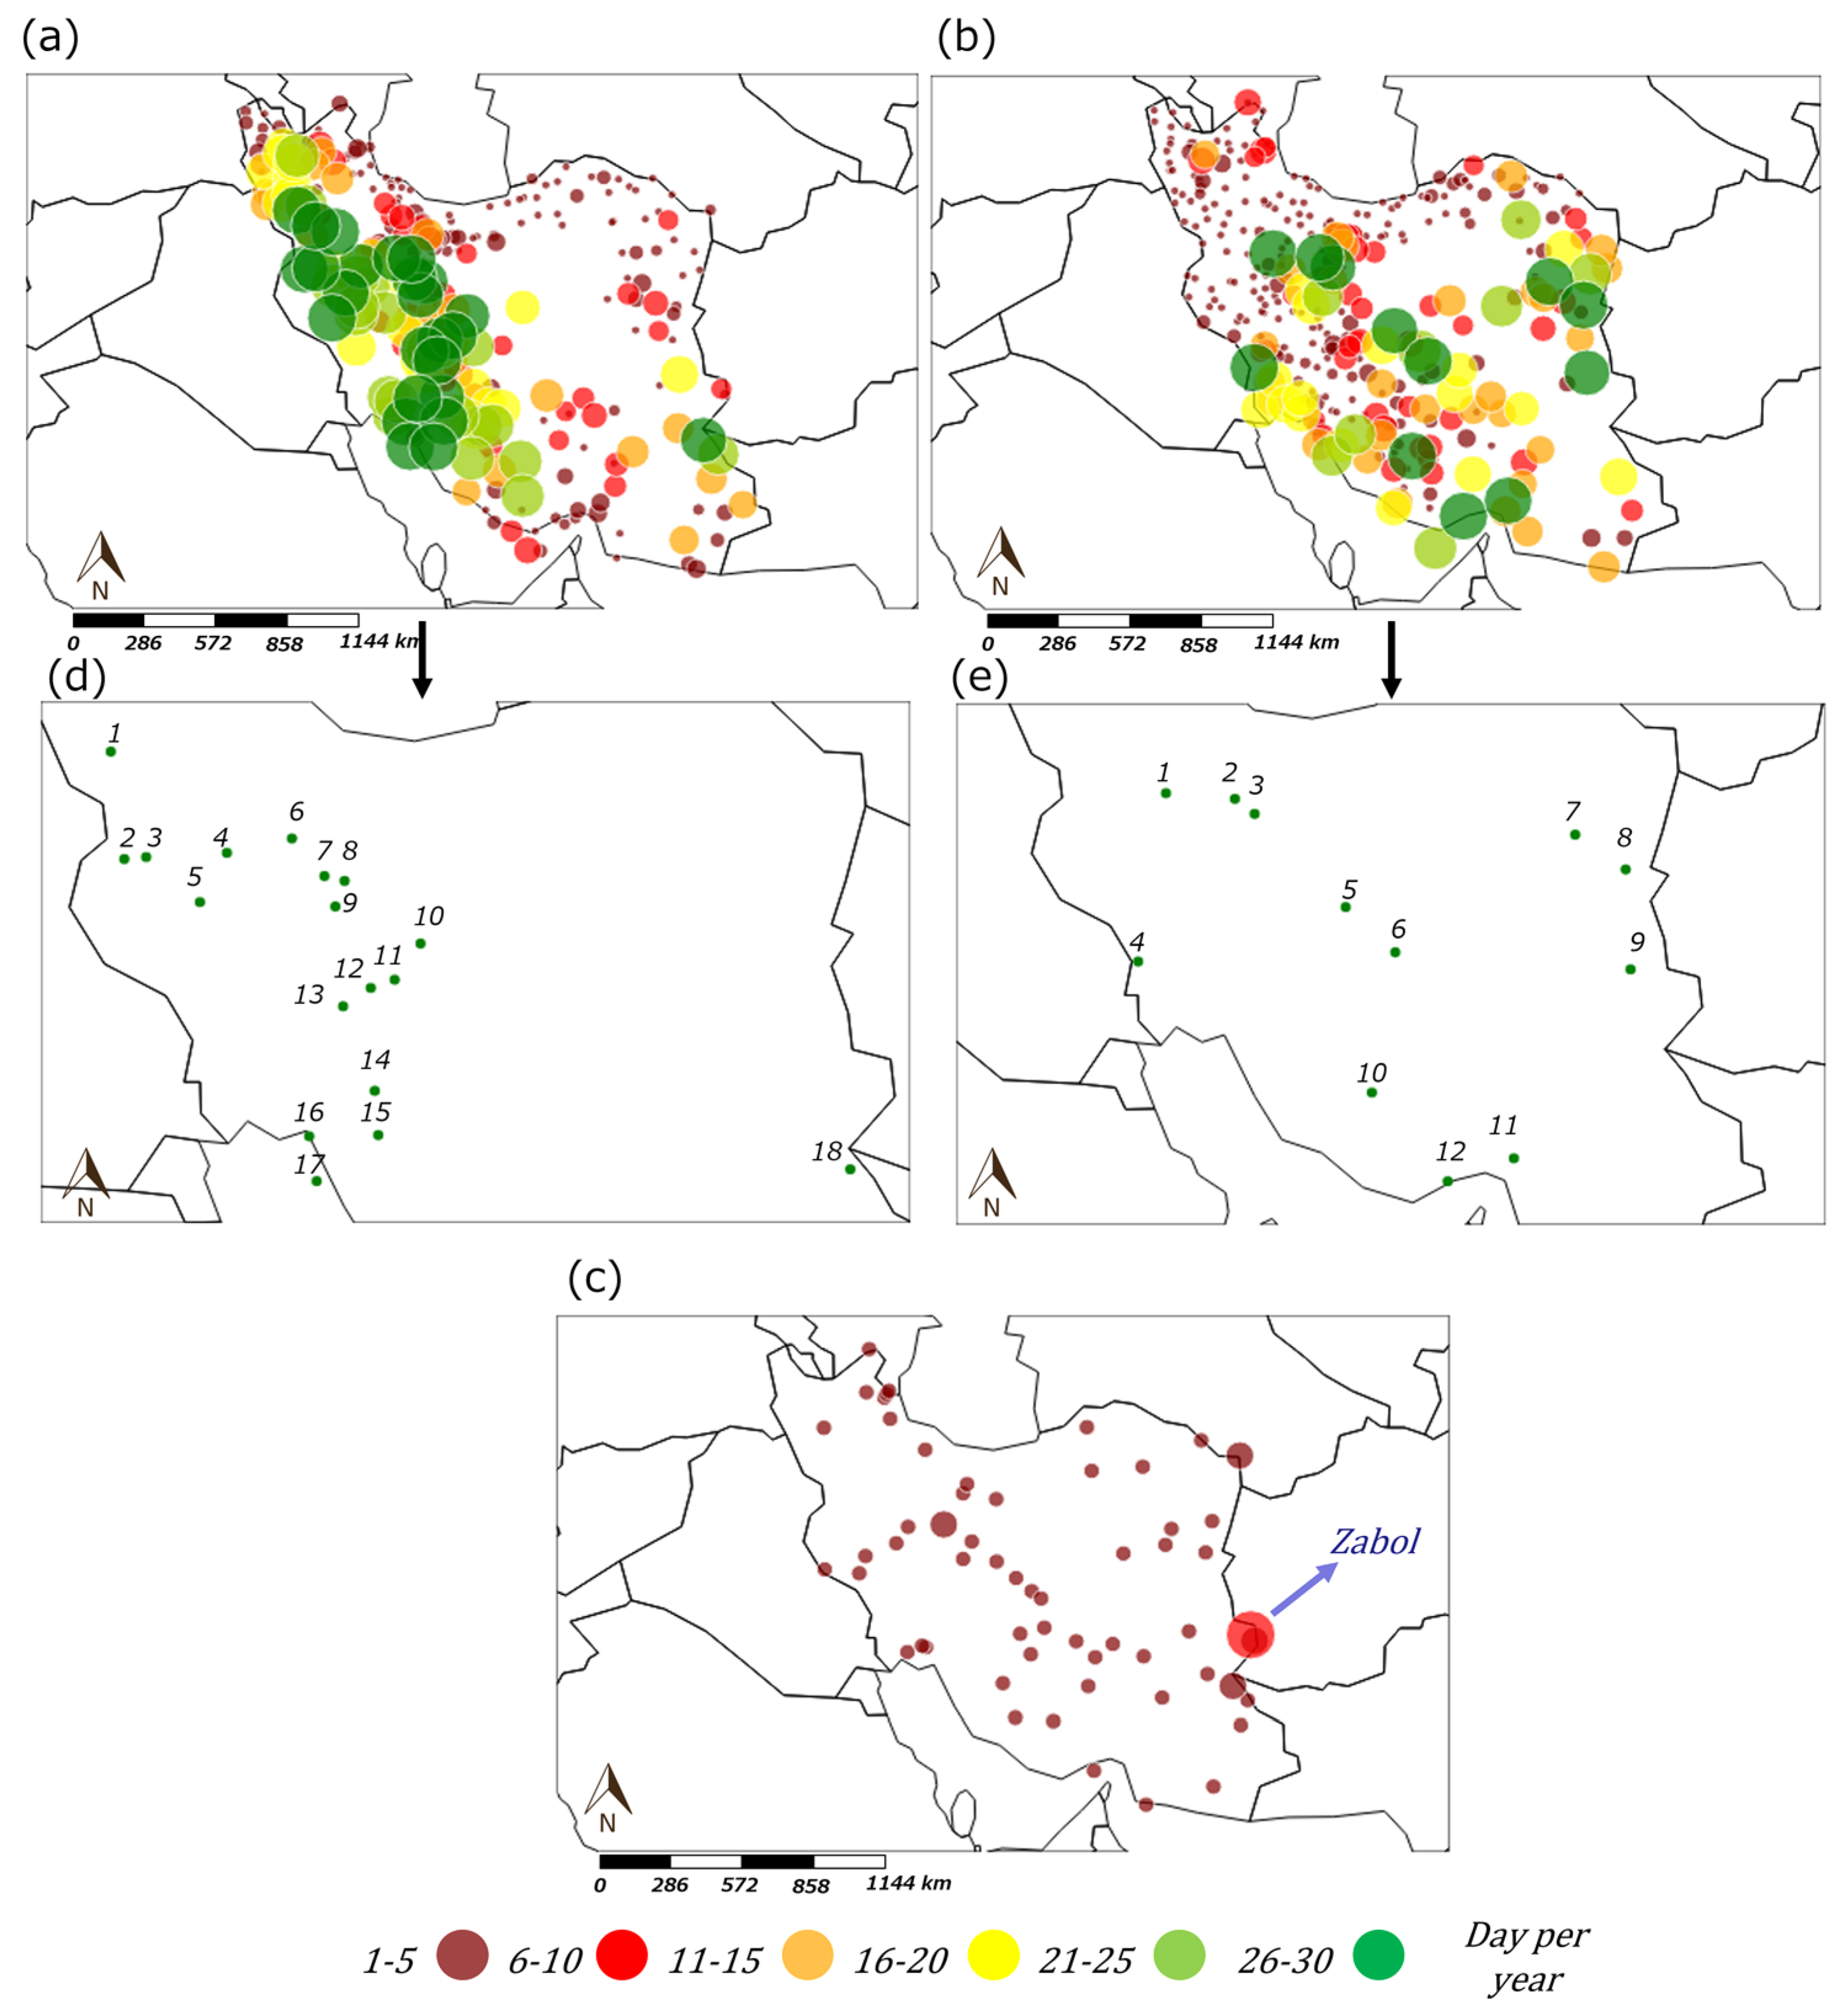
Figure 3 illustrates the spatial distribution of dust events across Iran, categorized into three types. The sizes and colors of the markers indicate the total days of the dust events per year. It is evident that there are eastern regions where the occurrence frequency of rising dust (Figure 3b) per year surpasses that of the other two categories, aligning with the outcome in Figure 2. In the case of suspended dust category (Figure 3a), it is apparent that suspended dust is more prevalent in the western regions of Iran, and the stations in that area experience such events with varying frequencies. Although a few stations experience suspended dust for nearly 100 days annually such as Qasreshirin, Dehloran, Sarpol-E-Zahab, and Bandar-E-Dayyer (Figure 3c, yellow markers), the majority experience it for not more than 60 days per year. Rising dust in (Figure 3b) is predominantly observed in the central, southern, and eastern parts of Iran, with the severity being more pronounced in the eastern region, specifically in the Zabol station. The occurrence frequency of rising dust is approximately 150 days per year in Zabol station (Figure 3c, green markers). Moreover, the occurrence frequency of dust storm does not exceed 10 days per year. While most stations report dust storms for no more than 4 days per year, these events are widespread across Iran and are not confined to specific regions except one station in the east which was mentioned previously.

3.3. Spatial Distribution of Standard Deviation of Occurrence Frequencies in Three Categories

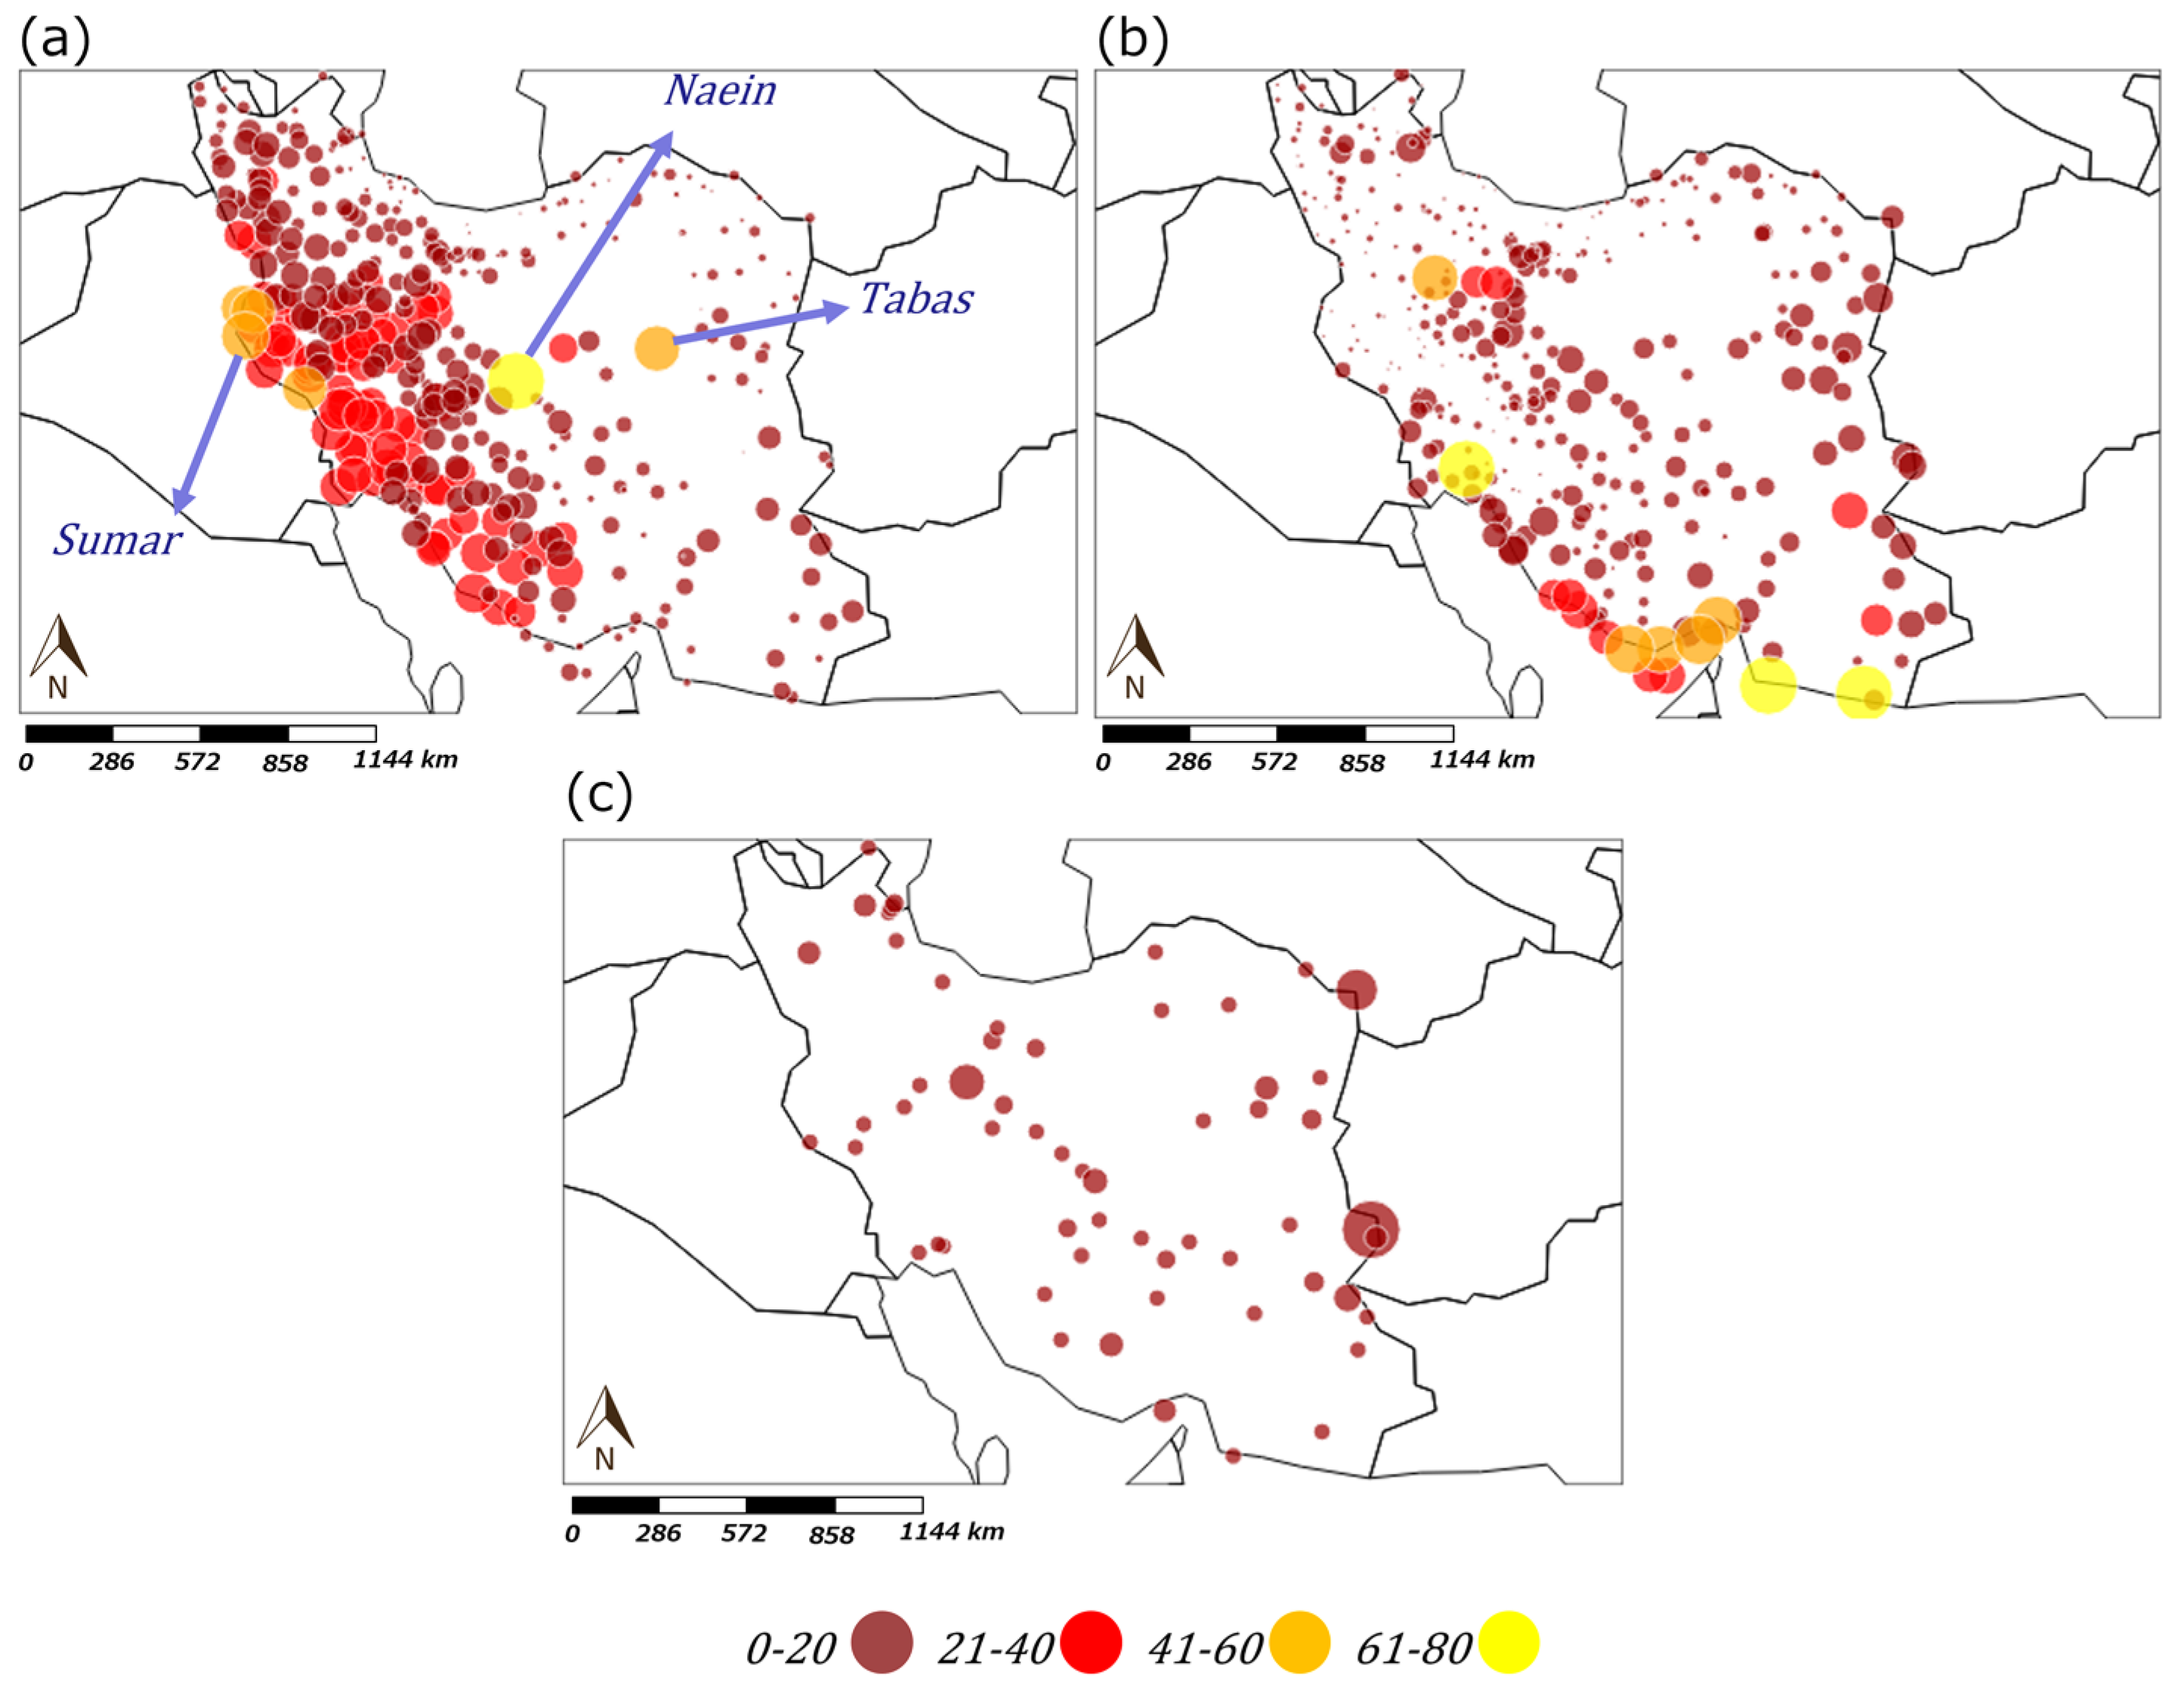
Figure 4 represents the spatial distribution of the standard deviation of the occurrence frequencies of suspended dust, rising dust, and dust storms over a period of 12 years. In all three categories, the standard deviation of most stations is less than 20 days per year over 300 stations, indicating that the annual averages of each dust event in Figure 3 represent the annual occurrence frequencies.
For the suspended dust category (Figure 4a), there are a significant number of stations that recorded the standard deviations between 0 and 40, while only a few stations exhibited higher standard deviation values, such as Sarpol-e Zahab, Sumar, Qasr-e Shirin, Naein, and Tabas, where the frequent dust events were observed. Since the occurrence frequencies of the suspended dust are large (Figure 3a), the variations are also large in some stations near the west regions of Iran. Regarding the rising dust and dust storm categories (Figure 4b,c), enhancing the representativeness of the annual average of the dust days in Figure 3.

3.4. Breakdown of Occurrence Frequency and Distributions of Dust Events in Less Than 30 Days

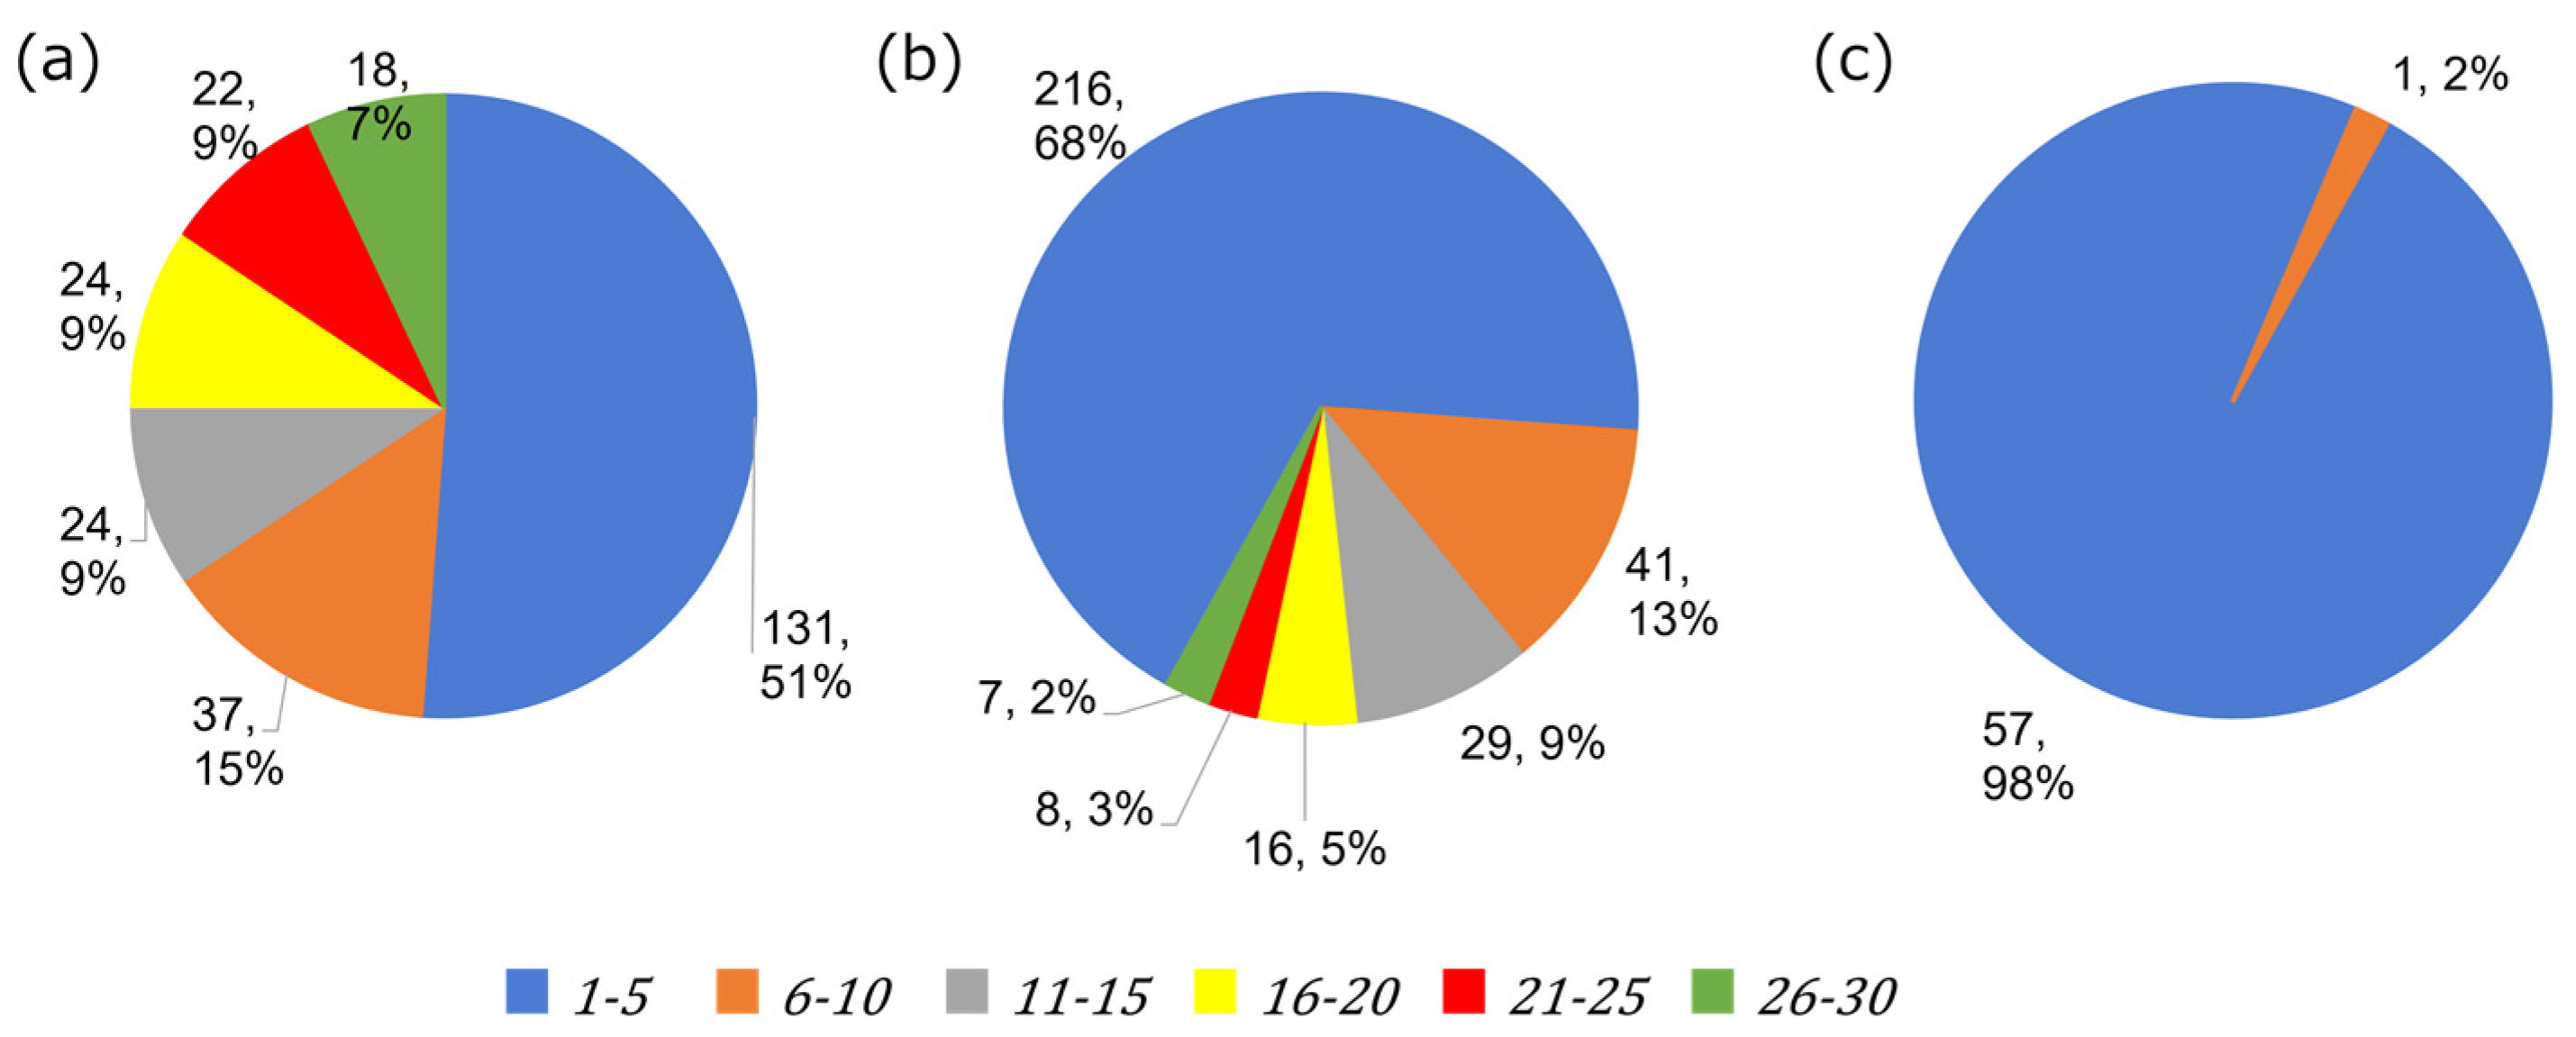
Figure 5 represents the occurrence frequency of dust events lasting less than 30 days per year in each category. As the frequency of dust events is less than 30 days per year in most stations based on the results from Figure 4, this categorization was necessary to provide a more accurate view. In all three categories, the highest frequency of occurrence of dust events is five days, indicating that most stations in all three categories experience dust events for only a few days per year.
In the suspended dust category (Figure 5a), out of all 427 stations, 344 stations experience suspended dust, and among them, 256 stations experience suspended dust for less than one month. Among these 256 stations, 51% experience suspended dust for almost five days, while 49% experience suspended dust for more than five days. Interestingly, 40 stations experience suspended dust for almost one month each year.
In the rising dust category (Figure 5b), 349 stations experience rising dust each year, and among them, 317 stations experience rising dust for less than one month. Furthermore, 68% of stations experience rising dust for less than five days each year, while 13% of 317 stations experience rising dust for 10 days, and 9% of stations experience rising dust for 15 days. Only 16 stations out of 317 experience rising dust for one month.
In the dust storm category (Figure 5c), 58 stations experience this phenomenon each year, and among them, 98% of stations experience dust storms for less than five days each year. In other words, the frequency of dust storm occurrence is less than five days each year in most stations that experience dust storms, and it is only in a few stations that it exceeds five days. Thus, this figure provides an accurate view of dust events, indicating that the frequency of occurrence of dust events is less than five days in all categories. Only the suspended dust period is longer than the other two categories.
Accordingly, the spatial breakdowns of the occurrence frequency are discussed. Figure 6 illustrates the spatial distribution of the number of dusty days with less than 30 occurrences per year across Iran. The three categories of dusty days are uniformly distributed across the country, but their frequency varies. Suspended dust (Figure 6a) is found in all stations, but its highest frequency is observed in the western part of Iran, where the duration of suspended dust is also longer. Stations that expected to experience suspended dust for almost 30 days are 1. Bukan, 2. Javanrud, 3. Kamyaran, 4. Hamedan, 5. Nurabad, 6. Gharaqabad, 7. Salafchegan, 8. Kahak, 9. Delijan, 10. Ardestan, 11. Esfahan, 12. Najafabad, 13. Shahrekord, 14. Sisakht, 15. Nurabad, 16. Bandar-e-Deylam, 17. Khark Island, and 18. Zahedan, respectively (Figure 6a, dark green markers).
Rising dust (Figure 6b), on the other hand, is visible in most stations, but its duration is shorter compared to suspended dust, with an occurrence frequency of less than 10 days. Stations that are expected to have rising dust for almost 30 days per year are 1. Hamedan, 2. Saveh, 3. Qom, 4. Bostan, 5. Naein, 6. Yazd, 7. Gonabad, 8. Hajiabad, 9. Nehbandan, 10. Fasa, 11. Rudan, and 12. Bandar-e-khamir, respectively (Figure 6b, dark green markers).
Dust storms (Figure 6c), characterized by a frequency of occurrence of no more than 10 days per year, are observed across the country. As mentioned previously, the only station that experiences dust storms more than other stations is Zabol station, which is expected to have dust storms around 10 days per year.

4. Seasonal Variations

4.1. Seasonal Spatial Distribution of Suspended Dust

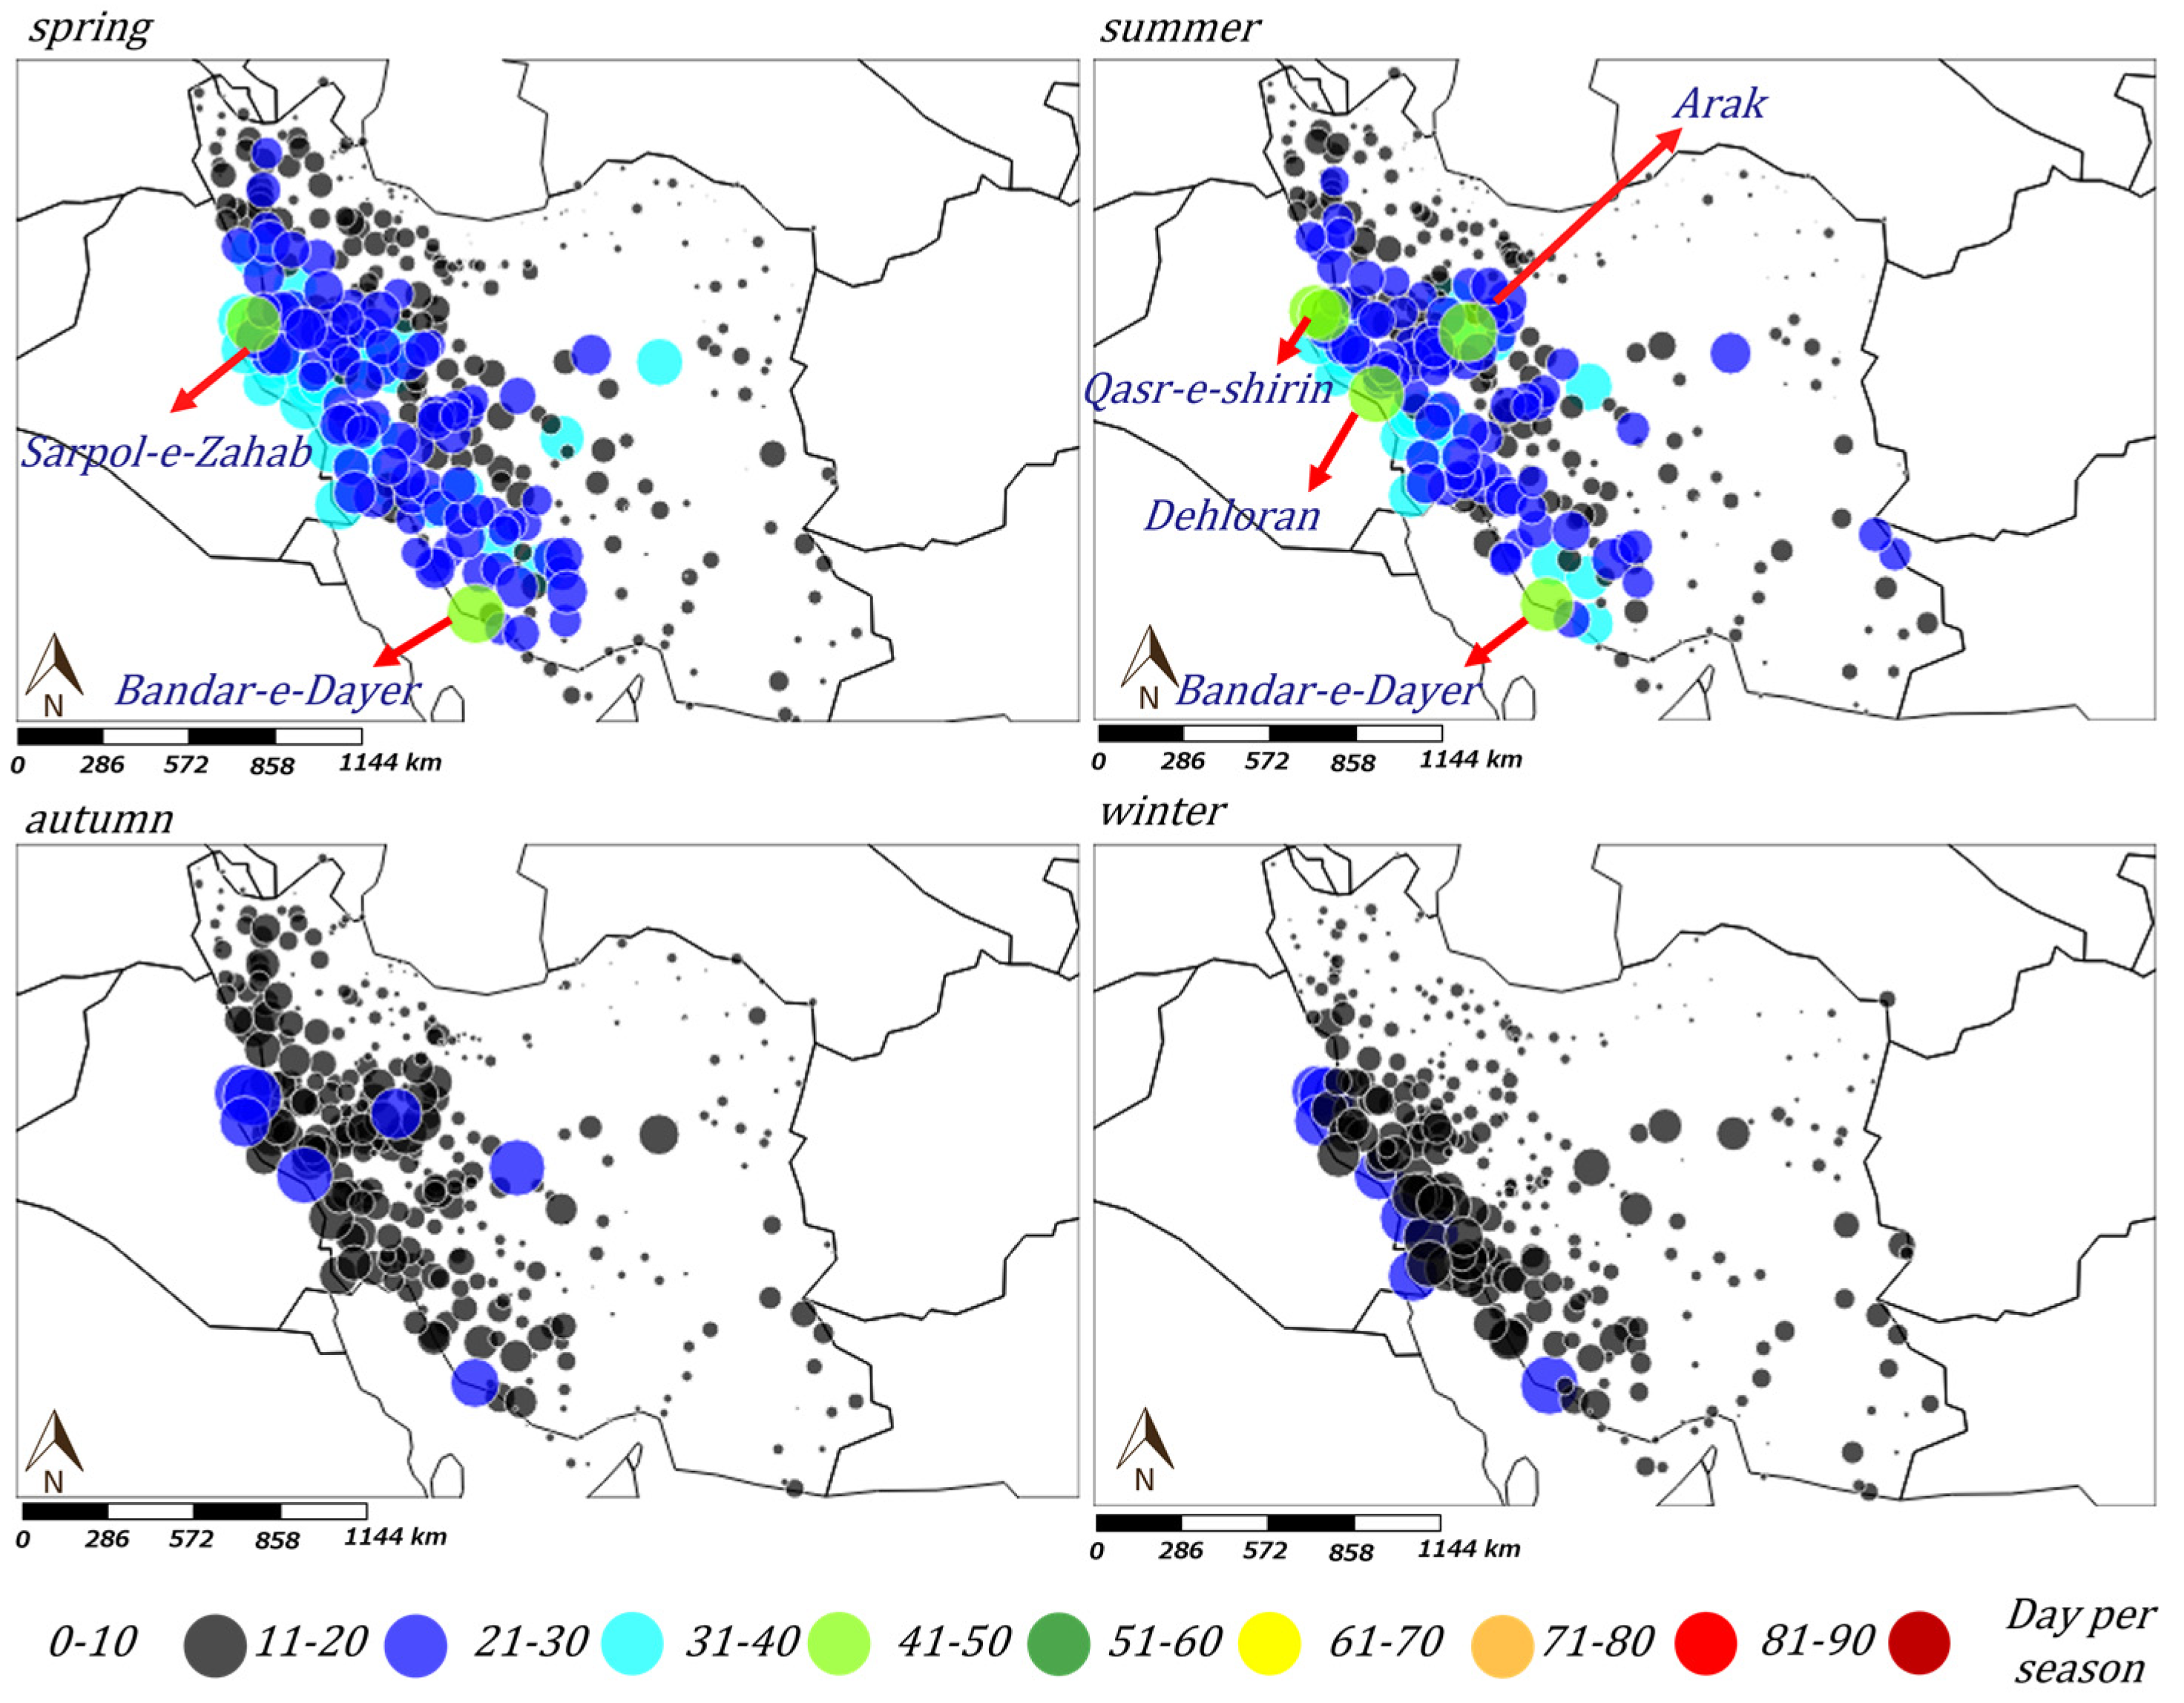
Figure 7 shows the seasonal distribution and the occurrence frequency of suspended dust. The four seasons in Iran are defined as follows: spring from March to May, summer from June to August, autumn from September to November, and winter from December to February. As is evident, the phenomenon of suspended dust is widespread across all areas, with a higher distribution in the western region of Iran. The occurrence frequency of suspended dust varies in each season. In autumn and winter, the frequency of occurrence of suspended dust is approximately 15 days in most stations, with some stations experiencing over 20 days per season. However, the occurrence frequency of suspended dust is higher in spring and summer (Figure 7 (spring, summer)) than in autumn and winter (Figure 7 (autumn, winter)). In spring, both the frequency of occurrence and the number of stations experiencing suspended dust are higher than in other seasons. Two stations that have higher frequency of occurrence than other stations are Sarpol-e-zahab and Bandar-e-dayer. The occurrence frequency of suspended dust in most stations is around 10 to 40 days per season per year. In summer, although the number of stations experiencing suspended dust is not as high as in spring, the frequency of suspended dust is as high as in spring, and stations such as Arak, qasr-e-shirin, Dehloran, bandar-e-dayer are expected to experience rising dust for more than 30 days and less than 40 days.

4.2. Seasonal Spatial Distribution of Rising Dust

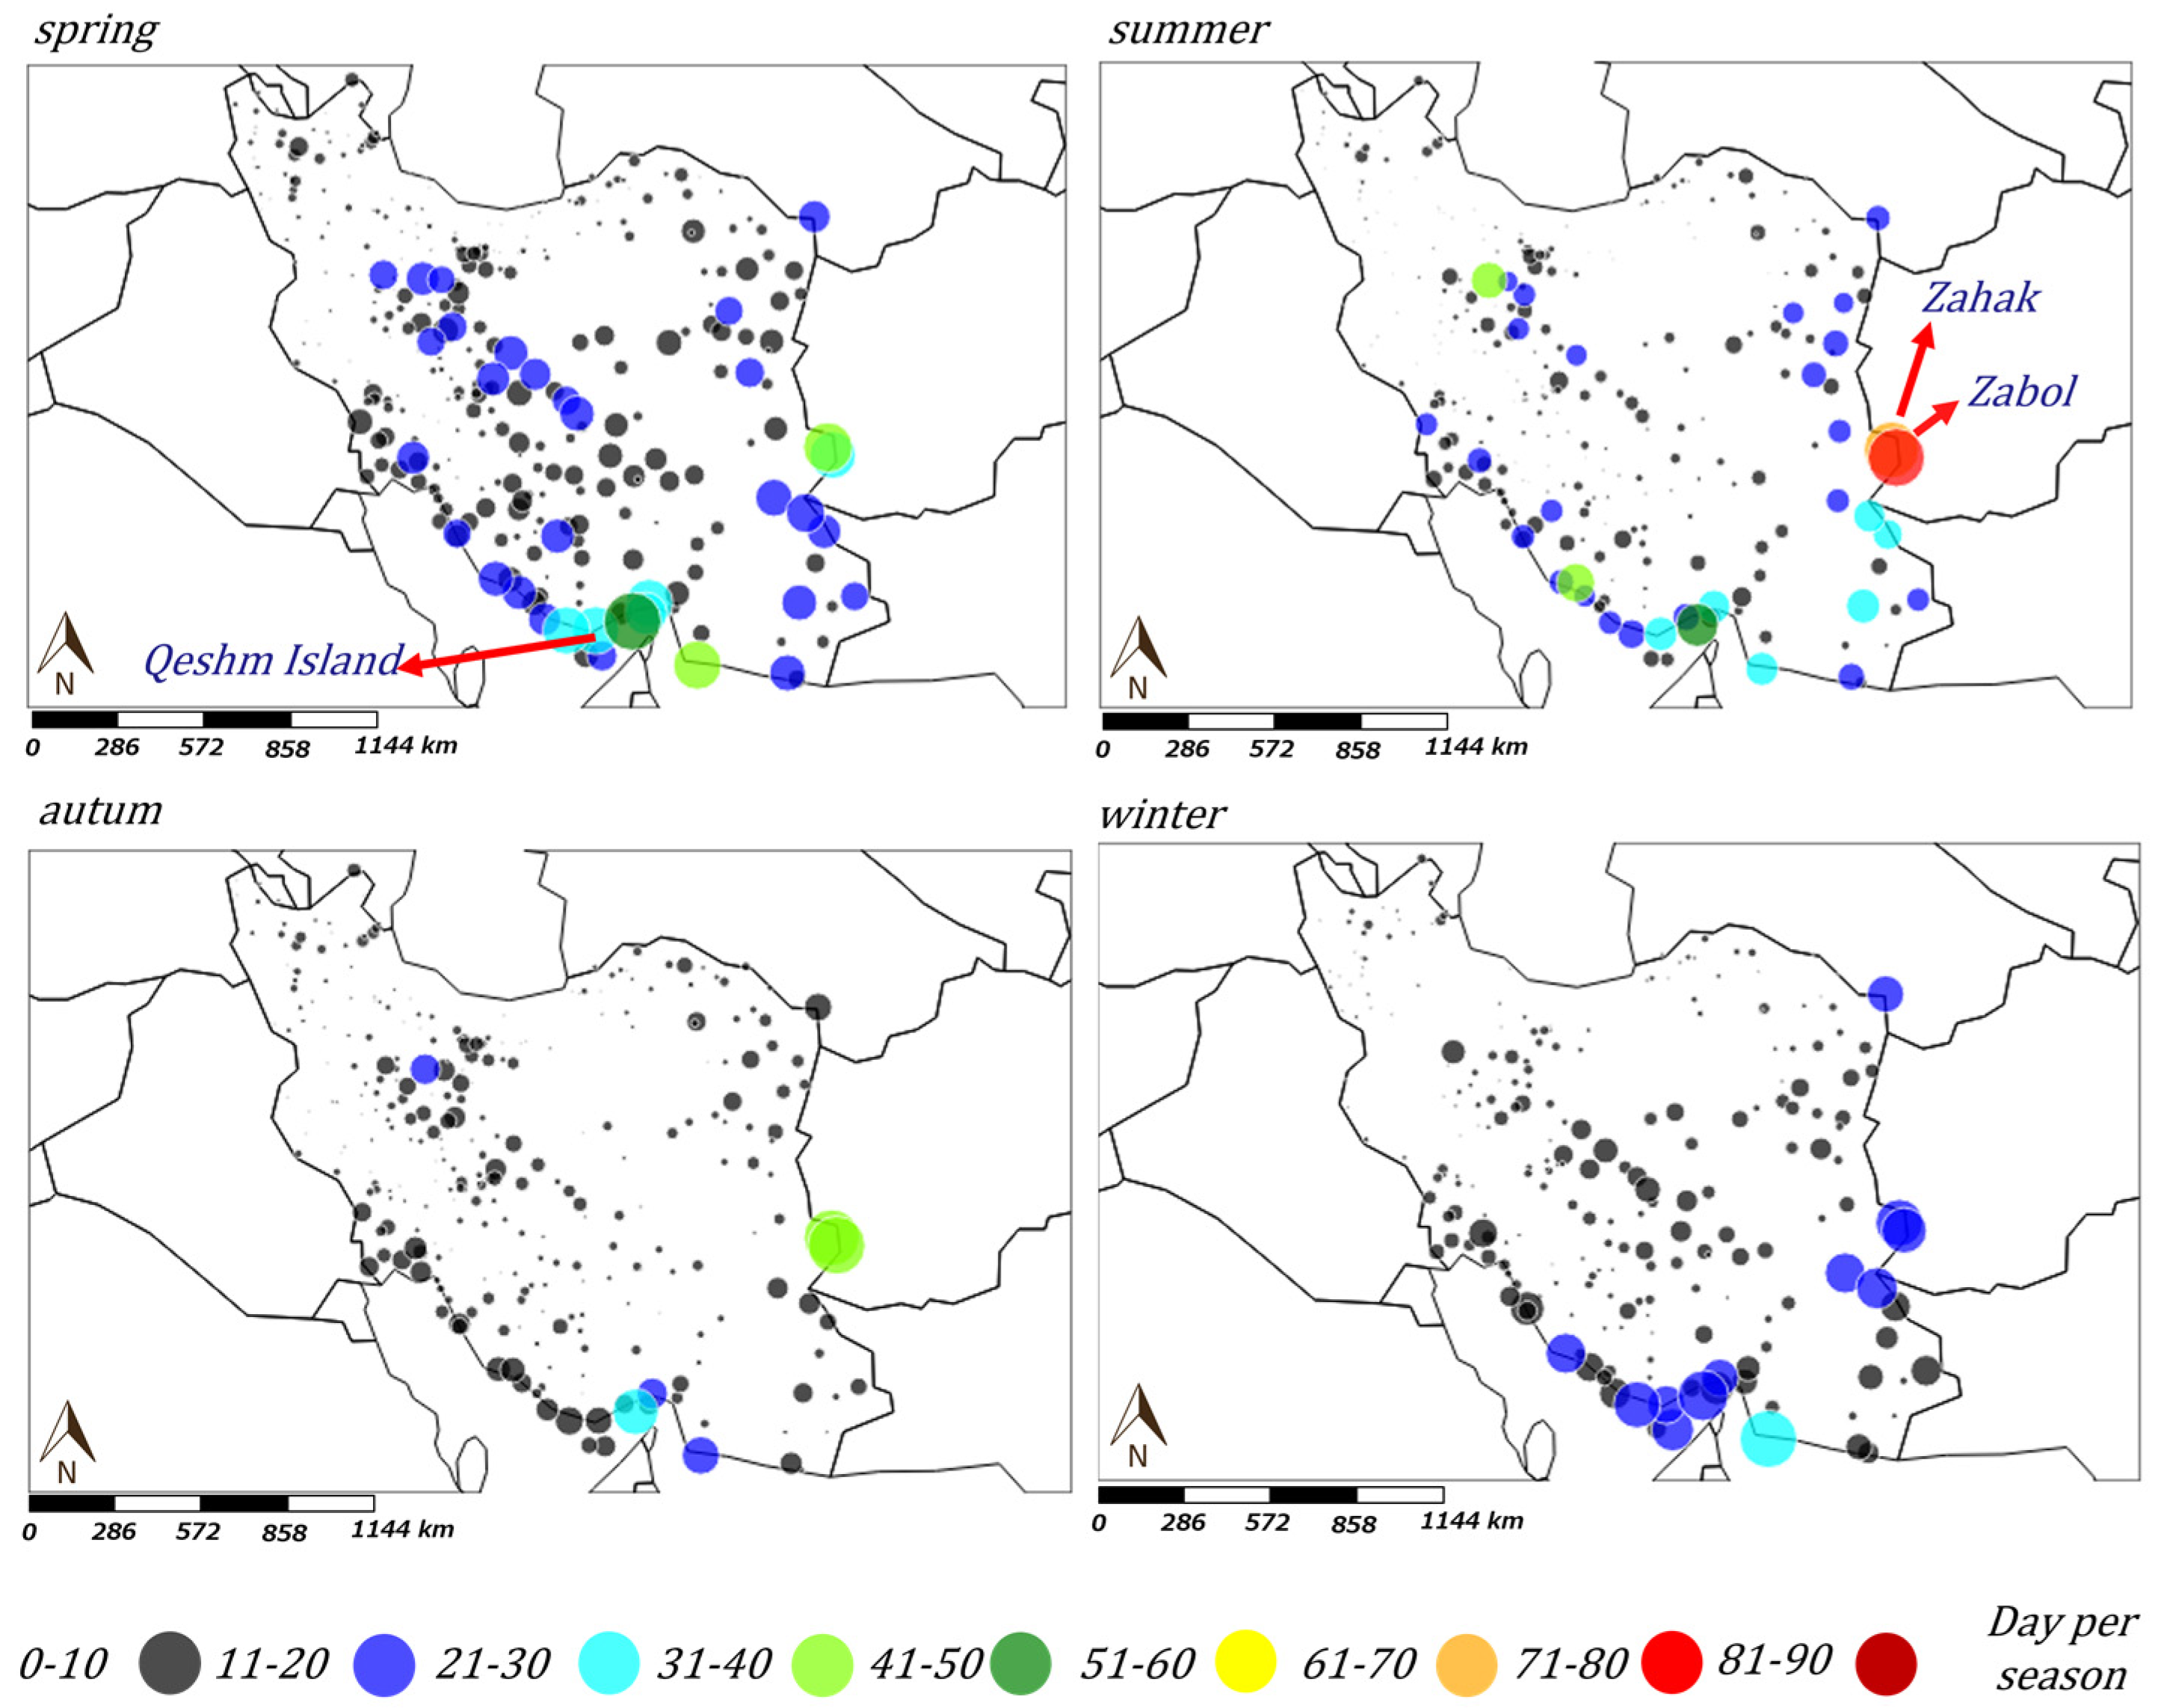
Figure 8 represents the seasonal distribution and occurrence frequency of rising dust. The average number of stations that experience rising dust is lower than the number of stations that experience suspended dust. The distribution of rising dust phenomenon is widespread, yet it is more visible in the central, south, and east parts of Iran. The highest frequency of occurrence of rising dust is in spring, followed by autumn and summer, respectively, while the lowest belongs to winter.
The occurrence frequency of rising dust is high in spring (Figure 8 (spring)), and the number of stations that experience rising dust is higher than in other seasons. However, the number of days that stations experience rising dust does not exceed 10 days in most stations. The only station that experiences high frequency of rising dust in spring is Qeshm Island (Figure 8 (spring), dark green markers). The high frequency of occurrence of rising dust is visible in the central, south, and eastern regions.
In the summer season (Figure 8 (summer)), the number of stations that experience rising dust is not as high as in the spring season. However, in several stations, the total day of rising dust is quite large such as Zahak and Zabol stations (Figure 8 (summer), red, orange markers), nearly 90 days per season, indicating that these are rising dust events every day in such stations.
In general, the total days of rising dust in the summer season are high in the east, south, and central parts of Iran.
After the spring season, the number of stations that experience rising dust is high in autumn (Figure 8 (autumn)). The frequency of occurrence of rising dust in most of them does not exceed 10 days each year, and the recurrence of rising dust is not high in autumn.
In the winter season (Figure 8 (winter)), the number of stations that experience rising dust is lower than in other seasons. The frequency of occurrence of rising dust in most stations does not exceed 10 days per season. As can be seen, the frequency of rising dust is high in the south and adjacent to the shoreline and the east part of Iran. Rising dust is also frequent in the central region but with lower recurrence.

4.3. Seasonal Spatial Distribution of Dust Storm

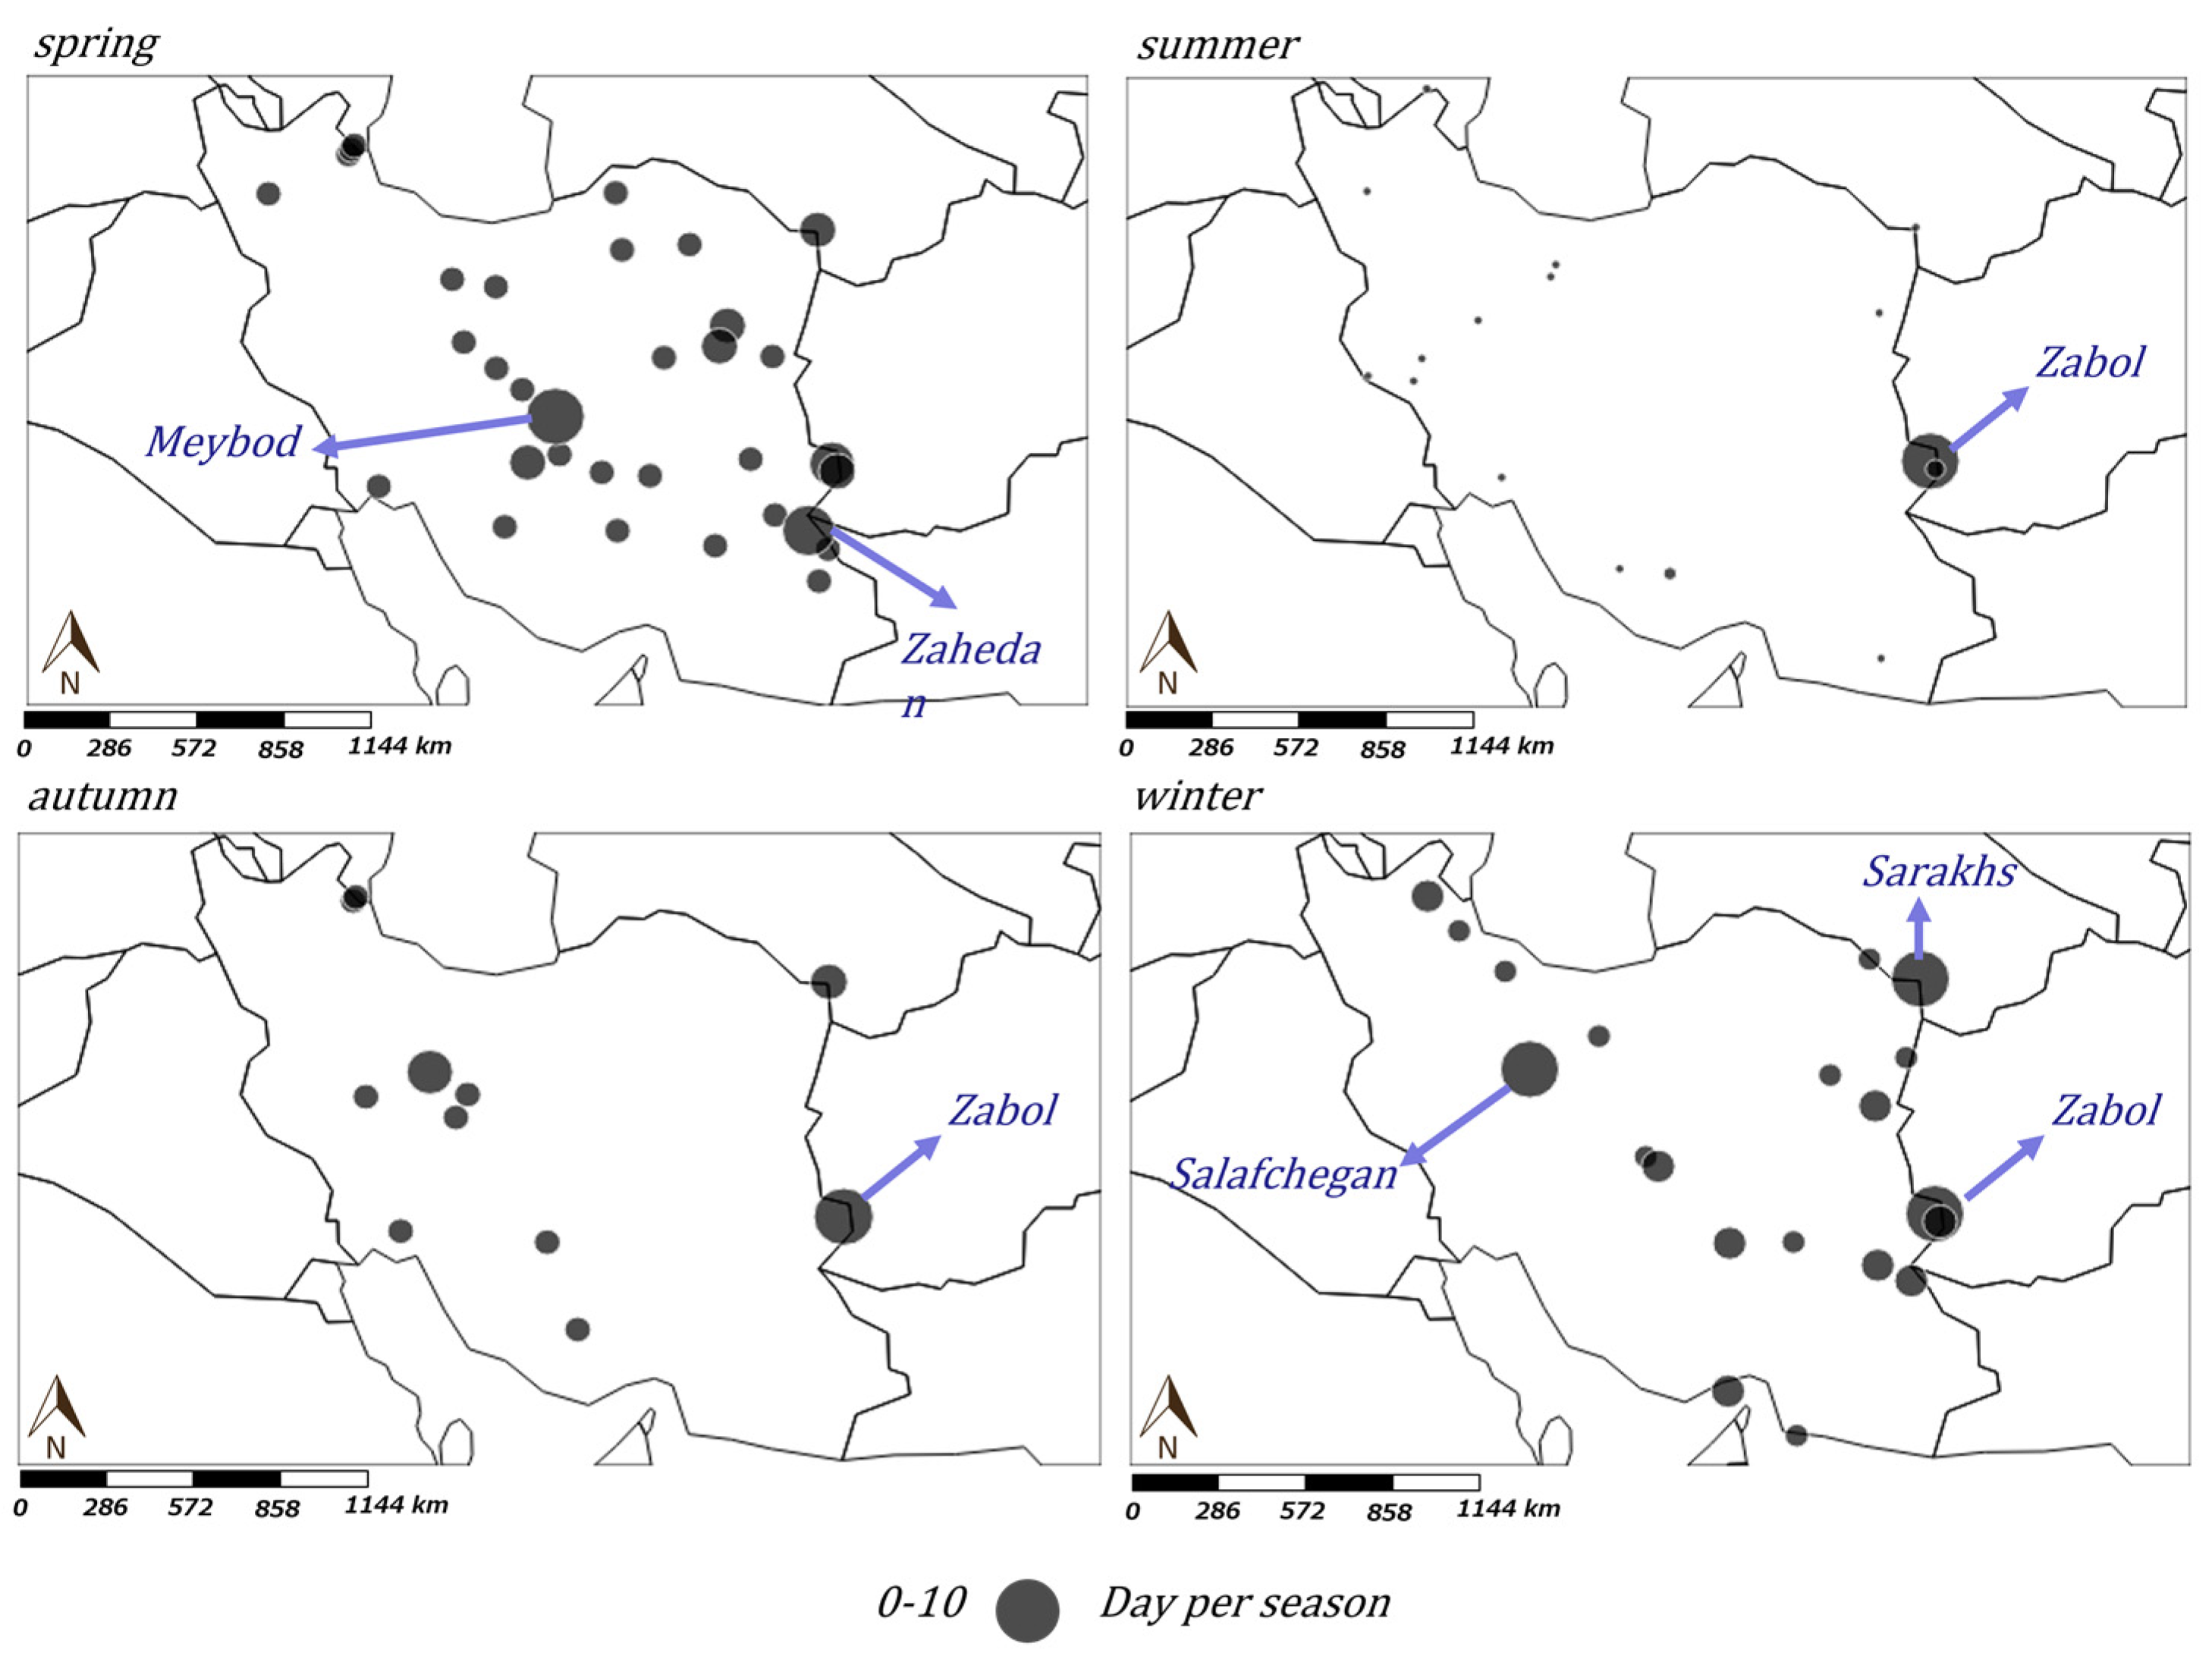
Figure 9 illustrates the seasonal distribution and frequency of occurrence of dust storms in Iran. The data reveal that the frequency of dust storms does not exceed 10 days in all seasons. Among all the seasons, spring (Figure 9 (spring)) has the highest frequency of dust storms, and many stations in central, east, northeast, and northwest parts of Iran experience dust storms during this season. Interestingly, the severe storms categorized as dust storm are uniformly distributed in entire country, and the seasonal trends are less apparent than other categories.
In summer (Figure 9 (summer)), the frequency of dust storms is low, except in the eastern part of Iran. In this season, dust storms are more prevalent in the south and east of Iran, obviously in Zabol station, but with lower frequency.
Autumn (Figure 9 (autumn)) has the lowest frequency of occurrence of dust storms compared to the other seasons, and the number of stations that experience dust storms is numerable, except for some stations where dust storms occur regularly.
After spring, winter (Figure 9 (winter)) has the highest frequency of dust storms. Except for the west part of Iran, dust storms are distributed in various parts of Iran, including the islands in the Persian Gulf. However, the number of stations that experience dust storms is few and countable in all four seasons.

5. Long-Term Variation of the Dust Events

5.1. Monthly Dusty Days in 12 Years

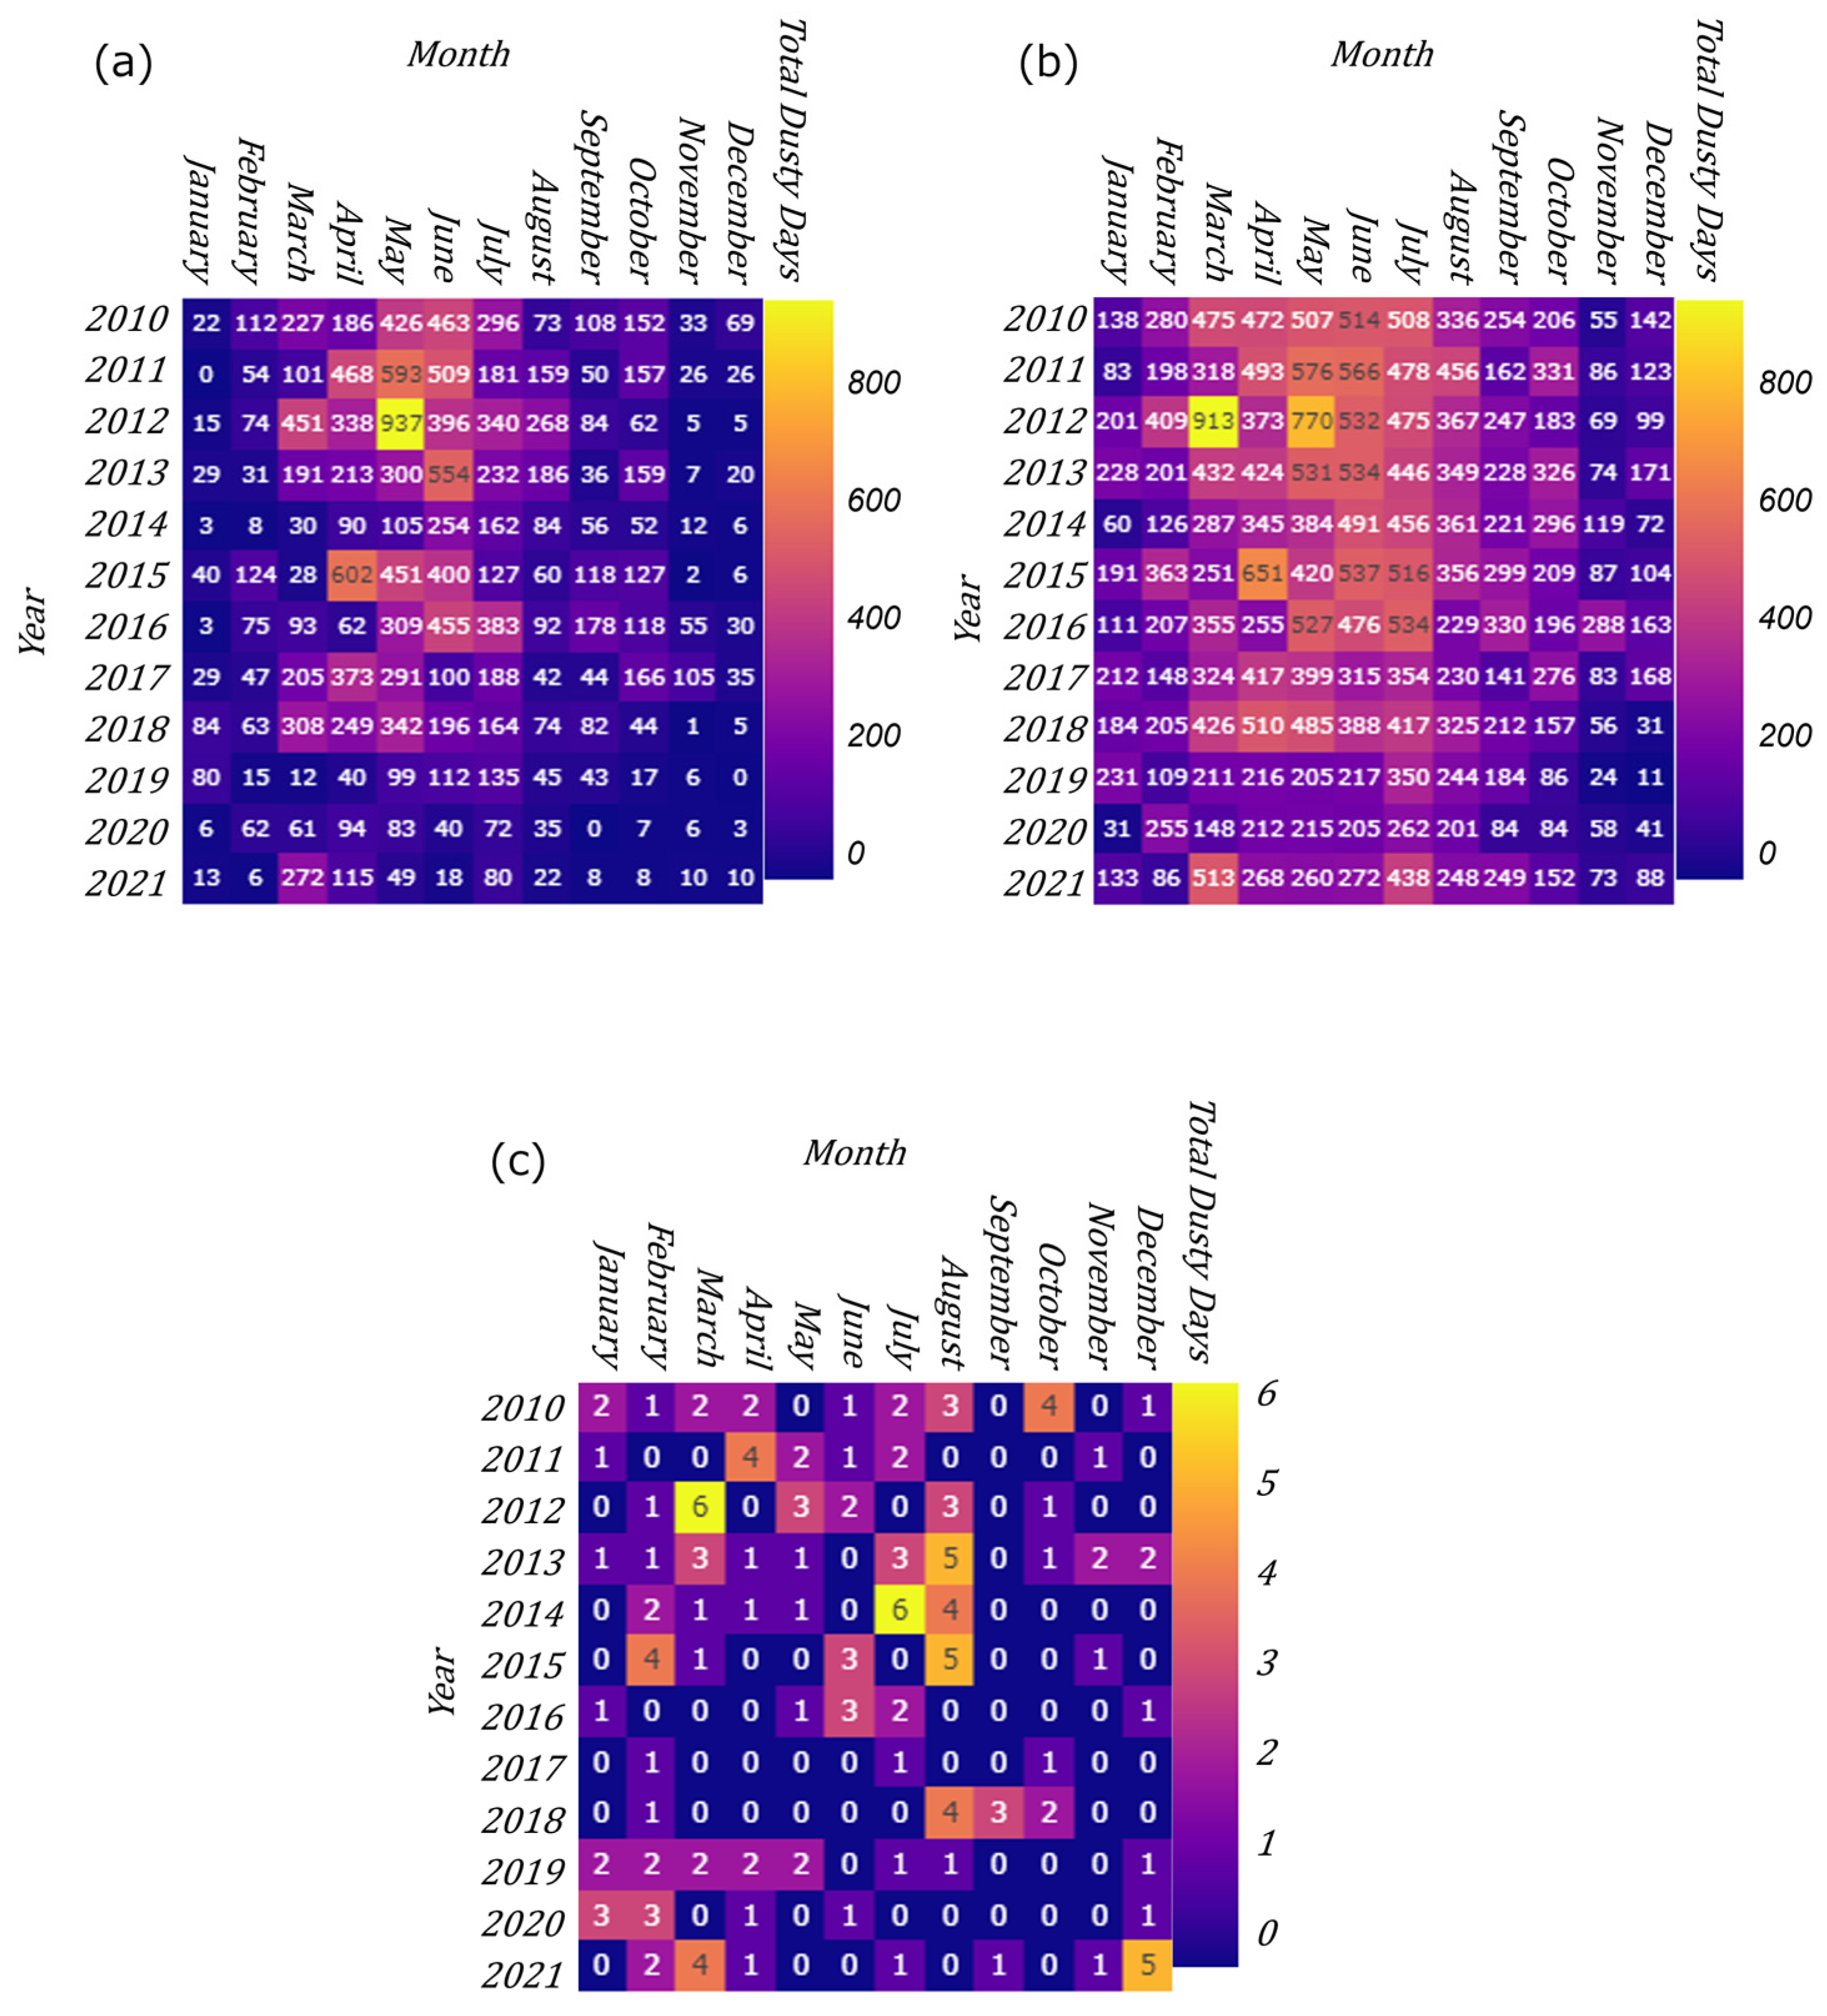
In addition to the statistical analyses to understand general annual and seasonal trends of the dust events, long-term monthly variation of the dust events is worth investigating to understand the representativeness of the statistical averages. Figure 10 illustrates a general overview of the total number of dust events occurred in each month for each year. Rising dust (Figure 10b) has the highest record per month and per year, indicating that it is the most frequently occurring type among the three categories of the dust events. Suspended dust (Figure 10a) is the next most frequently occurring type of the dust events, followed by dust storms (Figure 10c). With regards to monthly frequency, dust events reach their peak frequency in summer, beginning from late spring and decreasing after July as a general trend. The lowest frequency of dust events occurs in winter, particularly in January and December, for both suspended and rising dust categories. Although these general trends can be confirmed for the suspended and rising dust events, as can be seen in previous sections, there is also clear annual variation of less frequent days between 2019 and 2021. In contrast, dust storms do not show any obvious monthly trend because of less frequencies than the other two categories. In the annual analysis, the highest record of dust events occurred in 2012 during the spring season for all three categories.
Regarding suspended dust (Figure 10b), as previously mentioned, the number of occurrences in the spring is higher than in other seasons, but it increases substantially during this season. A slight but considerable high frequency of suspended dust can also be observed in October. From an annual perspective, suspended dust had a high frequency in particular years, such as 2011, 2012, and 2015, but its frequency has decreased significantly after 2018.
Rising dust (Figure 10b) has almost the same pattern as suspended dust but with a higher frequency. The highest frequency of rising dust occurs in the spring and early summer. From an annual perspective, 2012 and 2015 had the highest record of rising dust. However, there is no particular trend in the annual analysis.
Regarding dust storms (Figure 10c), it is evident that they have a very low frequency compared to other categories, and they do not exhibit any obvious trends annually or monthly. The monthly analysis shows that dust storms have a high frequency in the summer compared to other seasons. From an annual perspective, the highest number of dust storms was recorded in 2012 and 2014 during the spring and summer seasons, respectively. Overall, dust storms do not show any particular trend, unlike the other two categories.

5.2. Annual and Monthly Frequency of Dust Events for Three Classes

Figure 11 and Figure 12 illustrate the overall number of dust events that have been recorded across all three categories in all stations. Upon annual analysis, it is evident that the highest number of dusty days and dust events recorded across all stations belong to the rising dust category, with the maximum being observed in 2012 and the minimum in 2020. Following rising dust, suspended dust has the second-highest number of dust events, with a similar trend observed each year, as is the case with rising dust. Although the maximum and minimum number of dust events for this category also occurred in the same years as rising dust, there was a considerable difference in the total number of recorded dust events. The annual analysis of dust storms revealed that the maximum number of recorded dust storms did not exceed 20 events, which occurred in 2013, while the minimum was observed in 2017. In general, it can be concluded that no clear trend can be observed for any of the three dust categories upon annual analysis.
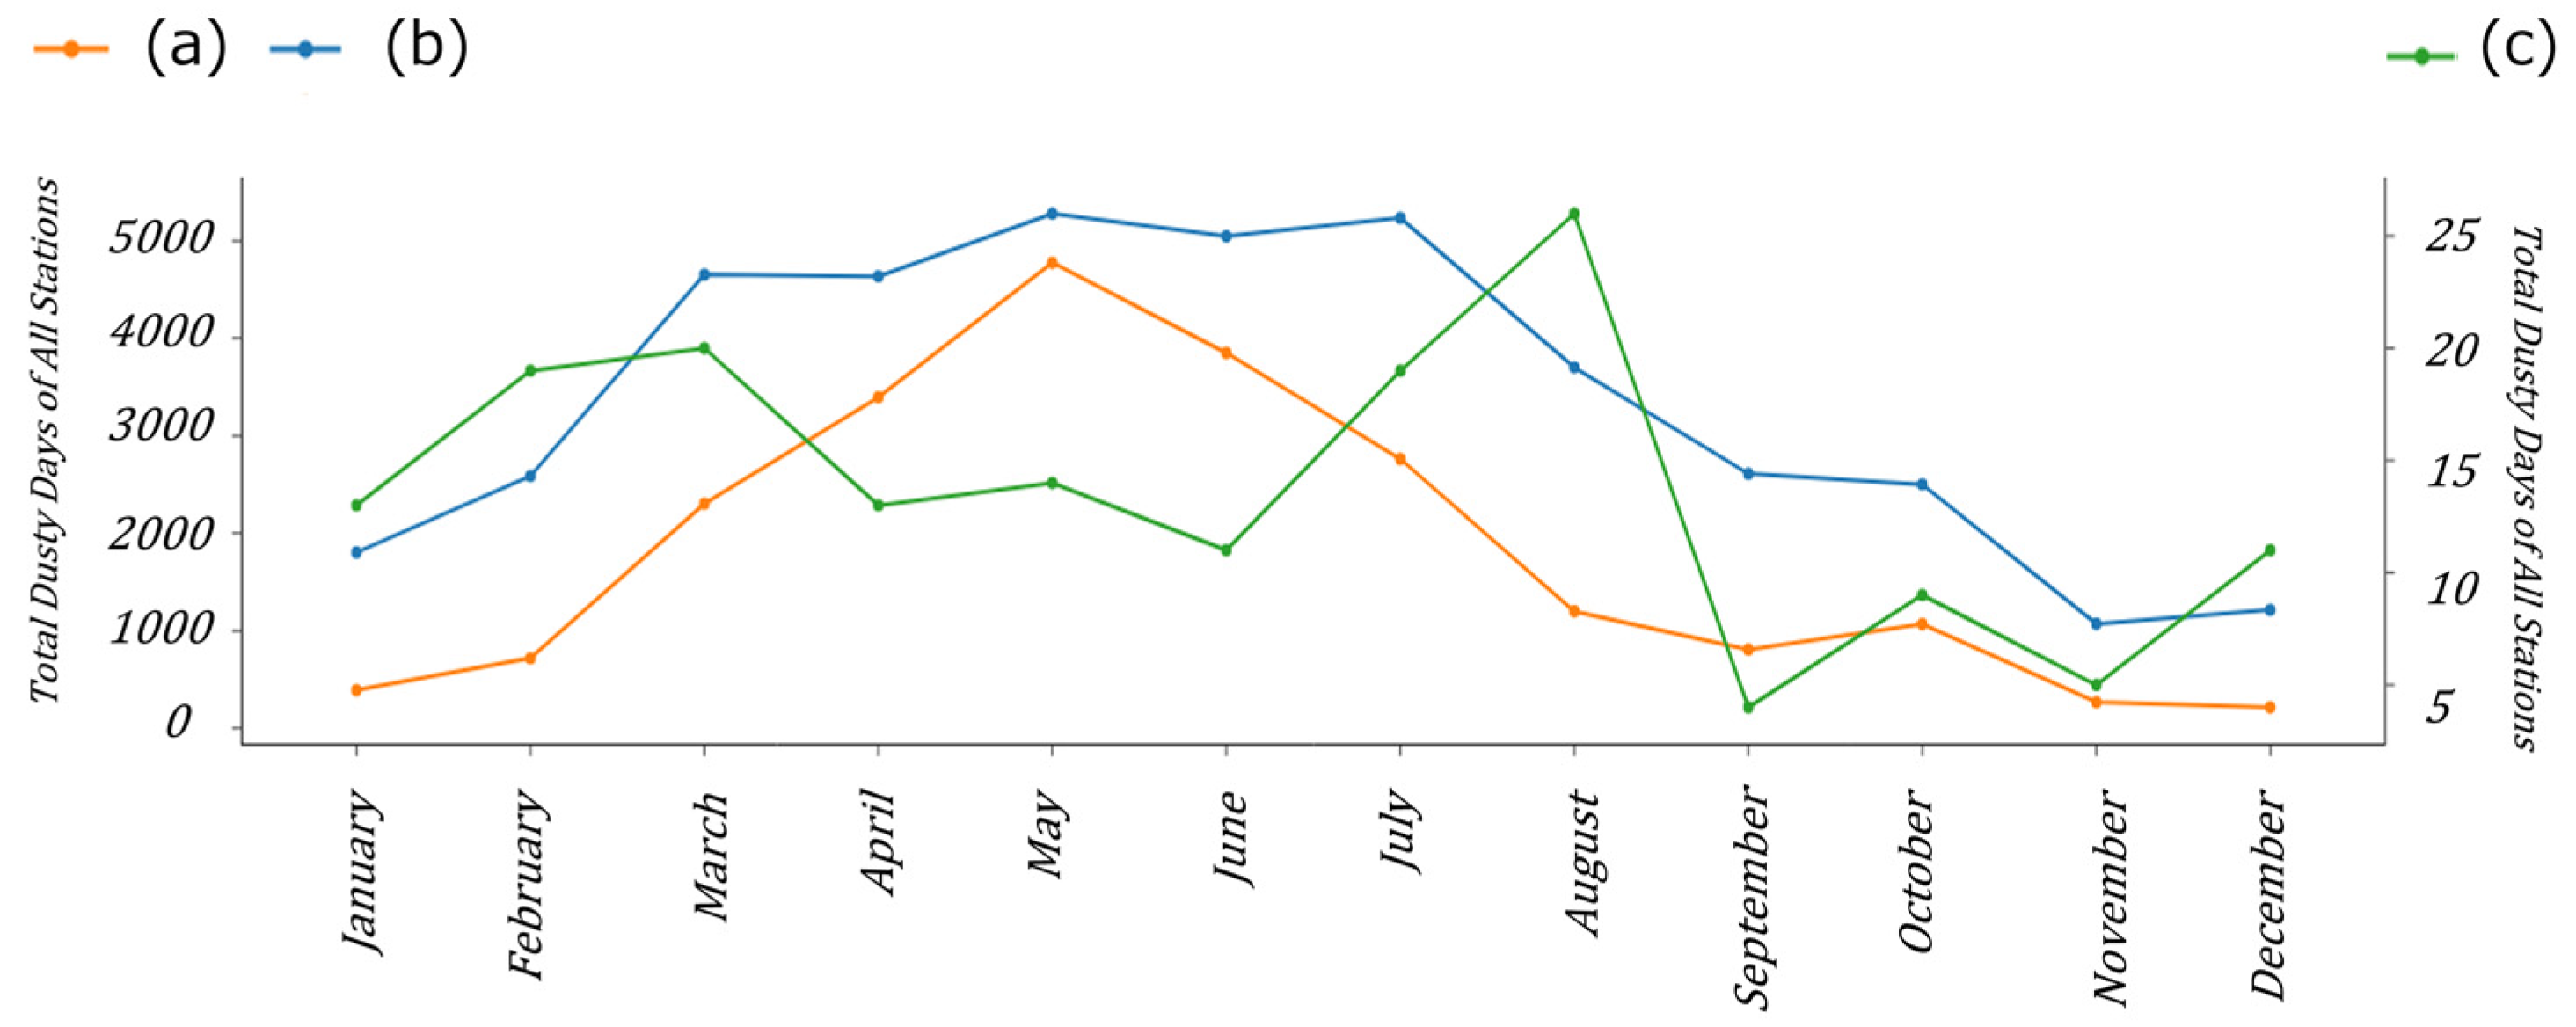
In monthly analysis, the highest recorded of dust events for both suspended dust and rising dust belongs to the spring and summer months, respectively. But for dust storms, it occurs in summer. The lowest frequency for all classes belongs to the winter season.

6. Conclusions

In this study, we investigate dust events of three categories of suspended dust, rising dust, and dust storm based on long-term meteorological datasets obtained at 427 stations over Iran covering a period of 12 years. We found that a single classification of sand and dust storm was insufficient to accurately reflect the different intensities and indices of this weather phenomenon. As a result, three classes of sand and dust storms were analyzed across all meteorological stations in Iran.
Among the three classes, rising dust had the highest frequency of occurrence, followed by suspended dust and dust storms. The duration and expected frequency of occurrence of all three categories were found to be less than 30 days per year, with only a few stations experiencing dust events more than 30 days per year. The interannual variation quantified by the standard deviation shows that most stations in all three categories have experienced frequent dust events annually.
The spatial distribution analysis revealed that all three classes were distributed uniformly across all stations. Suspended dust events, however, showed a distinct concentration in the western regions of the country, while rising dust tended to occur more frequently in the southern, eastern, and central parts of Iran. Dust storms, on the other hand, had the lowest frequency of occurrence compared to suspended and rising dust, yet they could still be observed in most parts of Iran.
Seasonal and monthly variations were also quantified. All three classes exhibited higher frequency of occurrence in the spring season. Accordingly, dust events reached their highest peak in late spring to early summer for all three categories, and rising dust was found to be the most frequently occurring type, followed by suspended dust and dust storms. In the annual analysis, the highest record of dust events occurred in 2012, indicating that the annual dust events also have variations.
Although our investigation analyzed records from all meteorological stations in Iran to analyze dust events, we acknowledge that the period of analysis was limited, and a longer timeframe would be necessary to obtain a more comprehensive understanding of these phenomena. Furthermore, it is important to note that the categories selected for the analyses did not encompass all possible dust classes. Therefore, for future studies, it would be beneficial to consider all dust classes to gain a more complete picture of sand and dust storms in Iran. This would enable us to identify any additional trends or patterns that may have been overlooked in our analysis.

Author Contributions

Methodology, N.I.; Software, L.M.; Formal analysis, L.M.; Writing—original draft, L.M.; Writing—review & editing, N.I.; Supervision, N.I.; Funding acquisition, N.I. All authors have read and agreed to the published version of the manuscript.

Funding

This study is financially supported by the Intellectual Exchange and Innovation program by The Japanese Ministry of Education, Culture, Sports, Science and Technology (MEXT).

Institutional Review Board Statement

Not applicable.

Informed Consent Statement

Informed consent was obtained from all subjects involved in the study.

Data Availability Statement

Data is unavailable due to privacy or ethical restrictions.

Acknowledgments

The meteorological datasets were provided from the National Meteorological Organization, the Islamic Republic of Iran (IRIMO) for the purpose of completing a research project. The data collection was supported by Shahruz Shekari. We express our deep gratitude for their cooperation.

Conflicts of Interest

The authors declare no conflict of interest.

References

  1. Middleton, N.; Kang, U. Sand and Dust Storms: Impact Mitigation. Sustainability 2017, 9, 1053. [Google Scholar] [CrossRef] [Green Version]
  2. Mahmoudi, L.; Ikegaya, N. Present Situations of Dust Storms in Iran for Seeking Numerical Predictions. Proc. Int. Exch. Innov. Conf. Eng. Sci. 2022, 8, 354–359. [Google Scholar] [CrossRef]
  3. 2015.220669. The-Physics Pdf, 2nd ed.; Methuen & Co., Ltd.: London, UK, 1941. [Google Scholar]
  4. Zittis, G.; Almazroui, M.; Alpert, P.; Ciais, P.; Cramer, W.; Dahdal, Y.; Fnais, M.; Francis, D.; Hadjinicolaou, P.; Howari, F.; et al. Climate Change and Weather Extremes in the Eastern Mediterranean and Middle East. Rev. Geophys. 2022, 60, e2021RG000762. [Google Scholar] [CrossRef]
  5. Cuevas Agulló, E. Establishing a WMO Sand and Dust Storm Warning Advisory and Assessment System Regional Node for West Asia: Current Capabilities and Needs. Atmosphere 2013, 50, 91–96. [Google Scholar] [CrossRef] [Green Version]
  6. Sivakumar, M.V.; Motha, R.P.; Das, H.P. (Eds.) Natural Disasters and Extreme Events in Agriculture Impacts and Mitigation, 1st ed.; Springer: Berlin/Heidelberg, Germany, 2005. [Google Scholar]
  7. Ke, Y.; Wang, H.; Wu, Z.; Liu, S.; Zhao, T.; Yin, Y. Quantifying the Pollution Characteristics of Chemical Components in PM2.5 in the North China Plain, China: Spatiotemporal Variation and Health Risk. Atmos. Environ. 2023, 307, 119860. [Google Scholar] [CrossRef]
  8. Huang, X.; Ding, K.; Liu, J.; Wang, Z.; Tang, R.; Xue, L.; Wang, H.; Zhang, Q.; Tan, Z.M.; Fu, C.; et al. Smoke-Weather Interaction Affects Extreme Wildfires in Diverse Coastal Regions. Science 2023, 379, 457–461. [Google Scholar] [CrossRef]
  9. Miri, A.; Middleton, N. Long-Term Impacts of Dust Storms on Transport Systems in South-Eastern Iran. Nat. Hazards 2022, 114, 291–312. [Google Scholar] [CrossRef]
  10. Wang, H.; Ke, Y.; Tan, Y.; Zhu, B.; Zhao, T.; Yin, Y. Observational Evidence for the Dual Roles of BC in the Megacity of Eastern China: Enhanced O3 and Decreased PM2.5 Pollution. Chemosphere 2023, 327, 138548. [Google Scholar] [CrossRef]
  11. Tan, Y.; Wang, H.; Zhu, B.; Zhao, T.; Shi, S.; Liu, A.; Liu, D.; Pan, C.; Cao, L. The Interaction between Black Carbon and Planetary Boundary Layer in the Yangtze River Delta from 2015 to 2020: Why O3 Didn’t Decline so Significantly as PM2.5. Environ. Res. 2022, 214, 114095. [Google Scholar] [CrossRef]
  12. Chen, Q.; Wang, M.; Wang, Y.; Zhang, L.; Li, Y.; Han, Y. Oxidative Potential of Water-Soluble Matter Associated with Chromophoric Substances in PM2.5 over Xi’an, China. Environ. Sci. Technol. 2019, 53, 8574–8584. [Google Scholar] [CrossRef]
  13. Boroughani, M.; Hashemi, H.; Hosseini, S.H.; Pourhashemi, S.; Berndtsson, R. Desiccating Lake Urmia: A New Dust Source of Regional Importance. IEEE Geosci. Remote Sens. Lett. 2020, 17, 1483–1487. [Google Scholar] [CrossRef]
  14. Tanaka, T.Y.; Chiba, M. A Numerical Study of the Contributions of Dust Source Regions to the Global Dust Budget. Glob. Planet. Chang. 2006, 52, 88–104. [Google Scholar] [CrossRef]
  15. Sharifi, A.; Murphy, L.N.; Pourmand, A.; Clement, A.C.; Canuel, E.A.; Beni, A.N.; Lahijani, H.A.; Delanghe, D.; Ahmady-Birgani, H. Early-Holocene Greening of the Afro-Asian Dust Belt Changed Sources of Mineral Dust in West Asia. Earth Planet. Sci. Lett. 2018, 481, 30–40. [Google Scholar] [CrossRef] [Green Version]
  16. Francis, D.; Fonseca, R.; Nelli, N.; Bozkurt, D.; Cuesta, J.; Bosc, E. On the Middle East’s Severe Dust Storms in Spring 2022: Triggers and Impacts. Atmos. Environ. 2023, 296, 119539. [Google Scholar] [CrossRef]
  17. Ginoux, P.; Prospero, J.M.; Gill, T.E.; Hsu, N.C.; Zhao, M. Global-Scale Attribution of Anthropogenic and Natural Dust Sources and Their Emission Rates Based on MODIS Deep Blue Aerosol Products. Rev. Geophys. 2012, 50, 1–36. [Google Scholar] [CrossRef]
  18. Boloorani, A.D.; Nabavi, S.O.; Bahrami, H.A.; Mirzapour, F.; Kavosi, M.; Abasi, E.; Azizi, R. Investigation of Dust Storms Entering Western Iran Using Remotely Sensed Data and Synoptic Analysis. J. Environ. Health Sci. Eng. 2014, 12, 124. [Google Scholar] [CrossRef] [Green Version]
  19. Javadian, M.; Behrangi, A.; Sorooshian, A. Impact of Drought on Dust Storms: Case Study over Southwest Iran. Environ. Res. Lett. 2019, 14, 124029. [Google Scholar] [CrossRef]
  20. Rezazadeh, M.; Irannejad, P.; Shao, Y. Climatology of the Middle East Dust Events. Aeolian Res. 2013, 10, 103–109. [Google Scholar] [CrossRef]
  21. Hamzeh, N.H.; Kaskaoutis, D.G.; Rashki, A.; Mohammadpour, K. Long-Term Variability of Dust Events in Southwestern Iran and Its Relationship with the Drought. Atmosphere 2021, 12, 1350. [Google Scholar] [CrossRef]
  22. Modarres, R.; Sadeghi, S. Spatial and Temporal Trends of Dust Storms across Desert Regions of Iran. Nat. Hazards 2018, 90, 101–114. [Google Scholar] [CrossRef]
  23. Mesbahzadeh, T.; Miglietta, M.M.; Sardoo, F.S.; Krakauer, N.; Hasheminejad, M. Regional Analysis of Dust Day Duration in Central Iran. Appl. Sci. 2022, 12, 6248. [Google Scholar] [CrossRef]
  24. Mesbahzadeh, T.; Salajeghe, A.; Sardoo, F.S.; Zehtabian, G.; Ranjbar, A.; Krakauer, N.Y.; Miglietta, M.M.; Mirakbari, M. Climatology of Dust Days in the Central Plateau of Iran. Nat. Hazards 2020, 104, 1801–1817. [Google Scholar] [CrossRef]
  25. Baghbanan, P.; Ghavidel, Y.; Farajzadeh, M. Temporal Long-Term Variations in the Occurrence of Dust Storm Days in Iran. Meteorol. Atmos. Phys. 2020, 132, 885–898. [Google Scholar] [CrossRef]
  26. Beyranvand, A.; Azizi, G.; Alizadeh-Choobari, O.; Darvishi Boloorani, A. Spatial and Temporal Variations in the Incidence of Dust Events over Iran. Nat. Hazards 2019, 97, 229–241. [Google Scholar] [CrossRef]
  27. Alizadeh-Choobari, O.; Ghafarian, P.; Owlad, E. Temporal Variations in the Frequency and Concentration of Dust Events over Iran Based on Surface Observations. Int. J. Climatol. 2016, 36, 2050–2062. [Google Scholar] [CrossRef]
  28. Climate-Data-Historical. Available online: https://climateknowledgeportal.worldbank.org/about (accessed on 2 June 2023).
  29. Rashki, A.; Middleton, N.J.; Goudie, A.S. Dust Storms in Iran—Distribution, Causes, Frequencies and Impacts. Aeolian Res. 2021, 48, 100655. [Google Scholar] [CrossRef]
  30. Papi, R.; Kakroodi, A.A.; Soleimani, M.; Karami, L.; Amiri, F.; Alavipanah, S.K. Identifying Sand and Dust Storm Sources Using Spatial-Temporal Analysis of Remote Sensing Data in Central Iran. Ecol. Inform. 2022, 70, 101724. [Google Scholar] [CrossRef]
  31. Alizade Govarchin Ghale, Y.; Tayanc, M.; Unal, A. Dried Bottom of Urmia Lake as a New Source of Dust in the Northwestern Iran: Understanding the Impacts on Local and Regional Air Quality. Atmos. Environ. 2021, 262, 118635. [Google Scholar] [CrossRef]
  32. Rashki, A.; Kaskaoutis, D.G.; Goudie, A.S.; Kahn, R.A. Dryness of Ephemeral Lakes and Consequences for Dust Activity: The Case of the Hamoun Drainage Basin, Southeastern Iran. Sci. Total Environ. 2013, 463–464, 552–564. [Google Scholar] [CrossRef]
  33. Zucca, C.; Middleton, N.; Kang, U.; Liniger, H. Shrinking Water Bodies as Hotspots of Sand and Dust Storms: The Role of Land Degradation and Sustainable Soil and Water Management. Catena 2021, 207, 105669. [Google Scholar] [CrossRef]
  34. World Meteorological Organization. WMO Manual on Codes: International Codes, Volume I.1 Annex II to the WMO Technical Regulations: Part A—Alphanumeric Codes, 2017 ed.; World Meteorological Organization: Geneva, Switzerland, 2019; Volume I.1, ISBN 978-92-63-10306-2. [Google Scholar]
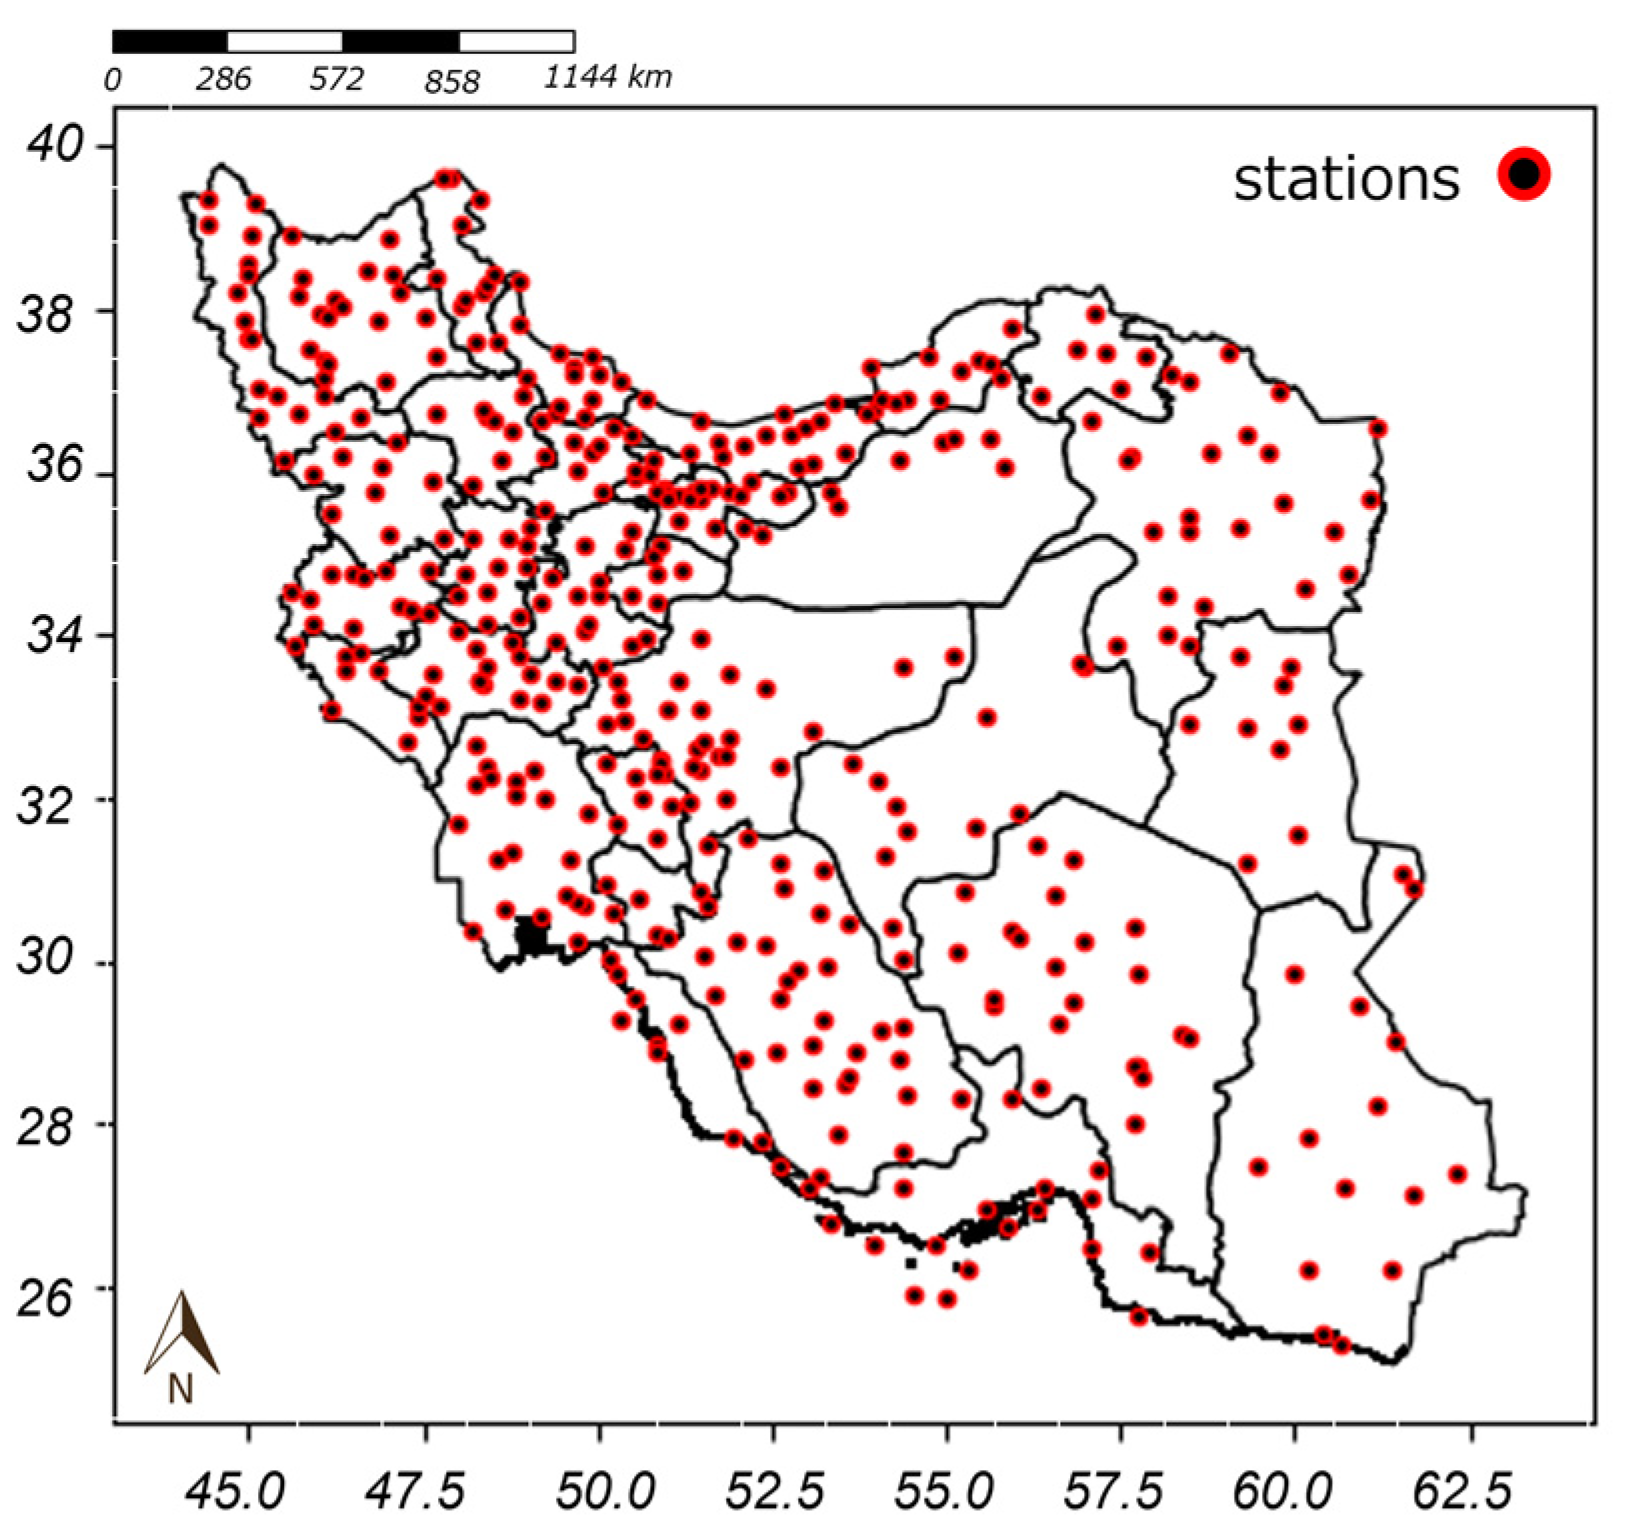
Figure 1. The horizontal and vertical axes show the longitude and latitude. The red markers indicate the locations of the weather stations. Total number of the stations is 427, covering the entire county.
Sustainability 15 12294 g001
Figure 2. The number of stations and occurrence frequency of dust events in each class per year based on 12-year data for (a) suspended dust (06), (b) rising dust (07), and (c) dust storm (33–35).
Sustainability 15 12294 g002
Figure 3. Spatial distribution of occurrence frequencies of dust per year for (a) suspended dust, (b) rising dust, and (c) dust storm. The sizes and colors of the marker indicate the frequency.
Sustainability 15 12294 g003
Figure 4. Spatial distribution of standard deviation of occurrence frequencies of dust per station for (a) suspended dust, (b) rising dust, and (c) dust storm. The sizes and colors of the marker indicate the frequency.
Sustainability 15 12294 g004
Figure 5. Breakdowns of the number of stations and occurrence frequency of dust events less than 30 days per year based on 12-year data for (a) suspended dust, (b) rising dust, and (c) dust storm.
Sustainability 15 12294 g005
Figure 6. Spatial distribution of occurrence frequencies of dust less than 30 days per year for (a) suspended dust, (b) rising dust, and (c) dust storm. The sizes and colors of the marker indicate the frequency. The numbers in (d,e) indicate the locations of the weather stations. Please refer to the explanation in Section 3.4.
Sustainability 15 12294 g006
Figure 7. Seasonal spatial distribution of the occurrence frequencies per season for the suspended dust. The sizes and colors indicate the frequency. Seasons are defined as follows: spring from March to May, summer from June to August, autumn from September to November, and winter from December to February.
Sustainability 15 12294 g007
Figure 8. Seasonal spatial distribution of the occurrence frequencies per season for the rising dust. The sizes and colors indicate the frequency. Seasons are defined as follows: spring from March to May, summer from June to August, autumn from September to November, and winter from December to February.
Sustainability 15 12294 g008
Figure 9. Seasonal spatial distribution of the occurrence frequencies per season for the dust storm. The sizes and colors indicate the frequency. Seasons are defined as follows: spring from March to May, summer from June to August, autumn from September to November, and winter from December to February.
Sustainability 15 12294 g009
Figure 10. Long-term monthly variation of total dusty days for 12 years (a) suspended, (b) rising dust, and (c) dust storm. The numbers indicate the total dusty days per months of all the weather stations.
Sustainability 15 12294 g010
Figure 11. Annual variation of the total number of dust events for (a) suspended dust, (b) rising dust, and (c) dust storm.
Sustainability 15 12294 g011
Figure 12. Monthly variation of the total number of dust events for (a) suspended dust, (b) rising dust, and (c) dust storm. Each lines indicates the average of 12-year data.
Sustainability 15 12294 g012
Table 1. Description of three classes of dust events defined by WMO (World Meteorological Organization).
ClassSuspended DustRising DustDust Storm
Code060733, 34, 35
DescriptionDust is suspended in the air but not raised by the wind at or near the station.Sand and dust are raised by the wind at or near the station. The following VR and WSR are considered.Severe dusts storms occur with a low VR and strong WSR.
Visibility range (VR)No limitBetween 1 and 10 kmLess than 1 km
Wind speed range (WSR)No limitBetween 7 and 15 m/sMore than 15 m/s
Disclaimer/Publisher’s Note: The statements, opinions and data contained in all publications are solely those of the individual author(s) and contributor(s) and not of MDPI and/or the editor(s). MDPI and/or the editor(s) disclaim responsibility for any injury to people or property resulting from any ideas, methods, instructions or products referred to in the content.