


Measuring the Circularity and Impact Reduction Potential of Post-Industrial and Post-Consumer Recycled Plastics


Abstract
1. Introduction
1.1. Difference between Post-Industrial Recycling and Post-Consumer Recycling
1.2. Measuring Circularity
2. Materials and Methods
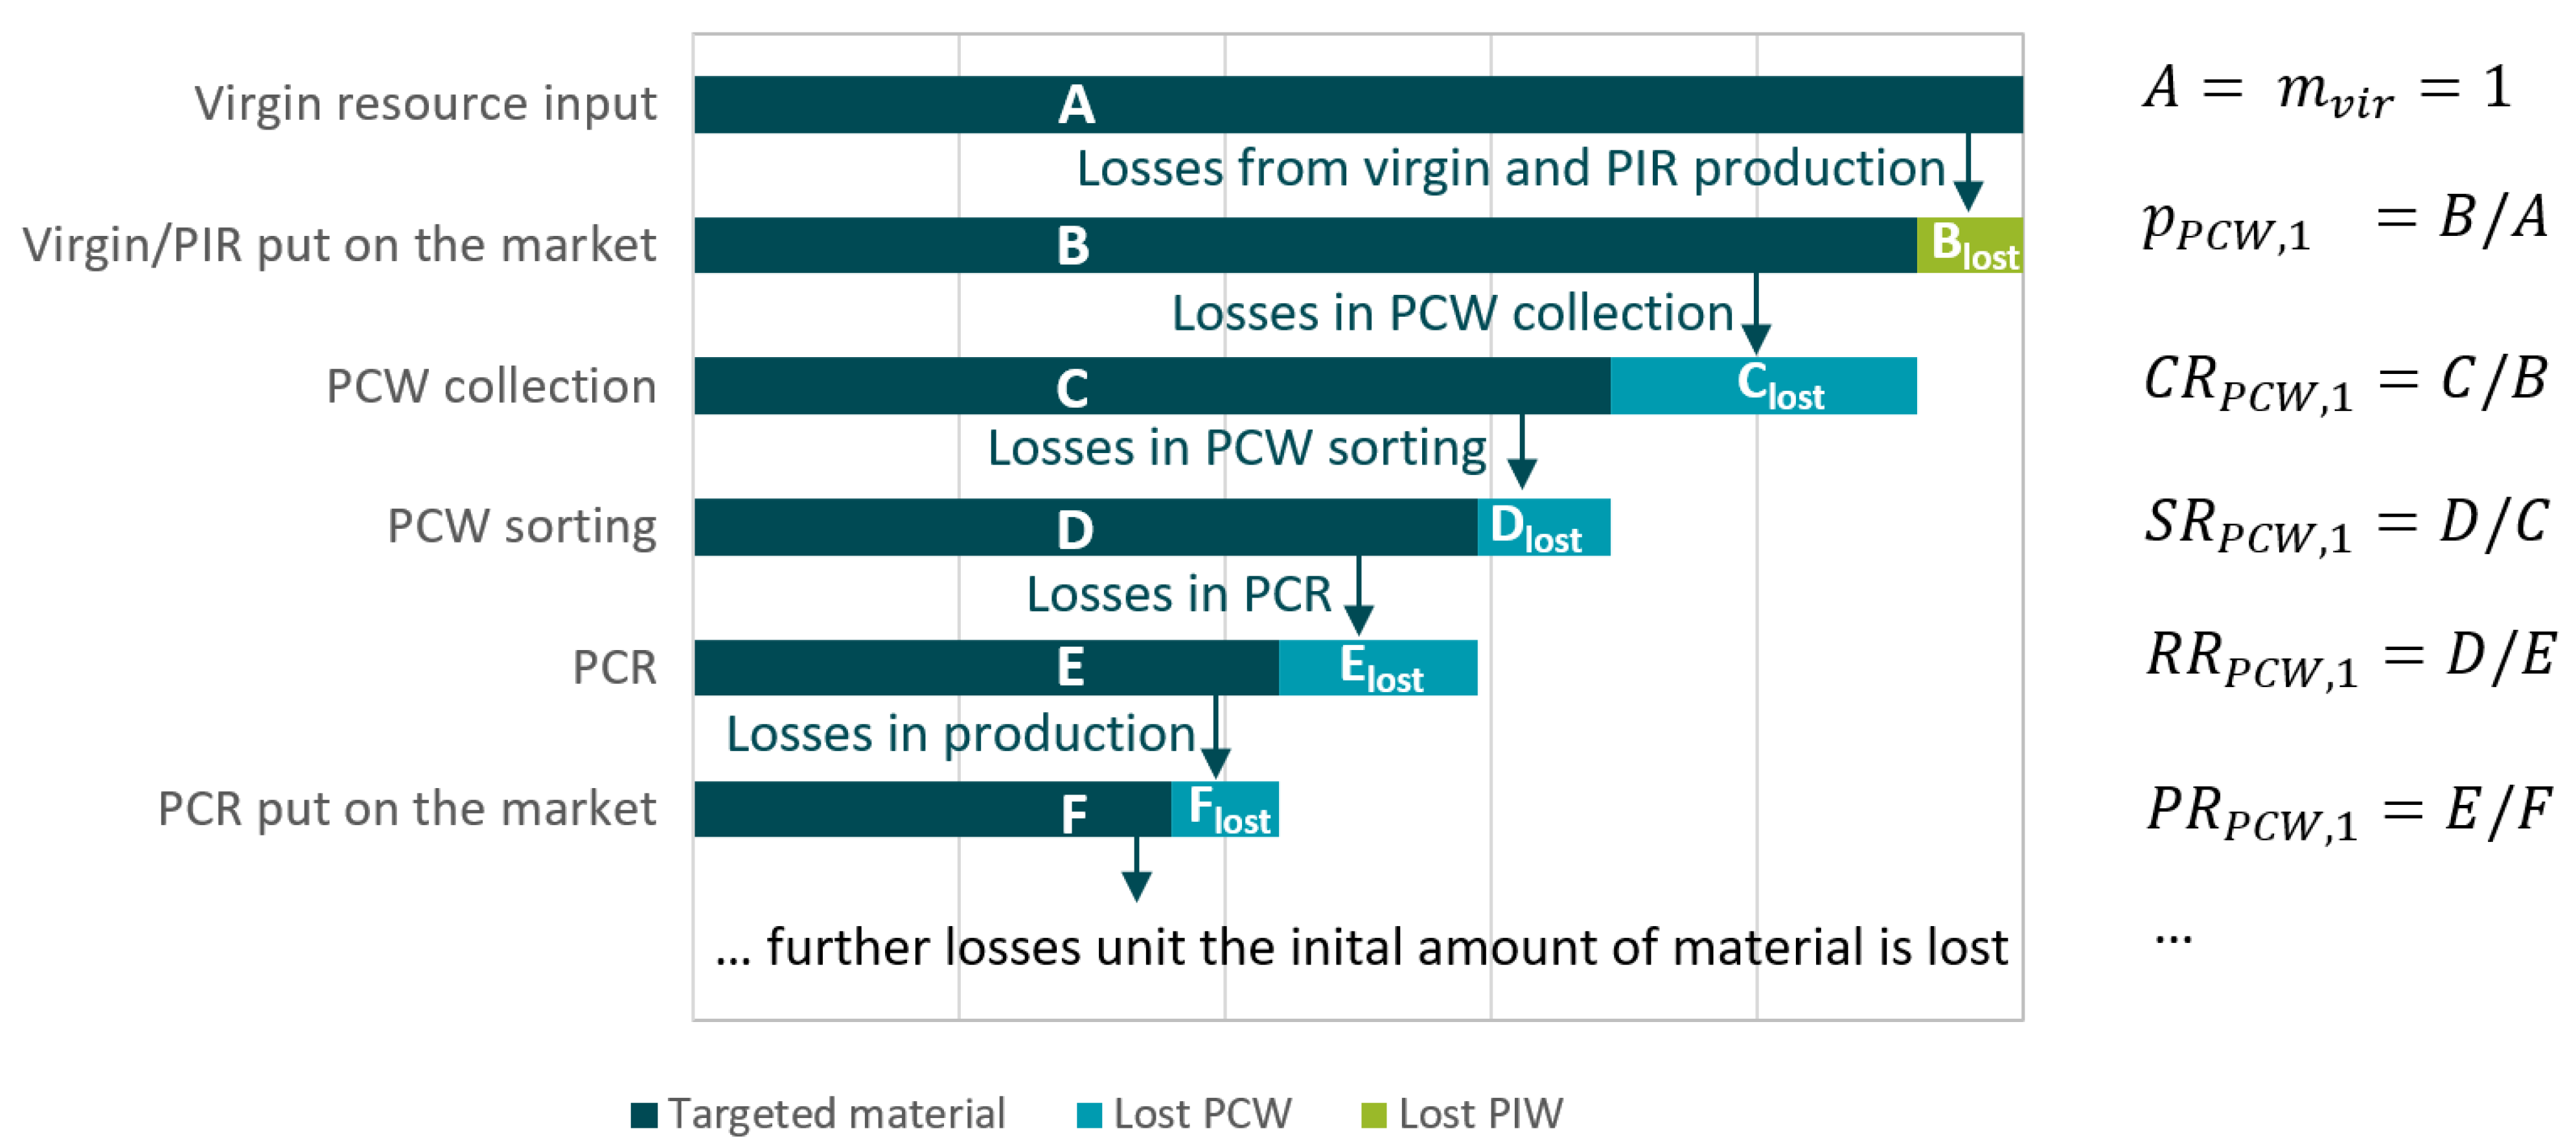
2.1. Effective Circularity
- Level 1: Closed-loop recycling of a product into an identical production application.
- Level 2: Quasi-closed-loop recycling, with restricted but defined reuse in products that are managed by the same recycling system.
- Level 3: Open-loop recycling, with reuse in alternative products that might be further managed by another recycling system (also referred to as a recycling cascade).
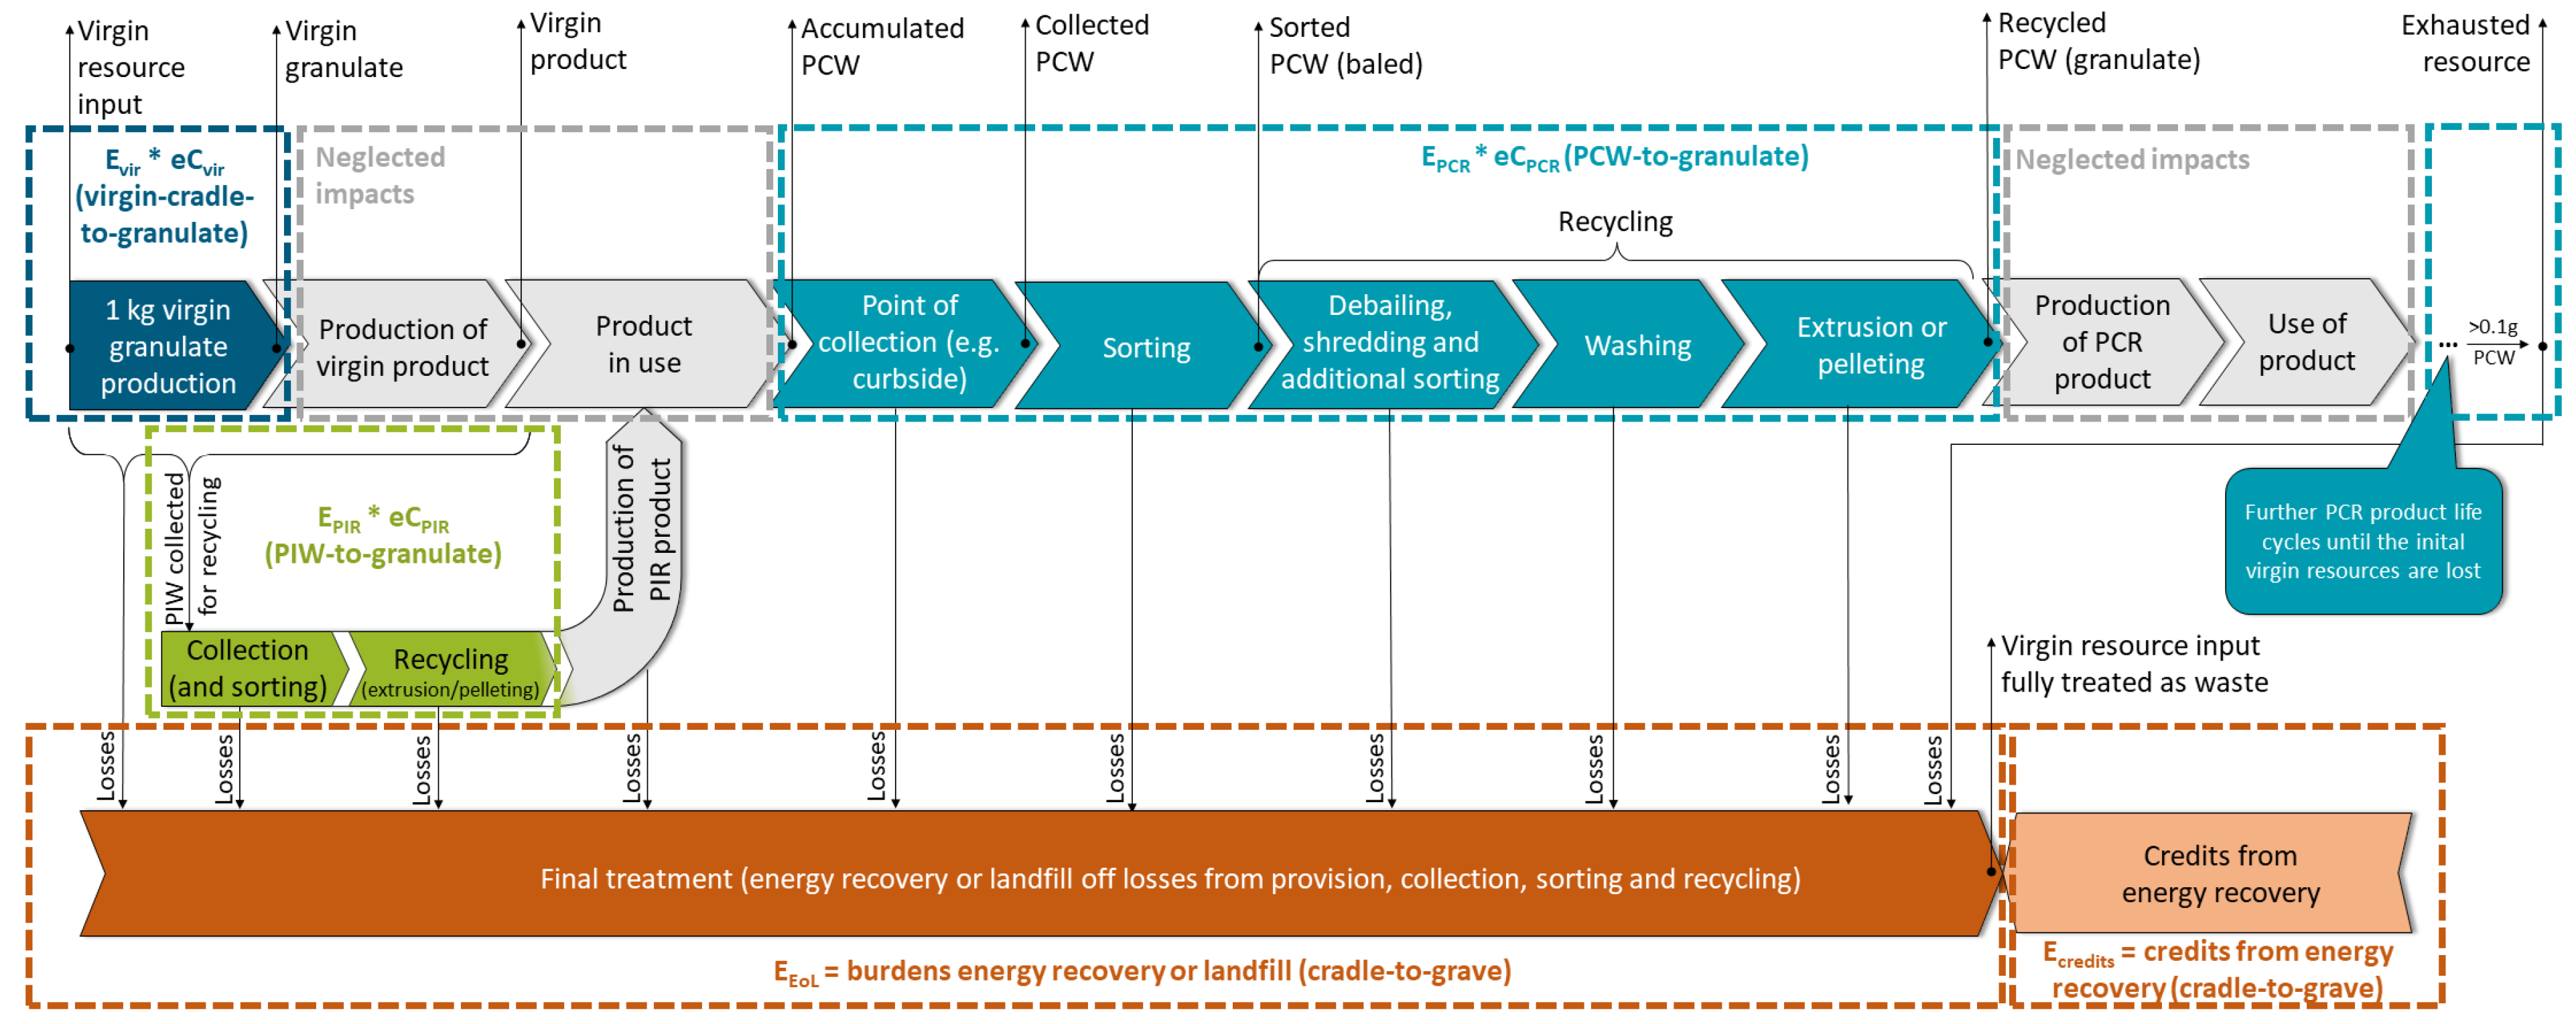
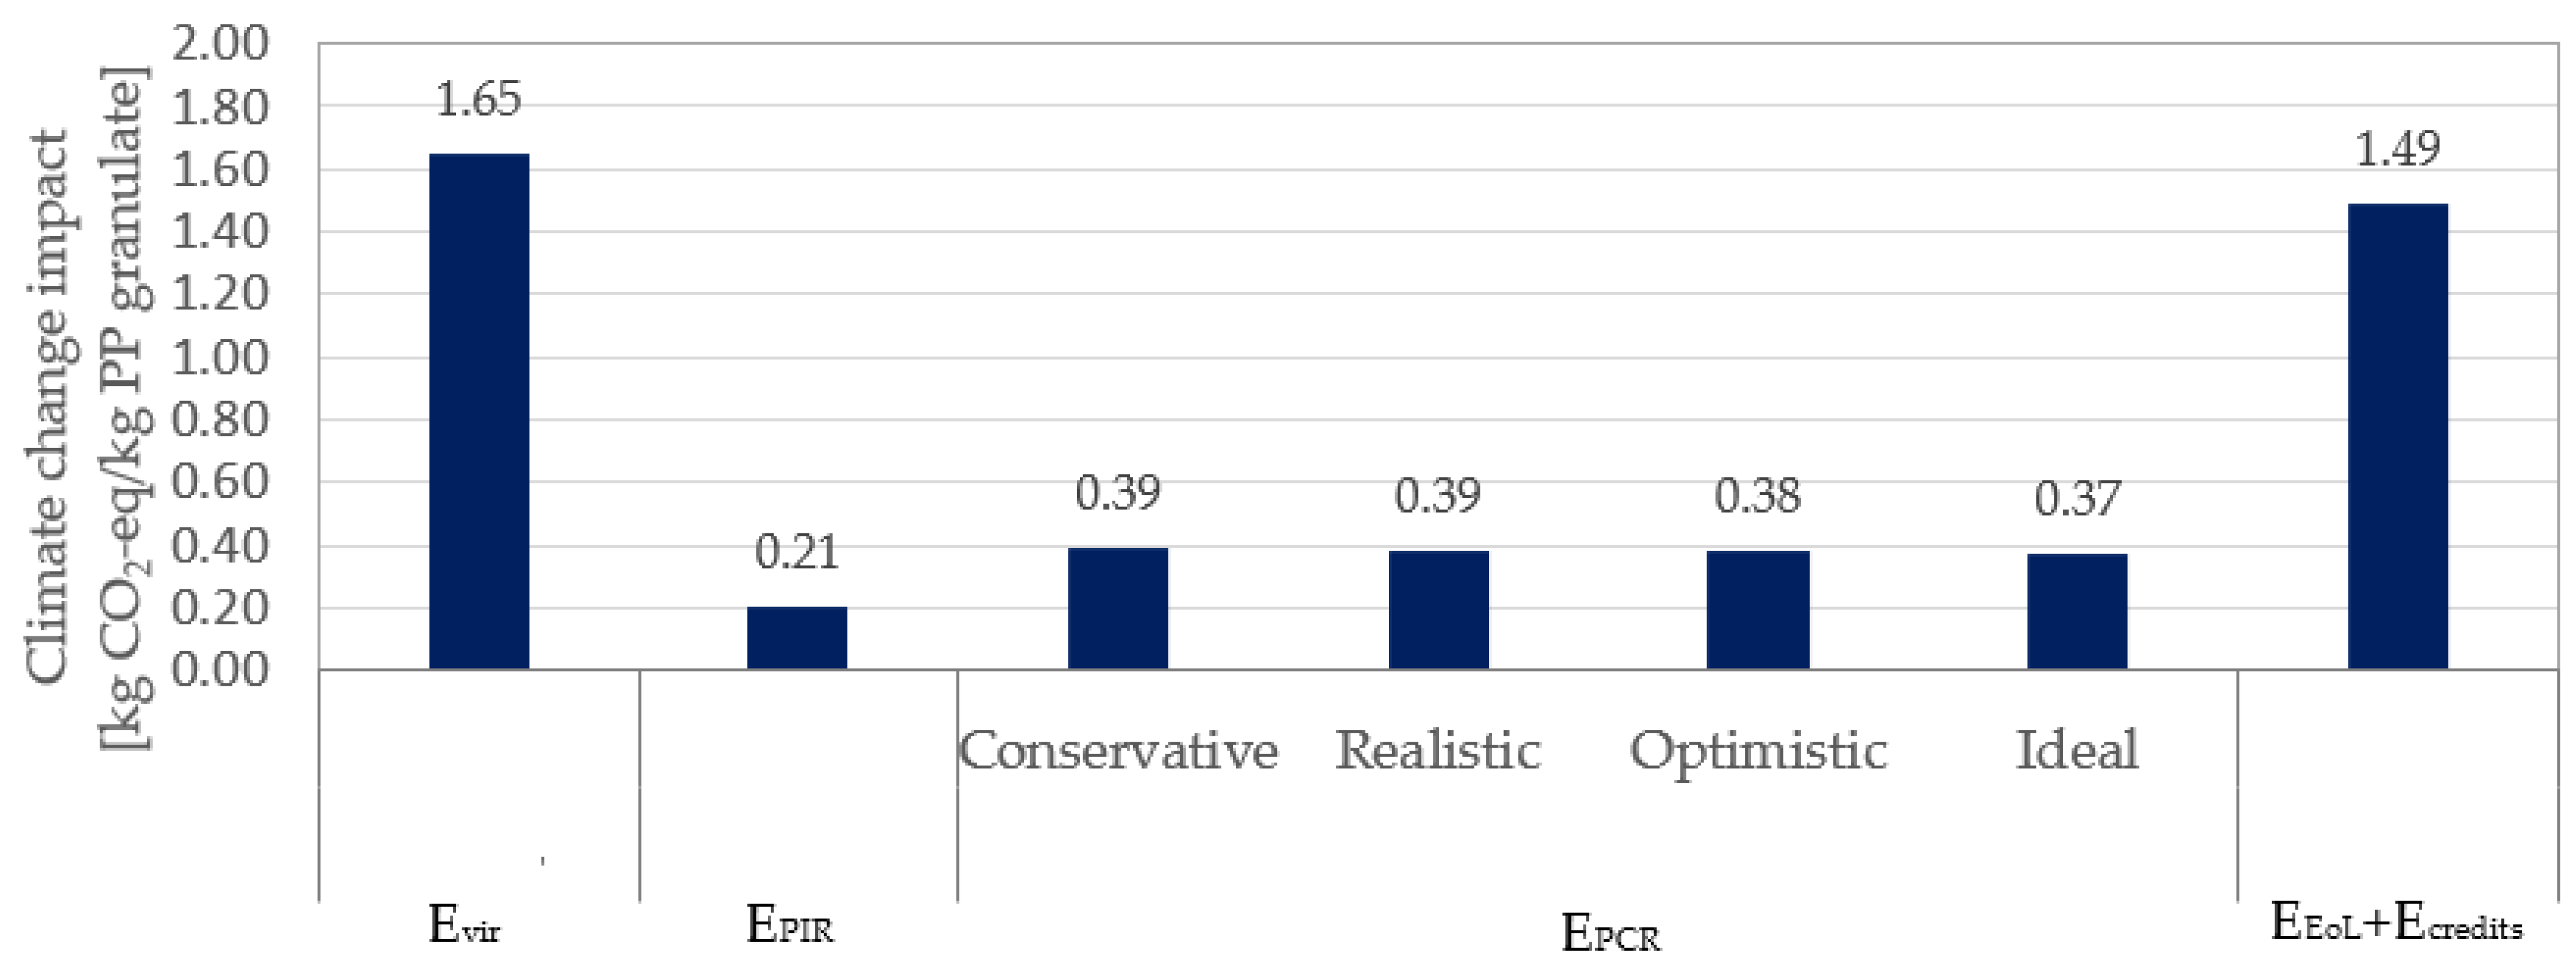
2.2. Combining Effective Circularity and Environmental Impact Assessment
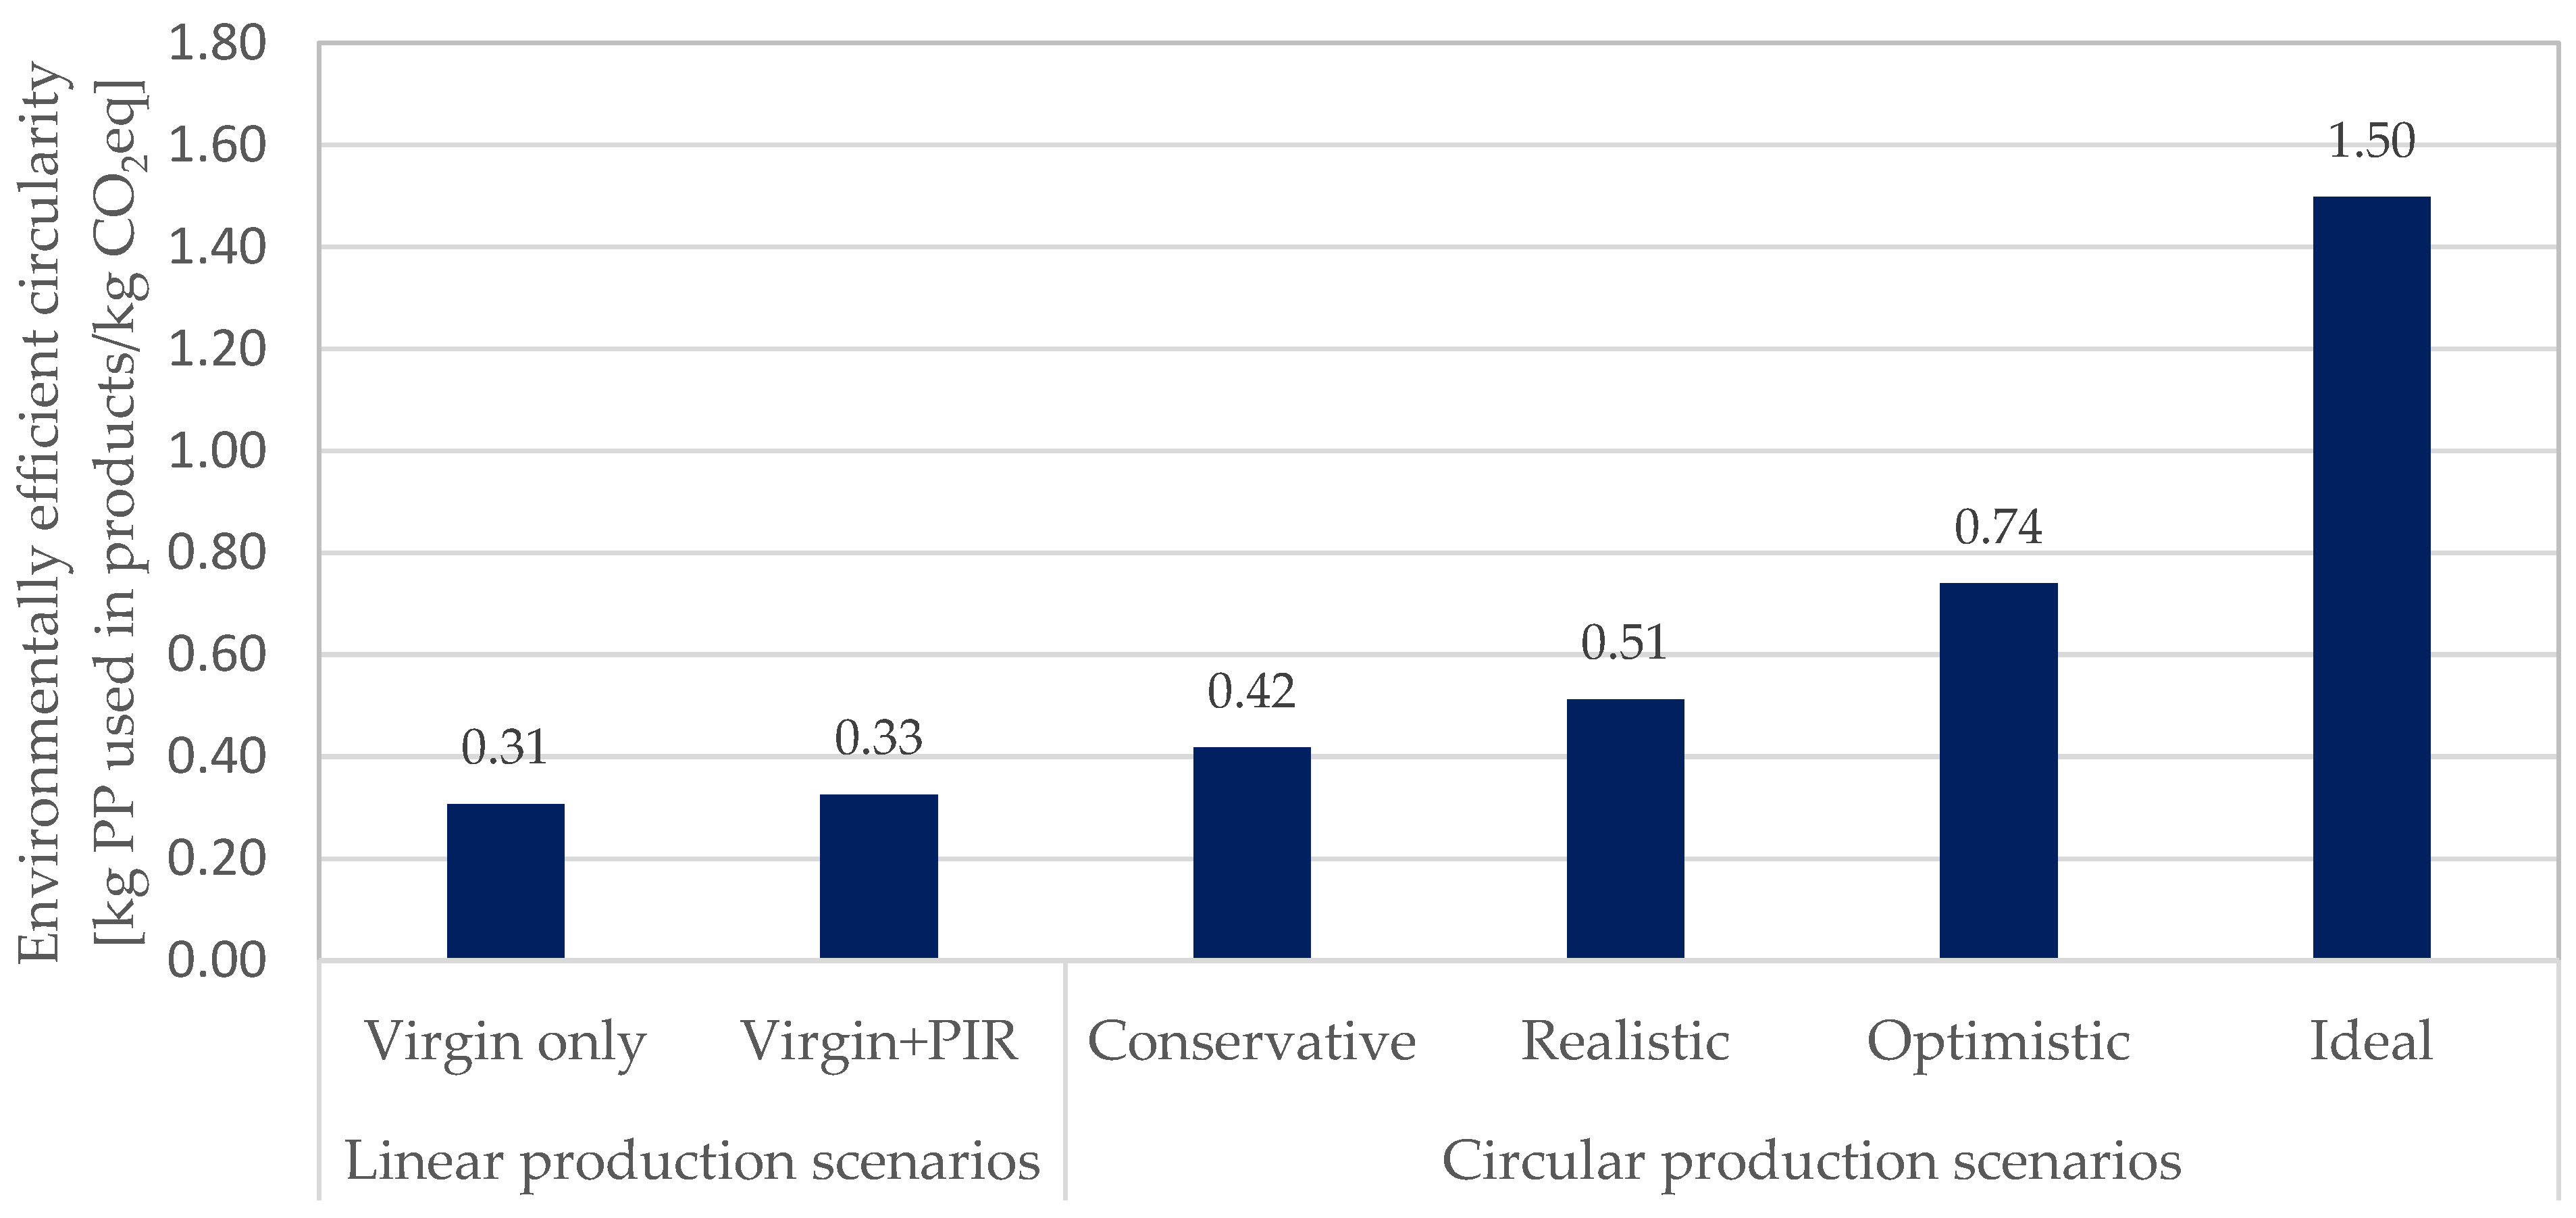
2.2.1. Environmentally Efficient Circularity
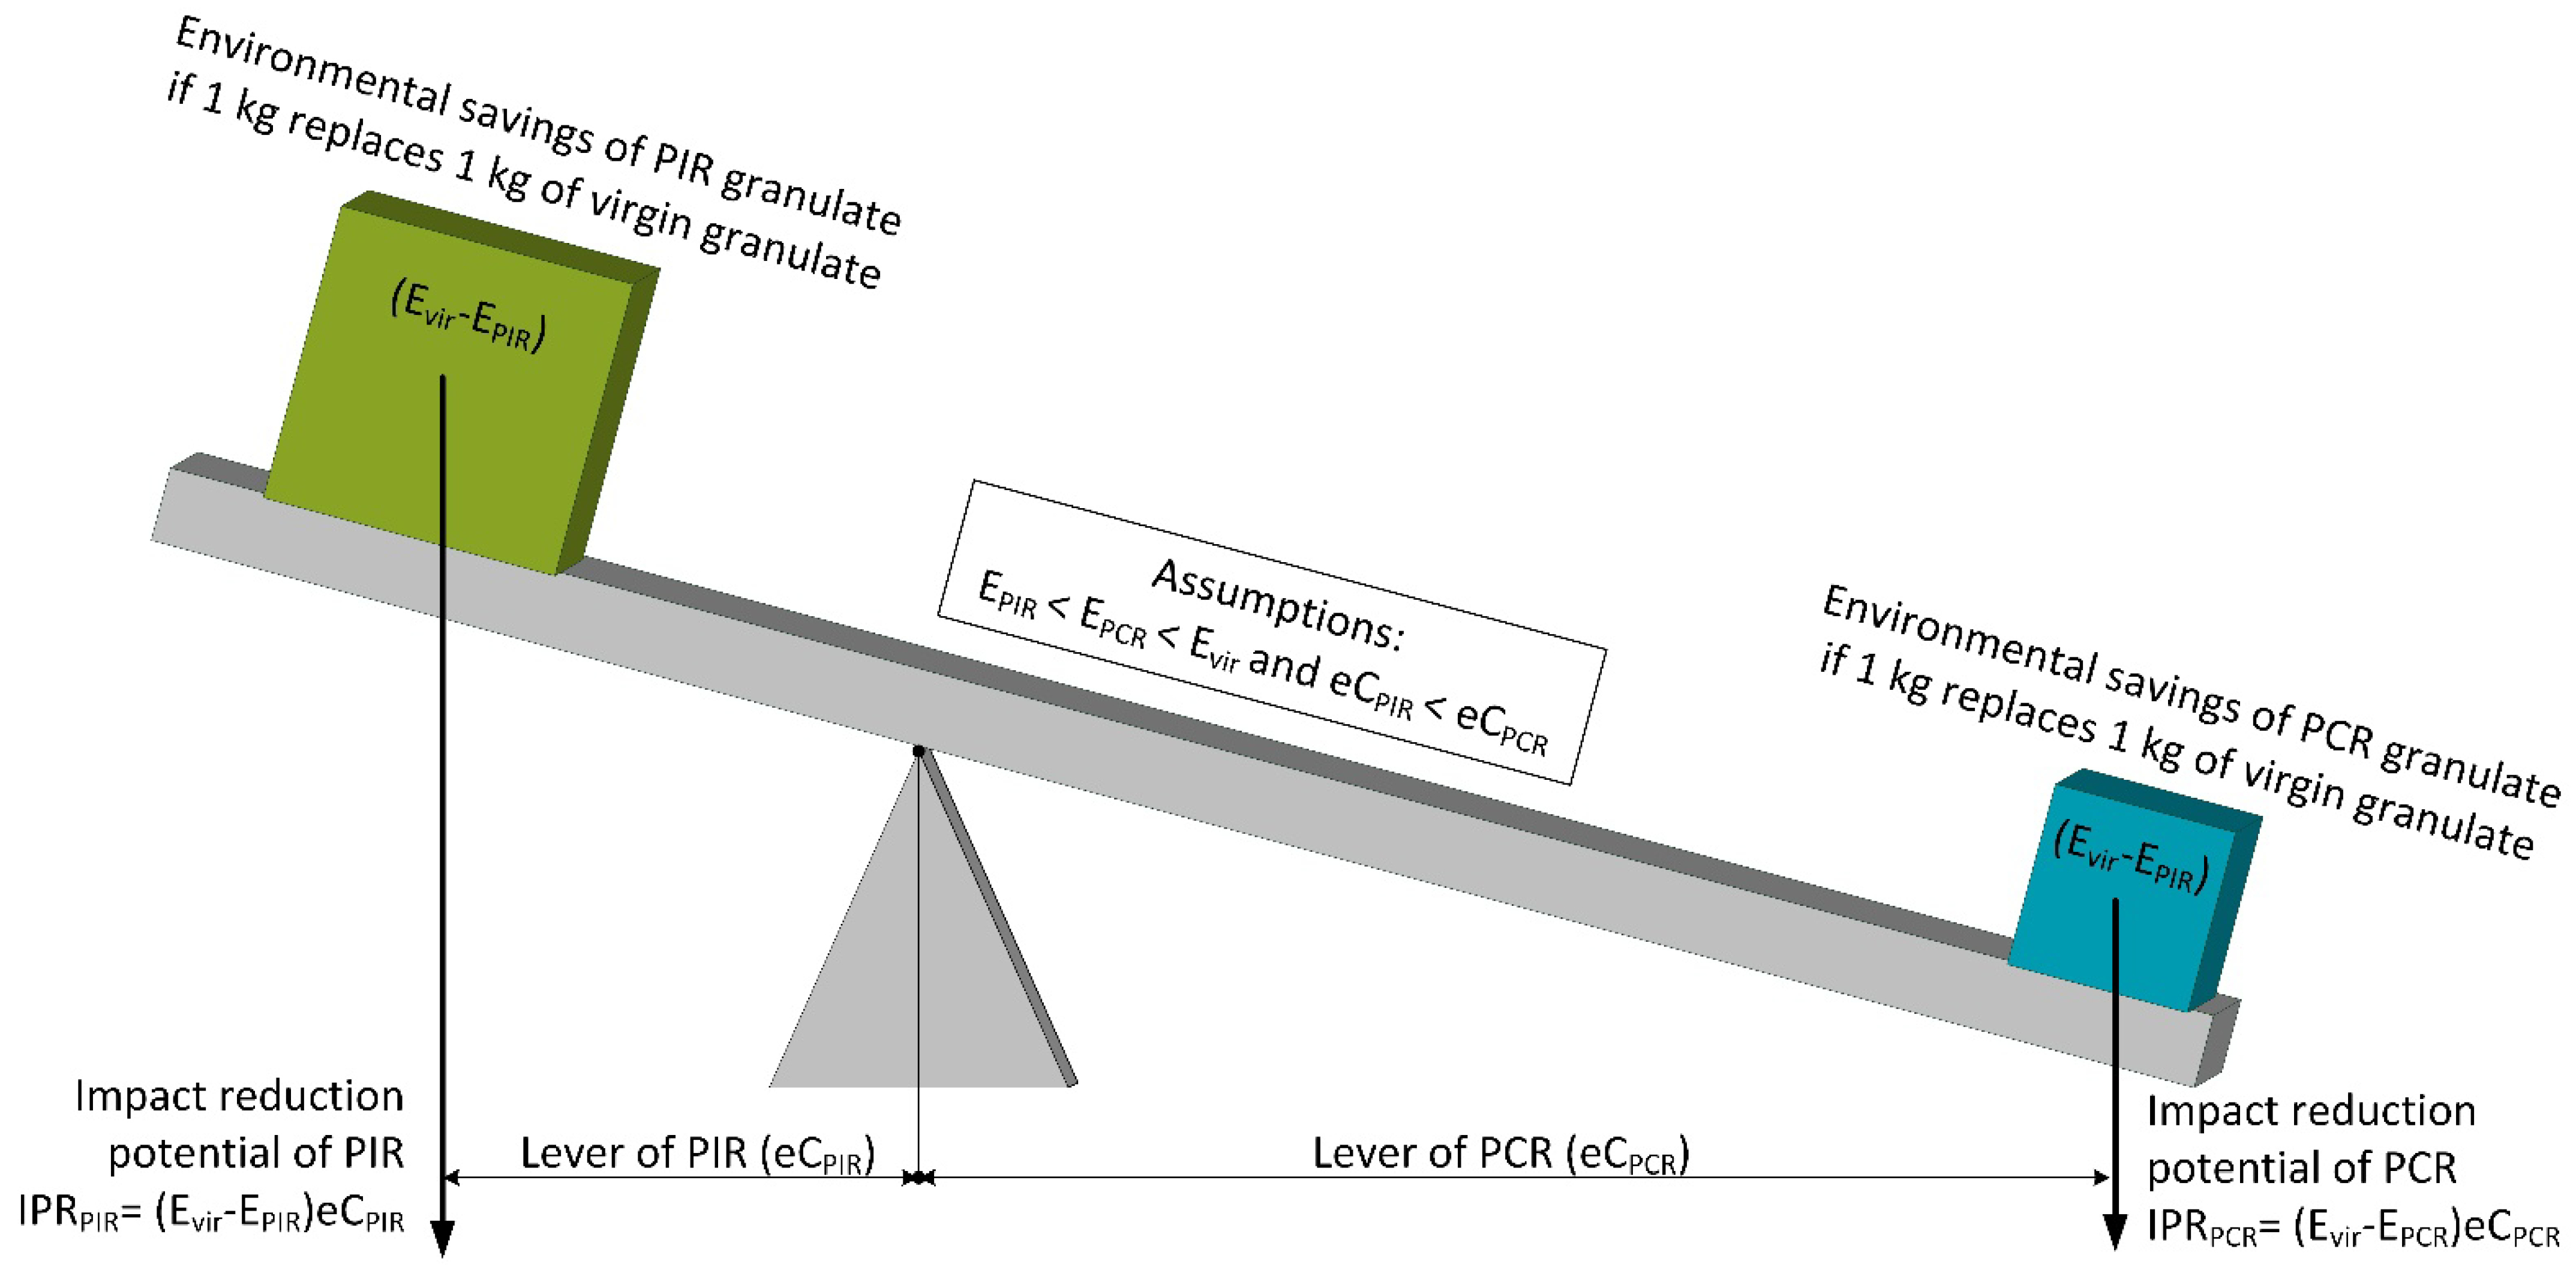
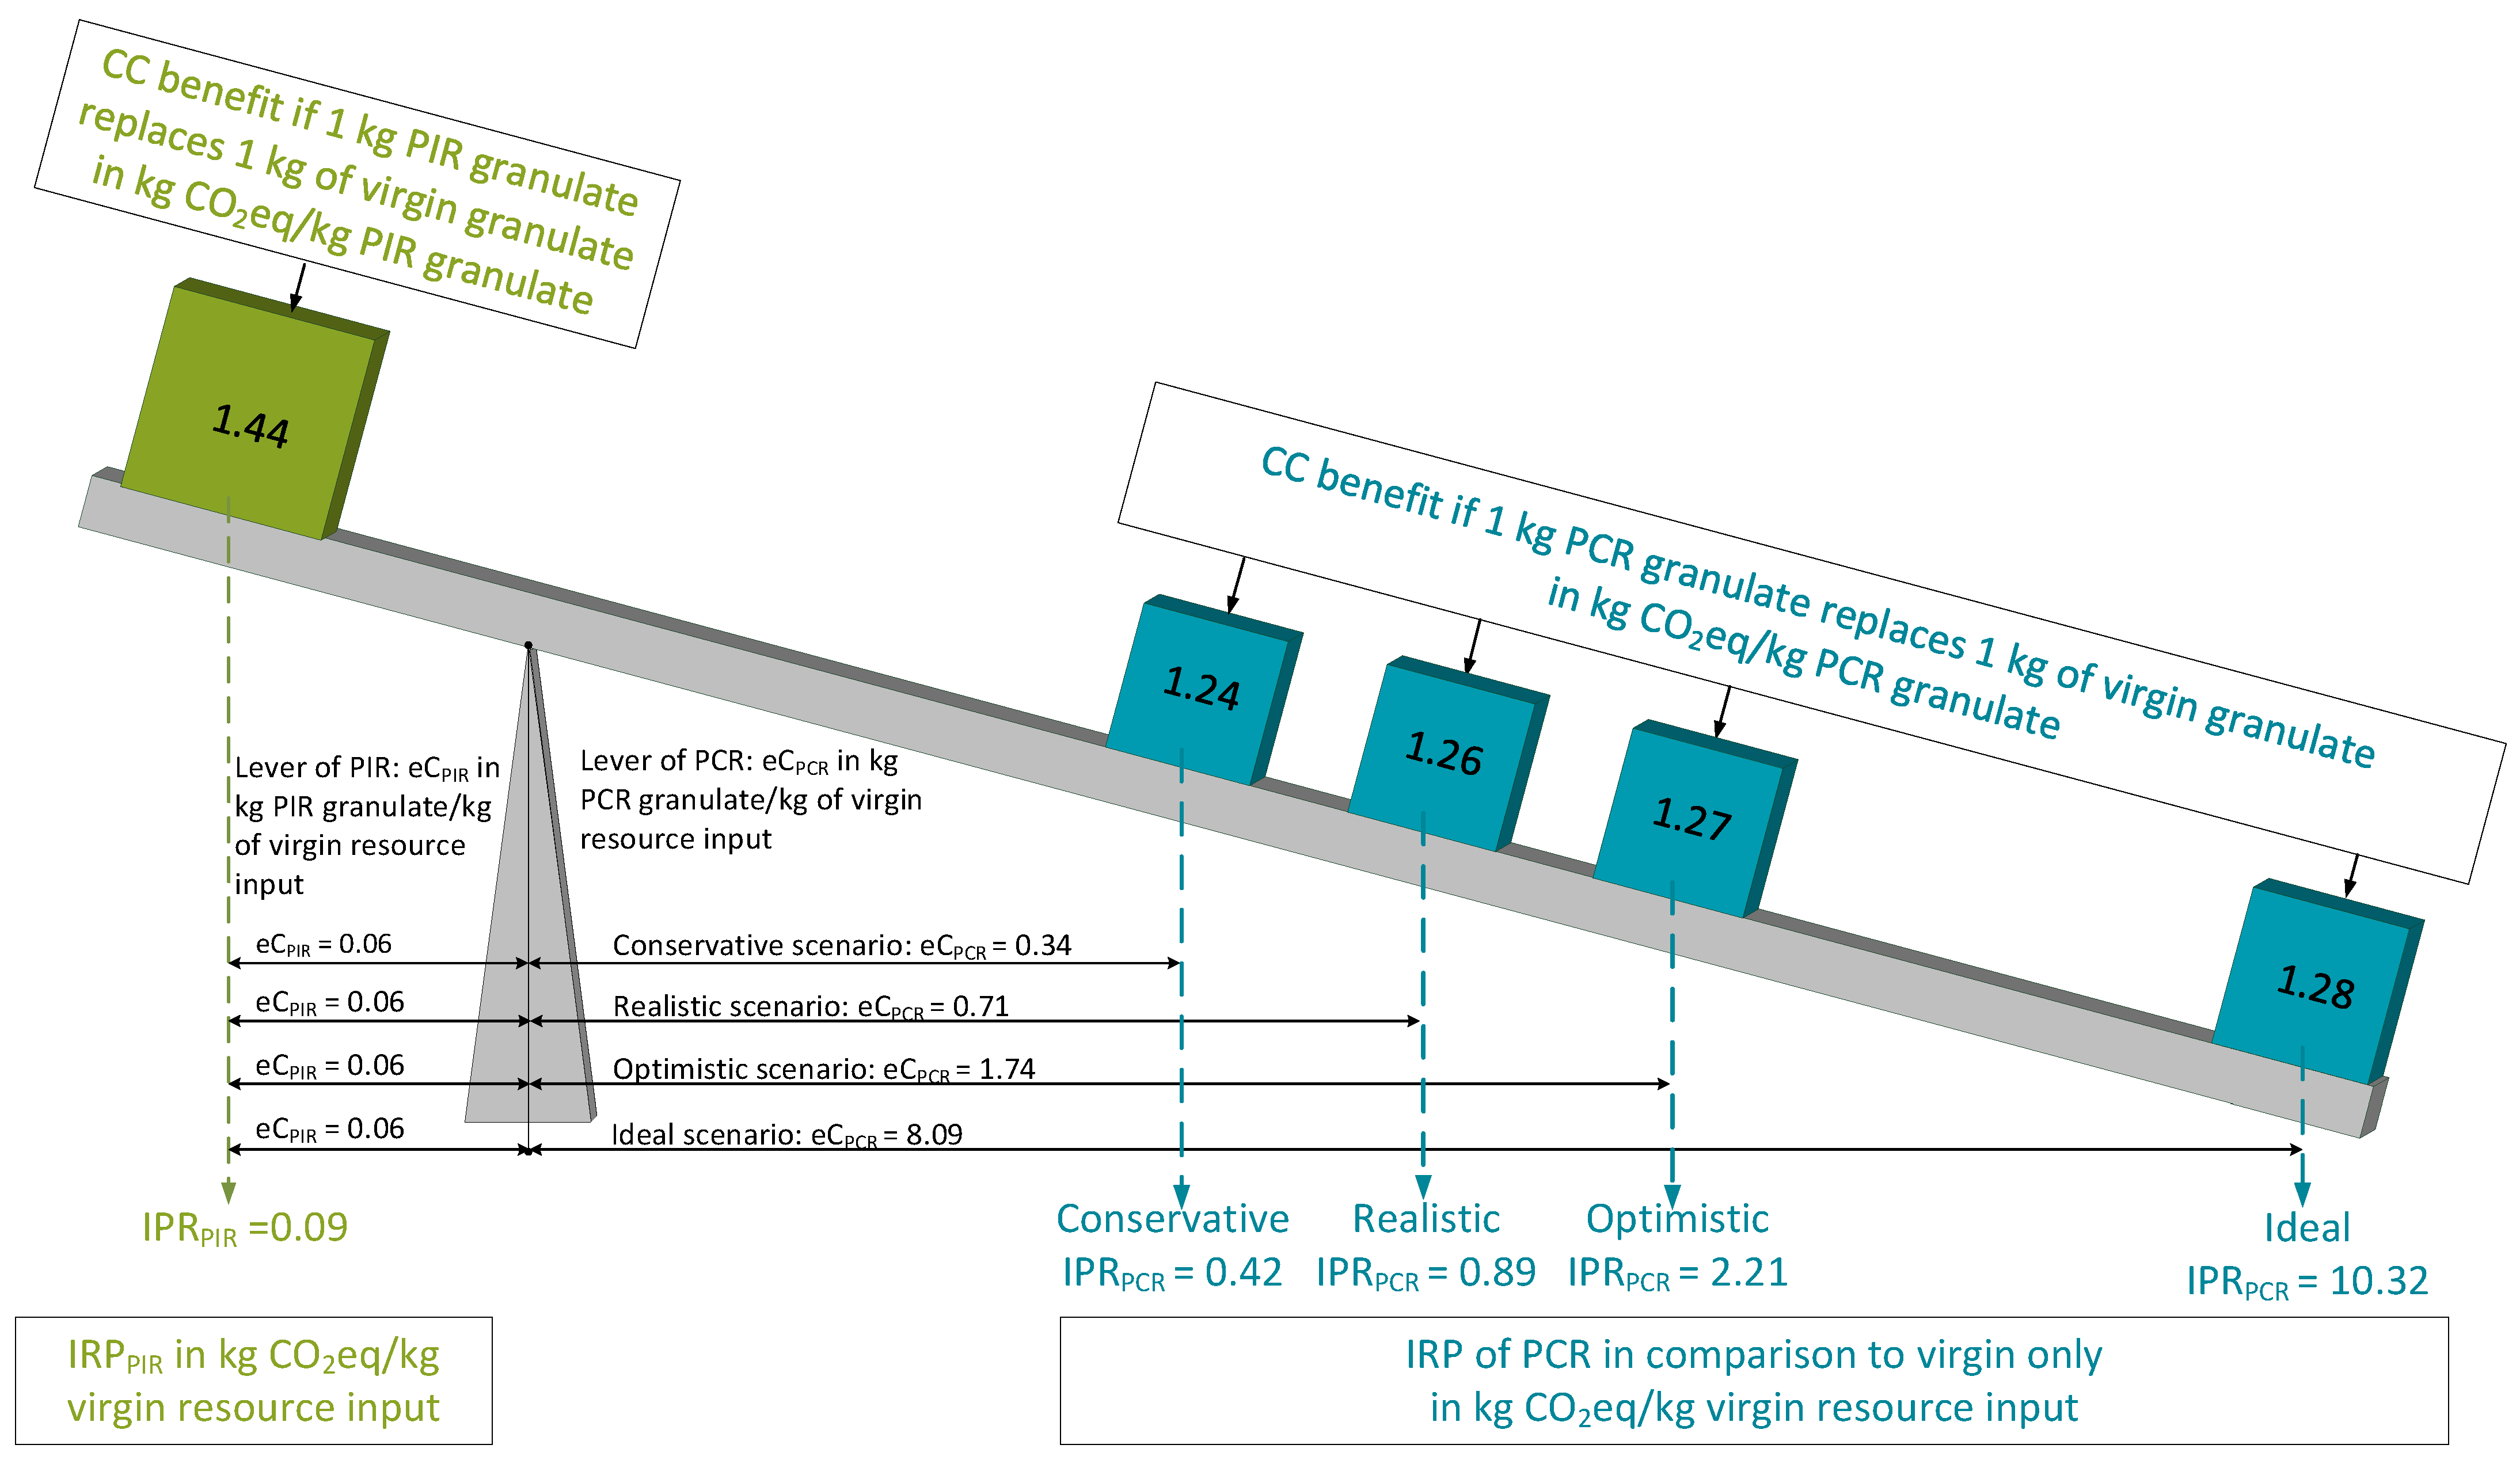
2.2.2. Impact Reduction Potential of Using Recycled Granulate
2.3. Transfer to the Case Study Example of Polypropylene Used for Packaging
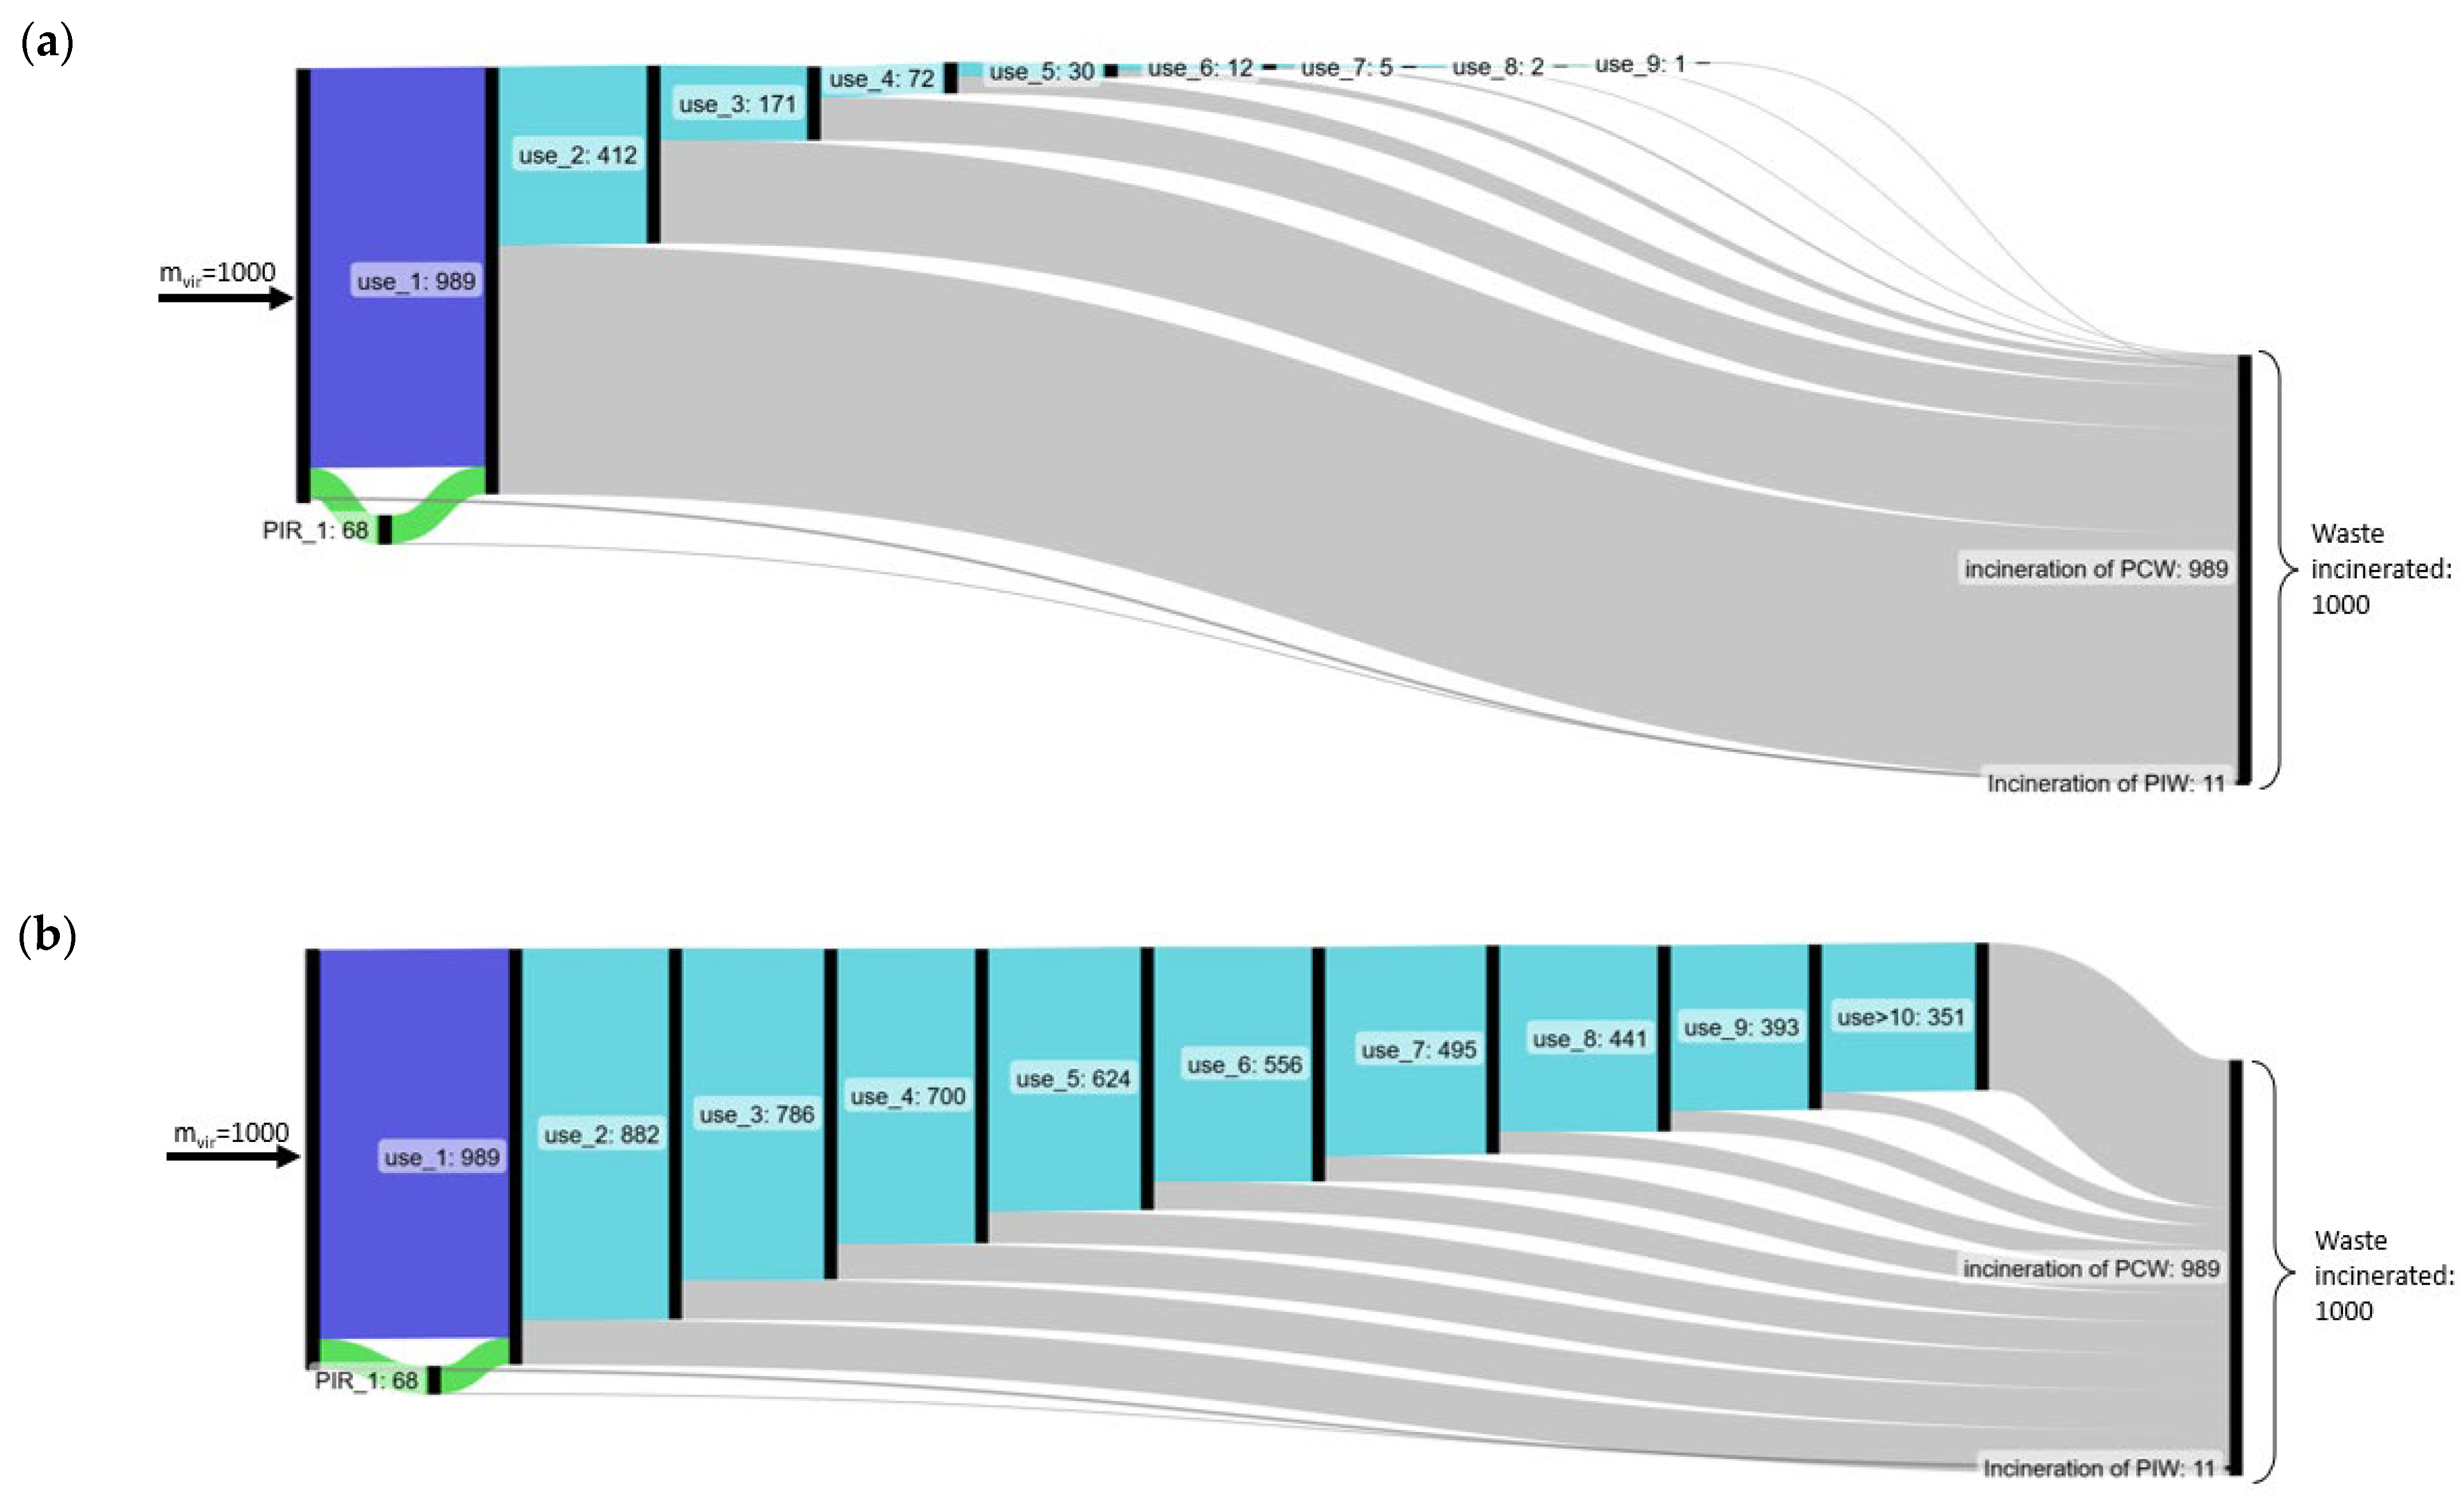
2.3.1. Effective Circularity
2.3.2. Environmentally Efficient Circularity and Impact Reduction Potential
3. Results and Discussion
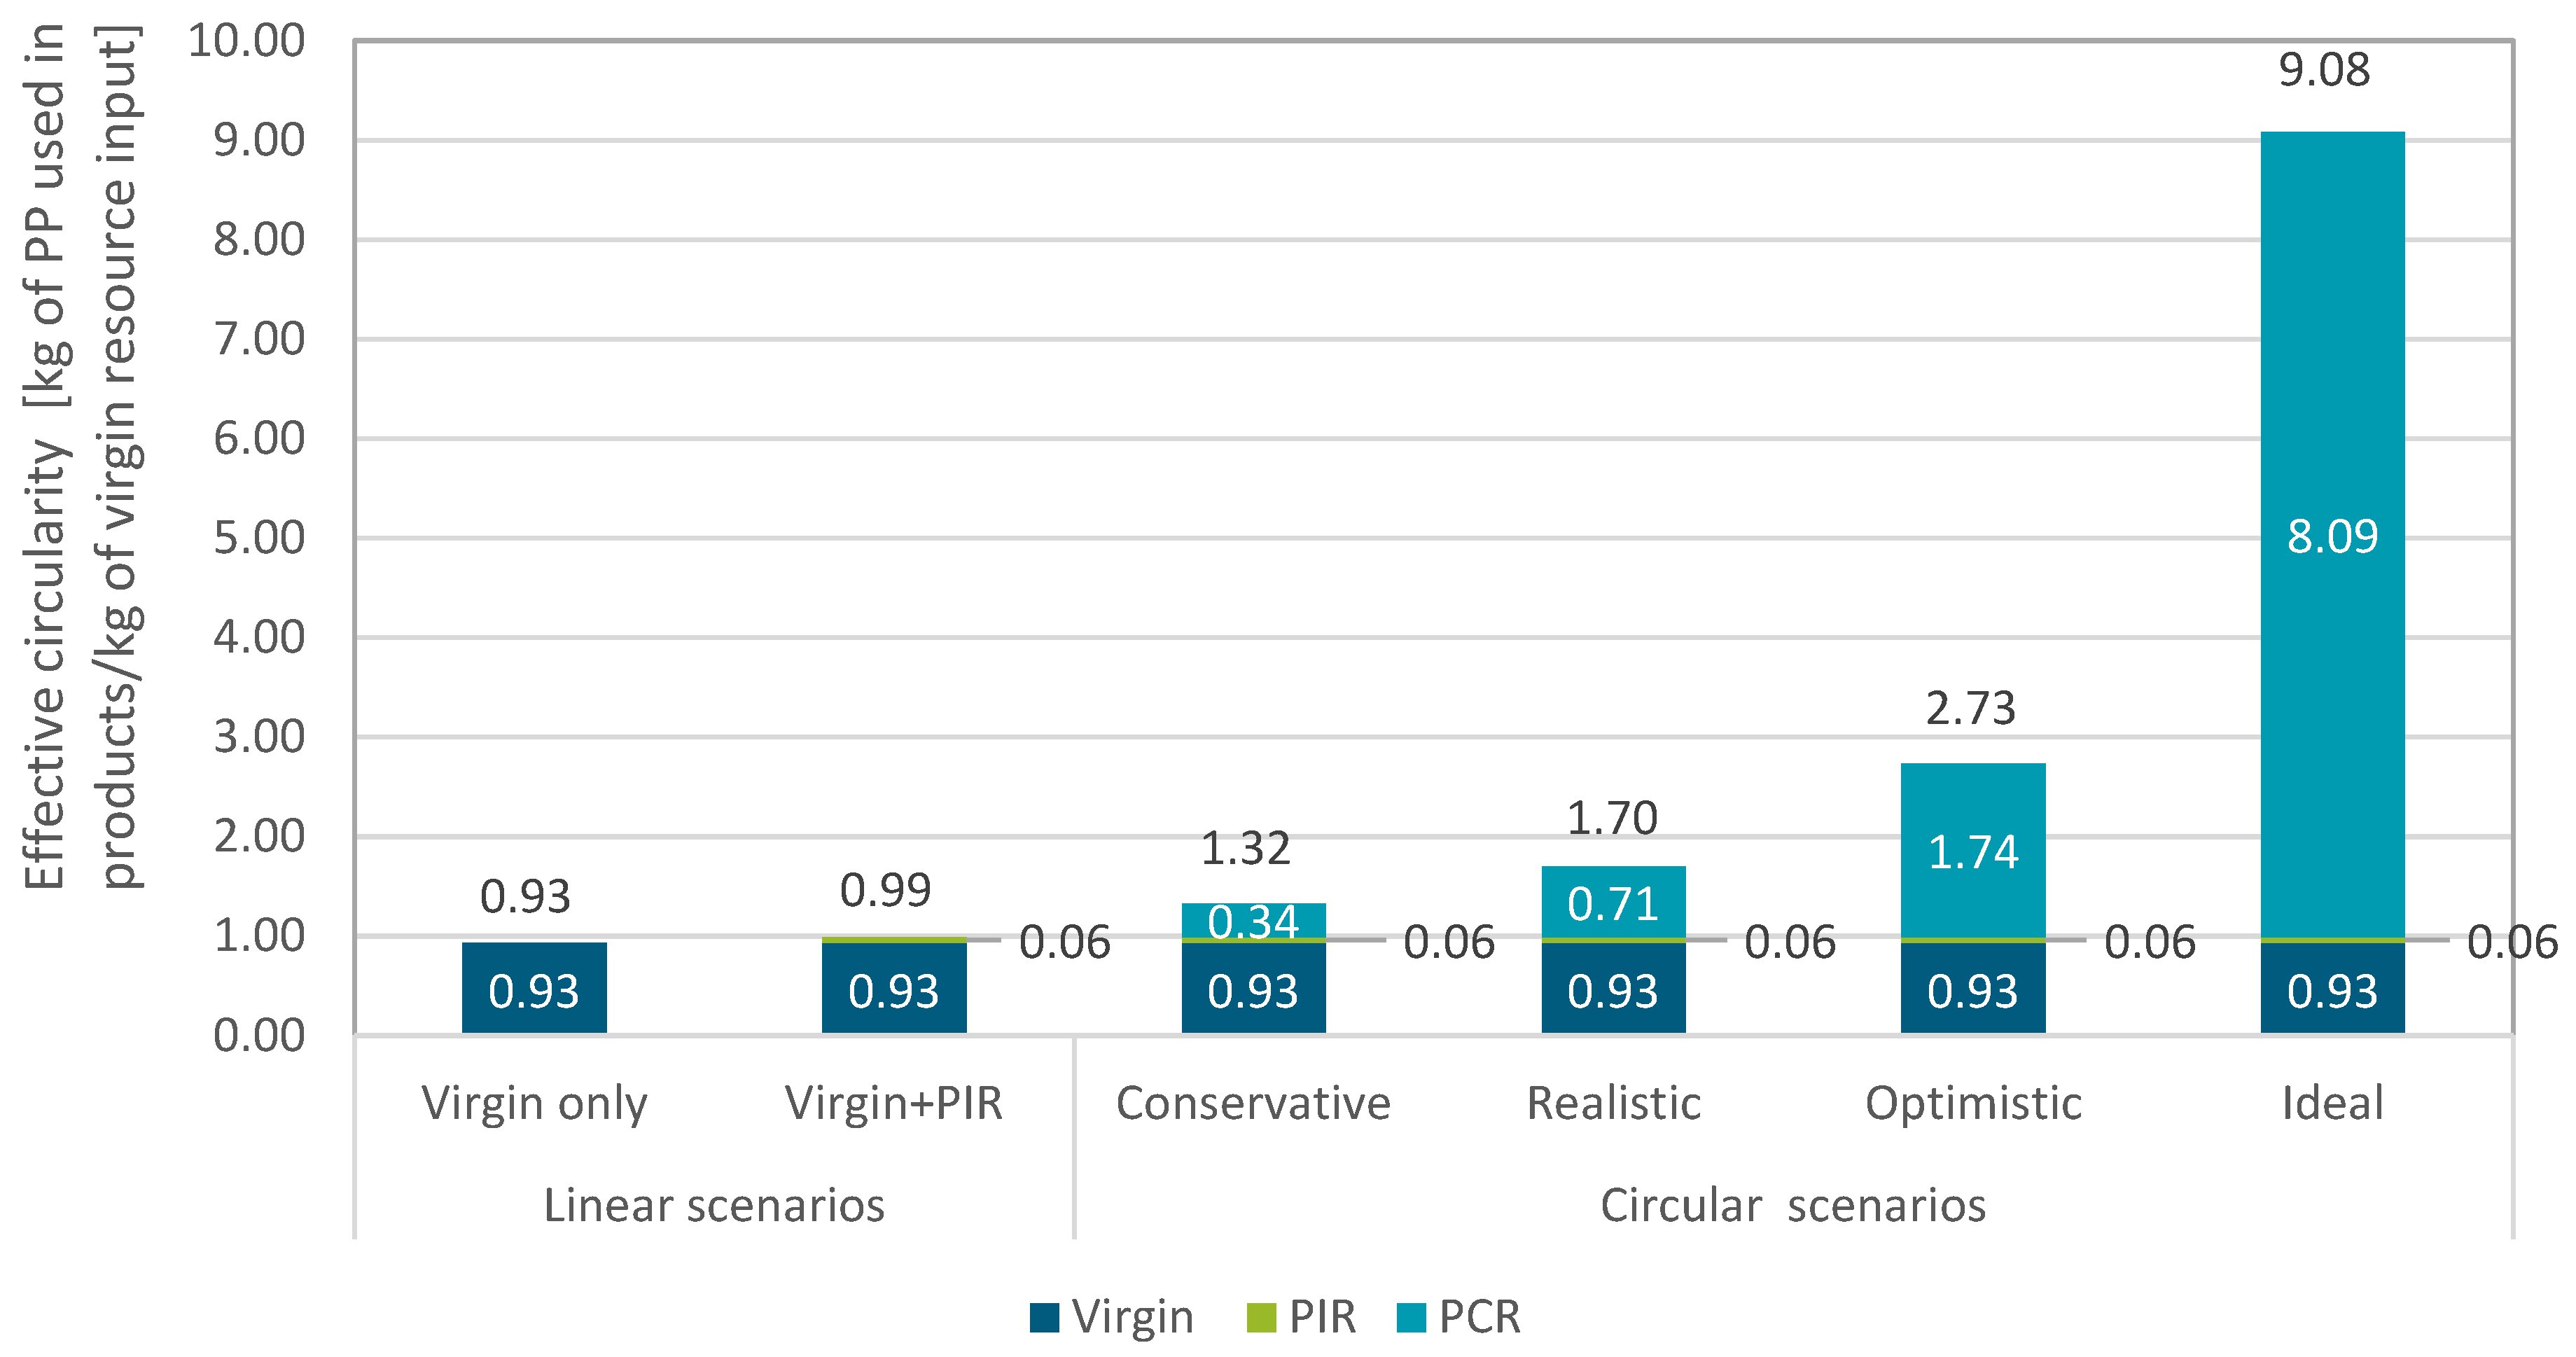
3.1. Effective Circularity
3.2. Environmentally Efficient Circularity
3.3. Impact Reduction Potential
3.4. Applicability, Limitations, and Recommendations
- i.
- The physical properties of technological cycles, such as a recycling rate;
- ii.
- The physical properties of technological cycles, with full or partial life cycle approaches, such as the eC or the MCI [38]; and
- iii.
- The effects (burdens/benefits) of technological cycles such as eeC or the circular economy performance indicator (CPI) proposed by Huysman et al. [39].
4. Conclusions and Outlook
Supplementary Materials
Author Contributions
Funding
Data Availability Statement
Conflicts of Interest
Appendix A
References
- Corona, B.; Shen, L.; Reike, D.; Carreón, J.R.; Worrell, E. Towards sustainable development through the circular economy—A review and critical assessment on current circularity metrics. Resour. Conserv. Recycl. 2019, 151, 104498. [Google Scholar] [CrossRef]
- Nikolaou, I.E.; Jones, N.; Stefanakis, A. Circular economy and sustainability: The past, the present and the future directions. Circ. Econ. Sustain. 2021, 1, 1–20. [Google Scholar] [CrossRef]
- Schroeder, P.; Anggraeni, K.; Weber, U. The Relevance of Circular Economy Practices to the Sustainable Development Goals. J. Ind. Ecol. 2018, 23, 77–95. [Google Scholar] [CrossRef]
- Ellen MacArthur Foundation. Towards a Circular Economy Business Rationale for an Accelerated Transition. 2015. Available online: https://emf.thirdlight.com/file/24/_A-BkCs_h7gfln_Am1g_JKe2t9/Towards%20a%20circular%20economy%3A%20Business%20rationale%20for%20an%20accelerated%20transition.pdf (accessed on 5 May 2023).
- European Commission. A New Circular Economy Action Plan for a Cleaner and More Competitive Europe: COM/2020/98 Final; European Commission: Brussels, Belgium, 2020. [Google Scholar]
- Elia, V.; Gnoni, M.G.; Tornese, F. Measuring circular economy strategies through index methods: A critical analysis. J. Clean. Prod. 2017, 142, 2741–2751. [Google Scholar] [CrossRef]
- Geissdoerfer, M.; Savaget, P.; Bocken, N.M.P.; Hultink, E.J. The circular economy—A new sustainability paradigm? J. Clean. Prod. 2017, 143, 757–768. [Google Scholar] [CrossRef]
- Ghisellini, P.; Cialani, C.; Ulgiati, S. A Review on Circular Economy: The Expected Transition to a Balanced Interplay of Environmental and Economic Systems. J. Clean. Prod. 2016, 114, 11–32. [Google Scholar] [CrossRef]
- King, S.; Locock, K.E. A circular economy framework for plastics: A semi-systematic review. J. Clean. Prod. 2022, 364, 132503. [Google Scholar] [CrossRef]
- European Commission. A European Strategy for Plastics in a Circular Economy: COM (2018) 28 Final; European Commission: Brussels, Belgium, 2018. [Google Scholar]
- Yuan, X.; Wang, X.; Sarkar, B.; Ok, Y.S. The COVID-19 pandemic necessitates a shift to a plastic circular economy. Nat. Rev. Earth Environ. 2021, 2, 659–660. [Google Scholar] [CrossRef]
- Johansen, M.R.; Christensen, T.B.; Ramos, T.M.; Syberg, K. A review of the plastic value chain from a circular economy perspective. J. Environ. Manag. 2022, 302, 113975. [Google Scholar] [CrossRef]
- Plastics Europe. Plastics—The Facts 2022. 2022. Available online: https://plasticseurope.org/knowledge-hub/plastics-the-facts-2022/ (accessed on 12 May 2023).
- Stegmann, P.; Daioglou, V.; Londo, M.; van Vuuren, D.P.; Junginger, M. Plastic futures and their CO2 emissions. Nature 2022, 612, 272–276. [Google Scholar] [CrossRef]
- van der Harst, E.; Potting, J.; Kroeze, C. Comparison of different methods to include recycling in LCAs of aluminium cans and disposable polystyrene cups. Waste Manag. 2016, 48, 565–583. [Google Scholar] [CrossRef] [PubMed]
- Leal, J.M.; Pompidou, S.; Charbuillet, C.; Perry, N. Design for and from Recycling: A Circular Ecodesign Approach to Improve the Circular Economy. Sustainability 2020, 12, 9861. [Google Scholar] [CrossRef]
- Schulte, A.; Velarde, P.S.; Marbach, L.; Mörbitz, P. Measuring the circularity potential of recycled LDPE based on quantity and quality conservation—A functional requirement matrix approach. Resour. Conserv. Recycl. Adv. 2023, 17, 200127. [Google Scholar] [CrossRef]
- DIN ISO 14021; Environmental Labels and Declarations—Self-Declared Environmental Claims (Type II Environmental Labelling). ISO: Geneva, Switzerland, 2021.
- Hubo, S.; Ragaert, K.; Leite, L.; Martins, C. Evaluation of post-industrial and post-consumer polyolefin-based polymer waste streams for injection moulding. In Proceedings of the 6th Polymers & Mould Innovations International Conference, Guimaraes, Portugal, 10–12 September 2014; pp. 201–206. [Google Scholar]
- Nessi, S.; Sinkko, T.; Bulgheroni, C.; Garcia-Gutierrez, P.; Giuntoli, J.; Konti, A.; Sanye-Mengual, E.; Tonini, D.; Pant, R.; Marelli, L.; et al. Life Cycle Assessment (LCA) of Alternative Feedstocks for Plastics Production; Publications Office of the European Union: Luxembourg, 2021. [Google Scholar] [CrossRef]
- Rigamonti, L.; Mancini, E. Life cycle assessment and circularity indicators. Int. J. Life Cycle Assess. 2021, 26, 1937–1942. [Google Scholar] [CrossRef]
- Martinho, V.J.P.D. Insights into circular economy indicators: Emphasizing dimensions of sustainability. Environ. Sustain. Indic. 2021, 10, 100119. [Google Scholar] [CrossRef]
- Moraga, G.; Huysveld, S.; Mathieux, F.; Blengini, G.A.; Alaerts, L.; Van Acker, K.; de Meester, S.; Dewulf, J. Circular economy indicators: What do they measure? Resour. Conserv. Recycl. 2019, 146, 452–461. [Google Scholar] [CrossRef]
- Mishra, S.; Singh, S.P.; Johansen, J.; Cheng, Y.; Farooq, S. Evaluating indicators for international manufacturing network under circular economy. Manag. Decis. 2019, 57, 811–839. [Google Scholar] [CrossRef]
- Jerome, A.; Helander, H.; Ljunggren, M.; Janssen, M. Mapping and testing circular economy product-level indicators: A critical review. Resour. Conserv. Recycl. 2022, 178, 106080. [Google Scholar] [CrossRef]
- Janik, A.; Ryszko, A. Circular economy in companies: An analysis of selected indicators from a managerial perspective. Multidiscip. Asp. Prod. Eng. 2019, 2, 523–535. [Google Scholar] [CrossRef]
- Jain, S.; Jain, N.K.; Metri, B. Strategic framework towards measuring a circular supply chain management. Benchmarking: Int. J. 2018, 25, 3238–3252. [Google Scholar] [CrossRef]
- Helander, H.; Petit-Boix, A.; Leipold, S.; Bringezu, S. How to monitor environmental pressures of a circular economy: An assessment of indicators. J. Ind. Ecol. 2019, 139, 1011. [Google Scholar] [CrossRef]
- Harris, S.; Martin, M.; Diener, D. Circularity for circularity’s sake? Scoping review of assessment methods for environmental performance in the circular economy. Sustain. Prod. Consum. 2021, 26, 172–186. [Google Scholar] [CrossRef]
- Ortiz-De-Montellano, C.G.-S.; van der Meer, Y. A Theoretical Framework for Circular Processes and Circular Impacts Through a Comprehensive Review of Indicators. Glob. J. Flex. Syst. Manag. 2022, 23, 291–314. [Google Scholar] [CrossRef]
- Chrispim, M.C.; Mattsson, M.; Ulvenblad, P. The underrepresented key elements of Circular Economy: A critical review of assessment tools and a guide for action. Sustain. Prod. Consum. 2023, 35, 539–558. [Google Scholar] [CrossRef]
- Calzolari, T.; Genovese, A.; Brint, A. Circular Economy indicators for supply chains: A systematic literature review. Environ. Sustain. Indic. 2022, 13, 100160. [Google Scholar] [CrossRef]
- Camacho-Otero, J.; Boks, C.; Pettersen, I.N. Consumption in the Circular Economy: A Literature Review. Sustainability 2018, 10, 2758. [Google Scholar] [CrossRef]
- Parchomenko, A.; Nelen, D.; Gillabel, J.; Rechberger, H. Measuring the circular economy—A Multiple Correspondence Analysis of 63 metrics. J. Clean. Prod. 2019, 210, 200–216. [Google Scholar] [CrossRef]
- Saidani, M.; Yannou, B.; Leroy, Y.; Cluzel, F.; Kendall, A. A taxonomy of circular economy indicators. J. Clean. Prod. 2019, 20, 542–559. [Google Scholar] [CrossRef]
- Iacovidou, E.; Velis, C.A.; Purnell, P.; Zwirner, O.; Brown, A.; Hahladakis, J.; Millward-Hopkins, J.; Williams, P.T. Metrics for optimising the multi-dimensional value of resources recovered from waste in a circular economy: A critical review. J. Clean. Prod. 2017, 166, 910–938. [Google Scholar] [CrossRef]
- WBCSD. Circular Metrics Landscape Analysis. 2018. Available online: http://docs.wbcsd.org/2018/06/Circular_Metrics-Landscape_analysis.pdf (accessed on 24 March 2023).
- Ellen MacArthur Foundation. Circularity-Indicators: An Approach to Measuring Circularity. Methodology. 2015. Available online: https://ellenmacarthurfoundation.org/material-circularity-indicator (accessed on 12 May 2023).
- Huysman, S.; De Schaepmeester, J.; Ragaert, K.; Dewulf, J.; De Meester, S. Performance indicators for a circular economy: A case study on post-industrial plastic waste. Resour. Conserv. Recycl. 2017, 120, 46–54. [Google Scholar] [CrossRef]
- Glogic, E.; Sonnemann, G.; Young, S.B. Environmental Trade-Offs of Downcycling in Circular Economy: Combining Life Cycle Assessment and Material Circularity Indicator to Inform Circularity Strategies for Alkaline Batteries. Sustainability 2021, 13, 1040. [Google Scholar] [CrossRef]
- Bailey, R.; Janet, K.; Bras, A.; Bras, B. Applying Ecological Input-Output Flow Analysis to Material Flows in Industrial Systems: Part I: Tracing Flows. J. Ind. Ecol. 2004, 8, 69–91. [Google Scholar] [CrossRef]
- Figge, F.; Thorpe, A.S.; Givry, P.; Canning, L.; Franklin-Johnson, E. Longevity and Circularity as Indicators of Eco-Efficient Resource Use in the Circular Economy. Ecol. Econ. 2018, 150, 297–306. [Google Scholar] [CrossRef]
- Klose, S.; Pauliuk, S. Quantifying longevity and circularity of copper for different resource efficiency policies at the material and product levels. J. Ind. Ecol. 2021, 25, 979–993. [Google Scholar] [CrossRef]
- Pauliuk, S. Critical appraisal of the circular economy standard BS 8001:2017 and a dashboard of quantitative system indicators for its implementation in organizations. Resour. Conserv. Recycl. 2018, 129, 81–92. [Google Scholar] [CrossRef]
- Drucker, P.F. Management; Routledge: Abingdon, UK, 2012. [Google Scholar]
- The World Business Council for Sustainable Development. Eco-Efficiency and Cleaner Production: Charting the Course to Sustainability. Available online: https://enb.iisd.org/consume/unep.html (accessed on 12 May 2023).
- Huppes, G.; Ishikawa, M. A Framework for Quantified Eco-efficiency Analysis—Huppes. J. Ind. Ecol. 2005, 9, 25–41. [Google Scholar] [CrossRef]
- Maxime, D.; Marcotte, M.; Arcand, Y. Development of eco-efficiency indicators for the Canadian food and beverage industry. J. Clean. Prod. 2006, 14, 636–648. [Google Scholar] [CrossRef]
- BS 8001:2017; Framework for Implementing the Principles of the Circular Economy in Organizations—Guide. British Standards Institution: Frankfurt am Main, Germany, 2017.
- Albrecht, S.; Brandstetter, P.; Beck, T.; Fullana-I-Palmer, P.; Grönman, K.; Baitz, M.; Deimling, S.; Sandilands, J.; Fischer, M. An extended life cycle analysis of packaging systems for fruit and vegetable transport in Europe. Int. J. Life Cycle Assess. 2013, 18, 1549–1567. [Google Scholar] [CrossRef]
- Pinter, E.; Welle, F.; Mayrhofer, E.; Pechhacker, A.; Motloch, L.; Lahme, V.; Grant, A.; Tacker, M. Circularity Study on PET Bottle-To-Bottle Recycling. Sustainability 2021, 13, 7370. [Google Scholar] [CrossRef]
- (EC) No. 282/2008; 15Th Update of the Register of Valid Applications for Authorisation of Recycling Processes to Produce Recycled Plastic Materials and Articles of Intended to Come into Contact with Foods Submitted under Article 13 of Regulations. European Commission: Brussels, Belgium, 2008.
- DIN EN ISO 14040; Environmental Management—Life Cycle Assessment—Principles and Framework. ISO: Geneva, Switzerland, 2022.
- DIN EN ISO 14044; Environmental Management—Life Cycle Assessment—Requirements and Guidelines. ISO: Geneva, Switzerland, 2006.
- Ekvall, T.; Björklund, A.; Sandin, G.; Jelse, K.; Lagergren, J.; Rydberg, M. Modeling Recycling in Life Cycle Assessment; IVL Swedish Environmental Research Institute: Gothenburg, Sweden, 2020. [Google Scholar]
- Tonini, D.; Schrijvers, D.; Nessi, S.; Garcia-Gutierrez, P.; Giuntoli, J. Carbon footprint of plastic from biomass and recycled feedstock: Methodological insights. Int. J. Life Cycle Assess. 2021, 26, 221–237. [Google Scholar] [CrossRef]
- Brander, M.; Wylie, C. The use of substitution in attributional life cycle assessment. Greenh. Gas Meas. Manag. 2011, 1, 161–166. [Google Scholar] [CrossRef]
- Eriksson, O.; Reich, M.C.; Frostell, B.; Björklund, A.; Assefa, G.; Sundqvist, J.-O.; Granath, J.; Baky, A.; Thyselius, L. Municipal solid waste management from a systems perspective. J. Clean. Prod. 2005, 13, 241–252. [Google Scholar] [CrossRef]
- Astrup, T.; Fruergaard, T.; Christensen, T.H. Recycling of plastic: Accounting of greenhouse gases and global warming contributions. Waste Manag. Res. J. Sustain. Circ. Econ. 2009, 27, 763–772. [Google Scholar] [CrossRef]
- Conversio Market & Strategy GmbH. Stoffstrombild Kunststoffe in Deutschland 2017; Conversio Market & Strategy GmbH: Mainaschaff, Germany, 2018. [Google Scholar]
- Picuno, C.; Alassali, A.; Chong, Z.K.; Kuchta, K. Flows of post-consumer plastic packaging in Germany: An MFA-aided case study. Resour. Conserv. Recycl. 2021, 169, 105515. [Google Scholar] [CrossRef]
- IPCC. Climate Change 2022: Impacts, Adaptation, and Vulnerability; Contribution of Working Group II to the Sixth Assessment Report; Intergovernmental Panel on Climate Change: Cambridge, UK; New York, NY, USA, 2022. [Google Scholar]
- Schulte, A.; Maga, D.; Thonemann, N. Combining Life Cycle Assessment and Circularity Assessment to Analyze Environmental Impacts of the Medical Remanufacturing of Electrophysiology Catheters. Sustainability 2021, 13, 898. [Google Scholar] [CrossRef]
- Rockström, J.; Steffen, W.; Noone, K.; Persson, Å.; Chapin, F.S., III; Lambin, E.; Lenton, T.M.; Scheffer, M.; Folke, C.; Schellnhuber, H.J.; et al. Planetary Boundaries: Exploring the Safe Operating Space for Humanity. Ecol. Soc. 2009, 14, 32. [Google Scholar] [CrossRef]
- Matthews, J.B.R.; Möller, V.; van Diemen, R.; Fuglestvedt, J.S.; Masson-Delmotte, V.; Méndez, C.; Semenov, S.; Reisinger, A. IPCC 2021: Annex VII: Glossary. In Climate Change 2021: The Physical Science Basis. Contribution of Working Group I to the Sixth Assessment Report of the Intergovernmental Panel on Climate Change; Cambridge University Press: Cambridge, UK; New York, NY, USA, 2021. [Google Scholar]
- Rogelj, J.; den Elzen, M.; Höhne, N.; Fransen, T.; Fekete, H.; Winkler, H.; Schaeffer, R.; Sha, F.; Riahi, K.; Meinshausen, M. Paris Agreement climate proposals need a boost to keep warming well below 2 °C. Nature 2016, 534, 631–639. [Google Scholar] [CrossRef]
- Chen, P.-Y.; Chen, S.-T.; Hsu, C.-S.; Chen, C.-C. Modeling the global relationships among economic growth, energy consumption and CO2 emissions. Renew. Sustain. Energy Rev. 2016, 65, 420–431. [Google Scholar] [CrossRef]
- da Costa, H.M.; Ramos, V.D.; de Oliveira, M.G. Degradation of polypropylene (PP) during multiple extrusions: Thermal analysis, mechanical properties and analysis of variance. Polym. Test. 2007, 26, 676–684. [Google Scholar] [CrossRef]
- Franklin Associates. Life Cycle Impacts for Postconsumer Recycled Resins: PET, HDPE, and PP; The Association of Plastic Recyclers: Washington, DC, USA, 2018. [Google Scholar]
- European Commission. Amending Decision 2005/270/EC Establishing the Formats Relating to the Database System Pursuant to European Parliament and Council Directive 94/62/EC on Packaging and Packaging Waste: EU-2019/665; European Commission: Brussels, Belgium, 2019. [Google Scholar]
- European Parliament and Council. Packaging and Packaging Waste: Directive 94/62/EC; European Commission: Brussels, Belgium, 1994. [Google Scholar]
- Umweltbundesamt. Aufkommen und Verwertung von Verpackungsabfällen in Deutschland im Jahr 2019. 2021. Available online: https://www.umweltbundesamt.de/sites/default/files/medien/479/publikationen/texte_148-2021_aufkommen_und_verwertung_von_verpackungsabfaellen_in_deutschland_im_jahr_2019.pdf (accessed on 24 March 2023).
- Antonopoulos, I.; Faraca, G.; Tonini, D. Recycling of post-consumer plastic packaging waste in the EU: Recovery rates, material flows, and barriers. Waste Manag. 2021, 126, 694–705. [Google Scholar] [CrossRef]
- Tua, C.; Biganzoli, L.; Grosso, M.; Rigamonti, L. Life Cycle Assessment of Reusable Plastic Crates (RPCs). Resources 2019, 8, 110. [Google Scholar] [CrossRef]
- Schwarz, A.E.; Ligthart, T.N.; Bizarro, D.G.; De Wild, P.; Vreugdenhil, B.; van Harmelen, T. Plastic recycling in a circular economy; determining environmental performance through an LCA matrix model approach. Waste Manag. 2021, 121, 331–342. [Google Scholar] [CrossRef]


| Scenario | pPIW | CRPIW | RRPIW | pPCW,1 | CSRPCW | RRPCW | |
|---|---|---|---|---|---|---|---|
| Linear scenarios | Virgin only | 7.6% b [60] | 0% | 0% | 92.4% b [60] | 0% | 0% |
| Virgin + PIR | 7.6% b [60] | 89.1% b [60] | 96% a | 99% b | 0% | 0% | |
| Circular scenarios | Conservative | 38.9% b [60] | 65% c | ||||
| Realistic | 55.5% b [49] | 75% c | |||||
| Optimistic | 75% c | 85% c | |||||
| Ideal | 99% c | 90% c | |||||
| Effective Circularity (eC) | Material Circularity Indicator (MCI) [38] | Environmental Efficient Circularity (eeC) | Circular Economy Performance Indicator (CPI) [39] | |
|---|---|---|---|---|
| Scope | (ii) Technological cycles with full or partial life cycle approaches | (iii) Effects (burdens/benefits) of technological cycles | ||
| Perspective | Material perspective | Product perspective | Material perspective | Product perspective |
| Unit | Frequency of uses | Degree or rate from 0 to 1 | Frequency of uses in relation to environmental impacts associated with the material | Environmental impacts per functional unit, such as extracted cumulative exergy from natural environment per 1 kg of plastic waste |
| Number of material uses considered | Multiple | Single | Multiple | Single |
| Life cycle stages | Provision of the material and its recycling | Feedstock provision (reuse and recycled content), use stage (lifespan and utility), destination after use (reuse, recycling) | Provision of the material and its EoL (recycling, recovery, and landfill) | EoL (recycling, recovery, and landfill) |
| Information needed | Production, collection, sorting, and recycling rates of PIW and PCW | Recycled and reused content, recycling efficiency for recycled feedstock provision and for destination after use; lifespan, utility, and material fraction for reuse and recycling after use | eC and the environmental impacts associated with the material (virgin provision, PIR and PCR, and EoL) | Avoided impacts of the virgin production (material or energy), percentage of substitutable virgin material, recycling rate, environmental impact of the recycling process |
| Ability to compare PIR and PCR | Yes | No (intended for PCR) | Yes | No (only for PIR) |
Disclaimer/Publisher’s Note: The statements, opinions and data contained in all publications are solely those of the individual author(s) and contributor(s) and not of MDPI and/or the editor(s). MDPI and/or the editor(s) disclaim responsibility for any injury to people or property resulting from any ideas, methods, instructions or products referred to in the content. |
© 2023 by the authors. Licensee MDPI, Basel, Switzerland. This article is an open access article distributed under the terms and conditions of the Creative Commons Attribution (CC BY) license (https://creativecommons.org/licenses/by/4.0/).
Share and Cite
Schulte, A.; Kampmann, B.; Galafton, C. Measuring the Circularity and Impact Reduction Potential of Post-Industrial and Post-Consumer Recycled Plastics. Sustainability 2023, 15, 12242. https://doi.org/10.3390/su151612242
Schulte A, Kampmann B, Galafton C. Measuring the Circularity and Impact Reduction Potential of Post-Industrial and Post-Consumer Recycled Plastics. Sustainability. 2023; 15(16):12242. https://doi.org/10.3390/su151612242
Chicago/Turabian StyleSchulte, Anna, Benjamin Kampmann, and Christina Galafton. 2023. "Measuring the Circularity and Impact Reduction Potential of Post-Industrial and Post-Consumer Recycled Plastics" Sustainability 15, no. 16: 12242. https://doi.org/10.3390/su151612242
APA StyleSchulte, A., Kampmann, B., & Galafton, C. (2023). Measuring the Circularity and Impact Reduction Potential of Post-Industrial and Post-Consumer Recycled Plastics. Sustainability, 15(16), 12242. https://doi.org/10.3390/su151612242