Article

An Analysis of Residual Financial Contagion in Romania’s Banking Market for Mortgage Loans

Department of Economic Informatics and Cybernetics, Bucharest University of Economic Studies, 0105552 Bucharest, Romania
*
Author to whom correspondence should be addressed.
Sustainability 2023, 15(15), 12037; https://doi.org/10.3390/su151512037
Submission received: 29 May 2023 / Revised: 2 August 2023 / Accepted: 4 August 2023 / Published: 6 August 2023
(This article belongs to the Section Economic and Business Aspects of Sustainability)

Abstract

:
The uncertainty of the environment, the complexity of economic systems, both at the national and global economy levels, and the digital age and artificial intelligence draw attention to the existence or appearance of systemic, disruptive phenomena that can appear and propagate in different forms, producing effects that can turn into economic crises. These phenomena can be transmitted like a domino effect, and they are referred to as the contagion effect in the scientific literature. In this research, one of the four forms of financial contagion, known as residual contagion, is studied on the mortgage loan market in Romania using agent-based modeling. By considering the economic crisis of 2007–2009, also supported by the mortgage crisis, in the present paper, we aim to study the Romanian mortgage market in 2022 through the use of machine learning techniques and agent-based modeling. The purpose of this research is to capture the potential systemic risks that can outline a residual financial contagion effect. The simulation results highlight the fact that the degree of connectivity between the commercial banks in Romania and the way in which they are interconnected have a major importance in the emergence and propagation of contagion effects. The proposed approach and the obtained results can offer more insight to policymakers on how the contagion effect takes place within the banking sector.

1. Introduction

The era we live in is driven by artificial intelligence, which transforms the way the fundamental sectors of contemporary society, namely the medical, automotive, economic, financial, marketing, and retail sectors operate, but also the way each individual’s life unfolds, as we interfere with this type of technology on a daily basis [1,2,3]. Furthermore, the occurrence of machine learning (ML) has succeeded in significantly changing every aspect of our lives. Currently, machine learning algorithms perform tasks that, not long ago, only experts had the ability to perform [3,4].
The main motivation of this paper is to analyze and observe the impacts that artificial intelligence (AI) and its branches, machine learning (ML) and Deep Learning (DL), have on contemporary society and on important world industries such as the banking industry [5,6]. The multitude of data and information collected by a bank in Romania can have a significant contribution to help us analyze and manage artificial intelligence, as well as to build advanced risk models that predict, quantify, and appropriately estimate its associated risks. Technological innovations change the course of our lives and have a major impact on all economic systems [6,7]. The departments within the commercial banks in Romania use these AI technologies in the analysis and design of risk models related to lending products, including mortgages. For example, Romanian banks such as Banca Transilvania or ING Bank use artificial intelligence at the levels of several departments, collaborating with UiPath, which is the global company that deals with the development and automation of robotic processes, including Microsoft [8,9,10]. The banks also use these techniques to make a forecast on the performance of the model based on some residual values evaluated based on the traffic light technique. Changes that exceed these values and fall on the red zone of the traffic light, meaning that the estimated value is lower than the real value, considering the residual valuation, can outline a contagion effect [11,12].
The banking network in Romania continues to adjust as we live in an era of digitization, and banks try to continuously adapt to the requirements of economic agents and of the environment. This response is a result of the complex behavior that banks exhibit as complex adaptive systems that co-evolve and organize themselves with regard to be able to offer as many banking services as possible in the new digital environment, which sometimes translates to giving up to physical agencies. This process plays a double role, as besides co-evolution and adaptation, it contributes to optimizing certain expenses of an operational nature.
The banking and financial market is influenced by major risks, including environmental issues, climate change, pollution, and other natural disasters that can impact the economy. These events can lead to financial losses in a chain reaction, affecting companies, investors, banks, and the financial market. Therefore, in order to address and mitigate these risks, banks need to adopt a sustainable approach to minimize the negative impact of potential financial contagion. Banking institutions’ integration of ESG factors (Environmental, Social, and Governance) in investment decisions and in addressing risks and opportunities related to sustainability, as mentioned earlier, enables investors to make informed decisions and reduce the risk of financial contagion. On the other hand, regulations and government policies regarding sustainability can also have a significant impact on the occurrence of financial contagion. Implementing coherent and efficient measures to promote sustainable development can reduce systemic risks as well.
From this point of view, the current paper also considers the cybernetic approach to the analyzed topic. This helps us to better understand both the transmission channels of the effects of financial contagion, as well as the impact that a faulty management of the cybernetic subsystem of credits can have. Considering this standpoint, agent-based modeling, which is specific to economic cybernetics, can be used to simulate the effect of residual banking contagion by creating a system of agents that represent individual banks and their interactions in a financial environment, which will be addressed in a practical section of the case study within this research.
The Commercial Bank, from the cybernetic perspective, is a complex adaptive system analyzed from the perspective of five subsystems [13]: credit management, deposit management, risk management, treasury management, and fund insurance management. The cybernetic approach helps us to understand the transmission channels of systemic risks in the banking sector by highlighting the eloquent properties of complex adaptive systems: co-evolution, adaptability, interconnection, and emergence or feedback mechanisms. Compared to the other sectors, the financial sector is different as it depends on people and their behaviors, to which it provides services. Banking is an area where ML procedures are applied to complex databases to combat financial fraud and cyber-attacks, save customers’ time and money, and streamline back-office activities [14]. With the development of AI, currently, banks use AI chatbots to respond to customer requests. In the financial management and advisory services sector, firms are looking at the potential of AI solutions to improve possible speculative solutions. Thus, ML has become necessary in many areas of the financial system. Among the various applications of ML in the financial system, it has been observed that one of the most important applications is fraud detection [15,16]. Another important application implemented in the financial sector is the verification of the conditions necessary to grant loans or insurance to customers [17,18,19,20].
This process can be described as ideal for ML in this sector. Calculations made by artificial intelligence can provide important predictions about the status of each customer and the conditions that they have fulfilled in order to be granted a loan.
In Romania, it has been observed that the mortgage market has registered a significant increase in recent years, according to the Stability Reports published by the NBR [21]. From the perspective of the use of artificial intelligence models in banks in Romania, this has become more and more popular, with these algorithms being used in various fields, such as risk management, credit management, data analysis, and customer behavior analysis [22,23,24].
Given the importance of ML algorithms in the current era, on one hand, this paper aims to aim to study the Romanian mortgage market in 2022 through the use of ML techniques for the purpose of better capturing the potential systemic risks that can outline a residual financial contagion effect. On the other hand, considering the confidential nature of the real data and information held by the bank, simulating a financial contagion effect is quite challenging. For this reason, this research employs agent-based modeling specific to economic cybernetics to simulate the residual contagion effect.
This paper is organized as follows: Section 2 provides a discussion related to the state of the art in the field from the perspective of the contagion phenomenon in the financial sector. Section 3 presents in detail the financial stability of Romanian banks, making a comparison between the values recorded for the prudential indicators in Romania compared to the European Union (EU) average. Section 4 presents the methodology used in this study, while Section 5 discusses the results with an accent on residual financial contagion. The paper ends with concluding remarks and future work directions.

2. The Stage of Knowledge in the Field

Until 1997, the concept of contagion meant the spread of a medical disease, as the association of the phenomenon with banking turbulence did not exist before that year [20]. According to the “Merriam-Webster” dictionary [25], contagion is associated with “(i) a contagious disease; (ii) transmission of a disease through direct or indirect contact; (iii) a disease-producing agent such as a virus; (iv) poison or contagious influence that spreads rapidly; (v) the rapid communication of an influence (such as a doctrine or an emotional state)”.
On the other hand, the Cambridge dictionary [26] associates the term contagion with the following meanings: “(i) the context in which a disease spreads by touching someone or something; (ii) the situation in which feelings, ideas or problems spread from one place to another; (iii) economic problems in a country, region, etc., they spread to another”.
The Oxford Learner’s Dictionary [27] describes the phenomenon of contagion as “(i) the spread of a disease through close contact between people; (ii) something bad that spreads rapidly by transmission from one person to another”.
From the definitions identified in the above dictionaries, it can be observed that some essential information can be extracted that connects the effect of contagion with the behavior exhibited by complex adaptive systems. For example, it can be observed that the phenomenon of contagion spreads through direct or indirect contact, which illustrates the emergent properties, interdependence, and connectivity of complex adaptive systems. Moreover, connectivity is emphasized by describing the analyzed phenomenon as “the spread of a disease through close contact between people”, illustrating the importance of the degree of connectivity.
Zheng [28] states in his research that, in the modern financial system, the division of labor and the close cooperation between different departments are determinants of the risk contagion. The authors show that the risk from stock market volatility can easily spread to other industries and departments, leading to systemic financial and economic crises [27]. Compared to the previous research, which has mostly examined financial security from the perspective of macro currency security and the security of the banking system, but has ignored its underlying problems, such as the limited rationality of investors due to a lack of financial knowledge, the work conducted by Zhang [28] analyzes micro-level investor behavior, meso-level stock market price fluctuations, and macro-level financial security in a unified framework.
Currently, ML has become necessary in many areas of the financial system, having the most important application in fraud detection. Mathur [29] predicted that the year 2027 will be one in which more and more systems will use AI, and the applications of this technology will impact the whole world, together with its important industries, including the financial sector. This scenario features a 27-year-old entrepreneur named Godson, who works in community offices that are close to his home and is assisted by robots and Personal Drones (PA) to accomplish his work [29]. The PA drone communicates the day’s priorities to him daily. Also, at Godson’s request, the PA drone connects with the TradeBot, which is the robot that keeps track of all of Godson’s financial transactions, to present him with the monthly report on his stock market investments. The automated bots based on artificial intelligence notify Godson of potential losses and provide predictions and advice on how he can act so that losses are minimized and profit is maximized. The robots can also accept input from Godson when requested, so that processes performed by them are processed based on the manual input given by Godson [29]. These bots use algorithms that predict possible falls or rises in stock prices based on whatever information they have access to. Another innovation that artificial intelligence can introduce in the future is communication between robots and the creation of an ecosystem of robots, where they can interact. Even if in the year 2023 this scenario seems like something that is still impossible to achieve for the year 2027, we believe that it will for sure be possible in the near future.
Fares et al. [30] developed research in which they analyzed, from a holistic perspective, the specialist literature on how artificial intelligence algorithms are used in the banking sector. The analyzed period was 2005–2020. The authors examined 44 research works using a systematic review and a content analysis of the topic as their methods. The research conclusions were focused on how the banking sector expands on three key research areas in which AI algorithms are used: customer, strategy, and processes. Ris et al. [31] present in their research the fact that with today’s technological advances, with the automation of processes, banks must adapt to the evolution in order not to lose the opportunity to transform their business models and to prevent certain risks such as bank fraud. They concluded that the automation process in the banking sector, along with the use of AI algorithms, can improve the performance of the banking business process.
More and more, research is emphasizing the importance of using AI models in the analysis process regarding the granting and monitoring of loans. However, according to the research carried out by Sadok et al. [32], it is emphasized that certain limitations regarding ethical, legislative, and legal issues must also be considered.
The phenomenon of financial contagion is gaining the attention of more and more supervisory institutions in Romania and is analyzed in increasing numbers of scientific articles. Although there is a low probability of the manifestation of the risk of contagion, it can appear at any time, considering that a minor shock, untreated, can spread systemically in the banking network and have major effects. Trenca and Dezsi [33] examine in their paper the behavior of the Romanian stock market from the perspective of the formation of the phenomenon of financial contagion in the global market. They used the MS-VAR model on three countries, between 1997 and 2012, and their results conclude that during the financial crisis, no financial contagion effects were observed on the Romanian market due to the easy integration of the Romanian stock market with the world market.
In another research, Carausu [34] used a wavelet analysis in order to analyze whether there was a financial contagion effect between the capital market in the US and Romania at the beginning of the economic crisis of 2007–2009. They discovered that the capital market in Romania and the US were in perfect synchronization during the crisis for large transaction periods, meaning that the Romanian market was sensitive to short-term systemic shocks from the US market. This aspect could have outlined a fundamental long-term contagion.
On the other hand, Tilica [35] studies the presence of the day-of-the-week (DOW) effect in the process of forming the financial contagion effect that can be observed in individual economic sectors on the post-communist markets of Eastern Europe. The author noticed that the markets that offer specific national sector indices from the financial crisis period of 2007–2009 are Romania, Russia, and Poland. He used the GJR-GARCH model on a regression model that considers both the crisis period and working days.
Bookstaber [36] carried out research in which he described how the agent-based approach can be used in modeling financial crises. It clearly shocks the agents’ interactions and the way they respond to changes in the environment. Practically, Bookstaber believes that this explains the phenomenon of contagion and the cascades that can appear due to financial leverage, the concentration of the market formed by agents, and because of the liquidity factor. In addition, Bookstaber [36] highlights how agent-based modeling overcomes the limitations of traditional economic models when analyzing financial crises.
Systemic risk and financial contagion are closely related concepts that refer to how problems in a financial institution or financial sector can impact and spread throughout the entire financial system [37]. Financial contagion is the phenomenon in which issues or disruptions in a financial institution or financial market can transmit and affect other financial institutions or economic sectors. It can have a negative impact in the form of a chain reaction, spreading from one institution to another and potentially leading to the collapse of the entire financial system. Systemic risk is associated with the possibility that an event or a series of events can cause significant disruptions throughout the financial system. This risk arises when there are interconnectedness and interdependence among financial institutions and financial markets, so that problems in one specific location can rapidly propagate and affect the entire system [37,38,39].
Residual financial contagion refers to the secondary and lingering effects after an initial financial crisis has been resolved or when a financial institution experiences major problems. Even if the initial source of contagion has been addressed, the consequences can persist and spread throughout the financial system. For example, in the case of a bank collapse, there is a possibility that other banks or financial sectors may be negatively affected even after the initial crisis has been addressed.
Thus, systemic risk can lead to the effect of financial contagion, and the latter can result in residual financial contagion, amplifying and propagating the negative effects within the financial system. It is important to understand these connections and develop appropriate risk management mechanisms to prevent or mitigate the impact of financial crises.
Given the close connection between systemic risk and financial contagion, this study can make significant contributions to green practices and sustainability as well. Commercial banks in Romania provide loans to companies for green investments and financing, highlighting the importance of ESG (Environmental, Social, and Governance) factors. As this is a relatively new niche, the risks involved can be quantified differently, and the emergence of residual financial contagion risk can rapidly form and propagate if not addressed proactively. Therefore, through simulations conducted using agent-based modeling, the performance and resilience of financial institutions and green financing can be analyzed to identify the synergy between them. Currently, various studies address green practices and sustainability across different fields. For instance, Tsagkanos et al. [40] conducted a study that examines the relationship between corporate green bonds and commodities, employing methodologies such as Value-at-Risk-based copulas. On the other hand, Mahmood et al. studied how the perception and disclosure of corporate social responsibility (CSR) by firms determine their financial performance. According to Naeem et al. [41], financial markets are also exposed to extreme and uncertain circumstances that amplify tail risk, including sustainable, religious, and conventional markets. Therefore, they apply a neural network to identify religious and conventional investments with a high exposure to tail risk.
The Chinese government is actively promoting the issuance of green credit by commercial banks as a key aspect of China’s green finance system. Lian et al. [42], in their research, focus on the impact of green credit on the financial performance of banks, considering the diverse regional context of green development. Using panel data from 34 Chinese commercial banks between 2007 and 2018, the study empirically analyzes the effects of green credit on financial performance using a fixed effects model. The findings demonstrate that green credit has a positive impact on commercial banks’ financial performance, particularly through its effect on the rate of return on interest-bearing assets. Moreover, the level of green development enhances the economic benefits of green credit, and higher green economic growth and government support through environmental policies amplify the positive influence of green credit on banks’ financial performance. In conclusion, commercial banks are encouraged to actively engage in green credit activities, while the government should strengthen policies that incentivize green credit to foster the coordinated development of green finance and a sustainable economy.

3. The Level of Financial Stability Banking in Romania

The degree of uncertainty on macroeconomic developments, both at the national and global levels, has increased substantially in the recent period of time [43]. This increase was supported by the outbreak of the armed conflict between Russia and Ukraine and by the major implications of the energy crisis [43]. In this context, the analysis of systemic risks is an important action for the supervisory authorities, which, in the case of Romania, is made by the National Bank of Romania, which publishes periodic financial stability reports [43].
Thus, according to the report on financial stability published in June 2022 [43], the National Bank of Romania (NBR) identified two severe systemic risks and two high systemic risks. These are presented in Table 1.
For each risk presented in Table 1, the colors used represent the intensity of the risk and the arrows indicate its perspective for the next period.
One of the important risks for the banking sector remains the credit risk. Regarding the state of non-performing loans at the population level, the non-performing rate decreased insignificantly in June 2022 compared to March 2022, according to the NBR report [6]. This decrease may be a False Positive result as many debtors have appealed to GEO 37/2020 for the suspension of payment installments due to financial difficulties [44]. However, an improvement in the payment capacity was observed in the case of mortgage loans [45].
Over time, there have been several financial crises such as the Asian crisis, the South Sea Bubble, or the recent global crisis of 2007–2009. Many of these had the financial instabilities of the banks as the main starting point. Central banks play an important role in maintaining the financial stability of commercial banks [46,47,48,49].
Thus, the NBR ensures the design of a macroprudential supervision framework with the aim of limiting the frequency and impact of potential future crises, as well as the contribution made to the safeguarding of the financial system. Financial stability in Romania has become the main objective of the NBR since 1999 when the Financial Banking Policy Directorate was established and later, in 2004, with the establishment of the Financial Stability Directorate [50].
According to the Eurostat source, Romania ranks eighth in the European Union from the perspective of price stability. Even though inflation has grown strongly in the last three years, Romania has gradually improved its position compared to other EU countries, as can be seen in Figure 1.
Regarding the banking sector in Romania, according to the information presented in the Financial Stability Report [45] by the NBR, the financial and prudential position of the banking system in Romania is at an adequate level compared to the average recorded at the level of the European Union. However, the risks are increasing. As can be seen in Figure 1, the risk of non-payment of loans is a vulnerable subject, considering the deterioration of macroeconomic conditions, as well as the uncertainties of their future developments. The increase in inflation associated with the increase in the interest rate amplifies the vulnerability of this increase in non-performing loans. Also, even if the average is very high at the EU level regarding banks’ debts to the government sector and assets, falling within the worst prudential interval established by the EBA, the situation is not favorable in Romania either.
Even if the situation regarding financial stability in Romania is relatively stable at present, the uncertainties of the macroeconomic environment, the energy crisis, Russia’s aggression against Ukraine, and the low level of financial education in Romania still represent challenges that the Romanian economy faces. Although Romanian banks are considered stable and well capitalized, there are several concerns regarding the high level of non-performing loans, which has increased significantly in recent years. The supervisory authorities must maintain their increased interest in identifying solutions for the problems they face.
Considering these aspects, the analysis of contagion effects becomes a very important topic to analyze, including the high degree of uncertainty of the political, economic, and social contexts, as well as the existing vulnerabilities of the banking sector in Romania, emphasizing the current research.
The analysis of residual financial contagion contributes to economic growth through stabilizing and consolidating the financial system, restoring confidence in it, and developing appropriate policies and regulations to better prevent and manage financial crises. By creating a safer and more predictable environment for investments and economic activity, it can stimulate innovation, productivity, and sustainable growth. For example, by conducting this analysis, the vulnerabilities and remaining risks in the financial system can be identified. This enables authorities and institutions to take preventive measures to reduce the risk of recurrence of the contagion effect, thereby creating a more stable and secure environment for economic growth. Furthermore, regulations and policies can be improved by providing valuable insights learned from past effects. Thus, by strengthening regulations, the financial system can be stabilized, creating a favorable climate for investments and economic growth [38,51].

4. Methodology

4.1. Conceptual Dimensions of Machine Learning Algorithms

ML is a field of computer science that is based on the use of statistical tests, techniques, and methodologies to ensure the ability to learn from past experiences and to improve the behavior of models, as well as the way they perform certain tasks, over time [52,53].
Considering the economic uncertainties faced by banking institutions, the standardized traditional methods used in the development of bank credit risk models are insufficient to face the new challenges. Thus, specific machine learning algorithms are useful, beneficial tools for banking institutions in Romania. By using them, more accurate and efficient models can be developed to help us to evaluate the credit risk and to reduce the high risk of default that Romania has been facing in recent years. Even if these algorithms have proven to be more accurate than traditional credit risk assessment models, we cannot say that they represent the perfect solution because there are also certain risks related to the input data used and the historical data on the basis of which the models were developed, which, in time, may no longer have a high discrimination power [53,54].
In the following, the most used ML algorithms in the development of credit risk models will be briefly presented, which will be employed in analyzing and evaluating the predictive ability of some debtors to repay the second mortgage loan based on indicators that are influenced by customer behavior, such as the debt held for the first mortgage loan and the value of the loan. The algorithms are presented through a brief description and through the needed implementation in Python for ensuring the reproducibility of the results obtained through the use of these algorithms.
Random Forest—a supervised learning algorithm that helps us build a set of decision trees. This algorithm is used most of the time for classification problems and can provide a relative importance of the variables used in the prediction [55,56]. To implement this model in Python, the following lines of code were used, according to Figure 2:
Basically, the estimator is instantiated in a control object variable. The random_state argument receives the value 0 so that with each run of the model, the results remain consistent.
In the second step, we defined the set of hyperparameters, as can be seen in Figure 3.
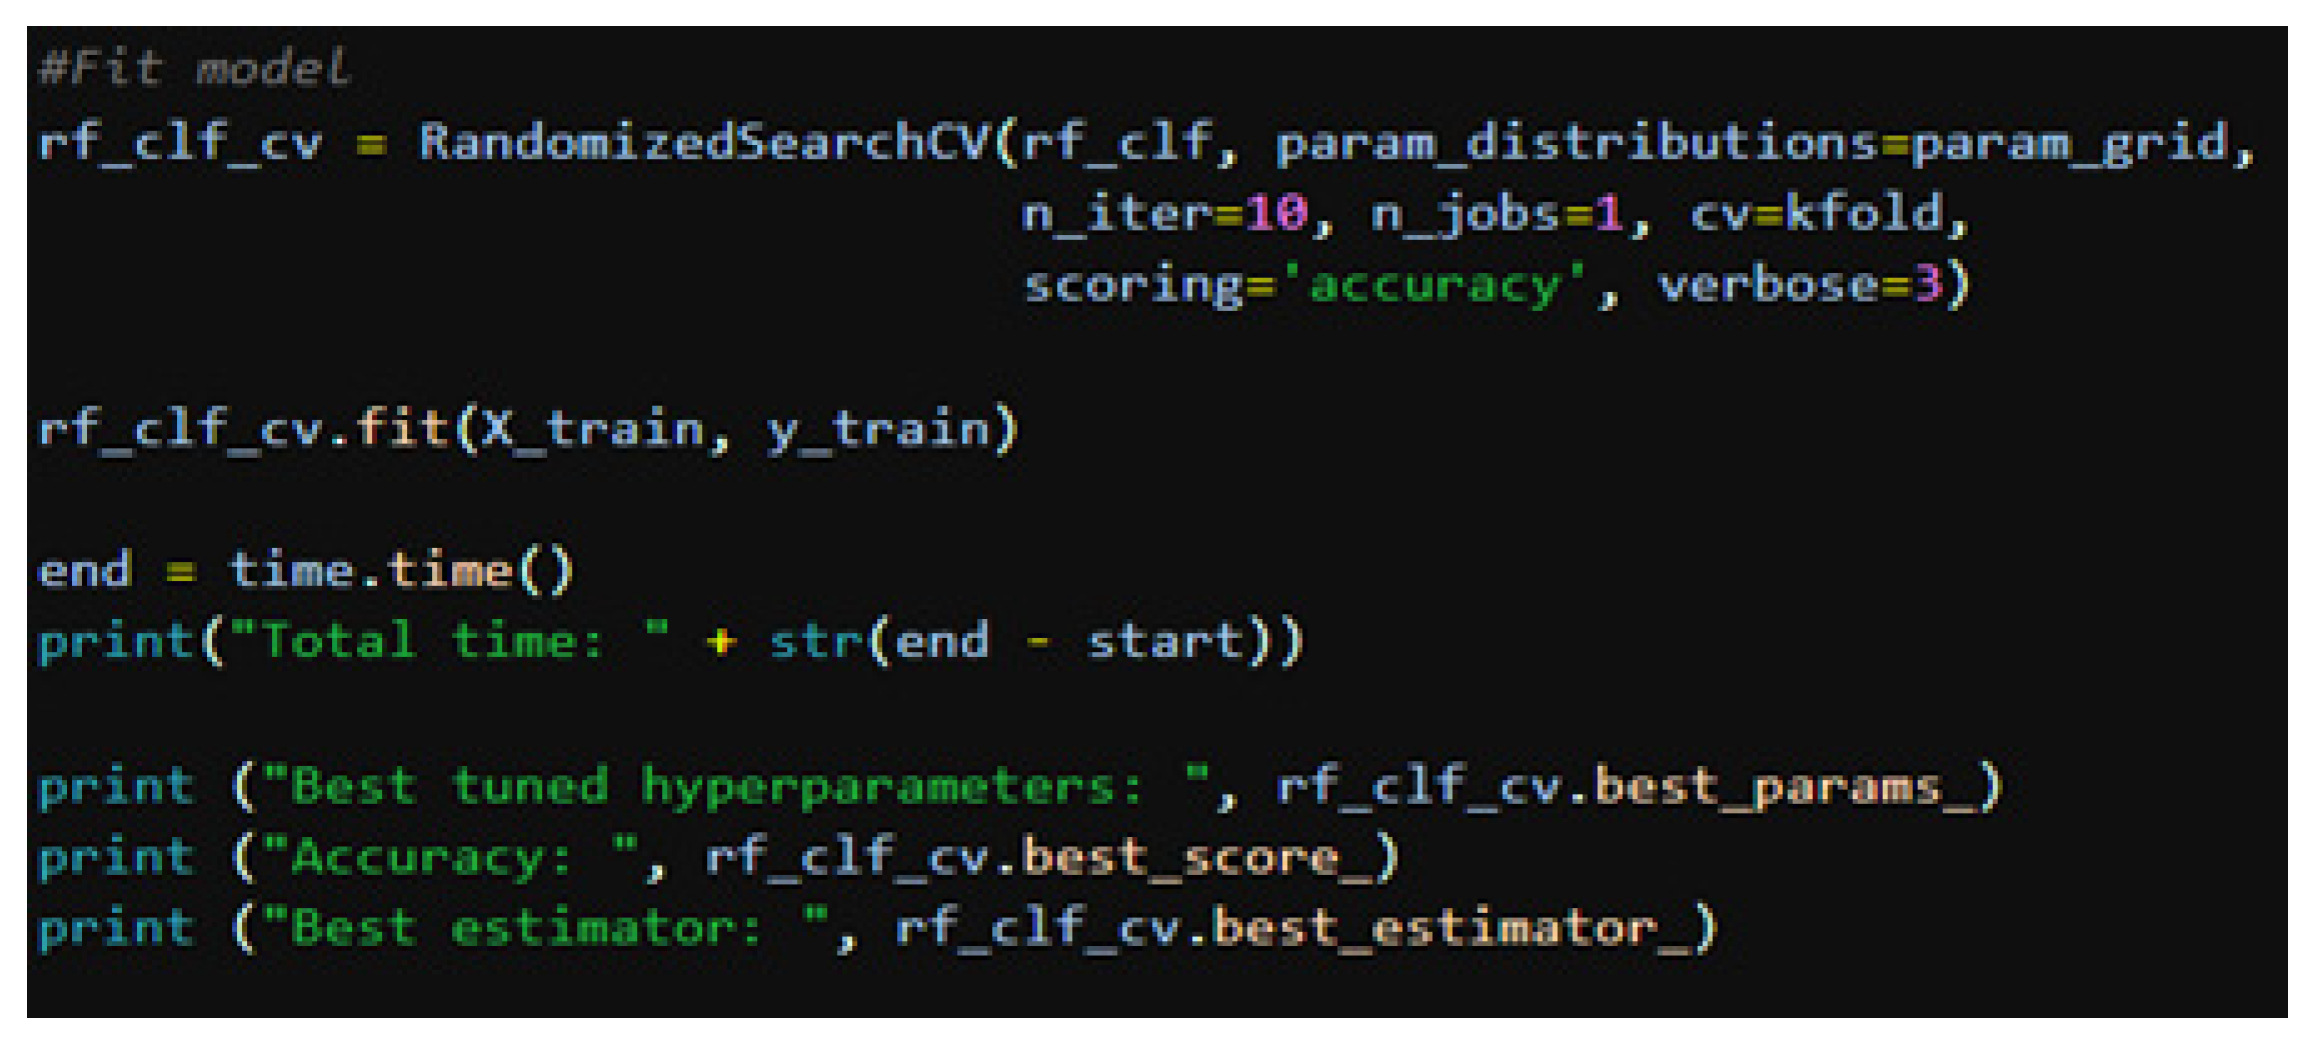
The third step, which can be seen in Figure 4, consisted of adjusting the hyperparameters and training the model on the training set. Within this stage, the k fold cross-validation process was also performed. At the end of the training stage, the best tuned hyperparameters, the best accuracy score, and the best estimator, resulting from the hyperparameter tuning and model training, were displayed. We also added a method that calculates the running time of the model on the training set, which will be displayed in a later output.
In the last step, we evaluated the accuracy and performance of the model by calculating the indicators for performance measurement, to which the confusion matrix and the classification ratio were added. Figure 5 illustrates the last described step necessary to evaluate the performance of the Random Forest algorithm.
K-Nearest Neighbors (KNN)—a supervised learning algorithm based on the idea that new data instances are classified based on the classes of their neighbors in the data set [57].
The purpose of this ML algorithm is to search for the nearest neighbors of a known query point in order to be able to assign a class label to that point. In this sense, the KNN algorithm considers the following steps [57].
The distance values are determined. The distance between the interrogation point and the other points is calculated. Based on these calculations, we determine the decision boundaries in different regions.
To determine the distance metrics, several measures [58] can be applied such as Euclidean distance, Manhattan distance, Minkowski distance, and Hamming distance.
The formula to calculate the Euclidean distance is
a , b = i = 1 n b i a i 2
Another well-known distance metric is the Manhattan distance (MD). This measures the absolute value between two points and has the following formula:
d a , b = ( i = 1 m a i b i )
The Minkowski distance ( M d ) is based on the Euclidean and Manhattan distance metrics, being their generalized form. This can be confirmed by replacing the parameters p in the formula below with 2 to obtain the Euclidean distance, and p = 1 is the Manhattan distance.
M d = i = 1 n a i b i 1 p
When working with Boolean vectors or strings, the Hamming distance is used. This can be represented by the following formula:
D H = ( i = 1 k | a i b i )
a = b ; D = 0   o r   a b ; D 1
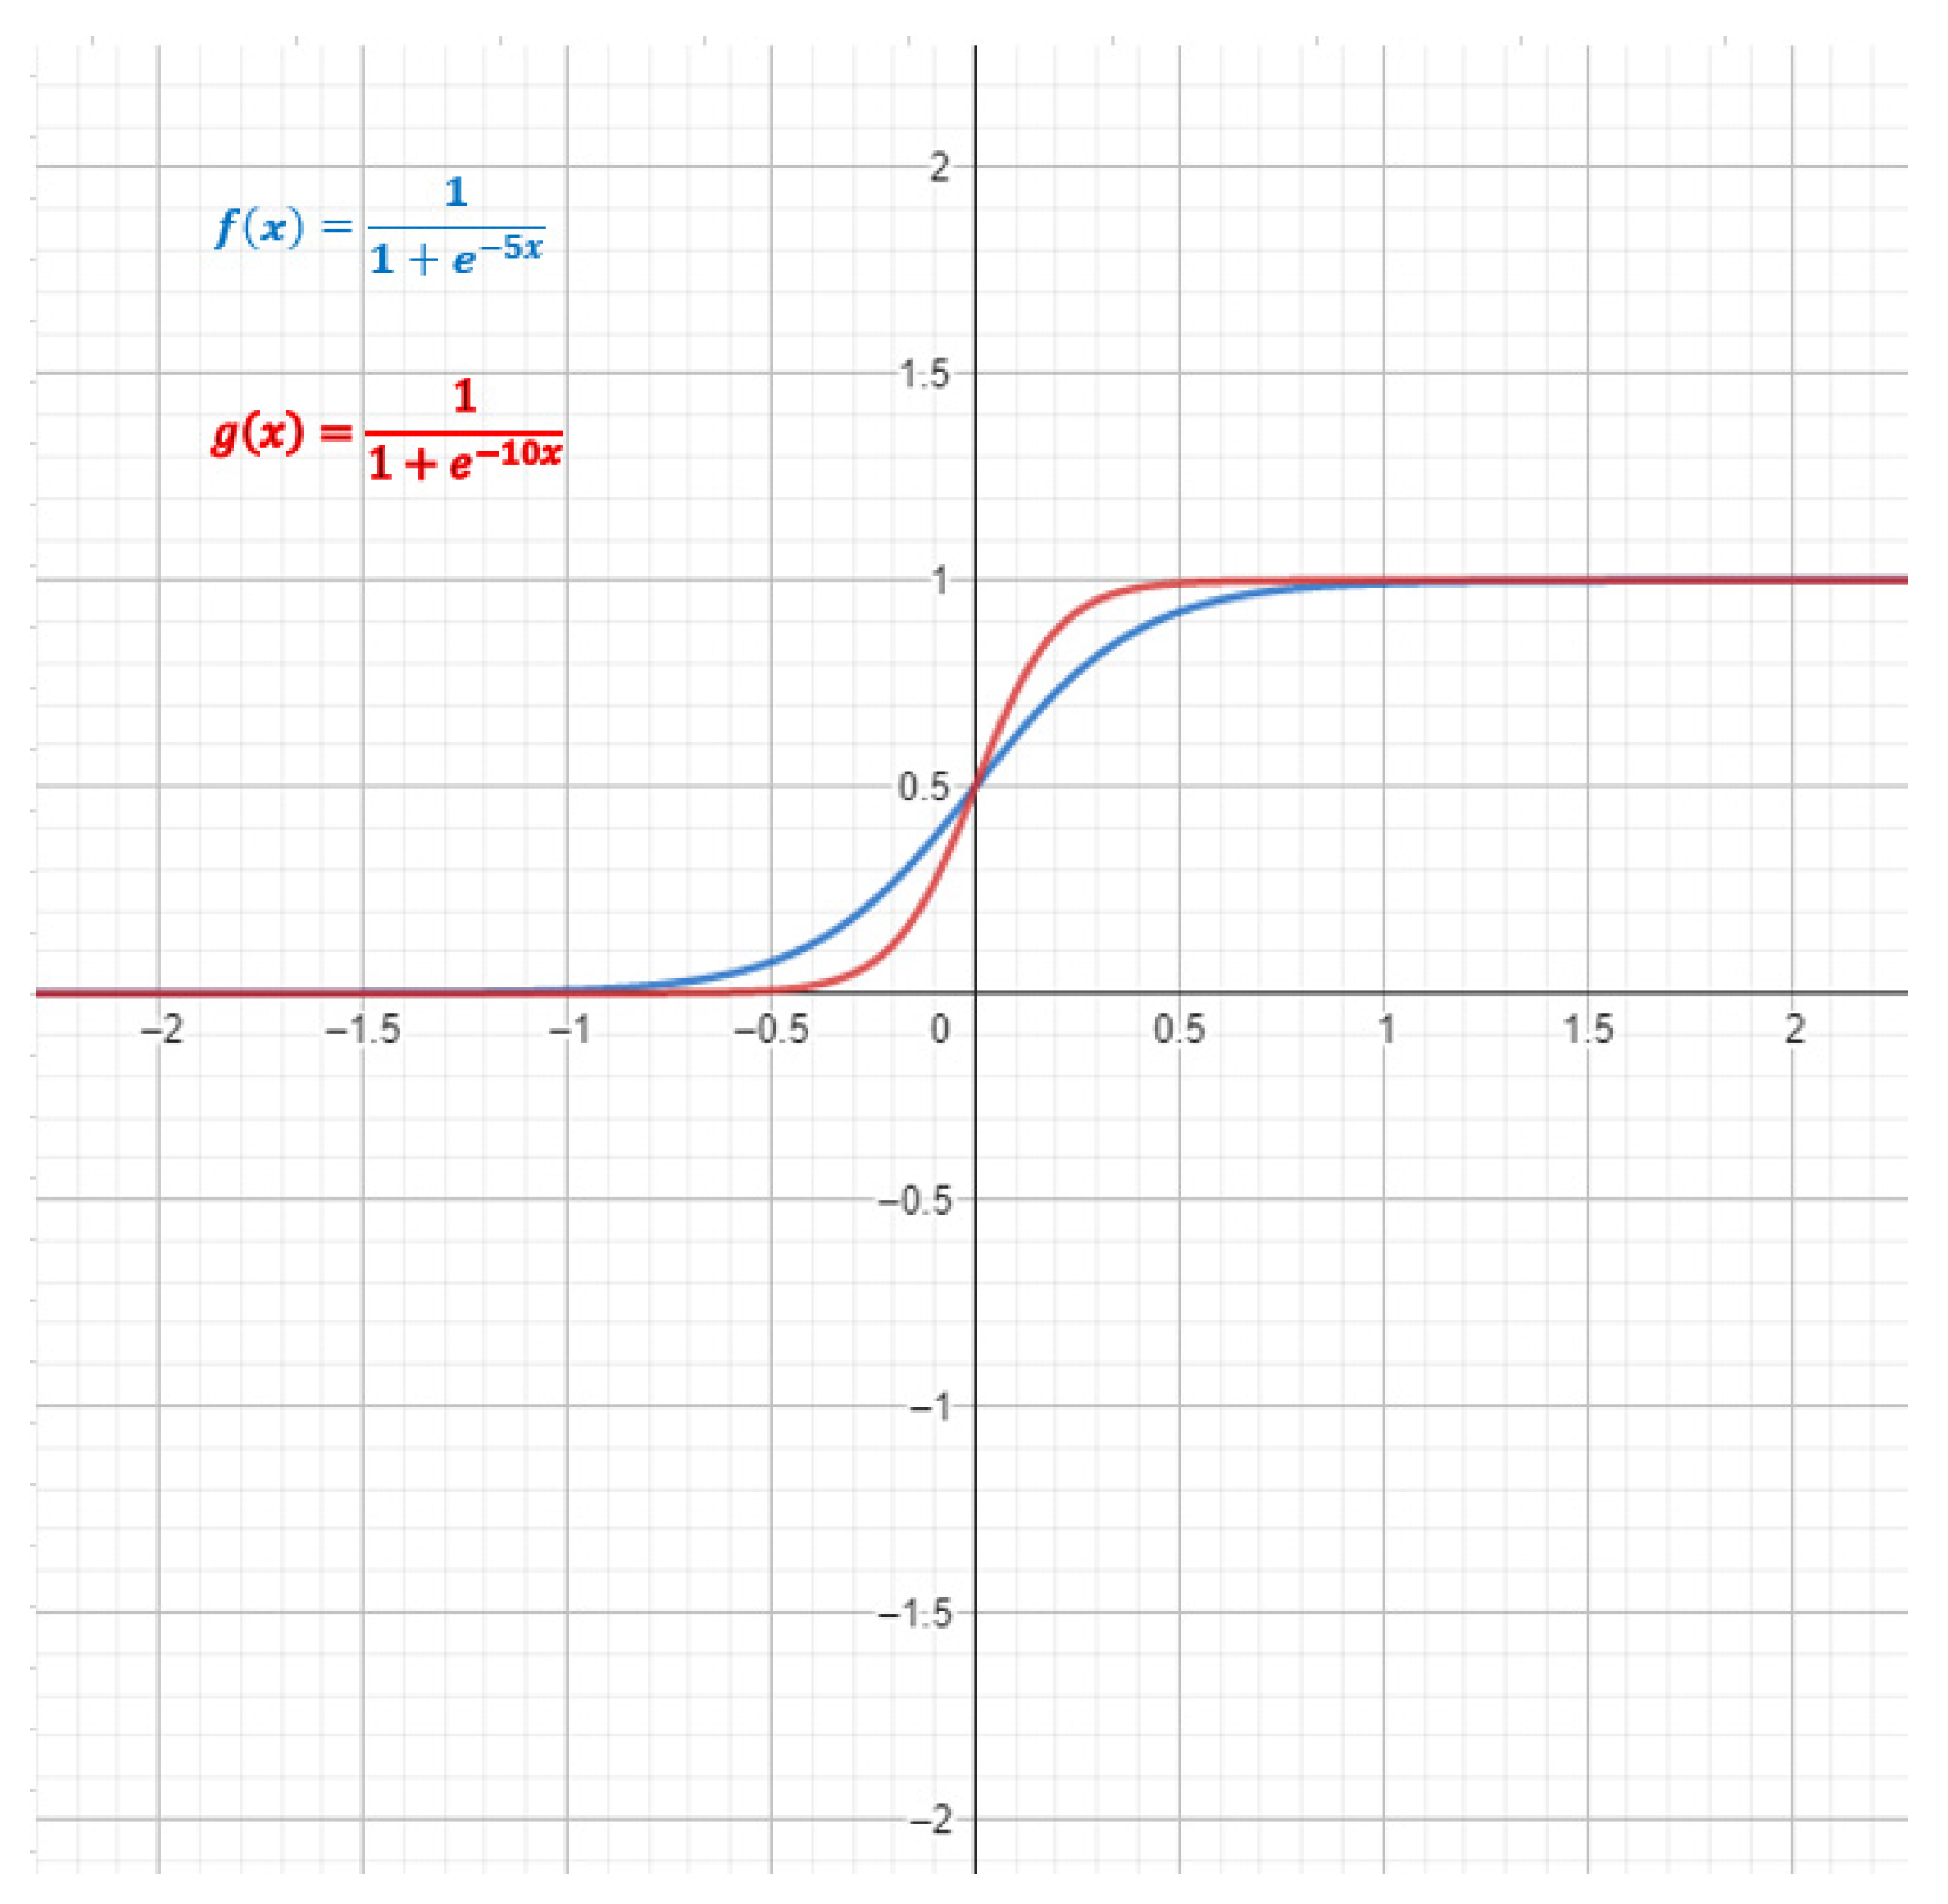
Logistic Regression—a supervised learning algorithm that uses the sigmoid function to make a binary classification. Basically, the sigmoid function is a mathematical function that transforms continuous values into values between 0 and 1 [59,60]. This can be represented by the following formula [61,62]:
F x = 1 1 + e x = e x e x + 1
Logistic regression is based on the probability that a sample belongs to a class. The main feature of this probability must be continuous and bounded between (0, 1). The graphical representation is shown in Figure 6.
Extra Trees Classifier—an algorithm similar to Random Forest. The difference is that it uses the entire data set and builds the decision tree by randomly selecting features and cut points.
This algorithm can be an efficient method for reducing the variant and improving the generalization [63].
Naïve Bayes—a supervised learning algorithm that is based on Bayes theorem. Naïve Bayes can be used for classification problems and is effective when the independent variables are few and highly correlated [64,65].
AdaBoost—a supervised learning algorithm that tries to improve the performance of a weak classifier by successively building stronger classifiers. In each round, a higher weight is given to the wrong examples so that the next strong classifier focuses on these examples. AdaBoost can be used for classification problems [64].
XGBoost—an algorithm that is an extended implementation of Gradient Boosting Machine (GBM), which is another supervised learning algorithm used for classification and regression problems. XGBoost uses an additive model where new classifiers are added to correct the mistakes of previous classifiers [65,66].
LightGBM—an open-source algorithm package, patented in 2016 by Microsoft and, like the original Gradient Boosting, uses decision trees to solve classification problems as well as other specific machine learning problems [67].
Hyperparameters are used to control the behavior of the automatic learning model and to optimize its performance in order to reduce the risk of residual model [68]. These are the configuration parameters of the algorithm that are not learned by the model, but are specified by the user before training the model. If the hyperparameters are set incorrectly, then the performance of the model may be sub-optimal. Choosing the right hyperparameters can improve model performance and reduce the risk of overfitting or underfitting the model. Thus, for each model analyzed in this research, hyperparameter tuning was applied.
To test the performance and accuracy of the models on the testing set, a series of performance indicators can be applied that measure the accuracy of models and provide results about their performances on the predictions on the testing set.
The confusion matrix [69,70] contains the total number of predicted values and actual values. It is a very popular metric used to solve classification problems (Table 2). This one can be applied to binary classifications, but also to multi-class classification problems. Classification models have multiple categorical outputs. Most indicators that measure prediction errors calculate the total error in the model but cannot find the individual cases of error in the model. The model may misclassify more categories than others, but we cannot see this using a standard indicator that measures accuracy.
As can be seen, the confusion matrix is a quadratic matrix, with its size being given by the number of classes predicted by the model. It contains four important quantities: True Positive, True Negative, False Positive, and False Negative.
The True Positive size shows the number of examples correctly classified in the positive class and the True Negative size shows the number of examples correctly classified in the negative class. The other two quantities show the number of examples wrongly classified in the positive and negative classes, respectively.
We will use the confusion matrix to calculate a series of performance metrics, such as accuracy, recall, precision, F1 score, and ROC curve, of the selected classification models.
The calculation formulas for these metrics are as follows [70]:
A c c u r a c y = T P + T N T P + T N + F P + F N
R e c a l l = T P T P + F N
P r e c i s i o n = T P T P + F P
F 1   S c o r e = 2 1 R e c a l l + 1 P r e c i s i o n
The ROC curve illustrates the relationship between the True Positive rate (TP) and the False Positive rate (FP) at different decision threshold cut points.

4.2. Agent-Based Modeling

Commercial Bank is an economic and financial agent that offers specific services and products, such as granting loans, deposits, customer management, and intermediary payments, both for individuals and legal entities [13,70,71].
Cybernetics, as defined by Norbert Wiener, is an interdisciplinary science that deals with the study of communication and control of complex systems in complex environments [72].
The economy, analyzed from a cybernetic perspective [70,72], is a complex system made up of complex agents that interact both with each other and with the environment, and these interactions can be understood based on the feedback mechanisms that are formed. This is made up of agents such as all companies, banks, the population, households, the government, and all the agents that form and define the national economy or the global economy, depending on how it is analyzed at the system level.
The Commercial Bank, analyzed as a cybernetic system, must be understood from the perspective of the function and interaction between its subsystems. Considering the central topic of the work, we will focus on the cybernetic subsystem of credit management, which represents the interface between the Commercial Bank and the Credit Market, but also realizes the interaction between the Bank and the environment through the services and products offered to clients. This interaction between autonomous agents, the bank’s customers, will be analyzed through agent-based modeling (ABM) with the aim of understanding both their behavior and the behavior of the banking system.
Agent-based modeling [73,74] is an efficient method that offers tools necessary to understand, simulate, and solve real-life situations so that we can understand the complex behavior of economic agents and the factors that influence their behavior, unlike the model based on equations. ABM is based on computational modeling that can incorporate different traits and characteristics of the agents, helping us to understand the interaction between them, which is an aspect that can be difficult to analyze or model if modeling based on equations is used.
Traditional mathematical models, such as those that use logistic models, the Lotka-Volterra model, or models based on differential equations cannot explain the behavior of agents in decision making or behavioral modification [75].
An agent-based modeling cannot work without considering the particularities of individual entities or agents. These particularities [76,77] refer to the properties of the agents, the behavior during the movement, the behavior during the change in direction, or the behavior in the interactions with the other agents.
The are many definitions in the literature formed by different researchers for agent-based modeling that are more or less similar, but their meanings are partly the same. Therefore, the meaning of agent-based models is given by models programmed in computers, using various mathematical or statistical formulas, with the aim of capturing the evolution and behavior of one or more individuals, but within a given environment, it is well established. There are different conditions depending on what a person wants to simulate or study [77,78]. The benefit provided by agent-based modeling is the ability to present the results and the process of reaching them in an interactive form rather than an abstract one, even if the initial step in solving the problem involves an abstract, theoretical structure, such as a formula or an indicator [79].
Regarding the use of agent-based modeling in the analysis of the financial contagion effect, the properties of agents that can be found in such models are [80,81,82,83,84] heterogeneity, emergence, complexity, social interaction, adoption, risk and reward, learning, informational asymmetry, interdependence, feedback, adaptability, realistic behavior, and exploring the space of possibilities. The properties are further described in Table 3.
Agent-based modeling involves computer systems where agents interact with one another within an environment according to well-established rules [72]. However, the rules and conditions established by researchers can lead to unpredictable outcomes at the macro level, as interactions between agents and their environment can result in unexpected results during experiments. These rules and conditionings can nevertheless offer insight into predicting behavior at the micro level [85].
Regarding the use of agent-based modeling in the analysis of the residual contagion effect, we will use the NetLogo IT solution, and we will have the model developed by Gai and Kapadia as a reference. In their study [86], they created a model for two important contagion channels in financial systems. The primary focus is on how losses can spread through the complex network of direct exposures to counterparties after an initial default. However, the secondary effects of distress on asset prices in some financial institutions can cause other financial entities to decrease the value of their assets, potentially triggering additional default rounds. Contagion stemming from direct interconnections between interbank claims and liabilities can thus be intensified through indirect contagion from the asset side of the balance sheet, particularly in illiquid markets for key assets of the financial system.
Gai and Kapadia [86] assumed a financial network in which a number of financial intermediaries are randomly interconnected through interbank exposures that are directed and weighted by assets and liabilities owned by the banks in the network. In addition, they also considered the size of these exposures important in the analysis of the contagion effect.
From the perspective of graph theory, in the case of the analyzed network, the banks represent the nodes of the network, and the interbank exposures represent the arcs. One of the important properties of the network is its degree distribution. Thus, Gai and Kapadia [86] considered, for example, that in a directed graph, each node has 2 degrees. An internal degree indicates a bank’s interbank assets or exposures, and an external degree represents interbank liabilities.
Thus, the model assumes the following assumptions:
The total assets of each bank in the network are made up of interbank assets and illiquid external assets such as mortgages;
The total positions of the interbank assets of each bank in the network are uniformly distributed, following a normal Gaussian distribution, and are independent of the number of links that a bank has in the network;
Interbank liabilities are determined endogenously;
The only component of a bank’s liabilities are exogenous data of customer deposits.
The condition for the bank’s solvency is expressed by the following equation:
1 θ A I B + q A I M L I B D i > 0
where:
  • A I B represents the interbank assets;
  • A I M represents the illiquid assets;
  • L I B represents the interbank liabilities;
  • D i represents deposits;
  • θ represents the proportion of banks that have defaulted on their obligations to bank;
  • q denotes the price at which the illiquid asset can be resold.
The model will calculate the following variables using the relationships below:
A I B = b s c
A I M = b s ( 1 c )
L I B = 0.2 E o u t
D i = A I B + A I M L I B
where:
  • b s represents bank size;
  • c represents the constant that is set with a value between 0 and 1;
  • E o u t represents the number of outgoing links.
In this research, the NetLogo computer solution was chosen because it allows for the programming and simulation of interactions among individual agents in a virtual environment [87]. The NetLogo platform provides an intuitive graphical interface and facilitates the visualization of simulation results [87,88]. Users can program the behavior of agents and adjust parameters to explore different scenarios and effects. NetLogo is freely available and supported by an active community that provides resources, examples, and pre-defined models that users can utilize and modify according to their specific needs [77,89]. Recently, NetLogo has been used in various applications in the scientific literature, including but not limited to modeling the human behavior involved in an evacuation process [90,91], reducing the risk associated with airplane boarding in pandemic conditions [92], understanding the issues related to fairness and efficiency in an economic context [93], economic recovery after an endemic situation [94], optimization in flexible job-shop scheduling [95], and modeling dynamical processes on complex networks [96].
Regarding the simulation of residual contagion effect, the NetLogo environment allows for the definition of agents, interactions among agents within the financial network, modeling of risk and contagion, simulation and evaluation of scenarios, and analysis of the obtained results aimed at assessing the effects of contagion on the overall financial and economic system. The results can highlight specific vulnerabilities, evaluate the effectiveness of policies and risk reduction measures, and provide a framework for understanding the mechanisms of financial contagion propagation [97,98].

5. Case Study: The Analysis of Banking Financial Contagion from a Cybernetic Approach

5.1. Application of Machine Learning

In the following, the banking market of mortgage loans in Romania at the beginning of 2022 is analyzed for the first seven banks in terms of size from the perspective of both assets and the volume of loans granted. The data were taken from the official online platforms of the banks included in the analysis. These banks are the Romanian Commercial Bank (RCB), the CEC Bank (CECB), the ING Bank (INGB), the Transilvania Bank (TB), the Raiffeisen Bank (RB), the Romanian Development Bank (RDB), and the Unicredit Bank (UB). The analysis presented in Figure 7 was carried out in order to observe the evolution of interest rates on mortgage loans for several banks in Romania and to compare the values. The interest rates used are all variable, and the EAI represents the effective annual interest and is an indicator that expresses the total cost of the loan in percentage form.
From the perspective of the analysis of existing mortgages on the banking market in Romania, as can be seen in Figure 7, the bank that offers the lowest interest rate is the CEC Bank. However, the EAI does not have the lowest value, as the bank has several commissions such as credit administration fees that exceed the EAI of the mortgage loans offered by the Romanian Commercial Bank. At the opposite pole, Unicredit Bank has both the highest interest rate and EAI. From the perspective of the client who is applying for a loan, it is important for them to consider the EAI, not just the interest rate, because they must estimate their correct payment capacity to be able to repay the loan.
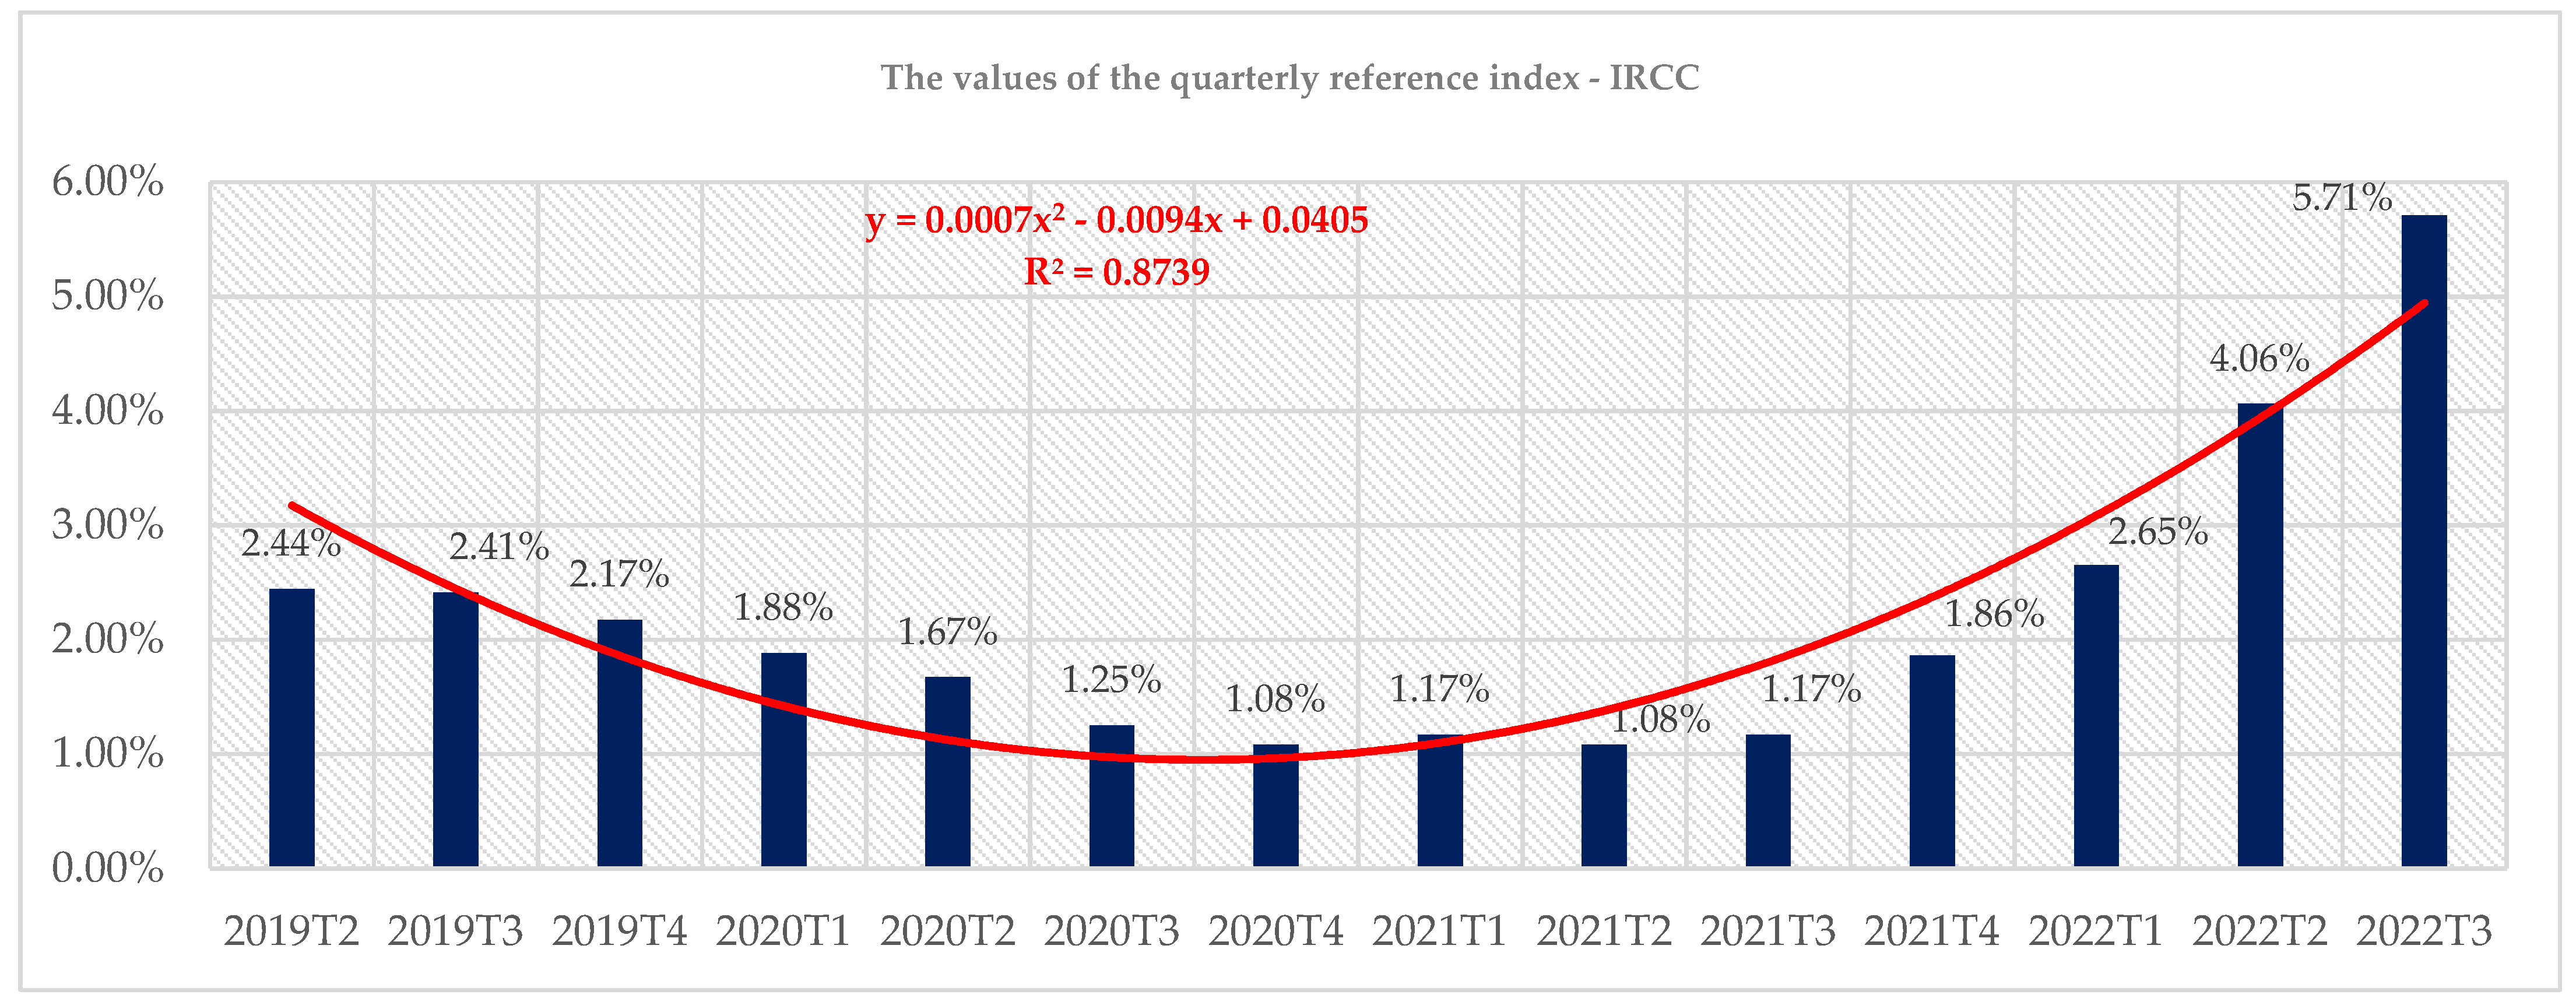
ROBOR is the reference index used for loans in RON. It is determined by the National Bank of Romania (NBR), based on a specific methodology. It represents an average of the interest rates at which Romanian banks are willing to lend to each other and is published every working day at 11:00 AM. Starting from May 2019, according to NBR 19/2019, the ROBOR index from the variable interest component was replaced by the reference index for consumer loans, IRCC. So, all banks have variable interest expressed according to the IRCC.
The quarterly reference index for consumer loans (IRCC) of the interbank money market is calculated as the arithmetic mean of the daily values recorded in all working days of the respective quarter. After the analysis, we noticed that the evolution trend of the consumer reference index follows a polynomial series.
In Figure 8, we denoted 2019T2 as the values recorded for the second trimester in 2019.
We observe that the lowest values of IRCC are in the last trimester of 2014 and the second trimester of 2021, respectively, and the highest value is recorded in the third trimester of 2022.
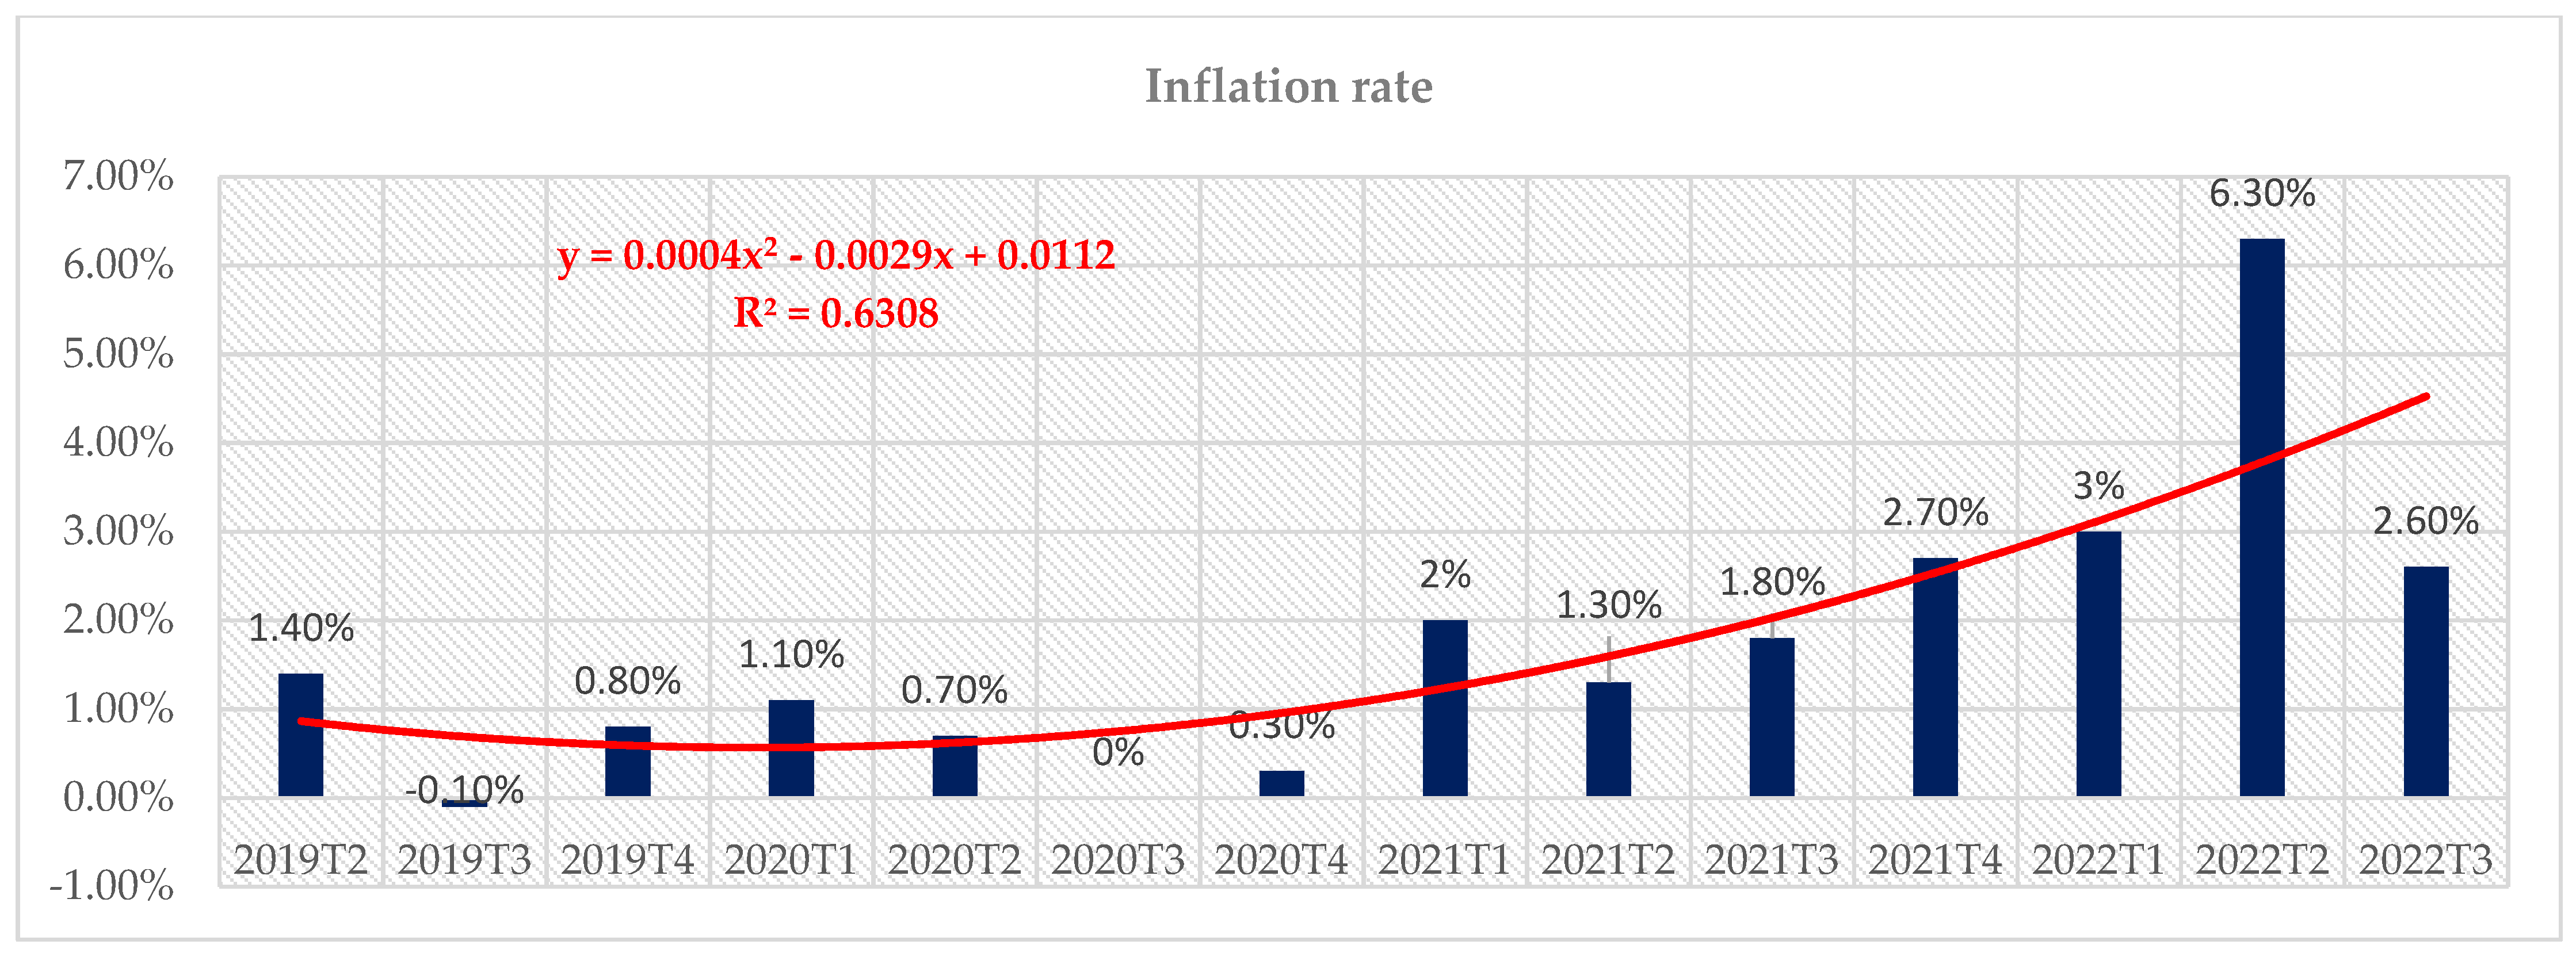
The increase in the inflation rate and the interest rate can constitute a favorable environment for the propagation of financial contagion effects. In Figure 9, we can observe the evolution of the inflation rate from the second trimester of 2019 to the third trimester in 2022. The highest inflation rate recorded during the inflation period is in the second quarter of 2022, and the lowest inflation rate was observed in 2019T3.
The significant increase in inflation can propagate a financial contagion effect through the following channels [100,101,102,103,104,105,106]:
-
An increase in the production costs of companies, which will have the effect of decreasing profit margins and, possibly, increasing consumer prices. Thus, other effects can be generalized with an impact on the occurrence of potential systemic events of residual contagion. For example, this increase in costs makes it difficult for companies to repay loans. This can lead to the imbalance of the credit risk model that is the basis of the granting of loans by the bank. It is enough to have calculation residues at a sufficiently large bank and with a high degree of connectivity in the financial economic network, due to which the rate of non-performing loans will increase.
-
A decrease in purchasing power can negatively affect the sales and profits of the companies.
-
An increase in the interest rate is a normal reaction of the central banks, as a rule, to combat the increase in inflation. This can have the effect of decreasing investments and consumption because loans become more difficult for consumers to access.
-
An increase in the interest rate can also lead to a decrease in the value of financial assets, leading to significant losses for investors, which favors triggering a financial contagion effect by affecting other financial institutions or even the financial market in which it operates.
To prevent such situations, financial supervisory authorities can take measures to limit the rise in inflation and interest rates through appropriate macroeconomic policies. It is also important that banks and other financial institutions have adequate risk management and diversification of their portfolios to reduce the risk of financial contagion in the event of adverse events.
For these reasons, the current research also aims to test machine learning algorithms for mortgage credit models.
Next, we will analyze and predict the ability of some debtors to repay the second mortgage loan and their final status, considering other variables that are important in the analysis of customer behavior, such as the amount of the loan, the remaining debt from the first mortgage loan, etc.
The data that we model below have a sensitive nature; they were taken from the official website of the Central Bank of England [107]. The data set contains information on second mortgages purchased or home equity loans and contains a set of 5960 observations and 13 variables. Two of these variables are non-numeric and eleven are numeric. The analyzed time horizon is 2018–2021.
Based on this data set, we model the relationship between the dependent variable BAD and the predictor variables LOAN, MORTDUE, VALUE, DELINQ, and DEBTINC. The description of the variables is provided in Table 4. The initial variables and loading of the database before the process of processing, cleaning, and preparing it can be seen in Figure 10.
We identified and estimated several possible models using machine learning algorithms, and later checked the accuracy of the models and compared the results between them to decide which model is better, i.e., the most suitable to make predictions based on the data set regarding the repayment of mortgage loans of some applicants.
The application was made in Python.
To carry out the analyses presented above, the following steps were followed:
  • Database processing: Cleaning, processing, and preparing the data set used in the analysis and subsequent modeling, as well as splitting it into a training set and testing set, respectively.
  • Dimensioning the variables: Splitting the data set into a training set (80%) and testing set (20%), respectively.
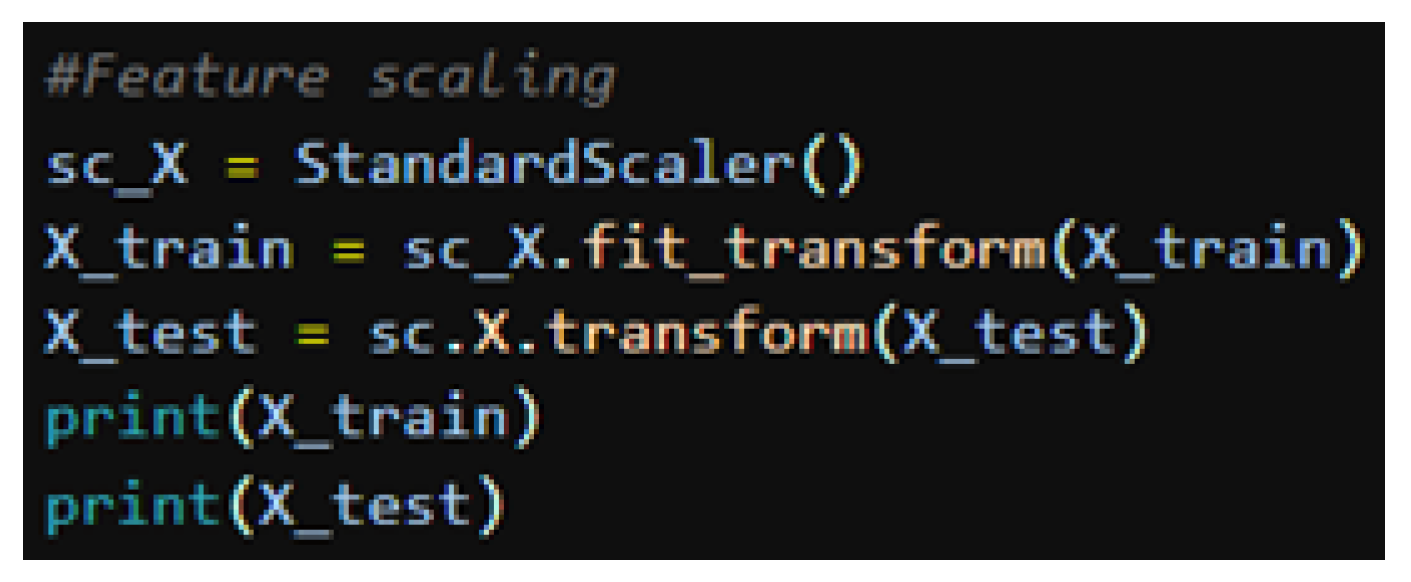
  • Standardizing the predictor variables by eliminating the maximum differences between the variables.
  • Defining the k-fold cross-validation methodology to test the performance of the model for the testing set.
  • Estimating the models on the training set and testing the accuracy and performance of the model on the testing set.
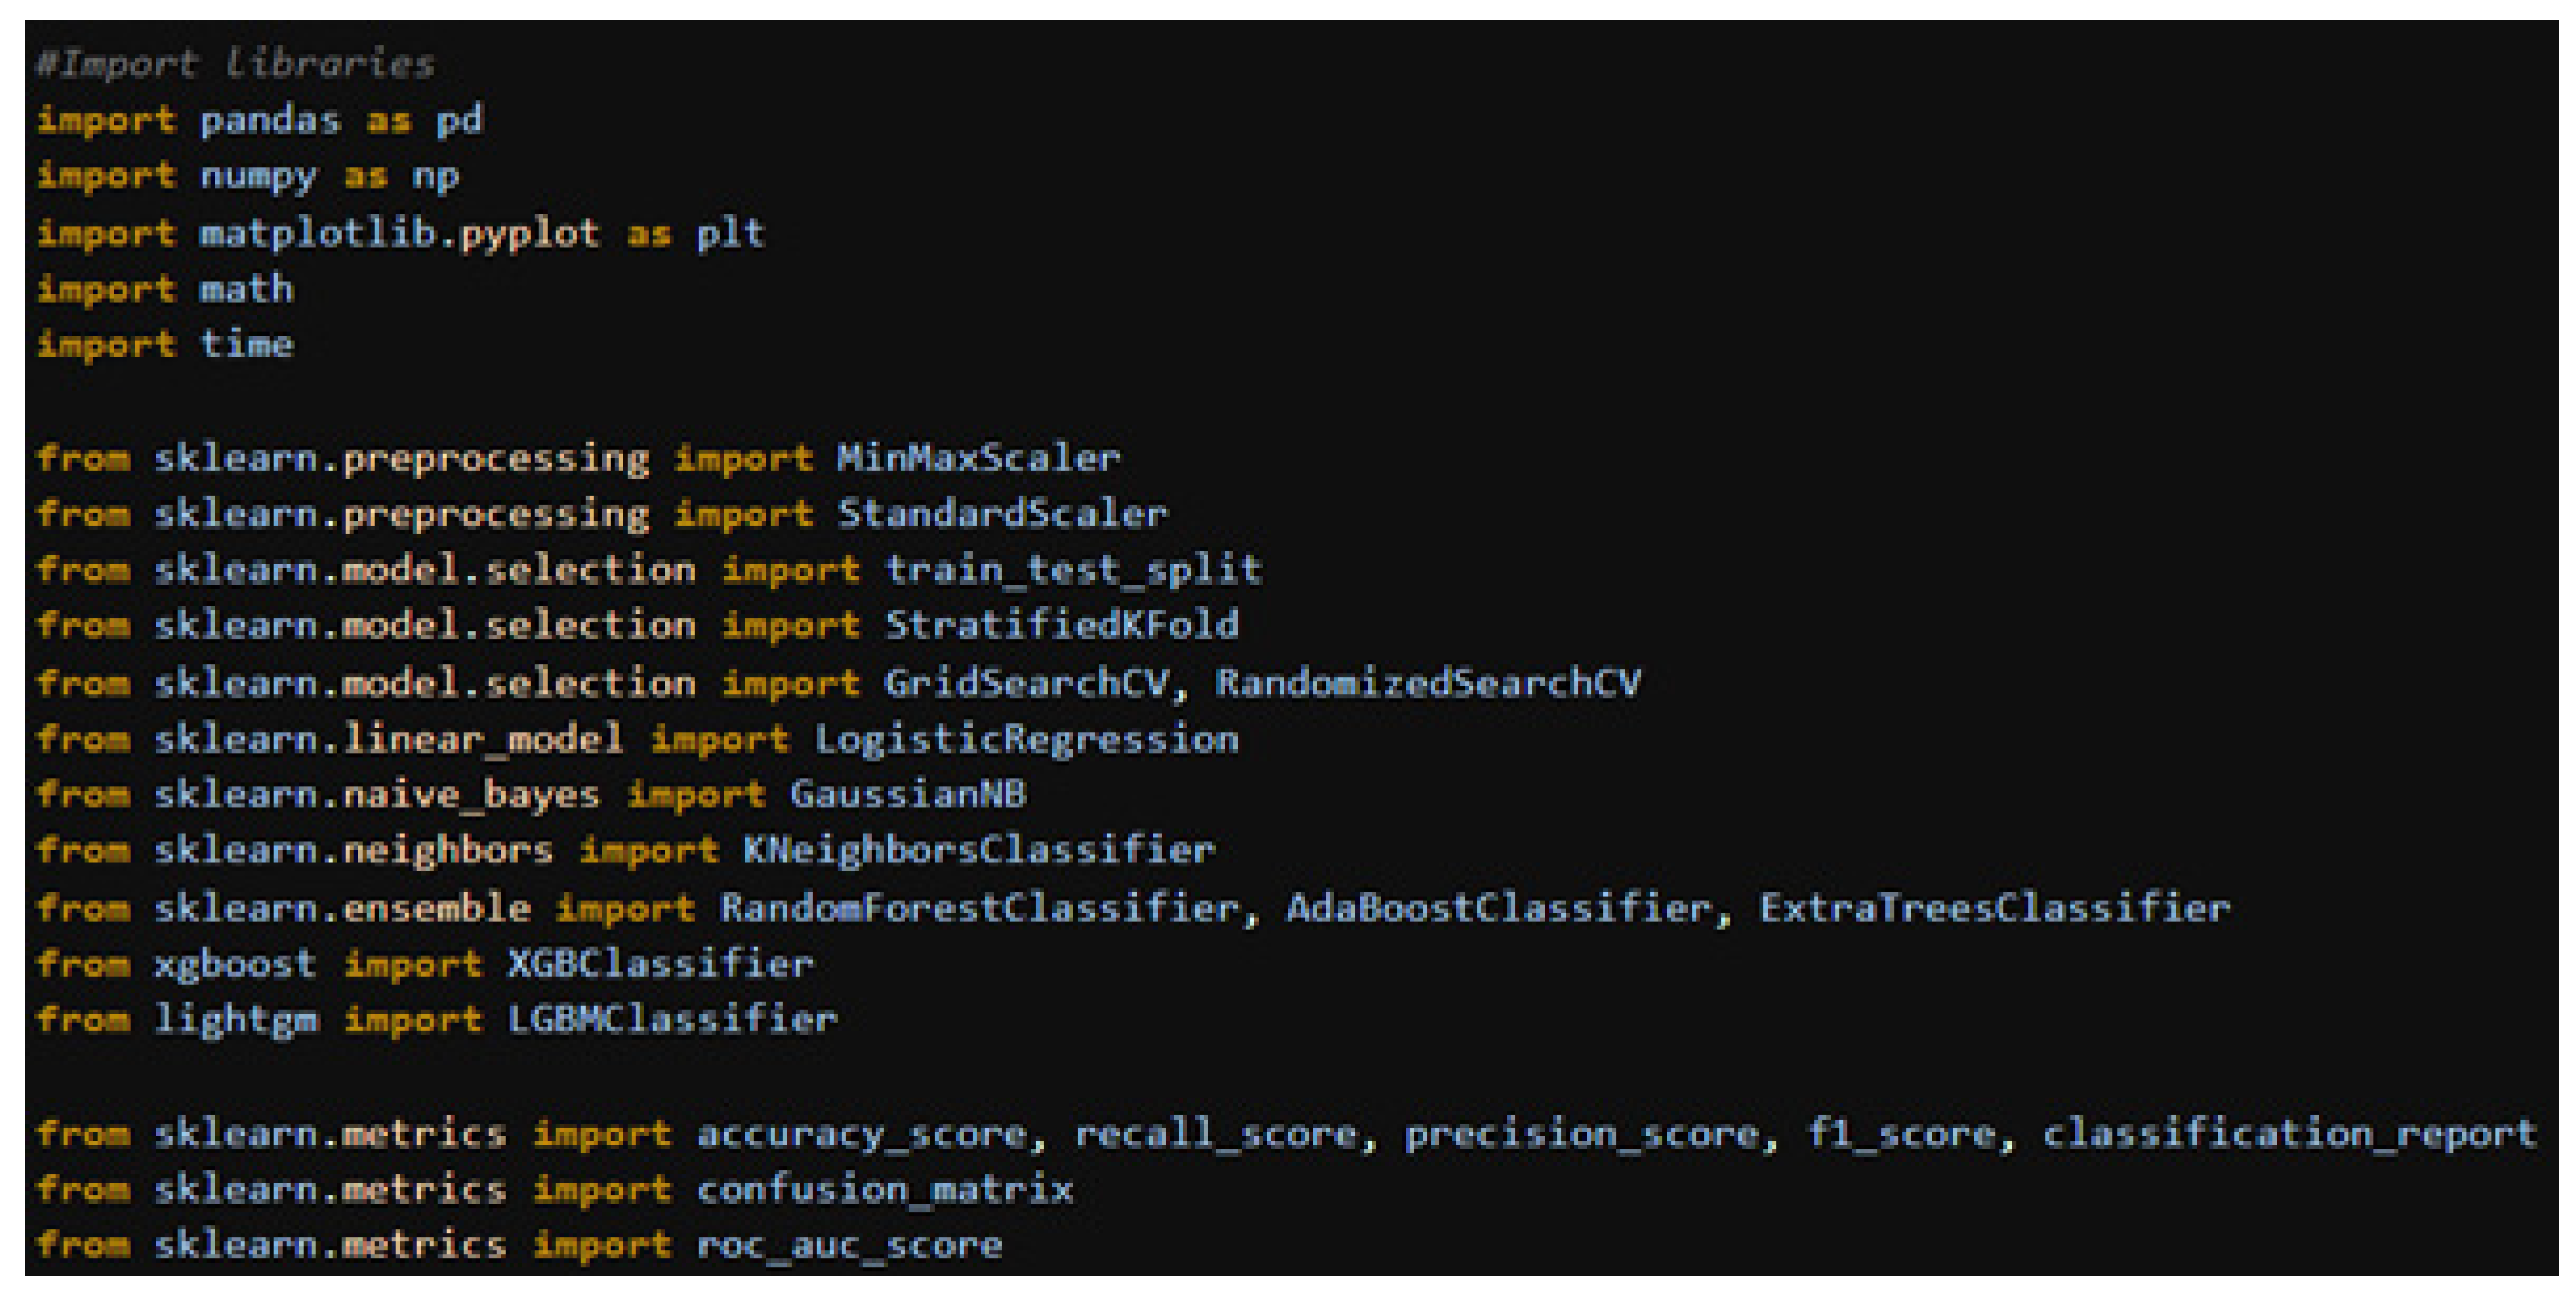
For step 1, we imported the following specific libraries in Python: <<pandas>>, <<numpy>>, <<matplotlib.pyplot>>, <<math>>, and <<time>> (Appendix E).
The first step was to identify the missing values and 0 values and replace them with the column mean for each value. This step was performed so that the model could be estimated as accurately as possible. Later after processing, there were no more missing values for the numeric columns (Appendix A).
In the next step, we divided the data set into a training set (train) and a testing set (test), keeping only the significant variables for the analysis (Appendix B).
In the training set, we included about 80% of the observations, and in the testing set, we included about 20% of the observations.
The dependent variable BAD was assigned to the Y variable in the application, and the predictor variables LOAN, MORTDUE, VALUE, DELINQ, and DEBTINC were assigned to the X variable.
The next step was to standardize the predictor variables (variable X) so that all their values had a mean equal to 0 and a standard deviation equal to 1 (Appendix C). Thus, the values of these predictor variables were found in the interval [−1,1]. This standardization was performed to make the analysis as accurate as possible, eliminating large differences in the values between variables, thus bringing them into a common range of values with limits, so that there were no discrepancies in the analysis of the models. The normalization method, min–max scaling (MinMaxScaler()), could also be used, but the normalization method of standard scaling (StandardScaler()) was used, because this technique forms a Gaussian normal distribution of the data, so that the model learns the parameters in a more efficient way. Also, the standard scaling standardization method preserves the useful information of outliers and determines that the algorithm is not easily influenced by outliers, compared to the min–max scaling normalization method.
In practice, the following standardization formula is used:
z = x i μ σ
where:
  • μ represents the mean of the data distribution;
  • σ represents the standard deviation of the data distribution;
  • z represents the standard score.
It is not necessary to use dummy variables, because the dependent variable BAD is a binary discrete variable, which has only two numerical classes (1/0). Dummy variables are variables that take discrete values, usually 0 or 1, to represent the presence or absence of a particular attribute or characteristic. They are used in statistical analysis and econometric modeling to allow for the measurement of the causal effects of a set of independent variables on a dependent variable. If we had factor variables with more than two classes (n classes), we would have had to create n − 1 dummy variables in order to perform the analysis. The creation of dummy variables could have been performed using various methods including LabelEncoder(), OneHotEncoder(), LabelBinarizer(), and OrdinalEncoder(), which assigns binary numeric values of 1 and 0 to categorical, multi-class variables depending on the variables’ classes.
In the next step, the k-fold cross-validation methodology was defined to test the model performance on the testing set.
The k-fold cross-validation method was used to split the data set into a training set and a testing set, so that after each split, each part of the training set became the testing set, and each part of the testing set became the training set, respectively, so at each stage, the accuracy of the model was tested on new data. This aspect can be seen in Figure 10. This cross-validation method is specifically used to reduce overfitting.
Next, we applied several models to the processed data set. We estimated the models on the training set and tested their accuracy and performance on the testing set. Afterwards, we analyzed and compared the results, choosing the optimal model for forecasting.
For each model, hyperparameter tuning was performed. To test the performance and accuracy of the models on the testing set, we chose a number of performance indicators that measure the accuracy of the models and provide the results of their performance on the predictions on the testing set.
The confusion matrix contains the total number of predicted values and actual values. It is a very popular metric used to solve classification problems. This can be applied to binary classifications, but also to multi-class classification problems. Classification models have multiple categorical outputs. Most indicators that measure prediction errors calculate the total error in the model but cannot find the individual cases of error in the model. The model may misclassify more categories than others, but we cannot see this using a standard indicator that measures accuracy. Several specific machine learning algorithms were tested, including Random Forest, K-Nearest Neighbors, Logistic Regression, Extra Trees Classifier, Naïve Bayes, AdaBoost, XGBoost, LightGBM, and the test results are summarized in Table 5.
The first measure of model performance is accuracy testing. This is calculated as the ratio of correctly predicted observations to the total number of observations. To evaluate the performance of each proposed model, the accuracy was calculated. The higher its value, the better the model and the better it is at predicting the observations. In terms of accuracy, the best value was obtained for the AdaBoost model, followed by XGBoost, LightGBM, Random Forest, and K-Nearest Neighbors. Another indicator for performance testing is the precision score, which is calculated as the ratio of correctly anticipated positive observations to the total number of predicted positive observations. A high accuracy score value indicates a low False Positive rate, that is, when the predicted situation is close to or similar to the current situation. For our models, the highest value was obtained by the Extra Trees Classifier, followed by Logistic Regression and AdaBoost.
The next indicator for evaluating the performance of the models is the recall score, which refers to the sensitivity between the correctly predicted positive observations and all actual observations.
A value greater than 0.5 is considered to indicate good model performance from the perspective of sensitivity to observations. From this point of view, the best models are XGBoost and AdaBoost. In order to be able to draw the most pertinent conclusion about the identification of the optimal model, we also use the F1 score, which is calculated as a weighted average between the precision score and the recall score. The best value was obtained by AdaBoost, followed by XGBoost and LightGBM.
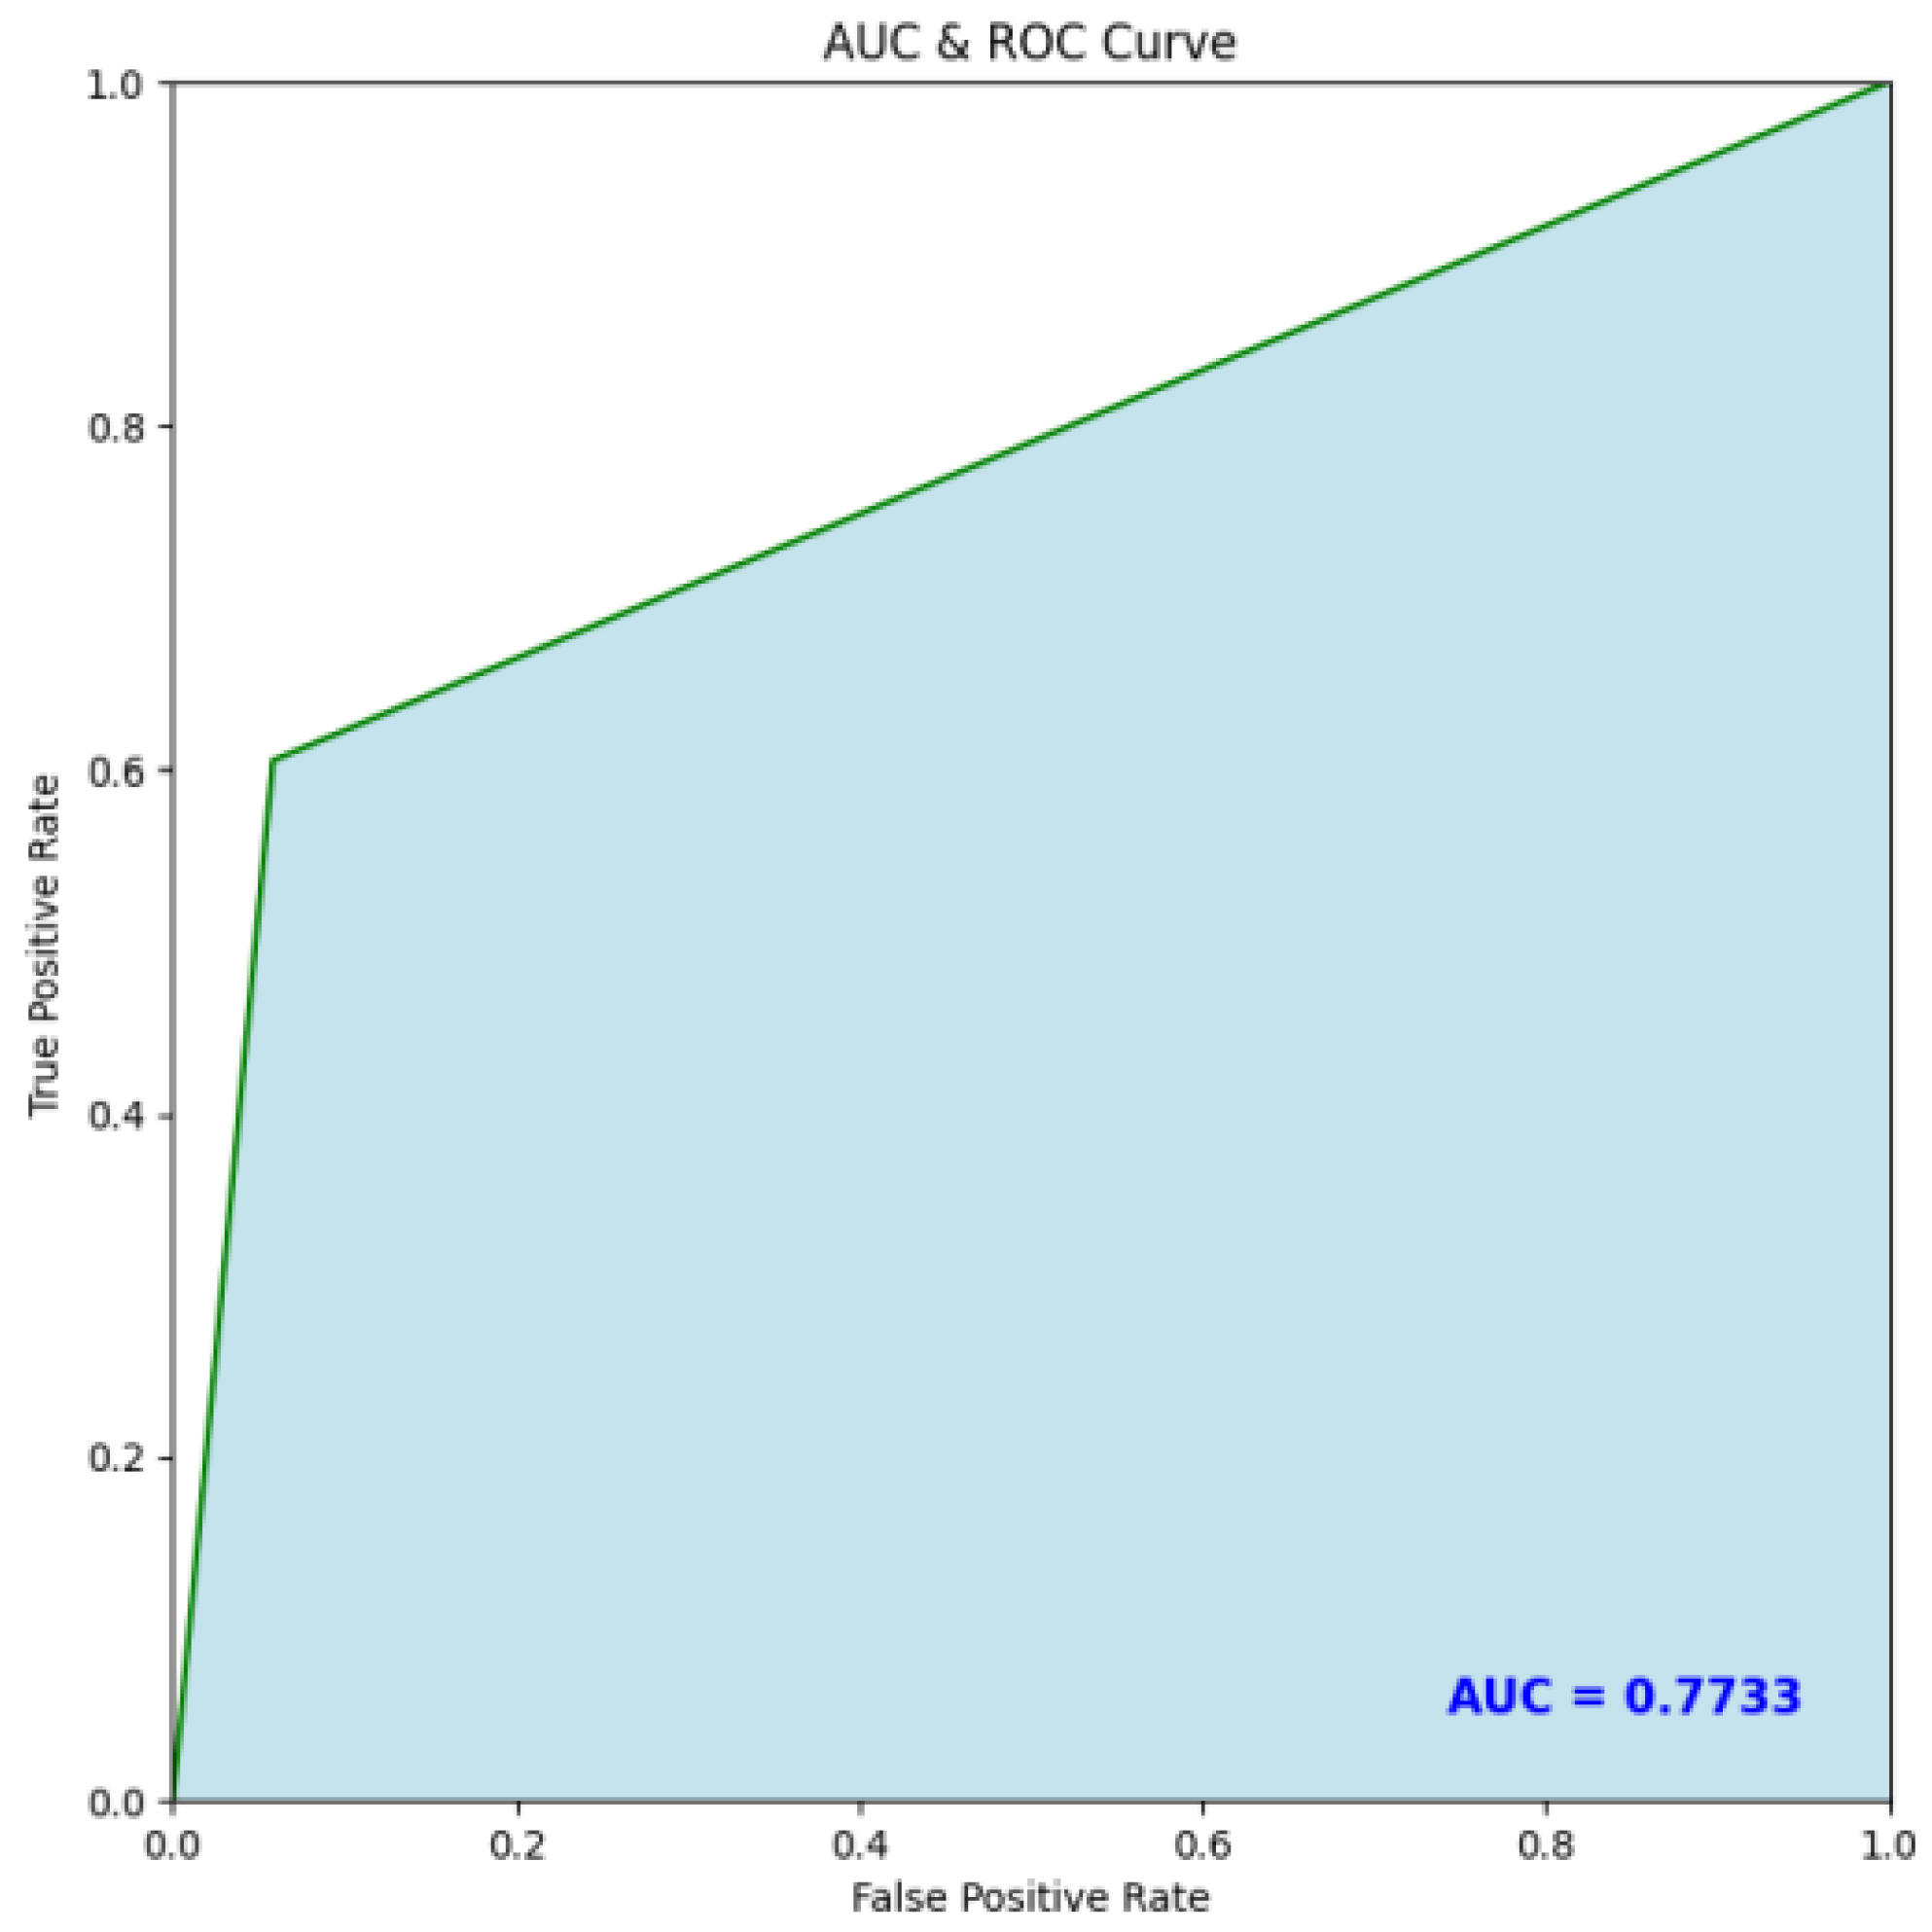
The last indicator to measure the performance of the models used is the AUC Score, which depends on the ROC curve. The ROC curve is a graphical representation that shows the relationship between the True Positive rate and the False Positive rate. The AUC can take values between 0 and 1. If the chosen model has 100% wrong predictions, then the AUC for this model will have a value of 0. Conversely, if all the predictions of the model are correct, then the AUC will have a value of 1. From the perspective of the AUC score, the best model was XGBoost, followed by AdaBoost, LightGBM, Random Forest, and K-Nearest Neighbors.
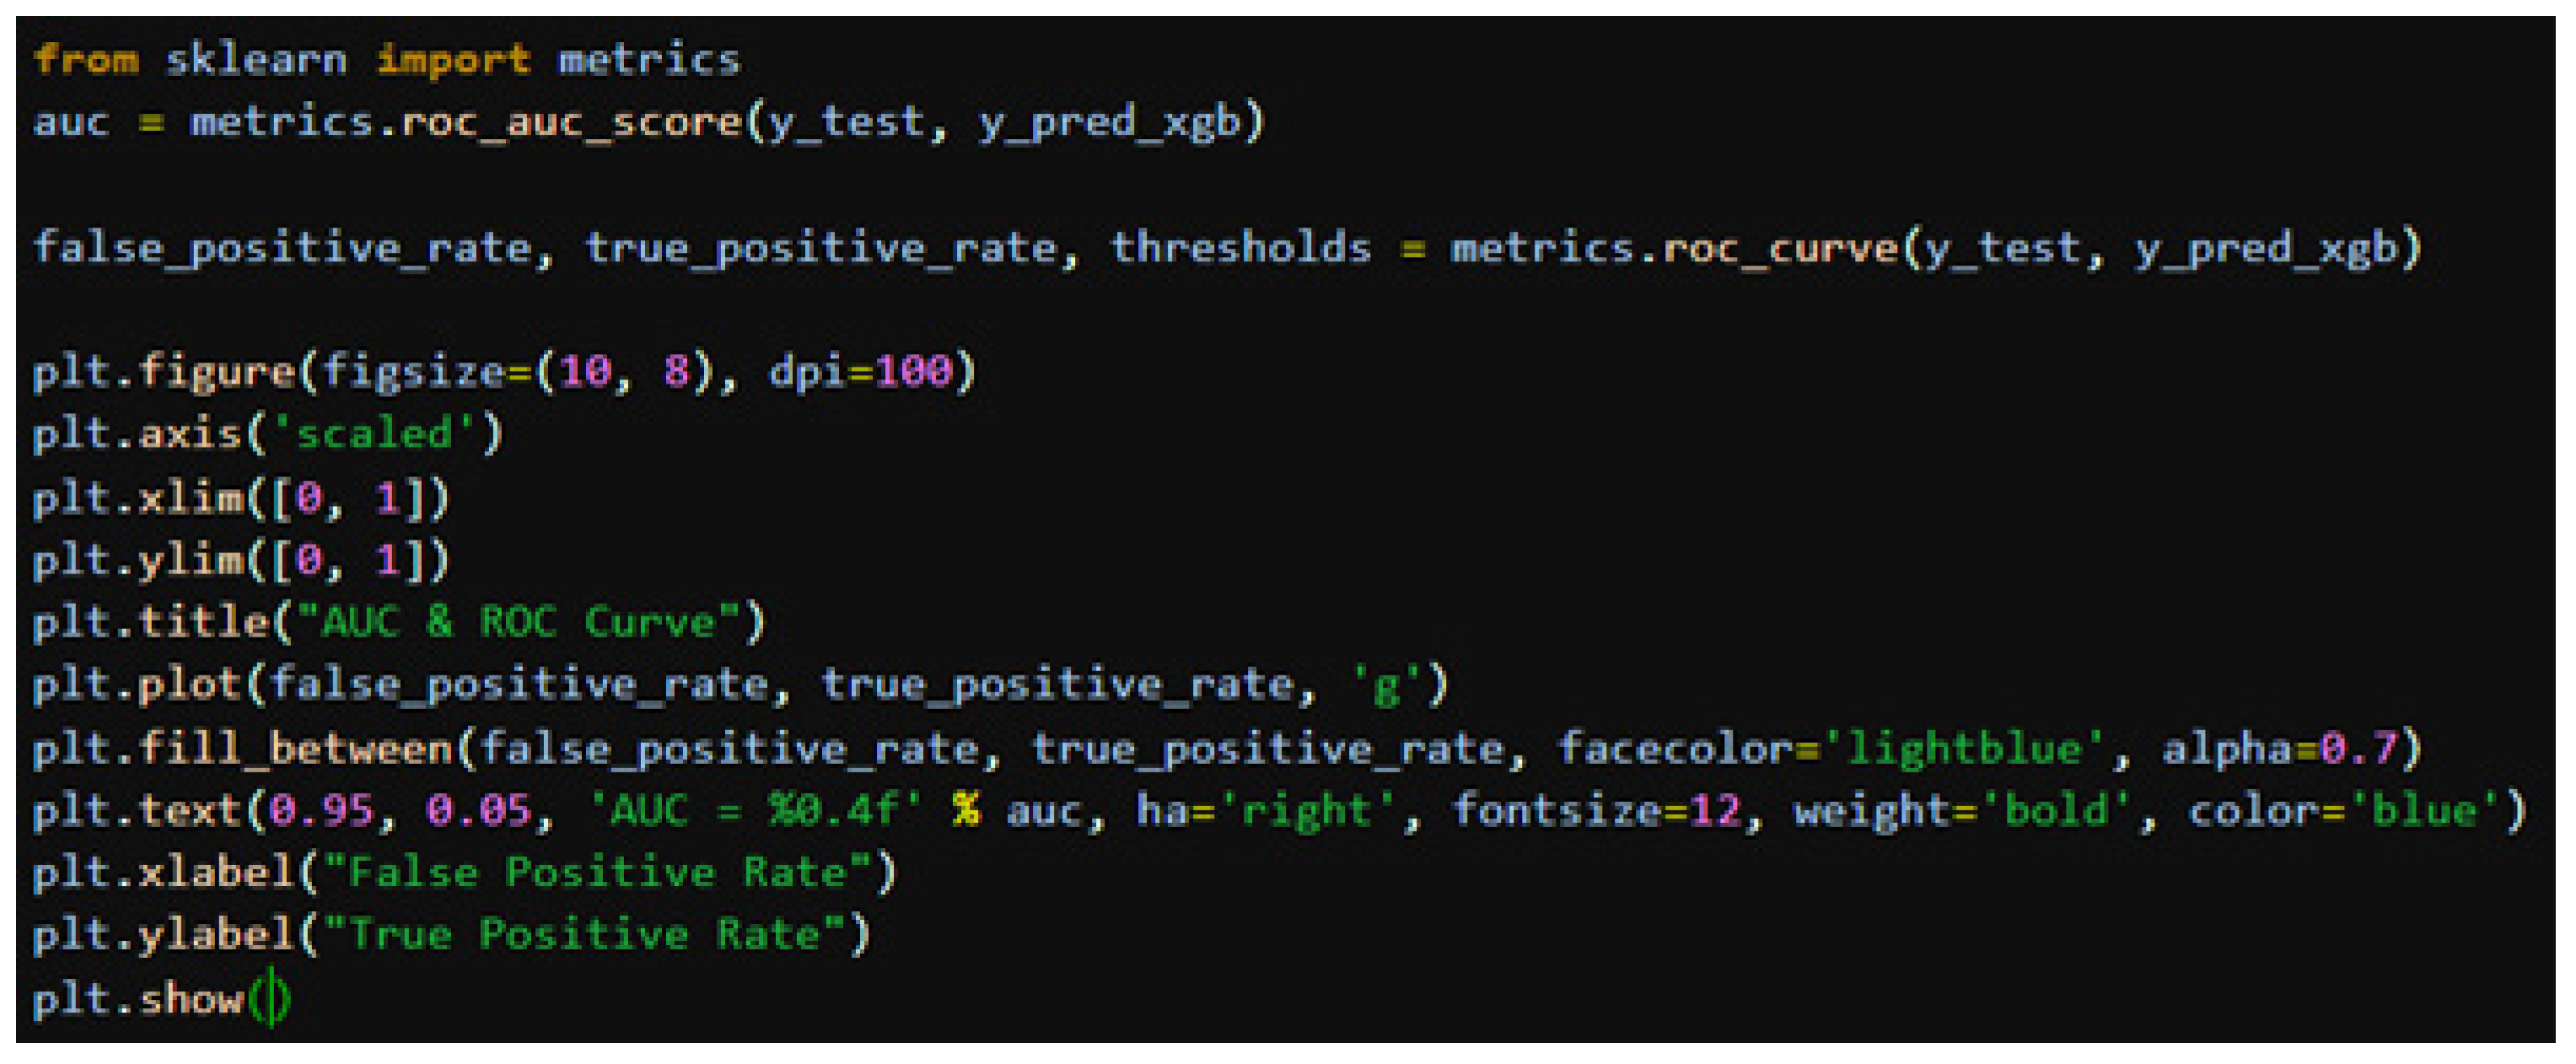
Finally, we plotted the AUC-ROC curve for XGBoost (Appendix D), as it was the model with the best value for the AUC score and performed very well in most of the accuracy and performance evaluation tests, being a possible optimal model (please see Figure 11).
The graphical representation of the ROC curve above illustrates the False Positive rate on the OX axis, and the True Positive rate on the OY axis. The coordinate points (0,0) represent the wrong classification of all examples, and coordinates (1,1) represent the correct classification of all examples. Considering the AUC value of 77.33%, this indicates a good performance of the classification model.
Regarding the emergence of the financial contagion effect, in this case, we can investigate the correlations of the prediction errors. This can become problematic because it can cause incorrect estimates of standard errors, thus distorting the conclusions of the model.
Residual financial contagion refers to the spread of negative financial effects of an economic or financial event to other institutions or markets through their interconnections and relationships. This type of contagion can be caused by a variety of factors, such as the insolvency of a financial institution, liquidity crises, market volatility, or rapid changes in interest rates.
Residual financial contagion can have a significant impact on the global economy by creating a domino effect in the chain of financial institutions and markets. This can lead to a significant decline in financial assets, a decrease in liquidity, and an increase in credit risk for other financial institutions.
To prevent or minimize residual financial contagion, financial regulators and supervisors can take precautionary measures, such as introducing strict risk supervision and control rules, continuously monitoring financial markets, applying stress tests, and maintaining adequate capital and liquidity.
Also, effective communication and increased transparency between financial institutions and regulators can help to prevent residual financial contagion by raising awareness of the risks and vulnerabilities in the financial system.

5.2. Application of Agent-Based Modeling

There were cases of the residual financial contagion effect in Romania. During the financial crisis of 2008, but also in 2012, the problems in the banking system in Romania had a domino effect on other financial institutions.
In 2008, the banking system in Romania and beyond was exposed to significant credit risks generated by the rapid increase in non-performing loans and the exposure to currency risk. This context led to liquidity problems and the need to resort to emergency financing from the National Bank of Romania. In 2012, the same causes led to the emergence of the residual financial contagion effect.
The measures taken by the financial supervision authorities in Romania regarding the safety and stability of the financial system were as follows [50]:
The establishment of the Financial Supervision Authority in 2013 with the aim of improving the supervision of financial institutions in Romania.
The elaboration and introduction of stricter rules and regulations for financial institutions, such as increasing capital requirements and liquidity requirements for banks.
Improving transparency by disseminating relevant information for the financial market and introducing periodic reports communicated by the press.
Developing stress tests and increasing the frequency of audits or inspections that financial institutions are subject to in order to identify risks and take preventive measures.
According to public information on the website of the National Bank of Romania, there are currently 25 commercial banks and seven branches of foreign credit institutions. That is, we have a number of 32 banks [108] that form the banking network in Romania.
Regarding the simulation of the transmission of the residual financial contagion effect, we used agent-based modeling, starting from the research carried out by Gai and Kapadia [86]. The developed model was used to explore how shocks in one part of the financial system can lead to contagion and even the collapse of the entire system.
Based on this information, we will illustrate and simulate the residual financial contagion effect using agent-based modeling and the NetLogo IT solution. We assume that the banking network formed by the 32 banks in Romania are connected to each other through financial transactions (loans, deposits, financial transfers, etc.). Each bank has a capital level and certain banks grant loans to other banks.
The variables used in the model are summarized in Table 6.
Regarding the simulation made in NetLogo, starting from the model developed by Gai and Kapadia, we added procedures to the model to simulate the state of default starting from the bank that has the largest size, and simulated a scenario in which the state of default was installed at the bank with the smallest size. The interface can be viewed in Appendix F. Regarding the description of the modules that can be seen in the interface, they are detailed in Table 7.
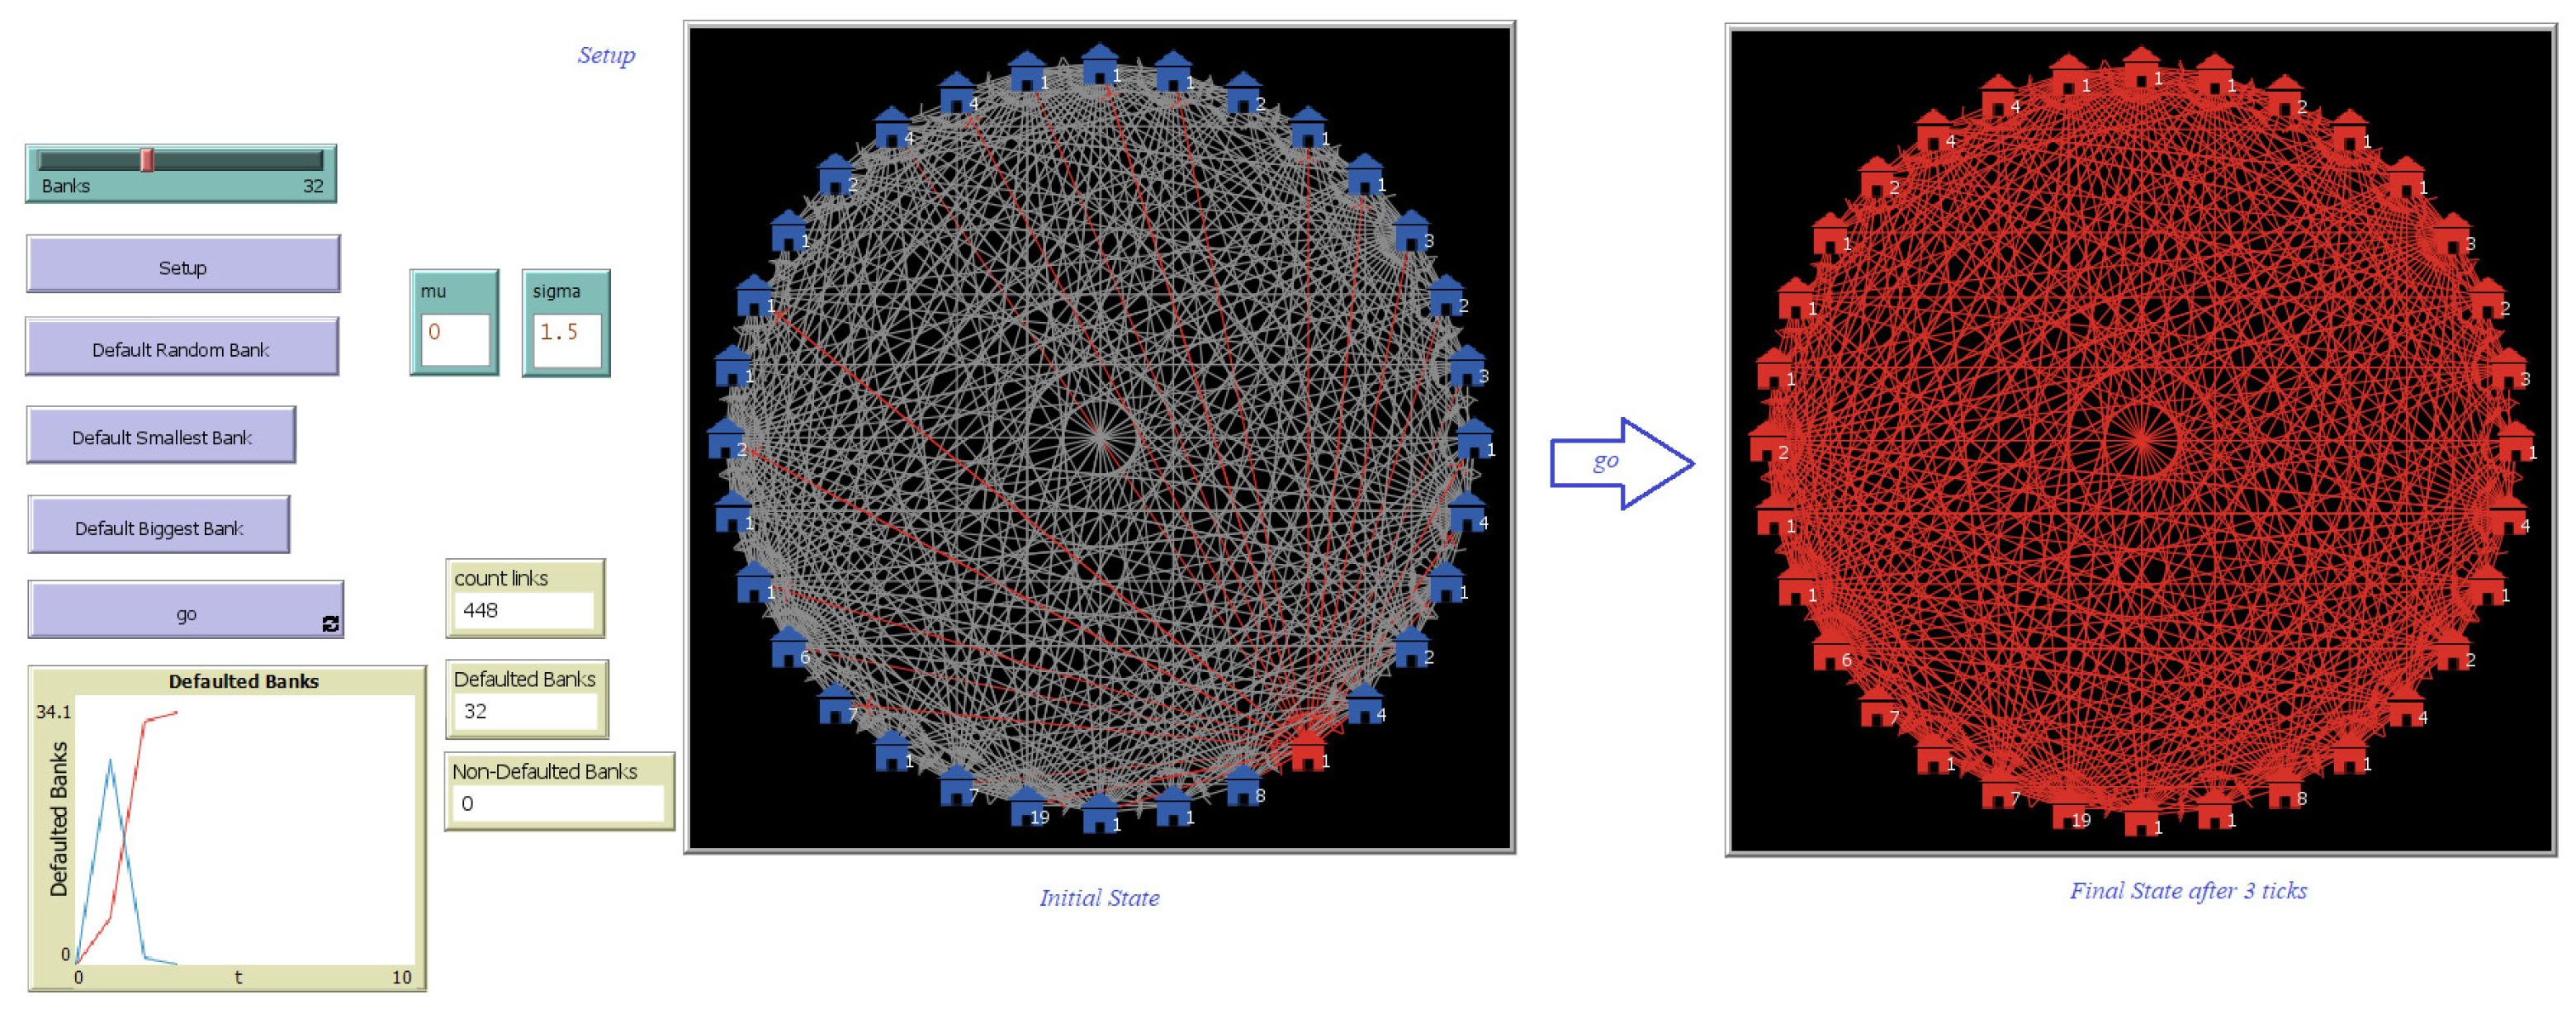
Figure 12 shows an example of a simulation that was made in NetLogo, which considers the following input in the initial stage:
The agents (banks) were initialized;
The interdependencies between the agencies are built randomly, with each bank having a certain size;
The simulation is based on the scenario that one of the banks with the smallest size goes into default.
In the Final State image, it can be seen that the entire network goes into default, with the financial contagion effect being transmitted systemically throughout the entire network. The network was completely contaminated, outlining an effect that can be understood as an economic crisis. The conclusions of this simulation are that although the size of the bank in default is the smallest, connectivity in the network is very important as a property of complex adaptive systems. The selected bank of size 1, as can be seen, interacts through lending relationships or by holding assets with 24 banks out of the remaining 31, which is an aspect that favored the transmission of the contagion effect. Moreover, the bank of size 1 is connected with the bank with the largest size (19), which is an aspect that also influences it.
However, in order to have a holistic picture of the above conclusion, we propose the analysis of three scenarios: the bank that defaults is randomly selected, the defaulting bank with the largest size is selected, and the bank with the smallest size is chosen.
For each scenario, 1000 simulations were carried out. Ticks was considered to be the default entry time, and one tick was considered to be 3 days. For the three scenarios, the results are centralized in Table 8.
Following the three realized scenarios, the following observations were concluded regarding the transmission of the financial contagion effect in the banking network in Romania:
The size of the bank is an important element that influences the transmission of the contagion effect.
The degree of connectivity given by banking transactions carried out in the network has a significant impact on the transmission of the systemic default shock and favors the propagation of the contagion effect.
The level of deposits is again an important element compared to the level of liabilities (interbank loans). In general, according to the simulations, if the level of deposits is higher than the interbank loans, the contagion effect is blurred.
We noticed that in about 1 week (2 ticks), the contagion effect can spread and be installed in the entire banking network.
The simulations carried out are based on the analysis of the residual contagion effect, which represents a situation in which a problem that a bank has can affect other banks, even after the initial problem has been solved. The residual financial contagion is transmitted in the network through direct exposures, as we observed in the simulations, when a bank has debts or loans to other banks, especially when they are non-performing. In dealing with the emergence of the risk of financial contagion, regulatory authorities must have an active role in monitoring and managing systemic events in the banking system. Considering the simulations above, we can conclude that regardless of the form of financial contagion, its effects can be devastating when these effects cannot be predicted, or when they are not detected in time to be avoided. The simulation carried out in NetLogo offers an important perspective on systemic risks and can help us to identify effective solutions to manage these risks and to reduce the effects of financial contagion.

6. Conclusions

Considering the uncertainty of the current economic environment, financial contagion can be caused by a variety of factors such as fluctuations in the interest rate or exchange rate, interconnections between banks, the increase in the inflation rate, the increase in production costs, or the lack of diversification.
Currently, the specialized literature presents the factors that contribute to the creation of financial contagion, and most of the time, spillover contagion is the most frequently studied form.
Our research highlights the importance of studying financial contagion and its impact on the banking market within the broader context of economic and business sustainability. The analysis sheds light on the potential risks and vulnerabilities within the mortgage loan sector, which are crucial factors to consider for sustainable economic growth and stability. By exploring the link between financial contagion and sustainability, this study contributes to a comprehensive understanding of the economic and business aspects of sustainability in the specific context of the banking market in Romania.
The novelty of this research is the focus on residual contagion. This form of contagion is illustrated by the fact that when a bank is negatively affected or goes into default, it can transmit negative effects to other banks through the banking network and through the phenomenon of financial interconnection. This can be described as a residual effect because it can form following other phenomena of financial contagion, as can be seen in the simulations made in NetLogo. When a bank faces a solvency problem or cannot pay its debts to other banks in its interconnected network, these defaulted banks thus face liquidity problems and cannot face payment requests from their customers, which can lead to the collapse of other banks in their network.
It is very important for a bank to have a healthy and diverse loan portfolio. From this perspective, the bank develops, implements, and periodically validates credit risk models that are adapted to the economic context and the profile of the loaned client. Machine learning algorithms are recommended by the latest research in the field for the construction of these credit risk models and have a significant impact on all types of bank loans.
Based on the results obtained by the ML algorithms, the best models from the perspective of performance metrics (accuracy, precision, recall score, F1 score, and AUC curve) are the boosting algorithms XGBoost, AdaBoost, and LightGBM.
After processing the data and applying the model to them, the accuracy tests as well as the other performance measurement indicators performed very well, indicating that the probability of predicting a customer’s loan repayment is very high. This ability to predict a loan repayment by customers has a major impact and brings value to banking systems. Through these predictions, the bank can manage and resolve cases more effectively and plan its processes in a more efficient manner. These types of predictions can be valuable assets and improve processes not only in banking systems, but in many other industries as well.
Based on the agent-based modeling made in NetLogo, the model developed by Kai and Kapadia [86] helped us build some simulations to highlight how the residual financial contagion effect propagates in the banking network in Romania. The simulations highlighted the fact that the degree of connectivity between the commercial banks in Romania and the way in which they are interconnected have a major importance in the emergence and propagation of contagion effects.
The conclusions of this research can be considered as both general conclusions that can be applied to banking systems worldwide, as well as conclusions that are specific to Romania. However, from the perspective of regulations and policies, banking institutions may be subject to different regulatory frameworks. In the case of Romania, the National Bank of Romania issues and enforces certain regulations and procedural frameworks, but banks may also be subject to specific criteria set by the European Central Bank, guidelines issued by the European Banking Authority, or other supervisory institutions. The results of applying this research in any of the banking institutions in Romania can contribute to identifying scenarios that highlight certain residual risks that have not been observed until now. These aspects can be formalized through the improvement of internal and external regulatory frameworks.
Future research directions in the area of exploring the residual financial contagion effect should consider the implications of cybernetic systems on the banking network by illustrating the properties of complex adaptive systems. For example, in the research carried out in this paper, the following properties can be easily identified: connectivity, which is illustrated by the relationships and interconnections between the banks that form the banking network in Romania, and co-evolution and adaptability, which are highlighted by the way in which certain banks stabilize to the default effects of other banks and adapt to the current economic context by using machine learning algorithms. On the other hand, besides the analysis of the banking network as a complex, cybernetic, and dynamic adaptive system, it is interesting to apply econometric tests to investigate the effects of banking residuals and the emergence of the residual contagion effect. Another important research direction can be to analyze the impact of green credit on financial contagion. By doing so, we can identify aspects that explain how measures of green credit issuance or environmental performance indicators are incorporated into models. Researchers can outline assumptions and hypotheses regarding the relationship between green practices and the propagation of residual contagion in the banking sector.

Author Contributions

Conceptualization, Ș.I.; data curation, I.N.; formal analysis, Ș.I.; investigation, Ș.I., N.C. and I.N.; methodology, Ș.I.; project administration, C.D.; software, Ș.I.; supervision, C.D.; validation, Ș.I., N.C. and I.N.; visualization, N.C. and C.D.; writing—original draft, Ș.I.; writing—review and editing, N.C., I.N. and C.D. All authors have read and agreed to the published version of the manuscript.

Funding

This research received no external funding.

Institutional Review Board Statement

Not applicable.

Informed Consent Statement

Not applicable.

Acknowledgments

This paper was co-financed by the Bucharest University of Economic Studies during the PhD program.

Conflicts of Interest

The authors declare no conflict of interest.

Appendix A

Figure A1. Identifying missing values.
Sustainability 15 12037 g0a1
Figure A2. Replacing missing values and 0 values with the mean.
Sustainability 15 12037 g0a2
Figure A3. The first 5 observations of the data set with the columns REASON and JOB removed.
Sustainability 15 12037 g0a3

Appendix B

Figure A4. Splitting the data set into training and testing sets.
Sustainability 15 12037 g0a4
Figure A5. Observing the structure/dimensionality of the variables on training and testing sets.
Sustainability 15 12037 g0a5

Appendix C

Figure A6. Data standardization.
Sustainability 15 12037 g0a6

Appendix D

Figure A7. Designing the AUC-ROC curve.
Sustainability 15 12037 g0a7

Appendix E

Figure A8. Library’s import.
Sustainability 15 12037 g0a8

Appendix F

Figure A9. NetLogo interface.
Sustainability 15 12037 g0a9

References

  1. Wamba-Taguimdje, S.L.; Wamba, S.F.; Kamdjoug, J.R.K.; Wanko, C.E.T. Influence of Artificial Intelligence (AI) on Firm Performance: The Business Value of AI-based Transformation Projects. Bus. Process. Manag. J. 2020, 26, 1893–1924. [Google Scholar] [CrossRef]
  2. Yigitcanlar, T.; Degirmenci, K.; Inkinen, T. Drivers behind the public perception of artificial intelligence: Insights from major Australian cities. AI Soc. 2022. [Google Scholar] [CrossRef]
  3. ITUTrends. Assessing the Economic Impact of Artificial Intelligence. Available online: https://www.itu.int/dms_pub/itu-s/opb/gen/S-GEN-ISSUEPAPER-2018-1-PDF-E.pdf (accessed on 10 February 2023).
  4. McKinsey Company. Notes from the AI Frontier. Modeling the Impact of AI on the World Economy. Available online: https://www.mckinsey.com/~/media/McKinsey/Featured%20Insights/Artificial%20Intelligence/Notes%20from%20the%20frontier%20Modeling%20the%20impact%20of%20AI%20on%20the%20world%20economy/MGI-Notes-from-the-AI-frontier-Modeling-the-impact-of-AI-on-the-world-economy-September-2018.ashx (accessed on 10 February 2023).
  5. Moreira, M.A.L.; de Souza Rocha Junior, C.; de Lima Silva, D.F.; de Castro Junior, M.A.P.; de Araujo Costa, I.P.; Gomes, C.F.S.; dos Santos, M. Exploratory analysis and implementation of machine learning techniques for predictive assessment of fraud in banking systems. Procedia Comput. Sci. 2022, 214, 117–124. [Google Scholar] [CrossRef]
  6. Nazareth, N.; Reddy, Y.V.R. Financial applications of machine learning: A literature review. Expert Syst. Appl. 2023, 219, 119640. [Google Scholar] [CrossRef]
  7. Mahalakshmi, V.; Kulkarni, N.; Kumar, K.V.P.; Kumar, K.S.; Sree, D.N.; Durga, S. The role of implementing Artificial Intelligence and Machine Learning Technologies in the financial services Industry for creating Competitive Intelligence. Mater. Proc. 2022, 56 Pt 4, 2252–2255. [Google Scholar] [CrossRef]
  8. Startupcafe. Transilvania Bank’s Statement Regarding the Use of Artificial Intelligence in Several Departments. Available online: https://www.startupcafe.ro/smart-tech/inteligenta-artificiala-romania-startup-banci-functionari-publici.htm (accessed on 10 February 2023).
  9. Microsoft. Announcement Regarding the Partnership between Microsoft and Banca Transilvania Regarding the Creation of Two Chatbots. Available online: https://customers.microsoft.com/en-us/story/760664-banca-transilvania-banking-azure-ro-romania (accessed on 10 February 2023).
  10. ING Bank. Press Release Regarding the Use of Artificial Intelligence by Cyber Attackers. Available online: https://ing.ro/informatii-utile/ING-Bank-si-DNSC-fac-apel-la-vigilenta (accessed on 10 February 2023).
  11. Costanzino, N.; Curran, M. A Simple Traffic Light Approach to Backtesting Expected Shortfall. Risks 2018, 6, 2. [Google Scholar] [CrossRef] [Green Version]
  12. Fang, M.; Yang, S.; Lei, Y. Residual contagion in emerging markets: ‘herd’ and ‘alarm’ effects in informatization. Electron. Commer. Res. 2021, 21, 787–807. [Google Scholar] [CrossRef] [Green Version]
  13. Scarlat, E.; Chirita, N. Cibernetica Sistemelor Economice—Editia a Treia; Editura Economică: Bucharest, Romania, 2019. [Google Scholar]
  14. Al-Dosari, K.; Fetais, N.; Kucukvar, M. Artificial Intelligence and Cyber Defense System for Banking Industry: A qualitative study of AI applications and challenges. Cybern. Syst. J. 2022. [Google Scholar] [CrossRef]
  15. Ranjan, P.; Santhosh, K.; Kumar, A.; Kumar, S. Fraud Detection on Bank Payments using Machine Learning. In Proceedings of the 2022 International Conference for Advancement in Technology (ICONAT), Goa, India, 21–22 January 2022. [Google Scholar] [CrossRef]
  16. Ali, A.; Abd Razak, S.; Othman, S.H.; Eisa, T.A.E.; Al-Dhaqm, A.; Nasser, M.; Elhassan, T.; Elshafie, H.; Saif, A. Financial Fraud Detection Based on Machine Learning: A Systematic Literature Review. Appl. Sci. 2022, 12, 9637. [Google Scholar] [CrossRef]
  17. Sargent, H. Algorithmic decision-making in financial services: Economic and normative outcomes in consumer credit. AI Ethics 2022. [Google Scholar] [CrossRef]
  18. OECD. Artificial Intelligence, Machine Learning and Big Data in Finance. Opportunities, Challenges and Implications for Policy Makers. 2021. Available online: https://www.oecd.org/finance/artificial-intelligence-machine-learningbig-data-in-finance.htm (accessed on 10 February 2023).
  19. Herrmann, H.; Masawi, B. Three and a half decades of artificial intelligence in banking, financial services, and insurance: A systematic evolutionary review. Strat. Chang. 2022, 31, 549–569. [Google Scholar] [CrossRef]
  20. Goldstein, I. Chapter 36—Empirical Literature on Financial Crises: Fundamentals vs. Panic. In The Evidence and Impact of Financial Globalization; Elsevier: Amsterdam, The Netherlands, 2013; pp. 523–534. [Google Scholar]
  21. National Bank of Romania. Financial Stability Report. Available online: https://www.bnr.ro/Regular-publications-2504.aspx (accessed on 10 February 2023).
  22. Bancherul. Transilvania Bank Implements an Artificial Intelligence Solution. Available online: https://www.bancherul.ro/stire.php?id_stire=20618&titlu=banca-transilvania-implementeaza-o-solutie-de-inteligenta-artificiala (accessed on 10 February 2023).
  23. Ziarul Financiar. The Need for Artificial Intelligence in Combating the Risks of Bank Fraud. Available online: https://www.zf.ro/info/p-necesitatea-inteligentei-artificiale-in-combaterea-riscurilor-20326047 (accessed on 10 February 2023).
  24. NOCASH. Artificial Intelligence is Making Its Way into Romanian Banks—Banca Transilvania Signs a Partnership with an Israeli Fintech. Available online: https://nocash.ro/inteligenta-artificiala-isi-face-loc-in-bancile-din-romania-banca-transilvania-semneaza-un-parteneriat-cu-un-fintech-israelian/ (accessed on 10 February 2023).
  25. Merriam-Webster. Available online: https://www.merriamwebster.com/dictionary/contagion (accessed on 10 February 2023).
  26. Cambridge Dictionary. Available online: https://dictionary.cambridge.org/dictionary/english/contagion (accessed on 10 February 2023).
  27. Oxford Dictionary. Available online: https://www.oxfordlearnersdictionaries.com/definition/american_english/contagion (accessed on 10 February 2023).
  28. Zheng, C. An innovative MS-VAR model with integrated financial knowledge for measuring the impact of stock market bubbles in financial security. J. Innov. Knowl. 2022, 7, 100207. [Google Scholar] [CrossRef]
  29. Puneet, M. Machine Learning Applications Using Python; Apress: Berkeley, CA, USA, 2018. [Google Scholar]
  30. Fares, O.; Butt, I.; Lee, S.H.M. Utilization of Artificial Intelligence in the banking sector: A systematic literature review. J. Financial Serv. Mark. 2022. [Google Scholar] [CrossRef]
  31. Ris, K.; Stankovic, Z.; Avramovic, Z. Implications of Implementation of Artificial Intelligence in the Banking Business with Correlation to the Human Factor. J. Comput. Commun. 2020, 08, 130–144. [Google Scholar] [CrossRef]
  32. Sadok, H.; Sakka, F.; El Maknouzi, M. Artificial intelligence and bank credit analysis. A review. Cogent Econ. Finance 2022, 10, 2023262. [Google Scholar] [CrossRef]
  33. Trenca, I.; Dezsi, E. Financial contagion on the Romanian stock market. In Finante—Provocarile Viitorului (Finance—Challenges of the Future); University of Craiova, Faculty of Economics and Business Administration: Craiova, Romania, 2012; Volume 1, pp. 27–36. [Google Scholar]
  34. Carausu, D.N. Fianncial Contagion in the Recent Fiancial Crisis: Evidence form the Romanian Capital Market. In Ovidius University Annals, Economic Sciences Series; Ovidius University of Constantza, Faculty of Economic Sciences: Constanța, Romania, 2017; Volume XVII, Issue 2. [Google Scholar]
  35. Țilică, E.V. Financial Contagion Patterns in Individual Economic Sectors. The Day-of-the-Week Effect from the Polish, Russian and Romanian Markets. J. Risk Financ. Manag. 2021, 14, 442. [Google Scholar] [CrossRef]
  36. Bookstaber, R. Agent-Based Models for Financial Crises. Annu. Rev. Financ. Econ. 2017, 9, 85–100. [Google Scholar] [CrossRef]
  37. Silva, T.C.; da Silva, M.A.; Tabak, B.M. Systemic risk in financial systems: A feedback approach. J. Econ. Behav. Organ. 2017, 144, 97–120. [Google Scholar] [CrossRef]
  38. Gajurel, D.; Dungey, M. Systematic Contagion Effects of the Global Finance Crisis: Evidence from the World’s Largest Advanced and Emerging Equity Markets. J. Risk Financ. Manag. 2023, 16, 182. [Google Scholar] [CrossRef]
  39. Zhang, B.; Xie, X.; Li, C. How Connected Is China’s Systemic Financial Risk Contagion Network?—A Dynamic Network Perspective Analysis. Mathematics 2023, 11, 2267. [Google Scholar] [CrossRef]
  40. Tsagkanos, A.; Sharma, A.; Ghosh, B. Green Bonds and Commodities: A New Asymmetric Sustainable Relationship. Sustainability 2022, 14, 6852. [Google Scholar] [CrossRef]
  41. Naeem, M.A.; Karim, S.; Yarovaya, L.; Lucey, B.M. Systemic risk contagion of green and Islamic markets with conventional markets. Ann. Oper. Res. 2023. [Google Scholar] [CrossRef]
  42. Lian, Y.; Gao, J.; Ye, T. How does green credit affect the financial performance of commercial banks?—Evidence from China. J. Clean. Prod. 2022, 344, 131069. [Google Scholar] [CrossRef]
  43. National Bank of Romania. Financial Stability Report. Available online: https://www.bnr.ro/PublicationDocuments.aspx?icid=19968 (accessed on 14 February 2023).
  44. The Government of Romania. Emergency Ordinance No. 37 of March 30. 2020. Available online: https://legislatie.just.ro/Public/DetaliiDocument/224489 (accessed on 14 February 2023).
  45. National Bank of Romania. Financial Stability Report. Available online: https://www.bnr.ro/Raportul-asupra-stabilita%c8%9bii-financiare---decembrie-2022-25453.aspx (accessed on 14 February 2023).
  46. Federal Reserve History. Asian Financial Crisis. Available online: https://www.federalreservehistory.org/essays/asian-financial-crisis (accessed on 14 February 2023).
  47. Hoppit, J. The myths of the South Sea Bubble. Trans. R. Hist. Soc. 2002, 12, 141–165. [Google Scholar] [CrossRef] [Green Version]
  48. Bruner, R.F.; Miller, S.C. The first modern financial crises: The South Sea and Mississippi Bubbles in Historical Perspective. J. Appl. Corp. Financ. 2020, 32, 17–33. [Google Scholar] [CrossRef]
  49. Thakor, A. The Financial Crisis of 2007–2009: Why did it happen and what did we learn? Rev. Corp. Financ. Stud. Rev. Corp. Finance Stud. 2015, 4, 155–205. [Google Scholar] [CrossRef] [Green Version]
  50. National Bank of Romania. The Role of the NBR in Maintaining Financial Stability. Available online: https://www.bnr.ro/Stabilitate-financiara---Rolul-BNR-3114-Mobile.aspx (accessed on 14 February 2023).
  51. Acharya, V.V.; Pedersen, L.H.; Philippon, T.; Richardson, M. Measuring Systemic Risk. Rev. Financ. Stud. 2017, 30, 2–47. [Google Scholar] [CrossRef] [Green Version]
  52. Sarker, I.H. Machine Learning: Algorithms, Real-World Applications and Research Directions. SN Comput. Sci. 2021, 2, 160. [Google Scholar] [CrossRef]
  53. Edgar, T.; Manz, D.O. Chapter 6—Machine Learning. In Research Methods for Cyber Security; Syngress: Oxford, UK, 2017; pp. 153–173. [Google Scholar] [CrossRef]
  54. Wang, Y.; Zhang, Y.; Lu, Y.; Yu, X. A comparative assessment of Credit Risk Model Based on Machine Learning—A case study of bank loan data. Procedia Comput. Sci. 2020, 174, 141–149. [Google Scholar] [CrossRef]
  55. Breiman, L. Random Forests. Mach. Learn. 2001, 45, 5–32. [Google Scholar] [CrossRef] [Green Version]
  56. Towardsdatascience. Random Forest in Phyton. Available online: https://towardsdatascience.com/random-forest-in-python-24d0893d51c0 (accessed on 14 February 2023).
  57. IBM. K-Nearest Neighbors Algorithm. Available online: https://www.ibm.com/topics/knn (accessed on 15 February 2023).
  58. Analytics Vidhaya. Understanding Distance Metrics Used in Machine Learning. Available online: https://www.analyticsvidhya.com/blog/2020/02/4-types-of-distance-metrics-in-machine-learning/ (accessed on 15 February 2023).
  59. Towardsdatascience. Building a Logistic Regression in Python, Step by Step. Available online: https://towardsdatascience.com/building-a-logistic-regression-in-python-step-by-step-becd4d56c9c8 (accessed on 15 February 2023).
  60. Liew, B.; Kovacs, F.; Rugamer, D.; Royuela, A. Machine learning versus logistic regression for prognostic modelling in individuals with non-specific neck pain. Eur. Spine J. 2022, 31, 2082–2091. [Google Scholar] [CrossRef] [PubMed]
  61. Analytics Vidhya. The Math Behind Logistic Regression. Available online: https://medium.com/analytics-vidhya/the-math-behind-logistic-regression-c2f04ca27bca (accessed on 15 February 2023).
  62. Towards AI. Logistic Regression with Mathematics. Available online: https://towardsai.net/p/machine-learning/logistic-regression-with-mathematics (accessed on 15 February 2023).
  63. Addo, P.M.; Guegan, D.; Hassani, B. Credit Risk Analysis Using Machine and Deep Learning Models. Risks 2018, 6, 38. [Google Scholar] [CrossRef] [Green Version]
  64. Yu, Y.; Nguyen, T.; Li, J.; Sanchez, L.; Nguyen, A. Predicting elastic modulus degradation of alkali silica reaction affected concrete using soft computing techniques: A comparative study. Constr. Build. Mater. 2020, 274, 122024. [Google Scholar] [CrossRef]
  65. Aggarwal, C.C. Neural Networks and Deep Learning; Springer International Publishing AG: Cham, Switzerland, 2018. [Google Scholar]
  66. Ibrahem Ahmed Osman, A.; Najah, A.A.; Chow, M.; Feng, H.Y.; El-Shafie, A. Extreme gradient boosting (Xgboost) model to predict thegroundwater levels in Selangor Malaysia. Ain Shams Eng. J. 2021, 12, 1545–1556. [Google Scholar] [CrossRef]
  67. Dhieb, N.; Ghazzai, H.; Besbes, H.; Massoud, Y. Extreme Gradient Boosting Machine Learning Algorithm for Safe Auto Insurance Operations. In Proceedings of the 2019 IEEE International Conference on Vehicular Electronics and Safety, Cairo, Egypt, 4–6 September 2019. [Google Scholar]
  68. Probst, P.; Wright, M.; Boulesteix, A.-L. Hyperparameters and Tuning Strategies for Random Forest. Wiley Interdiscip. Rev. Data Min. Knowl. Discov. 2019, 9, e1301. [Google Scholar] [CrossRef] [Green Version]
  69. Haghighi, S.; Jasemi, M.; Hessabi, S.; Zolanvari, A. PyCM: Multiclass confusion matrix library in Python. J. Open Source Softw. 2018, 3, 729. [Google Scholar] [CrossRef] [Green Version]
  70. Nica, I.; Alexandru, D.B.; Crăciunescu, S.L.P.; Ionescu, Ș. Automated Valuation Modelling: Analysing Mortgage Behavioural Life Profile Models Using Machine Learning Techniques. Sustainability 2021, 13, 5162. [Google Scholar] [CrossRef]
  71. Economic Times. What Is Commercial Bank. Available online: https://economictimes.indiatimes.com/definition/commercial-bank (accessed on 16 February 2023).
  72. Miller, J.H.; Scott, E.P. Complex Adaptive Systems: An Introduction to Computational Models of Social Life; Princeton University Press: Princeton, NJ, USA, 2007. [Google Scholar]
  73. Rand, W.; Rust, R.T. Agent-based modeling in marketing: Guidelines for rigor. Int. J. Res. Mark. 2011, 28, 181–193. [Google Scholar] [CrossRef]
  74. Delcea, C.; Cotfas, L.-A.; Salari, M.; Milne, R.J. Investigating the Random Seat Boarding Method without Seat Assignments with Common Boarding Practices Using an Agent-Based Modeling. Sustainability 2018, 10, 4623. [Google Scholar] [CrossRef] [Green Version]
  75. DeAngelis, D.L.; Diaz, S.G. Decision-Making in Agent-Based Modeling: A current review and future prospectus. Front. Ecol. Evol. Sec. Behav. Evol. Ecol. 2018, 6. [Google Scholar] [CrossRef] [Green Version]
  76. Pan, X.; Han, C.S.; Law, K.H. A multi-agent based simulation framework for the study of human and social behavior in egress analysis. In Proceedings of the International Conference on Computing in Civil Engineering, Cancun, Mexico, 12–15 July 2005. [Google Scholar]
  77. Ionescu, S.; Nica, I.; Chirita, N. Cybernetics Approach Using Agent-Based Modeling in the Process of Evacuating Educational Institutions in Case of Disasters. Sustainability 2021, 13, 10277. [Google Scholar] [CrossRef]
  78. Delcea, C.; Bradea, I.A. Economic Cybernetics. An Equation-Based Modeling and Agent-Based Modeling Approach. Universitara Printinghouse: Bucharest, Romania, 2017; ISBN 978-606-28-0629-3. [Google Scholar]
  79. Railsback, S.; Grimm, V. Agent-Based and Individual-Based Modeling: A Practical Introduction, 2nd ed.; Princeton University Press: Princeton, NJ, USA, 2019. [Google Scholar]
  80. Chan-Lau, J.A. ABBA: An Agent-Based Model of Banking System; IMF Working Paper/17/136; International Monetary Fund: Bretton Woods, NH, USA, 2017. [Google Scholar]
  81. Simudyne. A Complete Guide to Agent-Based Modeling for Financial Services. Available online: https://simudyne.com/wp-content/uploads/2019/08/A4-Guide-to-ABM-FINAL-5.pdf (accessed on 16 February 2023).
  82. Steinbacher, M.; Raddant, M.; Karimi, F.; Cuena, E.C.; Alfarano, S.; Iori, G.; Lux, T. Advances in the agent-based modeling of economic and social behavior. SN Bus. Econ. 2021, 1, 99. [Google Scholar] [CrossRef] [PubMed]
  83. Chakraborty, S. Developing Agent-Based Models to Study Financial Markets. Digital Commons @ University of South Florida. Available online: https://digitalcommons.usf.edu/cgi/viewcontent.cgi?article=10119&context=etd (accessed on 16 February 2023).
  84. Halaj, G. Agent-Based Model of System-Wide Implications of Funding Risk; Working Paper Series, No. 2121; European Central Bank: Frankfurt, Germany, 2018. [Google Scholar]
  85. Bruch, E.; Atwell, J. Agent-Based Models in Empirical Social Research. Sociol. Methods Res. 2013, 44, 186–221. [Google Scholar] [CrossRef] [PubMed] [Green Version]
  86. Gai, P.; Kapadia, S. Contagion in financial networks. Proc. R. Soc. A Math. Phys. Eng. Sci. 2010, 466, 2401–2423. [Google Scholar] [CrossRef]
  87. Wilensky, U.; Rand, W. An Introduction to Agent-Based Modeling: Modeling Natural, Social, and Engineered Complex Systems with NetLogo; MIT Press: Cambridge, MA, USA, 2015; ISBN 978-0-262-73189-8. [Google Scholar]
  88. Milne, R.J.; Delcea, C.; Cotfas, L.-A.; Ioanas, C. Evaluation of Boarding Methods Adapted for Social Distancing When Using Apron Buses. IEEE Access 2020, 8, 151650–151667. [Google Scholar] [CrossRef] [PubMed]
  89. Cotfas, L.-A.; Delcea, C.; Mancini, S.; Ponsiglione, C.; Vitiello, L. An Agent-Based Model for Cruise Ship Evacuation Considering the Presence of Smart Technologies on Board. Expert Syst. Appl. 2023, 214, 119124. [Google Scholar] [CrossRef]
  90. Cotfas, L.-A.; Delcea, C.; Iancu, L.-D.; Ioanas, C.; Ponsiglione, C. Large Event Halls Evacuation Using an Agent-Based Modeling Approach. IEEE Access 2022, 10, 49359–49384. [Google Scholar] [CrossRef]
  91. Milne, R.J.; Delcea, C.; Cotfas, L.-A. Airplane Boarding Methods That Reduce Risk from COVID-19. Saf. Sci. 2021, 134, 105061. [Google Scholar] [CrossRef]
  92. Milne, R.J.; Delcea, C.; Cotfas, L.-A.; Craciun, L.; Molanescu, A.G. Health Risks of Airplane Boarding Methods with Apron Buses When Some Passengers Disregard Safe Social Distancing. PLoS ONE 2022, 17, e0271544. [Google Scholar] [CrossRef]
  93. Ponsiglione, C.; Roma, V.; Zampella, F.; Zollo, G. The Fairness/Efficiency Issue Explored Through El Farol Bar Model. In Scientific Methods for the Treatment of Uncertainty in Social Sciences; Gil-Aluja, J., Terceño-Gómez, A., Ferrer-Comalat, J.C., Merigó-Lindahl, J.M., Linares-Mustarós, S., Eds.; Advances in Intelligent Systems and Computing; Springer International Publishing: Cham, Switzerland, 2015; Volume 377, pp. 309–327. ISBN 978-3-319-19703-6. [Google Scholar]
  94. Zhou, Y.; Shen, X.; Cao, J.; Zhang, Y. Research on Influence Factors of Prevention and Control Measures on Economy-Based on Netlogo Simulation and Big Data Computation. In Proceedings of the 2022 2nd International Conference on Social Sciences and Intelligence Management (SSIM), Taichung, Taiwan, 24–26 November 2022; IEEE: Taichung, Taiwan, 2022; pp. 79–84. [Google Scholar]
  95. Umlauft, M.; Schranz, M.; Elmenreich, W. SwarmFabSim: A Simulation Framework for Bottom-up Optimization in Flexible Job-Shop Scheduling Using NetLogo. In Proceedings of the 12th International Conference on Simulation and Modeling Methodologies, Technologies and Applications, Lisbon, Portugal, 14–16 July 2022; SCITEPRESS—Science and Technology Publications: Lisbon, Portugal, 2022; pp. 271–279. [Google Scholar]
  96. Chatterjee, A.; Cao, Q.; Sajadi, A.; Ravandi, B. Deterministic Random Walk Model in NetLogo and the Identification of Asymmetric Saturation Time in Random Graph. Appl. Netw. Sci. 2023, 8, 33. [Google Scholar] [CrossRef]
  97. Khan, F. Application of Agent-Based Modeling: Simulating Financial Systemic Risk and Contagion within Housing and Financial Markets. Ph.D. Dissertation, The Claremont Graduate University, Claremont, CA, USA, 2019; p. 332. Available online: https://scholarship.claremont.edu/cgu_etd/332 (accessed on 9 July 2023).
  98. Axtell, R.L.; Farmer, J.D. Agent-Based Modeling in Economics and Finance: Past, Present, and Future; INET Oxford Working Paper No. 2022-10; Institute for New Economic Thinking: Oxford, UK, 2022; Available online: https://www.inet.ox.ac.uk/files/JEL-v2.0.pdf (accessed on 9 July 2023).
  99. National Bank of Romania. Evolution of the Quarterly Reference Index—IRCC. Available online: https://www.bnr.ro/Indicele-de-referin%C8%9Ba-pentru-creditele-consumatorilor--19492-Mobile.aspx (accessed on 16 February 2023).
  100. National Institute of Statistics. Evolution of the Inflation Rate in Romania. Available online: https://insse.ro/cms/en/content/cpi-%E2%80%93-quarterly-data-series (accessed on 16 February 2023).
  101. Li, H.; Zou, H. Inflation, Growth, and Income Distribution: A Cross-Country Study. Ann. Econ. Financ. 2002, 3, 85–101. [Google Scholar]
  102. Khumalo, J. Inflation and Stock Prices interactions in South Africa: VAR Analysis. Int. J. Econ. Financ. Stud. 2013, 5, 23–24. [Google Scholar]
  103. Hsing, Y. The Stock Market and Macroeconomic Variables in BRICS Country and Policy Implications. Int. J. Econ. Financ. Issues 2011, 1, 12–18. [Google Scholar]
  104. De Jesus, C.; Willows, G.D.; Olivier, A.M. The influence of the market on inflation, not the other way around. Invest. Anal. J. 2020, 49, 79–91. [Google Scholar] [CrossRef]
  105. Sokpo, J.T.; Iorember, P.T.; Usar, T. Inflation and Stock Market returns volatility: Evidence form the Nigerian Stock Exchange 1995Q1–2016Q4: An E-GARCH Approach. MPRA Paper, no. 85656. Int. J. Econom. Financ. Manag. 2017, 2, 69–76. [Google Scholar]
  106. Tchereni, B.H.; Mpini, S. Monetary Policy Shocks and Stock Market volatility in emerging markets. Risk Gov. Control. Financ. Mark. Inst. 2020, 10, 50–61. [Google Scholar] [CrossRef]
  107. Bank of England. Available online: https://www.bankofengland.co.uk/ (accessed on 16 February 2023).
  108. National Bank of Romania. Banks in Romania. Available online: https://www.bnro.ro/Banks-in-Romania-1724.aspx (accessed on 16 February 2023).
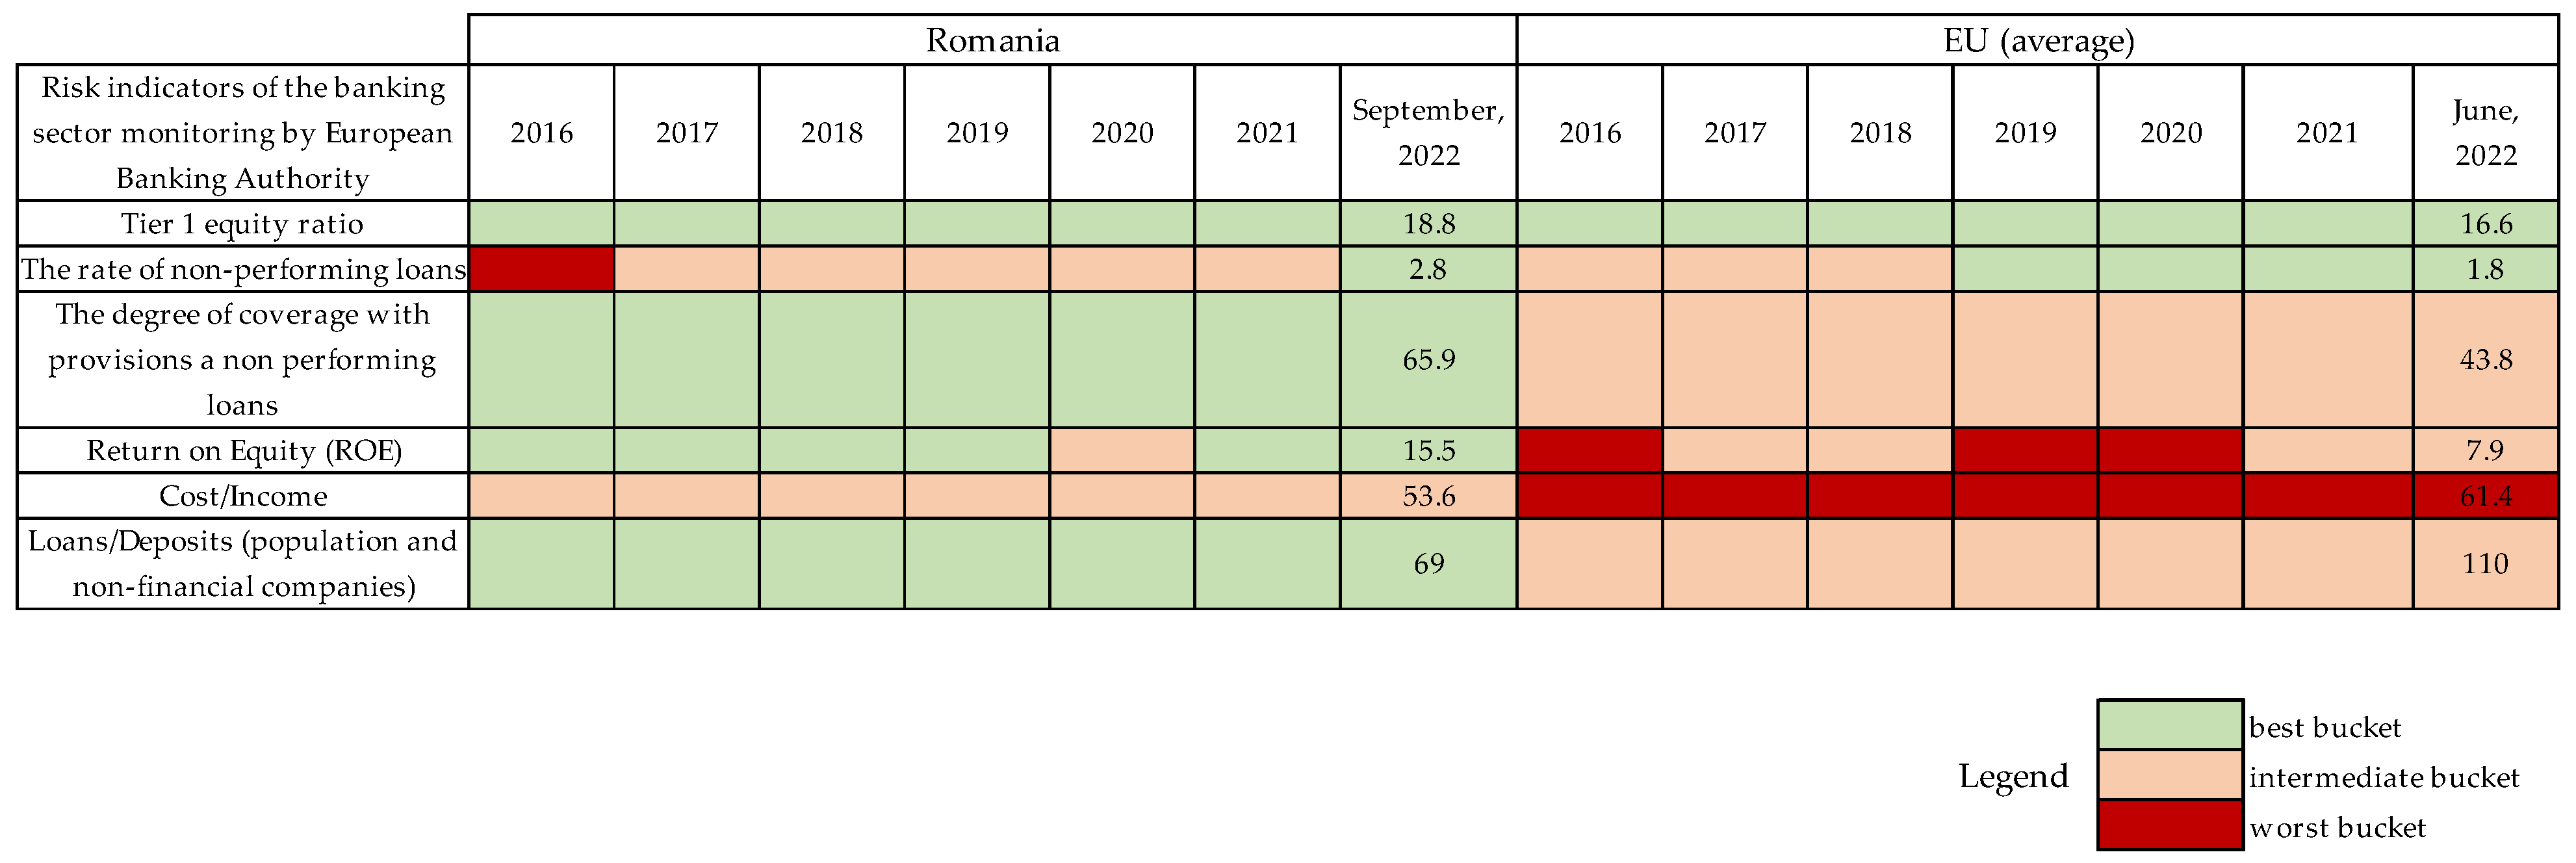
Figure 1. The situation of prudential indicators in Romania. Source: Financial Stability Report [45].
Sustainability 15 12037 g001
Figure 2. Developing the Random Forest model.
Sustainability 15 12037 g002
Figure 3. Defining the hyperparameters for Random Forest model.
Sustainability 15 12037 g003
Figure 4. Hyperparameter tuning and model training.
Sustainability 15 12037 g004
Figure 5. Performance evaluation for Random Forest model.
Sustainability 15 12037 g005
Figure 6. Representation of the logistic/sigmoid function.
Sustainability 15 12037 g006
Figure 7. Data on interest on mortgage loans from top 7 banks in Romania. Source: Authors’ processing according to the data published on the banks’ official websites.
Sustainability 15 12037 g007
Figure 8. Evolution of the quarterly reference index—IRCC. Source: Authors’ processing according to the data published on the National Bank of Romania website [99].
Sustainability 15 12037 g008
Figure 9. Evolution of the inflation rate in Romania. Source: Authors’ processing according to the data published on the National Institute of Statistics website [100].
Sustainability 15 12037 g009
Figure 10. Defining the k-fold cross validation methodology for the testing set. Source: Authors’ processing in Python.
Sustainability 15 12037 g010
Figure 11. Graphical representation of the AUC-ROC curve.
Sustainability 15 12037 g011
Figure 12. Simulation of the financial contagion effect in NetLogo.
Sustainability 15 12037 g012
Table 1. Map of systemic risks regarding financial stability in Romania.
Systemic Risk EventRisk Classification
Sustainability 15 12037 i001Global uncertainties in the context of the energy crisis, the war in Ukraine, and the COVID-19 pandemic.Severe Systemic Risk
Sustainability 15 12037 i001The deterioration of internal macroeconomic balances, including deterioration as a result of geopolitical and international developments.Severe Systemic Risk
Sustainability 15 12037 i002The delay in reforms and the absorption of European funds, especially through the National Recovery and Resilience Plan.High Systemic Risk
Sustainability 15 12037 i003The risk of non-payment of loans contracted by the non-governmental sectorHigh Systemic Risk
Source: Report of Financial Stability [43], National Bank of Romania (June 2022).
Table 2. Confusion matrix.
Actual Value
PositiveNegative
Predicted ValuePositiveTrue Positive (TP)False Positive (FP)
NegativeFalse Negative (FN)True Negative (TN)
Source: Reference [70].
Table 3. Agent characteristics.
Agent CharacteristicsDescription of the Property of ABM Agents
HeterogeneityAgent-based models provide the ability to simulate each specific entity of interest, such as ants, customers, households, small businesses, large corporations, governments, and more. Additionally, these models allow for the incorporation of realistic or irrational behaviors. By utilizing a “bottom-up” approach, these models can capture the diversity of the real world, making them highly intriguing. Basically, agents are different from each other in terms of behavior, degree of connectivity, and portfolio size.
EmergenceOne of the most important emergent properties of agents refers to the appearance of behaviors or characteristics at the system level that cannot be predicted or explained by the individual analysis of agents. This feature makes agent-based models very useful in analyzing and simulating complex systems such as financial markets. According to [81], one of the most notable instances of emergent behavior in the financial market and economics is Adam Smith’s concept of the invisible hand, which illustrates how the self-interested behaviors of individual agents in the economy can converge to generate optimal outcomes for society as a whole.
ComplexityBy using agent-based models, we can acknowledge the interconnected and non-linear nature of financial markets. This involves modeling the bank and the market as a complex adaptive system. Rather than disregarding complexity, agent-based models actively embrace it. Although agents in agent-based models are considered autonomous entities, the complexity property helps us to program agents so that they have complex behaviors and decisions based on an input of information and variables.
Social InteractionIn the case of the analysis of banking systems using agent-based modeling, the social interaction property shows us that agents interact with each other through the banking network. For example, you can simulate a network of customers who have mortgages offered by the Romanian banking system. This network can be an eloquent example that highlights the described property.
AdoptionAgents can adopt different strategies, being autonomous agents, but these are also influenced to some extent by market circumstances and by the level of financial education that the agent has.
Risk and rewardThrough this feature, agents evaluate their potential risk and reward to make decisions about their portfolio. For example, in the case of accessing a second mortgage, the agents can assess the risk of defaulting on the loan, but also the reward of purchasing another property.
LearningIn terms of learning, agents can learn from past experiences and adapt their strategies.
Informational asymmetryAgents may have different or incomplete information about markets and other agents, which can influence their decisions and lead to risk propagation.
InterdependenceDecisions made by one agent can directly or indirectly impact other agents and the market as a whole.
FeedbackAgents can receive feedback from the market and adjust their strategies accordingly, which can lead to changes in market behavior and performance.
AdaptabilityAgents may be able to adapt to changes in the economic environment and other market conditions.
Realistic behaviorsOne of the strengths of agent-based models is their ability to generate realistic behavior by observing actual human behavior. Research in behavioral economics has shown that people frequently use heuristics rather than making fully rational decisions. Consequently, there are several models that investigate the consequences of situations where purely rational options are not viable or too costly, or when agents’ environments undergo changes over time [81]
Exploring the space of possibilitiesA major advantage of agent-based modeling is that it allows for the simulation for each individual agent of numerous scenarios to observe the entire population of agents.
Source: References [80,81,82,83,84].
Table 4. Description of variables.
VariableTypeDescription
BadQuantitativeA bad customer is defined, in this case, as a customer who has payment delays or has not repaid the loan by the due date and has penalties such as garnishment of salary, court executions, etc.
LoanQuantitativeThe value (amount) of the requested loan.
MortdueQuantitativeThe amount owed for the mortgage loan.
ValueQuantitativeThe value of the mortgaged property.
ReasonQualitativeThe purpose of the loan requested. We have 2 possible options: loan consolidation (DeptCon) or home renovation (HomeImp).
JobQualitativeScorecard for credit applicants’ occupations.
YojQuantitativeSeniority at work.
DerogQuantitativeThe number of exemptions.
DelinqQuantitativeThe number of loans that have not been paid.
ClageQuantitativeDuration of the oldest line of credit (months).
NinqQuantitativeNumber of recent credit requests.
ClnoQuantitativeNumber of lines of credit.
DebtincQuantitativeDebt-to-income ratio.
Table 5. Test results for machine learning algorithms applied to the data set.
ModelsAccuracyPrecisionRecallF1AUC
Random Forest86.6678.7149.1960.5572.85
K-Nearest Neighbors85.9976.4747.1858.3571.67
Logistic Regression80.3688.896.4512.0353.12
Extra Trees Classifier81.2896.310.4818.9155.19
Naïve Bayes80.8773.8112.521.3855.66
AdaBoost88.268058.0667.2977.13
XGBoost8878.0758.8767.1377.25
LightGBM8775.4155.6564.0375.44
Table 6. The description of variables used in NetLogo.
VariablesDescription
Number of agents (banks)The agents modeled in NetLogo are the 32 banks that form the banking network in Romania.
Interbank assetsRepresents the loans the bank has received from other banks on the interbank market.
Illiquid assetsRepresents some form of illiquid assets on the balance sheet.
Interbank liabilitiesRepresents the obligations to other banks on the interbank market.
DepositsBank deposits.
Bank sizeBanks have different sizes based on random normal distribution.
TicksOne tick represents 3 days.
Source: Authors’ processing according to [86].
Table 7. The description of parameters used in NetLogo.
Setup ParametersMeaningPossible Values
BanksThe total number of banks that will be considered for the proposed analysis.Between 1 and 80
Since we are analyzing the behavior that may occur in Romania, 32 banks were selected, since this is the total number of the banks present in the country
SetupInitializes the model.N/A
muThe average value of the interbank assets.Between 0 and INF
In order to have a Gaussian distribution of the interbank assets for our analysis, mu should be 0
sigmaThe standard deviation of the interbank assets.Between 0 and INF.
In order to have a Gaussian distribution of the interbank assets for our analysis, sigma should be 1.5
Default random bankOne random bank from their total amount is going to be in a default state.1
Default smallest bankOne of the smallest banks is going to be in a default state.1
Default biggest bankOne of the biggest banks is going to be in a default state.1
goRuns the model.N/A
Count linksThe total amount of links that are between all of the banks.Between 1 and 322
Defaulted banksThe number of banks in default-state at a specific moment in time.Between 1 and 32
Non-defaulted banksThe number of banks in a non-default-state at a specific moment in time.Between 0 and 31
Source: Authors’ processing according to [86].
Table 8. The results of the financial contagion simulation for the 3 scenarios.
ScenarioStatisticsInterbank AssetsIlliquid AssetsInterbank LiabilitiesDepositsBank SizeTick
Default Random BankAverage Non-Contagion0.5306620212.4554006970.0017767562.9842862.986062718360
Max. Value Non-Contagion19.678.40.1352323499898360
Min. Value Non-Contagion00.800.8786551360
Average Financial Contagion0.660563382.6422535210.6201014262.6827153.3028169012.443662
Max. Value Financial Contagion15604.07880952473.89019755
Min. Value Financial Contagion0.20.80−2.9983612
Default Biggest BankAverage Non-Contagion5.4848725.3360.00341930.8174530.82087360
Max. Value Non-Contagion64.2256.80.337621321321360
Min. Value Non-Contagion02.4033360
Average Financial Contagion5.83729723.400540.5424528.6953929.237842.462162
Max. Value Financial Contagion45.8183.25.9228.962295
Min. Value Financial Contagion0404.20745152
Default Smallest BankAverage Non-Contagion0.1812260540.8187739460.0021155230.997881358.6303
Max. Value Non-Contagion0.210.31666666711360
Min. Value Non-Contagion00.800.6833312
Average Financial Contagion0.1995249410.8004750590.7086340490.2913712.418052
Max. Value Financial Contagion0.2112.811360
Min. Value Financial Contagion00.80−6.211412
Disclaimer/Publisher’s Note: The statements, opinions and data contained in all publications are solely those of the individual author(s) and contributor(s) and not of MDPI and/or the editor(s). MDPI and/or the editor(s) disclaim responsibility for any injury to people or property resulting from any ideas, methods, instructions or products referred to in the content.