Article

Analysis on the Rationality of Urban Green Space Distribution in Hangzhou City Based on GF-1 Data

1
Institute of Remote Sensing and Earth Sciences, Hangzhou Normal University, Hangzhou 311121, China
2
Zhejiang Provincial Key Laboratory of Urban Wetlands and Regional Change, Institute of Remote Sensing and Earth Sciences, Hangzhou 311121, China
*
Author to whom correspondence should be addressed.
Sustainability 2023, 15(15), 12027; https://doi.org/10.3390/su151512027
Submission received: 12 June 2023 / Revised: 28 July 2023 / Accepted: 3 August 2023 / Published: 5 August 2023

Abstract

:
With its ecological, economic, and social benefits, urban green space (UGS) plays an important role in urban planning. Accordingly, it is also an important indicator in the evaluation of urban liveability. However, the extraction and statistical analysis of UGS are difficult because urban land use involves complex types and UGS exhibits fragmented distribution and common vegetation extraction models such as the NDVI model and pixel bipartite model. In addition, there are few studies that analyze UGS in Hangzhou with a pixel decomposition model. Therefore, applying the mixed pixel decomposition model with GF-1 data, the following three objectives were set in this study: (1) analyzing the temporal changes of UGS in Shangcheng District, Hangzhou from 2018 to 2020; (2) analyzing the spatial distribution characteristics of UGS in the six main urban areas of Hangzhou in 2020; (3) analyzing the rationality and influencing factors of UGS distribution in Hangzhou. In Shangcheng District, the overall UGS area increased from 2018 to 2020 due to the increase in forest area rather than grassland area. As for the main built-up area in Hangzhou, medium and high coverage of UGS were primarily observed, with an overall high level of greening and a relatively uniform vegetation cover. Only a few areas showed very low UGS coverage. Some differences were observed among administrative regions under the influence of topography, but the overall coverage is high. At the same time, the distribution of UGS in Hangzhou is closely related to policy guidance, the needs of urban residents, and the requirements of economic development. This research not only can provide a new way to analyze UGS features in Hangzhou but also provides scientific guidance for governments in urban planning.

1. Introduction

Urban green space (UGS) refers to the natural environment connected with human activities in an urban context, which is beneficial to human health, ecosystem protection, as well as economic development [1,2]. It includes land used for greening within the scope of urban construction land, areas that play a positive role in the urban ecological environment, landscape structure, and life of residents, as well as areas that have a better green environment in addition to urban construction land [3].
Green space system planning is one of the most basic and important aspects of urban planning [4]. A green space provides not only leisure and exercise facilities for urban residents, but also ecological, economic, and social benefits that cannot be underestimated. UGS is an essential component of the urban complex ecosystem, and its system structure and function are conducive to improving environmental quality, beautifying the landscape, and maintaining urban ecological balance [5]. At the same time, UGS has the direct economic output of producing seedlings and other greening products; there are also indirect economic benefits associated with reducing urban losses, such as the energy-saving effect of green space on shading and wind protection, prevention of pollution through water storage and soil conservation, and safety protection [6]. The social benefits of UGS are reflected in that it can beautify the urban landscape and afford spiritual pleasure; meanwhile, residents can relax and release mental stress through activities in the green space [7,8].
UGS provides numerous environmental and social benefits for human beings, but with the acceleration of urbanization and population growth, the uneven distribution of UGS poses a challenge to urban sustainable development [9]. As the administrative center of Zhejiang Province, Hangzhou has experienced early and rapid urbanization. To improve the life quality of urban residents in the process of urbanization, relevant administrative departments are also paying close attention to the planning and maintenance of UGS. It mainly includes park green space (such as the West Lake and Xixi wetland), urban forest green space (such as Hangzhou Botanical Garden, Banshan National Forest), community greening, highway greening, and so on. Moreover, Hangzhou is also one of the most suitable cities for living in China and is developing rapidly, with a constantly expanding urban area. For residents and construction planners, it is important to determine whether green space area, green space distribution, and green space service, which are closely related to daily human life, can match the city status of Hangzhou and be coordinated with its economic development. Therefore, accurate and efficient extraction of UGS location, area, coverage, service area, and other parameters are helpful for accurately assessing the rationality of UGS distribution and improving urban ecological construction planning.
With progresses in research, remote sensing methods for green space extraction are increasingly being developed, and the efficiency of the intermediate process and accuracy of results are continuously being improved. Commonly used remote sensing methods of green space extraction include artificial statistics, traditional classification, vegetation index extraction, and mixed pixel decomposition.
Combining manual interpretation with ground survey results, Liu, Zhang and Li [10] analyzed the green space information during two periods in Harbin using ArcGIS software. Yao, Wu, and Kang [11] performed false color synthesis based on the combination of 3, 4, and 7 bands of TM data, through which they extracted UGS information using supervised classification. Jin and Jing [12] combined ISODATA unsupervised classification and GIS spatial analysis to analyze the service area of green space distribution and put forward reasonable planning suggestions. Based on object information extraction, Chen, Zhao, and Chen [13] comprehensively and quickly grasped the total amount and distribution of UGS in a study area using the NDVI model. To improve the accuracy of vegetation recognition, Liang et al. [14] modified the Gram–Schmidt fusion algorithm by using the idea of mixed pixel decomposition and solved the issues of serious mixing and scattered distribution of UGS pixels by improving the spatial resolution of spectral data. Tian [15] obtained accurate information on UGS coverage from remote sensing data based on the principle of linear mixed spectral model and used MODIS time series to obtain the interannual variation of UGS coverage, through which the change of UGS cover could be effectively monitored periodically.
Tigges, Lakes, and Hostert [16] used the support vector machine method to classify eight common tree genera in Berlin, Germany and used time series analysis to evaluate the necessity of UGS in urban residential life and urban ecosystem services. Huang et al. [17] used NDVI to obtain an urban land cover map and combined it with gridded population data to calculate the accessibility and accessibility of UGS. Tooke et al. [18] used a method based on spectral decomposition and statistical development decision trees to classify the species and status characteristics of UGS, and this method realizes the accurate separation of trees and surface cover vegetation. Rougier et al. [19] proposed an active learning algorithm that combines active learning and hierarchical strategy for extracting UGS, and the results showed that this method is as effective as the classical stratified random sampling algorithm.
As one of the fastest-growing cities in China, issues in Hangzhou have implications for China’s rapid economic development. Specifically, it remains unclear whether Hangzhou’s current UGS coverage matches economic development, and whether its spatial structure is reasonable. To address these issues, this study takes the main urban area of Hangzhou as an example to analyze its UGS coverage and spatial distribution. To this end, the PMS data of the GF-1 satellite, with spatial resolutions of 8 m in the multi-spectral band and 2 m in the panchromatic band, were used. The main objectives were as follows: (1) analyzing the temporal changes of UGS in Shangcheng District, Hangzhou from 2018 to 2020; (2) analyzing the spatial distribution characteristics of UGS in the six main urban areas of Hangzhou in 2020; (3) analyzing the rationality and influencing factors of UGS distribution in Hangzhou. A full understanding of the characteristics of UGS can guide relevant administrative departments in planning urban green space, which can make the UGS level of Hangzhou match the urban social and economic development better.

2. Materials and Methods

2.1. Study Area

This study focused on the main area of Hangzhou (119°10″ E–120°38″ E, 29°35″ N–30°34″ N), the capital of Zhejiang Province. Hangzhou is the center of the province in terms of economy, culture, and education, with 10 districts, 2 counties, and a county-level city under its jurisdiction. Hangzhou is located on the southern edge of the Yangtze River Delta and the Qiantang River basin, with a complex and diverse topography. The western part of Hangzhou has a primarily hilly topography, with Tianmu Mountain as the main mountain range, whereas the eastern part belongs to the northern Zhejiang plain. With a flat terrain and a dense river network, Hangzhou has been given the title “water village”. The selected six districts in this study are regarded as the main built-up area of Hangzhou with a long history of development; most districts are located north of the Qiantang River except the Binjiang District.
The main built-up area studied in Hangzhou contains six districts: Shangcheng District, Xiacheng District, Xihu District, Gongshu District, Jianggan District, and Binjiang District. Figure 1 shows the specific study area. Among them, Shangcheng District has a long history and has been the core of Hangzhou since ancient times, as Hangzhou Municipal People’s Government is located there. With an area of 26.06 km2, the population of Shangcheng District was up to 350 thousand at the end of 2020. Therefore, this research took Shangcheng District as an example to explore the temporal changes in UGS in Hangzhou.

2.2. Data

In this study, GF-1 data were used. The GF-1 satellite, launched on 26 April 2013, is the first satellite in the major space-based system of the Chinese high-resolution Earth observation system. It offers key advantages, such as high spatial resolution, and multi-spectral and wide coverage optical remote sensing. The GF-1 satellite is equipped with a WFV sensor (spatial resolution of 16 m) and PMS sensor (spatial resolution of 8 m in the multi-spectral band and 2 m in the panchromatic band). Table 1 shows the main parameters of the GF-1 satellite.
The PMS data of the GF-1 satellite of Shangcheng district from 2018 and 2020 were used to analyze the temporal change of the core area of Hangzhou, while the other three images covering the six districts in 2020 were used for the analysis over the entire study area. All the selected images have low cloud cover and good imaging conditions, which meet the requirements of the research.
The statistics used for verification are from the “Statistical Yearbook of Shangcheng District in 2018”. The green area and green space coverage of the entire district by the end of 2018 are given in Chapter 9, “Urban Construction, Environmental Protection and Production Safety”. The data can be used as an index to examine the accuracy of the results of green space extraction.

2.3. Data Pre-Processing

For image pre-processing, radiometric calibration, atmospheric correction, orthorectification, and data fusion were mainly applied. To obtain a multispectral image of high spatial resolution (2 m), the panchromatic (PAN) images were fused with the multispectral (MS) images using the Pansharpening tool in ENVI.
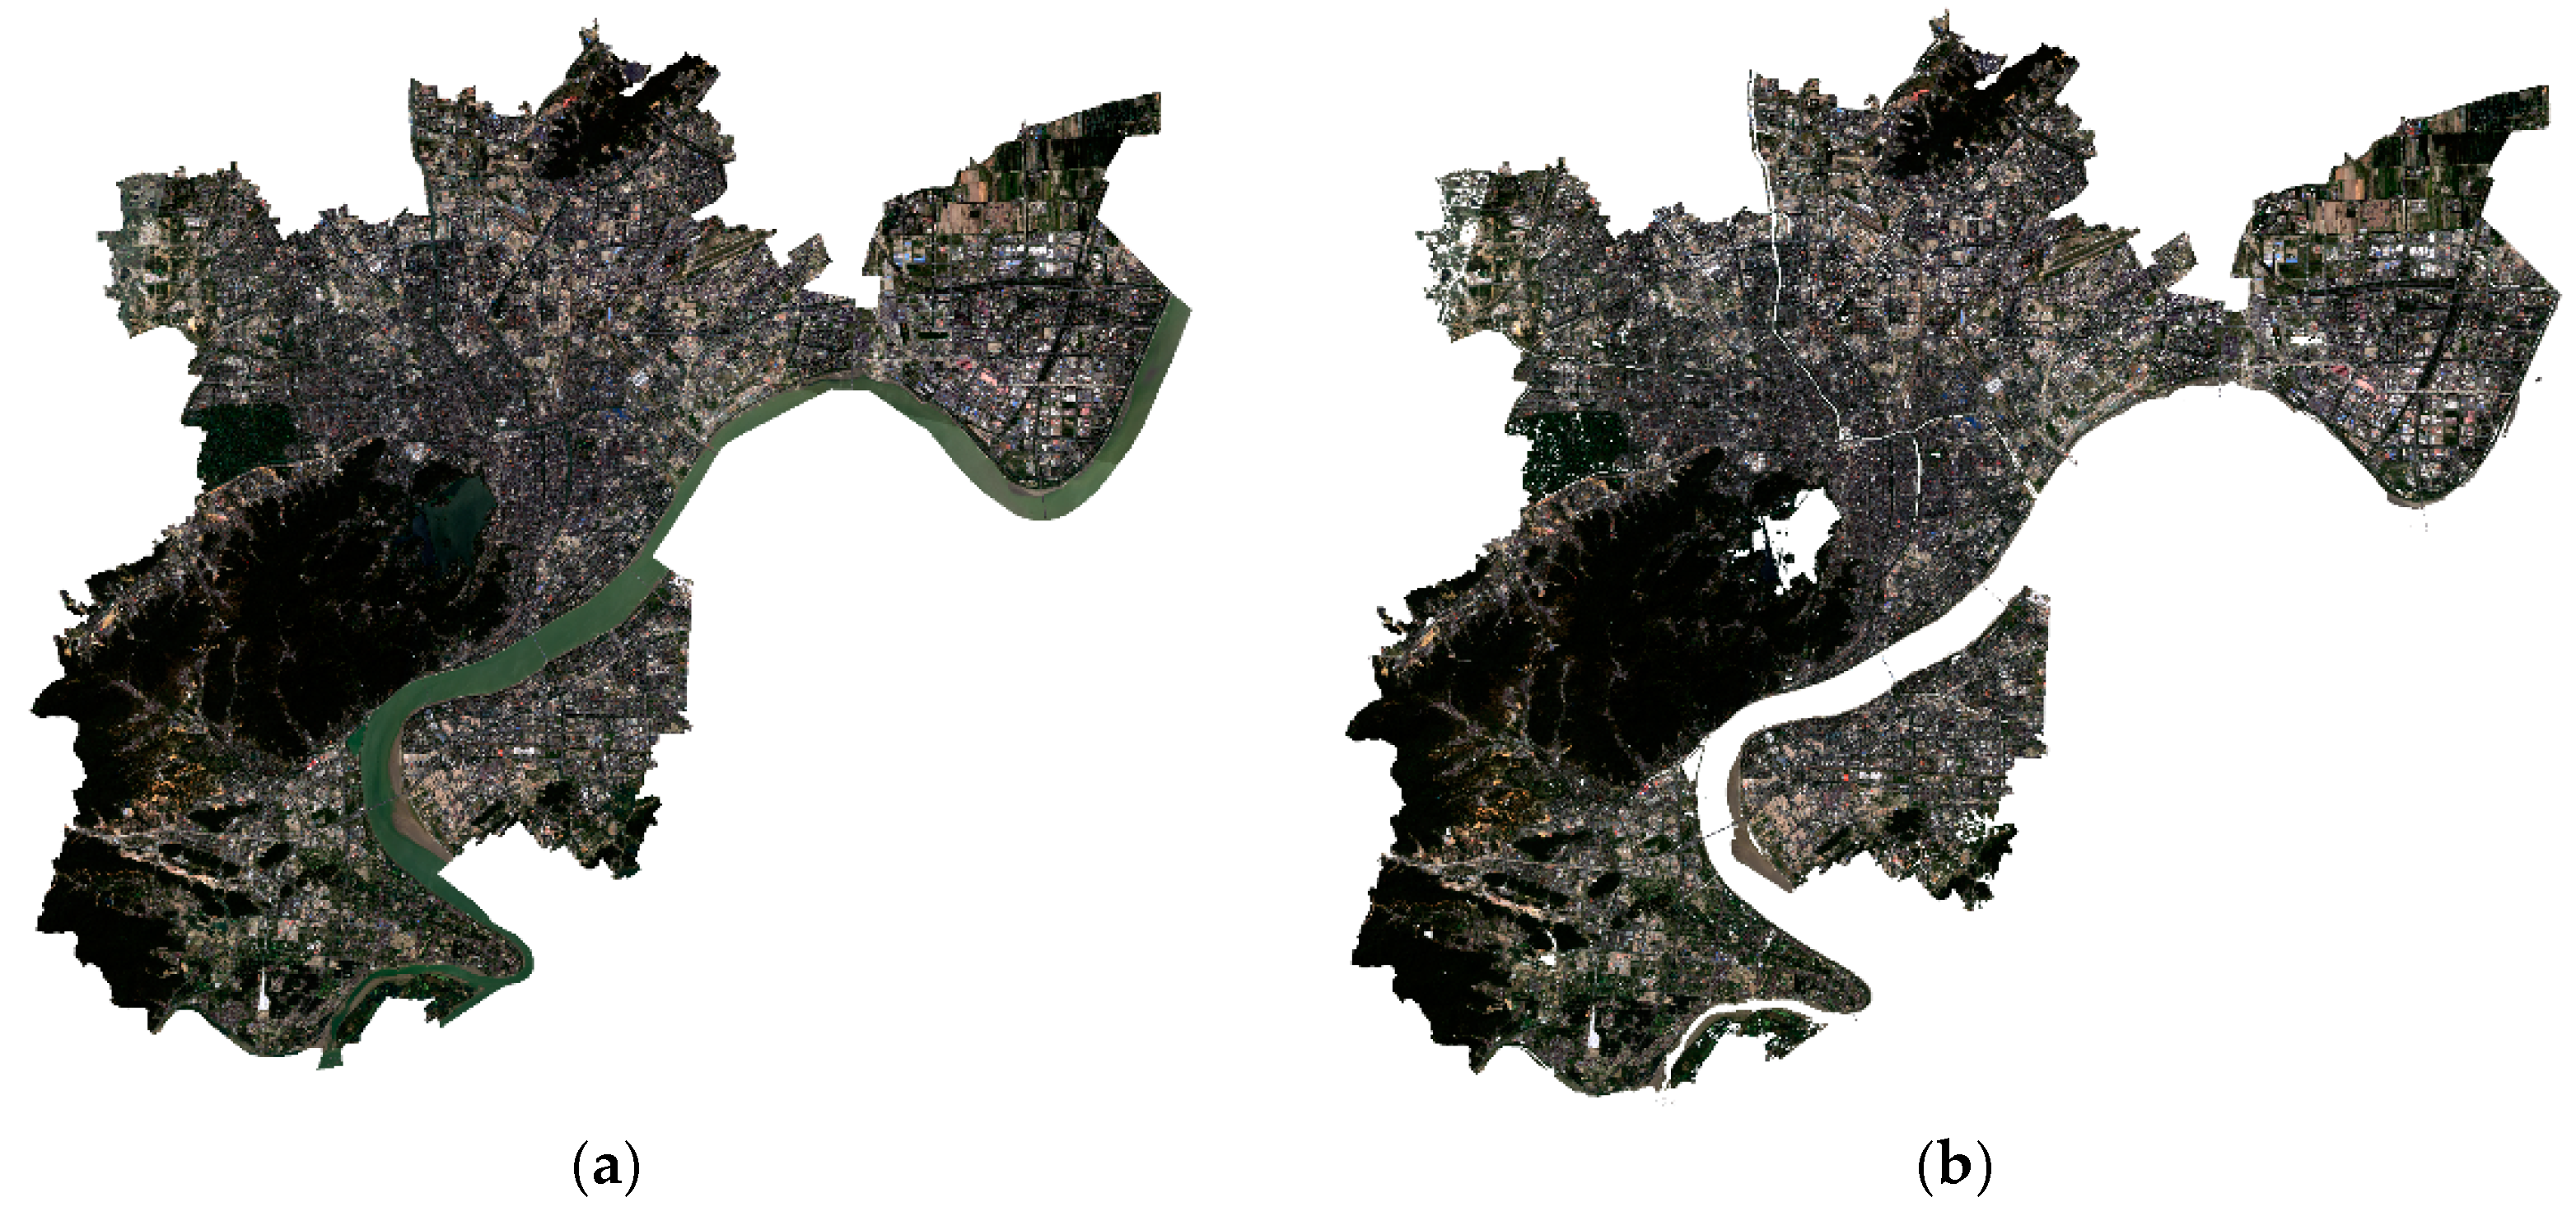
To improve accuracy and analyzability, the normalized difference water index (NDWI) was used to extract and mask water bodies in the study area. NDWI is a normalized ratio index established on the basis of the spectral reflectance characteristics of water bodies in the near-infrared and green bands. In theory, NDWI > 0 indicates water or snow cover on the ground. Therefore, NDWI can be used to extract water body information using a value of 0. The results of masking are shown in Figure 2 and Figure 3. Through masking, water bodies, including the Qiantang River and the West Lakes, could be removed clearly, thus showing satisfactory performance.

2.4. Method

Pixels in remote sensing images mostly comprise several types of ground features but rarely comprise uniform features. Therefore, the mixed spectral information of pixels often has a certain impact on the accuracy of image interpretation [20]. Mixed pixel decomposition is an extraction method for estimating the percentage of typical objects in each pixel based on the pixel value of each pixel in each band. This technique can reduce the problem of misclassification. There are many models of mixed pixel decomposition, such as the linear model, probability model, geometrical optics model, and random geometric model. Among them, the linear decomposition model has the advantages of simple working principles and convenient operation. It is one of the most widely used and most extensively developed mixed pixel decomposition models at present.
A linear spectral mixed pixel decomposition model was used in this research. In this model, the spectrum of each pixel is a linear combination of the characteristic spectrums of its endmember components and their corresponding abundances. The abundance of an endmember is the ratio of the endmember’s photometric vector to the overall spectrum [21]. The linear-spectral-mixed-pixel may be represented using Formula (1):
S = i = 1 n a i X i + W
where S refers to the m-dimension spectral vector of mixed pixels, m is the number of bands in the spectral cube, X i refers to one of the endmembers, and a i is its abundance value. W denotes the observation error. The constraints are as follows: i = 1 n a i = 1 and 0 a i 1 .
Using these two constraints, the fully constrained least square method can be used for linear mixed pixel decomposition. In this study, the external extension tool FCLS Spectral Unmixing of ENVI 5.3 (U.S) software was used for image processing.
To improve the accuracy of mixed pixel decomposition, certain principles need to be followed in the selection of endmembers. Methods of obtaining endmembers include the acquisition of endmembers from the existing spectral information database of ground objects, direct selection of endmembers from the image, and combination of the two [22]. In mixed pixel decomposition, the number of selected endmembers does not usually exceed “band number + 1”. As GF-1 data have four multi-spectral bands, the number of endmembers cannot exceed 5.
The following four endmembers were selected directly from the image: forest, grassland, bare land, and urban land (including roads and building areas). The sum of forest and grassland were regarded as UGS.

3. Results

3.1. Extraction of UGS of Shangcheng District

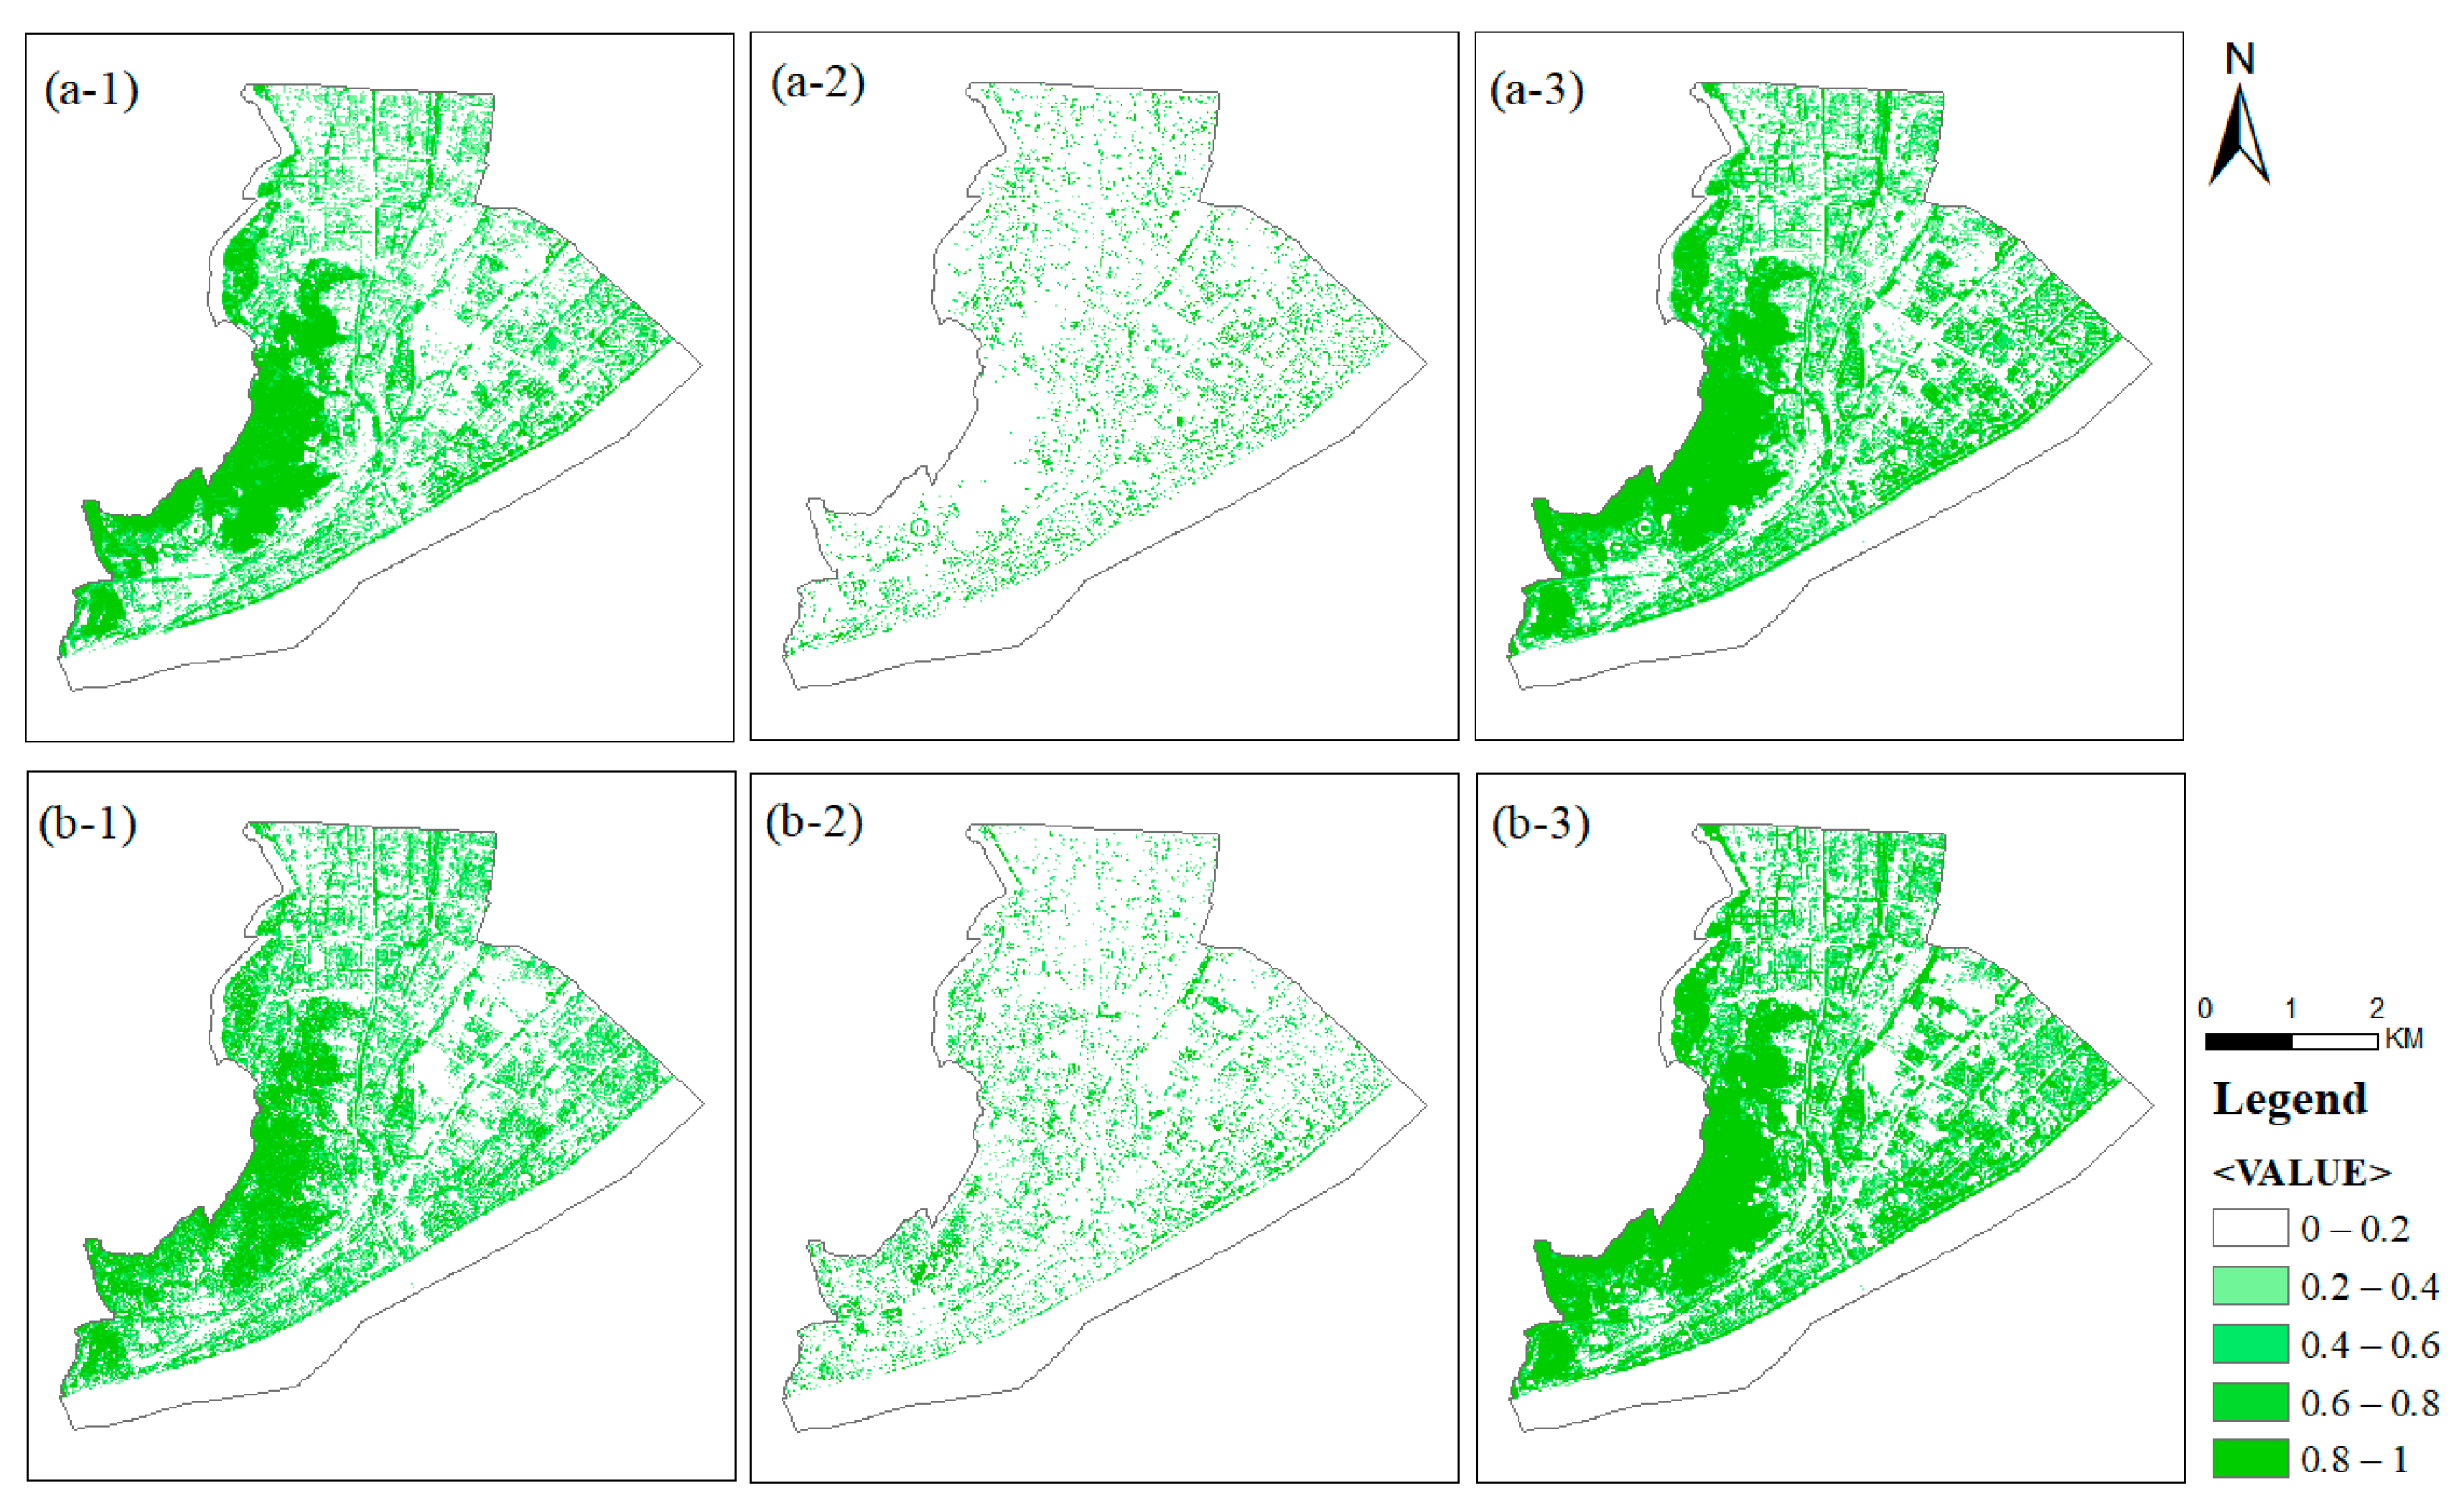
To explore the temporal change of urban green space in Shangcheng District, the mixed pixel decomposition model was used to extract UGS from the remote sensing images of Shangcheng District in 2018 and 2020. The extraction results are shown in Figure 4:
According to Figure 4, there are some interesting findings: (1) the forest is concentrated in the western part of the district; (2) the grassland is generally concentrated in the built-up area, such as along the street or in public parks, and most of them showed linear or blocky features in Figure 4. As for the temporal change, it is clear that the area of grassland presents a decrease from 2018 to 2020, which may be due to urban construction. Overall, the total UGS area (including the forest area and grassland area) increased from 2018 to 2020.

3.2. Extraction of UGS of the Main Urban Area of Hangzhou

3.2.1. Special Distribution of UGS in Hangzhou

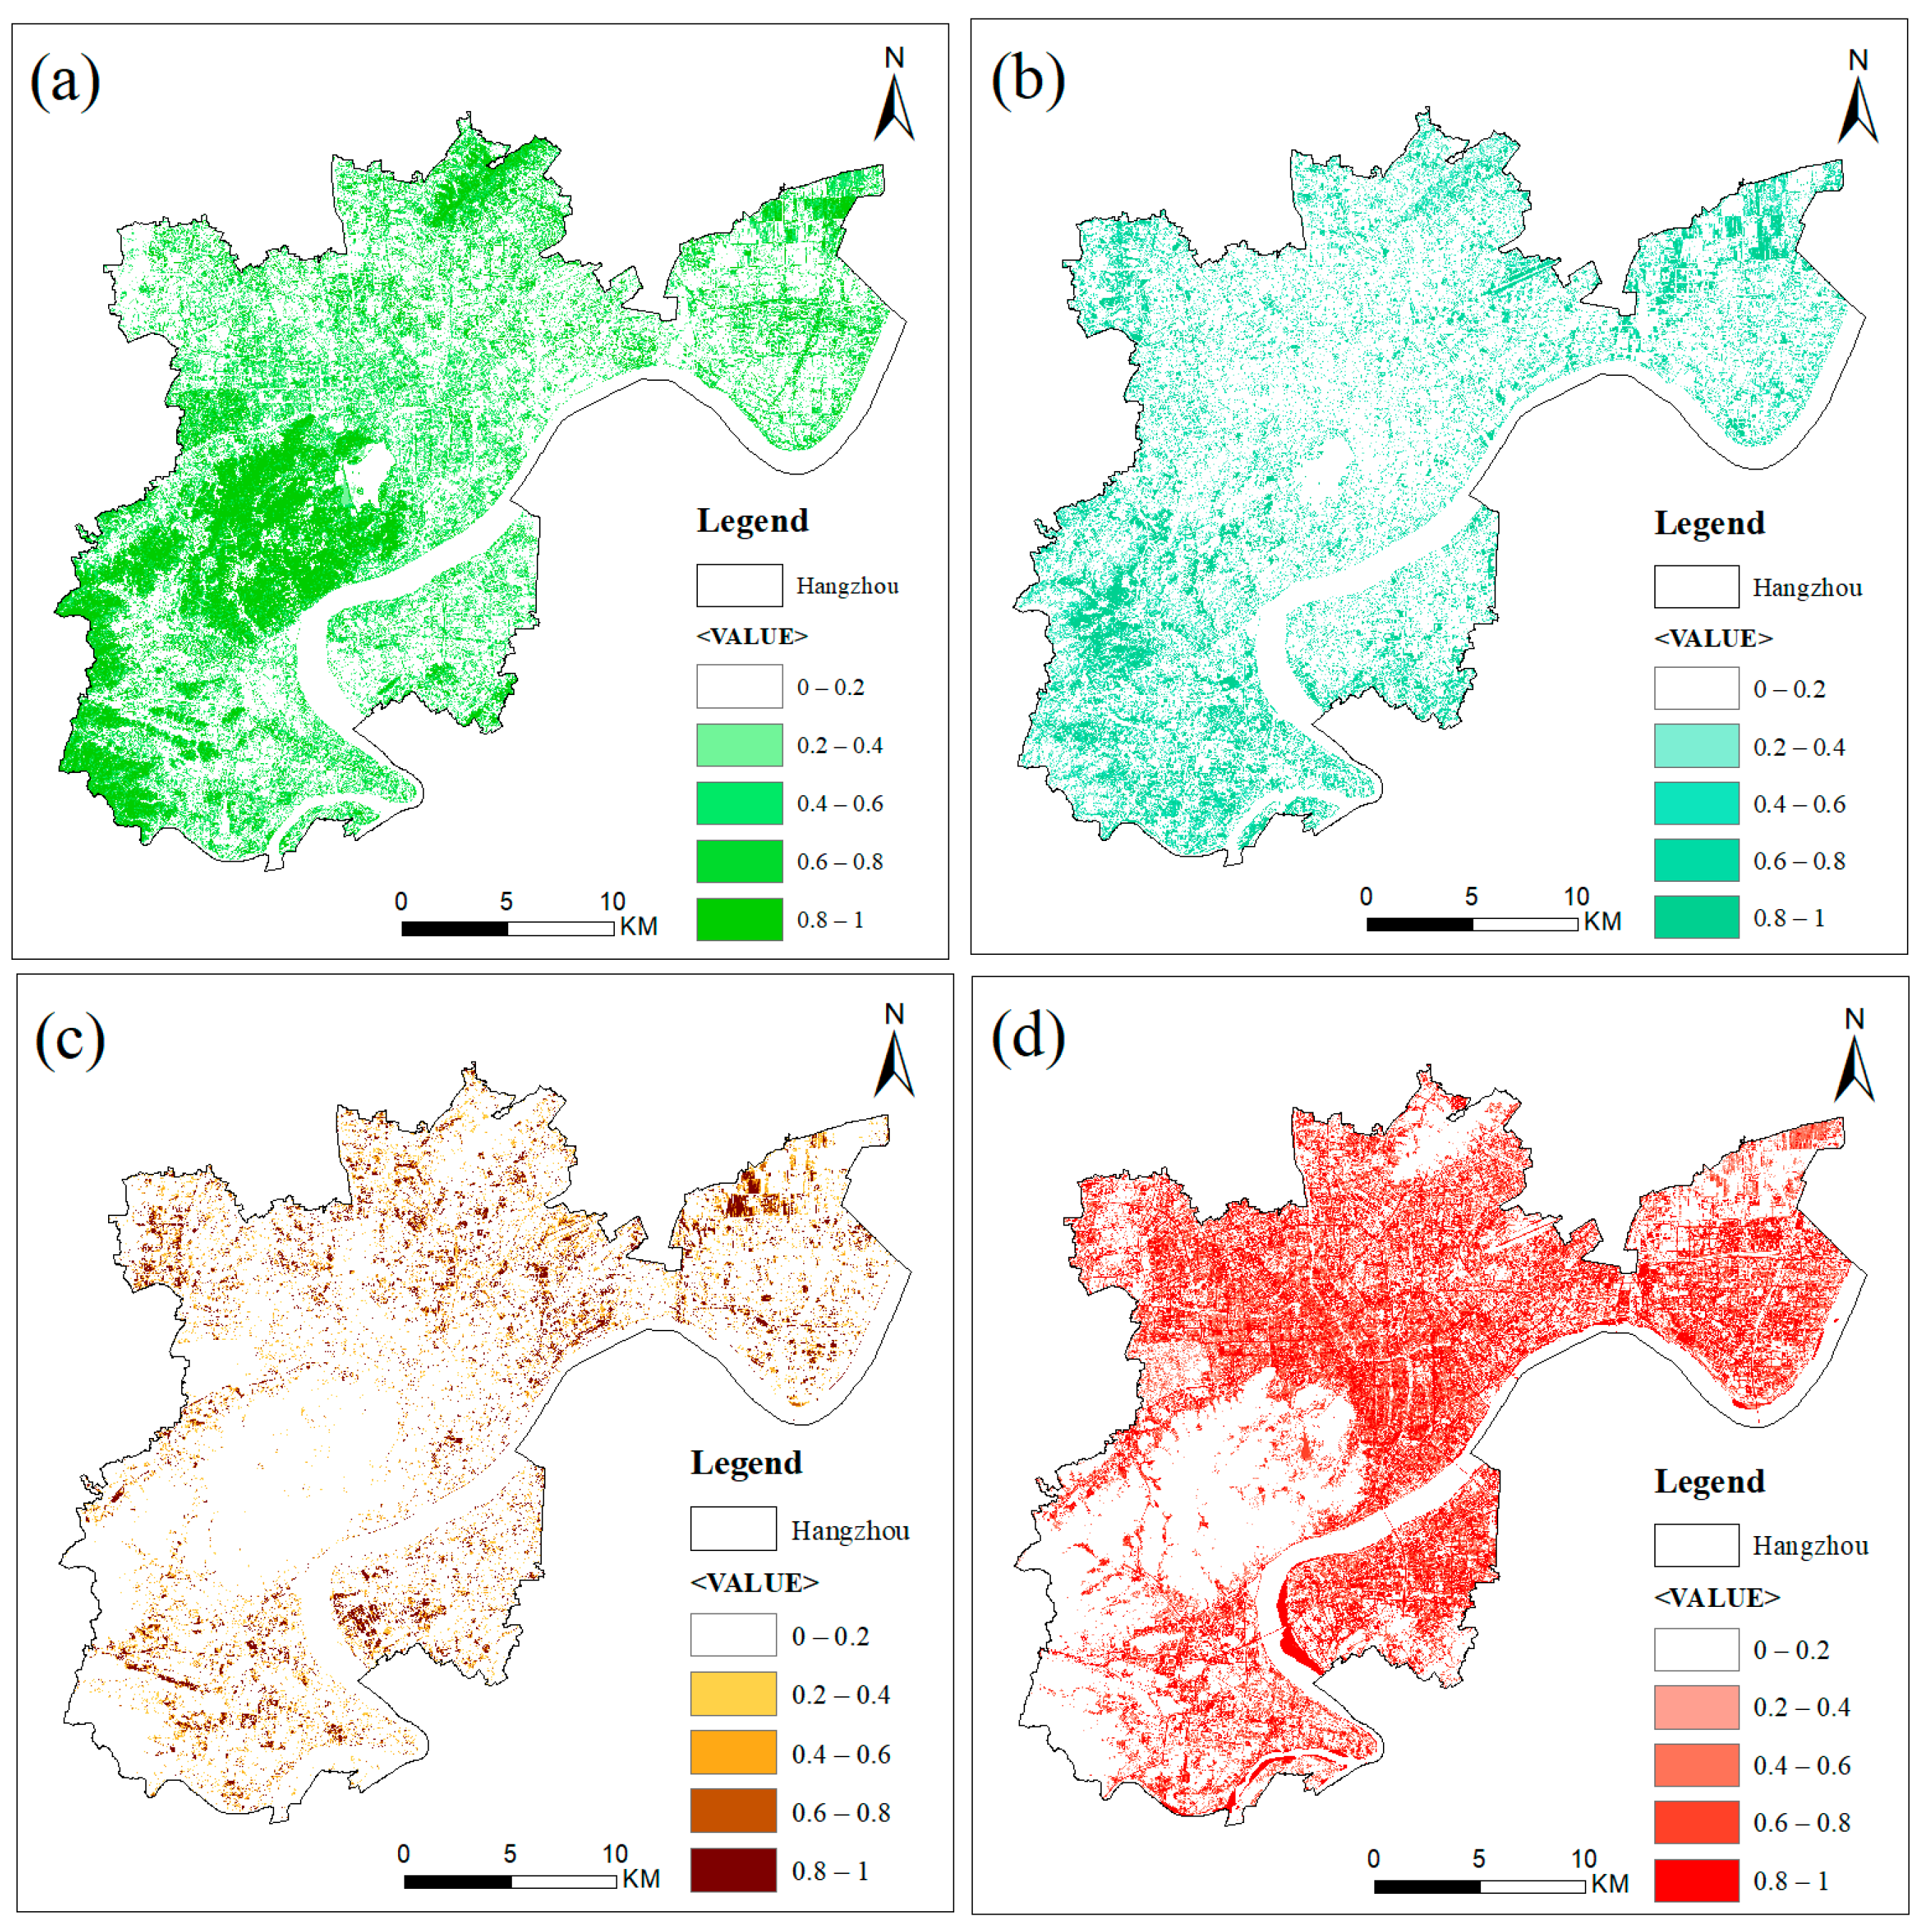
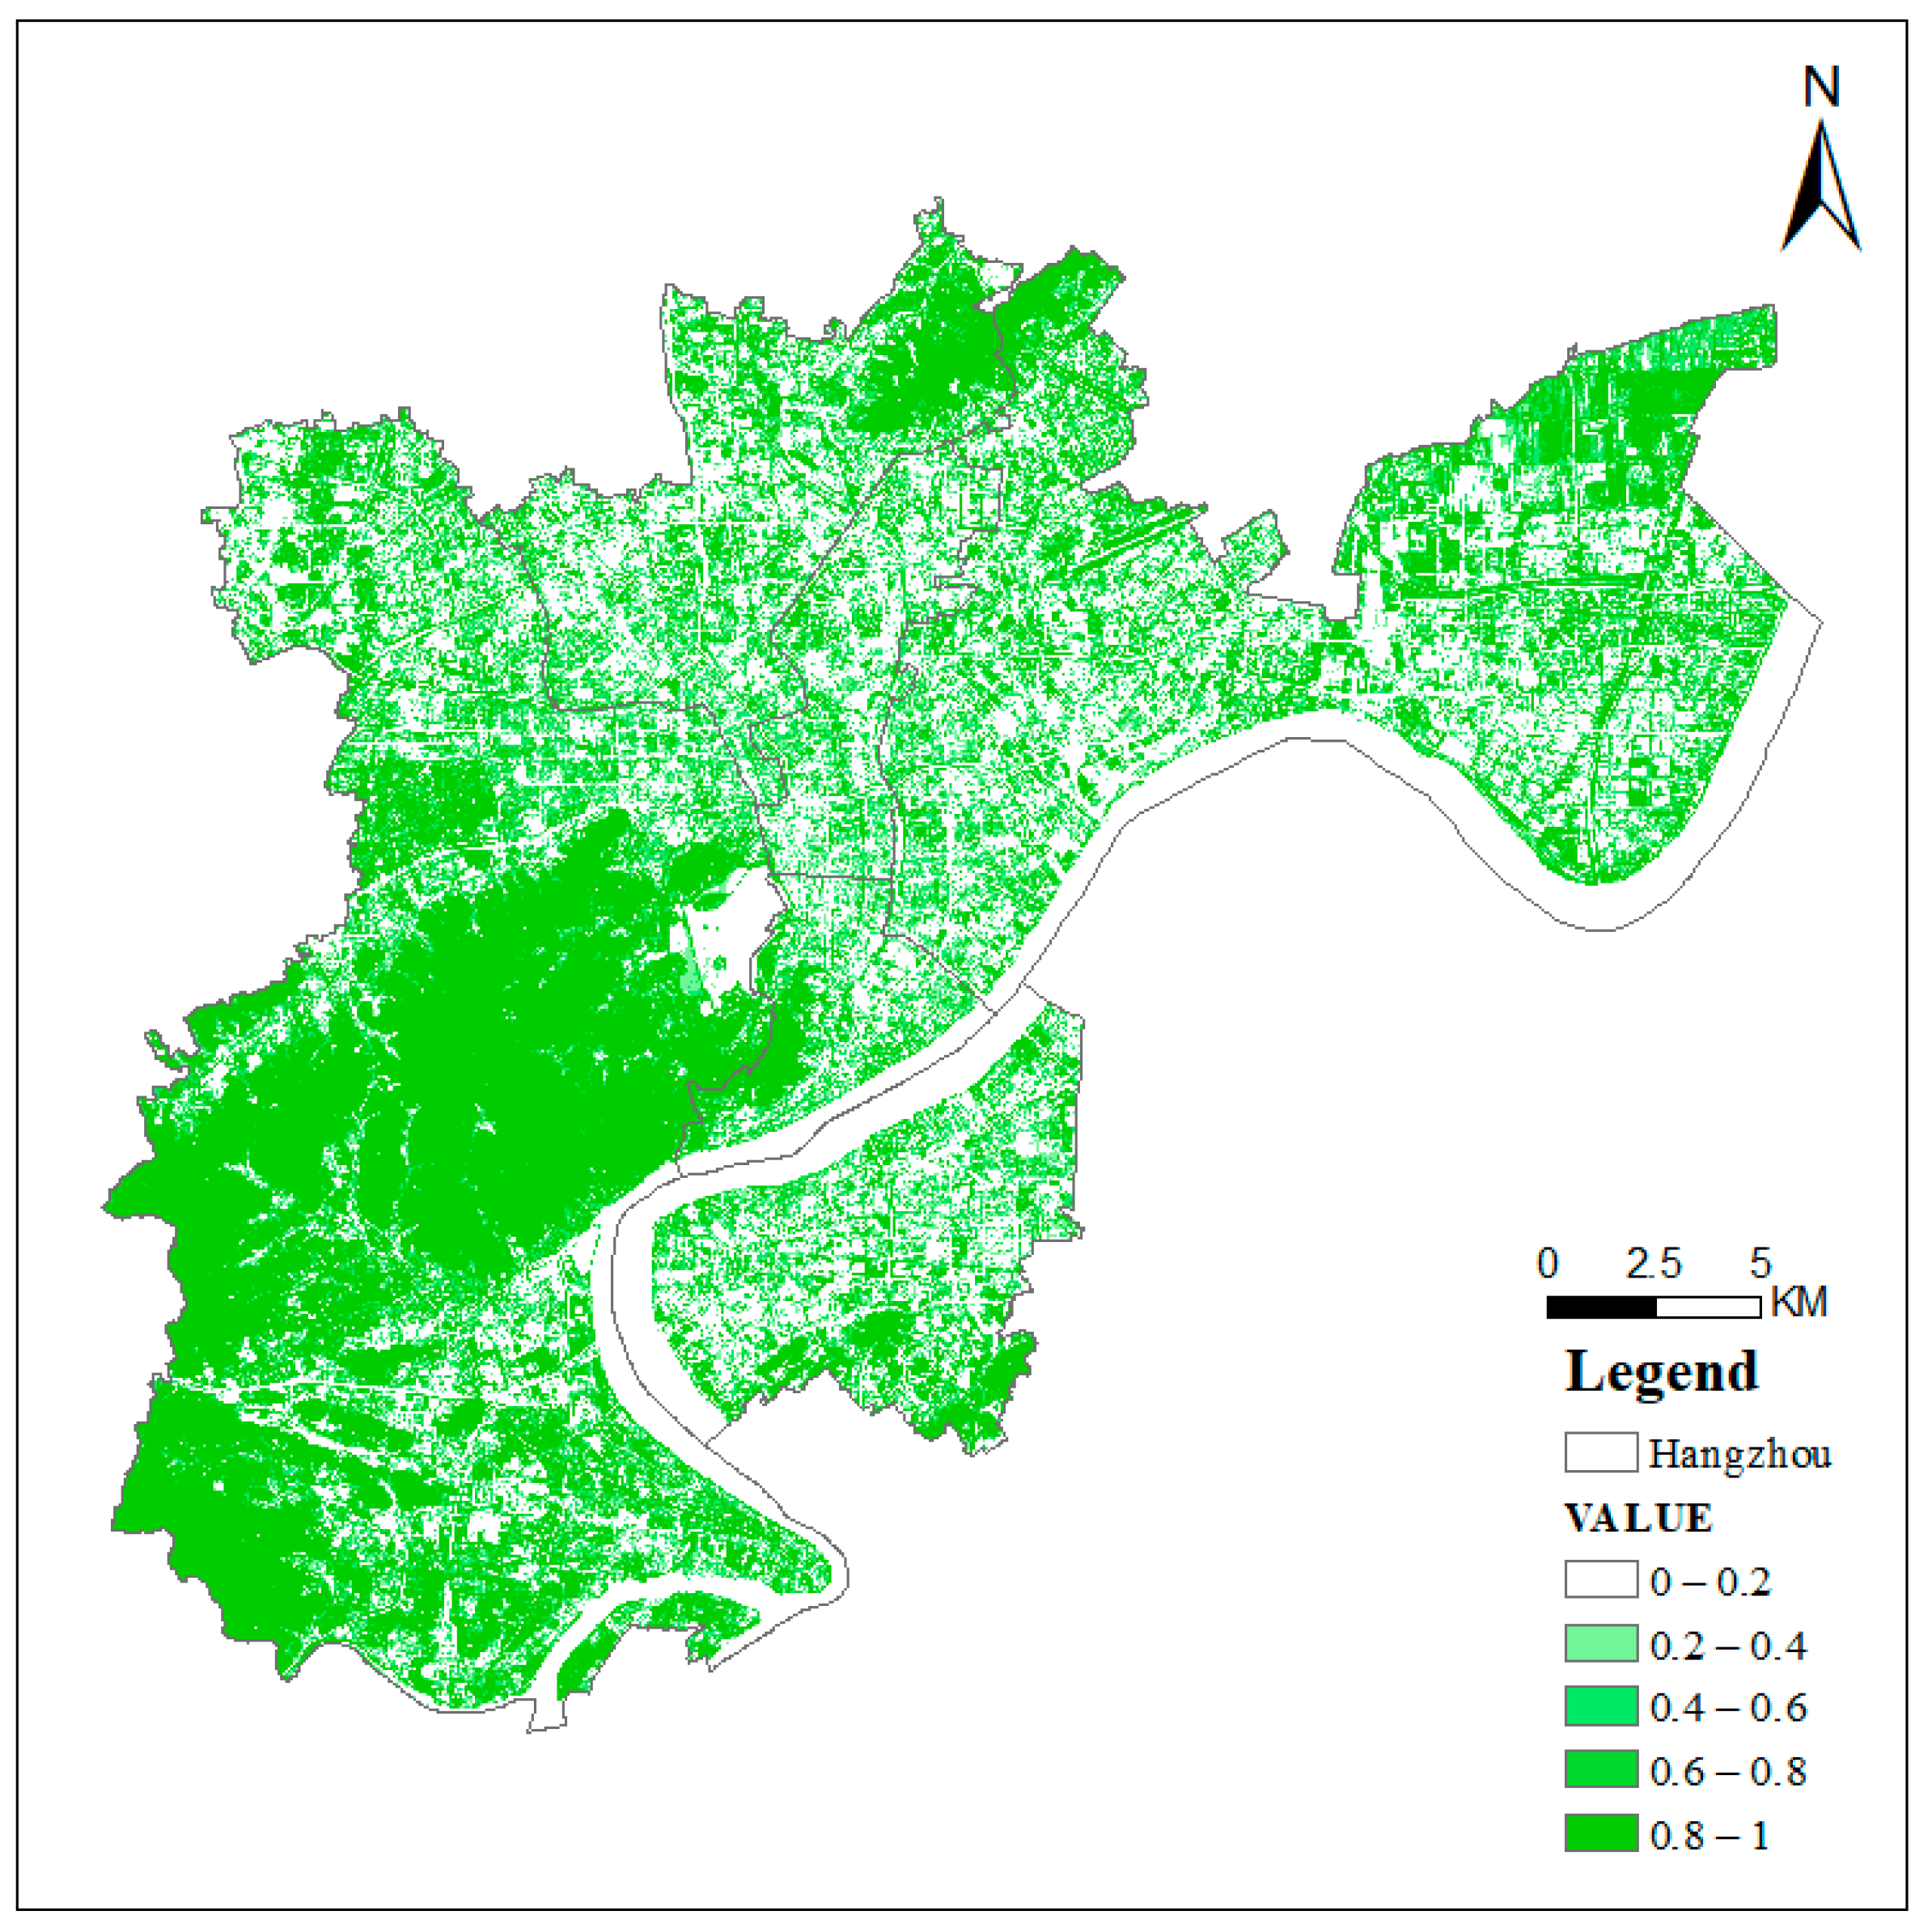
Based on the masked images, the mixed pixel decomposition model was used with four endmembers to extract the UGS: forest, grassland, bare land, and urban land. The extraction results are shown in Figure 5 and the overall UGS distribution is shown in Figure 6.
First, it can be seen that the urbanization development of Hangzhou has been of quite a high level, as shown in Figure 5d, and almost all the land had been used for urban construction except for the mountain areas (mainly located at the west of the area).
When it turns to the UGS, the level of UGS (including forest and grassland) coverage is high, and the main forms of urban greening are as follows. (1) Blocky green space: this pattern mainly appears in residential areas, close to buildings or even on the roof of buildings. (2) Linear green space: this pattern mainly appears along roads or rivers and canals, and can be easily distinguished from the surrounding objects in the image. (3) Natural green space: this type occurs as natural or artificial forest reserves, and mountains, such as the West Lake and Xixi Wetland.
As for the distribution of UGS, the areas with high UGS coverage appear in the west and north of the region, which is more likely natural green space. In the center of the region, the UGS is mainly blocky green space and linear green space.

3.2.2. Special Distribution of UGS in Each District

The results of mixed pixel decomposition were clipped according to different administrative regions to obtain the greening conditions of each district. The results are presented in Figure 7, and the distribution of UGS in each district is shown in Figure 8.
Due to natural green space (such as mountains), the UGS coverage in Xihu, Shangcheng, and Gongshu District are extremely high. Meanwhile, linear UGS can be observed in Shangcheng District and Xiacheng District, indicating the high level of street greening and road greening. This also confirms the high level of urbanization in these two districts. Finally, the coverage of forest is higher than that of grassland according to Figure 7, which indicates that urban greening in Hangzhou is primarily achieved by planting trees rather than turfing.

4. Discussion

4.1. Accuracy Analysis

The accuracy was analyzed mainly based on the green spaces extracted from the Shangcheng District in 2018. First, the calculation results are compared with the statistical results. Second, different samples are selected, and multiple extracts are used to analyze the differences in different results. Finally, the results are compared with the penetration NDVI and pixel bipartite model.

4.1.1. Comparison with Statistical Yearbook

In mixed pixel decomposition model, because forest and grassland were used as endmembers and the UGS coverage refers to the vertical projection area of all forest and grassland in the area, it is necessary to calculate the sum of forest area and grassland area when calculating the UGS area. The calculated forest area was 6.52 km2, the grassland area was 2.96 km2, and therefore, the total green space area was 9.48 km2. Accordingly, the coverage percentage of UGS was 36.38%.
In this study, as good-quality images were used and the spatial resolution was as high as 2 meters after image fusion, image quality did not strongly affect the results of the three green space extraction methods. According to the data provided in the “Statistical Yearbook of Shangcheng District in 2018”, by the end of 2018, the green space coverage rate of the whole district was 35.04%. It can be regarded that the result calculated by mixed pixel decomposition model is quite close to the statistical data.

4.1.2. Stability Analysis

To verify the stability of the results obtained using the mixed pixel decomposition model, it was repeatedly implemented for Shangcheng District using several groups of endmembers. The calculated results are shown in Table 2.
The analysis of green space extraction with different groups of endmembers showed that the results are stable and close to the yearbook data. Therefore, the mixed pixel decomposition model can be selected to extract and analyze UGS in the built-up area of Hangzhou.

4.1.3. Comparison of Different Methods

Apart from the mixed pixel decomposition model, several models were taken into consideration in some research. As these models work on different principles, their accuracy also varies for different research objects. To analyze the effectiveness of the mixed pixel decomposition model, this research compared the result from this model with that from Normalized Difference Vegetation Index (NDVI) model and pixel bipartite model with the remote sensing image of Shangcheng District.
1. 
Normalized Difference Vegetation Index (NDVI) model
In the field of remote sensing, vegetation indexes are commonly used for calculating regional vegetation coverage and distribution. According to the unique spectral characteristics of vegetation, all kinds of vegetation indexes can be obtained by combining the visible and near-infrared bands of remote sensing images [23]. The most commonly used vegetation indexes include RVI, NDVI, PVI, and DVI. Among them, the most widely used index is NDVI, which is calculated by the difference in reflection values between the near-infrared band ( N I R ) and the red band ( R ) divided by the sum of the two. The formula is as follows:
NDVI = N I R R N I R + R
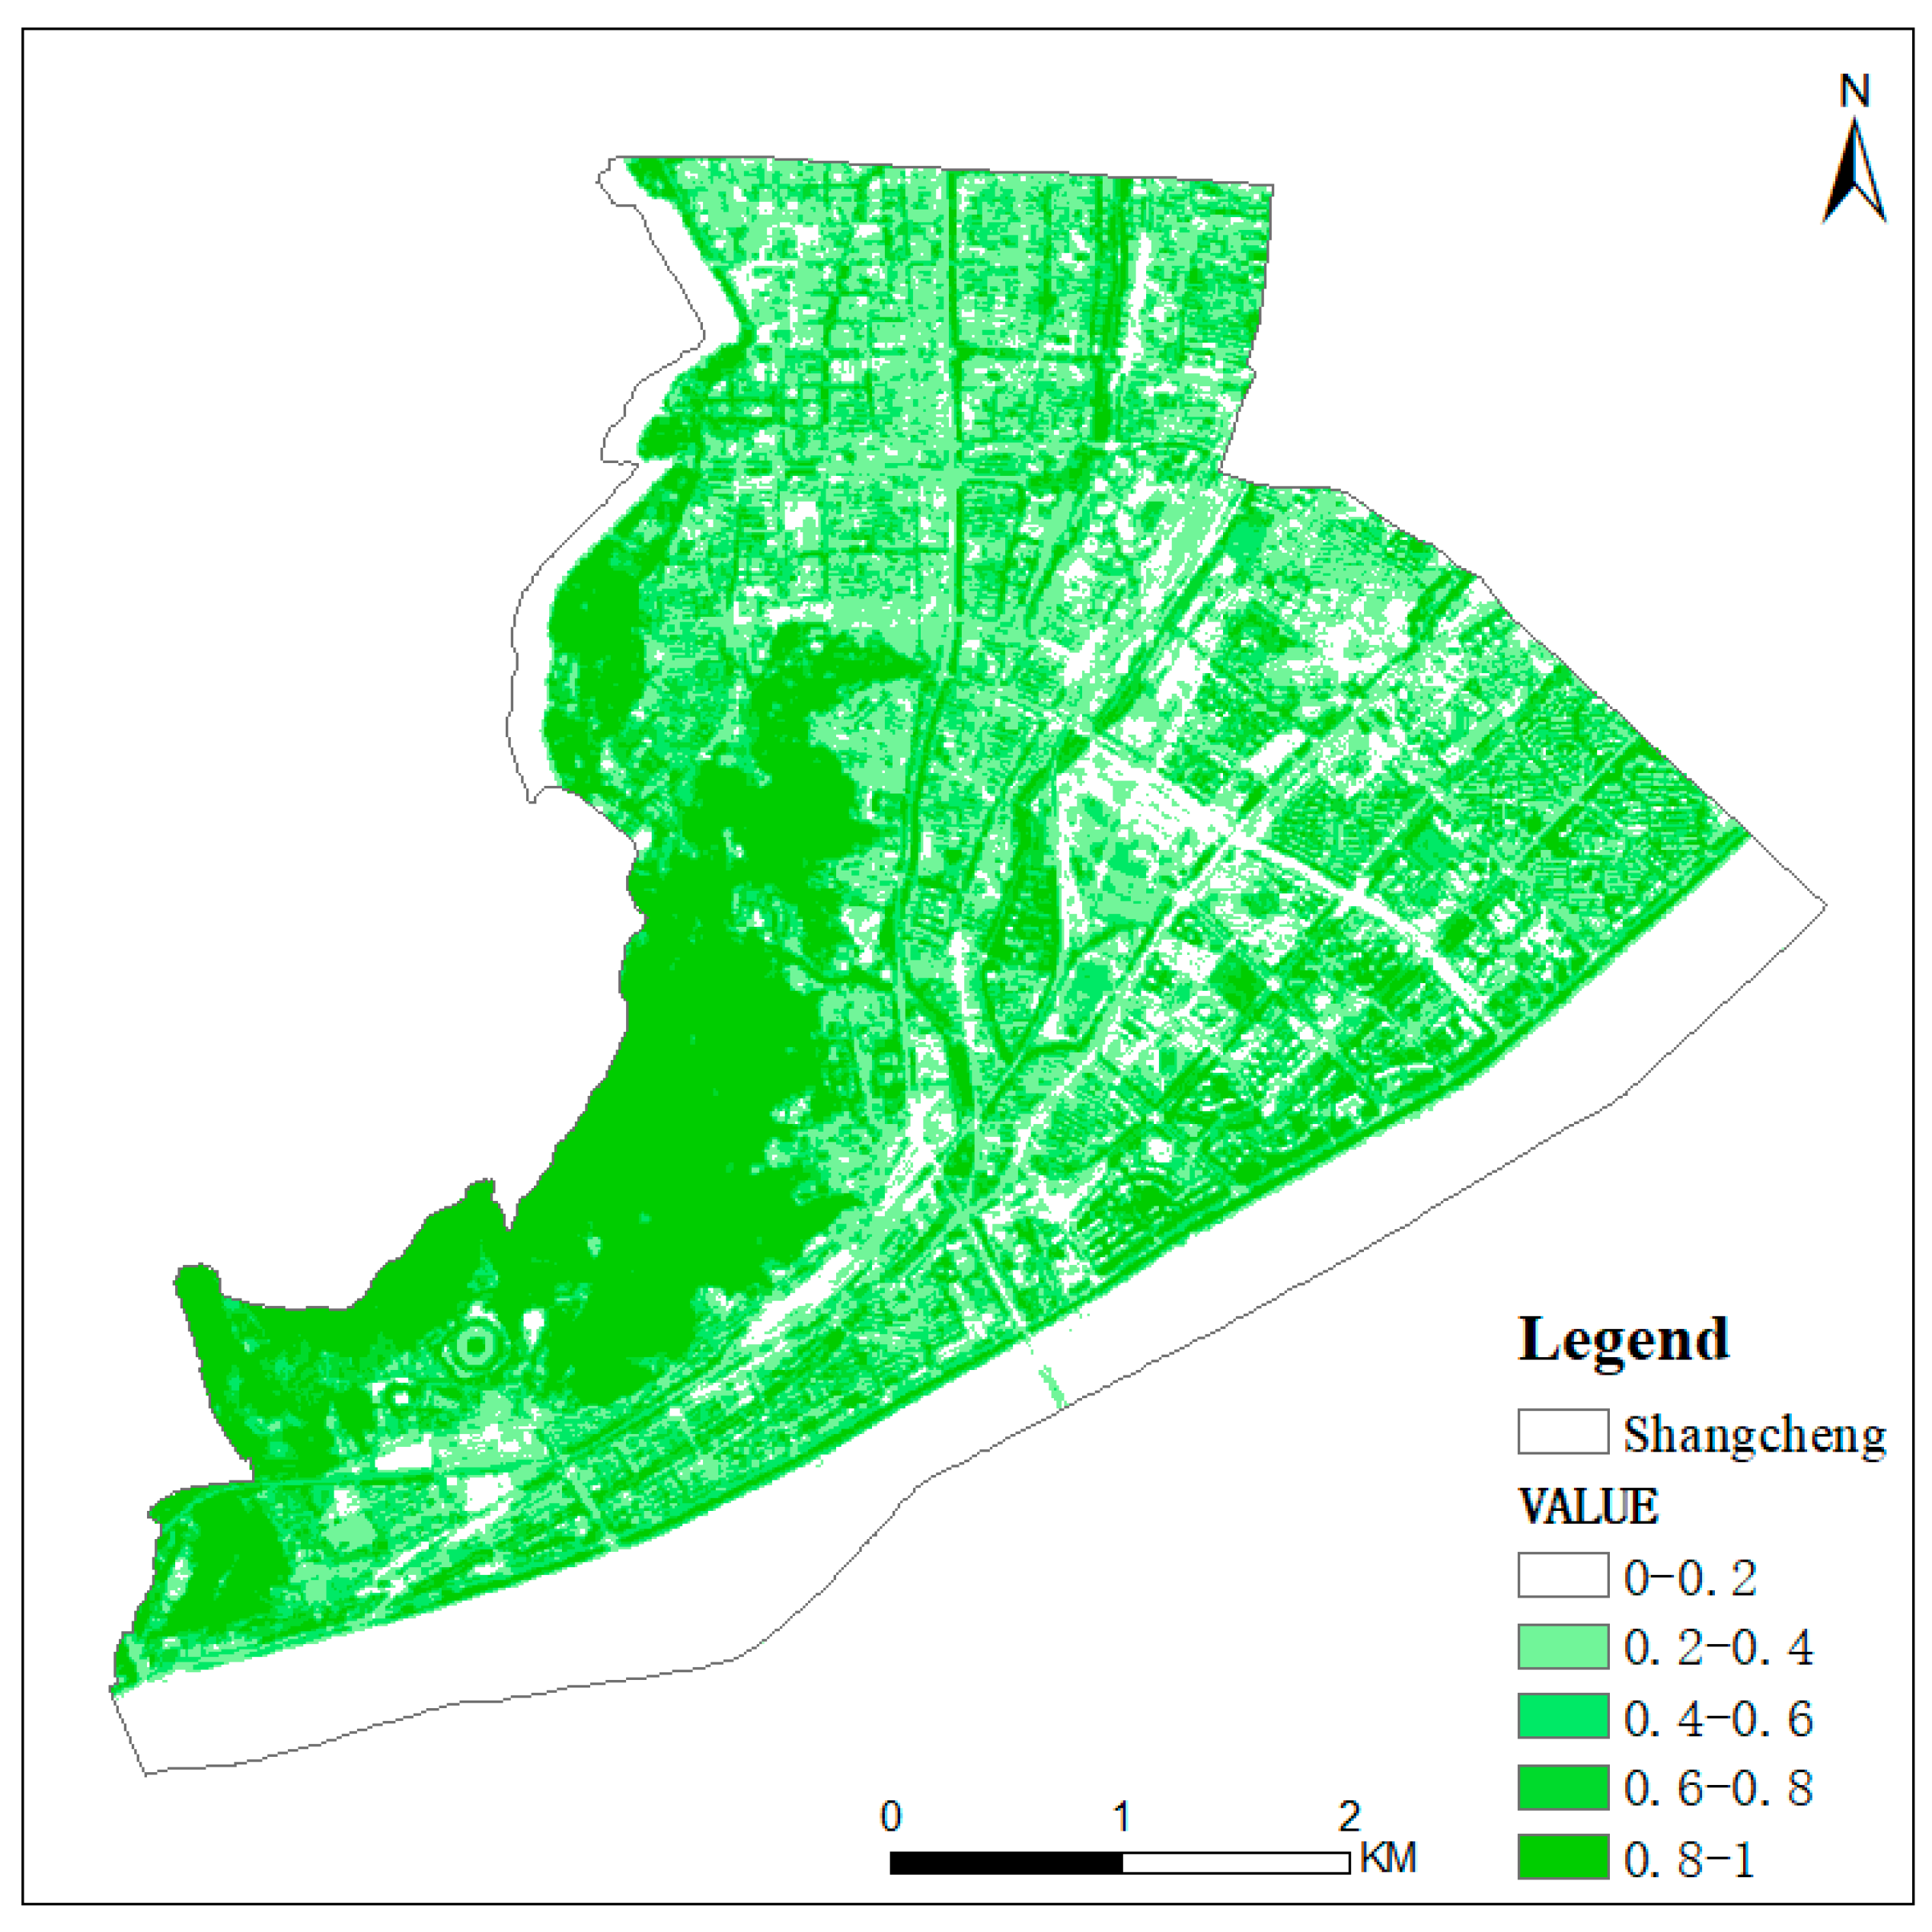
In this study, the NDVI model was used to extract the UGS. The N I R and R bands of GF-1 data correspond to the fourth and third bands of the data. Figure 9 shows the result of the NDVI calculation.
The results of NDVI are graded at intervals of 0.3, and pixels with higher NDVI values appear brighter in the image. According to the specific conditions of the study area, the threshold for segmentation when calculating the green space area was set as 0.3, and pixels with NDVI values greater than 0.3 were considered to be areas with good vegetation cover. The calculation result of the green space area was 12.39 km2. Using these data to divide the total urban area above, the vegetation coverage proportion was 47.54%.
As the NDVI index is the most common model to analyze the coverage of UGS, varieties of researchers used it to explore the distribution of green space, but there were some shortcomings as well. Li et al. pointed out that the major confusions of the NDVI model were between urban areas and dry land, and between water and green land [24]. In addition, the NDVI model requires a higher resolution of images because it is calculated from pixel to pixel [25].
2. 
Pixel Bipartite Model
The pixel bipartite model is a vegetation coverage estimation model based on the assumption that a pixel is composed of soil and vegetation. In other words, pixel information collected by a sensor can be expressed as the sum of the information contributed by the green vegetation component and the soil component [26]. Therefore, the proportion of vegetation can be expressed by the following model:
f g = S S O S g S o
In this model, f g is the vegetation coverage, S g is the pixel information value of pure vegetation coverage, S o is the pixel information value of pure soil coverage, and S is the pixel information value of mixed pixels.
As NDVI can reflect the growth and coverage of vegetation in different periods, the calculated value of NDVI can be used as the pixel information value in the above formula. Accordingly, the following models can be obtained:
f g = N D V I N D V I s N D V I v N D V I s
In this model, N D V I s represents the pixel value of bare land without vegetation coverage, and N D V I v represents the pixel value of complete vegetation coverage.
In theory, the numerical value of N D V I s should be close to 0, and the value of N D V I v is close to 1. However, in the actual experimental process, affected by image quality and the complexity of land cover, the theoretical value cannot be obtained. Therefore, it is necessary to determine the confidence interval through statistical analysis, and then determine the specific values of the two components [27].
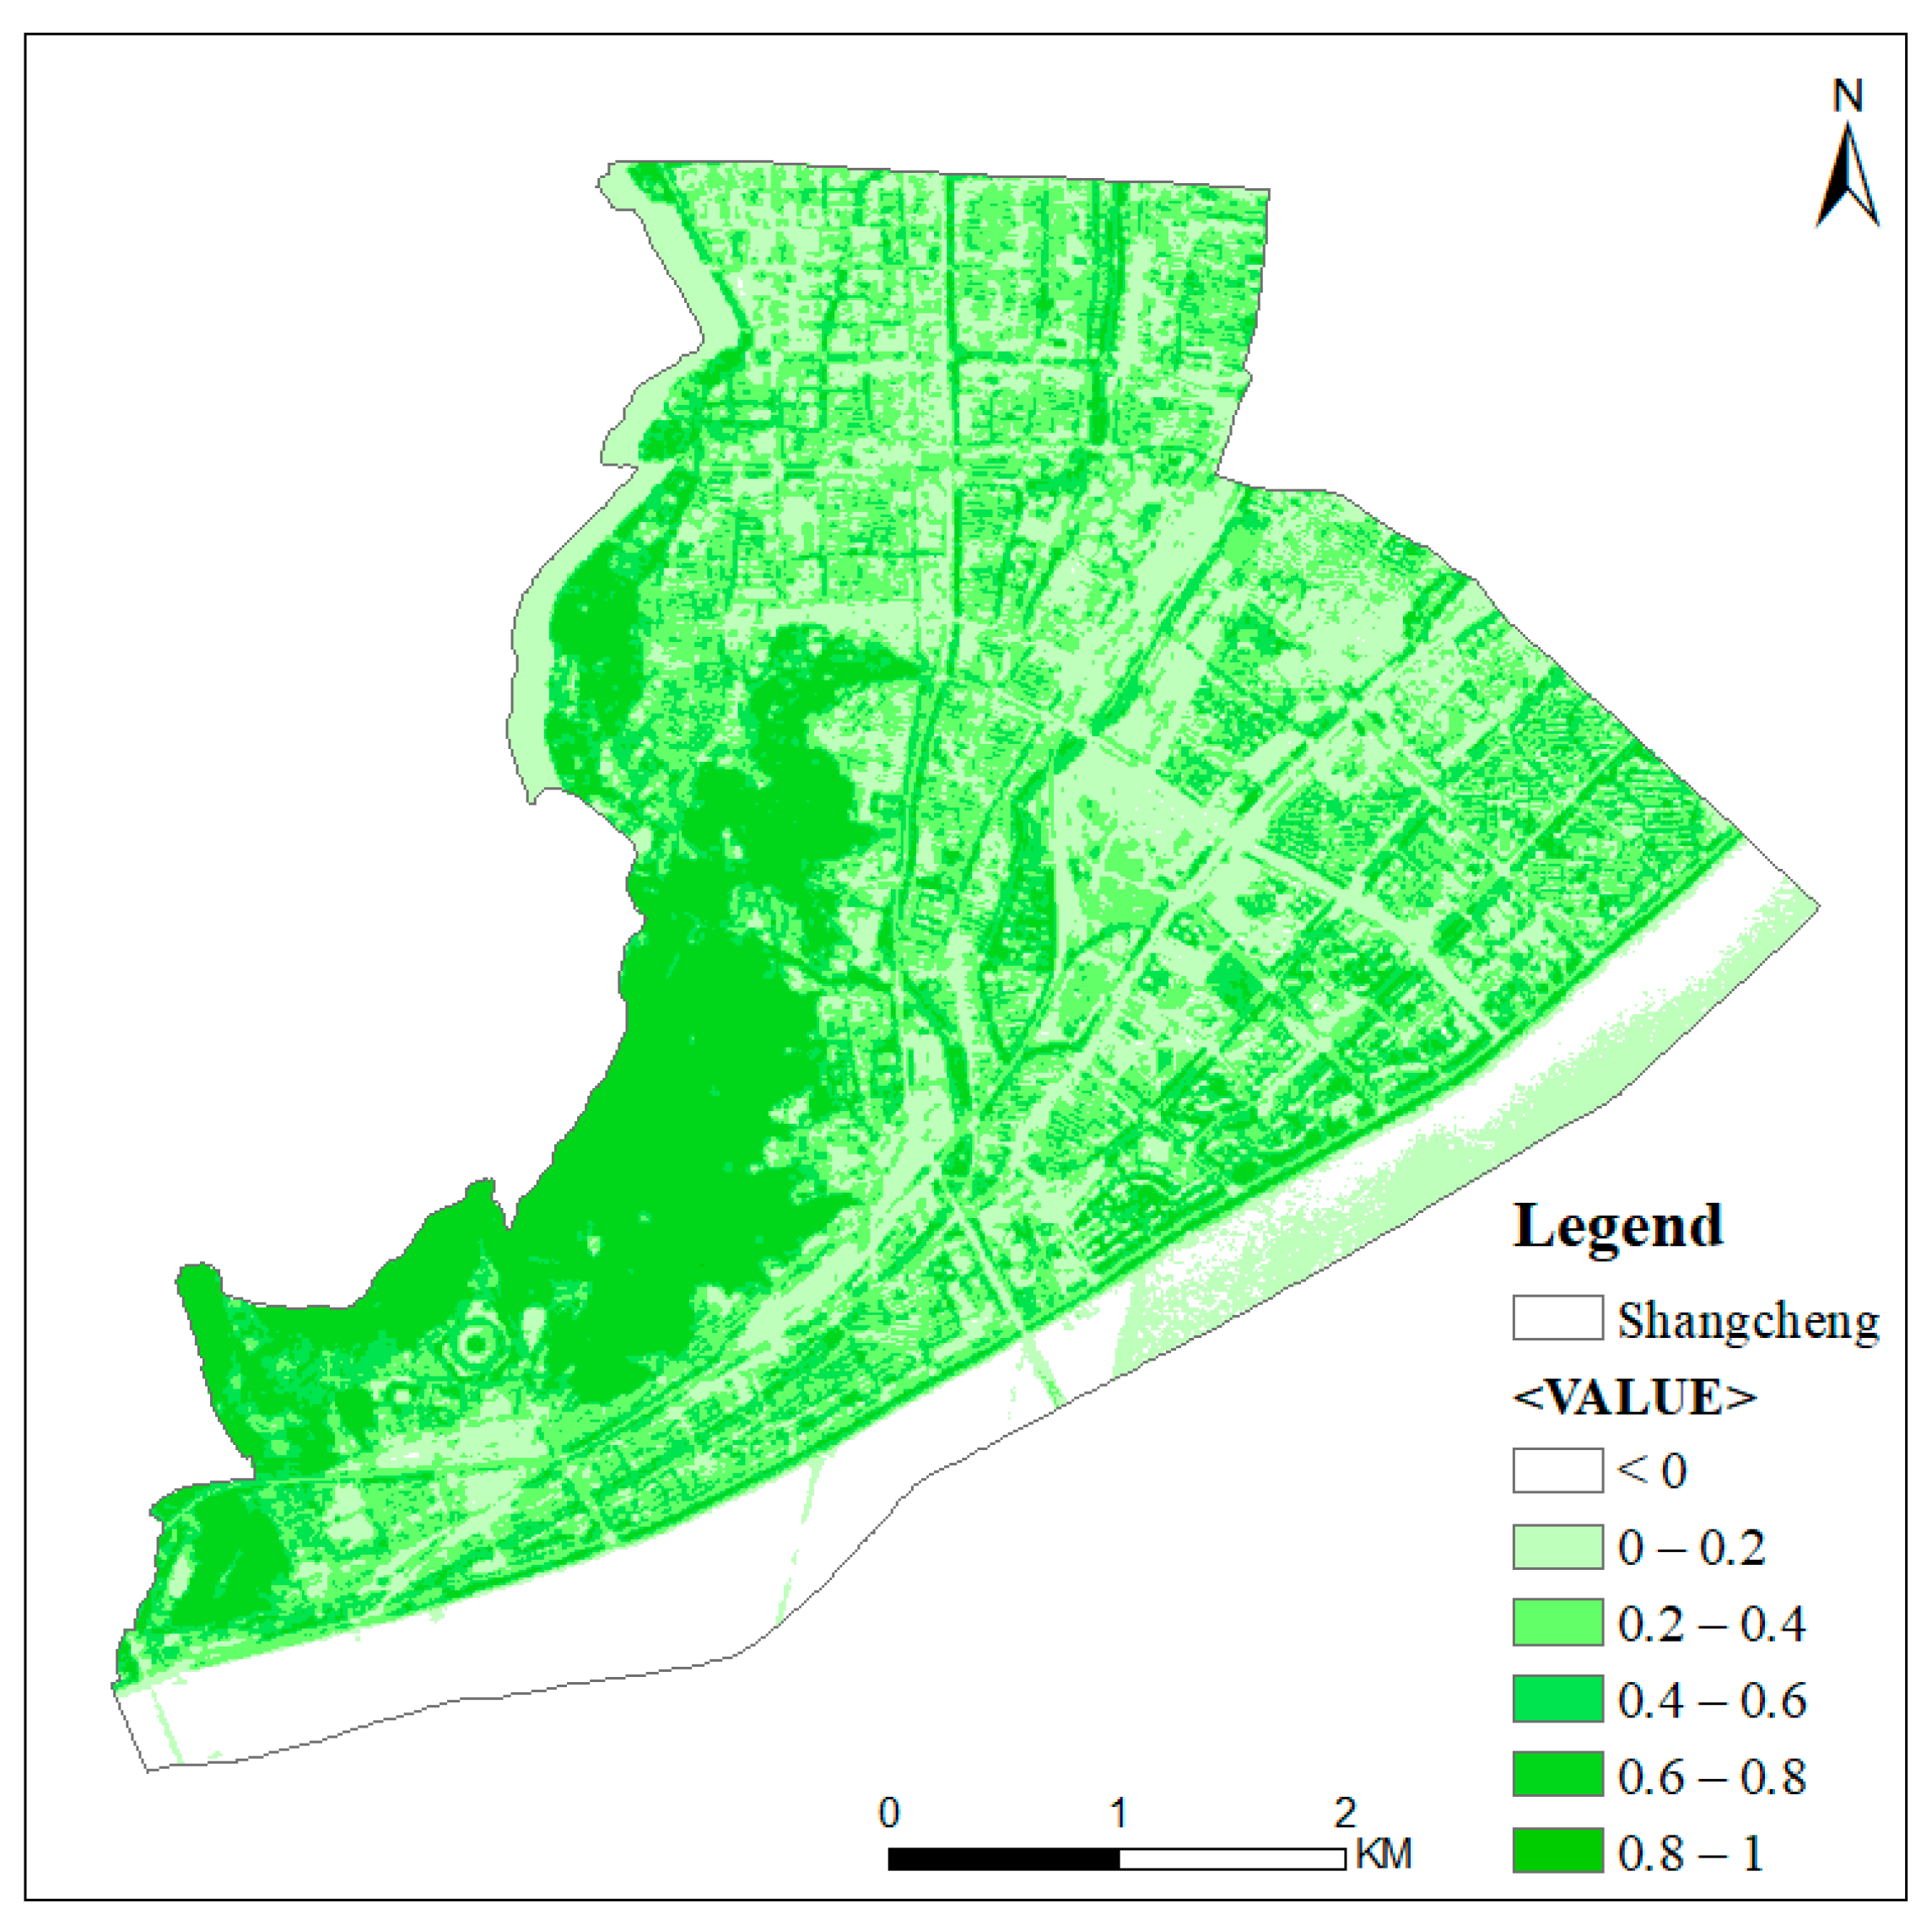
In this study, NDVI values of 5% and 95% in the NDVI frequency statistics table of the image were used as the values of N D V I s and N D V I v , respectively. The results are shown in Figure 10.
Through the calculation of NDVI, green space coverage could be obtained using the pixel bipartite model, and the green space coverage could be divided into five categories: (1) 0–0.2: very low coverage; (2) 0.2–0.4: low coverage; (3) 0.4–0.6: medium coverage; (4) 0.6–0.8: medium-high coverage; (5) 0.8–1: high coverage.
The processing results of the pixel bipartite model and mixed pixel decomposition model both refer to the percentage of green space in each pixel. Therefore, the green space area is the sum of the coefficients of all pixels multiplied by the number of pixels. The coefficient value of each pixel and the number of pixels were calculated by using the statistical tool in ENVI software and then processed in Excel. Using the pixel bipartite model, the green space area was 11.89 km2 and the UGS coverage was 45.63%.
As for other research which applied the pixel bipartite model, Liu and Li applied the pixel bipartite model with NDVI index in Henan City to extract the UGS, and they pointed out that the analysis would be quicker and more user-friendly by using the pixel bipartite model than by applying NDVI model only [28]. On the other hand, the pixel bipartite model can sometimes be subjective because the threshold is determined by the researcher. For instance, Zhu [29] selected 0.5% of the cumulative pixel value as pure non-vegetation pixel value, and 99.5% as pure vegetation pixel value, while Yin and Wang selected the pixel value of 1 as pure vegetation pixel and the pixel value of 0 as pure bare land [30]. It can be concluded that the mixed pixel decomposition model performed best among these three methods, with the smallest difference from the value given by statistical yearbook.

4.2. Analysis of Temporal Changes of UGS in Shangcheng District

Table 3 shows the comparison of the distribution of UGS in 2018 and 2020 in the Shangcheng District. The results show that the overall UGS area increased over two years, from 9.48 km2 to 10.34 km2. On the other hand, this change is caused by the increase in forest area rather than grassland area, as the area of grassland decreased by around 0.55 km2 in the period while the forest area increased by 1.41 km2 in total. This may be because the government’s decision on greening during this period is more about restoring forests than laying artificial lawns.

4.3. Analysis of Spatial Distribution of UGS in the Main Urban Area of Hangzhou

4.3.1. Special Distribution of UGS in the Main Urban Area in Hangzhou

To analyze the current situations of UGS in the built-up areas of Hangzhou in further detail, the abundance value of the results was divided into five grades using the natural breakpoint method with an interval of 0.2. (1) 0–0.2: very low coverage; (2) 0.2–0.4: low coverage; (3) 0.4–0.6: medium coverage; (4) 0.6–0.8: medium high coverage; (5) 0.8–1: high coverage. According to the statistical results of forest area and grassland area, the UGS area (the sum of forest area and grassland area), the percentage of forest (the ratio of forest area to total area), and the percentage of UGS (the ratio of UGS area to total area) can be further calculated. The calculation results are shown in Table 4.
Overall, the percentage of forest of the main built-up urban areas is 30.95%, and the percentage of UGS is 49.57%. The level of UGS in the area is relatively high. Among them, high-coverage areas account for the largest proportion of the total study area, with a percentage of forest of 14.18% and a percentage of UGS of 22.12%; in contrast, very-low-coverage areas accounted for the lowest proportion, with a UGS area of approximately 14.17 km2, accounting for only 2.01% of the whole study area. The western part of the study area is mountainous, with the widest and densest green space coverage; the central part is urban land, with medium forest and grassland coverage. Nevertheless, the distribution is very uniform, and only few areas are without UGS coverage.

4.3.2. Special Distribution of UGS in Each District

The UGS of each district can be obtained using the statistical tool ENVI. The statistics are shown in Table 5:
The results of analysis and calculation show that the UGS area of Xihu District is 199.46 km2, with a coverage rate of 64.46%, which is the highest among the six administrative regions, followed by Gongshu District and Shangcheng District, with a percentage of 43.54% and 39.68%, respectively. Xiacheng District shows the lowest UGS cover in the study area, accounting for only 32.39% of the total area. Moreover, as Xihu District and Shangcheng District include mountains, high-coverage areas in these three districts account for the largest proportion of the five levels of coverage, reaching 34.60% and 25.23%, respectively; Xiacheng and Binjiang districts mainly show medium-coverage areas, with little difference among the areas of medium, medium-high, and high coverage. Areas with very low UGS distribution in the six administrative regions all account for a very small proportion, accounting for not more than 2.37% of the total area of each district.

4.4. Analysis of Temporal Changes of UGS in Shangcheng District

The spatial distribution of green space in the main urban areas of Hangzhou shows the characteristics of medium and high coverage, uniform UGS distribution, and few areas with very low coverage. Except for the mountains with extremely high UGS coverage, there is little difference between the percentage of forest and that of grassland in different administrative regions. This characteristic is mainly attributable to policy, resident demand, economic development, and other factors.

4.4.1. Policy

Policy orientation is one of the important reasons for the change in urban land use, and the UGS planning of Hangzhou is inseparable from the guidance and support of relevant policies. As early as 2005, Xi Jinping, then secretary of the Zhejiang Provincial CPC Committee, put forward the ecological concept that “green water and green mountains are golden mountains and silver mountains”, which means that green land can be regarded as a treasure for humans. Accordingly, the Hangzhou government carried out a series of actions to protect the existing green space and increase UGS.
In 2019, the Hangzhou government formally issued the “Hangzhou High-level Land Greening and Beautification Action Plan (2019–2022)” (hereinafter referred to as the “Plan”), which revolves around rural revitalization and is based on the existing advantages of regional resources. The aim was to achieve the goal of stabilizing the city’s forest coverage at 67% by 2022. One of the important tasks of the plan was to implement the national forest city creation action, vigorously implement the “urban greening and splendor” activity and create a national forest urban agglomeration.
The Hangzhou government makes numerous efforts towards the development of UGS. Relevant policies and the planning of key areas are one of important reasons for Hangzhou’s excellent greening and good ecological environment.

4.4.2. Resident Demand

Hangzhou is one of the happiest cities in China, and the happiness primarily stems from residents being able to access the convenience and beauty of life on a daily basis [31]. UGS is one of the important links to happiness in urban residents [32]. The significance of UGS for residents is not only in improving the living environment but also in residents being able to feel physical and mental comfort and release pressure in beautiful community parks and scenic natural spots [33].
At present, the development of the city is not only in the development of the economy and urbanization but also in the improvement of people’s quality of life. Accordingly, the importance of UGS is becoming increasingly more prominent. Driven by the demand of residents and the joint efforts of the government and organizations, Hangzhou now offers not only residential parks of different sizes in rural areas but also areas that provide rest and a better green environment for residents in the city center.

4.4.3. Economic Development

UGS plays active and passive roles in promoting regional economic development, and the active role is mainly reflected in the direct economic output of nurseries. Xiaoshan District, as a major producer of seedlings in Hangzhou, has the largest seedling market in Hangzhou. Zhejiang (China) Flower and Tree City, located in Xiaoshan District, plays an important role in the Chinese seedling industry, and its products are sold to 31 provinces, municipalities, and autonomous regions in the United Nations. They are also exported to several global regions including the European Union, the United States, South Korea, and Japan. Therefore, in areas with seedling cultivation plans, the UGS distribution is not only reflected in the greening of living areas but also planned to provide economic benefits.
At the same time, the indirect economic output of UGS plays a very distinct role in tourism. Hangzhou, located in southern China, is a typical water town with beautiful scenery, and its beautiful natural scenery attracts countless tourists every year. Among them, the most famous West Lake Scenic spot, with plants and landscapes, supplemented by a variety of antique pavilions, is a favorable site for tourists and residents to relax and enjoy nature. Xixi Wetland is the first national 5A scenic spot in China, with a wide variety of plants, and its unique wetland ecology and water environment have played an important role in promoting Hangzhou’s tourism economy.

4.5. Strengths, Limitations, and Future Study

First, few studies have applied the mixed decomposition model to Hangzhou City; therefore, this research proposes a new way to analyze and discuss the overall UGS level in Hangzhou. The results also showed better accuracy by using the mixed decomposition model than other models such as the NDVI index and pixel bipartite model. In addition, this study can provide scientific help for the government to plan UGS in Hangzhou in the future. Finally, this paper endeavoured to use economic and social factors to explain the temporal and spatial changes of UGS in Hangzhou, which is also a major innovation
On the other hand, there are some limitations as well. First, when discussing the temporal changes in UGS in Shangcheng District, this paper only selected two time periods in 2018 and 2020 for comparison. To some extent, the paper only discussed the changed values, and it is difficult to describe the change trend. Meanwhile, the research only selected the main built-up area in Hangzhou rather than the whole of Hangzhou, and it may be not comprehensive for the discussion of the whole UGS feature in Hangzhou City. As for future study, it will be meaningful to describe the change trends of UGS with more data in different periods. In addition, how to improve the accuracy of the extraction results is also important to explore.

5. Conclusions

This study focuses on the UGS distribution in the main built-up area in Hangzhou using the mixed pixel decomposition model. Firstly, the research analyzed the temporal changes of UGS in Shangcheng District, Hangzhou from 2018 to 2020, and the results show that the overall UGS area increased in this period with the effort of increasing the area of forest. Second, the research analyzed the spatial characteristics of UGS in the main built-up area in Hangzhou from two aspects. Generally, the UGS distribution in Hangzhou is at a medium-high level, with some highlighted areas in natural mountains, which are also recognized as national nature reserves. As for the UGS distribution in each district, it is clear that Xihu District shows the highest coverage of UGS, over half of the region is covered by forest or grassland. Xiacheng District and Binjiang District did not perform well in UGS construction; more space was planned for artificial construction. Third, the research compared the stability and accuracy of the mixed pixel decomposition model with the other two models (NDVI model and pixel bipartite model).
Finally, the paper discusses the influencing factors of green space distribution in Hangzhou from three aspects: policy orientation, resident demand, and economic development demand. The policy guidance of the government and the living needs of residents are key drivers of the uniform distribution of UGS in Hangzhou. Under the promotion of related policies, relevant departments gradually improve the green space planning of Hangzhou, protect the original green space, and reasonably increase infrastructure such as residential parks. Considering the direct or indirect economic benefits of UGS, more large-scale green space will be formed in some areas of Hangzhou (such as the seedling planting base in Xiaoshan District and the West Lake Scenic spot in the Xihu District). These areas may have a higher degree of green coverage and single land-use planning.
To conclude, this study contributes to judging the rationality of urban green space distribution, and more research can be carried out to further improve the accuracy of green space extraction.

Author Contributions

Conceptualization, H.L. and Z.Y.; Methodology, H.L. and D.Z.; Software, D.Z.; Validation, D.Z.; Formal analysis, D.Z.; Resources, H.L.; Writing—original draft preparation, D.Z.; writing—review and editing, D.Z., H.L. and Z.Y.; Visualization, D.Z.; Project administration, H.L. All authors have read and agreed to the published version of the manuscript.

Funding

This research received no external funding.

Institutional Review Board Statement

Not applicable.

Informed Consent Statement

Not applicable.

Data Availability Statement

Please contact [email protected] for data.

Acknowledgments

The author would like to acknowledge the dataset of GF-1 and Zhejiang Provincial Bureau of Statistics for the data support.

Conflicts of Interest

The authors declare no conflict of interest.

References

  1. Kessel, A.; Green, J.; Pinder, R.; Wilkinson, P.; Grundy, C.; Lachowycz, K. Multidisciplinary research in public health: A case study of research on access to green space. Public Health 2008, 123, 32–38. [Google Scholar] [CrossRef]
  2. Yu, S.; Zhu, X.; He, Q. An Assessment of Urban Park Access Using House-Level Data in Urban China: Through the Lens of Social Equity. Int. J. Environ. Res. Public Health 2020, 17, 2349. [Google Scholar] [CrossRef] [PubMed] [Green Version]
  3. Tu, X.Y.; Huang, G.L.; Wu, J.G. Review of the relationship between urban greenspace accessibility and human well-being. Acta Ecol. Sin. 2019, 39, 421–431. [Google Scholar]
  4. Li, B.B. Study on Green Space system Planning in Urban Planning area. Constr. Sci. Technol. 2017, 21, 52–53. [Google Scholar]
  5. Li, Y.S.; Ouyang, Z.Y. Attach importance to the study on the ecological function of urban green space. Sci. Technol. Rev. 2013, 31, 11. [Google Scholar]
  6. Yang, J. A Summary of the Research on Urban Green Space and its Spatial pattern. Gansu Agric. Sci. Technol. 2018, 6, 77–81. [Google Scholar]
  7. Guo, B.N. The Function and Application of Urban Greenland System. Chin. Overseas Archit. 2018, 1, 40–41. [Google Scholar]
  8. Friederike, E.; Nadja, K. Urban green spaces for the social interaction, health and well-being of older people—An integrated view of urban ecosystem services and socio-environmental justice. Environ. Sci. Policy 2020, 109, 36–44. [Google Scholar]
  9. Ma, F.D. Spatial equity analysis of urban green space based on spatial design network analysis (sDNA): A case study of central Jinan, China. Sustain. Cities Soc. 2020, 60, 102256. [Google Scholar] [CrossRef]
  10. Liu, T.D.; Zhang, J.J.; Li, Y.J. Urban Green Space Landscape Pattern Dynamic Based on GIS-the Case of Harbin Main City Zone. J. Northeast For. Univ. 2014, 42, 65–68+74. [Google Scholar]
  11. Yao, J.; Wu, W.B.; Kang, T.J. Research on extraction method of Urban Green Space Information based on TM Image. Sci. Surv. Mapp. 2010, 35, 113–115. [Google Scholar]
  12. Jin, C.M.; Jing, H.T. Urban Green Space Information Extraction and Spatial Pattern Analysis. Geomat. Spat. Inf. Technol. 2019, 42, 105–107. [Google Scholar]
  13. Chen, Y.; Zhao, J.S.; Chen, Y.Y. ENVI based urban green space information extraction with high resolution remote sensing data. Eng. Surv. Mapp. 2015, 24, 33–36. [Google Scholar]
  14. Liang, Z.L.; Zhang, L.Y.; Zeng, X.L.; Fu, D.D.; Yang, L.X. Study on the method of urban vegetation recognition by hyperspectral remote sensing. Geospat. Inf. 2017, 15, 72–75+10. [Google Scholar]
  15. Tian, L. The extraction of time series vegetation fraction coverage based on linear spectral mixture model. Inf. Commun. 2017, 6, 29–31. [Google Scholar]
  16. Tigges, J.; Lakes, T.; Hostert, P. Urban vegetation classification: Benefits of multitemporal Rapid Eye satellite data. Remote Sens. Environ. 2013, 136, 66–75. [Google Scholar] [CrossRef]
  17. Huang, C.; Yang, J.; Lu, H.; Huang, H.; Yu, L. Green Spaces as an Indicator of Urban Health: Evaluating Its Changes in 28 Mega-Cities. Remote Sens. 2017, 9, 1266. [Google Scholar] [CrossRef] [Green Version]
  18. Tooke, T.R.; Coops, N.C.; Goodwin, N.R.; Voogt, J.A. Extracting urban vegetation characteristics using spectral mixture analysis and decision tree classifications. Remote Sens. Environ. 2009, 113, 398–407. [Google Scholar] [CrossRef]
  19. Rougier, S.; Puissant, A.; Stumpf, A.; Lachiche, N. Comparison of sampling strategies for object-based classification of urban vegetation from Very High Resolution Satellite Images. Int. J. Appl. Earth Obs. Geoinf. 2016, 51, 60–73. [Google Scholar] [CrossRef]
  20. Lv, C.C.; Wang, Z.W.; Qian, S.M. A review of hybrid image element decomposition models. Remote Sens. Inf. 2003, 3, 55–58+60. [Google Scholar]
  21. He, Q.; Zhang, Y.; Liang, L. Application of linear spectral mixed pixel decomposition technology in extracting the spatial distribution of illicit opium poppy cultivation. Optik 2020, 271, 170104. [Google Scholar] [CrossRef]
  22. Li, S.; Li, W.Z.; Zhou, J.J.; Zhuang, D.F. A review of end element selection methods in mixed image element decomposition of remote sensing images. Geogr. Geo-Inf. Sci. 2007, 5, 35–38+42. [Google Scholar]
  23. Guo, N. Vegetation Index and Its Advances. J. Arid. Meteorol. 2003, 4, 71–75. [Google Scholar]
  24. Li, D.; Lu, D.; Wu, M.; Shao, X.; Wei, J. Examining Land Cover and Greenness Dynamics in Hangzhou Bay in 1985–2016 Using Landsat Time-Series Data. Remote Sens. 2018, 10, 32. [Google Scholar] [CrossRef] [Green Version]
  25. Pan, Z.; Huang, J.; Zhou, Q.; Wang, L.; Cheng, Y.; Zhang, H.; Blackburn, G.A.; Yan, J.; Liu, J. Mapping crop phenology using NDVI time-series derived from HJ-1 A/B data. Int. J. Appl. Earth Obs. Geoinf. 2015, 34, 188–197. [Google Scholar] [CrossRef] [Green Version]
  26. Guo, F.F.; Fan, J.R.; Yan, D.; Guo, X.; Gong, K.F.; Zhang, D.R. Remote sensing estimation of vegetation cover in Changdu County based on the image dichotomous model. Soil Water Conserv. China 2010, 5, 65–67. [Google Scholar]
  27. Liu, Y.A.; Huang, B.; Cheng, T.; Qu, L.A. Vegetation Coverage in Upper Huaihe River Basin Based on Binary Pixel Model of Remote Sensing. Bull. Soil Water Conserv. 2012, 32, 93–97+267. [Google Scholar]
  28. Liu, Y.J.; Li, C. Analysis of urban vegetation cover based on NDVI and pixel bipartite model—Jiaozuo City as an example. Henan Agric. 2021, 12, 57–58. [Google Scholar]
  29. Zhu, L.F.; Xie, S.Y.; Yang, H.; Ma, M.G.; Xia, J. Landscape pattern analysis of vegetation coverage in Sichuan based on MODIS data. Leshan Norm. Univ. J. 2022, 37, 45–51+83. [Google Scholar]
  30. Yin, D.D.; Wang, Y.H. Temporal and spatial changes of vegetation coverage and its topographic differentiation in temperate continental semi-arid monsoon climate region. Acta Ecol. Sin. 2021, 41, 1158–1167. [Google Scholar]
  31. Yu, J.L. A Study on the Relationship between the Spatial Pattern of Green Space and the Physical and Mental Well-Being of Residents in Old Town of Hangzhou. Master’s Thesis, Zhejiang A&F University, Hangzhou, China, 2020; pp. 56–58. [Google Scholar]
  32. Jin, W.B. Relationship between Urban Planning and Subjective Well-Being. Master’s Thesis, Nanjing University, Nanjing, China, 2016; pp. 56–61. [Google Scholar]
  33. Kong, F.H.; Yin, H.W. Urban green space functions, present problems and future. J. Nanjing For. Univ. (Nat. Sci. Ed.) 2006, 34, 119–124. [Google Scholar]
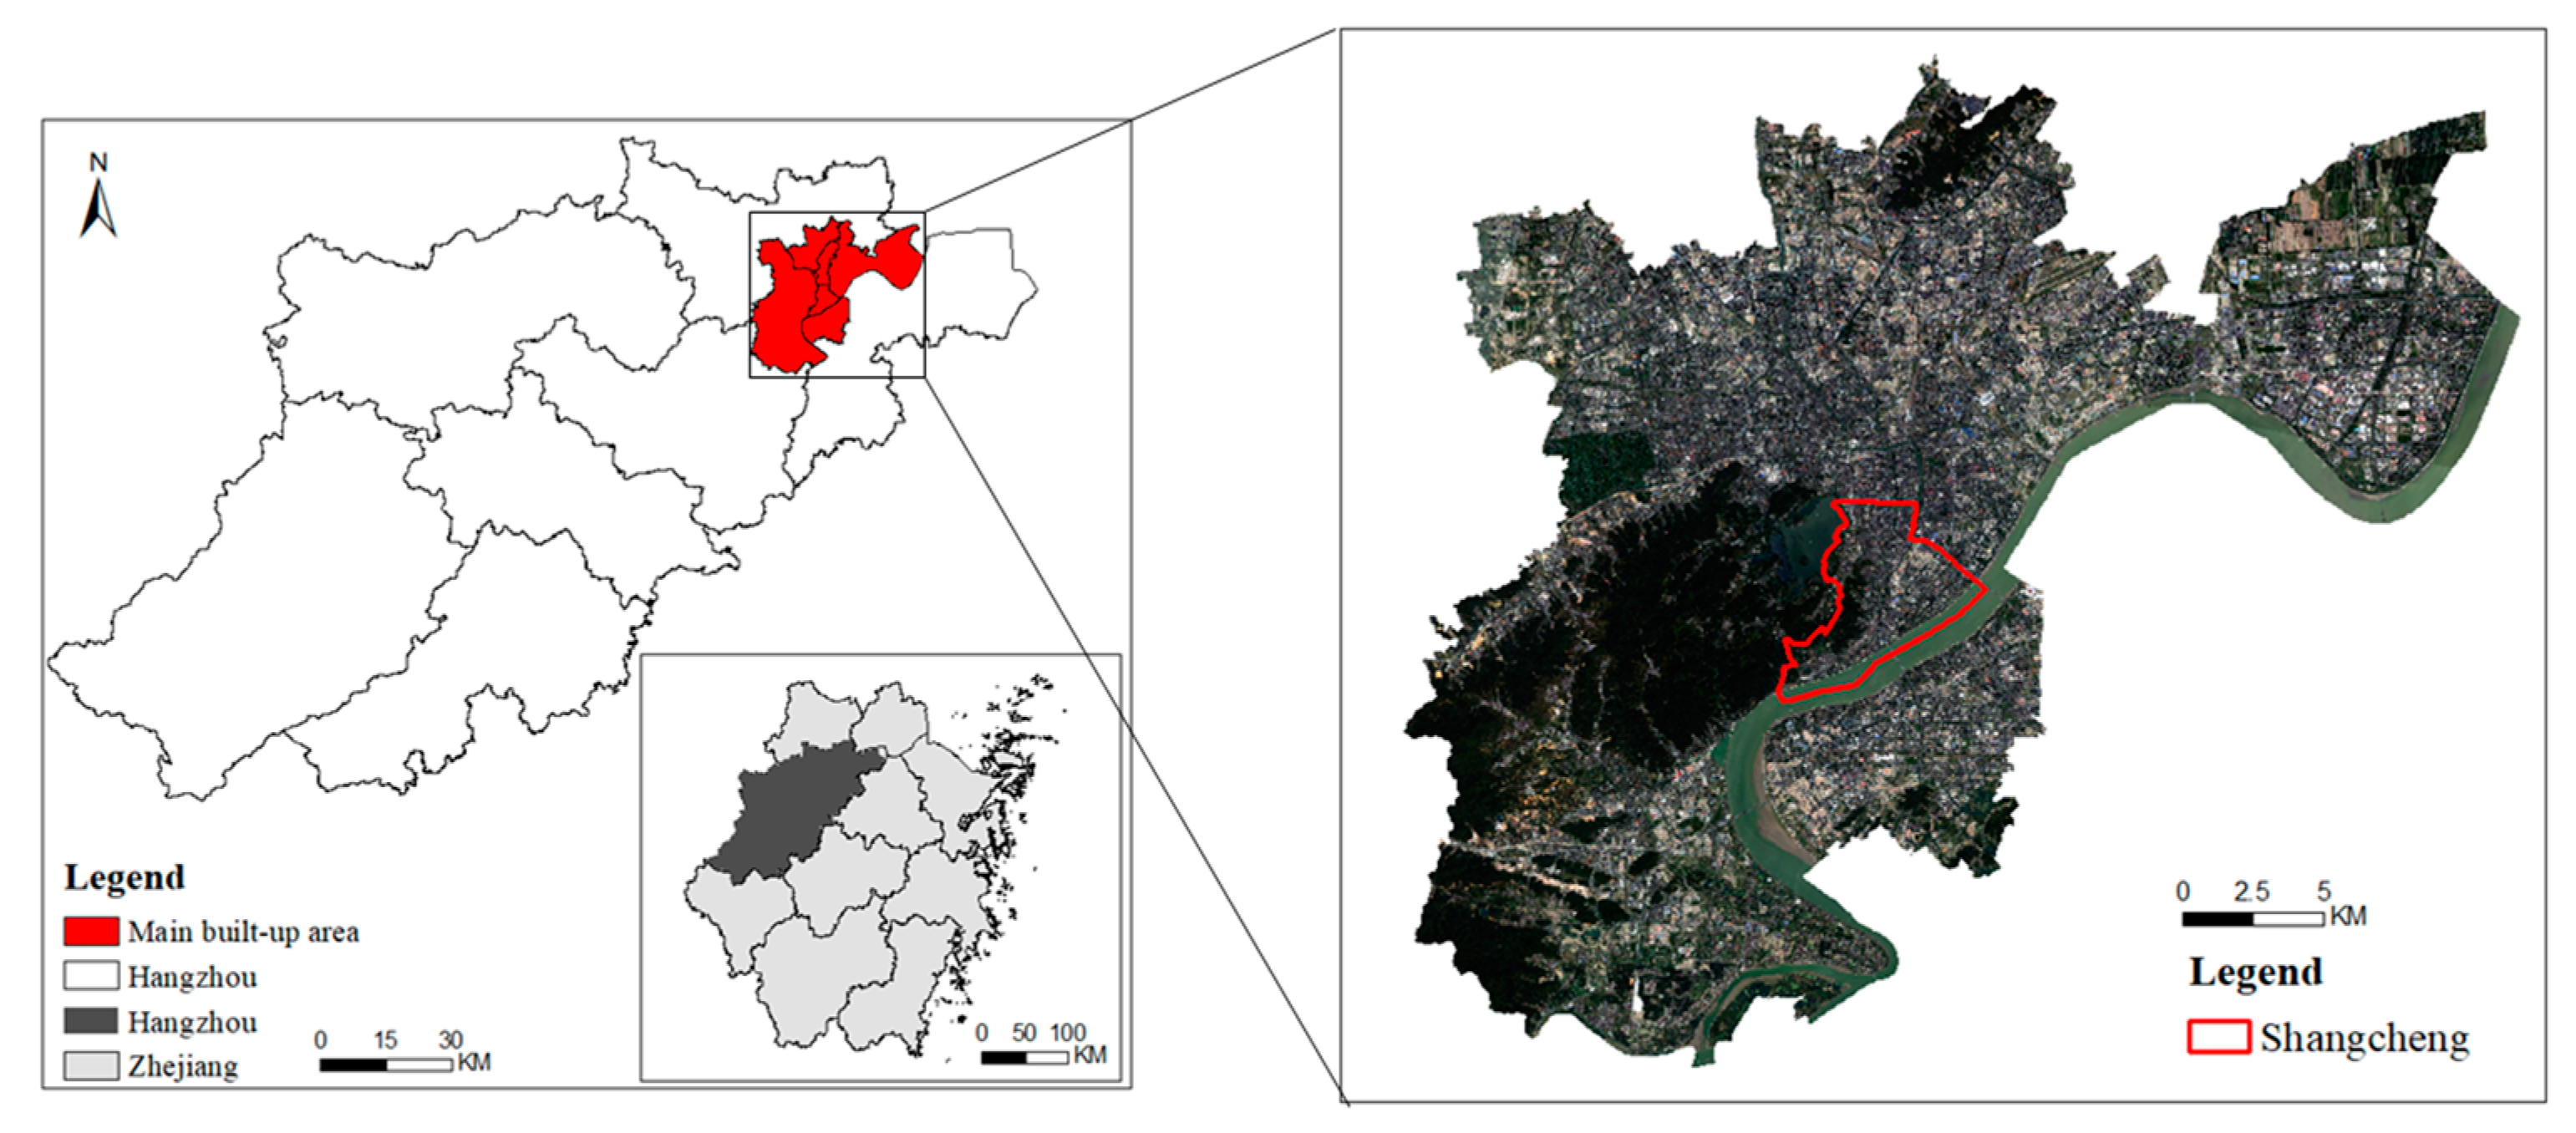
Figure 1. Study area.
Sustainability 15 12027 g001
Figure 2. Masking of water bodies based on NDWI (Shangcheng District): (a) before masking; (b) after masking.
Sustainability 15 12027 g002
Figure 3. Masking of water bodies based on NDWI (main built-up area in Hangzhou): (a) before masking; (b) after masking.
Sustainability 15 12027 g003
Figure 4. The green space distribution of Shangcheng District in 2018 and 2020: (a-1) forest, 2018; (a-2) grassland, 2018; (a-3) UGS, 2018; (b-1) forest, 2020; (b-2) grassland, 2020; (b-3) UGS, 2020.
Sustainability 15 12027 g004
Figure 5. The results of mixed pixel decomposition in Hangzhou: (a) forest; (b) grassland; (c) bare land; (d) urban land.
Sustainability 15 12027 g005
Figure 6. The distribution of UGS in Hangzhou (including forest and grassland).
Sustainability 15 12027 g006
Figure 7. The results of mixed pixel decomposition in each district: (a-1) forest, Shangcheng; (a-2) grassland, Shangcheng; (b-1) forest, Xiacheng; (b-2) grassland, Xiacheng; (c-1) forest, Jianggan; (c-2) grassland, Jianggan; (d-1) forest, Gongshu; (d-2) grassland, Gongshu; (e-1) forest, Xihu; (e-2) grassland, Xihu; (f-1) forest, Binjiang; (f-2) grassland, Binjiang.
Sustainability 15 12027 g007
Figure 8. The distribution of UGS in each district: (a) Shangcheng; (b) Xiacheng; (c) Jianggan; (d) Gongshu; (e) Xihu; (f) Binjiang.
Sustainability 15 12027 g008
Figure 9. The result of UGS extraction using the NDVI model.
Sustainability 15 12027 g009
Figure 10. The result of UGS extraction using the pixel bipartite model.
Sustainability 15 12027 g010
Table 1. Main Parameters of GF-1.
SensorBand
Number
Wavelength (μm)Spatial
Resolution (m)
Width (km)Side Pendulum AngleRevisit Cycle
PMS10.45–0.90260±35°4 Days
20.45–0.528
30.52–0.59
40.63–0.69
50.77–0.89
Table 2. Stability analysis of the mixed pixel decomposition model.
NO.Forest Area (km2)Grassland Area (km2)UGS Area (km2)Percentage of UGS (%)
16.532.969.4836.38
27.781.809.5836.76
36.362.548.934.15
46.322.929.2435.46
56.122.378.4932.58
67.381.969.3435.84
Table 3. The temporal changes of UGS in Shangcheng District.
ForestGrasslandUGS
Area (km2)Percentage (%)Area (km2)Percentage (%)Area (km2)Percentage (%)
20186.5225.022.9611.369.4836.38
20207.9330.432.419.2510.3439.68
Table 4. Statistics of five grades of UGS.
GradeForest (km2)Grassland (km2)UGS (km2)Percentage of Forest (%)Percentage of UGS (%)
Very low
(0–0.2)
7.177.0014.171.022.01
Low
(0.2–0.4)
25.5918.4944.063.626.24
Medium
(0.4–0.6)
40.3424.5064.845.719.18
Medium high
(0.6–0.8)
45.3425.4170.756.4210.02
High
(0.8–1)
100.1556.06156.2114.1822.12
Total218.59131.46350.0530.9549.56
Table 5. Statistics of the special distribution of UGS in each district.
GradeXihuXiachengShangchengJiangganGongshuBinjiang
(km2)(%)(km2)(%)(km2)(%)(km2)(%)(km2)(%)(km2)(%)
Very low
(0–0.2)
6.011.940.642.180.461.774.132.071.642.371.301.80
Low
(0.2–0.4)
19.656.351.966.681.576.0212.036.024.846.994.015.55
Medium
(0.4–0.6)
30.219.762.568.732.278.7117.338.676.789.795.687.86
Medium high
(0.6–0.8)
36.5411.812.207.502.218.4817.468.736.9810.085.367.42
High
(0.8–1)
107.0534.602.147.303.8314.7025.2312.629.9114.318.1111.23
Total199.4664.469.532.3910.3439.6876.1838.0930.1543.5424.4633.87
Disclaimer/Publisher’s Note: The statements, opinions and data contained in all publications are solely those of the individual author(s) and contributor(s) and not of MDPI and/or the editor(s). MDPI and/or the editor(s) disclaim responsibility for any injury to people or property resulting from any ideas, methods, instructions or products referred to in the content.