Article

Life-Cycle Assessments of Meat-Free and Meat-Containing Diets by Integrating Sustainability and Lean: Meat-Free Dishes Are Sustainable

by
Viktoria Mannheim
1,* and
Judit Lovasné Avató
2
1
Institute of Energy Engineering and Chemical Machinery, University of Miskolc, 3515 Miskolc-Egyetemváros, Hungary
2
Department of Methodology for Business Analysis, Institute of Quantitative Methodology, Budapest Business University, Alkotmány Str. 9-11, 1054 Budapest, Hungary
*
Author to whom correspondence should be addressed.
Sustainability 2023, 15(15), 12014; https://doi.org/10.3390/su151512014
Submission received: 20 June 2023 / Revised: 24 July 2023 / Accepted: 3 August 2023 / Published: 4 August 2023

Abstract

:
Nowadays, sustainable food choices are taking on an increasingly central role. This paper assesses the environmental loads and energy resources of meat-free (vegan and pescovegetarian) and meat-containing (traditional) restaurant soups and main dishes. The applied life-cycle assessment focuses on determining environmental loads and energy resources in restaurant products’ preparation, cooking, and end-of-life phases. Mann–Whitney and Kruskal–Wallis statistical methods were applied to investigate restaurant products’ distribution and carbon footprints. Furthermore, a sustainability assessment model was developed by integrating green-lean and life-cycle assessment approaches called “GreenCycLEAN”. Based on the analysis results, the whole life cycle of meat-free dishes has a lower environmental impact. However, the primary energy requirement of a vegetable soup is less favorable than that of a meat-containing soup. The preparation phase has higher burdens, and the cooking phase is the most energy intensive. Research results are helpful for the sustainability of catering establishments.

1. Introduction

1.1. Research History

The frequency and severity of natural disasters have increased steadily in recent years because of climate change, population growth, urbanization, and ecological changes. Europe is a densely populated and economically developed continent, so if a natural disaster occurs here, it can cause severe economic and social damage. Various indicators have been developed to monitor the impact of natural and social changes, among which food waste is one direct indicator [1]. In Europe, the amount of food waste in 2020 was 58.51 million tons (131 kg per inhabitant), of which 53% was generated in households and 9% in restaurants and food services [2]. The Sustainable Development Goals (SDGs) and the circular economy (CE) have started a field requiring a more sustainable approach to production and consumption by reducing material and energy resources [3,4,5]. Sustainable production and consumption can be one solution to preventing natural disasters. The direct benefit of sustainable production is economic, which is primarily realized in the catering sector. Sustainable consumption is aided by changed consumer demands and dietary habits because of the influence of trends focusing on healthier and more sustainable meals. Sustainable consumption promotes sustainable consumer behavior and, as a marketing tool, encourages catering establishments to adopt this approach. Considering sustainable consumption, minimizing material and energy resources should become one of the future priority goals of the catering industry, especially in the preparation and cooking phases of restaurant dishes.
New management approaches follow sustainable production and consumption. Lean management is a strategy that aims to reduce waste and shorten production time in as many areas as possible [6]. The lean system is based on value streamlining and continuous improvement, optimizing production to adapt to constantly changing conditions [4]. Lean production focuses on food waste (in Japanese: “muda”) by making the problem of food waste and food loss cover the entire food chain. This philosophy makes the consumer an essential link in the company’s operations (mainly through his feedback). According to Lipińska et al. [7], muda is a human activity that consumes resources without creating value. The “real-time” lean approach can cut the cost of live labor by up to half [8]. At the same time, the shortcoming of the lean philosophy is that it does not directly include sustainability. The green-lean approach, based on sustainability and the lean, involves rigorous monitoring and assessment of processes to help optimize management’s decision making [9,10]. Some research results [11,12] show that green lean can reduce energy consumption by 20% to 40%. The green-lean approach can reduce food waste generated in the preparation and cooking phases in the catering industry [13,14]. Applying green lean in restaurants can make dish products and services more competitive. Combining lean management principles and sustainability will primarily contribute to a more efficient and sustainable company operation [15,16]. However, green lean should be supplemented with the life-cycle assessment method. The three approaches have long been studied individually, but there are no examples of their combined implementation in the literature. The three ways alone do not optimize environmental impacts. Life-cycle assessment is a method consisting in an environmental management device; lean is a management strategy; and environmental awareness is a behavior. Since sustainable development can only be achieved through global cooperation, it is necessary to coordinate the three areas as widely as possible. Combining them leads to the three approaches complementing each other and can be more easily applied to a specific area. GreenCycLEAN is a complex approach encompassing sustainable environmental awareness, life-cycle assessment, and lean management.

1.2. The Literature Review

More and more research supports [17,18] the importance of the quantity and quality of nutrition, and the concept of functional eating has appeared. Today’s health-conscious and environmentally friendly consumers increasingly demand vegetarian, vegan, and sustainable dishes that retain their natural properties. The “living to eat” dilemma seems to dissolve, and the “eating to live” viewpoint comes into view. Based on scientific works [19,20], the risk of not only cardiovascular diseases but also eye and other diseases can be reduced by orders of magnitude by eating the right foods. According to the literature of Santeramo et al. [21], increasing the proportion of vegetables and fruits in the food pyramid is strongly recommended to prevent cardiovascular disease and obesity. The same motivation is behind changing the meat consumption pattern [22]. Social norms and living standards strongly influence changes in consumer habits. Calculations on consumer behavior show that as living standards rise, so does the consumption of higher-nutritional-value foods (animal protein), just like that of pasta and vegetables. This context needs to be complemented by geographical aspects. It means that the consumption of certain meat products varies from region to region. Looking at the evolution of meat consumption by country category, the meat consumption of the upper-middle-income group increased until 2014 [23]. Poultry meat consumption shows the highest growth rate (17.8% from 2021), followed by sheep meat (15.7%), pig meat (13.1%), and beef (5.9%) [18]. Countries with a lower standard of living (<USD 3895 per capita) played a prominent role in increasing the preference for poultry meat. The impact of higher-income countries (>USD 13,000 per capita) is estimated to be a quarter of the effect of the previous group [23]. The reason for the increase is the lower prices in the first group and the functional diet in the second group. The difference in the ratio is due to the different demographic composition of the population [23]. With increasing health- and environmentally conscious guests, the food industry has followed the catering industry’s demand for “functional” and new, exotic dishes [24,25]. Seafood is an essential part of the Mediterranean diet. Its positive effects on preventing chronic and inflammatory diseases have been scientifically proven. They also improve the condition and performance of the brain, eyes, and heart [26,27,28,29,30]. In 2020, the world’s average fish consumption was 20 kg per person per year, while meat consumption was 49 kg [23]. However, eating seafood is double edged: it can be the source of several pollutants, including persistent organic pollutants (POPs) and heavy metals [23].
In respect of health, one of the essential considerations when eating out is the amount of energy consumed per portion [31,32]. The phrase ‘energy efficiency’ is used in two senses: in a nutritional sense and in a food preparation sense [33]. The lower the energy content of a restaurant meal, the healthier it is in terms of the current interpretation [34,35]. The way to achieve this is to increase the proportion of vegetables, increase fiber, and use as few and as little processed raw materials as possible [36,37,38,39,40]. Studies of the circular economy theory have reinforced that dependence on resources can be reduced if they can be reused, renewed, or recycled [14]. Directly linked to the kitchen processes, it is in the fundamental economic interest of the catering sector to use raw materials in the least wasteful manner possible [41,42]. At the same time, they also must fulfil food safety standards (HACCP) [43,44,45,46]. Combining the above expectations, the question arises whether sustainable and healthy hospitality is possible. However, regarding economic weight, tourism and catering are not the most critical sectors. After a decline of 50.4% in 2020, the contribution of travel and tourism to GDP increased by 21.7% in 2021. In 2019, tourism and hospitality accounted for 10.3% of the global GDP, falling to 5.3% in 2020 (due to continued restrictions) and rising to 6.1% in 2021 [47,48]. The impact is much more significant, however, if you include the health and well-being of the consumers who use its services [49,50]. Hospitality services must meet healthy consumption criteria [51,52]. The consumer, as a guest, must know the details of the chosen dishes [53,54,55,56].
Economic, environmental, and social pillars are needed to achieve sustainability in hospitality because, in other cases, sustainability fails to manage the “anomalies” of a given process, leading to food waste. Some studies [9,10,11,12,13] offer the lean strategy as a solution. The lean theory focuses on value creation and continuous improvement alongside the monitoring of the company’s operations. The basic idea of lean is to produce for the customer, to maximize value for the customer while minimizing waste [57,58,59]. Seven main areas of lean measurement have now emerged. These are as follows: manufacturing process and equipment, production planning and scheduling, visual information system, supplier relations, customer relations, workforce, and product development and technology. However, lean alone cannot wholly eliminate food waste because it is not based on thinking in terms of systems or a scientific approach. Furthermore, lean alone cannot solve the problem of identifying and reducing process errors while considering environmental aspects. While green lean is closely linked to decision support and expert systems, they lack a practical problem-solving orientation. However, life-cycle thinking is a method based on thinking in terms of systems targeting the quantifying and assessing of the environmental impacts of different processes [60,61]. Like green lean, LCA is characterized by the side-effect nature of strategic decisions [62]. The three approaches (sustainability, lean, and LCA) are interlinked, can be used together, share standard features, and compensate for each other’s shortcomings. As a result of these characteristics, these strategies can address the objectives of resource saving and of food-waste and environmental-impact minimization together and simultaneously. Optimizing environmental impacts, economic efficiency, and social sustainability is an indirect side effect. To ensure cost-effectiveness, the information operators provide must be accurate and reliable [60].

1.3. Research Aims and Research Hypothesis

The research study’s topic is related to the research field of sustainability in production management and the catering sector. The literature distinguishes between many different eating strategies. Still, our eating strategies were selected based on the criteria of the dishes for which we had a database on our computer software. As a result, the main research aim was to investigate the vegan, pescovegetarian, and traditional two-course restaurant menus using a life-cycle assessment method. The selected restaurant dishes are well known in Hungarian restaurants and kitchens. We received accurate data (material and energy flows) from the head chef of the Hungarian restaurant “Saint Anna” only regarding soups and main courses, without desserts. We could compile two-course menus and analyze them individually during the software measurements. The exact measurement of these data was also quite a process, lasting several months in the restaurant (in which we participated, anyway). The software’s construction of operations and plans took a year and a half during our research work by building the LCA processes and plans in the software one by one for each catch and their scenarios. In the first step, the environmental burdens of two different restaurant soups were quantified. The garlic cream soup is the first part of the two-course vegan and pescovegetarian menus. The bean soup contained beef, the first course on the traditional menu. The second step compared vegan (green salad), pescovegetarian (fish with gnocchi), and traditional (Wienerschnitzel) main dishes to find a sustainable and optimal scenario. The impact categories and the energy resources in the preparation, cooking, and end-of-life phases for the three two-course menus were calculated. The nutritional value of the catches examined does not affect the environmental impact, so we did not calculate the nutritional value. The further research aim was to compare soup and main dish samples using different statistical methods. The last part of the research study sets up a sustainability assessment model (called GreenCycLEAN) that integrates LCA and green-lean approaches.
As a research hypothesis, knowing the life cycle of vegan, pescovegetarian, and traditional restaurant dishes, we can set up and compare different life-cycle assessments for the two soups and the three main courses. From a life-cycle assessment viewpoint, restaurant dishes produce food waste in the preparation, cooking, and use (food consumption) life-cycle phases. Furthermore, it can be assumed that the whole life cycle of vegan and pescovegetarian restaurant products has less impact on our environment, and its primary energy values are also more favorable.

2. Materials and Methods

2.1. Data Collection

Since the research goal was to set up life-cycle assessments for vegan, vegetarian, and traditional restaurant two-course menus, collecting the needed data for the inventory analysis from a Hungarian restaurant was helpful. For data collection, the main chef of the Saint Anna Restaurant (in Berkenye, Hungary) provided all material flows for the preparation and cooking phases, including the quantity of the food leftovers. We obtained the exact energy values for all sources: electricity grid mix for preparation and cooking; thermal energy from natural gas for cooking; electricity for cooled beef meat storage; and drinking water volume for preparation, cooking, and washing dishes. Regarding the capacity of the kitchen machines, we considered average values. The calculations are based on the two different soups and the three main dishes.

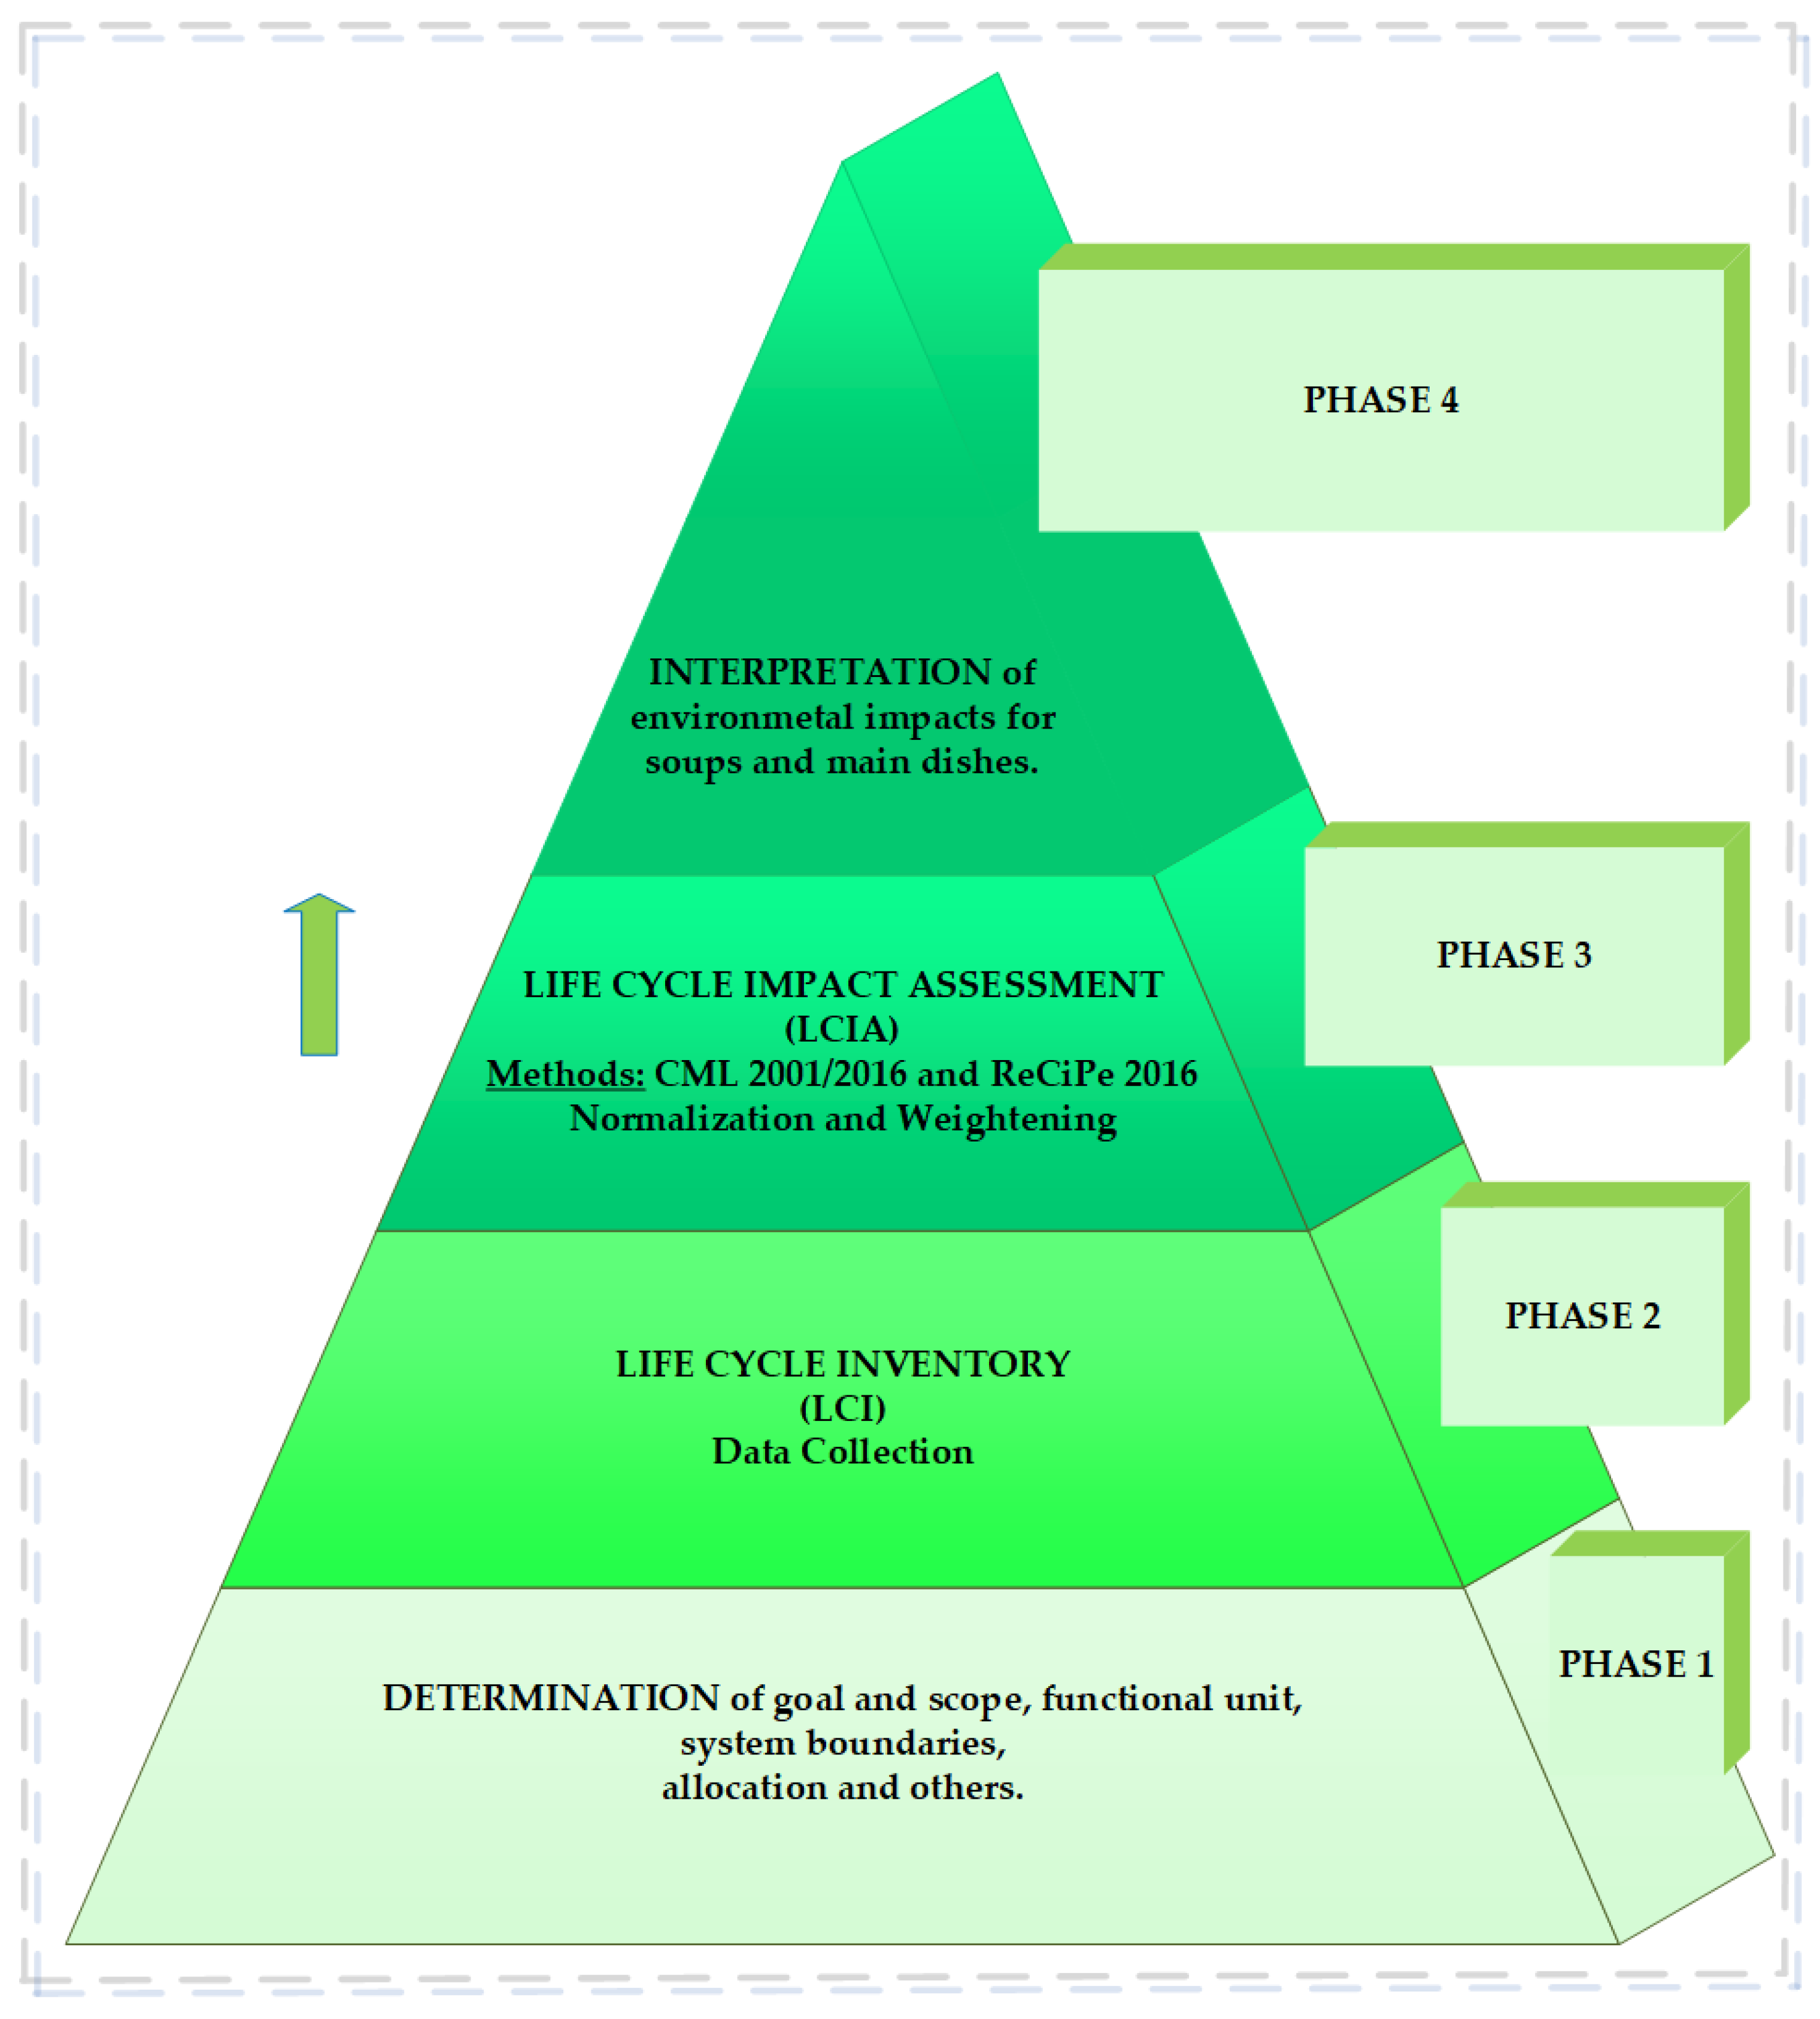
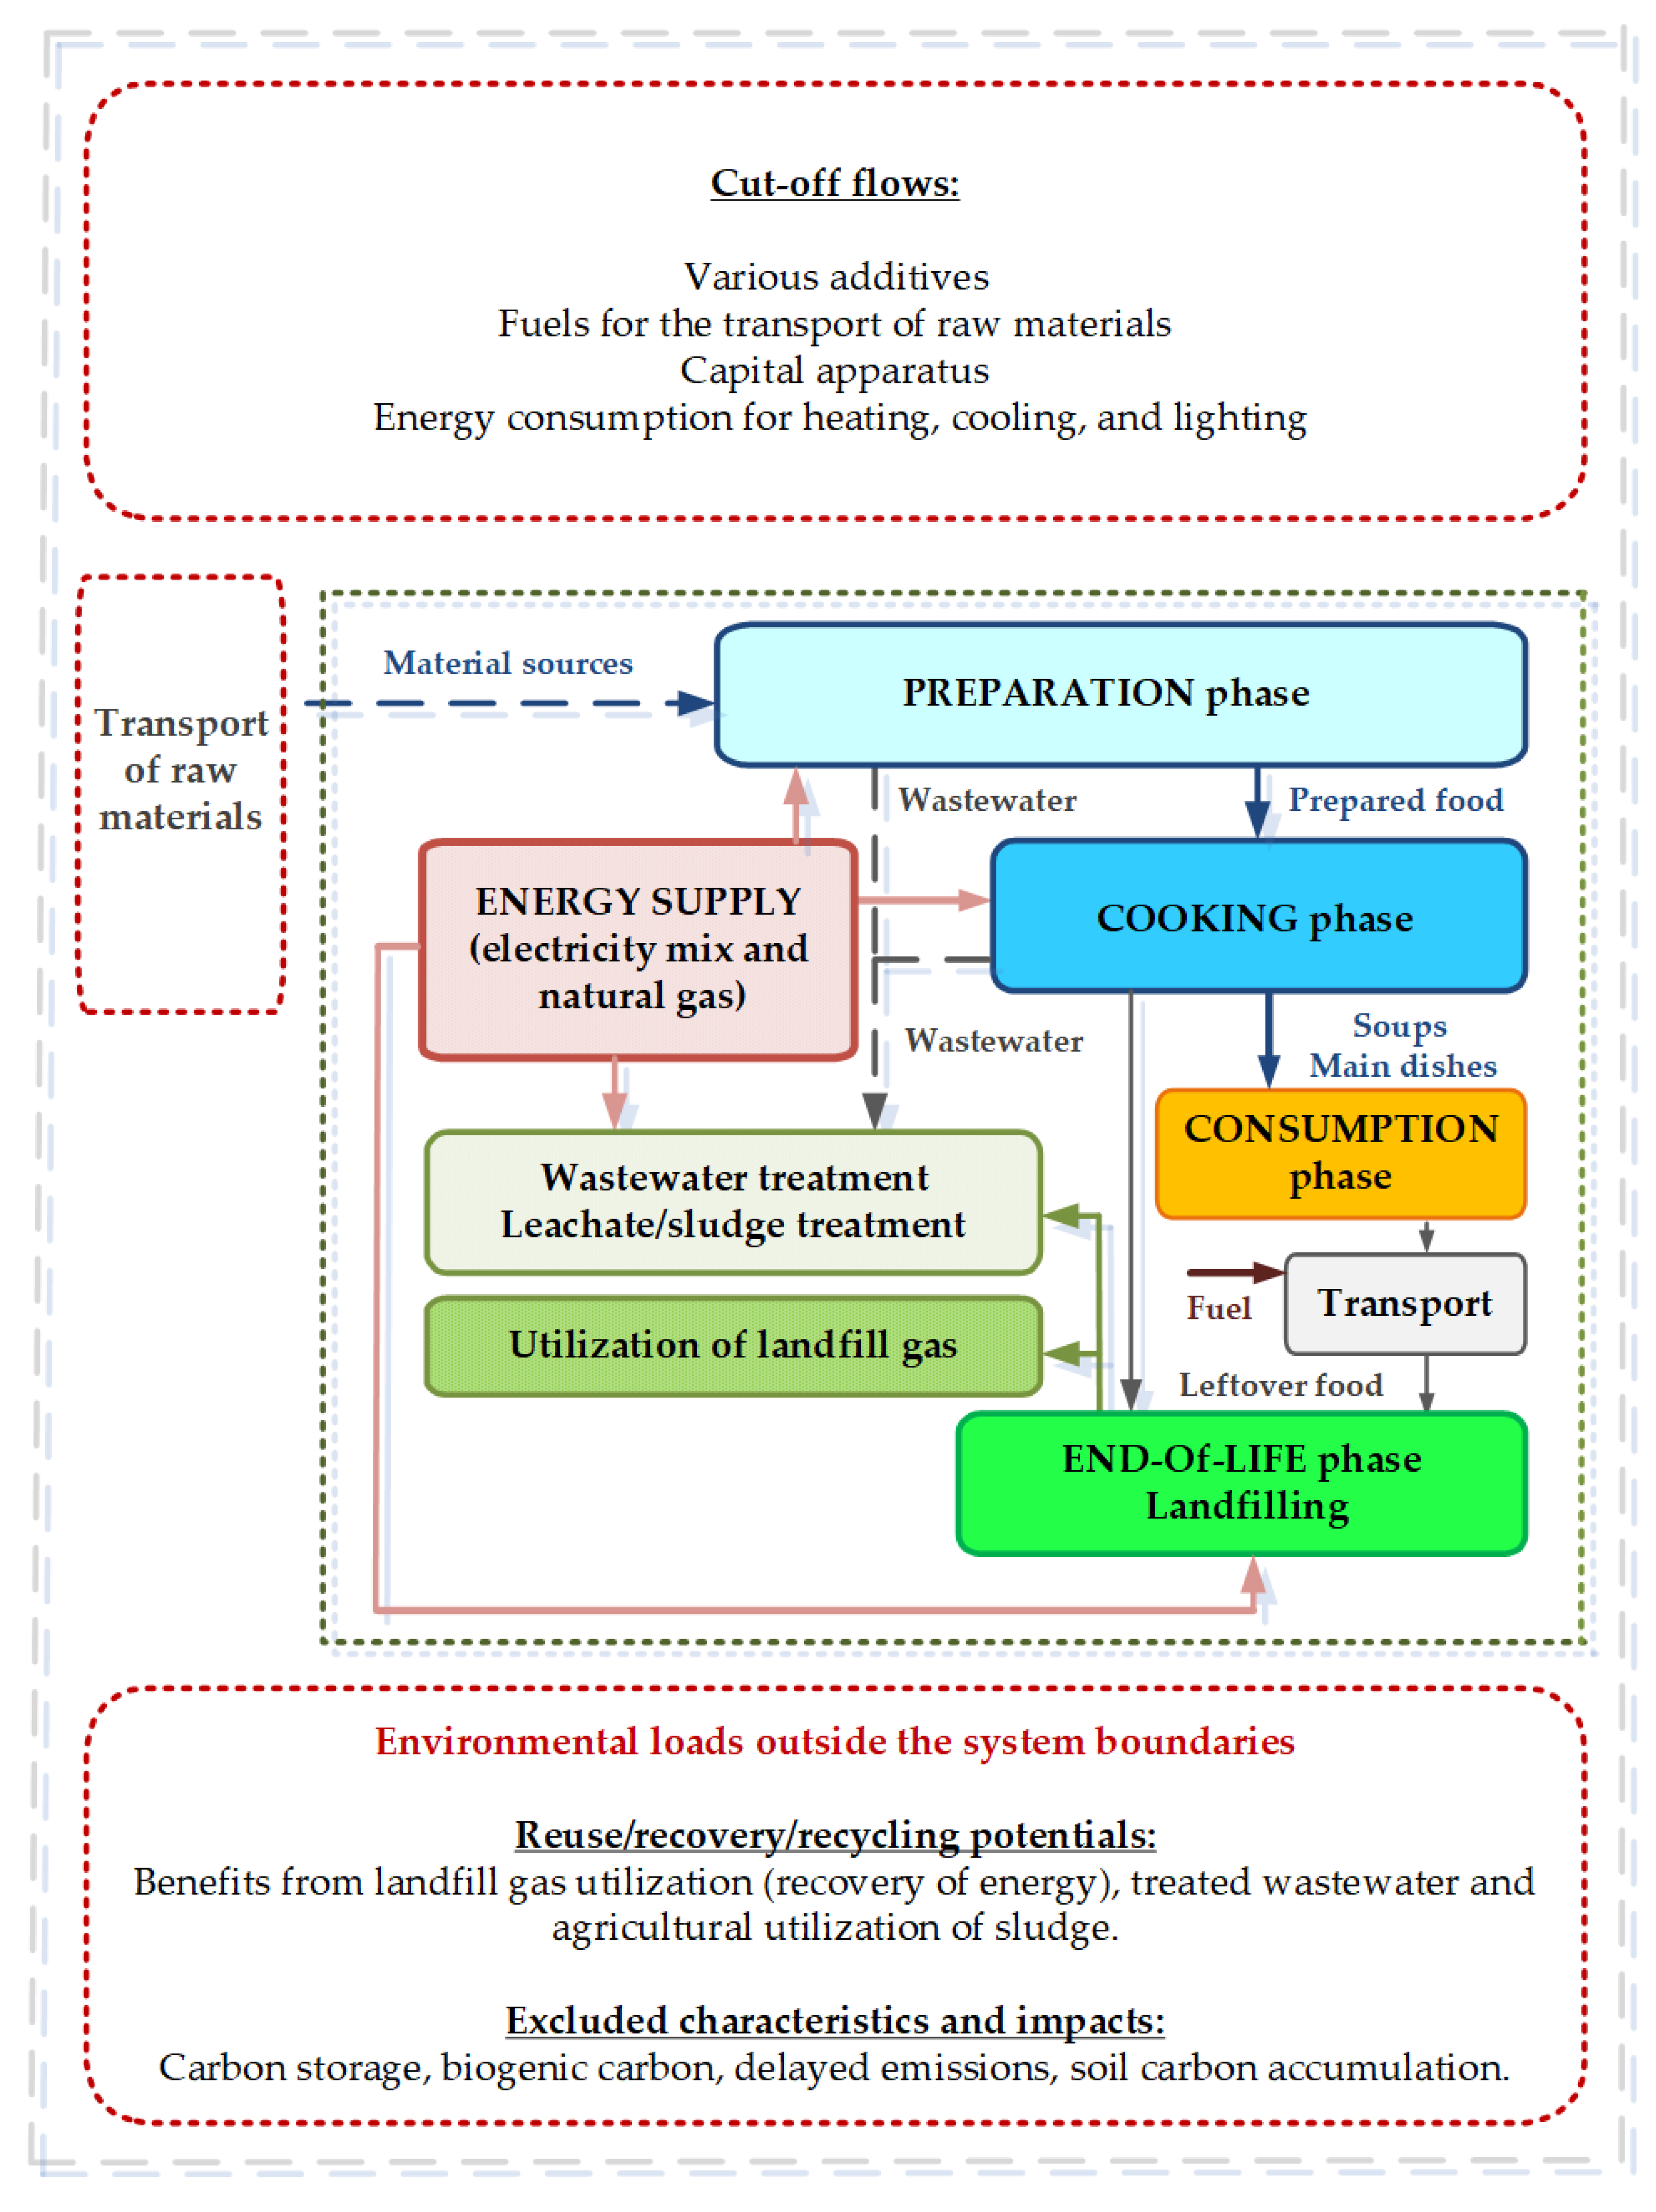
2.2. Life Cycle Assessment Method and System Boundary

The life-cycle assessments are related to analyzing the environmental loads and energy resources of two soups and three main dishes associated with the life-cycle phases. The life-cycle assessment method of the research includes the life-cycle inventory (LCI) and the life-cycle impact assessment (LCIA). Figure 1 shows the main phases of the applied life-cycle assessment.
The whole life cycle of the investigated restaurant dishes can be divided into four life-cycle phases: preparation, cooking, eating, and end of life. The life-cycle assessments of the vegan, pescovegetarian, and traditional two-course menus, from the extraction of the raw materials through the preparation, cooking, and use (consumption in a restaurant) phases to the end-of-life stage, were set up. For each dish related to restaurant consumption, a food residue of 5% in the use phase was assumed. This value comes from the domestic restaurant from which the recipe for each dish comes. The 5% value is an average value calculated for a whole year concerning the food waste generated. Our previous research [14] used this 5% value to analyze the use phase of the whole life cycle of restaurant dishes. At the end-of-life phase, the food wastes from the preparation, cooking, and use life-cycle phases were landfilled at a municipal solid-waste landfill. The environmental burdens of vegan, vegetarian, and traditional restaurant menus were compared using professional and food extension databases with the help of GaBi 9.0 software version 10.6, (Sphera, Stuttgart, Germany). The applied GaBi software, version 10.6, and the continuously updated databases provided valuable data resources to support the consistent modeling of all life-cycle phases of the examined products. Considering the historical background of the input currents, the applied software provided up-to-date information for the whole assessment [63]. The materials were considered within cradle-to-grave system boundaries. In the life-cycle assessment setup, the input–output mass values and energy streams for all life-cycle stages of the products were first investigated. The software analysis calculated 11 environmental impacts (within these 8 main potentials) and primary energy. Carbon storage and delayed emissions were not considered in estimating the global warming potential, and soil carbon accumulation was excluded from the life-cycle assessment. The reason for this is that the software used does not take these characteristics and effects into account when calculating the global warming potential, excluding biogenic carbon. Therefore, these characteristics were placed outside the system boundary. Figure 2 presents the system boundary of the life-cycle assessment method.
Energy requirements were stated as a function of the energetic content. Equipment and machinery were placed beyond the system boundary.
Transport: the preparation and cooking phases occur in the same place, i.e., the restaurant, so we did not consider transport between these two phases, only between the use and end-of-life phases, where the actual transport process occurs. In the preparation phase, we considered the storage of raw materials at the energy level, which included, e.g., the energy values used for thawing meat and cooling in refrigerators. These energy values were included in the preparation phase. Concerning the structure of the preparation phase in the software, we excluded deliveries because the individual raw materials come from different places, and we would not have been consistent in this case regarding the comparison of the environmental loads of the unique soups and main courses. The diesel mix used for transportation and the transportation distance affect the loads that occur and can take our results in a direction where the environmental loads of the products are no longer comparable.
The applied life-cycle assessment includes wastewater flows from the washing process of the raw materials and the washing of dishes in the preparation and cooking phases.

2.3. Life-Cycle Inventory

The coherent life-cycle inventory is consistent with the technique explained in the ISO 14040:2006 and 14044:2006 standards [64,65] and contains all processes’ material and energy supplies. The LCI is based on industry data from 2022. Professional and food industry datasets were associated with preparation and cooking data to set up life-cycle inventories for the examined food products. In most cases, the available data in the GaBi database does not consider the following parameters: capital apparatus, various materials, additives, and the quantity of energy used for heating, cooling, and lighting. When entering input data to create LCA processes within the software, we could not consider these parameters since they were not included in the database in the first place. Therefore, we thought of these parameters as cut-off parameters. Given that the restaurant’s amount of used raw materials for individual dishes is not public, we can provide public quantitative data regarding only energy and water inputs. Table 1 summarizes the material inputs of the inventory for the preparation and cooking life-cycle phases. As an input current, the orange is part of the decoration during serving in a restaurant.
For the preparation and cooking phases, a Hungarian energy mix was considered. Figure 3 illustrates the percentage composition of Hungary’s electricity production mix in 2022 based on the data of the Hungarian Energy and Utilities Regulatory Office. This pie chart shows the gross electricity generation in Hungary.
In addition to the eating residue, the examined process produces municipal solid waste from removing the garlic, carrot, celery tuber, and onion peels and cleaning the beef meat and from the leftover food in the preparation and cooking life-cycle phases. Table 2 shows the water inputs for preparing and cooking products in the case of both functional units. The amount of wastewater from washing the raw materials and the dishes left is always the same as the amount of introduced drinking water.
Table 3 presents the energy inputs and waste outputs regarding the tested soups and main dishes during the preparation and cooking life-cycle phases for the functional units of 1 portion and 1 kg.
The input for the consumption phase is the product prepared in the cooking phase; this phase does not require any other input flows. The leftover food from consumed restaurant soups and main dishes leaves the use phase as consumer waste outputs. After that, consumer waste goes as an input stream to the end-of-life stage. At the end-of-life stage, the dataset typifies waste treatment as landfilling. The selected landfill process in the European Union includes gas utilization, leachate, and sewage sludge treatment processes (landfill height: 30 m, landfill area: 40,000 sqm, deposition: 100 years, net calorific value: 9.7 MJ/kg) [53]. The medium landfill gas composition and the sum of the fixed methane phase were determined, and a transpiration/runoff ratio of 60% was assumed [53,54].

2.4. Life-Cycle Impact Assessment Method and Functional Unit

The life-cycle impact assessment method estimates the accessible environmental impacts and energy resources of the tested soups and main dishes in terms of a functional unit (FU). If the restaurant mass standard is used as a basis, the functional unit of the products is a restaurant portion, i.e., a portion expressed in kilograms. The portion sizes for soups and main dishes are entirely different and are given by the regulations for restaurants. If products are examined from the point of view of life-cycle assessment, the functional unit is usually measured as 1 kg or 1000 kg of output product. Since 1 kg is closer to the weight of restaurant portions, it was chosen as the basis for this research work. This choice is also justified because, in this latter case, the environmental impact of individual products can be compared more consistently.
By calculation, the CML 2016 method (Centrum voor Milieukunde Leiden) by the Centre for Environmental Science at Leiden University was applied [66,67,68]. Normalization and weighting methods for all life-cycle phases were used in the calculation. These methods are the LCIA Survey 2012 and CML 2016 (excluding biogenic carbon) in the European Union. The eight calculated impacts include photochemical ozone creation, freshwater aquatic ecotoxicity, human toxicity, global warming, eutrophication, acidification, and abiotic depletions for fossils and elements.

2.5. Statistical Methods

Combining life-cycle assessment results with statistical methods is practical in the case of two or more samples. Carbon footprints were compared using descriptive and mathematical–statistical methods. Mean, median, and variance were used for the first step. The different number of dishes justified the use of two different tests. In the second step, the difference in the carbon footprint between the tested two soups by the Mann–Whitney analysis and the tested three main courses by the Kruskal–Wallis test was investigated. Both statistical methods were implemented using SPSS (Statistical Package for the Social Sciences) software (version 28.0). The significance level for both types of tests is the generally accepted 5%. The optimal soup and primary dish samples were selected based on 115 garlic cream soup samples, 115 beef bean soup samples, and 115 main dish samples. From a statistical viewpoint, a selection of 115 items is already quite large. The normality of their distribution could not be assumed.

2.6. Sustainability Assessment Modeling

Since sustainability and food waste are receiving much attention nowadays, integrating life-cycle assessment and lean production seems to be an expedient solution. Regarding the entire life cycle of restaurant dishes, it is advisable to develop a sustainability evaluation model, focusing on reducing the environmental burden, the amount of energy used, and the amount of food waste by optimizing the individual life-cycle phases. In the case of restaurant food products, the environmental burden can be reduced primarily by optimizing the amounts of used material and energy in the preparation and cooking life-cycle phases. In the preparation and end-of-life phases, the set sustainability goal can be achieved by reducing generated food waste, recycling it within the phases, and choosing optimal waste management procedures. It is the application of green lean to a practical situation. Applying green lean in restaurants can make more sustainable dish products. The consumer’s eating habits can also influence the sustainability of the prepared meals and their production methods, as the environmental impact of the whole life cycle of individual restaurant dishes and the product’s carbon footprint can differ significantly. If the carbon footprint, all environmental impact categories, and the primary energy requirements of the soups and main courses served in restaurants are known, the hot points in the preparation, cooking, and end-of-life phases can be identified. In this case, a more complex sustainability assessment model can be set up, which we named GreenCycLEAN.

3. Results

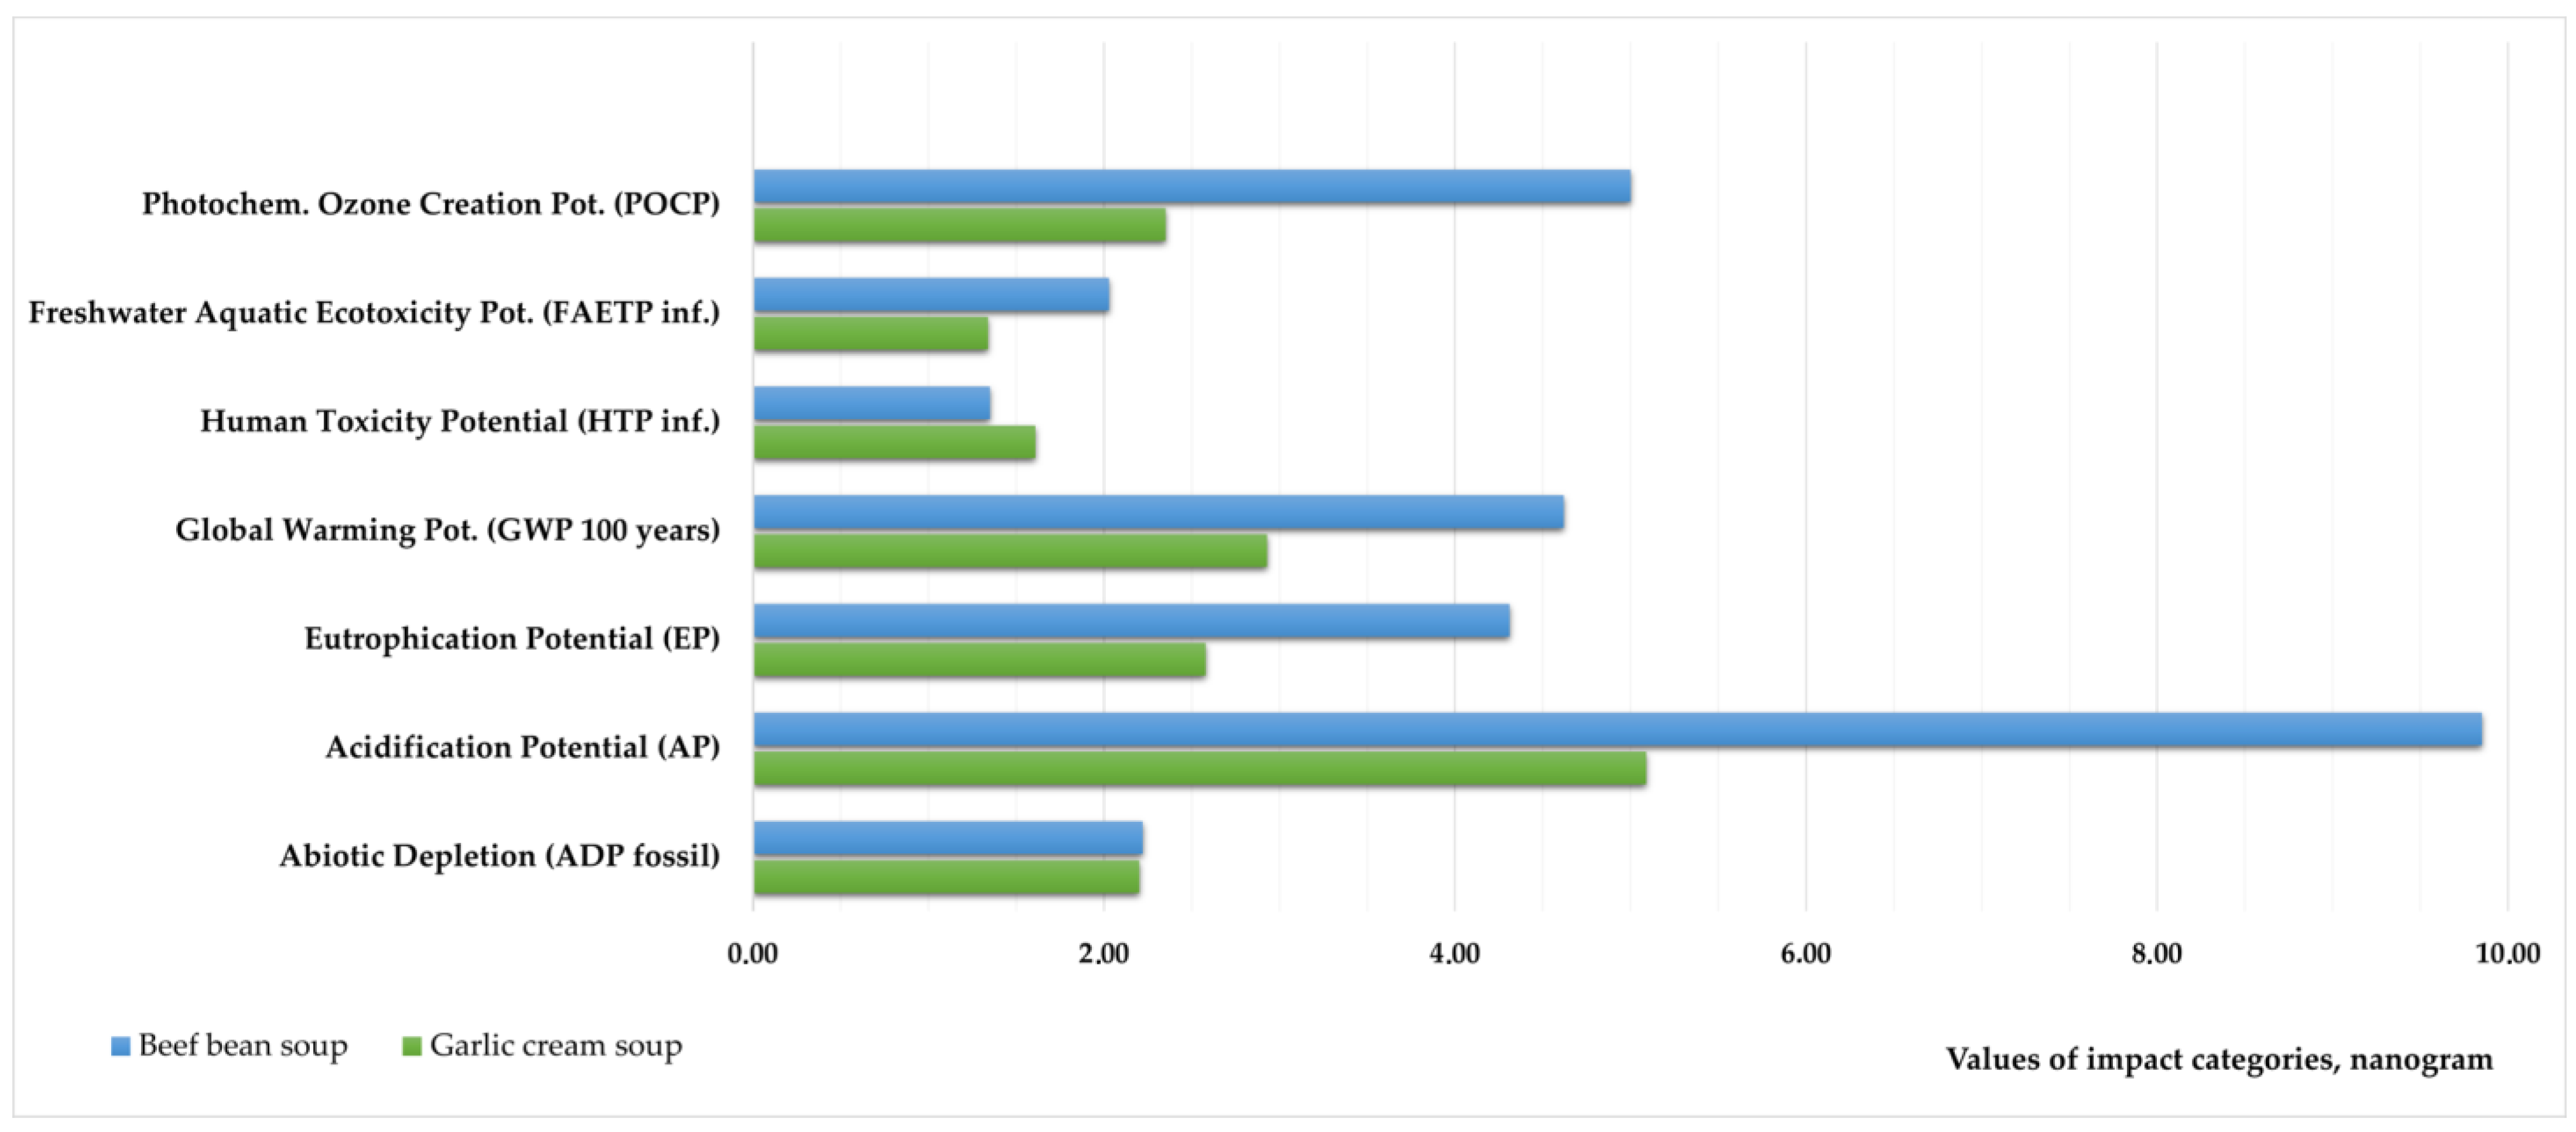
3.1. Energy Resources and Environmental Impacts of the Soups

For the life-cycle assessment, the meat-free garlic cream soup with croutons was tested as a vegetarian and vegan soup, and the beef bean soup was investigated as a traditional meat-containing soup. During the analysis, the production life-cycle stage was assumed to comprise the preparation and cooking phases of the examined soups. At the same time, it was also assumed that the use life-cycle phase does not involve input energy and that only food scraps remain on the plate as output after consumption in the restaurant. In the whole life cycle of the soups, the research results in different modules were declared, which allowed the constructed interpretation of results throughout the life-cycle phases of the tested soups. To calculate the environmental loads of food waste during end-of-life treatment, it was essential to set up an analysis of the previous life-cycle phases of both soups for the end-of-life treatment process. Table 4 describes the primary energy values of both soups in the case of a 1 kg functional unit in all examined life-cycle phases.
According to the result in Table 4, it can be determined that the total primary energy consumption for the whole life cycle is more favorable for meat-based soup than meat-free soup. However, the proportion of renewable energy sources in the meat-containing soup is smaller than in the meat-free soup. If the individual life-cycle stages are examined separately, then the total primary energy consumption of the cooking phase is higher than that of the preparation phase. Regarding the preparation and cooking phases, the amount of renewable energy introduced is more significant than that of the garlic cream soup.
Figure 4 describes the normalized and weighted impacts for the whole life cycle of both soups in the case of a 1 kg functional unit in nanograms.
Based on the calculations, it can be said that preparing and cooking vegetarian or vegan soup requires a much lower environmental load than preparing and cooking meat-based soup in almost all impact categories, excluding human toxicity. According to Figure 4, it can be determined that the acidification potential is higher compared to other examined environmental impact categories. This result is not surprising because this impact category is higher for the landfilling of municipal solid waste at the end-of-life stage based on our previous research. The highest environmental impact for both soups is represented by marine aquatic ecotoxicity, projected over the entire life cycle of the products. Therefore, marine ecotoxicity values cannot be represented with the other impact categories on a diagram. Most marine aquatic ecotoxicity percentage values (73–77%) are generated in the cooking phases of the soups.
In Table 5 and Table 6, we examined the value of human toxicity in more detail, considering that it represents a smaller value for meat-containing soup.
According to the results of Table 5 and Table 6, the butter and cream are the reason for the difference in the effect category: the dairy product requirement for garlic cream soup is 2.5 times that of bean soup, and the fat (butter) is not required at all for bean soup. Raw materials are the primary source of human toxic potential, while the impact of energy flows (electricity and gas) is much smaller. The HTP of garlic cream soup per 1 kg is twice as high as that of bean soup in raw materials and 0.77 times as high in energy.

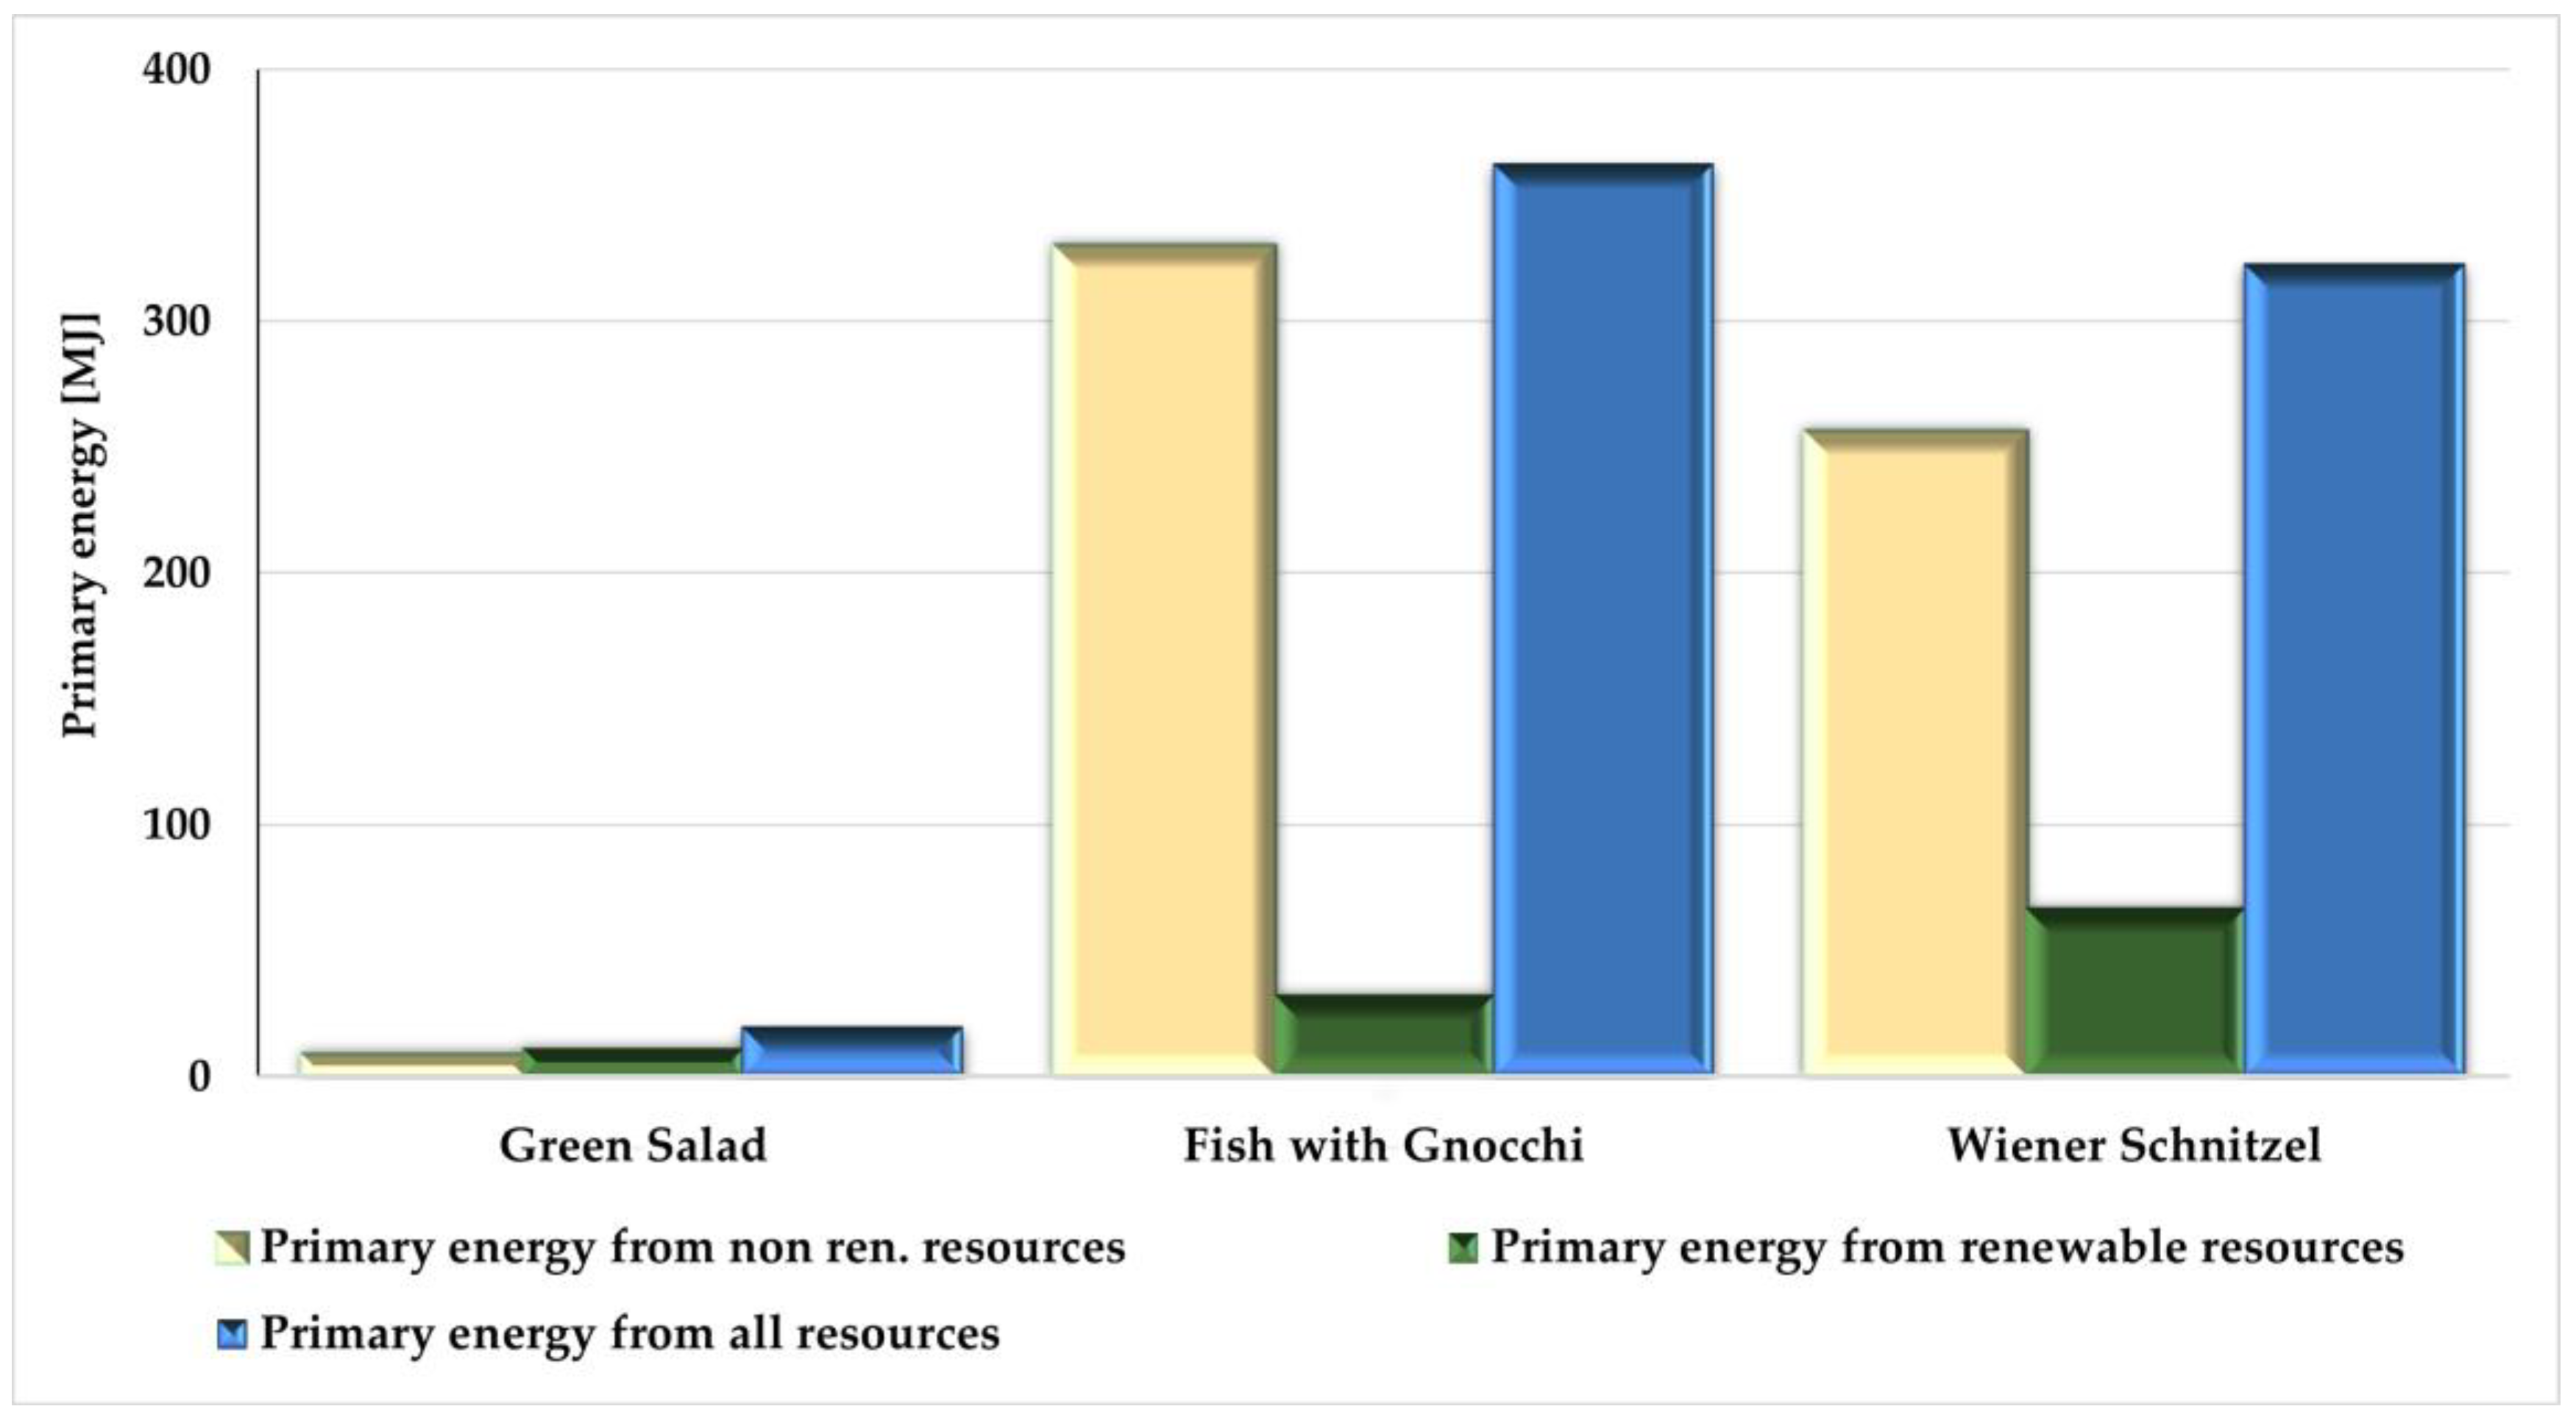
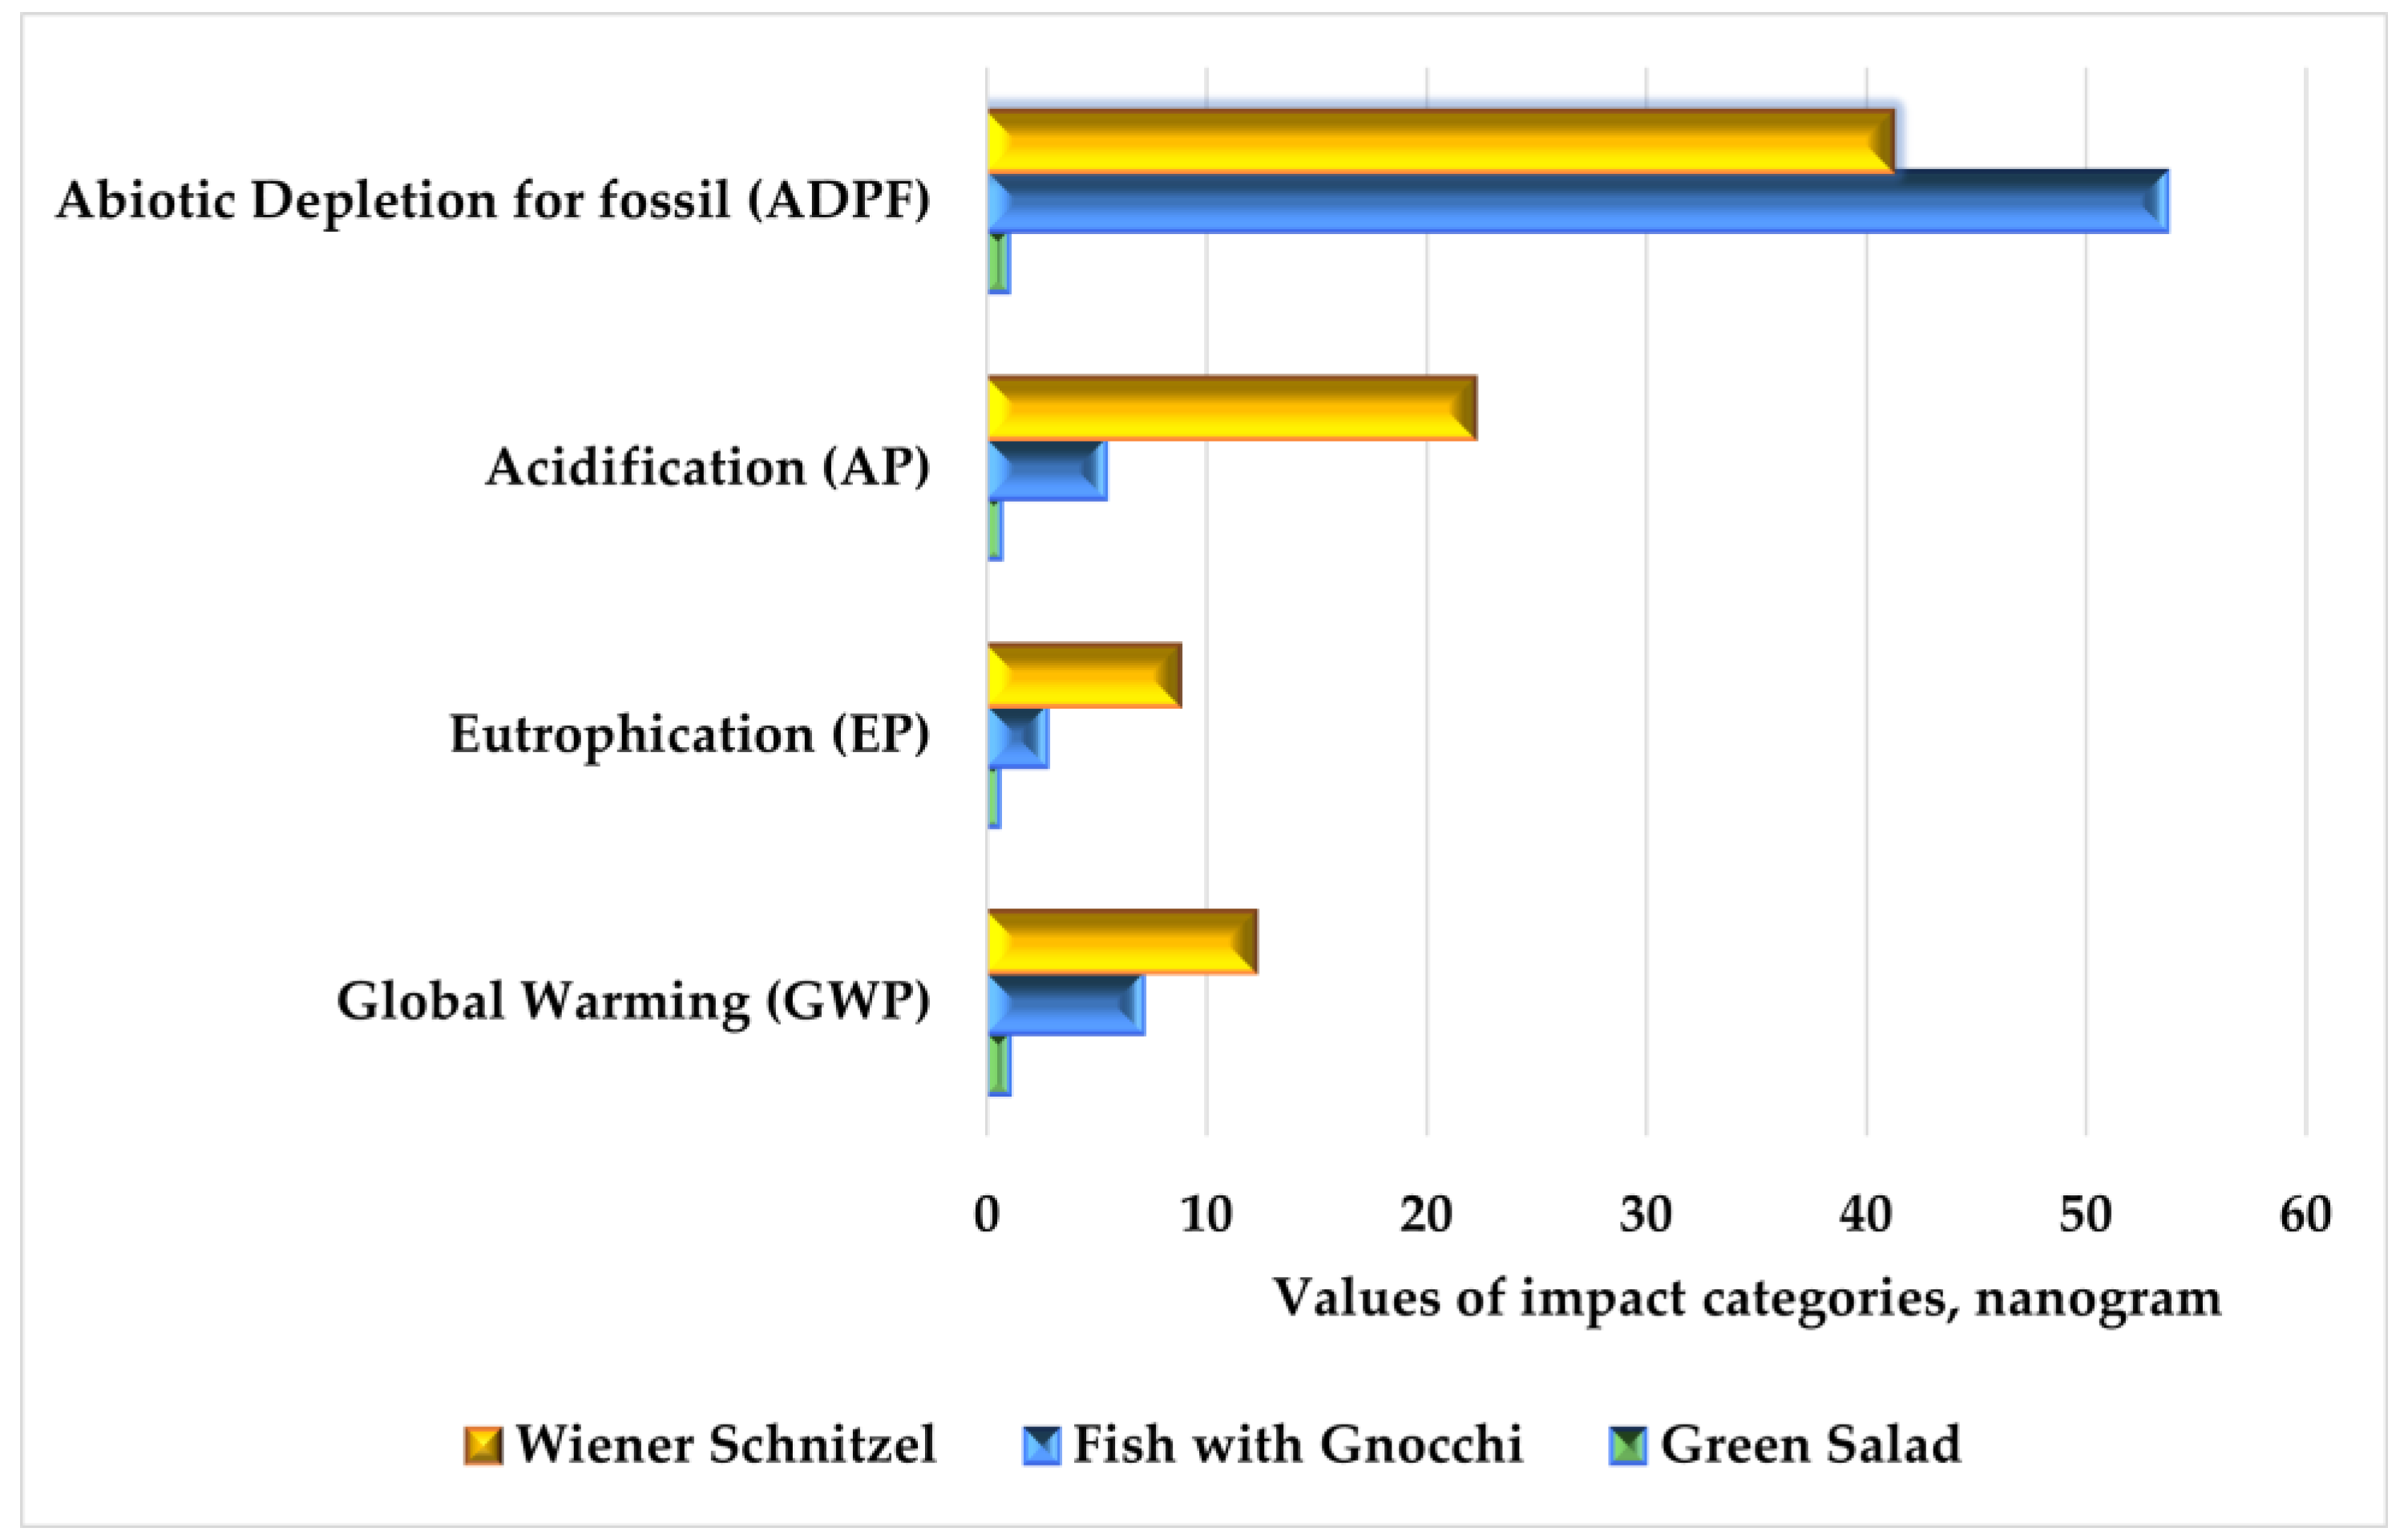
3.2. Energy Resources and Environmental Impacts of the Main Dishes

The vegan salad mainly contains the following components: rapeseed oil, sunflower seeds, carrots, tomatoes, and sugar beet. The pescovegetarian main dish contains the following ingredients in the preparation and cooking life-cycle phases: sea fish, potato, rapeseed oil, wheat flour, drinking water, spices, and pasteurized cream (38–42%). Table 7 details the primary energies in gross caloric value for all examined main dishes in all life-cycle phases. Figure 5 presents these primary energy values in MJ.
According to the data in Table 7, the primary energy use of a meat-based dish is more favorable than that of a vegetarian meal and less favorable than that of a vegan diet. However, it should be noted that not only is the energy use higher for fish, but also, its composition is less favorable: it has a higher proportion (91%) of nonrenewable energy than the meat dish (79%). Comparing the values of primary energy use, the raw materials cause a significant variance. The vegetable-based dish requires essentially no cooking. The shorter cooking time for fish meat in the pescovegetarian main dish is compensated for by the more energy-intensive nature of the preparation of the side dish. Contrary to expectations, the energy requirement of fish products is in many ways less favorable than red meats. Its intrinsic value is higher, its composition is less good, and it has a higher proportion of nonrenewable energy. Table 8 presents the impact categories of main dishes for the life-cycle phases. Figure 6 and Figure 7 show seven normalized and weighted impact categories for the whole life cycle of vegan, vegetarian, and traditional main dish products in the case of a 1 kg functional unit in nanograms.
In Table 8, regarding the environmental impacts of the three main courses, the most environmentally friendly course in each category is a green salad. Fish with gnocchi is less favorable than meat in only one impact category: abiotic depletion of fossils. Figure 6 and Figure 7 show that the most significant difference between fish with gnocchi and Wienerschnitzel is observed in AP, FAETP, and POCP, while the most negligible difference is observed in EP.

3.3. Determination of Carbon Footprint Using Statistical Methods

The IBM SPSS Statistics statistical software offers robust analysis and helps quality decision-making including all facets of the analytics life cycle. This software was available and seemed suitable for statistical analysis of food samples. In the case of two samples, the Mann–Whitney two-sample test is used. The Kruskal–Wallis nonparametric statistical procedure should be used to compare more than two independent samples along one variable. Therefore, the Mann–Whitney test was applied to the restaurant soups and the Kruskal–Wallis test to the restaurant main courses. Table 9 shows the descriptive statistics for both soups. Averaging was used to eliminate the effect of chance on the difference in the carbon balance of each soup. Based on this, the average carbon footprint of the vegetarian soup was 2.93, while that of the conventional soup was 4.62. Table 10 summarizes the summary results for both soups using the Mann–Whitney test. The first part of the comparison of the three main dishes is presented in Table 11. As in the previous graphs (Figure 6 and Figure 7), the vegan main course has the lowest carbon footprint, followed by the vegetarian main course, and the meat main course has the highest carbon footprint. According to the Kruskal–Wallis test, Table 12 shows the variance for the main dishes.
Based on the results of the above tables, the difference between the mean of 2.93 for garlic cream soup and the mean of 4.62 for beef bean soup is significant according to the Mann–Whitney test (the asymptotic significance value is zero), not due to chance alone. According to the Kruskal–Wallis test, the difference between the averages is significant and differences that are due to coincidence can be practically excluded (the asymptotic significance value is zero). Different foods’ raw materials and preparation techniques (plant/animal) result in significant differences in their carbon footprints. Dishes of plant origin have a lower carbon footprint than those of animal origin.

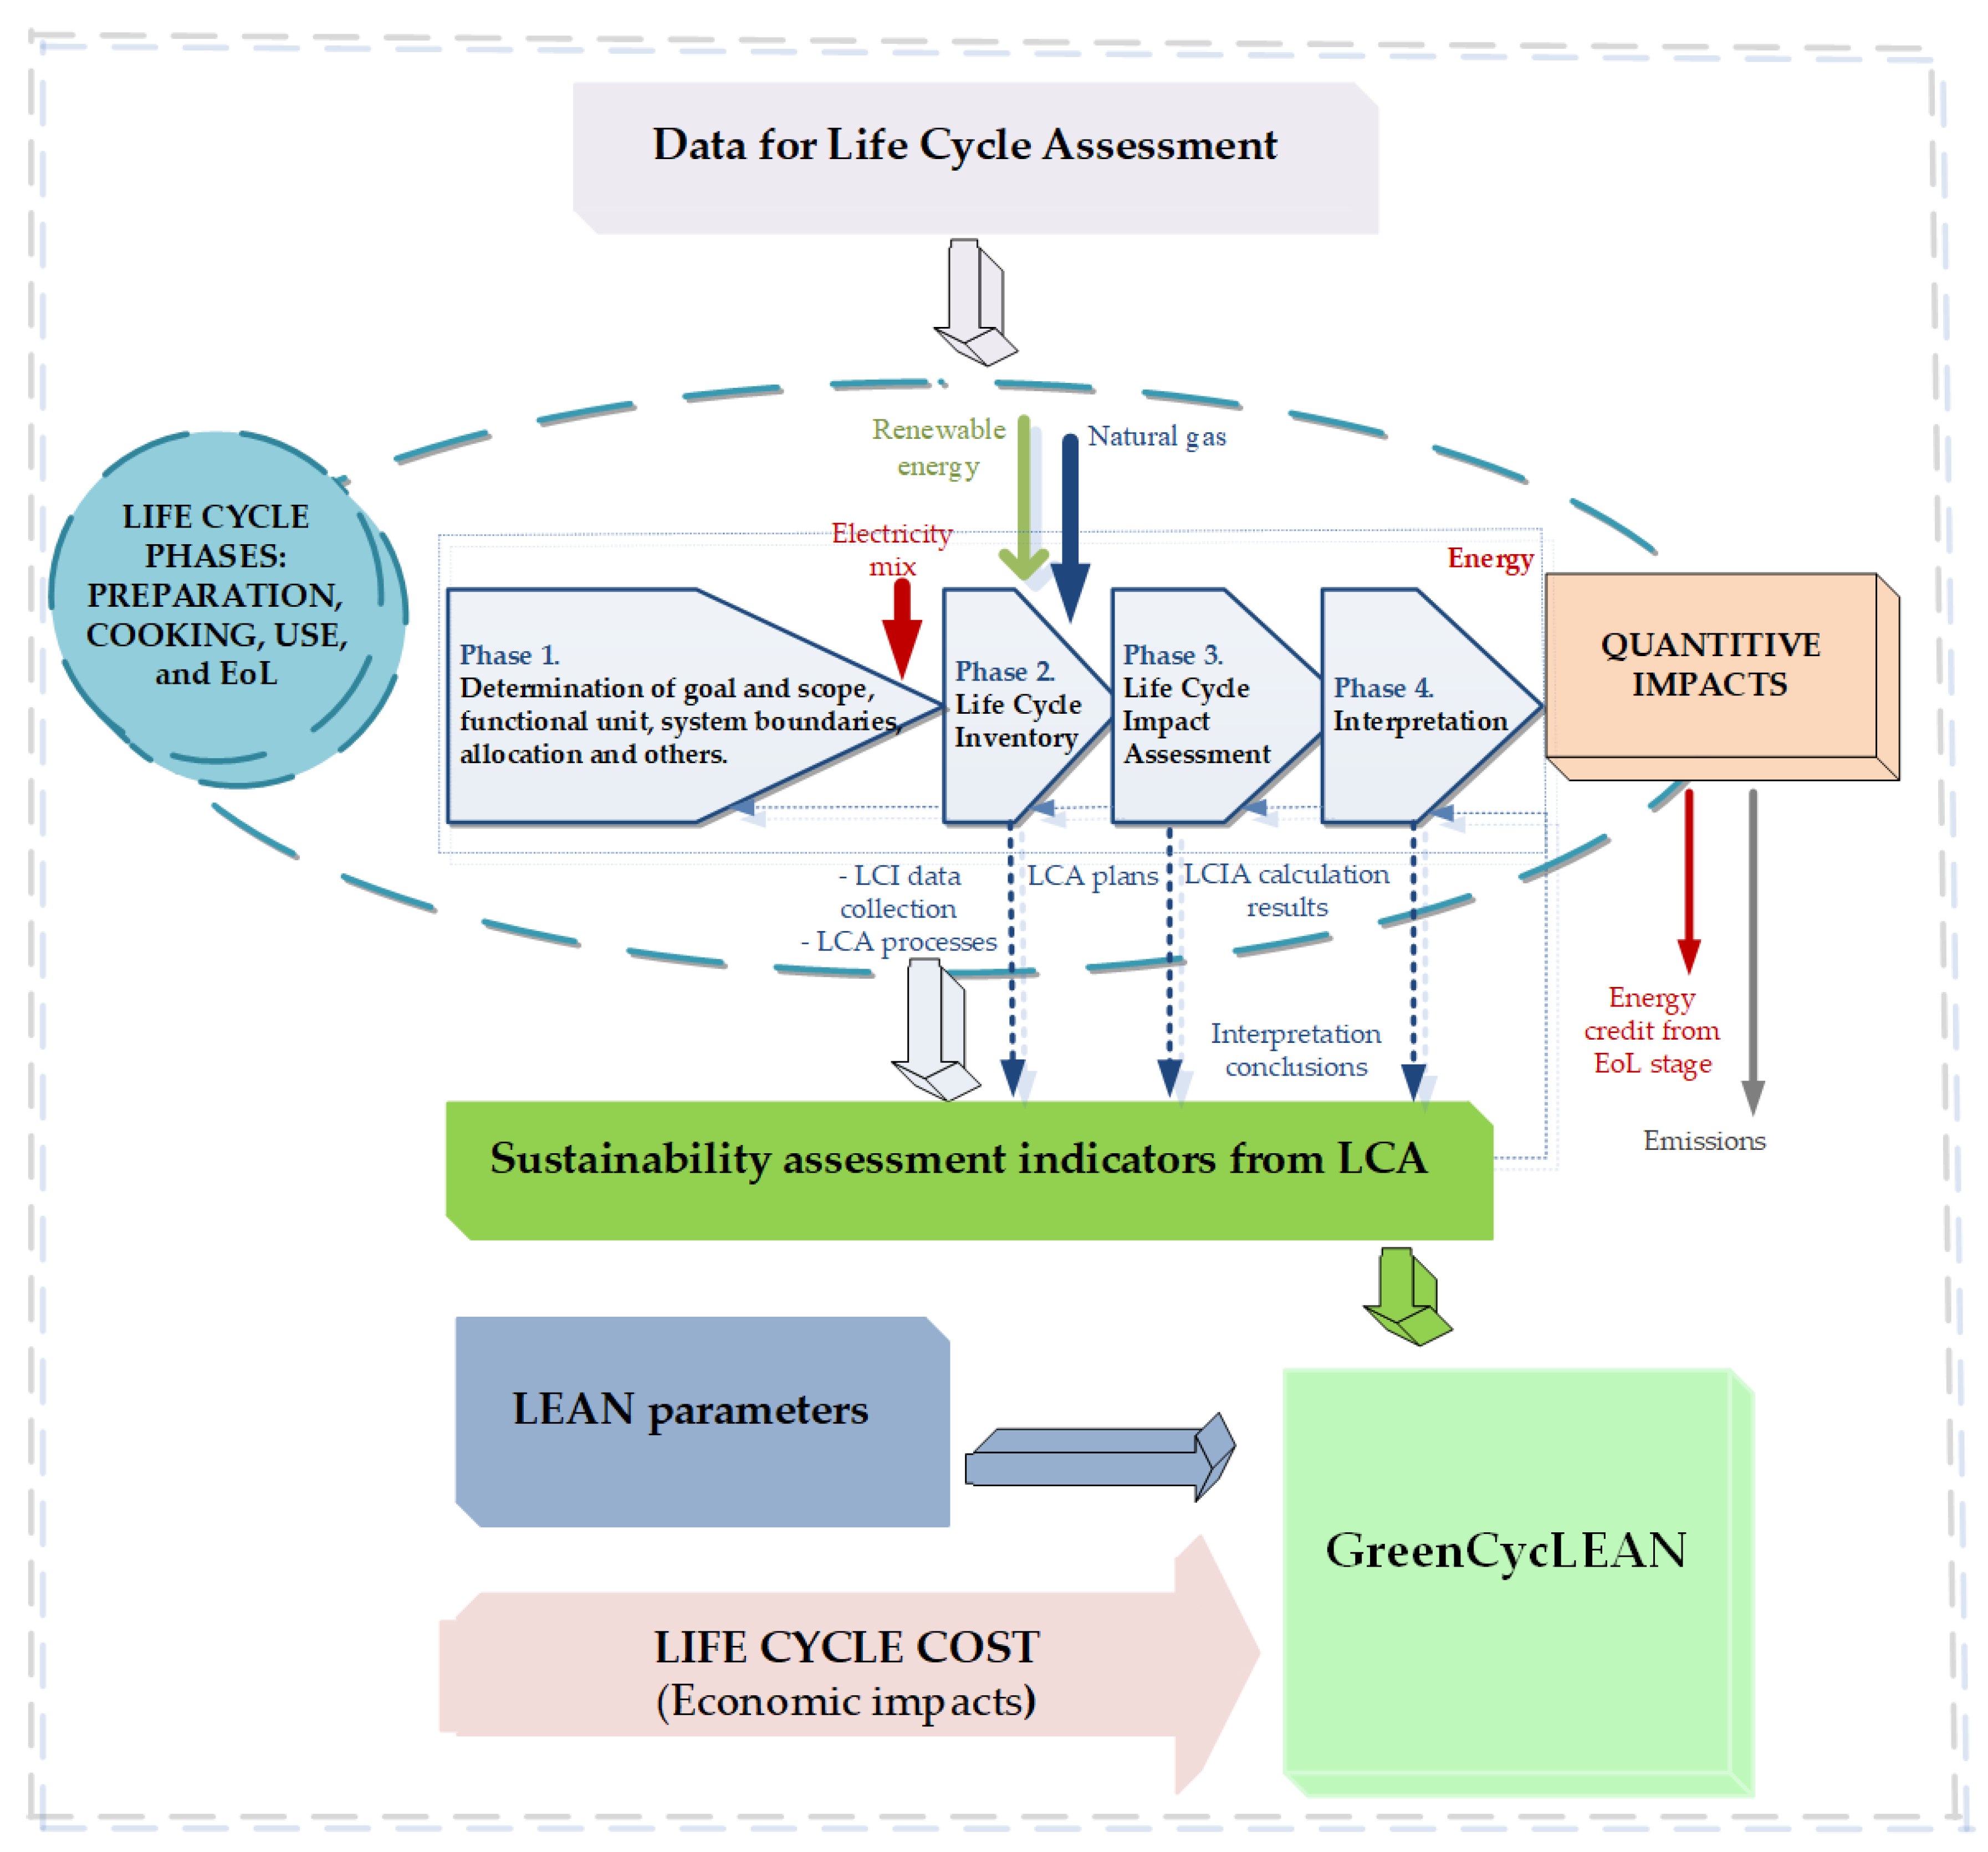
3.4. Development of Sustainability Assessment Model (GreenCycLEAN)

Examining the energy demand and environmental impact of the preparation and cooking processes is essential in optimizing the cooking processes. It is primarily the environmental impact of different energy supply methods and the increasing demand for cooking methods. It is rarely discussed how the optimization cooking process and the life-cycle assessment can jointly help design decision-making for restaurant chains. Different scenarios can be considered during the LCA-based examination of cooking methods by determining energy consumption and ecological burden. To draw broad conclusions, it is advisable to conduct a modeling process in which the possible examined parameters are the primary energy resource, the occurring environmental impact categories, and the ecological loads of the renewable and nonrenewable energy supplies. To implement this research purpose, a sustainability assessment model was developed. The developed model is primarily based on the quantitative method with the help of defining quantitative indicators. Because the sustainability assessment model uses calculation and statistical data for primary energy, emission, carbon footprint, and environmental impact categories, the LCA method is authoritative during the development of the model, where all life-cycle phases of the restaurant products are examined from ecological and energetic viewpoints. The GreenCycLEAN relies on the results of the LCA calculation and the lean. The development objective includes data collection for the LCI and impact assessment methods. The given model has different LCA phases in the restaurant product’s life-cycle stages, as illustrated in Figure 8.

4. Discussion

The European Union is trying to reach climate neutrality in the future within the framework of the SDGs and the circular economy [69,70]. Various dishes’ preparation and cooking technologies are the catering industry’s current challenge and development area. Knowing restaurant products’ environmental impacts based on the life-cycle assessment is essential for the sustainable catering industry and environmentally friendly dining. The combined results of the catering industry and life-cycle assessment make optimizing the environmental parameters in the various life-cycle phases possible to achieve ideal ecological impacts when preparing dishes while avoiding significant food waste. Several research studies [71,72] present whole-product life-cycle assessments. In recent years, examining the end of the life cycle of food waste through the choice of appropriate waste management methods has also come to the fore [73,74,75,76]. According to the analysis of Szita [77], one of the conditions for sustainable environmental management is knowledge of all phases of the life cycle of products. In our previous study [14], a whole life-cycle model was set up for a single main dish, but then, we focused primarily on end-of-life scenarios. This previous work compared “sous vide” and traditional cooking technologies and determined that “sous vide” is an effective method for more optimal and sustainable cooking. According to the previous research results [14], the environmental loads of the preparation phase were much higher than the impacts of the cooking phase. We obtained the same conclusion in this research by comparing the preparation and cooking phases. Based on current results, it can be said that the environmental impact of the preparation and cooking phases is higher than that of the end-of-life phase. This is because our analysis also includes loads related to raw material production, and meat and cream production involve a sizeable environmental load.
Based on the analysis results of the examined restaurant products, it can be said that, basically, the environmental impact of the preparation phase is higher than that of the cooking phase. In the case of soups, the whole life cycle of a meat-free soup causes a lower environmental load. However, the value of the human toxicity potential is lower for meat-containing soup. The highest environmental impact for both soups is represented by marine aquatic ecotoxicity. The percentage distribution value of marine aquatic ecotoxicity is 68% for the garlic cream soup and 33.5% for the beef bean soup compared to all potentials. The highest percentage value of the MAETP (73–77%) is generated in the cooking phases of soups. Also, the acidification potential is relatively higher. The percentage distribution values of the acidification are 8% for the garlic cream soup and 21.8% for the beef bean soup compared to all environmental impacts. From the viewpoint of primary energy consumption, the cooking phase is the most energy-intensive phase in the whole life cycle. Due to the different cooking requirements of the raw materials, the cooking phase of the vegetable-based soup is more favorable. Overall, the primary energy requirement of a soup without meat is less favorable than that of a meat-containing soup. However, the proportion of renewable energy is higher in soups with vegetable content.
In connection with the main dish results, it can be said that in terms of the environmental impact of the three main dishes, green salad is the most environmentally friendly dish in each category. Meat is better than fish in only one impact category: abiotic depletion of fossils. Wienerschnitzel has the most considerable disadvantage in acidification, freshwater ecotoxicity, and photochemical ozone and the smallest in eutrophication. Our results are consistent with several previous studies. In the most extensive comparison [47], results from 34 professional articles were averaged and summarized. The scores for conventional, vegetarian, and vegan diets in environmental impacts compare similarly to the scores for Wienerschnitzel, fish with gnocchi, and green salad. Another study [32], using only the results of its own data collection, also gave the highest carbon footprint values for the meat scenario and lower values for the vegetarian and vegan scenarios. For a company’s lean and sustainability approaches to be effective in its management, it must have a complete understanding and insight into all aspects of the supply chain. This requires an LCA approach to identify the critical intervention points where each process can be effectively improved for more sustainable performance [78]. In practice, applying green lean in the catering sector means that the same output requires fewer food materials and energy inputs, and less waste is generated in the preparation and cooking processes, further reducing the environmental impact of the process [12]. Sustainability, green lean, and LCA approaches are interlinked [21]. They can be used together, share standard features, and compensate for each other’s shortcomings. As a result of these characteristics, these strategies can address the objectives of resource saving, the problem of food waste, and environmental load optimization together and simultaneously. The GreenCycLEAN model we created is a complex approach to sustainability assessment, including sustainable ecological awareness, life-cycle assessment, and lean strategy.
We are aware that linking the methods used to measure sustainability with other disciplines (mathematics, statistics, and economics: T-set, T-Pareto optimality, and fuzzy) can provide more relevant and widely usable results [79,80,81,82]. In previous research studies [83,84] by the correspondence author, new mathematical equations have already appeared through LCA integrations. However, this research aimed to compare the scenarios of vegan, vegetarian, and meat-containing restaurant dishes regarding the entire life cycle of the products. The current study was not intended to develop improvement strategies by comparing critical elements (primary and secondary effects). Therefore, we did not use the fuzzy life-cycle evaluation method or fuzzy logic. To eliminate the distortion of the results, we use sensitivity analyses and weak-point analyses in the GaBi software in all our calculations. In the following research phase, we are considering combining the LCA and mathematical methods to examine these restaurant products. However, the database and computer software must be extended to apply newer techniques in the future.
Furthermore, as a continuation of this work, we plan to conduct life-cycle cost (LCC) analyses. However, the fact that the prices of individual raw materials change seasonally makes it challenging to determine cost-effectiveness. Therefore, we will probably have to consider cost change factors and combine LCC with mathematical methods during cost-effectiveness analyses. The cost-effectiveness model must be thoroughly developed, which can already be the central topic of our subsequent research work.

5. Conclusions

On the one hand, this research study evaluates the whole life cycle of two typical restaurant soups (garlic cream soup and beef bean soup) and three main dishes (green salad, fish with gnocchi, and Wienerschnitzel with cooked potatoes) by comparing different environmental burdens and energy resources. On the other hand, this work also presents an overview of the application of the life-cycle assessment method and lean strategy and the problem of food waste with the help of the professional literature.
The research estimates impact categories and the primary energy demand from renewable and nonrenewable sources based on the CML 2016 impact method. Normalization and weighting methods were the same. The functional unit is the mass of 1 kg of the examined soup and main dish output products in all life-cycle phases. The nutritional value of the examined catches does not affect the environmental impact, so we did not calculate the nutritional value in this article.
This study provides new information about the environmental loads and energy resources associated with preparing and cooking vegan, vegetarian, and meat-containing restaurant dishes. These results can be profitable for restaurant units aiming to achieve more sustainable food preparation and cooking technologies. Another area where the results can be used is to encourage sustainable consumer behavior. With the GreenCycLEAN approach, catering products’ ecological efficiency and the preparation and cooking process’ energy consumption can be improved, and food waste mass can be minimized.

Author Contributions

Conceptualization, supervision, visualization, diagrams, review, writing and editing, V.M.; methodology, investigation, original draft preparation, data curation, resources, funding acquisition, J.L.A. All authors have read and agreed to the published version of the manuscript.

Funding

This research was supported by the European Union and the Hungarian State, co-financed by the European Regional Development Fund in the framework of the GINOP-2.3.4-15-2016-00004 project, aiming to promote cooperation between higher education and industry.

Institutional Review Board Statement

Not applicable.

Informed Consent Statement

Not applicable.

Data Availability Statement

Data sharing is not applicable to this article.

Conflicts of Interest

The authors declare no conflict of interest.

Abbreviations

ADPEAbiotic Depletion Potential elements
ADPFAbiotic Depletion Potential fossils
APAcidification Potential
CECircular Economy
EGDEuropean Green Deal
EPEutrophication Potential
EUEuropean Union
FAETPFreshwater Aquatic Ecotoxicity Potential
FUFunctional Unit
GWPGlobal Warming Potential
HTPHuman Toxicity Potential
ILCDInternational Reference Life-Cycle Data System
LCALife-Cycle Assessment
LCCLife-Cycle Cost
LCILife-Cycle Inventory
LCIALife-Cycle Impact Assessment
POCPPhotochemical Ozone Creation Potential
SDGsSustainable Development Goals

References

  1. United Nations Department of Economic and Social Affairs Statistics Division. Global Indicator Framework for the Sustainable Development Goals and Targets of the 2030 Agenda for Sustainable Development. Available online: https://unstats.un.org/sdgs/indicators/indicators-list (accessed on 15 October 2021).
  2. Eurostat Statistics Explained. Food Waste and Food Waste Prevention-Estimates. Available online: https://ec.europa.eu/eurostat/statistics-explained/index.php?title=Food_waste_and_food_waste_prevention_-_estimates (accessed on 1 March 2023).
  3. Stahel, W.R. Circular economy. Nature 2016, 531, 435–438. [Google Scholar] [CrossRef] [Green Version]
  4. D’Adamo, I. Adopting a Circular Economy: Current Practices and Future Perspectives. Soc. Sci. 2019, 8, 328. [Google Scholar] [CrossRef] [Green Version]
  5. D’Adamo, I.; Falcone, P.; Huisingh, D.; Morone, P. A circular economy model based on biomethane: What are the opportunities for the municipalty of Rome and beyond? Renew. Energy 2021, 163, 1660–1672. [Google Scholar] [CrossRef]
  6. Womack, J.; Jones, D.; Roos, D. The Machine That Changed the World: The Story of Lean Production, Toyota’s Secret Weapon in the Global Car Wars That Is Now Revolutionizing World Industry; Free Press: New York, NY, USA, 1990. [Google Scholar]
  7. Lipińska, M.; Tomaszewska, M.; Kołożyn-Krajewska, D. Identifying Factors Associated with Food Losses during Transportation: Potentials for Social Purposes. Sustainability 2019, 11, 2046. [Google Scholar] [CrossRef] [Green Version]
  8. Berggren, C. Lean Production-The End of History? Work. Employ. Soc. 1993, 7, 163–188. [Google Scholar]
  9. Sagnak, M.; Kazancogle, Y. Integration of green lean approach with six sigma an application for flue gas emissions. J. Clean. Prod. 2016, 127, 112–118. [Google Scholar] [CrossRef]
  10. Baca-Nomberto, A.; Urquizo-Cabala, M.; Ramos, E.; Sotelo-Raffo, F. A Model Utilizing Green Lean in Rice Crop Supply Chain: An Investigation in Piura, Perú. In Human Interaction, Emerging Technologies and Future Applications III. IHIET 2020. Advances in Intelligent Systems and Computing; Ahram, T., Taiar, R., Langlois, K., Choplin, A., Eds.; Springer: Cham, Switzerland, 2020; Volume 1253. [Google Scholar] [CrossRef]
  11. Sartal, A.; Martínez-Senra, A.; Cruz-Machado, V. Are all lean principles equally eco-friendly? A panel data study. J. Clean. Prod. 2018, 177, 362–370. [Google Scholar] [CrossRef]
  12. Melin, M.; Barth, H. Lean in Swedish agriculture: Strategic and operational perspectives. Prod. Plan. Control Manag. Oper. 2018, 29, 845–855. [Google Scholar] [CrossRef] [Green Version]
  13. Marqués, L.; Costa, L.; Gohr, C.F.; Carvalho, L.; Da Silva, M.H. Criteria and practices for lean and green performance assessment: A systematic review and conceptual framework. J. Clean. Prod. 2019, 218, 746–762. [Google Scholar] [CrossRef]
  14. Avató, J.L.; Mannheim, V. Life Cycle Assessment Model of a Catering Product: Comparing Environmental Impacts for Different End-of-Life Scenarios. Energies 2022, 15, 5423. [Google Scholar] [CrossRef]
  15. Rathi, R.; Kaswan, S.; Garza-Reyes, J.; Jiju, A.; Cross, J. Green Lean Six Sigma for improving manufacturing sustainability: Framework development and validation. J. Clean. Prod. 2022, 345, 131130. [Google Scholar] [CrossRef]
  16. Elemure, I.; Dhakal, H.; Leseure, M.; Radulovic, J. Integration of Lean Green and Sustainability in Manufacturing: A Review on Current State and Future Perspectives. Sustainability 2023, 15, 10261. [Google Scholar] [CrossRef]
  17. Rondanelli, M.; Gasparri, C.; Riva, A.; Petrangolini, G.; Barrile, G.C.; Cavioni, A.; Razza, C.; Tartara, A.; Perna, S. Diet and ideal food pyramid to prevent or support the treatment of diabetic retinopathy, age-related macular degeneration, and cataracts. Front. Med. 2023, 10, 1168560. [Google Scholar] [CrossRef] [PubMed]
  18. Naureen, Z.; Bonetti, G.; Medori, M.C.; Aquilanti, B.; Velluti, V.; Matera, G.; Iaconelli, A.; Bertelli, M. Foods of the Mediterranean diet: Lacto-fermented food, the food pyramid and food combinations. J. Prev. Med. Hyg. 2022, 63, 28–35. [Google Scholar] [CrossRef]
  19. Santos, L. The impact of nutrition and lifestyle modification on health. Eur. J. Int. Med. 2022, 97, 18–25. [Google Scholar] [CrossRef]
  20. Wilson, T.; Bendich, A. Nutrition Guidelines for Improved Clinical Care. Med. Clin. N. Am. 2022, 106, 819–836. [Google Scholar] [CrossRef]
  21. Santeramo, F.G.; Carlucci, D.; De Devitiis, B.; Seccia, A.; Stasi, A.; Viscecchia, R.; Nardone, G. Emerging trends. Food Res. Int. 2018, 104, 39–47. [Google Scholar] [CrossRef] [Green Version]
  22. OECD-FAO Agricultural Outlook 2021 OECD Agriculture Statistics (Database). Available online: https://www.fao.org/3/cb5332en/Meat.pdf (accessed on 16 December 2022).
  23. World Agriculture Towards 2030/2050. The 2012 Revision. Available online: https://www.fao.org/3/ap106e/ap106e.pdf (accessed on 16 December 2022).
  24. Jost, S.; Birringer, M.; Herzig, C. Brokers, prestige and information exchange in the European Union’s functional food sector—A policy network analysis. J. Funct. Foods 2022, 99, 105309. [Google Scholar] [CrossRef]
  25. Ahmad, I.; Hao, M.; Li, Y.; Zhang, J.; Ding, Y.; Lyu, F. Fortification of yogurt with bioactive functional foods and ingredients and associated challenges-A review. Trends Food Sci. Technol. 2022, 129, 558–580. [Google Scholar] [CrossRef]
  26. Cai, J.; Leung, P. Unlocking the potential of aquatic foods in global food security and nutrition: A missing piece under the lens of seafood liking index. Glob. Food Secur. 2022, 33, 100641. [Google Scholar] [CrossRef]
  27. Liu, C.; Ralston, N. Chapter Seven-Seafood and health: What you need to know? Adv. Food Nutr. Res. 2021, 97, 275–318. [Google Scholar] [CrossRef] [PubMed]
  28. Church, H.; Nagao-Sato, S.; Overcash, F.; Reicks, M. Associations between seafood intake frequency and diet and health indicators among U.S. adults: NHANES 2011–2016. J. Food Compos. Anal. 2021, 102, 104054. [Google Scholar] [CrossRef]
  29. Fehrenbach, G.; Pogue, R.; Carter, F.; Clifford, E.; Rowan, N. Implications for the seafood industry, consumers and the environment arising from contamination of shellfish with pharmaceuticals, plastics and potentially toxic elements: A case study from Irish waters with a global orientation. Sci. Total Environ. 2022, 844, 157067. [Google Scholar] [CrossRef]
  30. Iłowiecka, K.; Maslej, M.; Czajka, M.; Pawłowski, A.; Wieckowski, P.; Styk, T.; Gołkiewicz, M.; Kuzdralinski, A.; Koch, W. Lifestyle, Eating Habits, and Health Behaviors Among Dietary Supplement Users in Three European Countries. Front. Public Health 2022, 10, 892233. [Google Scholar] [CrossRef] [PubMed]
  31. Calderón, L.; Herrero, M.; Laca, A.; Díaz, M. Environmental impact of a traditional cooked dish at four different manufacturing scales: From ready meal industry and catering company to traditional restaurant and homemade. Int. J. Life Cycle Assess 2018, 23, 811–823. [Google Scholar] [CrossRef]
  32. Bruno, M.; Thomsen, M.; Pulselli, F.; Patrizi, N.; Marini, M.; Caro, D. The carbon footprint of Danish diets. Clim. Change 2019, 156, 489–507. [Google Scholar] [CrossRef]
  33. Filimonau, V.; Lemmer, C.; Marshall, D.; Bejjani, G. ‘Nudging’ as an architect of more responsible consumer choice in food service provision: The role of restaurant menu design. J. Clean. Prod. 2017, 144, 161–170. [Google Scholar] [CrossRef] [Green Version]
  34. Gormaz, T.; Cortés, S.; Tiboni-Oschilewski, O.; Weisstaub, G. The Chilean Diet: Is It Sustainable? Nutrients 2022, 14, 3103. [Google Scholar] [CrossRef]
  35. Wansink, B.; Love, K. Slim by design: Menu strategies for promoting high-margin, healthy foods. Int. J. Hosp. Manag. 2014, 42, 137–143. [Google Scholar] [CrossRef]
  36. Lawless, H.; Patel, A.; Lopez, N. Mixed messages: Ambiguous penalty information in modified restaurant menu items. Food Qual. Prefer. 2016, 52, 232–236. [Google Scholar] [CrossRef] [Green Version]
  37. Gerić, M.; Matković, K.; Gajski, G.; Rumbak, I.; Štancl, P.; Karlić, R.; Bituh, M. Adherence to Mediterranean Diet in Croatia: Lessons Learned Today for a Brighter Tomorrow. Nutrients 2022, 14, 3725. [Google Scholar] [CrossRef] [PubMed]
  38. Fry, J.P.; Stodden, B.; Brace, A.M.; Laestadius, L.I. A Tale of Two Urgent Food System Challenges: Comparative Analysis of Approaches to Reduce High-Meat Diets and Wasted Food as Covered in U.S. Newspapers. Sustainability 2022, 14, 12083. [Google Scholar] [CrossRef]
  39. Topcu, B.; Dias, G.M.; Mollaei, S. Ten-Year Changes in Global Warming Potential of Dietary Patterns Based on Food Consumption in Ontario, Canada. Sustainability 2022, 14, 6290. [Google Scholar] [CrossRef]
  40. Houghtaling, B.; Greene, M.; Parab, K.V.; Singleton, C.R. Improving Fruit and Vegetable Accessibility, Purchasing, and Consumption to Advance Nutrition Security and Health Equity in the United States. Int. J. Environ. Res. Public Health 2022, 19, 11220. [Google Scholar] [CrossRef] [PubMed]
  41. Camilleri, M.A. Sustainable Production and Consumption of Food. Mise-en-Place Circular Economy Policies and Waste Management Practices in Tourism Cities. Sustainability 2021, 13, 9986. [Google Scholar] [CrossRef]
  42. Ioannou, T.; Bazigou, K.; Katsigianni, A.; Fotiadis, M.; Chroni, C.; Manios, T.; Daliakopoulos, I.; Tsompanidis, C.; Michalodimitraki, E.; Lasaridi, K. The “A2UFood Training Kit”: Participatory Workshops to Minimize Food Loss and Waste. Sustainability 2022, 14, 2446. [Google Scholar] [CrossRef]
  43. Brändström, J.; Saidani, M. Comparison between circularity metrics and LCA: A case study on circular economy strategies. J. Clean. Prod. 2022, 371, 133537. [Google Scholar] [CrossRef]
  44. Erdiaw-Kwasie, M.; Abunyewah, M.; Yusife, S.; Erdiaw-Kwasief, A. Does circular economy knowledge matter in sustainable service provision? A moderation analysis. J. Clean. Prod. 2023, 383, 135429. [Google Scholar] [CrossRef]
  45. Bianchi, M.; Cordella, M. Does circular economy mitigate the extraction of natural resources? Empirical evidence based on analysis of 28 European economies over the past decade. Ecol. Econ. 2023, 203, 107607. [Google Scholar] [CrossRef]
  46. Bongers, A.; Casas, P. The circular economy and the optimal recycling rate: A macroeconomic approach. Ecol. Econ. 2022, 199, 107504. [Google Scholar] [CrossRef]
  47. Kustar, A.; Patino-Echeverri, D. A Review of Environmental Life Cycle Assessments of Diets: Plant-Based Solutions Are Truly Sustainable, even in the Form of Fast Foods. Sustainability 2021, 13, 9926. [Google Scholar] [CrossRef]
  48. Kowalski, Z.; Muradin, M.; Kulczycka, J.; Makara, A. Comparative Analysis of Meat Bone Meal and Meat Bone Combustion Using the Life Cycle Assessment Method. Energies 2021, 14, 3292. [Google Scholar] [CrossRef]
  49. Purvis, B.; Mao, Y.; Robinson, D. Three pillars of sustainability: In search of conceptual origins. Sustain. Sci. 2019, 14, 681–695. [Google Scholar] [CrossRef] [Green Version]
  50. Stiles, G.; Collins, J.; Beck, K. Effectiveness of Strategies to Decrease Animal-Sourced Protein and/or Increase Plant-Sourced Protein in Foodservice Settings: A Systematic Literature Review. J. Acad. Nutr. Diet. 2022, 122, 5. [Google Scholar] [CrossRef] [PubMed]
  51. Rizwan, M.; Abbas, A.; Xu, H.; Ahmed, U.I.; Qing, P.; He, P.; Iqbal, M.A.; Shahzad, M.A. Role of Nutrition Information in Acceptance and Willingness to Pay for Biofortified Cereal Food: Implications for Better Health and Sustainable Diet. Nutrients 2022, 14, 3352. [Google Scholar] [CrossRef]
  52. Wijerathna-Yapa, A.; Pathirana, R. Sustainable Agro-Food Systems for Addressing Climate Change and Food Security. Agriculture 2022, 12, 1554. [Google Scholar] [CrossRef]
  53. Zuin, V.G.; Araripe, E.; Zanotti, K.; Stahl, A.M.; Gomes, C.J.C. Alternative Products Selling Sustainability? A Brazilian Case Study on Materials and Processes to Produce Plant-Based Hamburger Patties. Sustain. Chem. 2022, 3, 415–429. [Google Scholar] [CrossRef]
  54. Alexandropoulou, I.; Goulis, D.G.; Merou, T.; Vassilakou, T.; Bogdanos, D.P.; Grammatikopoulou, M.G. Basics of Sustainable Diets and Tools for Assessing Dietary Sustainability: A Primer for Researchers and Policy Actors. Healthcare 2022, 10, 1668. [Google Scholar] [CrossRef]
  55. Harray, A.J.; Boushey, C.J.; Pollard, C.M.; Dhaliwal, S.S.; Mukhtar, S.A.; Delp, E.J.; Kerr, D.A. Healthy and Sustainable Diet Index: Development, Application and Evaluation Using Image-Based Food Records. Nutrients 2022, 14, 3838. [Google Scholar] [CrossRef]
  56. Pereira, A.G.; Fraga-Corral, M.; Garcia-Oliveira, P.; Otero, P.; Soria-Lopez, A.; Cassani, L.; Cao, H.; Xiao, J.; Prieto, M.A.; Simal-Gandara, J. Single-Cell Proteins Obtained by Circular Economy Intended as a Feed Ingredient in Aquaculture. Foods 2022, 11, 2831. [Google Scholar] [CrossRef]
  57. Wahab, A.; Mukhtar, M.; Sulaiman, R. A Conceptual Model of Lean Manufacturing Dimensions. Procedia Technol. 2013, 11, 1292–1298. [Google Scholar] [CrossRef] [Green Version]
  58. Fiorello, M.; Gladysz, B.; Corti, D.; Wybraniak-Kujawa, M.; Ejsmont, K.; Sorlini, M. Towards a smart lean green production paradigm to improve operational performance. J. Clean. Prod. 2023, 413, 137418. [Google Scholar] [CrossRef]
  59. Abu Musameh, S.; Alqedra, M.; Arafa, M.; Agha, S. Developing a Framework for Implementing Green- Lean Construction Techniques. J. Eng. Res. Technol. 2018, 5, 77–87. [Google Scholar]
  60. Vinci, G.; Maddaloni, L.; Prencipe, S.A.; Ruggeri, M.; Di Loreto, M.V. A Comparison of the Mediterranean Diet and Current Food Patterns in Italy: A Life Cycle Thinking Approach for a Sustainable Consumption. Int. J. Environ. Res. Public Health 2022, 19, 12274. [Google Scholar] [CrossRef]
  61. Nunes, B.; Bennett, D. Green operations initiatives in the automotive industry: An environmental reports analysis and benchmarking study. Benchmarking Int. J. 2010, 17, 396–420. [Google Scholar] [CrossRef]
  62. Srivastava, S.; Raniga, U.I.; Misra, S. A Methodological Framework for Life Cycle Sustainability Assessment of Construction Projects Incorporating TBL and Decoupling Principles. Sustainability 2022, 14, 197. [Google Scholar] [CrossRef]
  63. Kalakul, S.; Malakul, P.; Siemanond, K.; Gani, R. Integration of life cycle assessment software with tools for economic and sustainability analyses and process simulation for sustainable process design. J. Clean. Prod. 2014, 71, 98–109. [Google Scholar] [CrossRef]
  64. ISO 14040:2006; Environmental Management—Life Cycle Assessment—Principles and Framework. ISO: Geneva, Switzerland, 2006.
  65. ISO 14044:2006; Environmental Management—Life Cycle Assessment—Requirements and Guidelines. ISO: Geneva, Switzerland, 2006.
  66. Van Oers, L.; De Koning, A.; Guinée, J.B.; Huppes, G. Abiotic resource depletion in LCA. In Improving Characterisation Factors for Abiotic Resource Depletion as Recommended in the New Dutch LCA Handbook; RWS-DWW: Delft, The Netherlands, 2002; Available online: http://www.leidenuniv.nl/cml/ssp/projects/lca2/report_abiotic_depletion_web.pdf (accessed on 29 February 2016).
  67. Kupfer, T.; Baitz, M.; Colodel, C.M.; Kokborg, M.; Schöll, S.; Rudolf, M.; Thellier, L.; Bos, U.; Bosch, F.; Gonzalez, M. GaBi Database & Modeling Principles. In GaBi Thinkstep AG; Sphera: Chicago, IL, USA, 2018. [Google Scholar]
  68. CML; Institute of Environmental Sciences, Leiden University. CML-IA Characterisation Factors Portal. 2016. Available online: https://www.universiteitleiden.nl/en/research/researchoutput/science/cml-ia-characterisation-factors (accessed on 29 June 2018).
  69. The Global Risks Report 2020; The World Economic Forum: Geneva, Switzerland, 2020; Available online: https://www.weforum.org/reports/the-global-risks-report-2020 (accessed on 15 October 2021).
  70. Kaczmarczyk, B.; Urych, I. Perception of the Transition to a Zero-Emission Economy in the Opinion of Polish Students. Energies 2022, 15, 1102. [Google Scholar] [CrossRef]
  71. Bałdowska-Witos, P.; Kruszelnicka, W.; Tomporowski, A. LCA analyzes were also performed for the production of PET bottle. Life cycle assessment of beverage bottles. J. Phys. Conf. Ser. 2020, 1426, 012038. [Google Scholar] [CrossRef]
  72. Mannheim, V. Life Cycle Assessment Model of Plastic Products: Comparing Environmental Impacts for Different Scenarios in the Production Stage. Polymers 2021, 13, 777. [Google Scholar] [CrossRef] [PubMed]
  73. Bianco, I.; Panepinto, D.; Zanetti, M. End-of-Life Tyres: Comparative Life Cycle Assessment of Treatment Scenarios. Appl. Sci. 2021, 11, 3599. [Google Scholar] [CrossRef]
  74. Alwaeli, M.; Mannheim, V. Investigation into the Current State of Nuclear Energy and Nuclear Waste Management—A State-of-the-Art Review. Energies 2022, 15, 4275. [Google Scholar] [CrossRef]
  75. Civancik-Uslu, D.; Puig, R.; Ferrer, L.; Fullana-i-Palmer, P. Influence of end-of-life allocation, credits and other methodological issues in LCA of compounds: An in-company circular economy case study on packaging. J. Clean. Prod. 2019, 212, 925–940. [Google Scholar] [CrossRef]
  76. Kiss, N.É.; Tamás, J.; Szőllősi, N.; Gorliczay, E.; Nagy, A. Assessment of Composted Pelletized Poultry Litter as an Alternative to Chemical Fertilizers Based on the Environmental Impact of Their Production. Agriculture 2021, 11, 1130. [Google Scholar] [CrossRef]
  77. Szita, K. The Application of Life Cycle Assessment in Circular Economy. Hung. Agric. Eng. 2017, 31, 5–9. [Google Scholar] [CrossRef]
  78. Salehin, M.; Kiss, J.T. Testing the Causal Relationship between Economic Growth and Renewable Energy Consumption: Evidence from a Panel of EAGLE Countries. Int. J. Energy Econ. Policy 2022, 12, 281–288. [Google Scholar] [CrossRef]
  79. Muñoz, L. Sustainability thoughts 127: Pareto optimality under the sustainability eye: Is the traditional pareto efficient bundle the second most undesirable bundle on the pareto optimality sustainability line? If yes, why? Int. J. Manag. Stud. Soc. Sci. Res. 2021, 3, 180–196. [Google Scholar]
  80. Jiang, S.; Zhang, H.; Cong, W.; Liang, Z.; Ren, Q.; Wang, C.; Zhang, F.; Jiao, X. Multi-Objective Optimization of Smallholder Apple Production: Lessons from the Bohai Bay Region. Sustainability 2020, 12, 6496. [Google Scholar] [CrossRef]
  81. Enea, M.; Salei, G. Fuzzy approach to the environmental impact evaluation. Ecol. Model. 2001, 135, 131–147. [Google Scholar] [CrossRef]
  82. Peche, R.; Rodríguez, E. Environmental impact assessment procedure: A new approach based on fuzzy logic. Environ. Impact Assess. Rev. 2009, 29, 275–283. [Google Scholar] [CrossRef]
  83. Mannheim, V.; Kruszelnicka, W. Energy-Model and Life Cycle-Model for Grinding Processes of Limestone Products. Energies 2022, 15, 3816. [Google Scholar] [CrossRef]
  84. Mannheim, V.; Kruszelnicka, W. Relation between Scale-Up and Life Cycle Assessment for Wet Grinding Process of Pumice. Energies 2023, 16, 4470. [Google Scholar] [CrossRef]
Figure 1. The phases of the life-cycle assessment (self-made scheme).
Sustainability 15 12014 g001
Figure 2. The system boundary of the life-cycle assessment method. The life-cycle phases were appointed as a function of the mass of the soups and main courses served. All used materials and energy flows are related to the examined product outputs. The LCA method allocates all loads to the examined food products and wastes with mass allocation.
Sustainability 15 12014 g002
Figure 3. Hungarian energy mix (reference year: 2022, source: Hungarian Energy and Utilities Regulatory Office).
Sustainability 15 12014 g003
Figure 4. Impact categories for the whole life cycle of the garlic cream soup and beef bean soup in nanograms (functional unit: 1 kg). Normalization reference: CML 2016, EU 25 + 3, the year 2000, excl. biogenic carbon. Weighting method: thinkstep LCIA Survey 2012, Europe, CML 2016, excl. biogenic carbon).
Sustainability 15 12014 g004
Figure 5. Primary energy values for the life-cycle phases of the meat-free and meat-containing main dishes in MJ (functional unit: 1 kg of main dish product).
Sustainability 15 12014 g005
Figure 6. Fossils abiotic depletion, acidification, eutrophication, and global warming values for the whole life cycle of meat-free and meat-containing main dishes in nanograms (functional unit: 1 kg). Normalization reference: CML 2016, EU 25 + 3, the year 2000, excl. biogenic carbon. Weighting method: thinkstep LCIA Survey 2012, Europe, CML 2016, excl. biogenic carbon).
Sustainability 15 12014 g006
Figure 7. Human toxicity, freshwater aquatic ecotoxicity, and photochemical ozone creation values for the whole life cycle of meat-free and meat-containing main dishes in nanograms (functional unit: 1 kg). Normalization reference: CML 2016, EU 25 + 3, the year 2000, excl. biogenic carbon. Weighting method: thinkstep LCIA Survey 2012, Europe, CML 2016, excl. biogenic carbon).
Sustainability 15 12014 g007
Figure 8. Sustainability assessment model: GreenCycLEAN.
Sustainability 15 12014 g008
Table 1. Material inputs regarding the tested soups and main dishes during the preparation and cooking life-cycle phases.
Flow Type Process Flow NamePlan Flow Name
Garlic Cream Soup
InputsCheddarCheddar
GarlicGarlic
Pasteurized cream (42%)Pasteurized cream (38–42%)
Rapeseed oil (Canola)Rapeseed oil, refined
Wheat white flourWheat white flour
Beef Bean Soup
InputsBeef cattleBeef, semi-boneless
Beans at farmField beans, field border (14% water content)
Carrots (87% water content)Carrots
Cream (38%)Pasteurized cream (38–42%)
Sugar beet (75% water content)Celery tuber, garlic, and onion
Green Salad
InputsCarrots (87% water content)Carrots
Rapeseed oil (Canola)Rapeseed oil, refined
Sugar beet (75% water content)Onion
Sunflower seedsSunflower seeds
Tomato (97% water content)Tomato
Fish with Gnocchi
InputsFish mealFish meal
Orange (90% water content)Orange
Pasteurized cream (42%)Pasteurized cream (38–42%)
Potato at farmPotato
Rapeseed oil (Canola)Rapeseed oil, refined
Wheat white flourWheat white flour
Wiener Schnitzel
InputsBeef cattleBeef, semi-boneless
Egg, breadcrumbEgg, breadcrumb
Orange (90% water content)Orange
Potato at farmPotato
Rapeseed oil (Canola)Rapeseed oil, refined
Wheat white flourWheat white flour
Table 2. Water inputs regarding the tested soups and main dishes during the preparation and cooking life-cycle phases in kilograms (functional units: 1 portion and 1 kg).
Process Flow NamePlan Flow NameAmount for 1 Portion/for 1 kg [kg]
Garlic Cream Soup (1 portion)
Water (drinking water)Drinking water (EU mix)4.50/27.13
Beef Bean Soup (1 portion)
Water (drinking water)Drinking water (EU mix)7.00/15.54
Green salad (1 portion)
Water (drinking water)Drinking water (EU mix)5.00/15.43
Fish with gnocchi (1 portion)
Water (drinking water)Drinking water (EU mix)8.00/16.51
Wiener Schnitzel (1 portion)
Water (drinking water)Drinking water (EU mix)8.50/19.76
Table 3. Energy inputs and waste outputs regarding the tested soups and main dishes during the preparation and cooking life-cycle phases in MJ (functional units: 1 portion and 1 kg).
Flow TypeProcess Flow NamePlan Flow NameAmount for 1 Portion/for 1 kg [MJ]
Garlic Cream Soup (1 portion)
InputHungarian electricity mixElectricity grid mix
(production mix, Hungary)
0.85/5.12
Natural gas at consumer (Hungary)Thermal energy from natural gas (Hungary)0.30/1.81
OutputProduct (unspecified)Garlic cream soup product2.51/15.16
Municipal solid waste Food waste0.14/0.83
Beef Bean Soup (1 portion)
Input
Hungarian electricity mixElectricity grid mix
(production mix, Hungary)
1.04/2.31
Natural gas at consumer (Hungary)Thermal energy from natural gas (Hungary)1.25/2.77
OutputProduct (unspecified)Beef bean soup product3.17/7.02
Municipal solid waste Food waste0.32/0.71
Green salad (1 portion)
InputHungarian electricity mix Electricity grid mix
(production mix, Hungary)
1.06/3.27
OutputProduct (unspecified)Green salad product2.37/7.33
Municipal solid waste Food waste0.35/2.50
Fish with gnocchi (1 portion)
InputHungarian electricity mixElectricity grid mix
(production mix, Hungary)
1.94/4.01
Natural gas at consumer (Hungary)Natural gas mix (Hungary)2.58/5.33
OutputProduct (unspecified)Fish with gnocchi product3.67/7.58
Municipal solid waste Food waste0.29/0.60
Wienerschnitzel (1 portion)
InputHungarian electricity mixElectricity grid mix
(production mix, Hungary)
2.37/5.52
Natural gas at consumer (Hungary)Thermal energy from natural gas (Hungary)1.71/3.98
OutputProduct (unspecified)Wienerschnitzel product5.11/10.49
Municipal solid wasteFood waste0.60/1.40
Table 4. Primary energy for the life-cycle phases of the soups in MJ (functional unit: 1 kg of soup).
Primary Energy
(in Gross Caloric Value)
Preparation Phase
[MJ]
Cooking Phase
[MJ]
End-of-Life Phase
[MJ]
Whole Life Cycle
[MJ]
Vegan and Vegetarian Soup—Garlic Cream Soup
Primary energy from nonren. resources12.25119.890.09132.23
Primary energy from renewable resources25.4924.530.0150.03
Primary energy from all resources37.74144.420.02182.18
Meat-based Soup—Beef Bean Soup
Primary energy from nonren. resources5.15150.000.13155.28
Primary energy from renewable resources16.23.540.0119.75
Primary energy from all resources21.35153.540.14175.03
Table 5. Values of the human toxicity potential of soups among life-cycle phases in nanograms.
Soup TypePreparation
[Nanogram]
Cooking
[Nanogram]
Whole LCA
[Nanogram]
Garlic cream soup0.8730.901.78
Beef bean soup0.3841.281.67
Functional unit: 1 kg of soup.
Table 6. Distribution of human toxicity potential of soups among the raw material inputs.
Name of Raw MaterialBeef Bean Soup
[%]
Garlic Cream Soup
[%]
Bean2.10-
Butter-22.46
Cream/sour cream3.2721.19
Electricity5.4011.32
Gas71.4644.31
Meat16.40-
Functional unit: 1 kg of soup.
Table 7. Primary energy values for the life-cycle phases of the main dishes in MJ (functional unit: 1 kg of main dish product).
Primary Energy
(in Gross Caloric Value)
Preparation Phase
[MJ]
Cooking Phase
[MJ]
End-of-Life Phase
[MJ]
Whole Life Cycle
[MJ]
Vegan Main Dish—Green Salad
Primary energy from nonren. resources5.293.230.168.68
Primary energy from renewable resources3.147.870.0111.02
Primary energy from all resources8.4311.100.1719.70
Vegetarian Main Dish—Fish with Gnocchi
Primary energy from nonren. resources9.99319.510.27329.77
Primary energy from renewable resources10.5921.890.0232.50
Primary energy from all resources20.58341.400.29362.27
Meat-based Main Dish—Wienerschnitzel
Primary energy from nonren. resources17.70238.000.22255.92
Primary energy from renewable resources60.006.920.0266.94
Primary energy from all resources77.70244.920.24322.86
Table 8. Environmental impact categories for the life-cycle phases of the main dishes in nanograms.
Environmental Impact CategoryPreparation Phase
[ng]
Cooking Phase
[ng]
End-of-Life Phase
[ng]
Whole Life Cycle
[ng]
Vegan Main Dish—Green Salad
Abiotic Depletion ADP elements, ADPE0.010.020.000.03
Abiotic Depletion ADP fossils, ADPF0.550.430.021.00
Acidification Potential AP0.230.420.010.66
Eutrophication Potential EP0.140.370.040.55
Global Warming Potential GWP 100 years0.470.380.171.03
Human Toxicity Potential HTP inf.0.240.490.000.73
Freshwater Aquatic Ecot. Pot. FAETP inf.0.100.470.000.57
Photochemical Ozone Creation Pot. POCP0.140.070.100.31
Pescovegetarian (Pescatarian) Main Dish—Fish with Gnocchi
Abiotic Depletion ADP elements. ADPE0.010.100.000.11
Abiotic Depletion ADP fossils. ADPF1.2052.460.0453.70
Acidification Potential AP0.764.620.025.40
Eutrophication Potential EP0.392.300.072.76
Global Warming Potential GWP 100 years0.965.830.317.10
Human Toxicity Potential HTP inf.1.154.310.015.47
Freshwater Aquatic Ecot. Pot. FAETP inf.0.341.320.001.66
Photochemical Ozone Creation Pot. POCP0.503.710.184.39
Meat-based Main Dish—Wienerschnitzel
Abiotic Depletion ADP elements. ADPE0.170.070.000.24
Abiotic Depletion ADP fossils. ADPF2.2938.870.0441.20
Acidification Potential AP20.571.620.0122.20
Eutrophication Potential EP8.020.660.078.75
Global Warming Potential GWP 100 years8.293.630.2612.18
Human Toxicity Potential HTP inf.2.364.240.016.61
Freshwater Aquatic Ecot. Pot. FAETP inf.3.790.880.004.67
Photochemical Ozone Creation Pot. POCP10.482.060.1612.70
Functional unit: 1 kg of main dish. Normalization reference: CML 2016. EU 25 + 3. the year 2000. excl. biogenic carbon. Weighting method: thinkstep LCIA Survey 2012. Europe. CML 2016. excl. biogenic carbon).
Table 9. Comparison of both soups based on the carbon footprint values in nanograms.
Name of the SoupAverage
[ng]
Variance
[ng]
Median
[ng]
Vegetarian/Vegan Soup (Garlic Cream Soup)2.933.712.44
Traditional Soup (Beef Bean Soup)4.621.714.59
Functional unit: 1 kg of soup. Number of samples: 115.
Table 10. Summary results based on the Mann–Whitney U test.
NameNumerical Value
Number of independent samples230
Mann–Whitney U2,437,000
Wilcoxon W9,107,000
Test Statistic2,437,000
Standard Error50,419
Standardized Test Statistic−8276
Asymptotic Significance (2-sided test)0000
Functional unit: 1 kg of soup. Number of samples: 115.
Table 11. Comparison of main dishes based on the carbon footprint values in nanograms.
Name of the SoupAverage
[ng]
Variance
[ng]
Median
[ng]
Vegan Main Dish (Green Salad)1.030.051.04
Pescovegetarian Main Dish (Fish with Gnocchi)7.102.507.15
Meat-containing Main Dish (Wienerschnitzel)12.207.4012.29
Functional unit: 1 kg of main dish. Number of samples: 115.
Table 12. Summary results based on the Kruskal–Wallis test.
Name Numerical Value
Total Number 345
Test Statistic289,884
Degree of Freedom2
Asymptotic Significance (2-sided test)0000
Functional unit: 1 kg of main dish. The test statistic is adjusted for ties.
Disclaimer/Publisher’s Note: The statements, opinions and data contained in all publications are solely those of the individual author(s) and contributor(s) and not of MDPI and/or the editor(s). MDPI and/or the editor(s) disclaim responsibility for any injury to people or property resulting from any ideas, methods, instructions or products referred to in the content.

