Article

A Parametric BIM Framework to Conceptual Structural Design for Assessing the Embodied Environmental Impact

by
Kitti Ajtayné Károlyfi
* and
János Szép
Department of Structural and Geotechnical Engineering, Széchenyi István University, H-9026 Győr, Hungary
*
Author to whom correspondence should be addressed.
Sustainability 2023, 15(15), 11990; https://doi.org/10.3390/su151511990
Submission received: 20 June 2023 / Revised: 27 July 2023 / Accepted: 2 August 2023 / Published: 4 August 2023
(This article belongs to the Special Issue Structural Engineering Simulation and Optimization for Sustainability)

Abstract

:
Decisions made in the early design stage have a significant effect on a building’s performance and environmental impact. In practice, a conceptual design is performed by an architect, while a structural engineer begins to work in later phases when the architectural concept has already evolved. However, the geometry and form of a building directly determine the type of structure and applicable materials; therefore, the conceptual design phase gives rise to examining alternative solutions. This paper presents a method for generating alternative structural solutions in the conceptual design phase and examining their embodied environmental impact by integrating parametric design and building information modeling (BIM). Rhinoceros and Grasshopper were used to develop the parametric script, which includes the generation of geometrical variations, the automatic definition of initial cross sections for the load-bearing elements based on in-built structural design approximations, the datasets for embodied environmental impact of the used building materials, the generation of life cycle inventory (LCI), the automatic calculation of life cycle assessment (LCA) results based on the geometry, and the conversion of the parametric model into building information model. The method was demonstrated using a case study of 48 different alternative solutions for an unheated warehouse made of steel frames. Based on the results, the areas with the greatest energy impact were identified. The case study analysis also illustrated that the applied cross section may have a significant effect on the impact categories. The results draw attention to the complexity of LCA calculations even in the case of a simple structure containing a limited number of variables, where parametric design can serve as an effective tool for a comprehensive environmental impact assessment.

1. Introduction

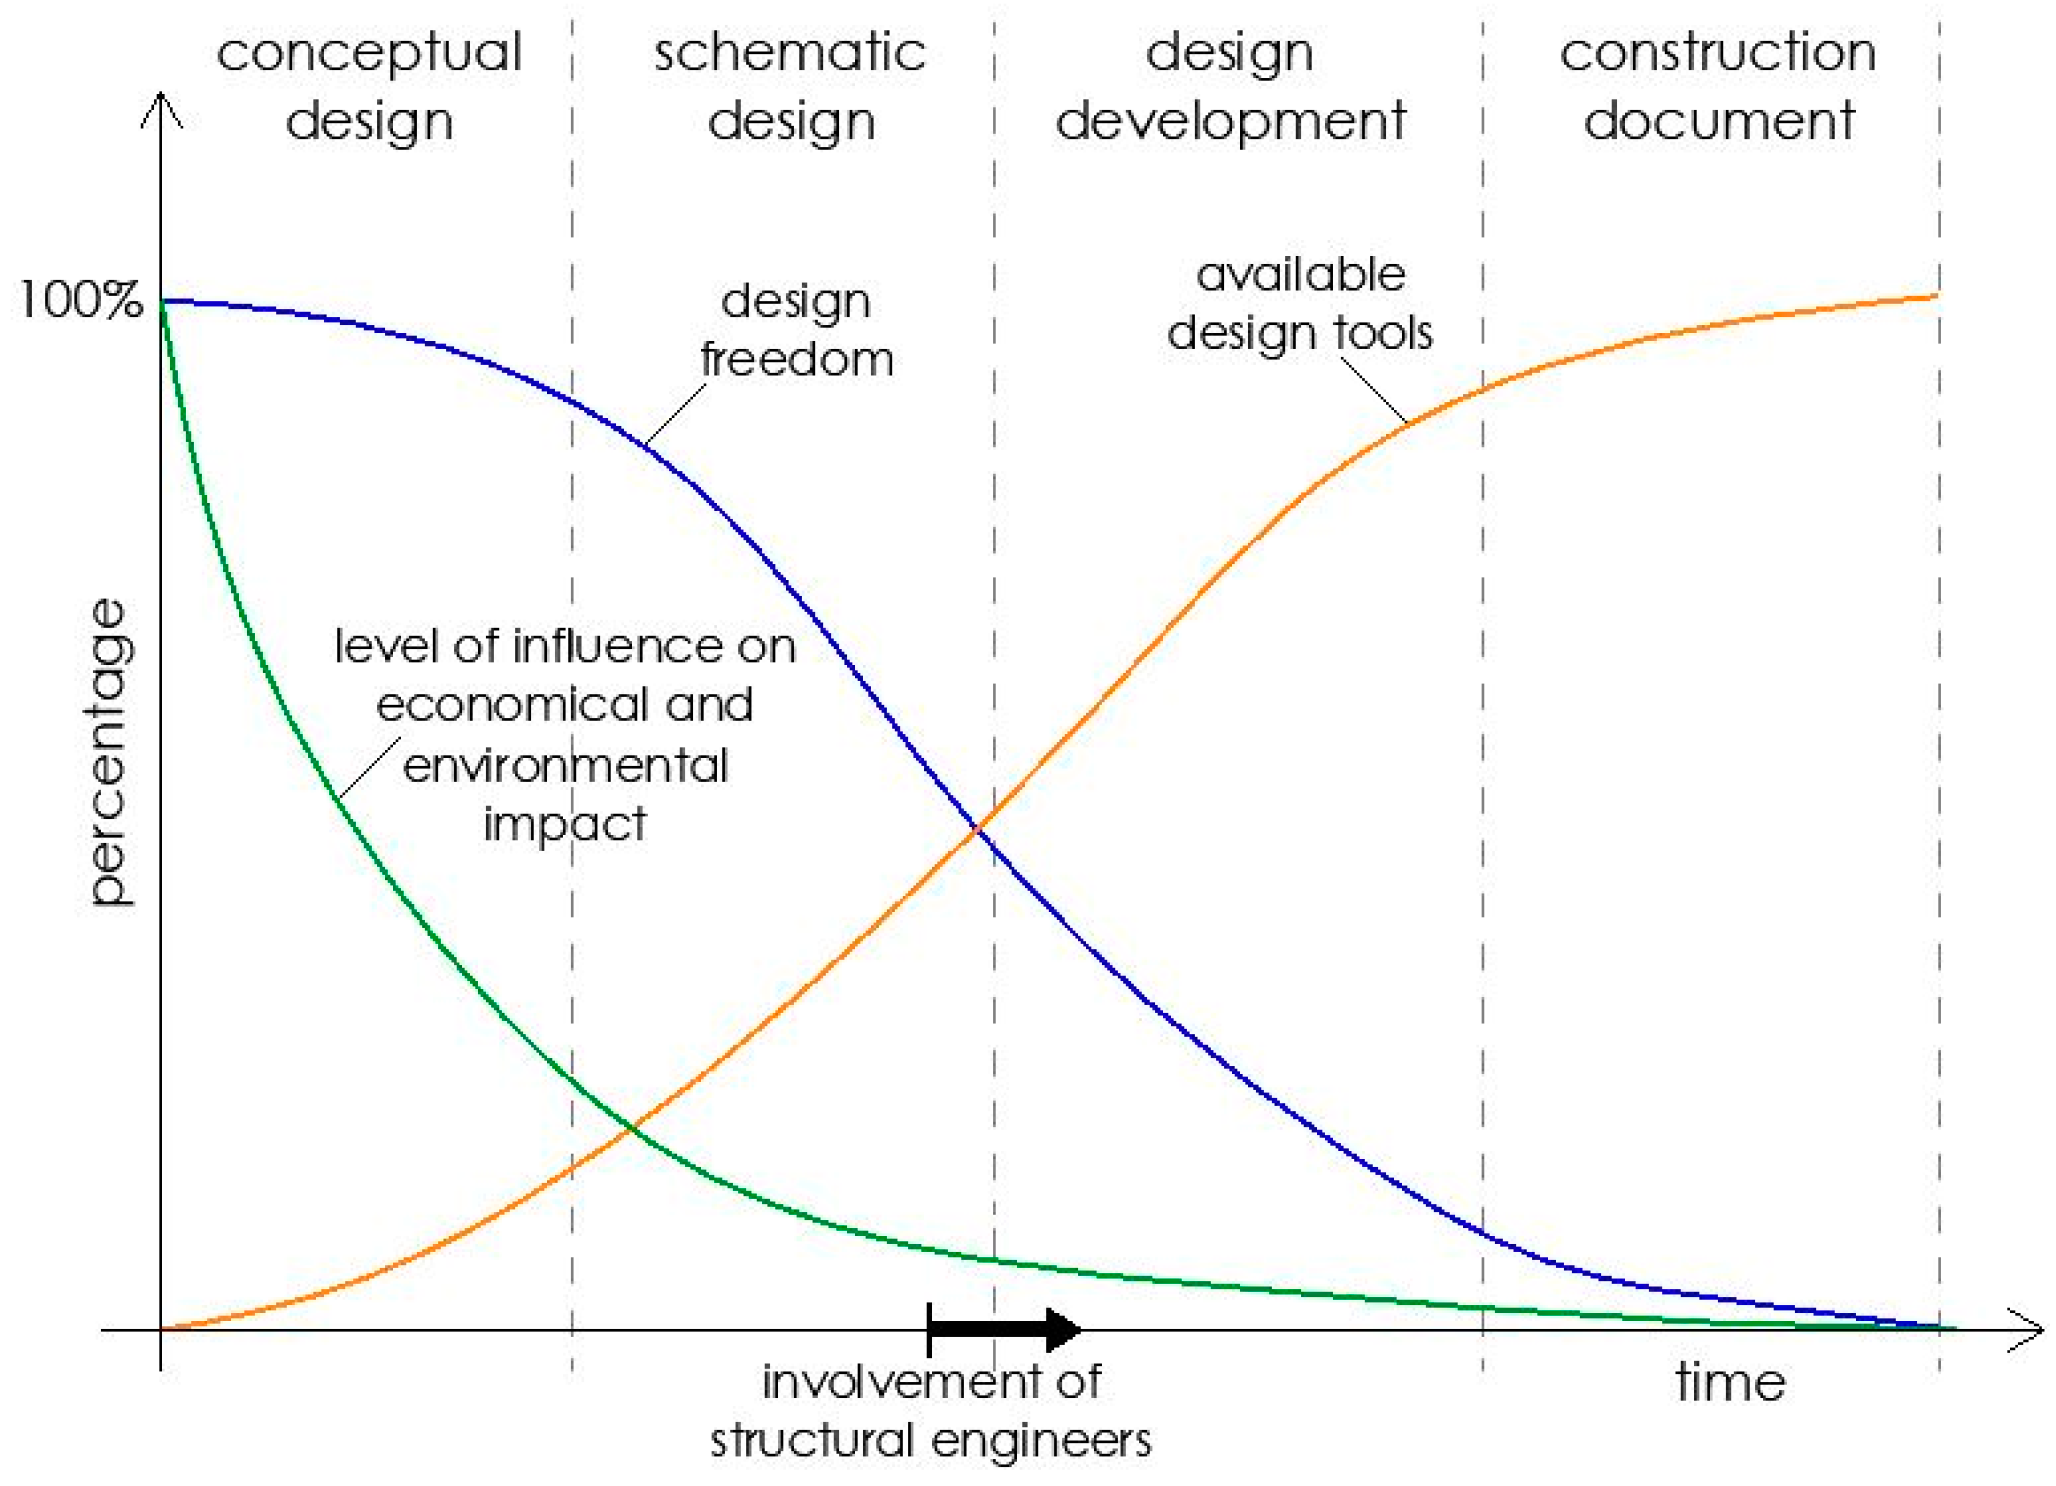
The design process of a building is usually divided into four phases: conceptual design, schematic design, design development, and construction documents [1]. The conceptual design phase is generally performed by an architect(s) alone, without the involvement of other disciplines. As a result of this work, the geometry, mass, and form of the building are invented and finalized by the end of the schematic design [2]. After the architectural concept has already evolved, structural engineers and other disciplines begin to work. Based on several studies [3,4], the main characteristic and performance of a building are predominantly determined by the decisions made in the early design stage, while in the late phases of design development, only a small impact can be achieved. This means that the results of the conceptual design phase determine the functional, aesthetical, and structural properties of a building and, therefore, its cost, performance, reliability, safety, and environmental impact. Furthermore, the design freedom of the structural engineers is significantly decreased when they are involved since the goal is to materialize the architectural visualization (Figure 1).
However, the form and geometry of a building determine the types of internal force that occur within the structural elements and influence its magnitudes [1,5,6]. The mechanical properties of materials directly determine the types of internal force for which they can be used; therefore, the form also determines the applicable structural materials and elements [5,7]. Although there is a strong relationship between form and structure, neither of them directly specifies the other. The static laws and equilibrium requirements can be fulfilled using different structure types and with variable details, while these solutions are not equivalent from the structural point of view. The flow of internal forces and the structural behavior may differ considerably and, at this point, economic factors become dominant. This is the general case if the designed building’s dimensions and shape remain within a defined framework.
Figure 1. Design freedom and tools in the different project phases [1,3,8].
Sustainability 15 11990 g001
However, an increase in the span or height reduces the scope of applicable structure types, and the use of structure-defined forms become increasingly important (Figure 2) [5].
In any case, there are many additional aspects that should also be considered during the design process in order to choose the optimal alternative. As is widely known, construction projects have significant energy consumption and carbon emission; therefore, the Architecture, Engineering, Construction, and Operation (AECO) industry is currently facing new challenges due to increasingly stringent sustainability requirements. Since the greatest impact on a building’s performance can be achieved in the conceptual design phase, it is crucial to create and examine alternative solutions. However, this workflow is time-consuming and requires complex evaluation based on several aspects, which are sometimes controversial. It is also important to note that in the conceptual design phase, the information is still incomplete and imprecise [3] and the scope of available design tools is narrow, which creates a great challenge for a comprehensive evaluation. As a consequence, there is a need for developing new tools and methods to simplify and optimize this process.
This study aims to develop a method that allows the efficient generation and evaluation of structural design alternatives in the conceptual design phase from a sustainability point of view. To achieve this, a steel frame structure was created as a case study using Rhinoceros 3D and Grasshopper. The model consists of load-bearing structures, secondary structural elements, and façade elements. Structural design approximations were embodied in the model as rules to define the cross section of the frame according to the span. The appropriateness of the structural dimensions was checked with the help of the Grasshopper–ConSteel live connection using the Pangolin plug-in. The embodied environmental impact of 48 different geometries was then investigated based on the database of ÖKOBAUDAT [10]. Although the entire geometry is parametric, the examined variables were the span, the number of frames, and the distance between the frames. This study focuses on the embodied environmental impact; therefore, the product stage (A1–A3 module) of the lifecycle was considered on seven environmental impact categories, i.e., global warming potential (GWP), photochemical ozone creation potential (POCP), ozone depletion potential (ODP), acidification potential (AP), eutrophication potential (EP), abiotic depletion potential for non-fossil resources (ADPE), and abiotic depletion potential for fossil resources (ADPF). The results were exported in Excel files, where the evaluation was performed. Finally, the parametric model was converted into a building information model using the live connection between Grasshopper and Archicad. The novelty of this study lies in performing LCA calculations based on a parametrically variable geometry, which automatically considers the impact of changes in the span on the cross sections of the load-bearing elements. Moreover, the entire algorithm is integrated into the OpenBIM [11] concept, allowing collaboration throughout the project’s lifecycle with the efficient and interactive handling of changes.

2. Literature Review

Many tools have been developed using digital technology to respond to the new challenges in the AECO industry. One of the most emerging methods is building information modeling (BIM), which is the concept of connecting information to geometrical objects that form a digital representation of a building [12,13,14]. It is an information technology-enabled approach, which aims to create, manage, and share all the relevant information on the different project stages throughout the entire life cycle of a building [15]. BIM is commonly used to support the design development [16] and construction phases of a project [17,18] by increasing efficiency and decreasing waste and the number of errors, and BIM has been used for several applications in facility management [19,20]. As a result, BIM has laid down the foundations for life cycle thinking and changed the way the AECO industry operates [21,22]. However, the real advantages of the method can only be revealed when its application is extended to the entire design process [23]. Since the BIM method has many benefits [24], it was successfully implemented in several fields [13], such as construction management [25], transportation infrastructure [26], and urban design [27]. BIM is also a significant tool that can be used in sustainable design [28] aimed at decreasing energy consumption and the carbon footprint, integrating renewable energy resources, and creating waste management systems [25,29]. One powerful method for reducing carbon emissions and energy consumption is the life cycle assessment (LCA), which allows for quantifying the buildings’ environmental sustainability using a comprehensive approach. According to the ISO 14040:2006 [30] and ISO 14044:2006 standards [31], the process of LCA is divided into four phases: (1) the first task is to define the purpose and scope of the LCA, including considerations for the level of detail, impact categories, characterization models, assumptions, and system boundaries. (2) The second phase is typically the most time-consuming task since the relevant input data (such as energy sources and raw materials) and the required output information (such as emissions and waste) are quantified here, leading to the creation of the life cycle inventory (LCI). (3) During the third stage, impact categories are chosen and linked to the LCI results. (4) The final step involves calculating the category indicator results, referred to as a life cycle impact assessment. This stage also entails evaluating and interpreting the results [32,33]. According to Hollberg and Ruth [32], the application of LCA is a challenging task in the AEC industry due to the complexity arising from building components using numerous diverse materials, the significant uncertainty regarding a building’s use through its lifecycle, the involvement of several manufacturers, the scarcity of environmental data for building materials, and the limited knowledge and experience among designers. The integration of BIM and LCA brings significant benefits and enables overcoming these issues; therefore, it has become a relevant research area in recent years [34,35].
Based on the extensive study of Li et al. [36] and Kudhair et al. [37], a bibliometric analysis of the literature showed that there are 60 key research areas in the BIM topic, including information systems, construction, 3D modeling, design methods, sustainability and energy simulation, interoperability, and so on. However, research on the integration of BIM within structural engineering has only started recently, according to a bibliometric analysis of the literature published between 2003 and 2018 by Vilutiene et al. [22]. Their study of 369 papers showed that the research began with the development of standards for computer-aided design, software tools, algorithms, and methods to increase efficiency. Between 2013 and 2015, the main research areas were shifted to data management, information systems, interoperability, and decision-making. From 2016, the directions of BIM in structural engineering were then moved to the automation of processes, big data analysis, simulations, 3D surveys, and risk assessment. The study also reveals the gaps in research on structural engineering applications of BIM: the existing studies appear as fragmented and isolated research efforts. The application potential is overshadowed by the challenges of BIM implementation during projects; therefore, there is a need for a comprehensive approach.
Parametric design is a design process based on algorithmic thinking, which uses rule-based techniques to create and control geometrical (and other) relations within design morphology [38]. This description is commonly used in the AEC industry; however, it is very similar to the general definition of computer-aided design (CAD) as well since a 3D object has parameters like length, height, width, etc. [39]. Therefore, it is important to identify the difference between these terms. According to [39,40], in product design, there are four levels of 3D modeling: (1) the conventional CAD, which enables the creation of geometrical elements with fixed values; (2) the parametric CAD, where the elements have variable parameters or the modeling history is traceable and editable; (3) the feature-based CAD, which can contain additional non-geometric information; and (4) the knowledge-based CAD, which supports the design process with automatic evaluation of the aspects. In architecture, many terms have become widespread after designers began to use computers, such as digital design, computational design, and parametric design. According to [38], digital design means only the usage of computer tools in the design process, while computational design is a generic term involving the application of computation to develop designs; therefore, it covers the term parametric design.
Parametric design gained earlier popularity in the mechanical engineering, aerospace, and automotive industries [41] compared to architecture because of several reasons. These engineering fields often involve highly complex systems and components that can benefit from the flexibility and automation offered by parametric design [42]. Furthermore, due to the iterative nature of the design process, the rapid exploration of alternatives and optimization methods were crucial to improve product performance and provide manufacturability. Additionally, the culture of innovation and adoption of advanced technologies has historically been stronger in these domains, leading to the development of CAD software focused initially on mechanical engineering applications. As a result, the software tools for parametric modeling were more mature and readily available in these domains before being widely adopted in the architectural field, like CATIA, Autodesk Inventor, Solid Edge, and Pro-Engineer, to name just a few.
However, it is important to mention, that the theory is not new in architecture: Otto Frei’s design principles and experimental form-finding methodologies, as well as Antonio Gaudí’s earlier work, were essentially parametric and made a significant impact on today’s rule-based design methodology and computational design tools [43,44]. The currently used term parametric architecture originated in the 1940s; its first computer application was performed in 1960 by Luigi Moretti [43]. However, the true interest in parametric architectural modeling started in the 2000s, initially focusing on formal geometrical explorations [45]. Nowadays, the most widely used parametric software in architecture includes Rhinoceros with Grasshopper and Autodesk Revit with Dynamo. The latter is a visual programming add-in for Autodesk Revit, enabling the parametric modeling for BIM processes, while Rhinoceros and its plug-in Grasshopper is a more widely used software due to its high level of interoperability with other software solutions and numerous apps available on the food4Rhino website (https://www.food4rhino.com/en (accessed on 1 June 2023)). Therefore, several applications can be found in the literature: it became an important tool for additive manufacturing in numerous domains like mechanical engineering [46], jewelry [47], and medical technology [48,49]. It is also highly used for optimization processes and automation purposes, as shown in examples from medical technology [50,51], the automotive industry [52], and urban design [53]. In the architecture and civil engineering domain, the scope of its application is continuously expanding [54]. The first examples were related mainly to the conceptual design phase and aimed to support creative design explorations [21]. Currently, it is commonly used for different analyses and optimization purposes during the conceptual and design development phase [55] since the creation of integral algorithms and embedding knowledge in the form of generative rules is well-supported [56]. For instance, many researchers worked on integrating software tools to improve the energy efficiency of buildings. Zhang et al. [57] developed a parametric generative algorithm to automatically generate and optimize layouts of residential buildings based on the energy performance using Rhino/Grasshopper and Python. An optimization framework was developed by Konis et al. [58] to improve energy performance in the early design stage. Kokkos [59] worked out a plugin for Grasshopper that allows for performing life cycle analysis of steel frame structures considering their cost. Several studies can also be found focusing on the application of parametric design for daylight improvement and energy saving based on the extensive literature review by Eltaweel and Su [60].
Although the technical approach and concept of BIM and parametric design is very similar [61], their application has evolved in separate ways. As is widely known, every object in a BIM project has its own intelligent behavior and is affected by several parameters, which can be changed by the designer. However, this parametric functionality has remained on the object level, and BIM software generally limits the application of internal algorithms, integrated scripting, dataflow modeling, and embodied knowledge. In parallel, parametric design methods usually lack the main advantages of the BIM method, such as the structured model or embodied information [23]. Therefore, several attempts have been made to integrate BIM and parametric design recently. Boeykens [23] suggested using both approaches complementary: the modeling method could be based on parametric design, while the analysis and further application could be performed using the BIM method. For that purpose, the author recommends bridging the gap between parametric and BIM software using real-time, simple messages for data transmission, similar to the Graphisoft BIM Server. Regarding its architectural application, J. Park [62] proposed a BIM-supported parametric design method for a traditional Korean building, Hanok, using Autodesk Revit and Digital Project.
There are also a few studies on integrating parametric structural design with BIM. Girardet and Boton [63] developed parametric bridge model elements, which can be used to generate and analyze several bridge types using Rhino/Grasshopper and Tekla Structures. Mirtschin [64] examined how a parametric model created using Grasshopper can be converted into IFC format to perform structural analysis. Generative modeling and integrated structural analysis were also previously applied in practice: for instance, the cable net roof of the 2012 Olympic Games Velodrome was optimized considering several evaluation aspects, such as appearance, cost, and services [64]. Cavieres et al. [65] developed a framework for designing load-bearing masonry walls in the context of a prototype modeling tool for the early design stage by embedding parametric construction and structural design rules. Das et al. [66] worked out an integrated spatial-structural optimization decision-making methodology for healthcare facilities using the Dynamo parametric modeling platform. This paper presents a case study to demonstrate how the developed method can support design teams to create, analyze, and manage alternative solutions in the conceptual design phase. These studies show that there is real potential for integrating the two approaches; however, the research is still in its infancy.

3. Research Methods

This study aims to develop a methodology by integrating parametric design with BIM, which has three major goals:
(1)
To support real-time and continuous information flow without loss from the conceptual design phase;
(2)
To develop consistent structural models ensuring intelligent computer support that decreases the possible sources of errors;
(3)
To create, examine, and evaluate alternative structural solutions in the conceptual design phase to decrease the environmental impact of the structure.
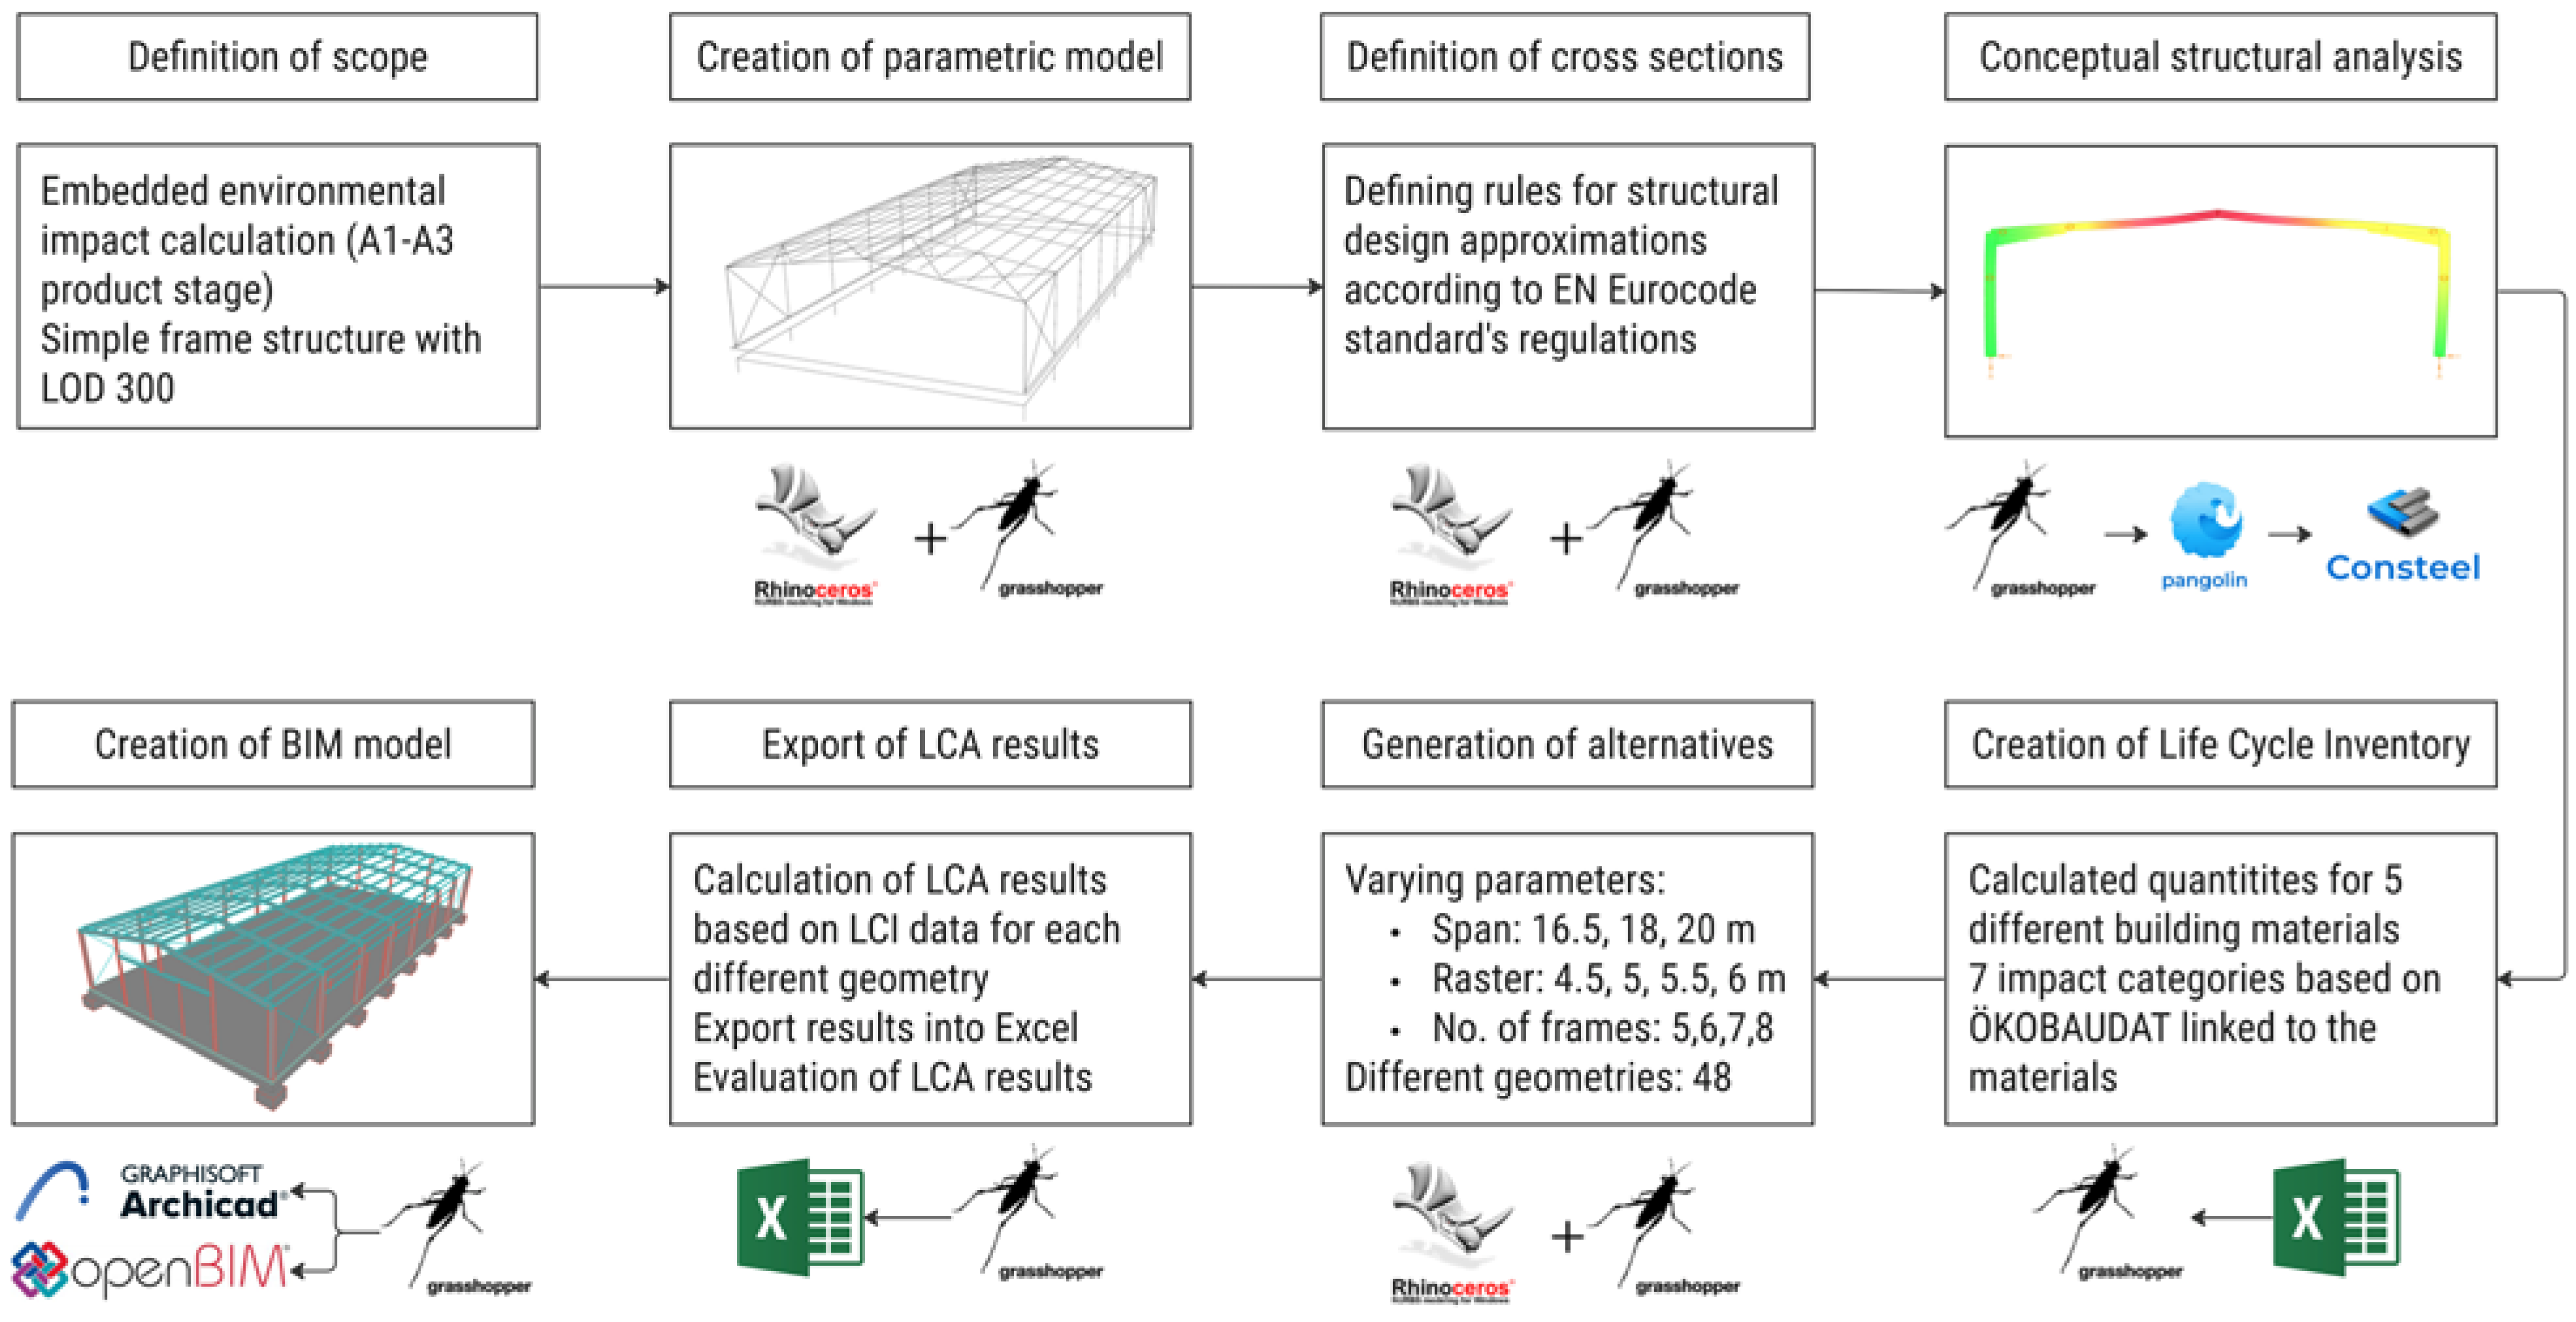
To achieve the research goals, a case study was conducted. This section describes the process of generating the parametric model including generating different alternatives for a simple steel hall using Rhinoceros 7 and Grasshopper, defining initial cross sections based on in-built structural design approximations, creating life cycle inventory, calculating LCA results, and converting the parametric model into analytical and building information models. The computational workflow and main steps of this study are shown in Figure 3.

3.1. Generation of the Parametric Model of a Simple Frame Structure

A steel frame structure was constructed as a case study to develop a BIM-based parametric approach for the conceptual design phase to calculate the embodied environmental impact of buildings. Since the early design stages are characterized by a high degree of uncertainty [3], the focus during the modeling process was directed toward the necessary building elements with large volumes and energy consumption. Therefore, the model consisted of the main load-bearing elements including columns, beams, and foundations; the secondary structural elements including the floor slab, purlins, eave and ridge struts, and bracings; and the envelope including wall and roof panels, gates, and windows. The frame and the stiffening system were made of steel, while the foundation and the floor slab were made of cast-in-place reinforced concrete. Since the hall is considered an unheated warehouse, hot-dip galvanized trapezoidal steel sheets were applied for the wall and roof covering. For the fenestration, aluminum windows and industrial gates were considered. The level of detail (LOD) of the model elements corresponds to LOD 300 (Figure 4), according to the LOD Specification published by BIMForum [67].
The parametric model starts from a single point in Grasshopper, and the elements are generated using simple editing functions. At this phase, the model consists of 3D lines, curves, and planes, which generally correspond to the center of gravity of the modeled structural elements (Figure 5a). The main variable parameters (Figure 5b) of the model and their minimal and maximal values are as follows:
  • Span: 10 m ≤ span ≤ 25 m;
  • Distance between frames: 4.5 m ≤ distance between frames (raster) ≤ 6 m;
  • Number of frames: 5 ≤ number of frames ≤ 20;
  • Height of the columns: 4 m ≤ height of the columns ≤ 10 m;
  • Apex height: 4.5 m ≤ apex height ≤ 25 m.
The cross section of the frame structure was defined according to the span using structural design approximations, which are described in detail in Section 3.2. The cross sections of the stiffening elements were consistent: Z200 × 2.5 was used for the purlins, RD25 for the wind bracings, and RHS100 × 5 for the ridge and eave struts. The thickness of the floor slab was 20 cm, and the dimensions of the plinth beam were 60 × 60 cm and 150 × 150 × 100 cm for the point foundations. Trapezoidal profiled sheets were used for the wall and roof covering with a profile height of 43 mm. Two industrial gates were applied in every case with dimensions of 350 × 350 cm, while the number of aluminum windows was equal to the number of frames, where the dimension was 100 × 360 cm.

3.2. Generation of Rules for Structural Design Approximation

In the conceptual design phase, the main dimensions of the structural elements are generally determined based on the architect’s experience or, ideally, based on cooperation with the structural engineer. The final sizes of the structural elements are refined during the design development, finalized in the construction document according to the updated architectural plans, and verified using detailed structural analysis. The design process is smooth if the applied dimensions fall within the range of early predictions and if there is no need for significant modifications. Since there are only a few design tools to help architects and engineers define appropriate structural dimensions in the early stages of a project, this method requires considerable professional experience from the participants.
Before the development of computational methods, structural engineers estimated the approximate depth of a structural member using “rules of thumb” [68,69,70]. These approximations were deduced from the regulations of the standards and were usually expressed in the ratio of the span. It is important to note, that there are many other variables (e.g., spacing of elements, loads, support system, etc.) that also influence the depth of the structural elements. However, these estimations can provide an initial value for the preliminary design phase from which further calculations and refinement can be made. The importance of these approximate methods has decreased with the appearance of computer software and its widespread use. Although structural design approximations do not replace static analyses and may include considerable uncertainty [71], they can be a powerful tool. On the one hand, they can help to estimate cross sections quickly and therefore improve the quality of the conceptual design documentation. On the other hand, the validity of the computer output can be evaluated with rational approximations.
The parametric modeling environment allows for building in these rules; therefore, the determination of the initial cross sections can be performed automatically. The proposed method includes the rules of thumb deducted from the EN Eurocode standards according to the different structural materials [69,72]. The equations for the approximate dimensions are determined separately for different structural elements (e.g., beams and columns) considering the requirements of the ultimate and serviceability limit states and using simplifications. For instance, it is assumed that columns are subjected to compression, where the relevant failure mode is the buckling, while beams are considered to be bent elements, where usually the serviceability limit state is relevant. In the latter case, the main goal is to reach maximal utilization but not to exceed the allowed deformation. Since the parametric model creates a network, with the help of these in-built rules, a change in the geometry (e.g., in span or height) will affect the applied structural dimensions and cross sections as well.
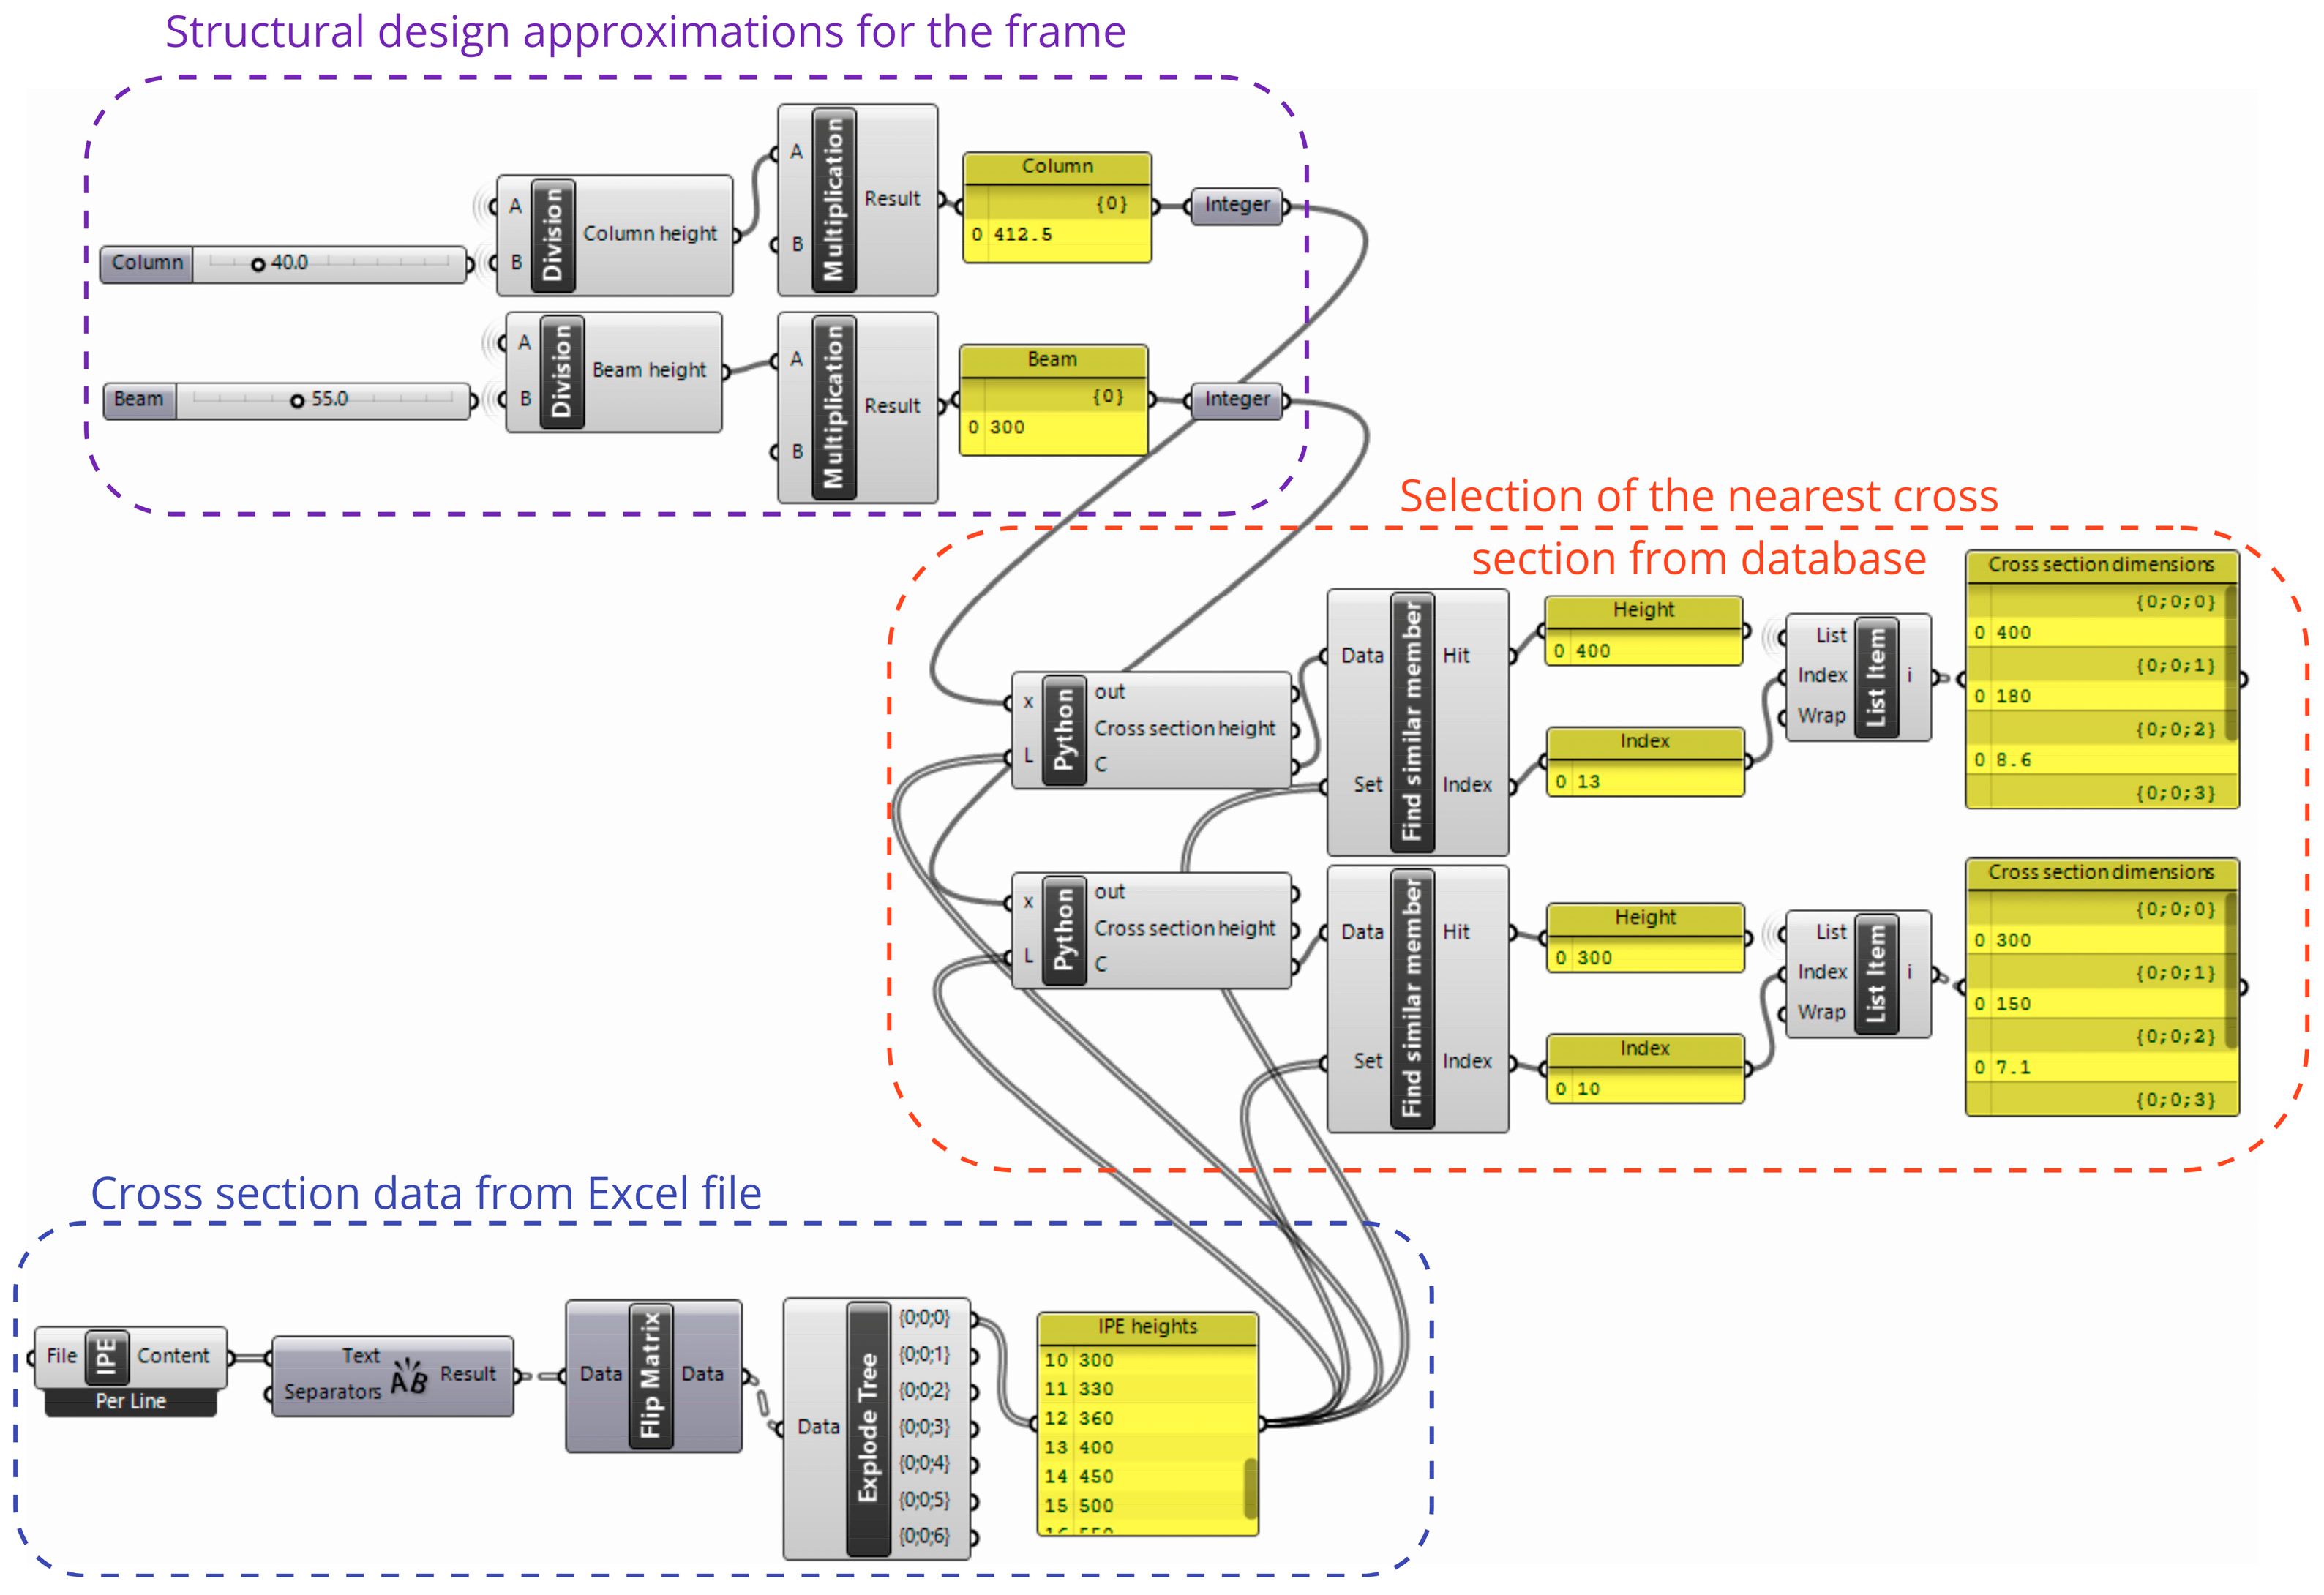
Figure 6 depicts the embedded structural design approximation rules, which determine the cross section height of the frame’s column and beam depending on the span. IPE profiles were used for the frame structure according to the EN 10365 standard [73]. The cross section height was:
  • L 40 for the columns;
  • L 55 for the beams.
  • In the above, L is the span of the frame.
The script references Excel files containing the standard profiles, their dimensions, and weight per meter length. Based on the calculated height of the cross section, the program finds the nearest standard profile and applies it to the structural elements.
In total, 48 different geometries were examined for the environmental impact calculation with the following variables:
  • Span: 16.5, 18.0, and 20.0 m;
  • Number of frames: 5, 6, 7, and 8;
  • Distance between frames: 4.5, 5.0, 5.5, and 6.0 m.
Table 1 shows the applied cross sections for the three different spans according to the structural design approximations.
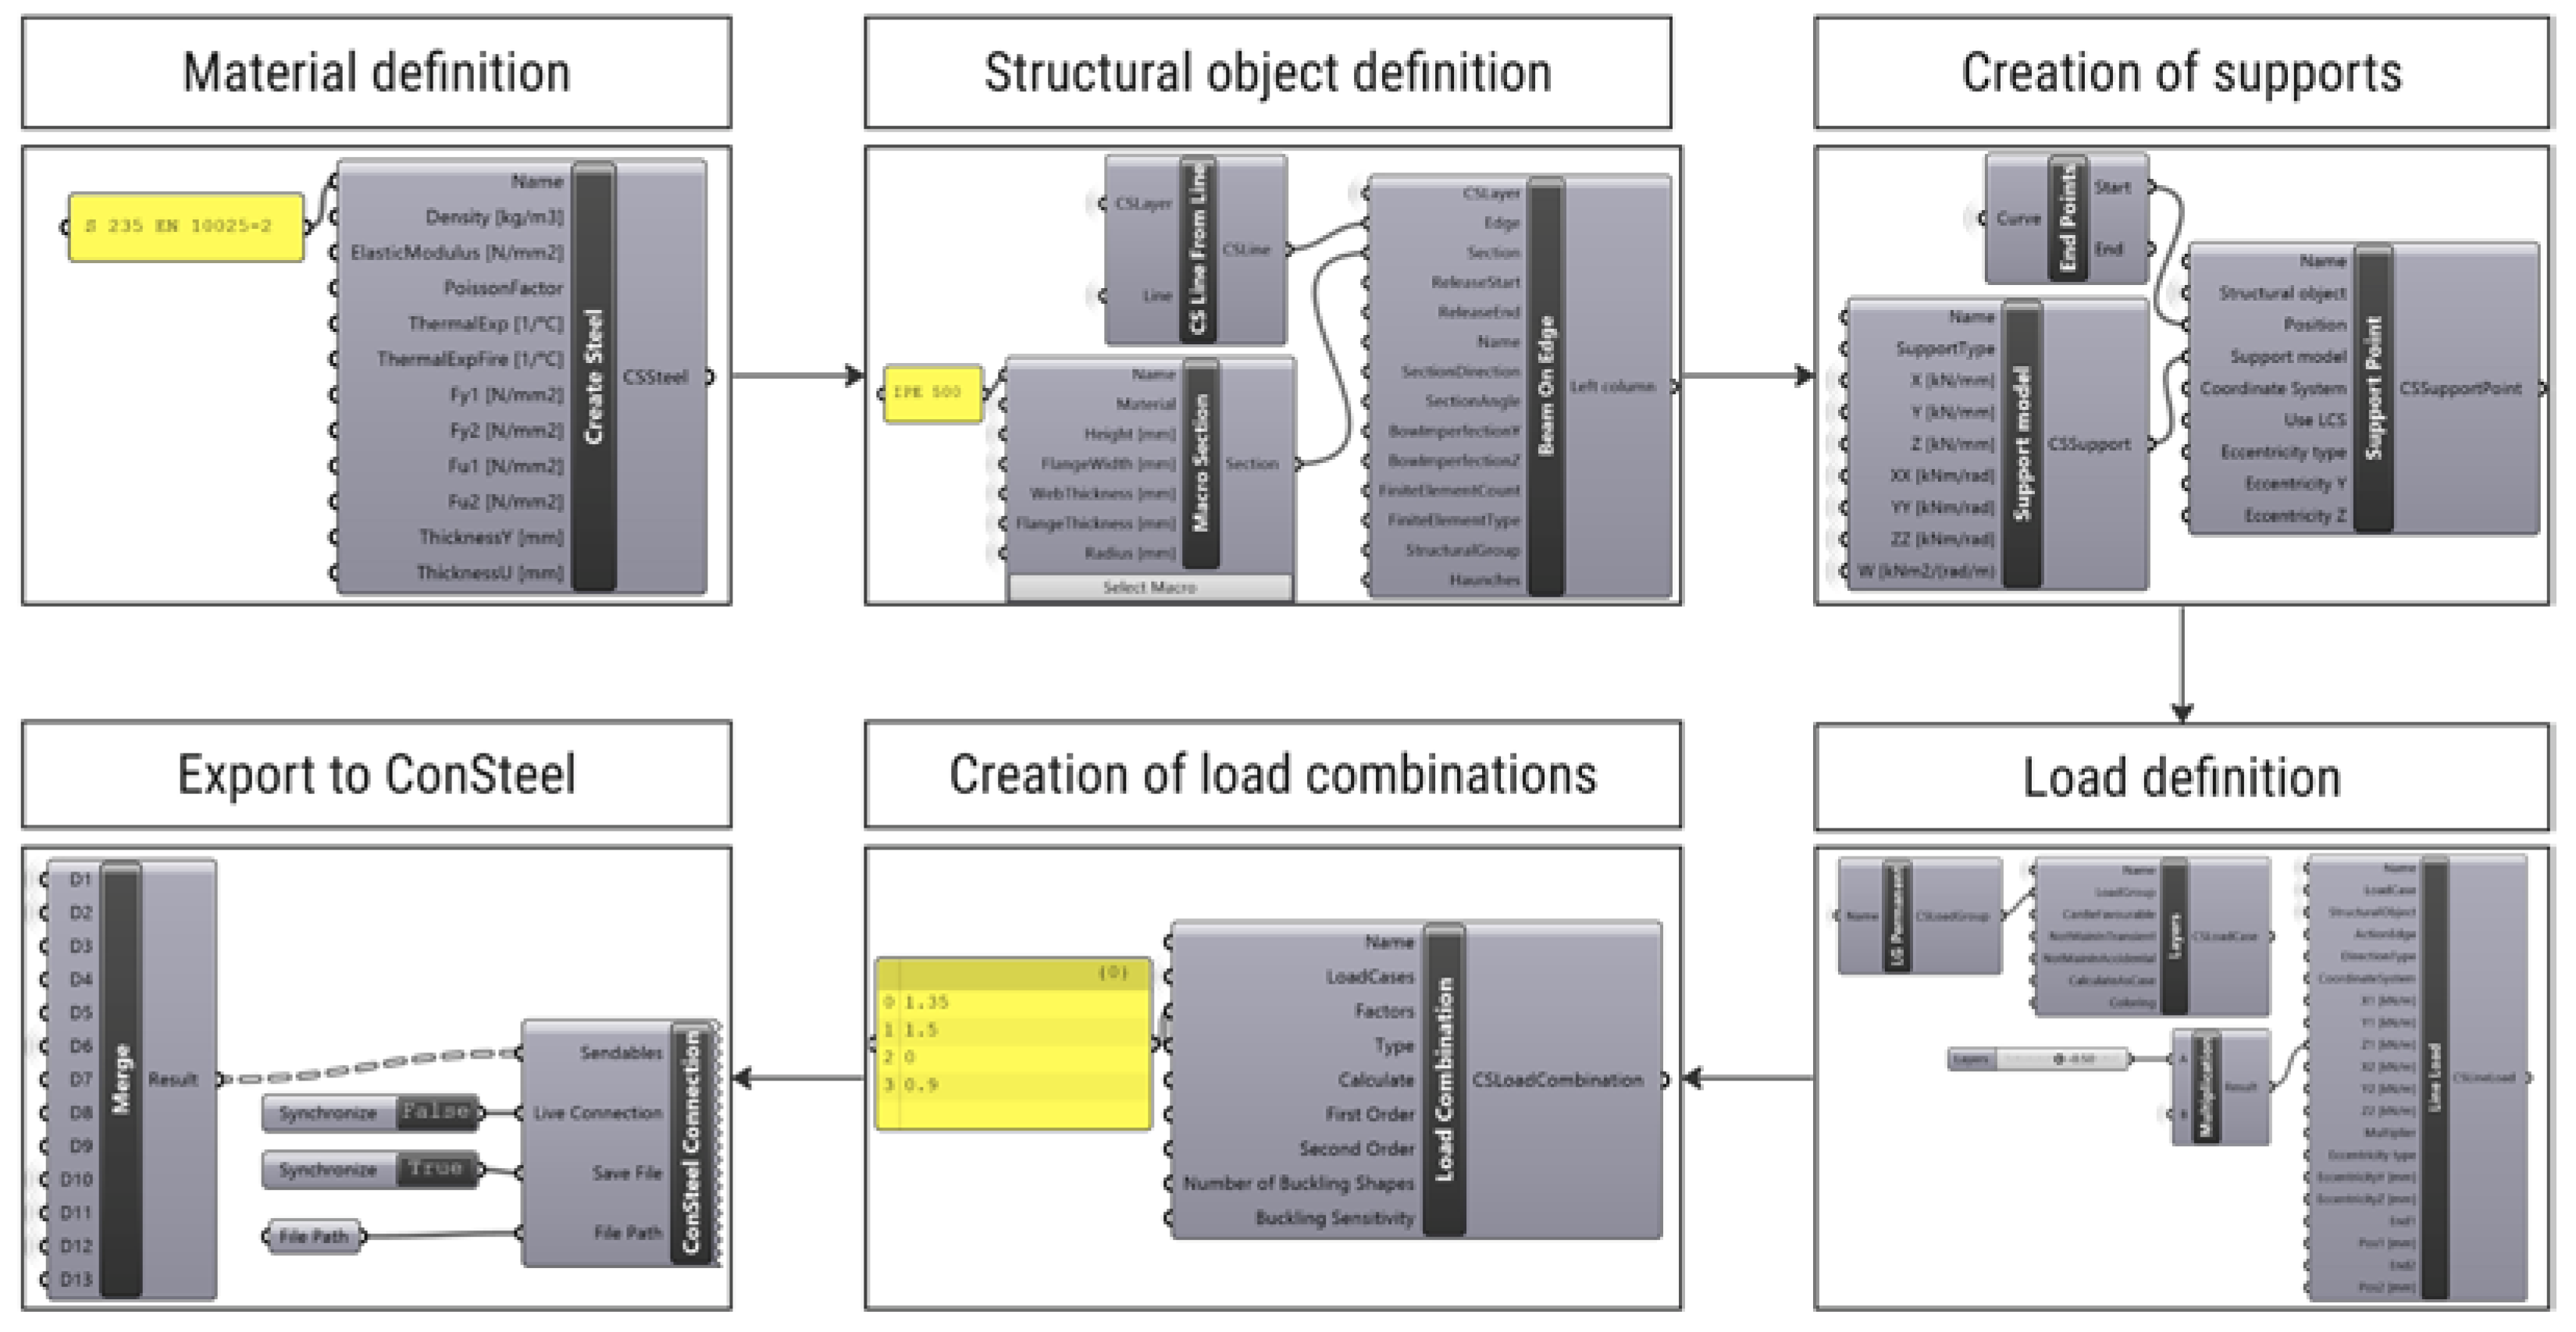
Grasshopper can be applied in a live connection with ConSteel using the Pangolin plugin; therefore, the conceptual structural model can be examined dynamically. The adequacy of the applied cross sections was checked using a 2D model for each span, where the purlins and other stiffening elements were considered as supports and the covering was considered as loads. The workflow for converting the parametric model into an analytical model is shown in Figure 7.
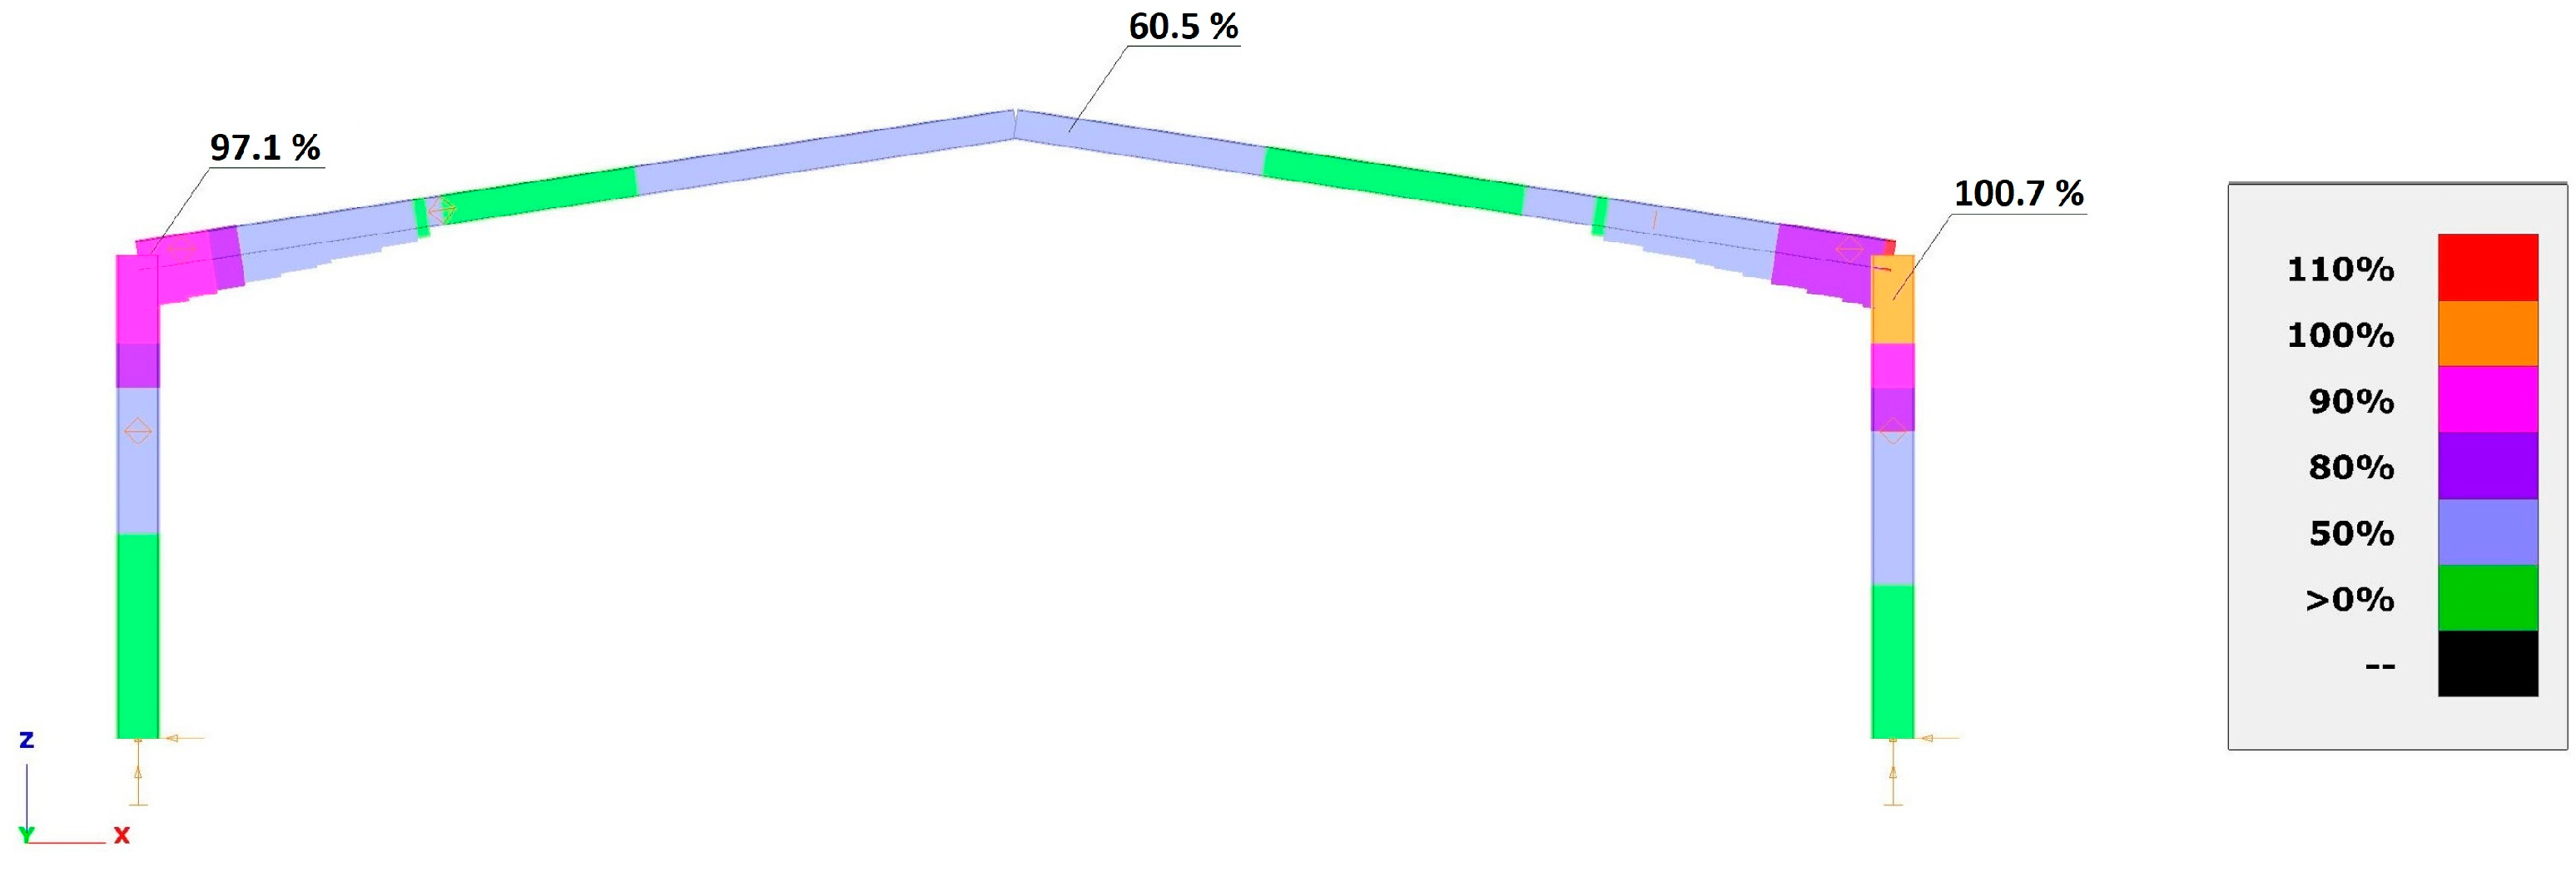
The model was checked for permanent loads (deadweight and layers), variable loads (wind load and snow load), and accidental snow load. Haunches were applied in the joint of the beam and column, which was neglected in the environmental impact analysis. Since the utilization of the cross sections (Figure 8) and the failure mode is similar for each span, the cross sections were considered to be adequate for the conceptual design phase. The detailed analysis of the structure should be the subject of the design development stage.

3.3. Generation of a Database for the Embodied Environmental Impact

In this study, the product stage of the life cycle is considered. Therefore, the following three modules were taken into account:
  • A1: raw material extraction and supply;
  • A2: transportation;
  • A3: manufacturing and fabrication.
Table 2 outlines the impact factors for the major building materials by environmental impact indicators: global warming potential (GWP), photochemical ozone creation potential (POCP), ozone depletion potential (ODP), acidification potential (AP), eutrophication potential (EP), abiotic depletion potential for non-fossil resources (ADPE), and abiotic depletion potential for fossil resources (ADPF) based on the standardized database of the ÖKOBAUDAT provided by the Federal Ministry for Housing, Urban Development and Building in Germany [10].
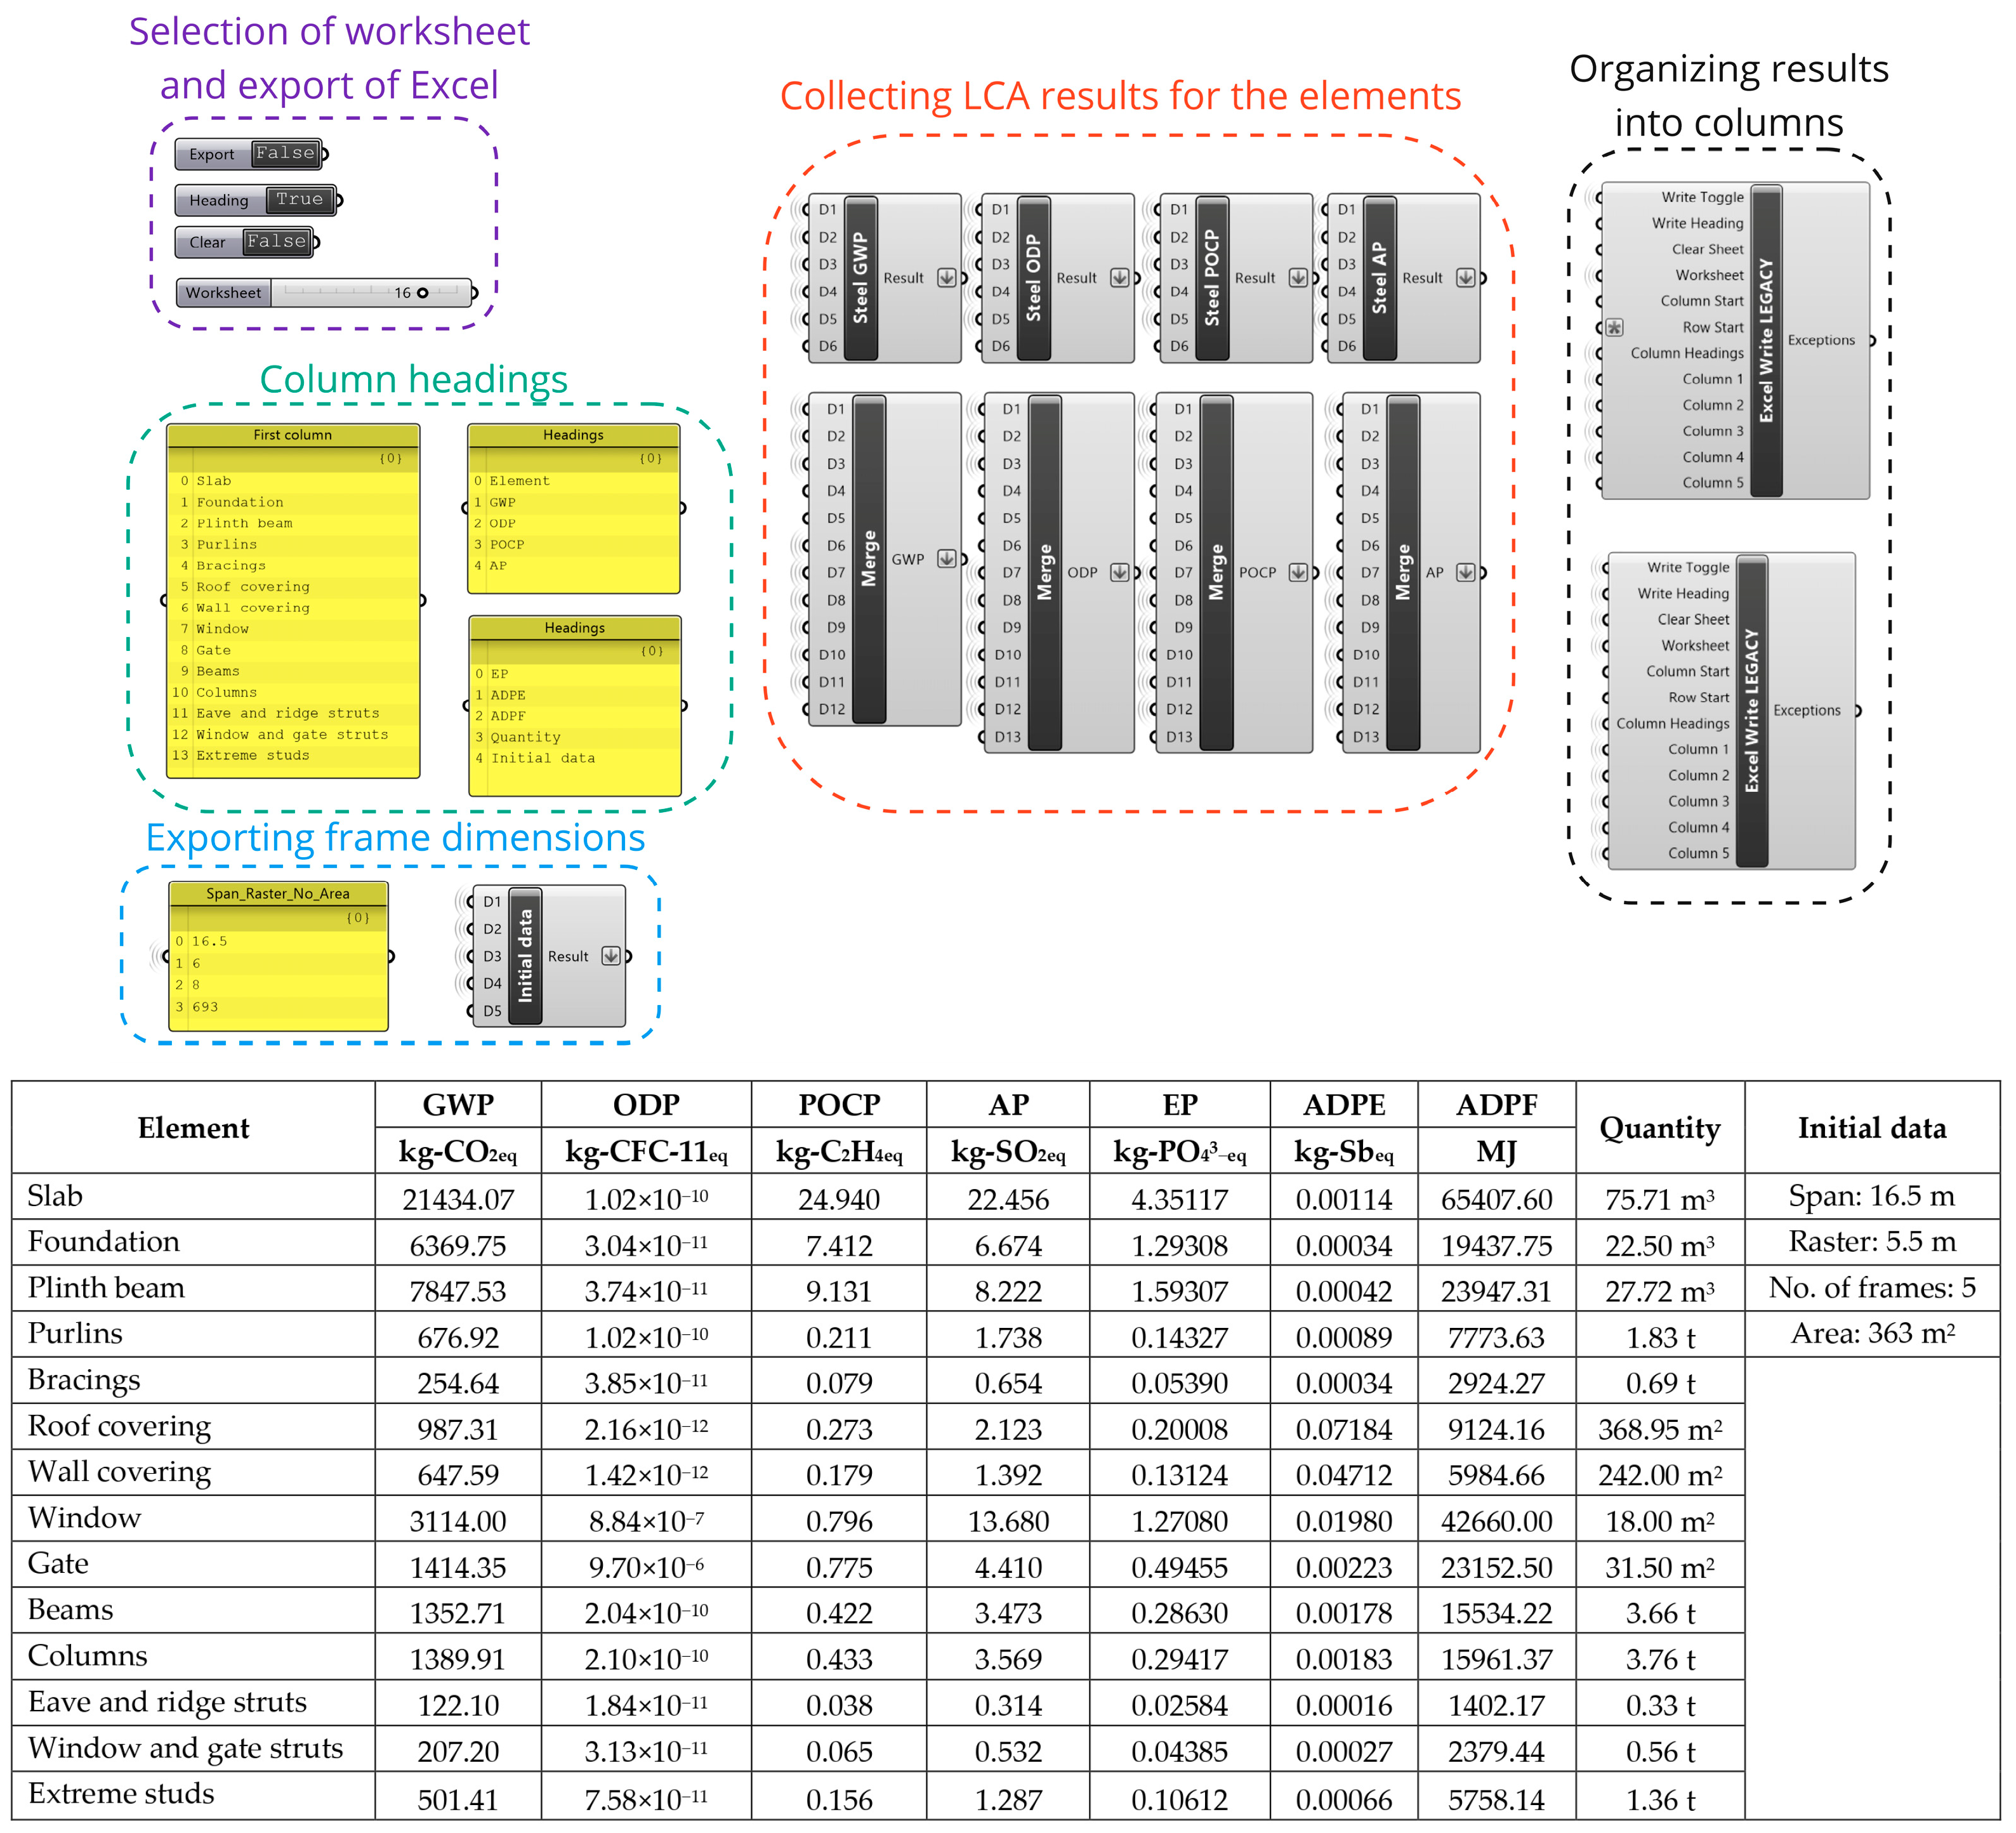
Figure 9 shows the link between the generated databases and the parametric model using Excel files. The quantities required for the environmental impact calculation were generated using Grasshopper. The volumes for reinforced concrete structures and the areas for the envelope elements were calculated based on the geometry, and the steel structures’ total weight was calculated using the length of the axes and weight/meter data from the referenced Excel files for each section type.
The embodied environmental impact of the different building parts was exported into an Excel file (Figure 10), and then the evaluation was performed (see Section 3.3).

3.4. Evaluation of Alternatives

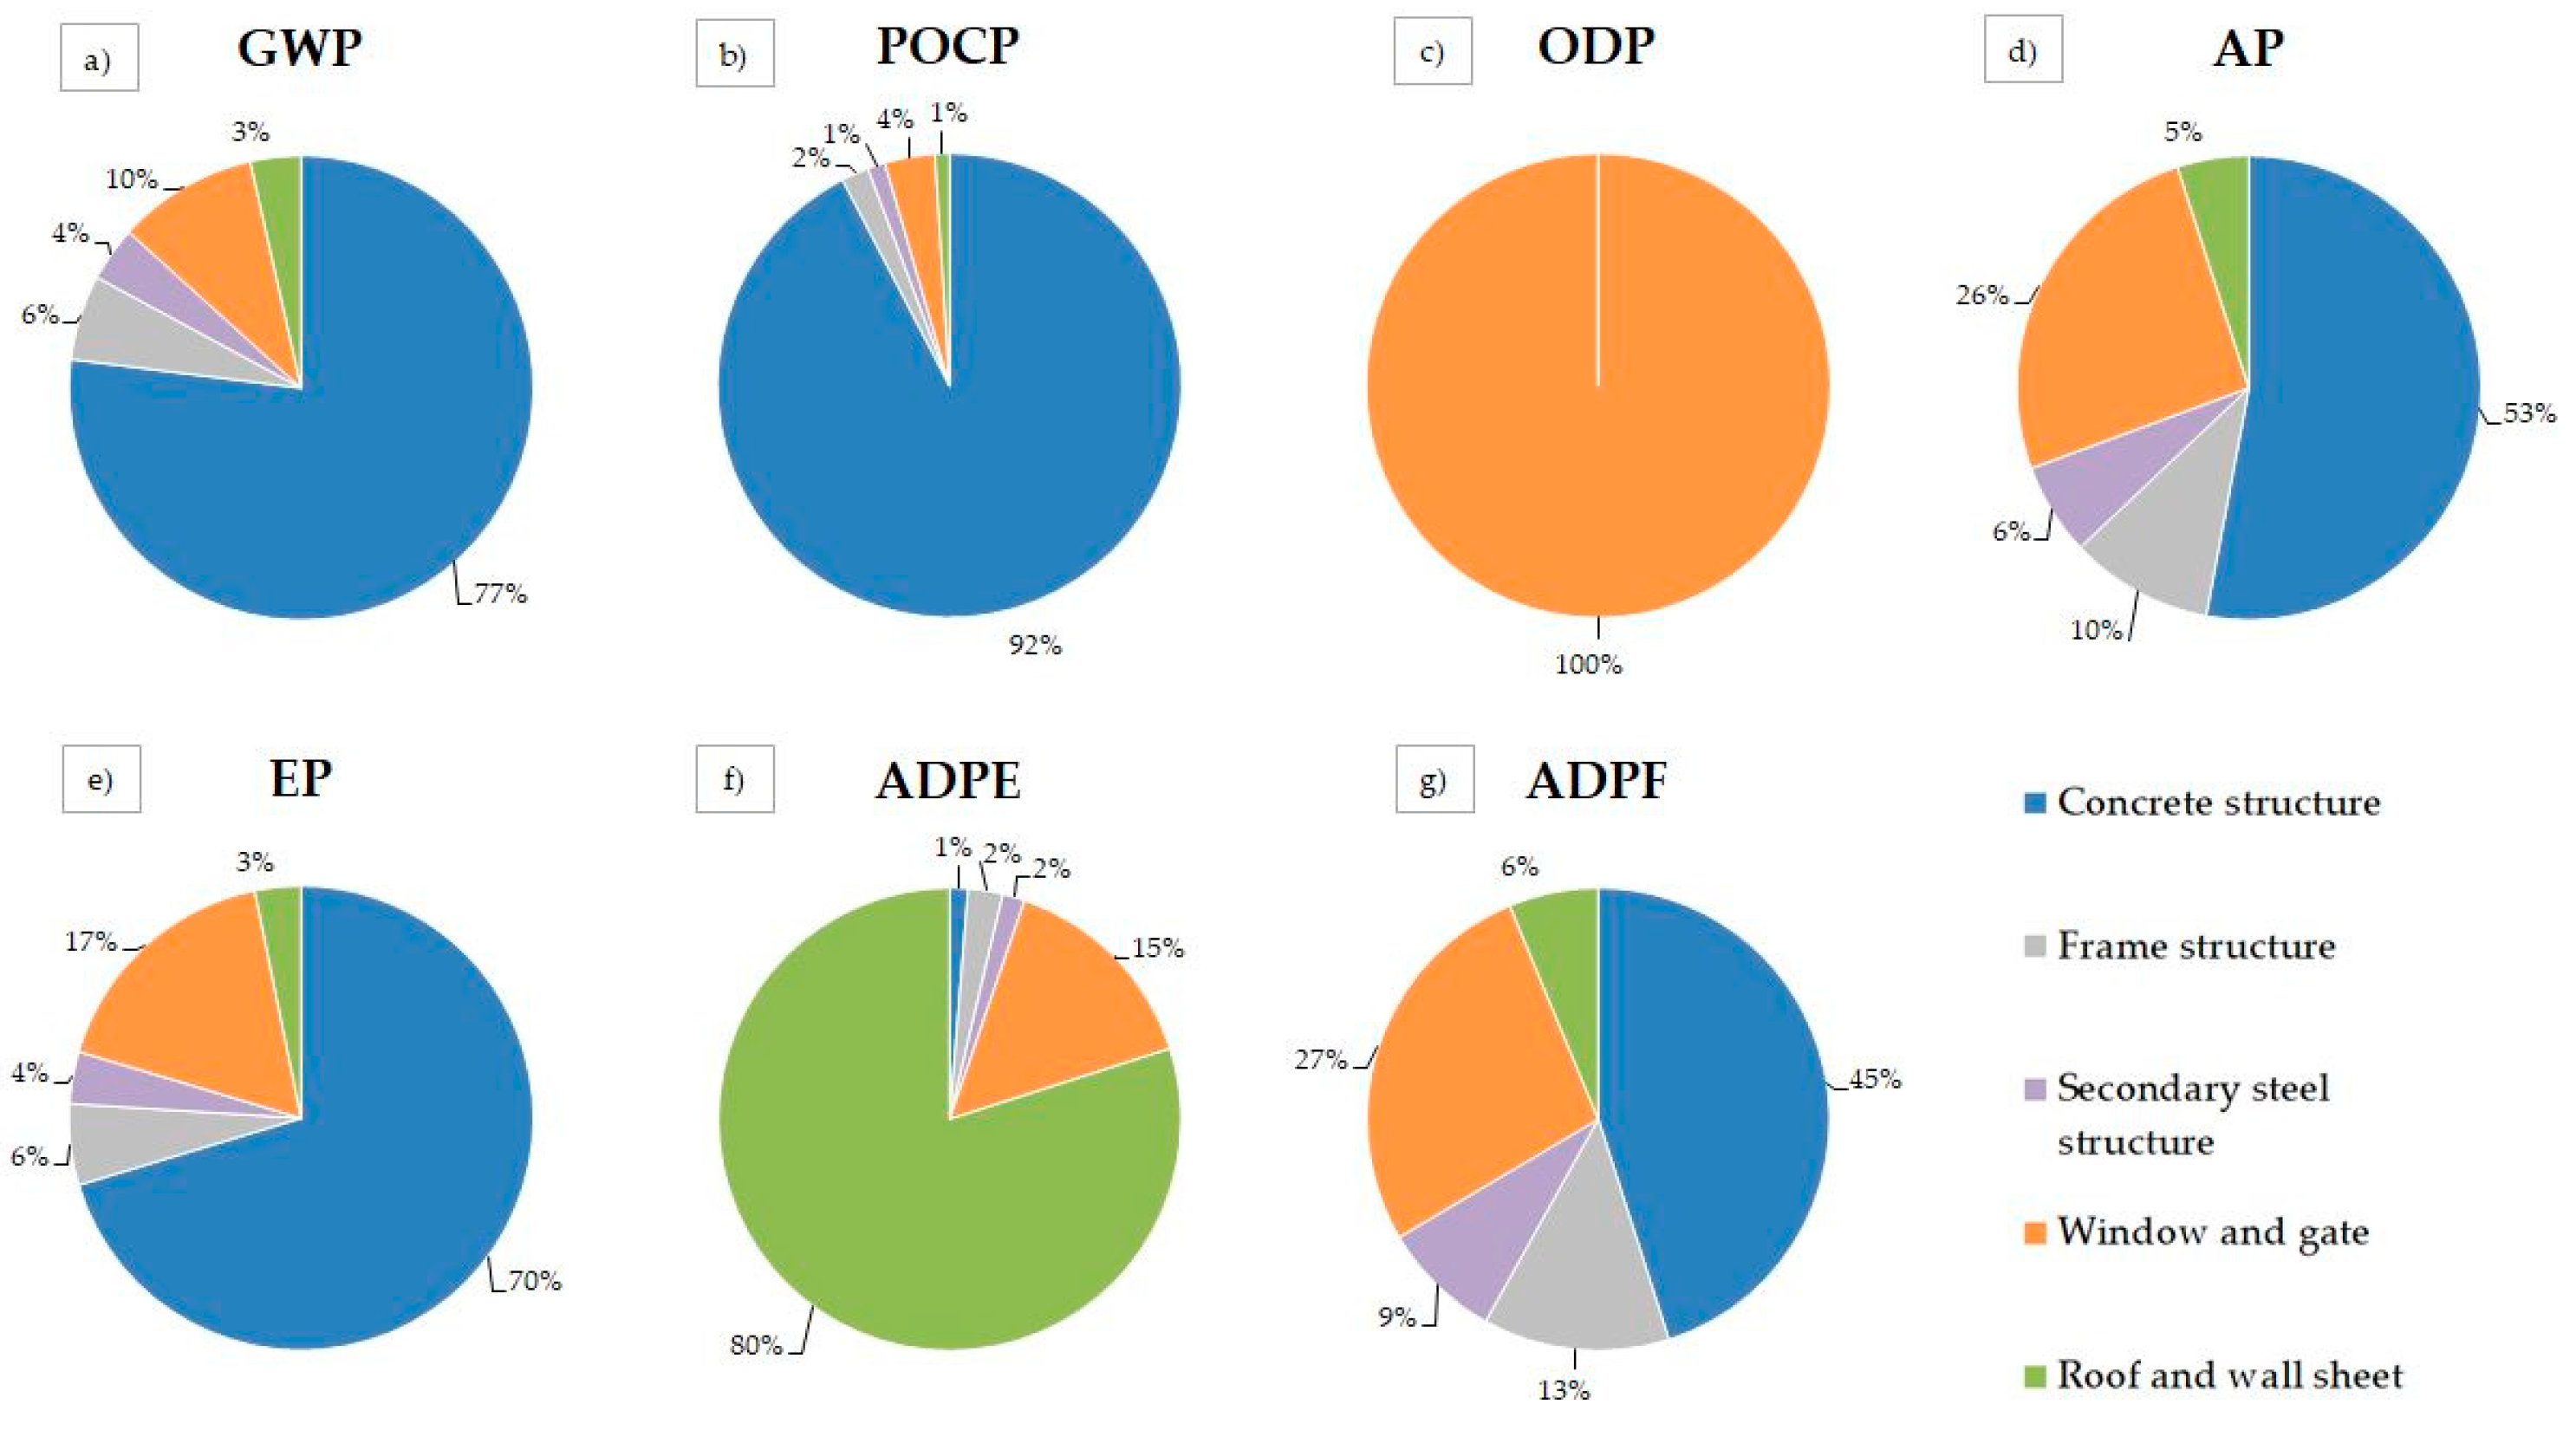
An examination was performed to analyze the contribution of the different building elements to each of the environmental impact categories, as shown in Figure 11. The data refers to a frame structure with a span of 16.5 m containing five frames and a raster of 5.5 m.
Concrete structures account for 77% of the total environmental impact in terms of GWP (Figure 11a), while primary and secondary steel structures contribute 10%, windows, and gates account for 10%, and the covering represents 3%. In contrast, windows and gates dominate the environmental burden in terms of ODP (Figure 11c), while concrete structures contribute the majority of the environmental impact in terms of POCP (Figure 11b). For AP (Figure 11d) and EP (Figure 11e), reinforced concrete structures contribute over half of the environmental burden, with steel structures contributing 16% and 10%, windows and gates contributing 26% and 17%, and covering contributing 5% and 3%, respectively. In terms of ADPE (Figure 11f), both covering and windows and gates play a crucial role. Similar proportions are observed for ADPF (Figure 11g) as in the case of AP. The contribution of the building elements to the environmental impact categories is very similar when the geometry (span, raster, number of frames) changes, and the difference is under 4%.
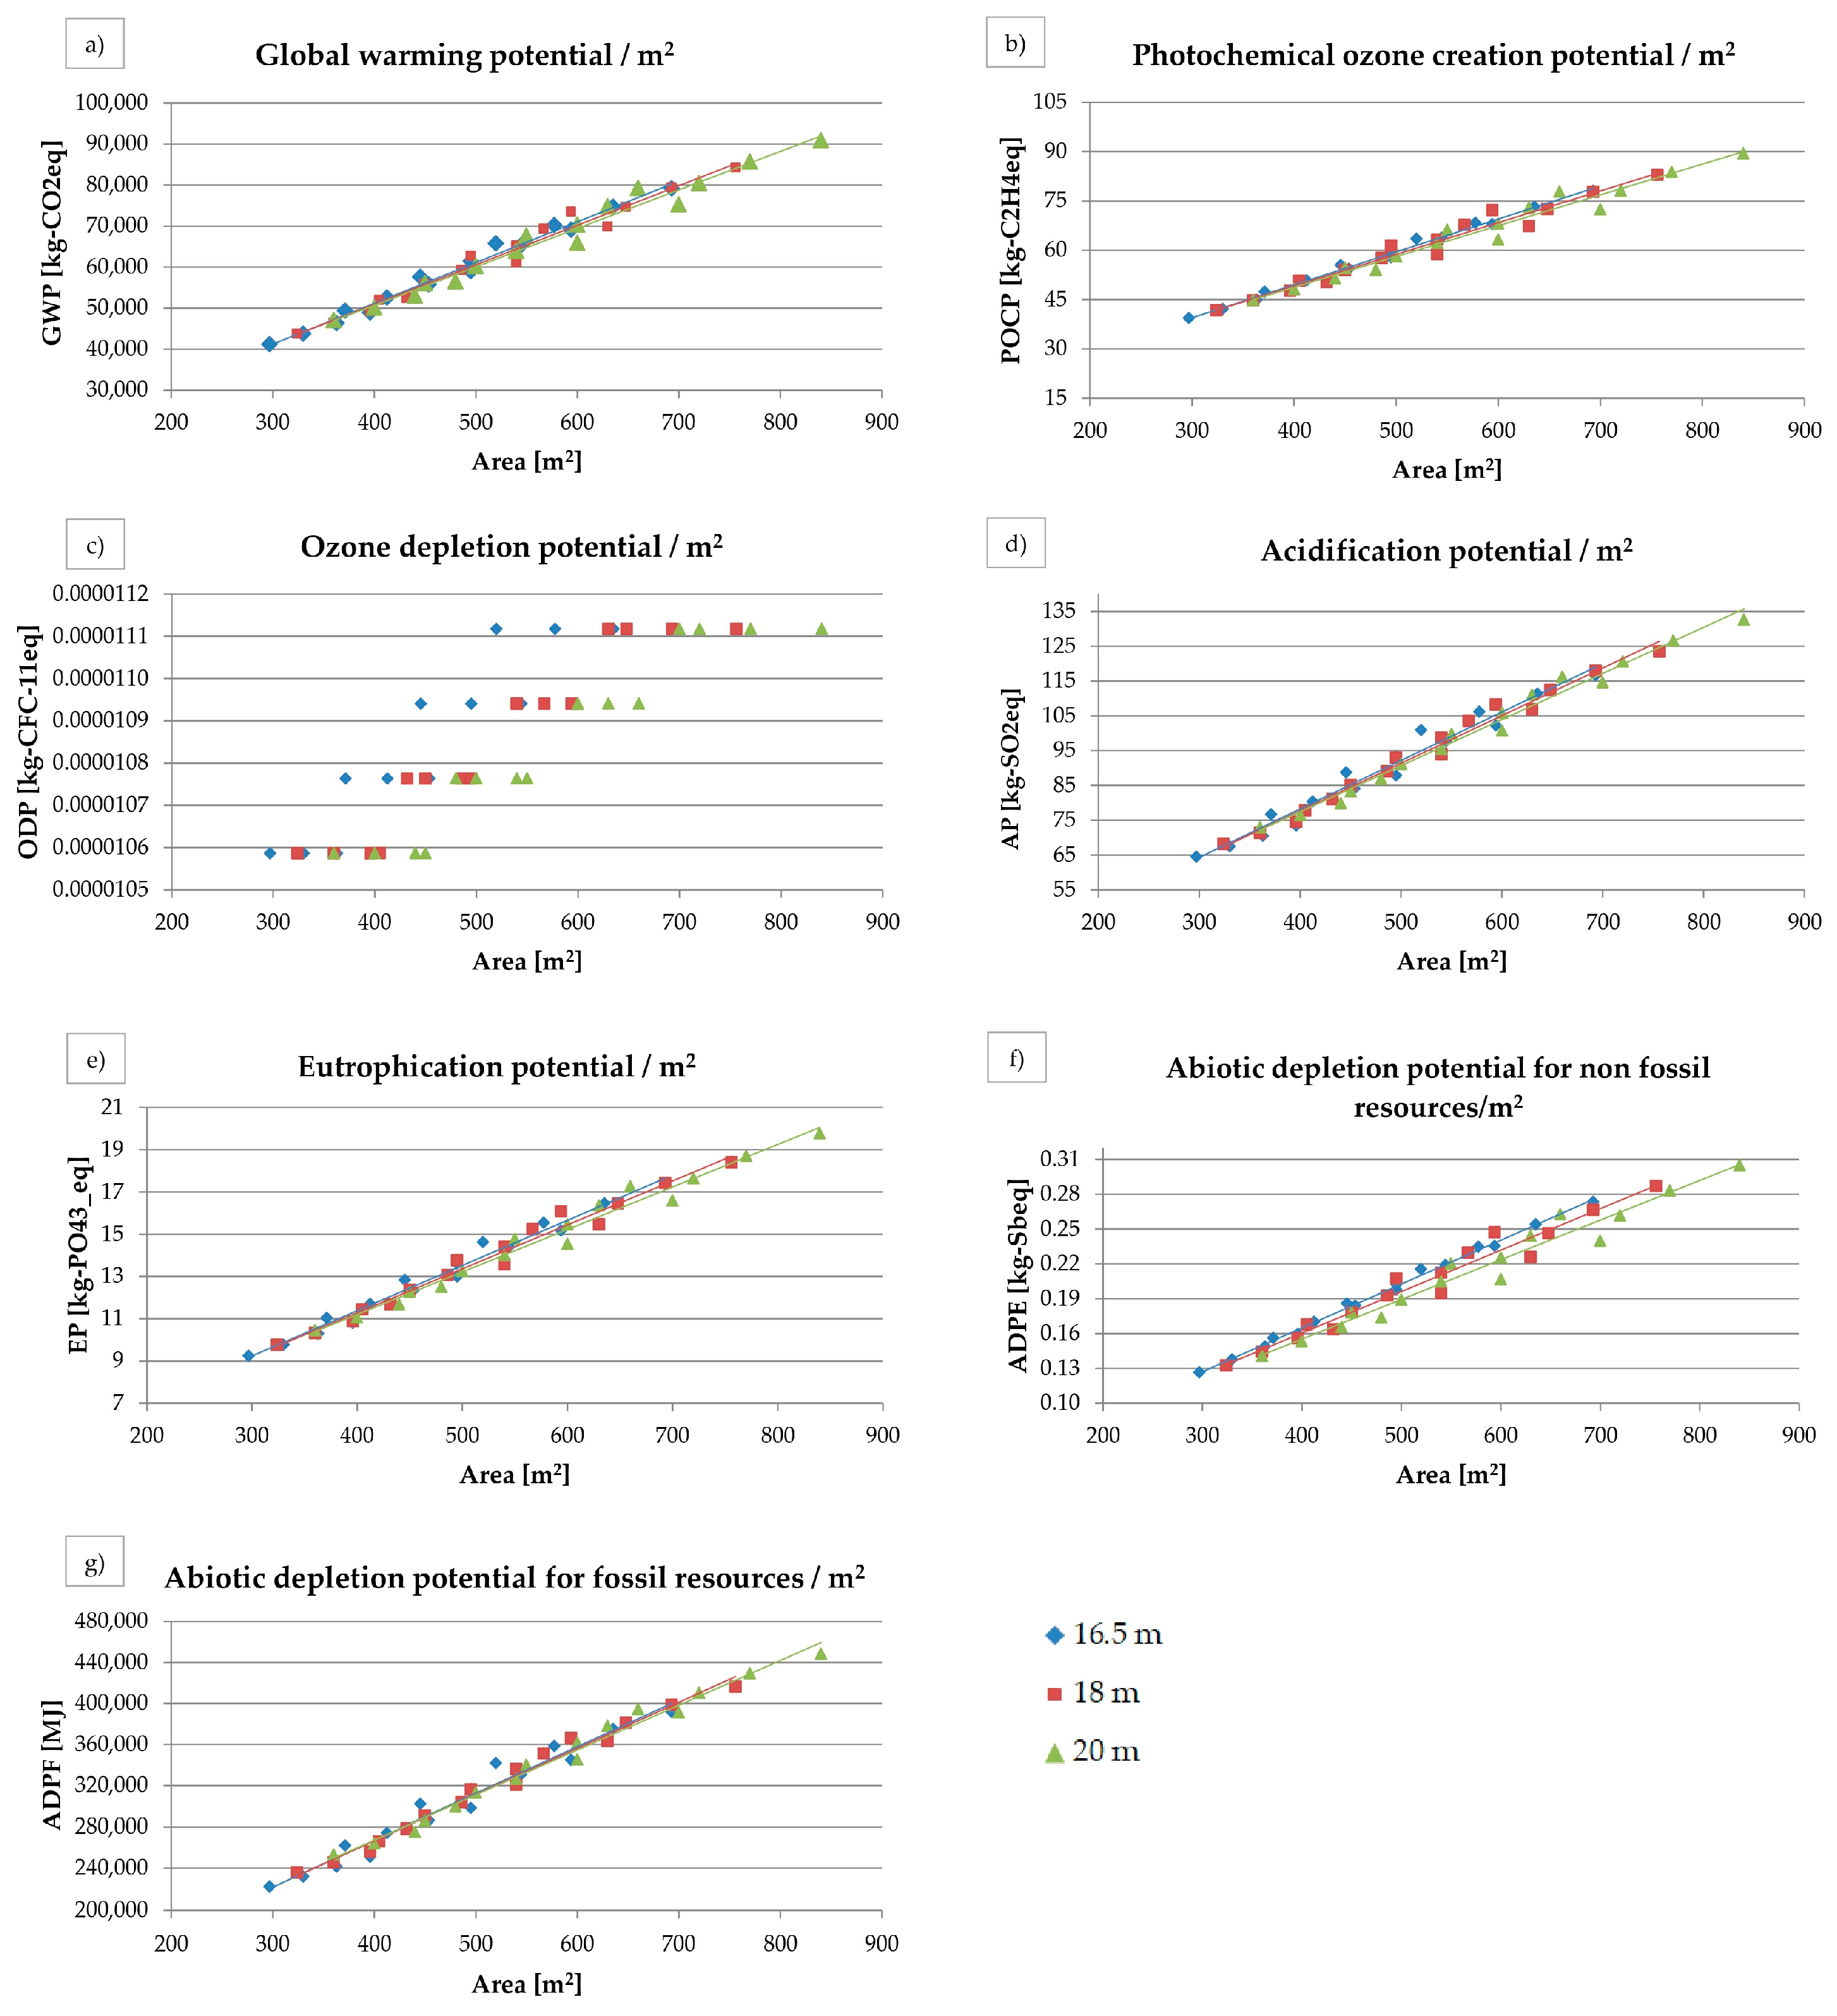
By examining the environmental impacts based on the span of the frame and the total area of the building (Figure 12), it can be observed that increasing the area leads to an increase in environmental impacts for all three spans. The rate of growth differs more significantly in the case of GWP (Figure 12a) and ADPE (Figure 12f). In terms of GWP and ADPE, the 20 m span frame structure yields the most favorable results. In the case of ODP (Figure 12c), there is a clear increase with the increase in the number of frame positions. This can be attributed to the fact that in the parametric model, the number of windows is equal to the number of frames, and among building elements, windows and gates contribute significantly to the environmental burden in terms of ODP.
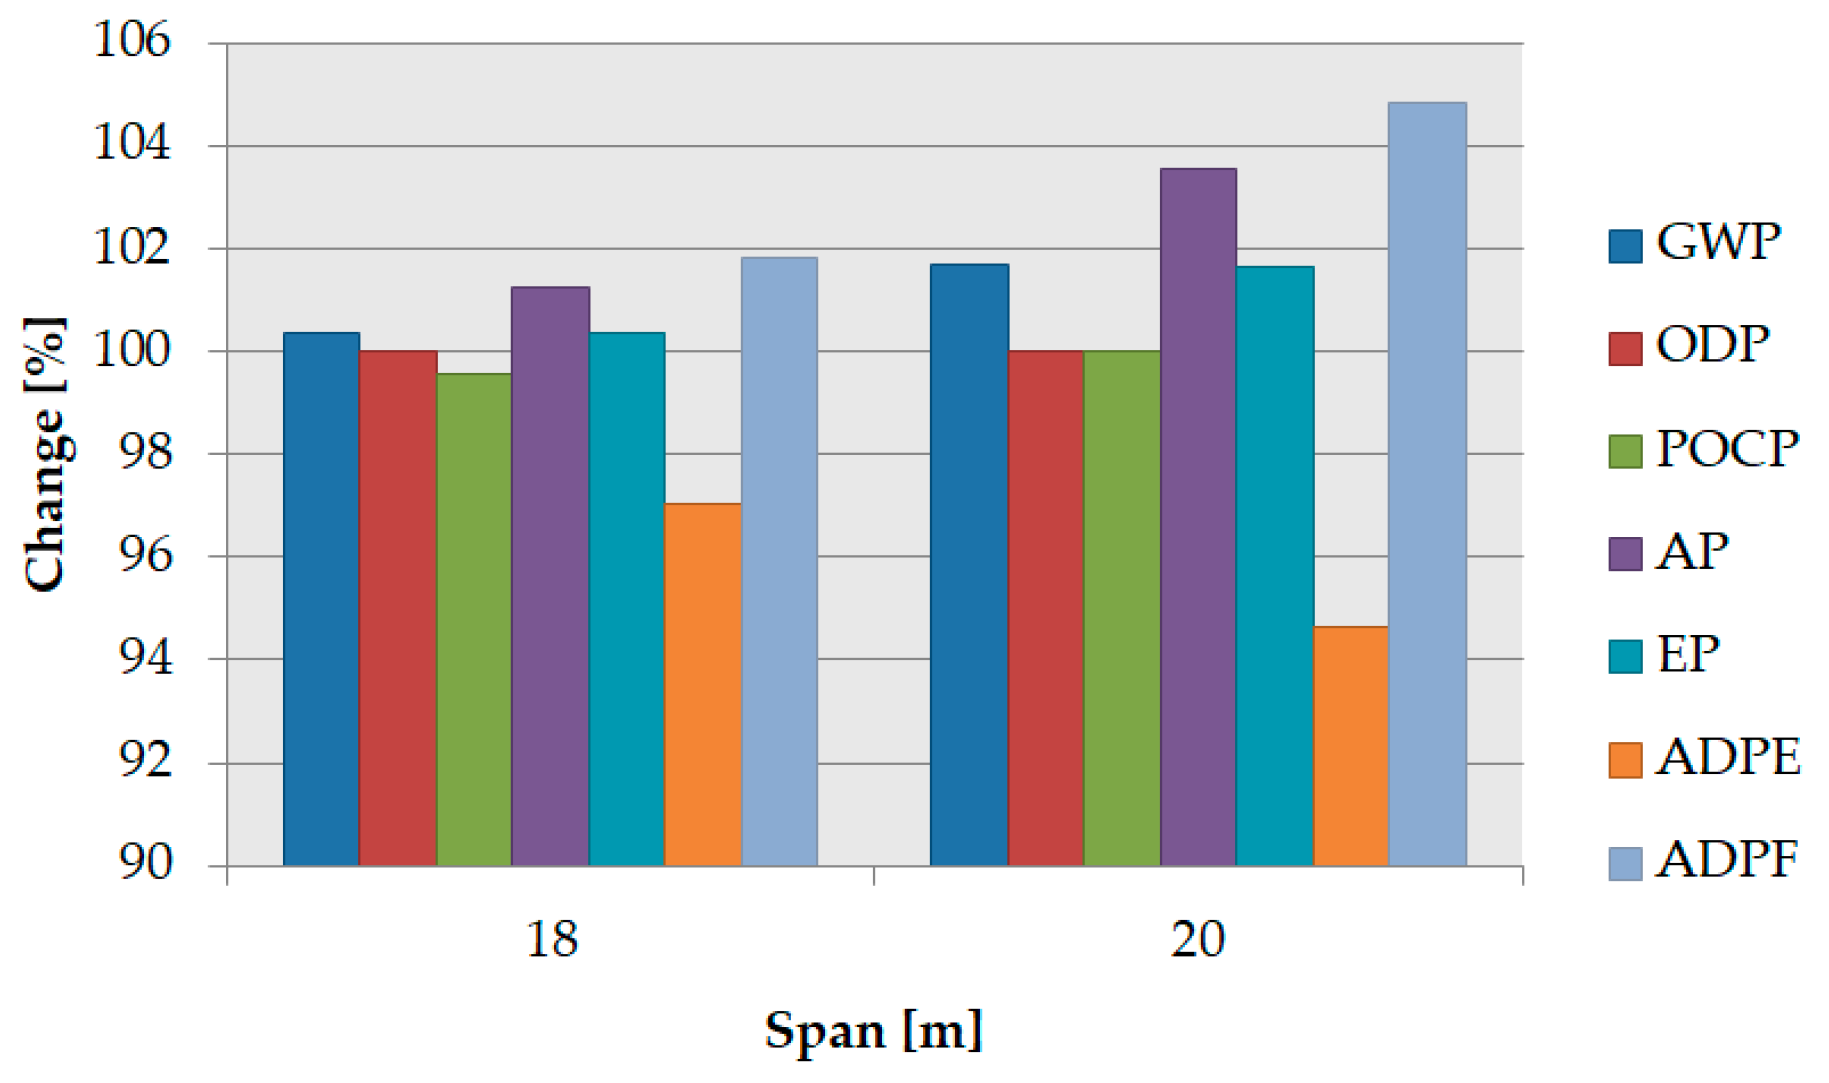
A change in the embodied environmental impact was examined depending on the span of the structures with nearly the same area. Figure 13 shows the results of the following three combinations relative to variation (a):
(a)
Span = 16.5 m, raster = 5.5 m, number of frames = 5, area = 363 m2;
(b)
Span = 18 m, raster = 5 m, number of frames = 5, area = 360 m2;
(c)
Span = 20 m, raster = 4.5 m, number of frames = 5, area = 360 m2.
It can be observed that only the ADPE decreases when increasing the span from 16.5 to 20 m, while ODP and POCP almost stagnate, and the values of the other impact categories increase.
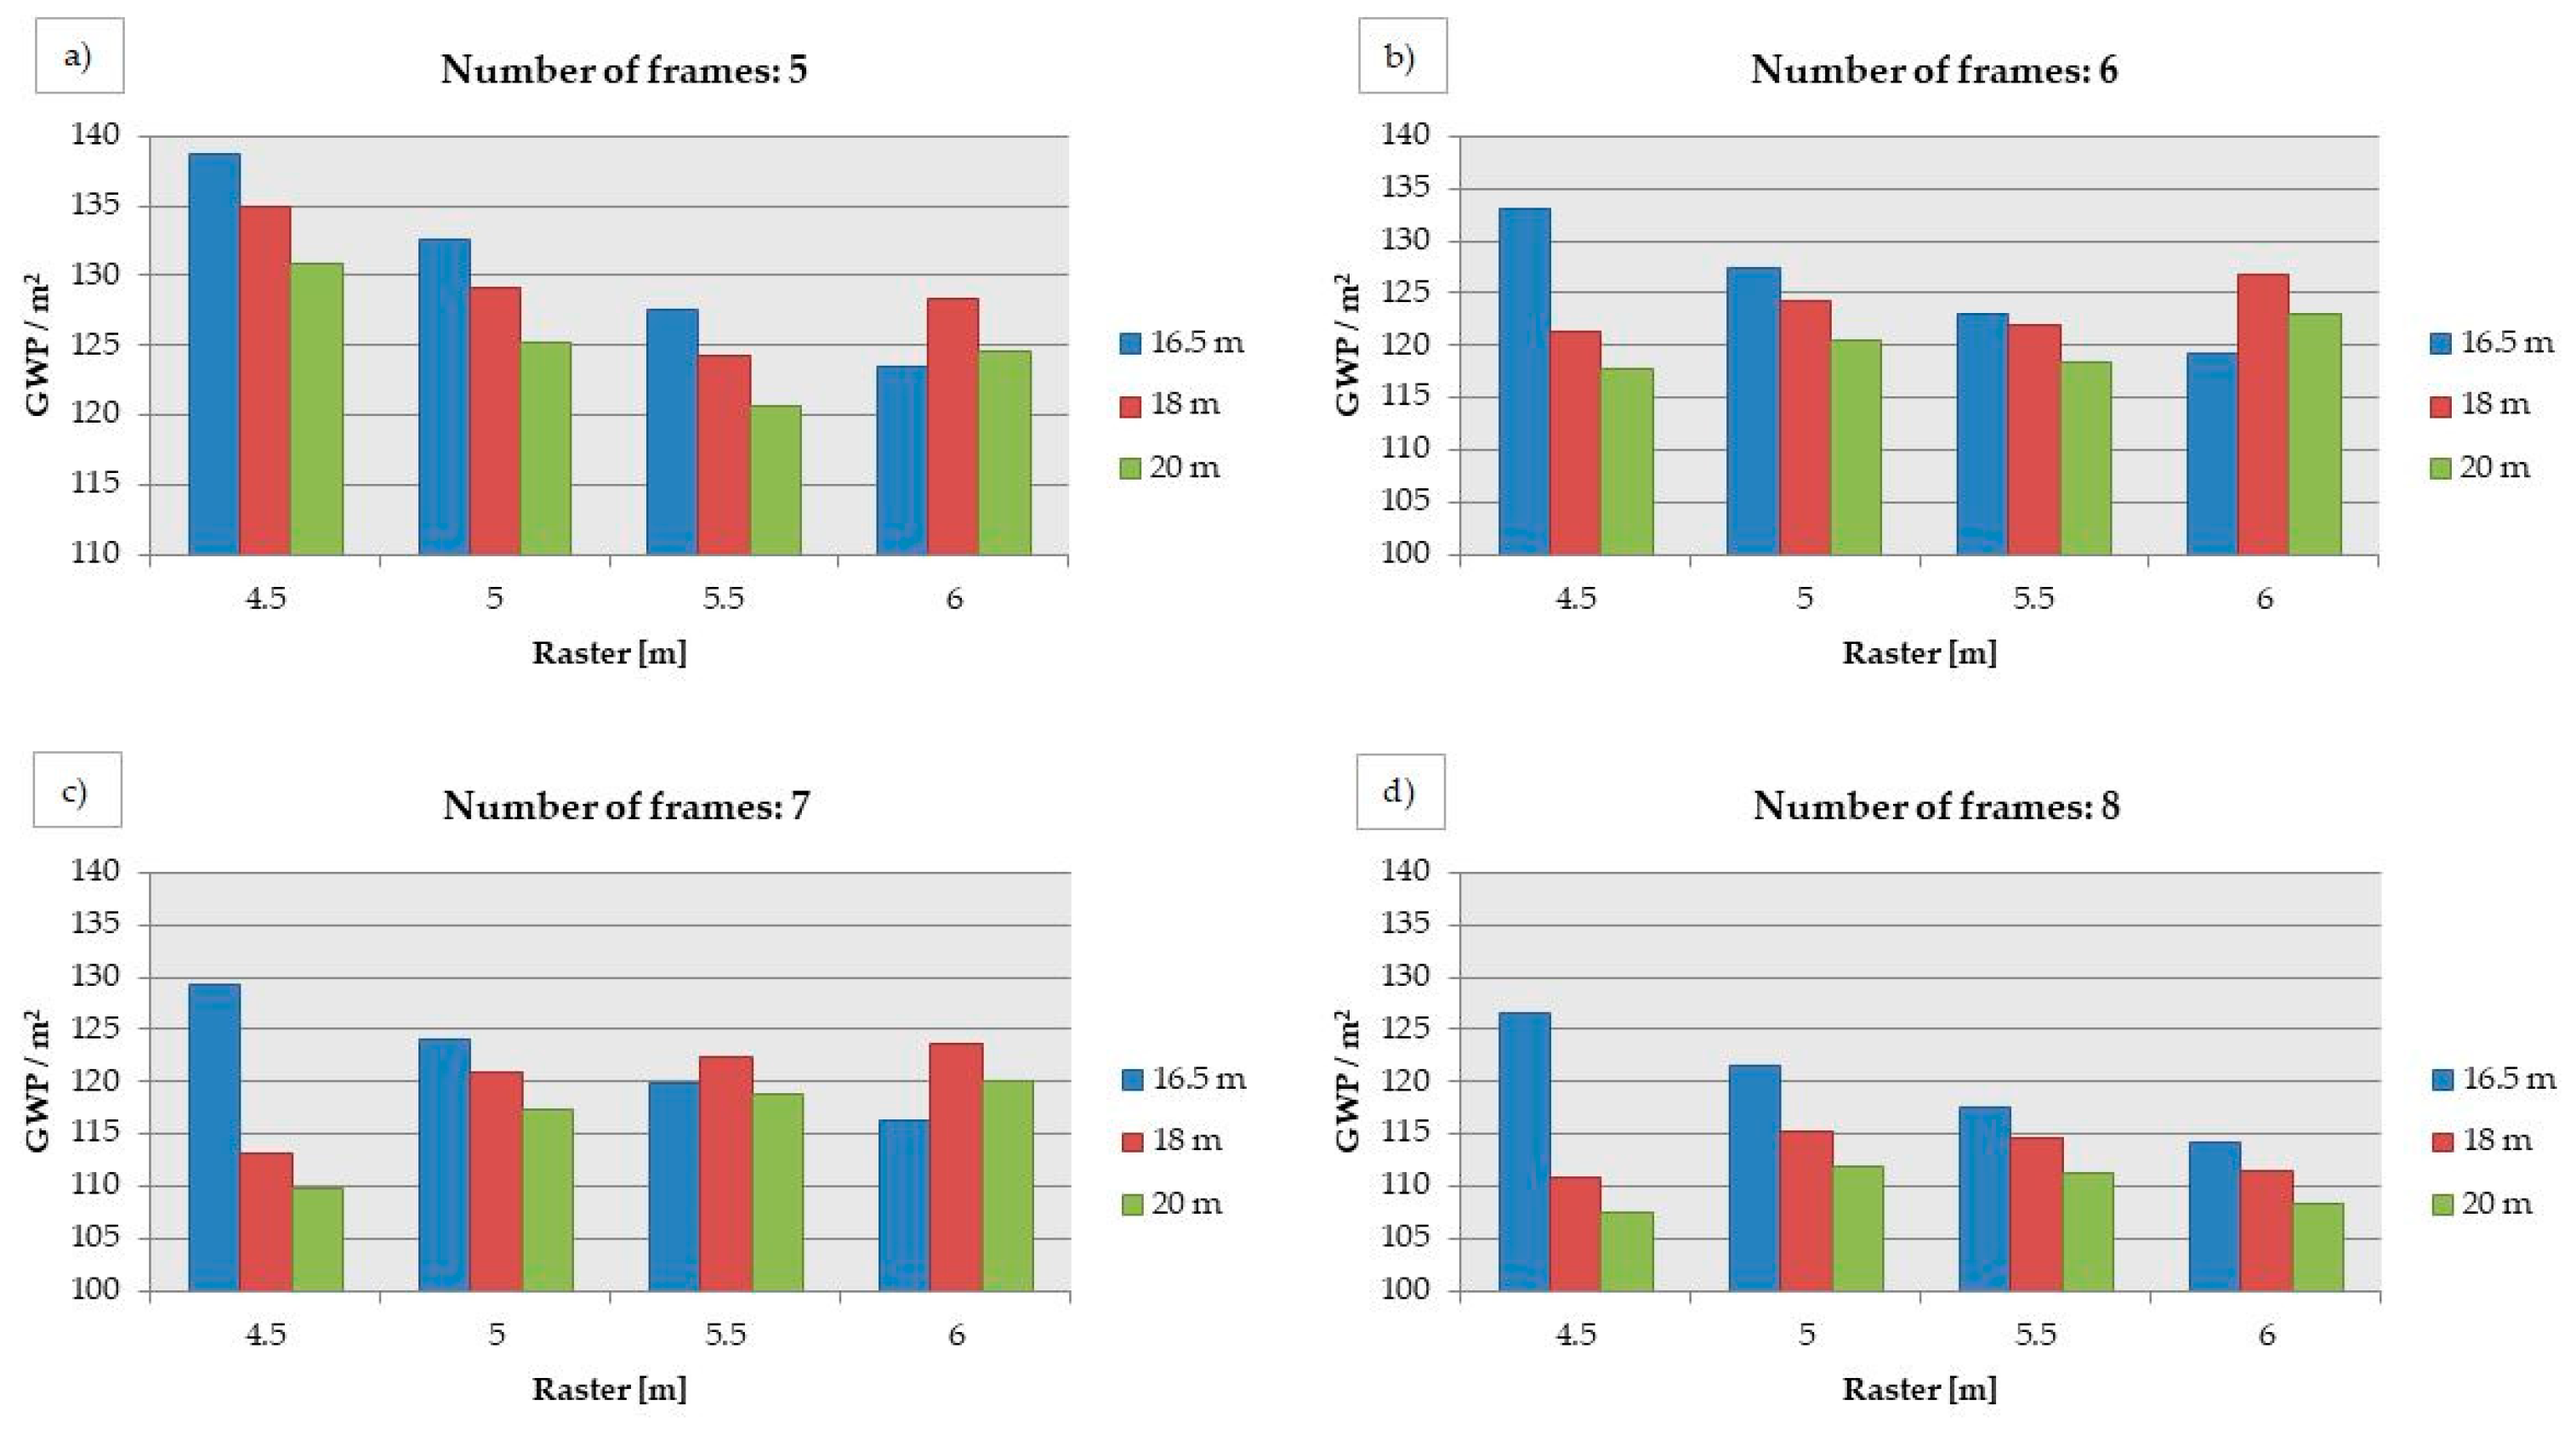
The effect of the number of frames and raster was examined on the global warming potential per square meter (GWP/m2), as shown in Figure 14. The frame with a span of 16.5 m shows a clear trend; an increase in raster from 4.5 to 6 m results in a decrease in GWP/m2 with an average of 10%, while an increase in number of frames from five to eight indicates an average decrease of 8% in GWP/m2. Different trends can be observed for frames with spans of 18 and 20 m. For five frame positions (Figure 14a), as the raster increases up to 5.5 m, the GWP/m2 value decreases, and then it becomes higher again in the case of 6 m. Among six (Figure 14b) and seven frame positions (Figure 14c), the highest values are obtained with a grid spacing of 6 m. The most favorable results are observed with eight frame positions (Figure 14d), where the lowest value is achieved with a frame structure having a span of 20 m and a raster of 4.5 m.

3.5. Use of the Parametric Model in a BIM System

The building information model was generated using the live connection between Grasshopper and Archicad 25. In this way, the geometry of the BIM model is driven using the logical and mathematical relationships and rules defined in Grasshopper in real-time. The parametric model—the centerlines and planes—was converted into Archicad objects, and information was attached to them referenced from Grasshopper (Figure 15).
The content of the attribute table for each Archicad object was connected to the classification defined in the Archicad system, which is also changeable and expandable. Therefore, the environmental data was attached to the objects directly from Grasshopper as new attributes (Figure 16). Since the live connection enables selecting the classification of the objects as well, it allows for the generation of the IFCs (industry foundation classes) file and the use of the attached information as IFC properties. Thus, the parametric model can be directly converted into a model applicable in the OpenBIM environment.
Furthermore, BIM software, including Archicad, is capable of generating automatic quantity takeoffs from the model, which allows for analyzing the environmental impact directly in the software by providing values of the environmental impact categories for each material or object. In this study, the BIM model was used to generate the structural plans (Figure 17) in Tekla structures with the help of the IFC format.
The entire Grasshopper algorithm used in this case study can be seen in Figure 18.

4. Discussion

This section presents the findings of the case study and the evaluation of the developed framework including its main advantages, challenges, and limitations.

4.1. Findings of the Case Study

The case study presents 48 alternative solutions for an unheated warehouse made of steel frames. The embodied environmental impact was analyzed for the production stage (A1–A3 module) of the life cycle depending on the applied span, the raster, and the number of frames. Based on the results, the contribution of the building materials and elements to the impact categories (Figure 11) is not influenced significantly by the geometry of the structure. However, this examination allows us to identify the areas with the greatest energy impact, the so-called hotspots. This is the ready-mix concrete for the GWP, POCP, AP, EP, and ADPF, which is in accordance with the results of Lee et al. [74], who performed similar examinations on an apartment building made of reinforced concrete. The impact of steel structures cannot be neglected either in the case of GWP, AP, EP, and ADPF. The covering made of galvanized steel sheet dominates ADPE, while windows and gates have the largest impact on ODP. The results for ODP significantly differ from those of [74], where the reinforced concrete also dominates. The reason for this is that the value of ODP for concrete material is considerably lower in the applied ÖKOBAUDAT than in the Korean life cycle inventory databases used in [74].
An examination of the impact indicators depending on the building’s total floor area and span (Figure 12) helps to find the optimal structural variation for the required area along with the lowest environmental impact. Generally, the most sustainable construction can be achieved with a frame of 20 m span as the indicator values per square meter are lower compared to the span of 16.5 m. The average difference is 5.3% for GWP, 17.3% for ODP, 5.5% for POCP, 6.2% for AP and EP, 8.0% for ADPE, and 5.6% for ADPF.
The other investigated aspects are the impact of the number of frames, the raster, and the applied span on the global warming potential per square meter (GWP/m2) (Figure 14). Although the greatest area (840 m2) can be reached with eight frames of 20 m span and with a raster of 6 m, the lowest GWP/m2 can be achieved with the same frame structure but with a raster of 4.5 m, where the area is 700 m2. Since reinforced concrete has the greatest contribution to the total GWP, its volume becomes significantly larger with increasing raster, leading to an increased total GWP. The applied cross section also has a significant effect on the impact category. For example, in the case of five frames and a raster of 6 m, the GWP/m2 value increases by 6.3% when changing the span from 16.5 m to 18 m. Although the area increases by 2.3%, the increase in the GWP of the steel structure is 43.4%.
These results draw attention to the complexity of LCA calculations even in the case of a simple structure containing a limited number of variables. The area of the building is influenced by the span, the raster, and the number of frames; however, the change in the span leads to a change in the applied cross sections. All of these variables have a direct effect on the environmental impact due to the changing quantities, but to varying degrees according to the contribution of the different materials to each of the impact categories. The manual creation and evaluation of these results is a very time-consuming task, where parametric design can serve as an effective tool to develop a comprehensive approach for environmental impact assessments.

4.2. Advantages of the Proposed Method

The objective of this study was to develop a framework (Figure 18) for the conceptual design phase, which supports generating and evaluating alternative structural solutions from a sustainability point of view. For this purpose, the parametric design method was applied using Rhinoceros and Grasshopper, which enables the manipulation of elements, such as building materials or dimensions, and the examination of their impact on environmental factors. Therefore, it allows users to perform quick analyses and use the results for real-time design decisions.
Another approach to creating geometry and reducing modeling and analysis time is developing element libraries. Lee et al. [74] proposed a green template for BIM-based LCA focusing on embodied environmental impact. The framework contains predefined parametric building elements organized in a library, for which Autodesk Revit was used. Although this method can be effectively used in the case of similar buildings and modular architecture, it limits the design freedom since the parametric nature only works at the object level, not for the entire model. In the proposed method, the rules controlling the geometry (Figure 18, 1. point) can be easily defined using visual programming language, which also enables inserting limitations and precise intervals for values or integrating unique scripts using Python, C#, or Visual Basic. The developed framework contains in-built structural design approximations (Figure 18, 2. point) to help define initial cross sections according to the EN Eurocode standard. The significance of rule-of-thumb has been underestimated since the emergence of finite element software. However, it can be an effective tool during the conceptual design phase, where structural engineers may not be involved in the design process yet.
In the proposed method, the information content of the model elements comes from Excel files using direct links (Figure 18, 3. point), which enables managing, sharing, and modifying object information in a seamless and structured way. For the environmental evaluation, the freely available database of ÖKOBAUDAT is used, which complies with EN 15804. However, the framework allows users to integrate any kind of material library or environmental product declaration (EPD) according to different countries and regulations. The calculation of material quantities is based on the Grasshopper geometry, and the results are assigned with the impact categories (Figure 18, 4. point). The LCA results are finally exported into Excel files (Figure 18, 5. point).
In the case of larger projects, several disciplines are involved in the design and construction process and thus the limitation of the applicable software solutions is an inefficient way for collaboration. Therefore, interoperability is one of the critical pillars for finding the optimal design solution [75]. Although the whole modeling and calculation process can be performed using Rhinoceros and Grasshopper, compatibility with additional BIM software is crucial. In this way, the generated model is applicable for further purposes represented as BIM dimensions [76,77] and can be utilized in the whole life cycle of a building. Furthermore, the application of environmental assessment is not yet implemented into commercial software solutions used in BIM [78], and the interoperability between BIM and LCA tools also needs to be significantly improved [35]. The findings present a practical tool that designers can use that is integrated within the BIM workflow, thus providing a possible alternative to BIM-based environmental analysis tools. Therefore, in the 6. step of Figure 18, the model is converted into a building information model using the Archicad live connection.
Although parametric modeling is a time-consuming process, it is not even necessary to parameterize each building component. This has to be considered in the environmental assessment since the live connection allows users to set elements in Archicad for further usage in Grasshopper. The modeling time can be significantly reduced by directly creating elements that are unlikely to change during the design process. However, with the explode function, Grasshopper is also able to retrieve parameters from Archicad components, from which the user can select for parametrization.
In the LCA workflow, calculating the material quantities (e.g., the creation of LCI) is the most time-consuming step, which also inherently carries the possibility of error, especially when it is performed manually [74]. Although the material quantities can be calculated with Archicad using lists and schedules, the feedback of results into Grasshopper for further usage is difficult. Similarly, the LCA calculation can also be performed using external software, but there are still many interoperability issues between LCA and BIM software tools [35]. Therefore, Säwén et al. [79] also recommend using the same platform for modeling and LCA calculation in the case of large-scale buildings due to the flexibility of the system enabling the quick adoption of the design changes and the possibility of integrating optimization algorithms.
The Grasshopper model is directly converted into an analytical model using the live connection with ConSteel provided by Pangolin (Figure 18, 7. point). Although this step is used only for conceptual structural analysis to check the cross sections and validate the structural design approximations, it can also be utilized in the design development phase to perform detailed structural analysis.

4.3. Challenges and Limitations of the Proposed Method

Findings from this study and the literature [74,75,78] suggest that there is a high level of uncertainty in the applicable software solutions and available datasets. The material libraries applied for LCA calculation may be confusing for designers in the AECO industry due to the large differences in the environmental impacts, as the production of raw materials or energy generation may vary in different regions. In this framework, the German database of ÖKOBAUDAT was used, which has, for example, significantly different values for reinforced concrete’s ODP compared to the Korean database used by Lee et al. [74]. On the other hand, only the product stage (A1–A3) of the life cycle is examined, while the operational energy use is neglected, which gives only half of the picture of the real LCA. Furthermore, the precision of the LCA results is highly dependent on the quality and level of detail of the model. According to [35,80], LCA calculations performed in the conceptual design phase often result in overestimation or underestimation due to the low LOD of building elements and lack of precise information. Therefore, data accuracy is a crucial point in the evaluation of the results. To answer this question, Gervásio [80] suggests calculating and evaluating the range of LCA results instead of exact values in early design stages. However, the proposed method is not limited to the conceptual design phase. Since the parametric model and the databases are in real-time connection with the BIM model, the effect of design changes also appears in the LCA results immediately. Furthermore, with an improved level of development of the model, the designer can yield more accurate LCA results as well.
The demonstrated case study represents a basic example of the application of the method, as it involves a limited number of elements and uses only a few different materials in the model. This type of building belongs to the right side in the classification of Figure 2, which means that the focus is shifted toward the structure and the form receives less attention during the design process. In this case, the design freedom appears mainly in manipulating the geometrical dimensions and the applied materials. However, the proposed method can be applied to other building types considering the increased complexity of the system. As is widely known, creating complex or free-from shapes is one of the main benefits of parametric design [81], where a higher level of design freedom can be achieved from both an architectural and structural point of view. The complex geometry undoubtedly leads to increased modeling time and, therefore, a large number of elements and applied materials can also result in more difficult data management. The modeling efficiency can be improved when the parametric design is applied in modular architecture [82,83], where the number of variables to be handled is limited due to the repetitive elements.
Regarding the modeling efficiency, it should be noted that the Grasshopper plug-ins (e.g., the Archicad and the Pangolin) usually have unique material libraries; therefore, the building materials must be chosen several times from different databases. Although the material properties for LCA come from the Excel files, this dataset cannot be directly applied for defining the material with the Archicad or Pangolin plug-in, leading to more difficult change monitoring. However, this shortcoming can be overcome by integrating scripts for the automatic material selection according to the referenced database.
Another challenge is the lack of a two-way connection between Grasshopper and ConSteel. The export of the analytical model built with the help of Pangolin is already a smooth process; however, the results of the structural analysis cannot be automatically sent back, which hinders the integration of optimization algorithms. For this purpose, it is recommended to use in-built structural analysis, for example, with the help of the Karamba3D plug-in.

5. Conclusions and Future Work

In the present study, a parametric BIM-based method for the calculation of embodied environmental impact was developed, and its application was demonstrated using a case study. The proposed framework includes the generation of geometrical variations, the automatic definition of initial cross sections for the load-bearing elements based on in-built structural design approximations, the datasets for the embodied environmental impact of the used building materials, the generation of life cycle inventory, the automatic calculation of LCA results based on the geometry, and the conversion of the parametric model into building information model.
A case study analysis showed that selecting the optimal solution is a challenging task due to the complexity of the LCA process, where the results of the impact categories are affected not only by the geometry but also by the proportions of the used materials, which are influenced by the span and thereby the dimensions of the load-bearing structures as well. Due to the automatic definition of the cross section, the method enables analyzing the effect of different structural variations on the embodied environmental impact.
A framework like this could offer important insights during the early design phases, revealing the areas with the most significant environmental impact depending on the geometry and used materials. Additionally, it can also be used to draw attention in the AECO industry to the potential effects of design decisions due to the high degree of interactivity [78]. In the OpenBIM environment, utilizing Grasshopper, which enables parametric geometry and data input, along with dynamic live connections and numerous export options, can function as central software for design. With this method, it is possible to quickly generate and analyze multiple alternative solutions. With the traditional design method, once the model is created and the analysis is run, any design change leads to the repetition of the process, which is very time-consuming [60]. Furthermore, the resulting BIM model is suitable for further model-based simulations and efficient handling of design decisions. Although parametric design requires experience and time, the invested extra effort will be worthwhile if the benefits of the method are utilized to considerably improve the performance of the designed building, as can be seen in many examples in the literature [23,57,60,62,63].
Based on the limitations and challenges of the proposed method described in Section 4.3, it can be improved in the future in several directions. Since only the production stage was considered in the LCA calculations, the integration of the following life cycle stages is necessary to achieve a comprehensive approach. Furthermore, additional rules for the structural design approximations need to be integrated into the system, which allows users to create various structural element types (e.g., trusses, cantilevers, shell structures, etc.) with proper initial cross sections. In this way, the framework can serve as a design support tool, which helps architects to define appropriate structural dimensions in the early design stage, leading to a reduced number of significant changes in later phases.
A definition for the environmental characteristics of building materials was completed manually using Excel files; however, several plug-ins are available for Grasshopper, which can be used for parametric LCA. For example, thirteen tools and their qualitative evaluation can be found in the study of Säwén et al. [79]. To utilize the substantial analytical capability of the used software environment, the framework can be further developed by integrating optimization tools. For instance, Mowafy et al. [75] presented a parametric BIM-based LCA framework using the BHoM and Bombyx plug-ins for LCA calculations and the Rhino-Inside-Revit plug-in for BIM integration. The proposed method also contains optimization and decision-making modules, which are presented using a case study. Consequently, the proposed methodology is one step in creating a BIM-integrated parametric framework for effective LCA and is suitable for further development.

Author Contributions

Conceptualization, K.A.K. and J.S.; methodology, K.A.K. and J.S.; software, K.A.K.; validation, K.A.K. and J.S.; formal analysis, K.A.K.; investigation, K.A.K.; resources, K.A.K. and J.S.; data curation, K.A.K.; writing—original draft preparation, K.A.K. and J.S.; writing—review and editing, K.A.K.; visualization, K.A.K.; supervision, J.S.; project administration, K.A.K.; funding acquisition, K.A.K. All authors have read and agreed to the published version of the manuscript.

Funding

This research is supported by the Hungarian ÚNKP-21-4-I-SZE-30 New National Excellence Program of the Ministry of Culture and Innovation from the source of the National Research, Development and Innovation Fund.

Conflicts of Interest

The authors declare no conflict of interest.

References

  1. Mueller, C.T.; Ochsendorf, J. From analysis to design: A new computational strategy for structural creativity. In Proceedings of the 2nd International Workshop on Design in Civil and Environmental Engineering, Worcester, MA, USA, 28–29 June 2013. [Google Scholar]
  2. Amorocho, J.A.P.; Hartmann, T. A multi-criteria decision-making framework for residential building renovation using pairwise comparison and TOPSIS methods. J. Build. Eng. 2022, 53, 104596. [Google Scholar] [CrossRef]
  3. Wang, L.; Shen, W.; Xie, H.; Neelamkavil, J.; Pardasani, A. Collaborative conceptual design—State of the art and future trends. Comput. Des. 2002, 34, 981–996. [Google Scholar] [CrossRef]
  4. Hsu, W.; Liu, B. Conceptual design: Issues and challenges. Comput. Des. 2000, 32, 849–850. [Google Scholar] [CrossRef]
  5. Gilyén, N. Structure and Form in Architecture; Műszaki Tankönyvkiadó: Budapest, Hungary, 1982. (In Hungarian) [Google Scholar]
  6. Allen, E.; Zalewski, W. Form and Forces: Designing Efficient, Expressive Structures; John Wiley & Sons: Hoboken, NJ, USA, 2010; ISBN 978-0-470-17465-4. [Google Scholar]
  7. Macdonald, A.J. Structure and Architecture, 2nd ed.; Architectural Press: Oxford, UK, 2001; ISBN 9781138629240. [Google Scholar]
  8. Kanyilmaz, A.; Tichell, P.R.N.; Loiacono, D. A genetic algorithm tool for conceptual structural design with cost and embodied carbon optimization. Eng. Appl. Artif. Intell. 2022, 112, 104711. [Google Scholar] [CrossRef]
  9. Kollár, L. Introduction into Structural Design; Budapest University of Technology and Economics: Budapest, Hungary, 2007. (In Hungarian) [Google Scholar]
  10. ÖKOBAUDAT. Federal Ministry for Housing, Urban Development and Building. Available online: https://www.oekobaudat.de/en.html (accessed on 25 July 2023).
  11. Jiang, S.; Jiang, L.; Han, Y.; Wu, Z.; Wang, N. OpenBIM: An Enabling Solution for Information Interoperability. Appl. Sci. 2019, 9, 5358. [Google Scholar] [CrossRef] [Green Version]
  12. Sacks, R.; Eastman, C.; Lee, G.; Teicholz, P.M. BIM Handbook: A Guide to Building Information Modelling for Owners, Managers, Designers, Engineers and Contractors, 3rd ed.; John Willey & Son Inc.: Hoboken, NJ, USA, 2018. [Google Scholar] [CrossRef]
  13. Pezeshki, Z.; Ivari, S.A.S. Applications of BIM: A Brief Review and Future Outline. Arch. Comput. Methods Eng. 2016, 25, 273–312. [Google Scholar] [CrossRef]
  14. Begić, H.; Galić, M. A Systematic Review of Construction 4.0 in the Context of the BIM 4.0 Premise. Buildings 2021, 11, 337. [Google Scholar] [CrossRef]
  15. Gu, N.; London, K. Understanding and facilitating BIM adoption in the AEC industry. Autom. Constr. 2010, 19, 988–999. [Google Scholar] [CrossRef]
  16. Zhao, X. A scientometric review of global BIM research: Analysis and visualization. Autom. Constr. 2017, 80, 37–47. [Google Scholar] [CrossRef]
  17. Mesároš, P.; Mandičák, T. Exploitation and Benefits of BIM in Construction Project Management. IOP Conf. Ser. Mater. Sci. Eng. 2017, 245, 062056. [Google Scholar] [CrossRef] [Green Version]
  18. Azhar, S.; Khalfan, M.; Maqsood, T. Building information modelling (BIM): Now and beyond. Australas. J. Constr. Econ. Build. 2012, 12, 15–28. [Google Scholar] [CrossRef] [Green Version]
  19. Teicholz, P. BIM for Facility Managers; John Wiley & Sons, Inc.: Hoboken, NJ, USA, 2013; ISBN 978-1-118-38281-3. [Google Scholar]
  20. Yalcinkaya, M.; Singh, V. Building Information Modeling (BIM) for Facilities Management—Literature Review and Future Needs. In Product Lifecycle Management for a Global Market; Fukuda, S., Bernard, A., Gurumoorthy, B., Bouras, A., Eds.; PLM 2014. IFIP Advances in Information and Communication Technology; Springer: Berlin/Heidelberg, Germany, 2014; Volume 442. [Google Scholar] [CrossRef] [Green Version]
  21. Holzer, D. BIM and Parametric Design in Academia and Practice: The Changing Context of Knowledge Acquisition and Application in the Digital Age. Int. J. Arch. Comput. 2015, 13, 65–82. [Google Scholar] [CrossRef]
  22. Vilutiene, T.; Kalibatiene, D.; Hosseini, M.R.; Pellicer, E.; Zavadskas, E.K. Building Information Modeling (BIM) for Structural Engineering: A Bibliometric Analysis of the Literature. Adv. Civ. Eng. 2019, 2019, 1–19. [Google Scholar] [CrossRef]
  23. Boeykens, S. Bridging Building Information Modeling and Parametric Design, eWork and eBusiness in Architecture, Engineering and Construction; Taylor & Francis Group: London, UK, 2012. [Google Scholar] [CrossRef]
  24. Azhar, S. Building Information Modeling (BIM): Trends, Benefits, Risks, and Challenges for the AEC Industry. Leadersh. Manag. Eng. 2011, 11, 241–252. [Google Scholar] [CrossRef]
  25. Hardin, B.; McCool, D. BIM and Construction Management: Proven Tools, Methods and Workflows, 2nd ed.; John Wiley & Sons, Inc.: Indianapolis, Indiana, 2015; ISBN 978-1-118-94276-5. [Google Scholar]
  26. Costin, A.; Adibfar, A.; Hu, H.; Chen, S.S. Building Information Modeling (BIM) for transportation infrastructure—Literature review, applications, challenges, and recommendations. Autom. Constr. 2018, 94, 257–281. [Google Scholar] [CrossRef]
  27. Wang, H.; Pan, Y.; Luo, X. Integration of BIM and GIS in sustainable built environment: A review and bibliometric analysis. Autom. Constr. 2019, 103, 41–52. [Google Scholar] [CrossRef]
  28. Lu, Y.; Wu, Z.; Chang, R.; Li, Y. Building Information Modeling (BIM) for green buildings: A critical review and future directions. Autom. Constr. 2017, 83, 134–148. [Google Scholar] [CrossRef]
  29. Kriegel, E.; Nies, B. Green BIM: Successful Sustainable Design with Building Information Modeling; Wiley Publishing: Indianapolis, Indiana, 2008; ISBN 978-0-470-23960-5. [Google Scholar]
  30. ISO 14040:2006; Environmental Management—Life Cycle Assessment—Principles and Framework. International Organization for Standardization: Geneva, Switzerland, 2006.
  31. ISO 14044:2006; Environmental Management—Life Cycle Assessment—Requirements and Guidelines. International Organization for Standardization: Geneva, Switzerland, 2006.
  32. Hollberg, A.; Ruth, J. LCA in architectural design—A parametric approach. Int. J. Life Cycle Assess. 2016, 21, 943–960. [Google Scholar] [CrossRef] [Green Version]
  33. Hollberg, A. Parametric Life Cycle Assessment: Introducing a Time-Efficient Method for Environmental Building Design Optimization. Ph.D. Thesis, Chalmers University of Technology, Aarhus, Denmark, 2016. [Google Scholar] [CrossRef]
  34. Obrecht, T.P.; Röck, M.; Hoxha, E.; Passer, A. BIM and LCA Integration: A Systematic Literature Review. Sustainability 2020, 12, 5534. [Google Scholar] [CrossRef]
  35. Tam, V.W.; Zhou, Y.; Illankoon, C.; Le, K.N. A critical review on BIM and LCA integration using the ISO 14040 framework. Build. Environ. 2022, 213, 108865. [Google Scholar] [CrossRef]
  36. Li, X.; Wu, P.; Shen, G.Q.; Wang, X.; Teng, Y. Mapping the knowledge domains of Building Information Modeling (BIM): A bibliometric approach. Autom. Constr. 2017, 84, 195–206. [Google Scholar] [CrossRef]
  37. Khudhair, A.; Li, H.; Ren, G.; Liu, S. Towards Future BIM Technology Innovations: A Bibliometric Analysis of the Literature. Appl. Sci. 2021, 11, 1232. [Google Scholar] [CrossRef]
  38. Caetano, I.; Santos, L.; Leitão, A. Computational design in architecture: Defining parametric, generative, and algorithmic design. Front. Arch. Res. 2020, 9, 287–300. [Google Scholar] [CrossRef]
  39. Schreiber, D.K.; Gembarski, P.C.; Lachmayer, R. Modeling and Configuration for Product-Service Systems: State of the Art and Future Research; International Configuration Workshop: Paris, France, 2017; Volume 19. [Google Scholar]
  40. VDI 2209; 3D Product Modelling—Technical and Organizational Requirements—Procedures, Tools, and Applications—Cost-Effective Practical Use. Deutsches Institut fur Normung E.V. (DIN): Berlin, Germany, 2009.
  41. Gane, V. Parametric Design—A Paradigm Shift? Master’s Thesis, Massachusetts Institute of Technology, Department of Architecture, Cambridge, CA, USA, 2004. [Google Scholar]
  42. Shah, J.J.; Mäntylä, M. Parametric and Feature-Based CAD/CAM—Concepts, Techniques, and Applications; John Wiley & Sons, Inc.: Etobicoke, ON, Canada, 1995; ISBN 978-0-471-00214-7. [Google Scholar]
  43. Peteinarelis, A. Frei Otto’s Contribution—Legacy to Parametric Design and Material Computation. In Proceedings of the Architecture-In-Play International Conference, Lisbon, Portugal, 11–23 July 2016; pp. 171–177. [Google Scholar]
  44. Frazer, J. Parametric Computation: History and Future. Arch. Des. 2016, 86, 18–23. [Google Scholar] [CrossRef]
  45. Holzer, D. Design exploration supported by digital tool ecologies. Autom. Constr. 2016, 72, 3–8. [Google Scholar] [CrossRef]
  46. Barberi, E.; Cucinotta, F.; Raffaele, M.; Salmeri, F. A Hollowing Topology Optimization Method for Additive and Traditional Manufacturing Technologies. In Design Tools and Methods in Industrial Engineering II. ADM 2021. Lecture Notes in Mechanical Engineering; Rizzi, C., Campana, F., Bici, M., Gherardini, F., Ingrassia, T., Cicconi, P., Eds.; Springer: Cham, Switzerland, 2021. [Google Scholar] [CrossRef]
  47. Bertacchini, F.; Bilotta, E.; Demarco, F.; Pantano, P.; Scuro, C. Multi-objective optimization and rapid prototyping for jewelry industry: Methodologies and case studies. Int. J. Adv. Manuf. Technol. 2021, 112, 2943–2959. [Google Scholar] [CrossRef]
  48. Müller, P.; Budau, J.P.; Gembarski, P.C. Development of an algorithm-based approach for Computational Design Synthesis of individualized implants. Procedia CIRP 2023, 119, 1091–1096. [Google Scholar] [CrossRef]
  49. Golovin, M.A.; Fogt, E.V.; Petrauskas, M.V.; Kaplun, D.I.; Sufelfa, A.R. Automated Technology of Manufacturing the Below Knee Prosthetic Socket. In Proceedings of the 2021 IEEE Conference of Russian Young Researchers in Electrical and Electronic Engineering (ElConRus), St. Petersburg and Moscow, Russia, 26–29 January 2021; pp. 1752–1755. [Google Scholar] [CrossRef]
  50. Suresh, S.; Perera, P.; Izatt, M.T.; Labrom, R.D.; Askin, G.N.; Little, J.P. Development and validation of a semi-automated measurement tool for calculating consistent and reliable surface metrics describing cosmesis in Adolescent Idiopathic Scoliosis. Sci. Rep. 2023, 13, 5574. [Google Scholar] [CrossRef]
  51. Aretxabaleta, M.; Roehler, A.; Poets, C.F.; Xepapadeas, A.B.; Koos, B.; Weise, C. Automation of Measurements for Personalized Medical Appliances by Means of CAD Software—Application in Robin Sequence Orthodontic Appliances. Bioengineering 2022, 9, 773. [Google Scholar] [CrossRef]
  52. Cucinotta, F.; Raffaele, M.; Salmeri, F. A Topology Optimization of a Motorsport Safety Device. In Design Tools and Methods in Industrial Engineering; ADM 2019. Lecture Notes in Mechanical Engineering; Rizzi, C., Andrisano, A.O., Leali, F., Gherardini, F., Pini, F., Vergnano, A., Eds.; Springer: Cham, Switzerland, 2020. [Google Scholar] [CrossRef]
  53. Yu, L. Automatic design optimization of landscape space based on improved genetic algorithm in tropical environment. Acta Geophys. 2023, 71, 1475–1489. [Google Scholar] [CrossRef]
  54. Hudson, R. Strategies for Parametric Design in Architecture. An Application of Practice Led Research. Ph.D. Thesis, University of Bath, Bath, UK, 2010. [Google Scholar]
  55. Holzer, D.; Hough, R.; Burry, M. Parametric Design and Structural Optimisation for Early Design Exploration. Int. J. Arch. Comput. 2007, 5, 625–643. [Google Scholar] [CrossRef]
  56. Lee, J.; Gu, N.; Williams, A.P. Parametric Design Strategies for the Generation of Creative Designs. Int. J. Arch. Comput. 2014, 12, 263–282. [Google Scholar] [CrossRef]
  57. Zhang, J.; Liu, N.; Wang, S. Generative design and performance optimization of residential buildings based on parametric algorithm. Energy Build. 2021, 244, 111033. [Google Scholar] [CrossRef]
  58. Konis, K.; Gamas, A.; Kensek, K. Passive performance and building form: An optimization framework for early-stage design support. Sol. Energy 2016, 125, 161–179. [Google Scholar] [CrossRef]
  59. Kokkos, A. Computational Modeling Tools for the Promotion of “Design for Deconstruction”. Master’s Thesis, Delft University of Technology, Delft, The Netherlands, 2014. [Google Scholar]
  60. Eltaweel, A.; Su, Y. Parametric design and daylighting: A literature review. Renew. Sustain. Energy Rev. 2017, 73, 1086–1103. [Google Scholar] [CrossRef]
  61. Eastman, C.M.; Teicholz, P.; Sacks, R.; Liston, K. BIM Handbook: A Guide to Building Information Modeling for Owners, Managers, Designers, Engineers and Contractors, 2nd ed.; Wiley & Sons: Hoboken, NJ, USA, 2011; ISBN 9780470541371. [Google Scholar]
  62. Park, J. BIM-Based Parametric Design Methodology for Modernized Korean Traditional Buildings. J. Asian Arch. Build. Eng. 2011, 10, 327–334. [Google Scholar] [CrossRef]
  63. Girardet, A.; Boton, C. A parametric BIM approach to foster bridge project design and analysis. Autom. Constr. 2021, 126, 103679. [Google Scholar] [CrossRef]
  64. Mirtschin, J. Engaging Generative BIM Workflows. In Collaborative Design of Lightweight Structures-LSAA; Association of Australia Inc.: Sydney, Australia, 2011. [Google Scholar]
  65. Cavieres, A.; Gentry, R.; Al-Haddad, T. Knowledge-based parametric tools for concrete masonry walls: Conceptual design and preliminary structural analysis. Autom. Constr. 2011, 20, 716–728. [Google Scholar] [CrossRef]
  66. Das, S.; Zolfgharian, S.; Nourbaksh, M.; Haymaker, J. Integrated Spatial-Structural Optimization in the Conceptual Design Stage of a Project. In Complexity & Simplicity, Proceedings of the Education and Research in Computer Aided Architectural Design in Europe (eCAADe) 34th Annual Conference, University of Oulu, Oulu, Finland, 22–26 August 2016; Herneoja, A., Österlund, T., Markkanen, P., Eds.; University of Oulu: Oulu, Finland; pp. 117–126.
  67. Bedrick, J.; Ikerd, W.; Reinhardt, J. Level of Development Specification, 2020. BIMForum. Available online: https://bimforum.org/resource/level-of-development-specification/ (accessed on 25 July 2023).
  68. Ruddy, J.L.; Ioannides, S.A. Rules Of Thumb For Steel Design. In Structures 2004: Building on the Past, Securing the Future; Wiley: Hoboken, NJ, USA, 2004. [Google Scholar] [CrossRef] [Green Version]
  69. Kollár, L.; Paládi-Kovács, Á. Approximate Methods of Calculation, Determination of Dimensions; Műegyetemi Kiadó: Budapest, Hungary, 1996. (In Hungarian) [Google Scholar]
  70. Innovative Engineering Inc. Structural Engineering Design Rules of Thumb, Woodstock. 2015. Available online: https://ieiusa.com/wp-content/uploads/IEI-Rules-of-Thumb-Line-Card_03012016.pdf (accessed on 25 July 2023).
  71. Czarnecki, L.; Van Gemert, D. Scientific basis and rules of thumb in civil engineering: Conflict or harmony? Bull. Pol. Acad. Sci. Tech. Sci. 2016, 64, 665–673. [Google Scholar] [CrossRef] [Green Version]
  72. Hartyáni, C.Z. Structural Design Approximations; Budapest University of Technology and Economics: Budapest, Hungaray, 2010. (In Hungarian) [Google Scholar]
  73. EN 10365:2017; Hot Rolled Steel Channels, I and H Sections—Dimensions and Masses. European Committee for Standardization: Brussels, Belgium, 2017.
  74. Lee, S.; Tae, S.; Roh, S.; Kim, T. Green Template for Life Cycle Assessment of Buildings Based on Building Information Modeling: Focus on Embodied Environmental Impact. Sustainability 2015, 7, 16498–16512. [Google Scholar] [CrossRef] [Green Version]
  75. Mowafy, N.; El Zayat, M.; Marzouk, M. Parametric BIM-based life cycle assessment framework for optimal sustainable design. J. Build. Eng. 2023, 75, 106898. [Google Scholar] [CrossRef]
  76. Wildenauer, A.A. Critical Assessment of the Existing Definitions of Bim Dimensions on the Example of Switzerlan. Int. J. Civ. Eng. Technol. (IJCIET) 2020, 11, 134–151. [Google Scholar] [CrossRef]
  77. Koutamanis, A. Dimensionality in BIM: Why BIM cannot have more than four dimensions? Autom. Constr. 2020, 114, 103153. [Google Scholar] [CrossRef]
  78. Alwan, Z.; Nawarathna, A.; Ayman, R.; Zhu, M.; ElGhazi, Y. Framework for parametric assessment of operational and embodied energy impacts utilising BIM. J. Build. Eng. 2021, 42, 102768. [Google Scholar] [CrossRef]
  79. Säwén, T.; Magnusson, E.; Kalagasidis, A.S.; Hollberg, A. Tool characterisation framework for parametric building LCA. IOP Conf. Ser. Earth Environ. Sci. 2022, 1078, 012090. [Google Scholar] [CrossRef]
  80. Gervásio, H.; Santos, P.; Martins, R.; da Silva, L.S. A macro-component approach for the assessment of building sustainability in early stages of design. Build. Environ. 2014, 73, 256–270. [Google Scholar] [CrossRef]
  81. Jabi, W.; Johnson, B.; Woodbury, R. Parametric Design for Architecture; Laurence King Publishing: London, UK, 2013; ISBN 9781780673141. [Google Scholar]
  82. Gan, V.J. BIM-based graph data model for automatic generative design of modular buildings. Autom. Constr. 2021, 134, 104062. [Google Scholar] [CrossRef]
  83. Benjamin, S.; Christopher, R.; Carl, H. Feature modeling for configurable and adaptable modular buildings. Adv. Eng. Inform. 2022, 51, 101514. [Google Scholar] [CrossRef]
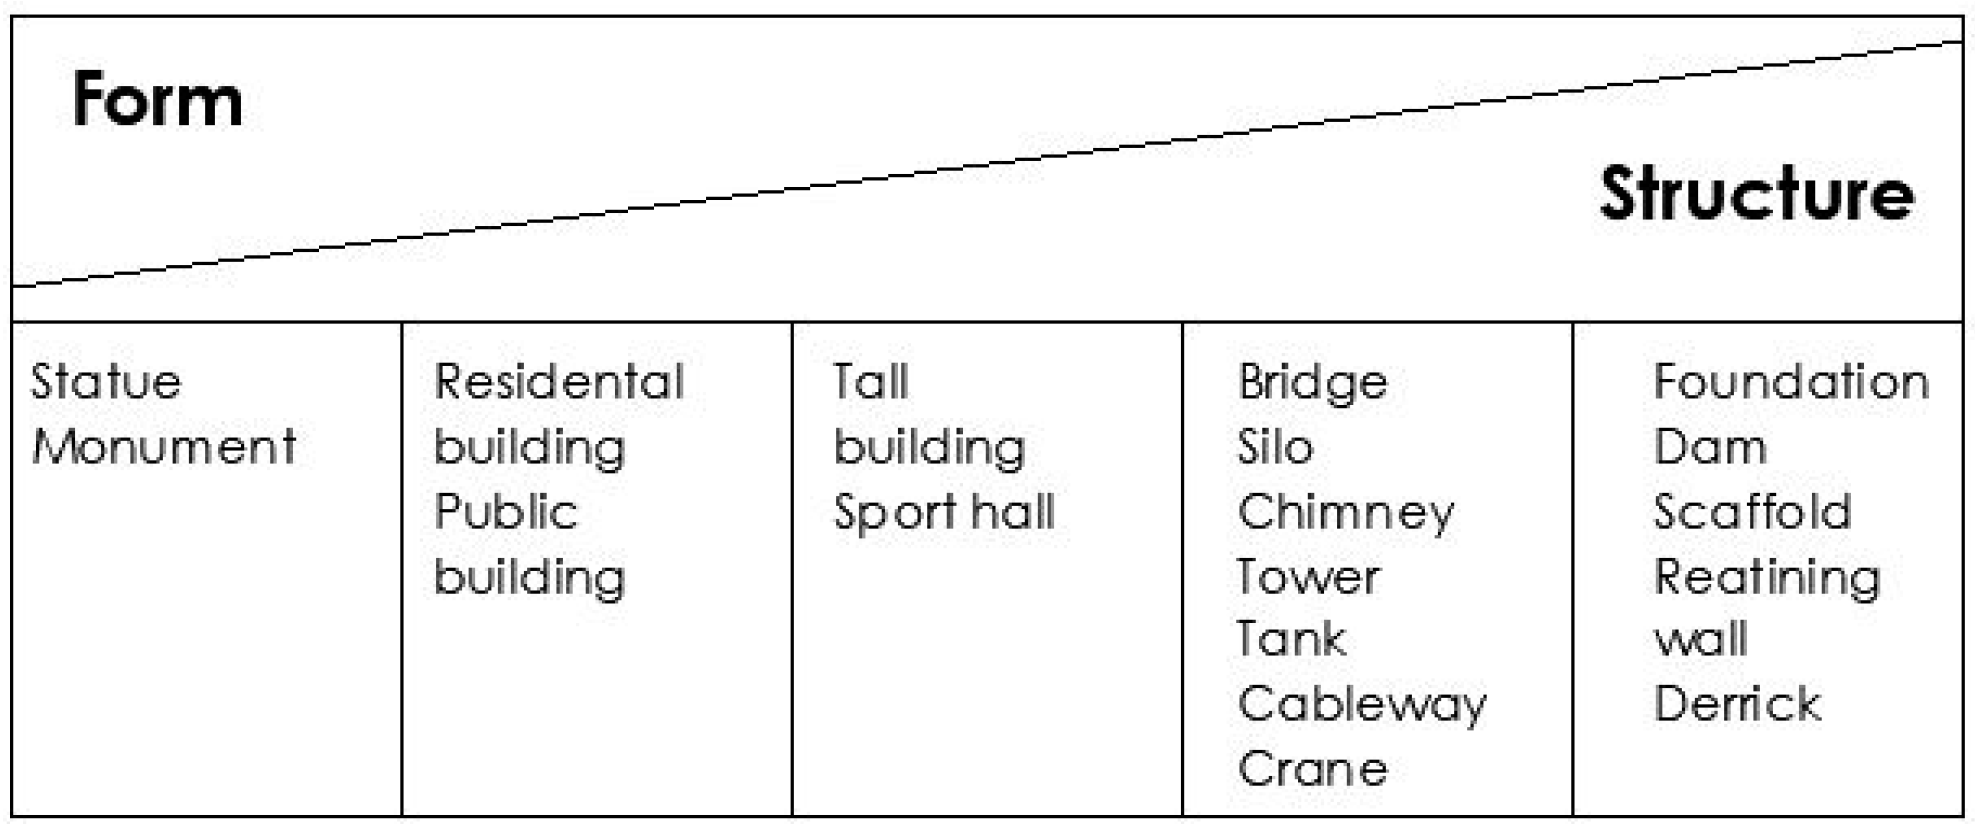
Figure 2. The role of form and structure [9].
Sustainability 15 11990 g002
Figure 3. Workflow for the proposed method.
Sustainability 15 11990 g003
Figure 4. LOD300 model elements.
Sustainability 15 11990 g004
Figure 5. (a) Parametric frame structure represented by center lines and planes and (b) variable parameters.
Sustainability 15 11990 g005
Figure 6. Structural design approximations for frame structure embedded in the parametric model.
Sustainability 15 11990 g006
Figure 7. Workflow for converting the parametric model into a 2D ConSteel structural model.
Sustainability 15 11990 g007
Figure 8. Conceptual structural analysis result: utilization of cross sections, span = 20 m.
Sustainability 15 11990 g008
Figure 9. Workflow for the embodied environmental impact calculation using Excel databases.
Sustainability 15 11990 g009
Figure 10. Excel export showing the embodied environmental impact results and the exported results of the following frame: span = 16.5 m, raster = 5.5 m, number of frames = 5, area = 363 m2.
Sustainability 15 11990 g010
Figure 11. Contribution of the building elements for the environmental impact categories: (a) GWP: global warming potential, (b) POCP: photochemical ozone creation potential, (c) ODP: ozone depletion potential, (d) AP: acidification potential, (e) EP: eutrophication potential, (f) ADPE: abiotic depletion potential for non-fossil resources, (g) ADPF: abiotic depletion potential for fossil resources.
Sustainability 15 11990 g011
Figure 12. Result of embodied environmental impact depending on the area: (a) Global warming potential/m2, (b) Photochemical ozone creation potential/m2, (c) Ozone depletion potential/m2, (d) Acidification potential/m2, (e) Eutrophication potential/m2, (f) Abiotic depletion potential for non-fossil resources/m2, (g) Abiotic depletion potential for fossil resources/m2.
Sustainability 15 11990 g012
Figure 13. Change in embodied environmental impact relative to variation (a).
Sustainability 15 11990 g013
Figure 14. Results for global warming potential per square meter depending on the span, number of frames, and raster: (a) Number of frames = 5, (b) Number of frames = 6, (c) Number of frames = 7, (d) Number of frames = 8.
Sustainability 15 11990 g014
Figure 15. Definition of an Archicad slab element in Grasshopper.
Sustainability 15 11990 g015
Figure 16. The 3D model and information content of a column in Archicad based on the parametric model.
Sustainability 15 11990 g016
Figure 17. A 3D overview of the steel structure in Tekla structures.
Sustainability 15 11990 g017
Figure 18. Overview of the Grasshopper algorithm: 1. geometry, 2. structural design approximations, 3. environmental databases, 4. calculation of environmental impact, 5. Excel export, 6. Archicad model, and 7. Consteel model.
Sustainability 15 11990 g018
Table 1. Applied cross sections.
Span (m)16.518.020.0
ColumnIPE 400IPE 450IPE 500
BeamIPE 300IPE 330IPE 360
Table 2. Environmental impact indicators based on the ÖKOBAUDAT [10].
MaterialsUnitsEnvironmental Impact Indicator
GWPPOCPODPAPEPADPEADPF
kg-CO2eqkg-C2H4eqkg-CFC-11eqkg-SO2eqkg-PO43_eqkg-SbeqMJ
Ready-mix concretem3283.10.32941.35 × 10−120.29660.057470.00001506863.9
Steelton3700.11535.59 × 10−110.950.078310.0004864249
Galvanized steel sheetm22.6760.0007415.85 × 10−150.0057540.0005420.00019524.73
Aluminum windowsm21730.04424.91 × 10−80.760.07060.00112370
Industrial gatem244.90.02463.08 × 10−70.140.01570.0000707735
GWP: global warming potential, POCP: photochemical ozone creation potential, ODP: ozone depletion potential, AP: acidification potential, EP: eutrophication potential, ADPE: abiotic depletion potential for non-fossil resources, ADPF: abiotic depletion potential for fossil resources.
Disclaimer/Publisher’s Note: The statements, opinions and data contained in all publications are solely those of the individual author(s) and contributor(s) and not of MDPI and/or the editor(s). MDPI and/or the editor(s) disclaim responsibility for any injury to people or property resulting from any ideas, methods, instructions or products referred to in the content.