Article

Experimental Investigations on the Response of Bedload Sediment to Vibration

1
College of Hehai, Chongqing Jiaotong University, Chongqing 400074, China
2
School of Transportation and Municipal Engineering, Chongqing Jianzhu College, Chongqing 400072, China
*
Author to whom correspondence should be addressed.
Sustainability 2023, 15(15), 11972; https://doi.org/10.3390/su151511972
Submission received: 13 June 2023 / Revised: 21 July 2023 / Accepted: 31 July 2023 / Published: 3 August 2023

Abstract

:
Research results on sediment vibration characteristics are scarce, and knowledge on the effect of the particle size on the sediment vibration response is still limited. In this study, natural pebbles of different heights—A, B and C—were selected (hA < hB < hC). Miniature acceleration sensors were installed inside the pebble. Experimental methods were used to measure the vibration process of pebbles on the rough bed surface and to measure the near-bed velocities simultaneously. The test results show that the sequence of pebble vibration and entrainment is A-C-B as the flow rate increases. The vibration intensity of pebbles A and B tended to increase before approaching the entrainment threshold but weakened when approaching the entrainment threshold; the vibration frequency, on the contrary, first decreased and then increased. The vibration intensity of pebble C decreased first and then increased, and when approaching the entrainment threshold, it rolled directly. The vibration frequency first increased and then decreased, and near the entrainment threshold, there was no vibration. Thus, it was demonstrated that with the increase in pebble height, the average vibration intensity increases, and the average vibration frequency decreases. The results of this research provide a reference for exploring the dynamic mechanism of the bed load in mountain rivers.

1. Introduction

Rivers play an important role in the process of geomorphologic system change on the Earth’s surface and are closely related to human social life. The problems of river evolution, channel remodeling and river health and ecology arising from the intersection of disciplines in the field of river sedimentation are directly related to sustainable economic and social development. Along with the development and utilization of rivers, the study of river sediment movement is a necessary consideration. However, the irregularity of particle shape, the randomness of particle motion, the turbulence of the water flow, and the irregularity of the bed make the study of individual sediment particles complicated; thus, it is necessary to systematically study the motion of sediment particles using fluid dynamics as well as nonlinear stochastic dynamics.
Based on field, laboratory, and other studies, many researchers have advocated that the stochastic motion of sediment particles is related to fluctuating water motion [1,2,3,4,5,6] and bed microtopography [7]. In recent years, researchers have proposed new interpretations of pulsations [8], forces [9,10] and energies [11,12] that go beyond the limitations of formulations based on time-averaged Shields parameters. The prediction of sediment particle motion has been improved. However, Garcia [13] and Maniatis [14] found that sediment particles do not entrain in the low flow velocity field and do not remain stationary. Through experimental studies, it was found that when the particles are in a low flow velocity situation, they will be in a position to vibrate or oscillate back and forth. When approaching or exceeding the threshold value, the sediment incurs rolling, sliding or lifting in an entrainment mode.
In recent years, with the development of nonlinear science, scholars have tried to study the sediment transport problem from a nonlinear perspective [15,16]. Wang Xiekang [17] analyzed the entrainment phenomena of a single particle, uniform sand and non-uniform sand, and concluded that the entrainment of sediment belonged to the scope of mutation theory research. Based on the nonlinear theory, Yang Gurui [18] and He Wenshe [19] studied the cusp mutation model of non-uniform sand entrainment and derived the critical condition equation of sediment entrainment. By analyzing the nonlinear dynamics of the nudging mass movement process, Bai Yuchuan [20] found that sediment initiation, nudging mass equilibrium of sand transport, and bed morphology are determined by the nonlinear dynamics of the nudging mass movement process. Yang Gurui [21] explored the law of sediment movement from the perspective of nonlinear science and obtained the relationship between a non-uniform sand transport intensity and water flow parameters and the bed sand compactness coefficient. Xu Xiaoyang [22] constructed a nonlinear nudging sand transport rate formula based on the cusp mutation model. The current research results, although introduces more nonlinear models, do not provide accurate definite conclusions about the sediment entrainment mechanism, and there are very few studies on the vibration characteristics of sediment before entrainment. The analysis of sediment vibration characteristics is the basis for studying the stability of sediment nonlinear motion, so it is necessary to study its vibration mechanism.
In recent years, due to the rapid development of sensor technology, monitoring of sediment movement processes has become possible [23,24,25,26,27,28,29,30]. In 2010, Akeila [23] proposed the idea of making smart pebbles using acceleration sensors and gyroscopes, whose smart pebbles can collect data on velocity, position, kinetic energy and other indicators. Maniatis placed customized acceleration sensors inside a closed ideal sphere to collect the acceleration during sediment movement [14]. Maniatis then also measured the inertial drag and lift of coarse particles on the coarse alluvium using acceleration sensors [25]. Oliver Gronz [26] developed a probe small enough to contain a three-axis accelerometer, magnetometer and gyroscope. The probe is implanted into a stone and can track the movement of the pebble. Although the sediment transport process was measured with sensors, the vibration process before sediment entrainment has rarely been monitored. Wang Pingyi et al. [31] measured the sediment vibration process using acceleration sensors and found that the sediment vibration is low-frequency vibration, which is closely related to the near-bed velocities. However, research results on sediment vibration characteristics are still scarce, and the effect of the particle size on the sediment vibration response is still to be elucidated. Therefore, this paper continues to measure the vibration process of sediment with different particle sizes using acceleration sensors.
To analyze the effect of grain size on the nonlinear vibration of sediment, this paper uses micro-accelerometers to measure the natural pebble vibration process. The acceleration of natural pebbles with different particle sizes under different water flow conditions was collected through indoor flume tests, and the near-bed velocity corresponding to the pebbles was measured using an acoustic Doppler velocimeter (ADV).

2. Kinetic Equation of Sediment Vibration

The movement of sediment is not only affected by the flow field and gravitational field but also by friction. Through experimental research, some scholars have found that the particles will not be entrained at low flow velocity and will not remain stationary, but will be in a position near the back-and-forth vibration or oscillation. Therefore, it is not reasonable to choose the hydrostatic equilibrium model to study the entrainment of particles. Based on this, the present paper establishes a kinetic model for sediment.
Considering the case of unidirectional flow vibration, the velocity of sediment moving under the action of water is u i , U b is the velocity of water acting on the bed sediment, and the expressions of the uplift force F L i , drag force F D i , and gravity W i are as follows:
F L i = C L i A 1 i D i 2 ρ ( U b u i ) 2 2
F D i = C D i A 2 i D i 2 ρ ( U b u i ) 2 2
W = A 3 i ( γ s γ ) D i 3
where C D i is the particle drag force resistance coefficient of sediment; C L i is the particle uplift force coefficient of sediment; U b is the flow velocity acting on the bed sediment; D i is the sediment particle size; ρ is the density of water; γ and γ s are the weight of water and sediment, respectively; and A 1 i , A 2 i , and A 3 i are the sediment particle area correction coefficients.
The following equation describes the motion of a single particle sediment:
F D i ( W i F L i ) t g φ = m i d u i d t = m i a i
where m i is the single particle sediment mass, m i = A 3 i ρ s D i 3 , φ is the friction angle, t g φ = u is the friction coefficient, and a i is the sediment vibration acceleration.
The vibration of sediment is influenced by the particle size, flow velocity, roughness, and flow rate. The flow velocity Ub acting on the bed sediment fluctuates with time, which is a nonlinear factor. And the nonlinear factors have an important influence on the response of sediment motion, especially the nonlinearity of sediment resistance moment and recovery moment. Therefore, the flow velocity excitation has a great influence on the vibration response of sediment.
Due to the dynamic equation of the particle, it is known that the particle vibration is a typical nonlinear vibration. The parameter changes with external periodic excitation may lead to various nonlinear dynamical properties such as periodic vibration, dynamic bifurcation, quasi-periodic vibration and even hybrid motion of the particles. Because of the lack of research on the nonlinear vibration characteristics of sediment, this paper uses experimental means to investigate the effect of the particle size on the nonlinear vibration of sediment.

3. Materials and Methods

To make the pebble vibrations easier to identify, three natural pebbles of different grain sizes were placed on the rough bed surface for the test, respectively. The tests measured the acceleration in front of isolated, fully exposed pebble entrainment under different water flow conditions. Near-bed velocities were measured simultaneously with a laser Doppler velocimeter.

3.1. Design of Smart Pebble

Pebbles of median grain size in the navigable upper reaches of the Yangtze River in China were selected for the experiment, while the shape chosen was commonly and relatively that of a regular ellipse. Because the sediment vibration characteristics of the law is very complex, the shape of each parameter change will lead to changes in the vibration characteristics, so the paper first explores the influence of the law of the height. In order to reduce the phenomenon to its most basic form and to promote causality (while retaining the physical quantities that play a dominant role), three natural pebbles with similar vertical projection areas (similar pebble lengths and widths) and varying heights were chosen for the experiment. The pebble parameters are shown in Table 1. A 2.5 cm-diameter hole was cut in the middle of the three pebbles. Waterproof acceleration sensors were installed in the holes of the pebbles. The distance from the top of the pebble was LA = 0.76 cm, LB = 1.05 cm and LC = 1.39 cm, respectively. To restore the pebbles to their original capacity, copper powder and fine steel wire were filled inside the pebbles according to a certain ratio. Finally, the bottom surfaces of the pebbles were sealed with a waterproof glue. Pebble vibration is not only related to the particle size but also to the curvature of the pebble bottom. In order to eliminate the effect of curvature, the bottom of the pebbles were designed to have a uniform curvature when sealing with the waterproof glue (Figure 1a).
The sensor implanted in the smart pebbles was a small, industrial-grade MEMS acceleration sensor with customized digital output. In order to mount the sensor inside the pebble, an instrument discarded the hardware of the battery and memory card and finally reduced the sensor size to 15 mm × 15 mm × 2.3 mm. Considering that the underwater wireless transmission method would lead to data loss, the sensor was wired (as shown in Figure 1b). To avoid line interference with pebble movement, the sensor used four ultra-fine Teflon high-temperature silver-plated wires of 0.35 mm diameter to complete the power supply and data transmission functions. The wires were tested for water resistance during the test preparation period and worked well. The acceleration sensor had a measurement range of 3.6 g and a resolution of 0.1 mg, where the sampling frequency was set to 200 Hz.

3.2. Flume Bed Experiments

The experimental site was set in the hydraulics laboratory of Chongqing Jiaotong University. The experiments were conducted in a rectangular glass flume, which was 25 m long, 0.55 m wide and 0.65 m high, and the slope of the riverbed was set at 0.3%. A constant reservoir provided the flow rate for this experiment, while a variable speed pump controlled the flow magnitude. The bottom of the rectangular glass flume was paved with concrete and its roughness was kept constant. To ensure fully developed turbulent flow conditions, isolated smart pebbles were placed 15 m downstream of the flume inlet for the test. The coordinates are arranged as shown in Figure 1c. To prevent the ultra-fine Teflon high-temperature silver-plated wire from interfering with the motion of the smart pebble, the line was installed on the side and downstream of the pebble in this experiment. An acoustic Doppler flowmeter was selected to collect the near-bed velocity of the smart pebble. The instrument was mounted on the centerline of the smart pebble along the direction of water flow, 10 cm away from the smart pebble, with a sampling frequency of 100 Hz. Figure 1c illustrates this arrangement.
Because the motion of the smart pebbles was unknown, we conducted a pre-experiment. The motion of three smart pebbles was observed under different flow conditions. Pre-experiments revealed that smart pebble A was stationary at Q = 30 L/h and entrained at Q = 53 L/h; smart pebble B was stationary at Q = 32 L/h and entrained at Q = 86 L/h; and smart pebble C was stationary at Q = 32 L/h and entrained at Q = 86 L/h. In order to study the vibration characteristics of the sediment from rest to entrainment, as many flow conditions as possible were set as long as the experimental conditions were satisfied. Therefore, the experimental smart pebble A had 5 flow conditions (Q1 = 30 L/h, Q2 = 32 L/h, Q3 = 37 L/h, Q4 = 39 L/h, and Q5 = 53 L/h), the smart pebble B had 6 flow conditions (Q2 = 32 L/h, Q3 = 37 L/h, Q4 = 39 L/h, Q5 = 53 L/h, Q6 = 69 L/h, and Q7 = 86 L/h), and the smart pebble C had 6 flow conditions (Q2 = 32 L/h, Q3 = 37 L/h, Q4 = 39 L/h, Q5 = 53 L/h, Q6 = 69 L/h, and Q7 = 86 L/h).
Summarizing the flow conditions, seven constant flow conditions were designed to observe the motion of pebbles at different flow rates, while acceleration sensors collected the acceleration values of pebbles and the ADVs collected the near-bed velocity of the pebbles (Q1 = 30 L/h, Q2 = 32 L/h, Q3 = 37 L/h, Q4 = 39 L/h, Q5 = 53 L/h, Q6 = 69 L/h, and Q7 = 86 L/h). The sediment vibration is a random process due to the pulsation of the water flow and the geometric conditions of the bed location. Therefore, five sets of data were measured for each smart pebble under the same water flow conditions, with each set of data lasting 30 s. Each of these data set corresponded to a different bed position. Before the experiment began, five test points were marked on the bottom of the sink. Once the experiment was prepared, the following steps were repeated for each of the three smart pebbles. First, a given flow was placed for a sufficient period of time. The lateral profile flow velocity 10 cm upstream of the test point was then measured with an ADV to determine if the flow was a fully developed uniform flow. Subsequently, the smart pebble was placed into the test site in the water, its position was secured using metal rods, and the ADV was positioned 10 cm upstream of the smart pebble. After installation, the metal stick was slowly withdrawn from the water. After the acceleration sensor and ADV system had stabilized, the near-bed flow velocity and acceleration values were synchronized and the pebble movement was recorded manually. The experimental procedure is shown in Figure 2.

4. Results

4.1. Pre-Processing of Data

The acceleration output from the sensor is triaxial acceleration (Ax, Ay, and Az). The output acceleration A contains the gravitational acceleration g and the vibration acceleration CA as follows:
A x = g x + C A x A y = g y + C A y A z = g z + C A z
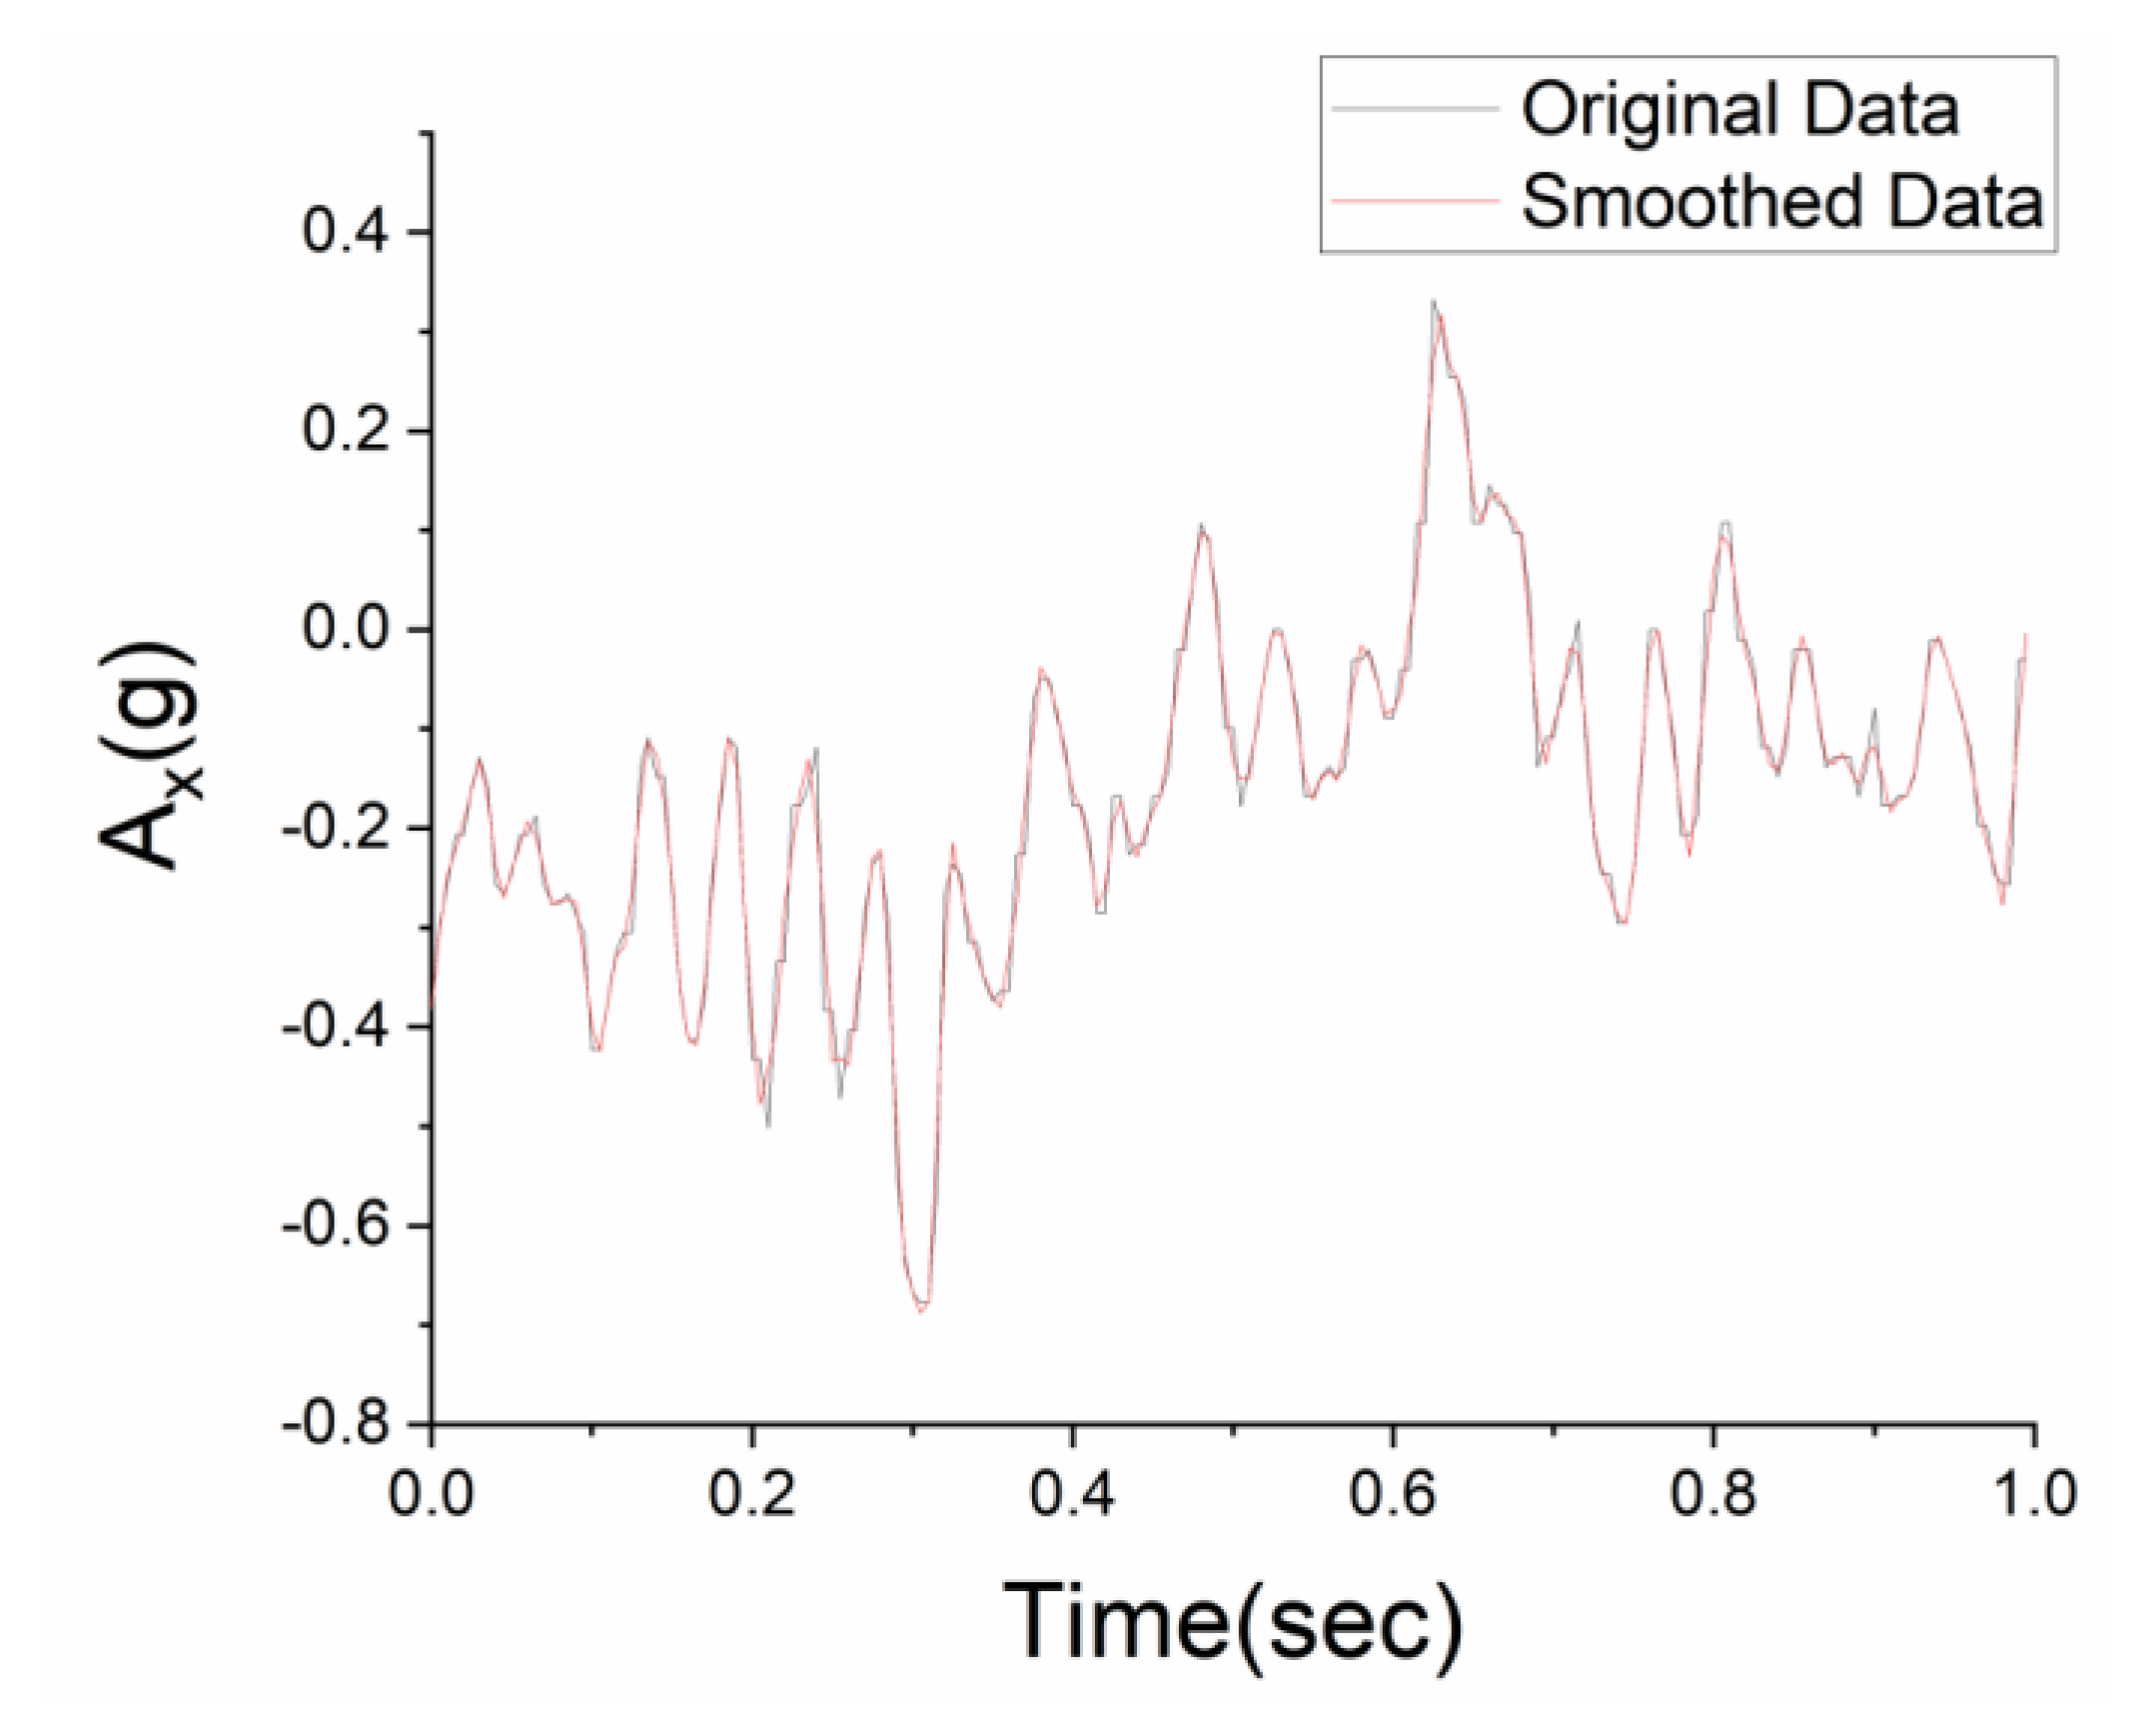
The acceleration sensor has high accuracy, a small size, a large range, and stable and reliable performance. And the digital filtering technology used in the instrument can ensure that the output data are still accurate under harsh conditions. However, observation of the experimental data reveals that there are burrs on the acceleration data curve. In order to improve the accuracy of the data, the raw data are smoothed in this paper (Figure 3).
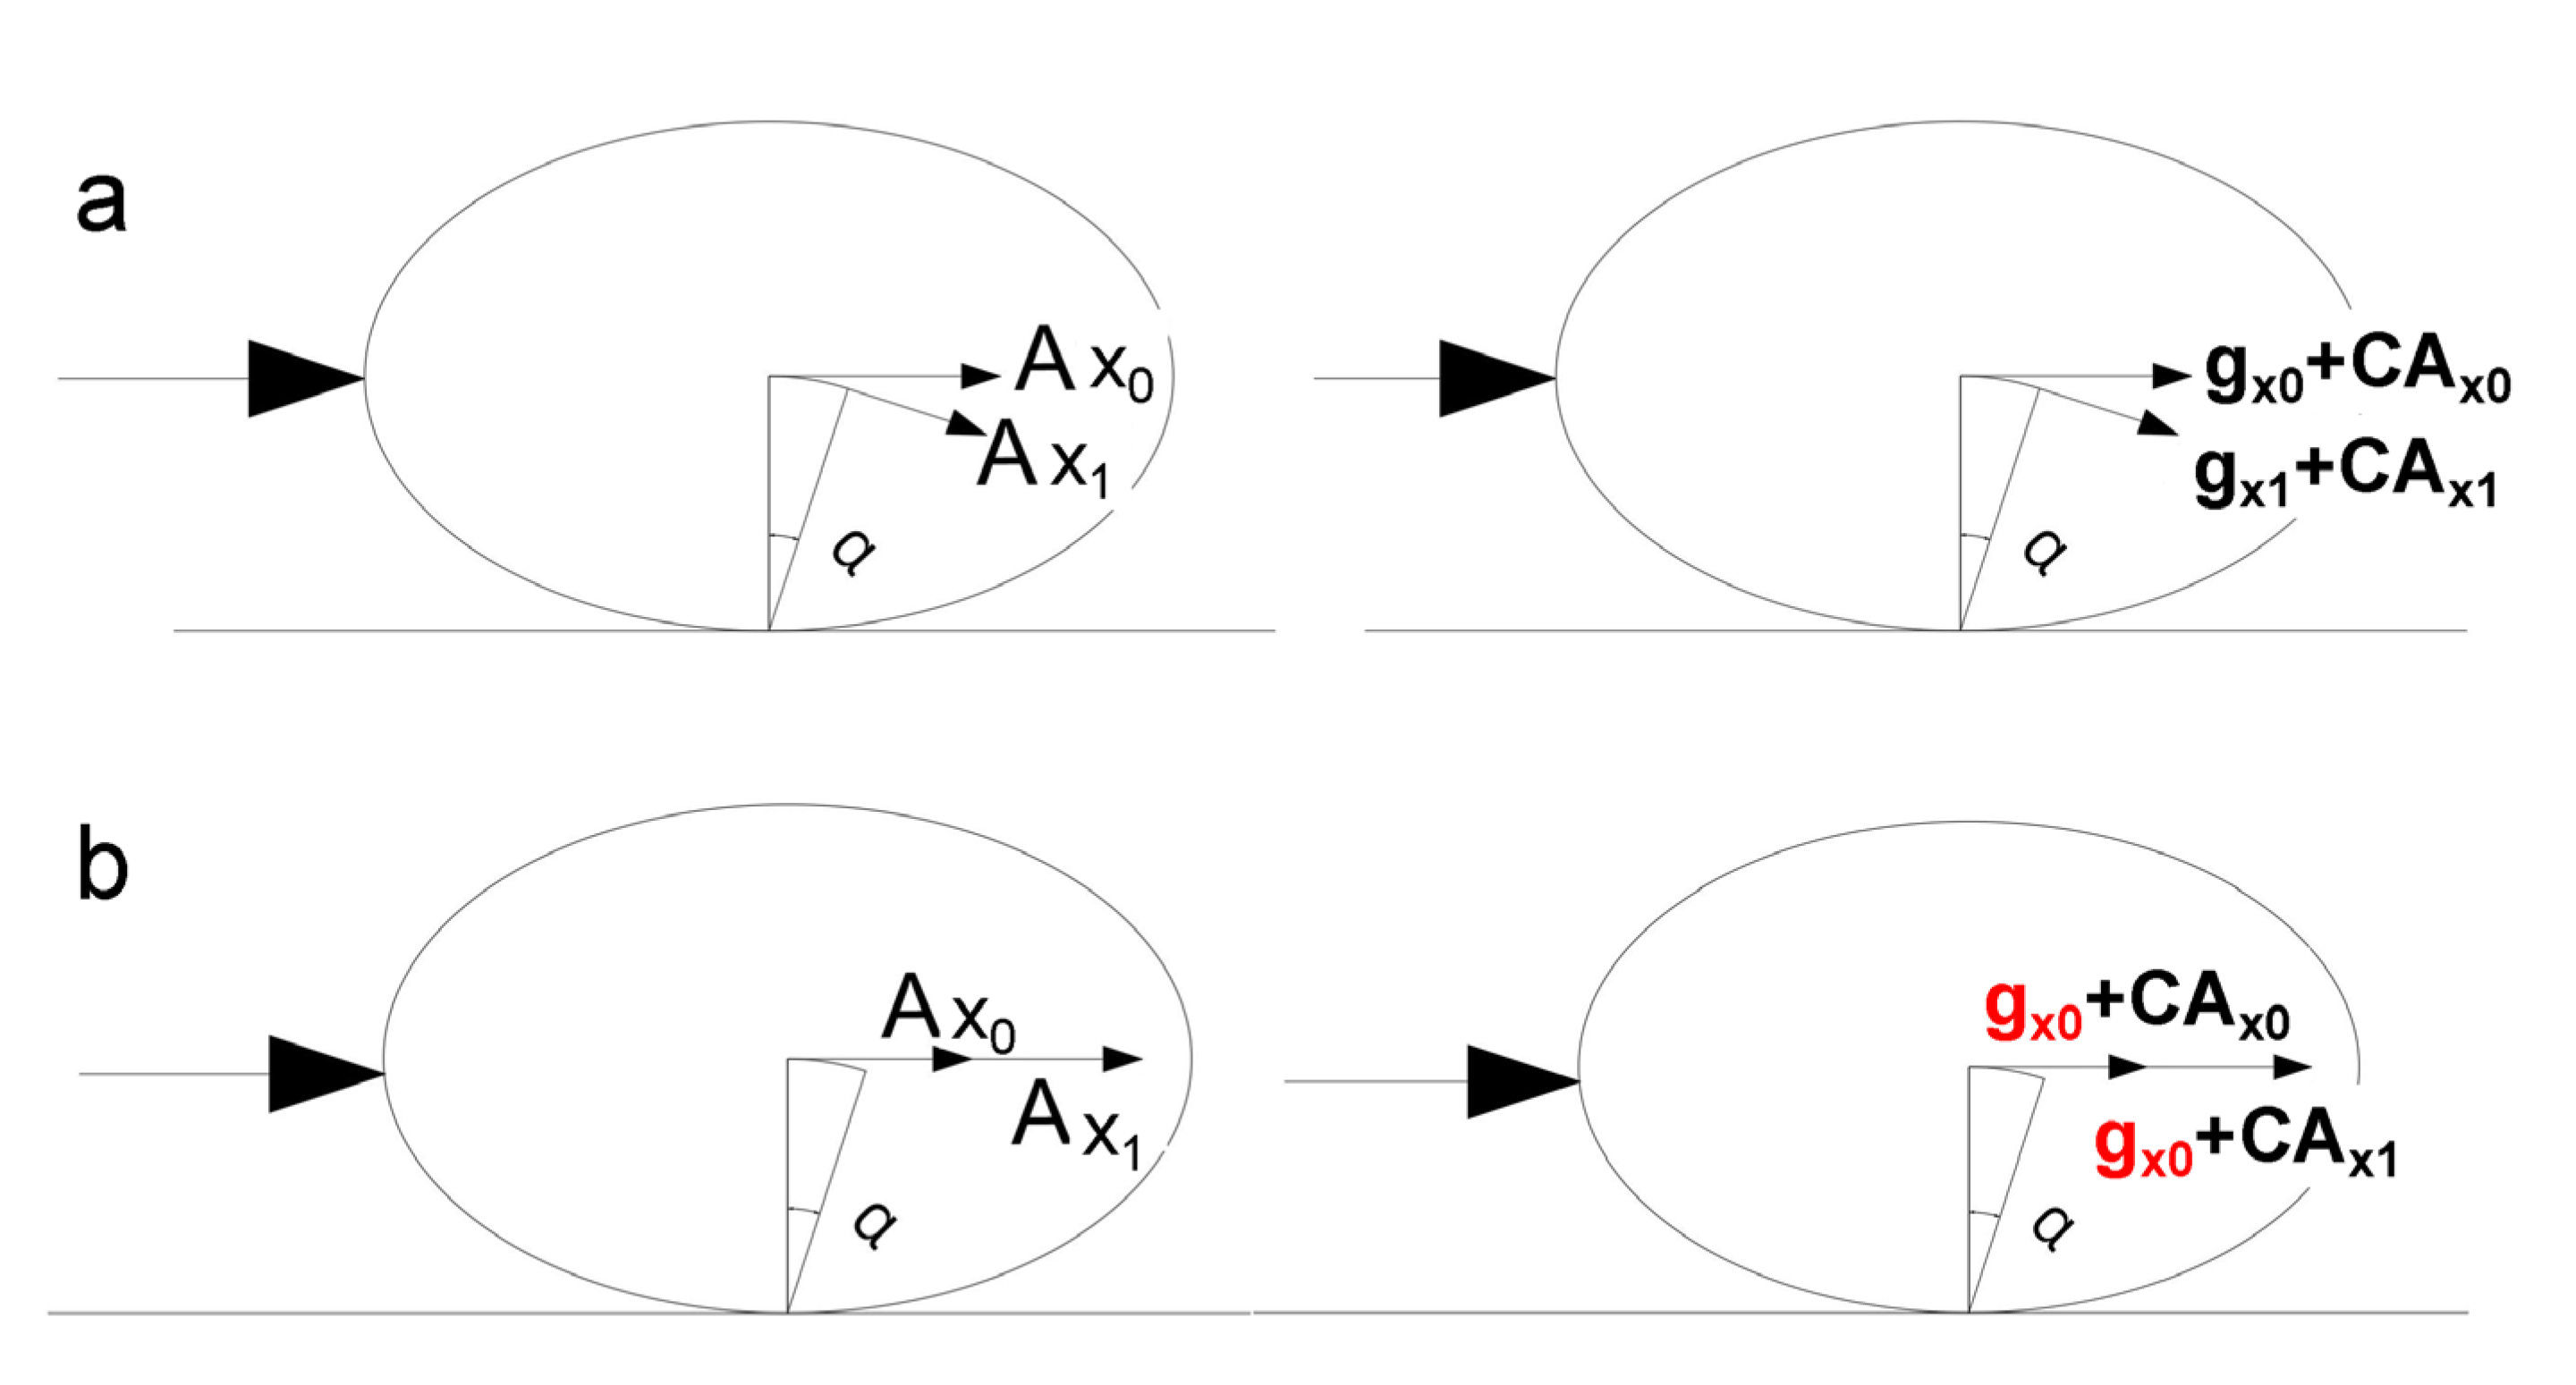
The pebbles are subjected to fluctuations in flow velocity to produce vibration phenomena, and their vibrations are mainly along the flow direction, so the acceleration values in the X-axis direction are analyzed in this paper. Because the acceleration A x collected via the sensor contains gravitational acceleration g x and vibration acceleration C A x , the effect of g x needs to be removed in order to investigate the vibration characteristics of pebbles with different grain sizes. As shown in Figure 4a, the smart pebble is at rest at moment t 0 , and the vibration acceleration C A x 0 = 0 , because A x 0 = g x 0 + C A x 0 , so the gravitational acceleration A x 0 = g x 0 . At moment t 0 + Δ t , the pebble is vibrated by the water flow, and the vibration path is circular; in this situation, the gravitational acceleration changes in magnitude and direction, so g x 1 g x 0 . The vibration at moment t 0 + Δ t acceleration C A x 1 = A x 1 g x 1 . Since g x 1 is unknown, C A x 1 is also unknown. The angle of in situ vibration of the smart pebble is observed experimentally to be small, and it can be concluded that the particle vibrates in a straight line and the gravitational acceleration remains constant, as shown in Figure 4b. Therefore, g x 1 = g x 0 and C A x 1 = A x 1 g x 1 = A x 1 g x 0 . Hence, when calculating the vibration acceleration of the pebble in this paper, the smoothed acceleration A x can be subtracted from the gravitational acceleration g x 0 .

4.2. Pebble Movement State Discrimination

Three smart pebbles were subjected to water flow excitation to produce a nonlinear vibration response. Based on the experimentally collected data and the observed phenomena, 80 sets of data were compiled. Four states of motion of the pebbles were found after analyzing the data. Figure 5 shows the acceleration A x versus time, and C A x in the figure is the acceleration of the pebble vibrating by turbulence. As seen in Figure 5a, the acceleration A x is a straight line with C A x = 0 , so g x = A x , indicating that the gravitational acceleration is constant and the pebble is stationary. The acceleration A x is observed to fluctuate up and down around the baseline (gravitational acceleration g x ) in Figure 5b; C A x 0 , indicating that the pebble is vibrating but not starting. An abrupt change in the baseline in Figure 5c indicates that the gravitational acceleration of the pebble changes and the pebble entrains. A gradual decrease in the baseline in Figure 5d indicates a change in gravitational acceleration and gradual movement of the pebbles.
Table 2 shows the results of the tests under seven water flow conditions:
  • The motion state of smart pebble A: When the flow rate is Q2 = 32 L/h, for the five sets of measurement data, C A x 0 and gravitational acceleration g x remains unchanged, and pebble A is in a vibration state; in this situation, the near-bed velocity v = 29 cm/s is the vibration threshold of particle A. When the flow rate is Q5 = 53 L/h, the pebble at five measurement points moves in the direction of water flow by a combination of jumping and drifting; in this situation, the near-bed velocity (v = 37 cm/s) is the entrainment threshold of particle A. The smart pebble A tends to be flat because of its small height, resulting in an increase in uplift force F L i and a decrease in gravity W i . Under the local transient turbulent force, it is very easy to drift or jump;
  • The motion state of smart pebble B: When the flow rate is Q3 = 37 L/h, three measurement points are stationary and two measurement points experiences vibration, and pebble B begins to vibrate; in this situation, the near-bed velocity v = 32 cm/s is the vibration threshold of the particle B. When the flow rate is Q7 = 86 L/h, of the five measurement points, two rolling and three slowly pushing particle entrainments are identified; in this situation, the near-bed velocity (v = 44 cm/s) is the entrainment threshold of particle B;
  • The motion state of smart pebble C: When the flow rate is Q3 = 37 L/h, measurement points are vibrating; in this situation, the near-bed velocity (v = 32 cm/s) is the vibration threshold of the particle C. When the flow rate is Q7 = 86 L/h, five measurement points of the pebble are directly rolling; in this situation, the near-bed velocity (v = 44 cm/s) is the entrainment threshold of particle C.
As shown in Table 2, the vibration threshold values of both smart pebbles B and C are v = 32 cm/s, but among the five sets of data for pebble B, three sets are stationary and two sets are vibrating, while all five sets of data for pebble C are vibrating, so pebble C vibrates earlier than pebble B. When Q7 = 86 L/h, although both pebbles B and C have five groups of work entrainment, pebble B has two groups rolling and three groups slowly pushing. In contrast, pebble C has no vibration and rolls directly, so pebble C’s entrainment occurs earlier than pebble B. As the pebble height increases, the vibration and entrainment threshold do not increase gradually but follow the law of rising first and then decreasing. From the sediment dynamics equation (Equation (4)), it can be seen that the height of sediment affects the magnitude of lifting force F L i , drag force F D i and gravity W i at the same time, and it is a nonlinear relationship, and the vibration of sediment is determined by all three together, so the vibration response of sediment does not follow a simple law.

5. Discussion

The pebble vibrations at different locations under the same flow rate varied (Figure 6), indicating that the pebble vibrations belong to a stochastic process. To further analyze the effect of particle size on sediment vibration, this paper analyzes the sediment vibration data in the time–frequency domain.

5.1. Time Domain Characteristics of Particle Vibration

In order to analyze the effect of particle size on the vibration characteristics of particles, the vibration data before pebble entrainment were collected and their time–domain characteristic values were statistically analyzed in this paper. Smart pebble A collected vibration data in the cases of flow rate Q2 = 32 L/h, Q3 = 37 L/h, and Q4 = 39 L/h; smart pebble B collected vibration data in the cases of flow rate Q3 = 37 L/h, Q4 = 39 L/h, Q5 = 53 L/h, and Q6 = 69 L/h; and smart pebble C collected vibration data in the cases of flow rate Q3 = 37 L/h, Q4 = 39 L/h, Q5 = 53 L/h and Q6 = 69 L/h. The number of samples per group was N = 6000 and the collection time was t = 30 s. Due to the pebble entrapment event, only pre-entrapment data could be collected. When flow rate at the time of smart pebble A entrapment was Q5 = 53 L/h, four sets of effective vibration data before entrapment were collected; N = 627~5163 and the effective collection time t = 3.135~25.815 s. When the flow rate at the time of smart pebble B entrapment was Q7 = 86 L/h, five sets of effective vibration data before entrapment were collected; N = 627~2299 and the effective collection time t = 3.135~11.495 s. When the flow rate of smart pebble C entrainment was Q7 = 86 L/h, there was no vibration before entrainment, but due to direct rolling, there were no effective vibration data.
Analysis of the vibration acceleration data of the three smart pebbles showed that the statistical parameters varied under the same water flow conditions and were not regular, indicating that the pebble vibration is a random process. The mean values of vibration acceleration were found to be greater than zero in 47 out of 64 sets of data, indicating that most of the smart pebbles vibrated in the direction of water flow under turbulence. A small number of particles vibrated in the opposite direction because the pebbles were located in a raised position, which prevented them from vibrating forward. To eliminate the randomness of the bed position, the characteristic parameters were averaged in this paper under the same flow rate, as shown in Table 3. As can be seen from Table 3, the mean squared deviation of pebbles A and B tends to increase as the flow rate increases before the threshold value, indicating that the discrete degree of vibration acceleration is enhanced. However, near the entrainment threshold, the mean square deviation decreases, and the vibration acceleration dispersion weakens. The time domain parameter characteristics of the smart pebbles are consistent with those found by Ping-Yi Wang et al. However, as the pebble height continues to increase, the mean squared difference of pebble C first decreases and then increases, and the pebble rolls directly when approaching the entrainment threshold.
Root mean square value analysis is a common data analysis method in signal processing, which mainly analyzes the average effective energy of the signal, and its expression is,
A r m s = 1 N i = 1 N X i 2
where X i is the vibration acceleration value and N is the number of vibration acceleration samples.
Since pebble vibration is a stochastic process, this paper averages the vibration intensity of the same water flow conditions. It then analyzes the effect of the particle size on the pebble vibration intensity.
Figure 7 shows the relationship between the near-bed velocities and the vibration intensity of the three smart pebbles. It can be seen from the figure that the vibration intensity of smart pebbles A and B increases with the flow velocity before approaching the threshold value and decreases when approaching the threshold value. This result is consistent with William’s [32] observations for solid particles. However, smart pebble C increases with the flow rate, and the vibration intensity first weakens and then strengthens, and near the entrainment threshold it rolls directly. From the sediment dynamics equation (Equation (4)), it can be seen that the sediment vibration is controlled by the uplift force F L i , drag force F D i and gravity W i . Due to the height of the pebbles, the three forces affect the sediment vibration with different weights. When the pebble height increases to hC, the drag force plays a major role. After the vibration of pebble C is generated, the vibration pivot point is shifted forward as the flow rate increases, leading to an increase in the resistance moment, so the vibration intensity is weakened. When the flow rate increases further, the drag force overcomes the resistance, and pebble C’s vibration intensity rises again. At the final critical entrainment threshold, the drag force is greater than the resistance, and pebble C vibrates in one direction and rolls directly with the current. Therefore, the effect of height on sediment vibration does not follow a simple law.
Figure 8a shows the values of pebble vibration intensity at different heights for flow rates Q3 = 37 L/h, Q4 = 39 L/h, and Q5 = 53 L/h. From the figure, it can be seen that when Q3 = 37 L/h and Q4 = 39 L/h, the pebble vibration intensity decreases and then increases with the increase in height, while, when Q5 = 53 L/h, the vibration intensity shows an increasing trend. Therefore, as the particle size changes, the vibration intensity develops a random nature. To further analyze the effect of particle size on sediment vibration, the vibration intensity of the pebbles under each water flow condition is averaged in this paper. Figure 8b shows the relationship between the mean value of vibration intensity and the height of pebbles. It can be seen from the figure that the mean value of pebble vibration intensity increases gradually with the increase in height.

5.2. Spectral Characteristics of Particle Vibration

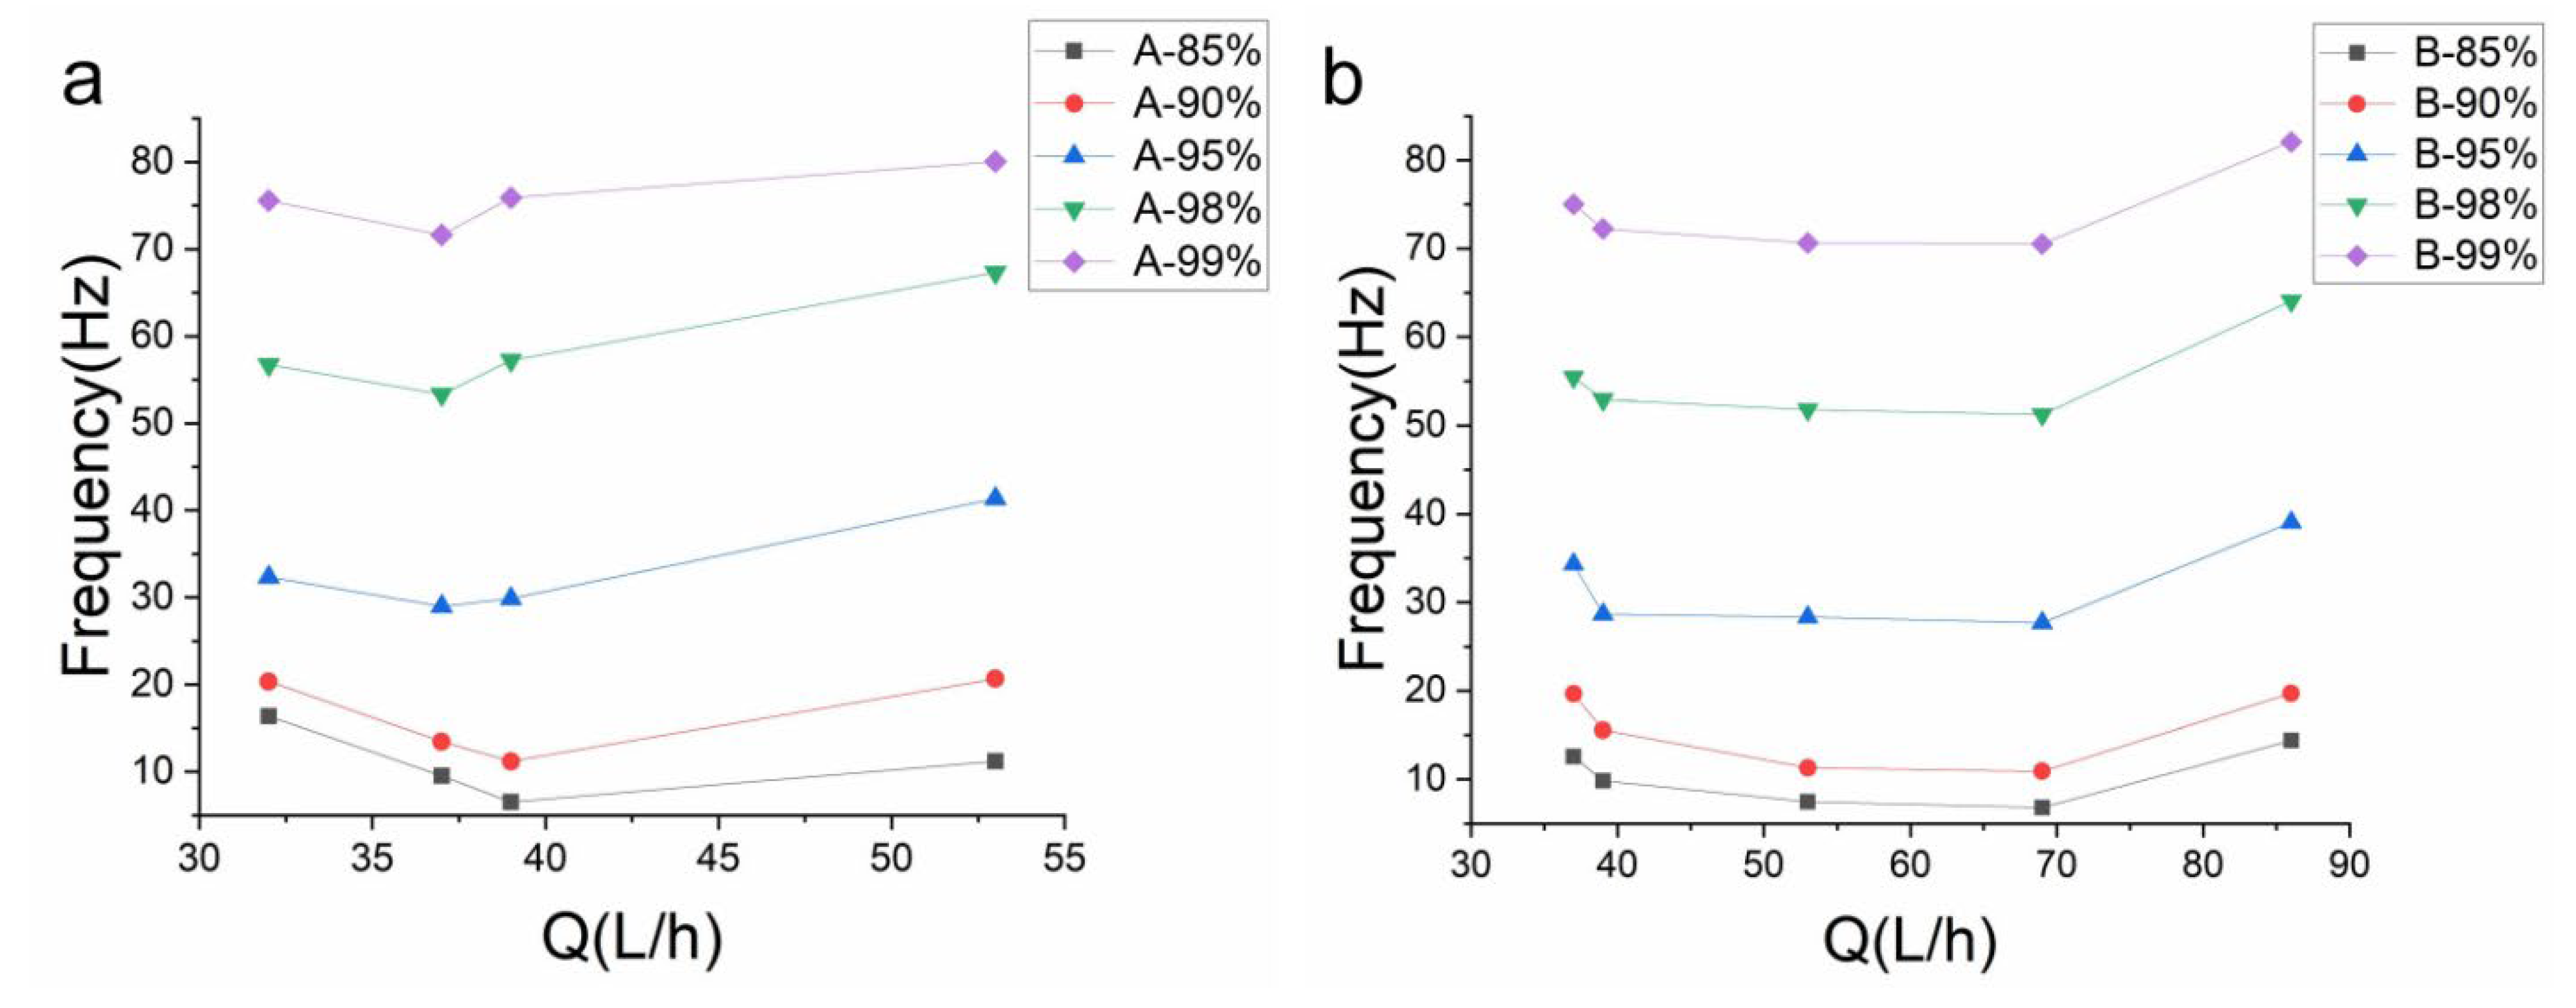
Frequency domain analysis provides an understanding of the spectral characteristics and frequency components of a signal, leading to a better understanding of the signal. In this paper, the vibration acceleration signal is subjected to fast Fourier transformation to analyze its characteristics. To analyze the vibration characteristics of pebbles with different particle sizes, the distribution of frequencies with varying ratios of energy is counted in this study. This paper focuses on the frequency values when the energy accounts for 85%, 90%, 95%, 98% and 99% of the entire frequency energy. Since pebble vibration is a random process, the frequencies at the same flow rate are averaged. From Table 4, it can be seen that 98% of the energy of the particle vibration signal is concentrated in the range of 70 Hz.
Figure 9 and Figure 10 show the vibration frequencies of the three smart pebbles versus the flow rate. From Figure 9, it can be seen that the vibration frequency of pebbles A and B tends to decrease as the flow rate increases, but increases when approaching the entrainment threshold. From Figure 10, it can be seen that for pebble C, as the flow rate increases, the vibration frequency first increases and then decreases, and when approaching the entrainment threshold, pebble C rolls directly. Because the effective action of energy of the water flow is limited, when the pebble height is low, as the flow velocity increases, the pebble vibration intensity increases and the vibration frequency decreases. Near the entrainment threshold, the vibration energy weakens and the vibration frequency increases. When the pebble height exceeds a certain threshold value, the vibration pivot point is shifted, the pebble drag force is enhanced, the vibration intensity is weakened, and the vibration frequency increases. When the flow velocity further increases, the drag force overcomes the resistance, pebble C’s vibration intensity is enhanced again, and the vibration frequency decreases. At the critical entrainment threshold, the drag force is greater than the resistance, and pebble C rolls directly. From the sediment dynamics equation (Equation (4)), it can be seen that the nonlinear changes in uplifting force F L i , drag force F D i and gravity W i lead to the nonlinearity of the sediment vibration response, so the final characterized law is also nonlinear.
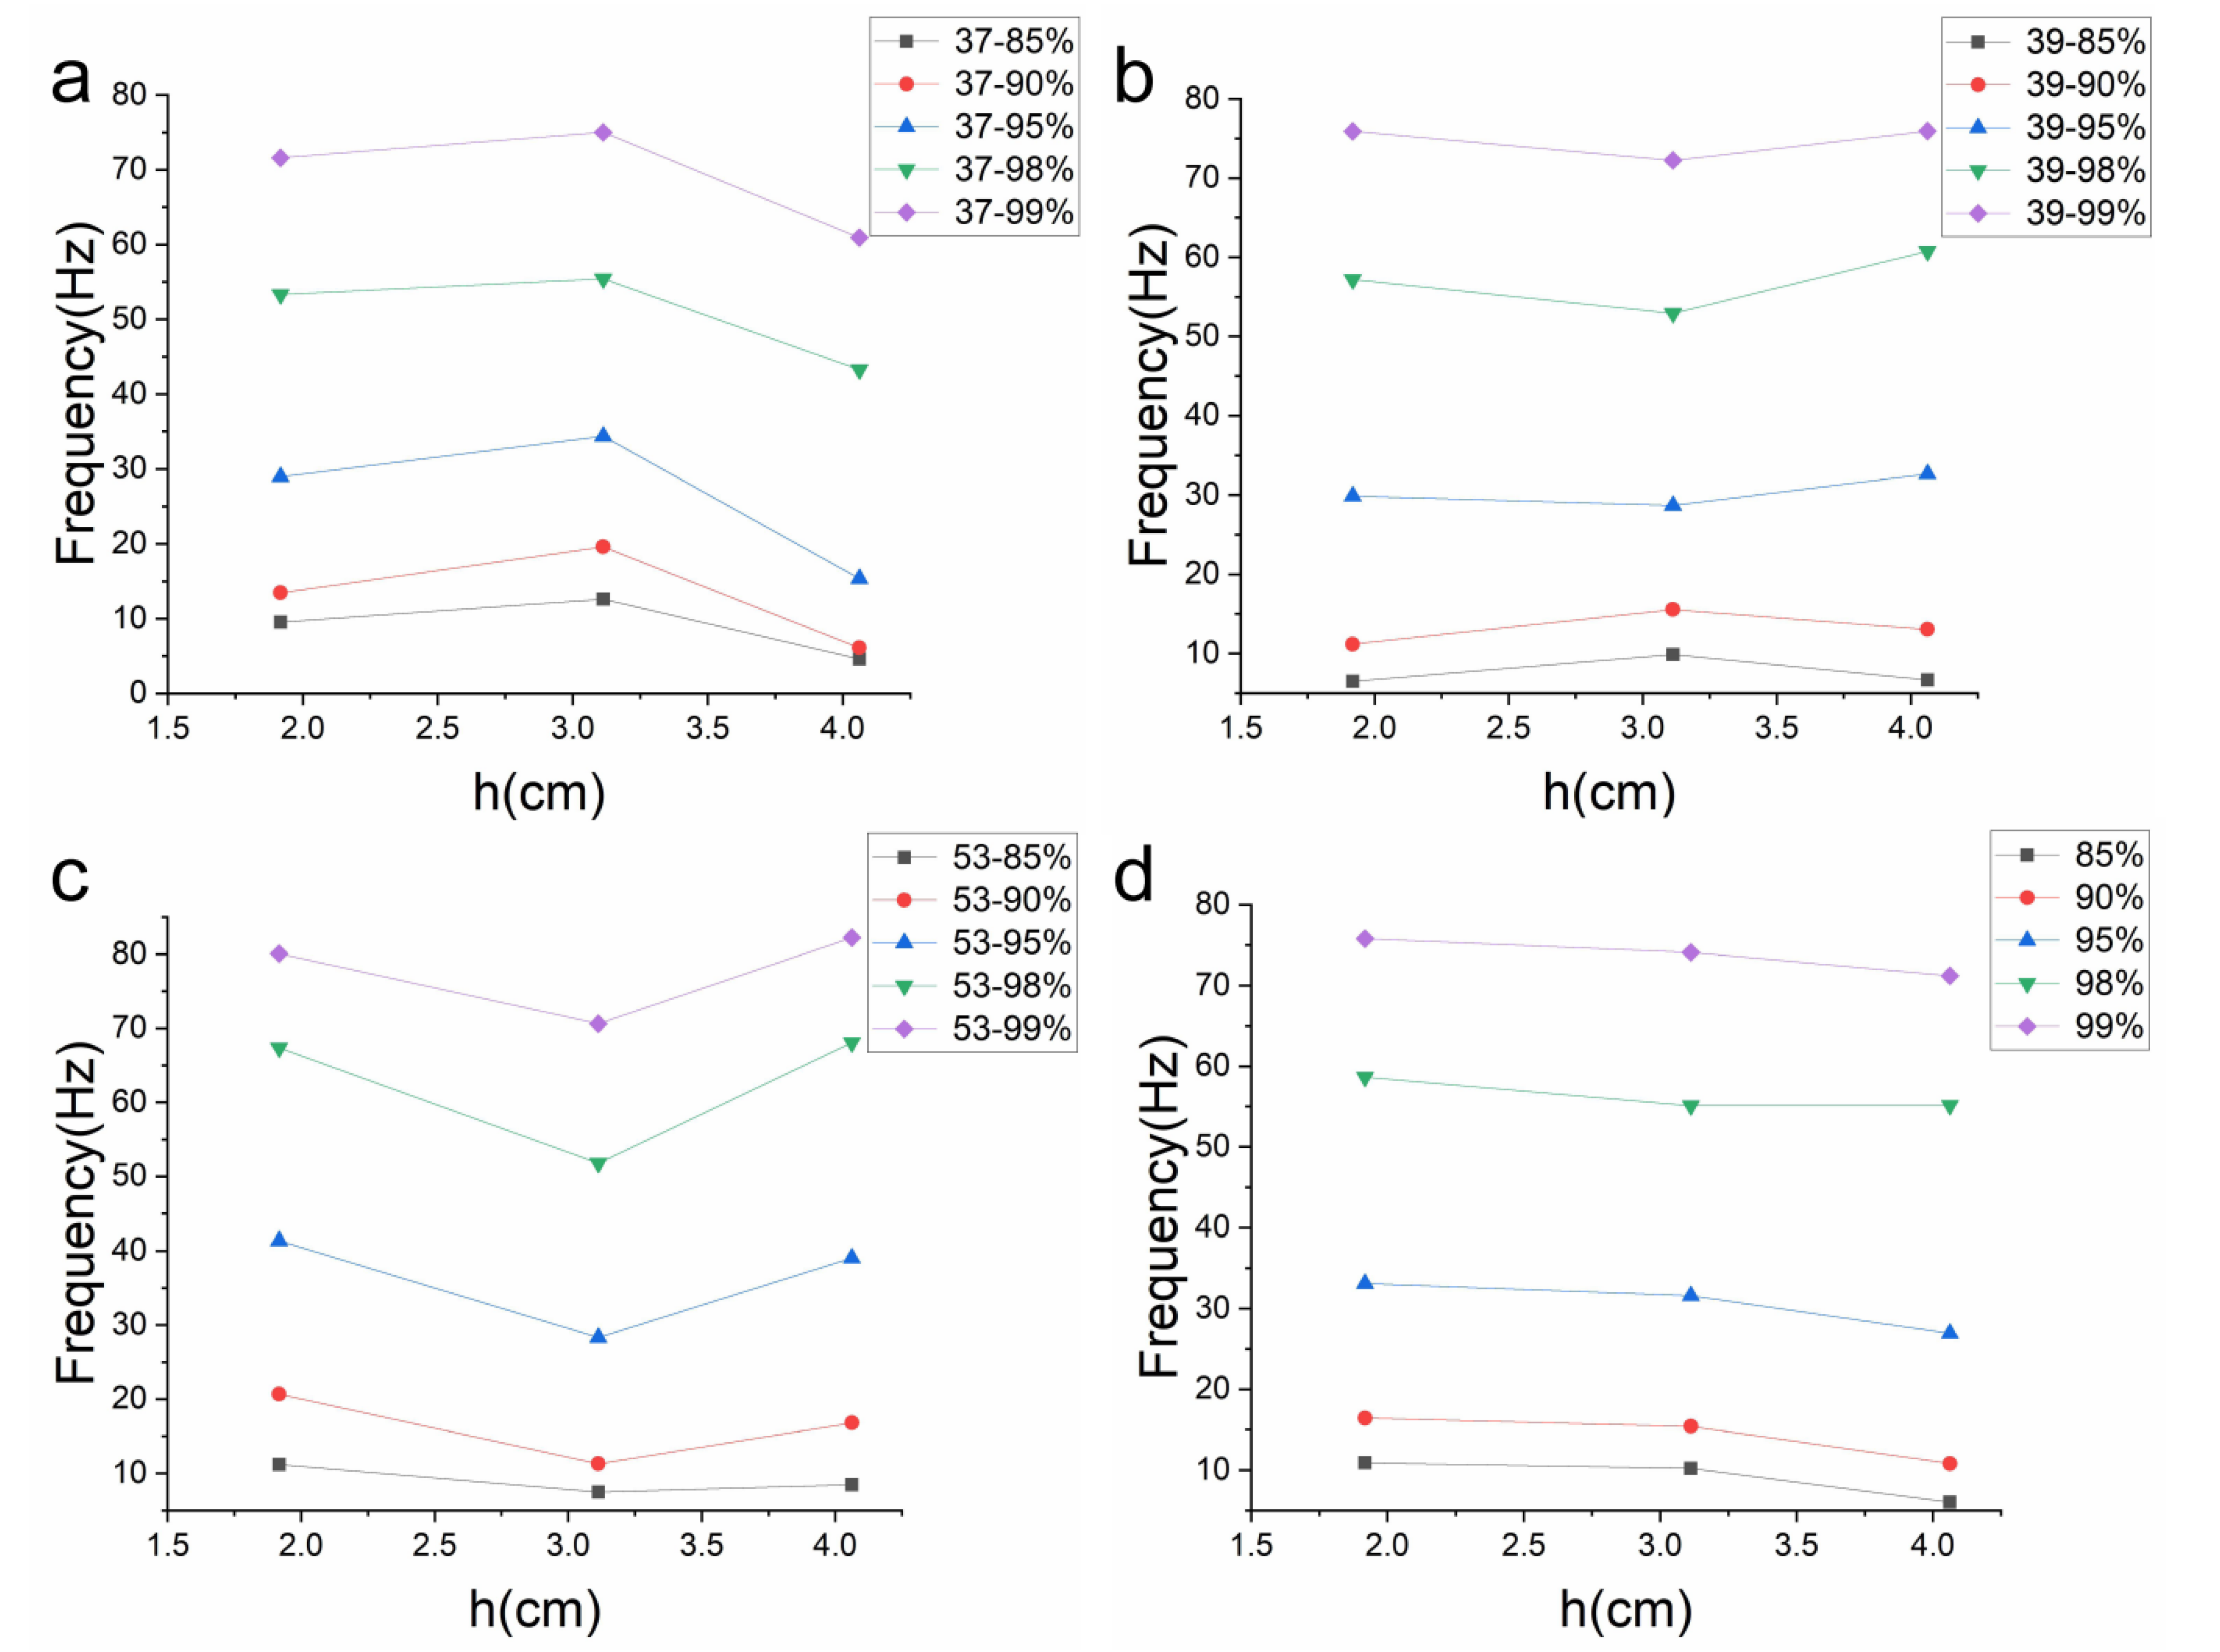
Figure 11a–c show the vibration frequency distribution of different particle sizes under the same water flow conditions. It can be seen that when the flow rates are Q3 = 37 L/h, Q4 = 39 L/h, and Q5 = 53 L/h, with the increase in particle size, part of the vibration frequency increases and then decreases, and part of the vibration frequency first decreases and then increases. Therefore, the effect of the particle size on the sediment vibration frequency does not follow a simple law. To explore the effect of the particle size on the vibration frequency of sediment, the vibration frequencies of pebbles A, B and C under different water flow conditions are averaged. Figure 11d shows a plot of the mean value of the vibration frequency versus the pebble height. It can be seen that the pebble vibration frequency gradually decreases as the height increases.

6. Conclusions

Based on the vibration or swaying phenomenon before sediment particle entrapment, three natural pebbles—A, B and C—with different heights (hA < hB < hC) were selected in this study, and the vibration processes of the pebbles on the rough bed was measured using a miniature inertial accelerometer. This study is the first to investigate the effect of the particle size on the vibration characteristics of pebbles, and the main findings are as follows:
  • The sediment motion belongs to the category of nonlinear dynamics. The height of the sediment also affects the magnitude of the lifting force F L i drag force F D i and gravity W i , and the relationship is nonlinear, so the final characterization of the sediment vibration is also nonlinear;
  • The vibration intensity of pebbles A and B tended to increase before approaching the entrapment threshold, but weakened when approaching the entrapment threshold. In contrast, the vibration intensity of pebble C decreased and then increased, and rolled directly when approaching the entrainment threshold. The average vibration intensity of the pebbles increased with height;
  • The distribution of the vibration intensity and frequency of pebbles at different heights under the same flow conditions does not follow a simple law;
  • With an increase in flow rate, the vibration frequency of pebbles A and B showed an increasing trend before approaching the entrainment threshold, but decreased near the entrainment threshold. The vibration frequency of pebble C, on the other hand, decreased and then increased, and had no vibration frequency near the entrainment threshold. The average vibration frequency of pebbles decreased with increasing height;
  • This paper is the first to explore the one-dimensional kinetic law of nudibranchs, which provides a reference for the study of the three-dimensional kinetic mechanism of nudibranchs in mountain rivers, and ultimately provides a theoretical guidance for the sustainable development and utilization of rivers.

Author Contributions

J.Y.: conceptualization, methodology, experiments, data analysis, writing—original draft preparation; P.W.: conceptualization, writing—review and editing, funding acquisition; M.W. (Meili Wang): experiments, data curation; M.W. (Mi Wang): experiments, validation. All authors have read and agreed to the published version of the manuscript.

Funding

This work was supported by the National Key R&D Program Funding Projects (No. 2018YFB1600400), the Natural Science Foundation of Chongqing (No. cstc2021jcyj-msxmX0667), the Science and Technology Research Project of Chongqing Municipal Education Commission (No. KJQN202104304), and the Science and Technology Research Project of Chongqing Municipal Education Commission (No. KJQN202004308).

Institutional Review Board Statement

Not applicable.

Informed Consent Statement

Not applicable.

Data Availability Statement

The data presented in this study are available on request from the corresponding author. The data are not publicly available due to privacy concerns.

Acknowledgments

The authors would like to thank the Editors and reviewer for their valuable comments and detailed suggestions.

Conflicts of Interest

The authors declare no conflict of interest.

References

  1. Nelson, J.M.; Shreve, R.L.; McLean, S.R.; Drake, T.G. Role of Near-Bed Turbulence Structure in Bed Load Transport and Bed Form Mechanics. Water Resour. Res. 2010, 31, 2071–2086. [Google Scholar] [CrossRef]
  2. Celik, A.O. Experimental Investigation of the Role of Turbulence Fluctuations on Incipient Motion of Sediment. Ph.D. Thesis, Virginia Tech, Blacksburg, VA, USA, 2011. [Google Scholar]
  3. Lee, H.; Ha, M.Y.; Balachandar, S. Work-based criterion for particle motion and implication for turbulent bed-load transport. Phys. Fluids 2012, 24, 1–73. [Google Scholar]
  4. Amir, M.; Nikora, V.I.; Stewart, M.T. Pressure forces on sediment particles in turbulent open-channel flow: A laboratory study. J. Fluid Mech. 2014, 757, 458–497. [Google Scholar]
  5. Cecchetto, M.; Tregnaghi, M.; Bottacin-Busolin, A.; Tait, S.; Marion, A. Statistical Description on the Role of Turbulence and Grain Interference on Particle Entrainment from Gravel Beds. J. Hydraul. Eng. 2016, 143, 06016021. [Google Scholar] [CrossRef] [Green Version]
  6. Shih, W.; Diplas, P.; Celik, A.O.; Dancey, C. Accounting for the role of turbulent flow on particle dislodgement via a coupled quadrant analysis of velocity and pressure sequences. Adv. Water Resour. 2017, 101, 37–48. [Google Scholar]
  7. Prancevic, J.P.; Lamb, M.P. Particle friction angles in steep mountain channels. J. Geophys. Res. Earth Surf 2015, 120, 242–259. [Google Scholar]
  8. Diplas, P.; Dancey, C.L.; Celik, A.O.; Valyrakis, M.; Greer, K.; Akar, T. The role of impulse on the initiation of particle move-ment under turbulent flow conditions. Science 2008, 322, 717–720. [Google Scholar]
  9. Celik, A.O.; Diplas, P.; Dancey, C.L. Instantaneous pressure measurements on aspherical grain under threshold flow conditions. Fluid Mech. 2014, 741, 60–97. [Google Scholar] [CrossRef] [Green Version]
  10. Celik, A.O.; Diplas, P.; Dancey, C.L. Instantaneous turbulent forces and impulse on a rough bed: Implications for initiation of bed material movement. Water Resour. Res. 2013, 49, 2213–2227. [Google Scholar]
  11. Valyrakis, M.; Diplas, P.; Dancey, C.L.; Greer, K.; Celik, A.O. Role of instantaneous force magnitude and duration on particle entrainment. J. Geophys. Res. 2010, 115, F02006. [Google Scholar]
  12. Valyrakis, M.; Diplas, P.; Dancey, C.L. Entrainment of coarse particles in turbulent flows: An energy approach. J. Geophys. Res. Earth Surf. 2013, 118, 42–53. [Google Scholar]
  13. Garcia, C.; Cohen, H.; Reid, I.; Rovira, A.; Úbeda, X.; Laronne, J.B. Processes of initiation of motion leading to bedload transport in gravel-bed rivers. Geophys. Res. Lett. 2007, 34, 125–141. [Google Scholar]
  14. Maniatis, G.; Hoey, T.B.; Hassan, M.A.; Sventek, J. Calculating of Explicit Probability of Entrainment Based on Inertial Acceleration Measurements. J. Hydraul. Eng. 2017, 143, 04016097. [Google Scholar] [CrossRef] [Green Version]
  15. Ma, F. Law of Sediment Particle Movement and Nonlinear Analysis. Ph.D. Thesis, Tianjin University, Tianjin, China, 2012. [Google Scholar]
  16. Li, C.; Chen, D.; Ge, F.; Chen, Y. Fractional derivative modeling for suspended sediment in unsteady flows. Commun. Nonlinear Sci. Numer. Simul. 2019, 79, 104971. [Google Scholar]
  17. Wang, X.K.; Ao, R.Z.; Fang, D. Nonlinearstudy on sediment incipient motion condition and itsmechanism. J. Yangtze River Sci. Inst. 1999, 16, 39–41. [Google Scholar]
  18. Yang, J.R.; Fang, D.; He, W.S.; Liu, X.N. Nonlinearstudy on transport rate of bed-load. J. Hydraul. Eng. 2003, 14, 36–40. [Google Scholar]
  19. He, W.S.; Cao, S.Y.; Lei, X.Z.; Liu, X.N. Nonlinear theory for incipient condition of sediment. J. Hydraul. Eng. 2004, 35, 28–32. [Google Scholar]
  20. Bai, Y.C.; Xu, H.J.; Xu, D.; Chiu-on, N.G. Nonlineardynamics of the process of bed-load transport. Chin. Sci. Technol. Sci. 2006, 36, 751–772. [Google Scholar]
  21. Yang, J.R.; Fang, D.; He, W.S.; Li, W.P. The nonlinearcusp-catastrophe model of incipient motion of non-uniform sediment. J. Hydraul. Eng. 2003, 34, 34–38. [Google Scholar]
  22. Xu, X.Y.; Zhang, G.; Zhou, S.; Wang, Y.; Chen, X.; Liu, Y. Formula of bedload sediment transport based on nonlinear theory. J. Hydroelectr. Eng. 2019, 38, 20–28. [Google Scholar]
  23. Akeila, E.; Salcic, Z.; Swain, A. Smart pebble for monitoring riverbed sediment transport. Sens.J. 2010, 10, 1705–1717. [Google Scholar] [CrossRef]
  24. Šolc, T.; Stefanovska, A.; Hoey, T.; Mikoš, M. Application of an instrumented tracer in an abrasion mill for rock abrasion studies. Stroj. Vestn. J. Mech. Eng 2012, 58, 263–270. [Google Scholar] [CrossRef]
  25. Maniatis, G.; Hoey, T.; Hodge, R.; Rickenmann, D.; Badoux, A. Inertial drag and lift forces for coarse grains on rough alluvial beds measured using in-grain accelerometers. Earth Surf. Dyn. 2020, 8, 1067–1099. [Google Scholar]
  26. Gronz, O.; Hiller, P.H.; Wirtz, S.; Becker, K.; Iserloh, T.; Seeger, M.; Brings, C.; Aberle, J.; Casper, M.C.; Ries, J.B. Smartstones: A small 9-axis sensor implanted in stones to track their movements. CATENA 2016, 142, 245–251. [Google Scholar]
  27. Dost, J.B.; Gronz, O.; Casper, M.C.; Krein, A. The potential of Smartstone probes in landslide experiments: How to read motion data. Nat. Hazards Earth Syst. Sci. 2020, 20, 3501–3519. [Google Scholar]
  28. Curley, E.; Valyrakis, M.; Thomas, R.; Adams, C.; Stephen, A. Smart Sensors To Predict Entrainment Of Freshwater Mussels: A New Tool In Freshwater Habitat Assessment. Sci. Total Environ. 2021, 787, 147586. [Google Scholar]
  29. AlObaidi, K.; Valyrakis, M. Linking the explicit probability of entrainment of instrumented particles to flow hydrodynamics. Earth Surf. Process. Landf. 2021, 46, 2448–2465. [Google Scholar] [CrossRef]
  30. Xie, Y.; Melville, B.W.; Shamseldin, A.Y.; Whittaker, C.N.; Yang, Y. Direct measurement of the inertial drag and lift forces on entrained coarse particles at various protrusion heights. Earth Surf. Process. Landf. 2021, 48, 371–385. [Google Scholar] [CrossRef]
  31. Wang, P.; Yuan, J.; Wang, M.; Wang, M. Sediment vibration characteristics based on accelerometer measurements. Sci. Rep. 2023, 13, 1205. [Google Scholar] [CrossRef]
  32. Williams, J.J.; Butterfield, G.R.; Clark, D.G. Aerodynamic entrainment threshold: Effects of boundary layer flow conditions. Sedimentology 1994, 41, 309–328. [Google Scholar] [CrossRef]
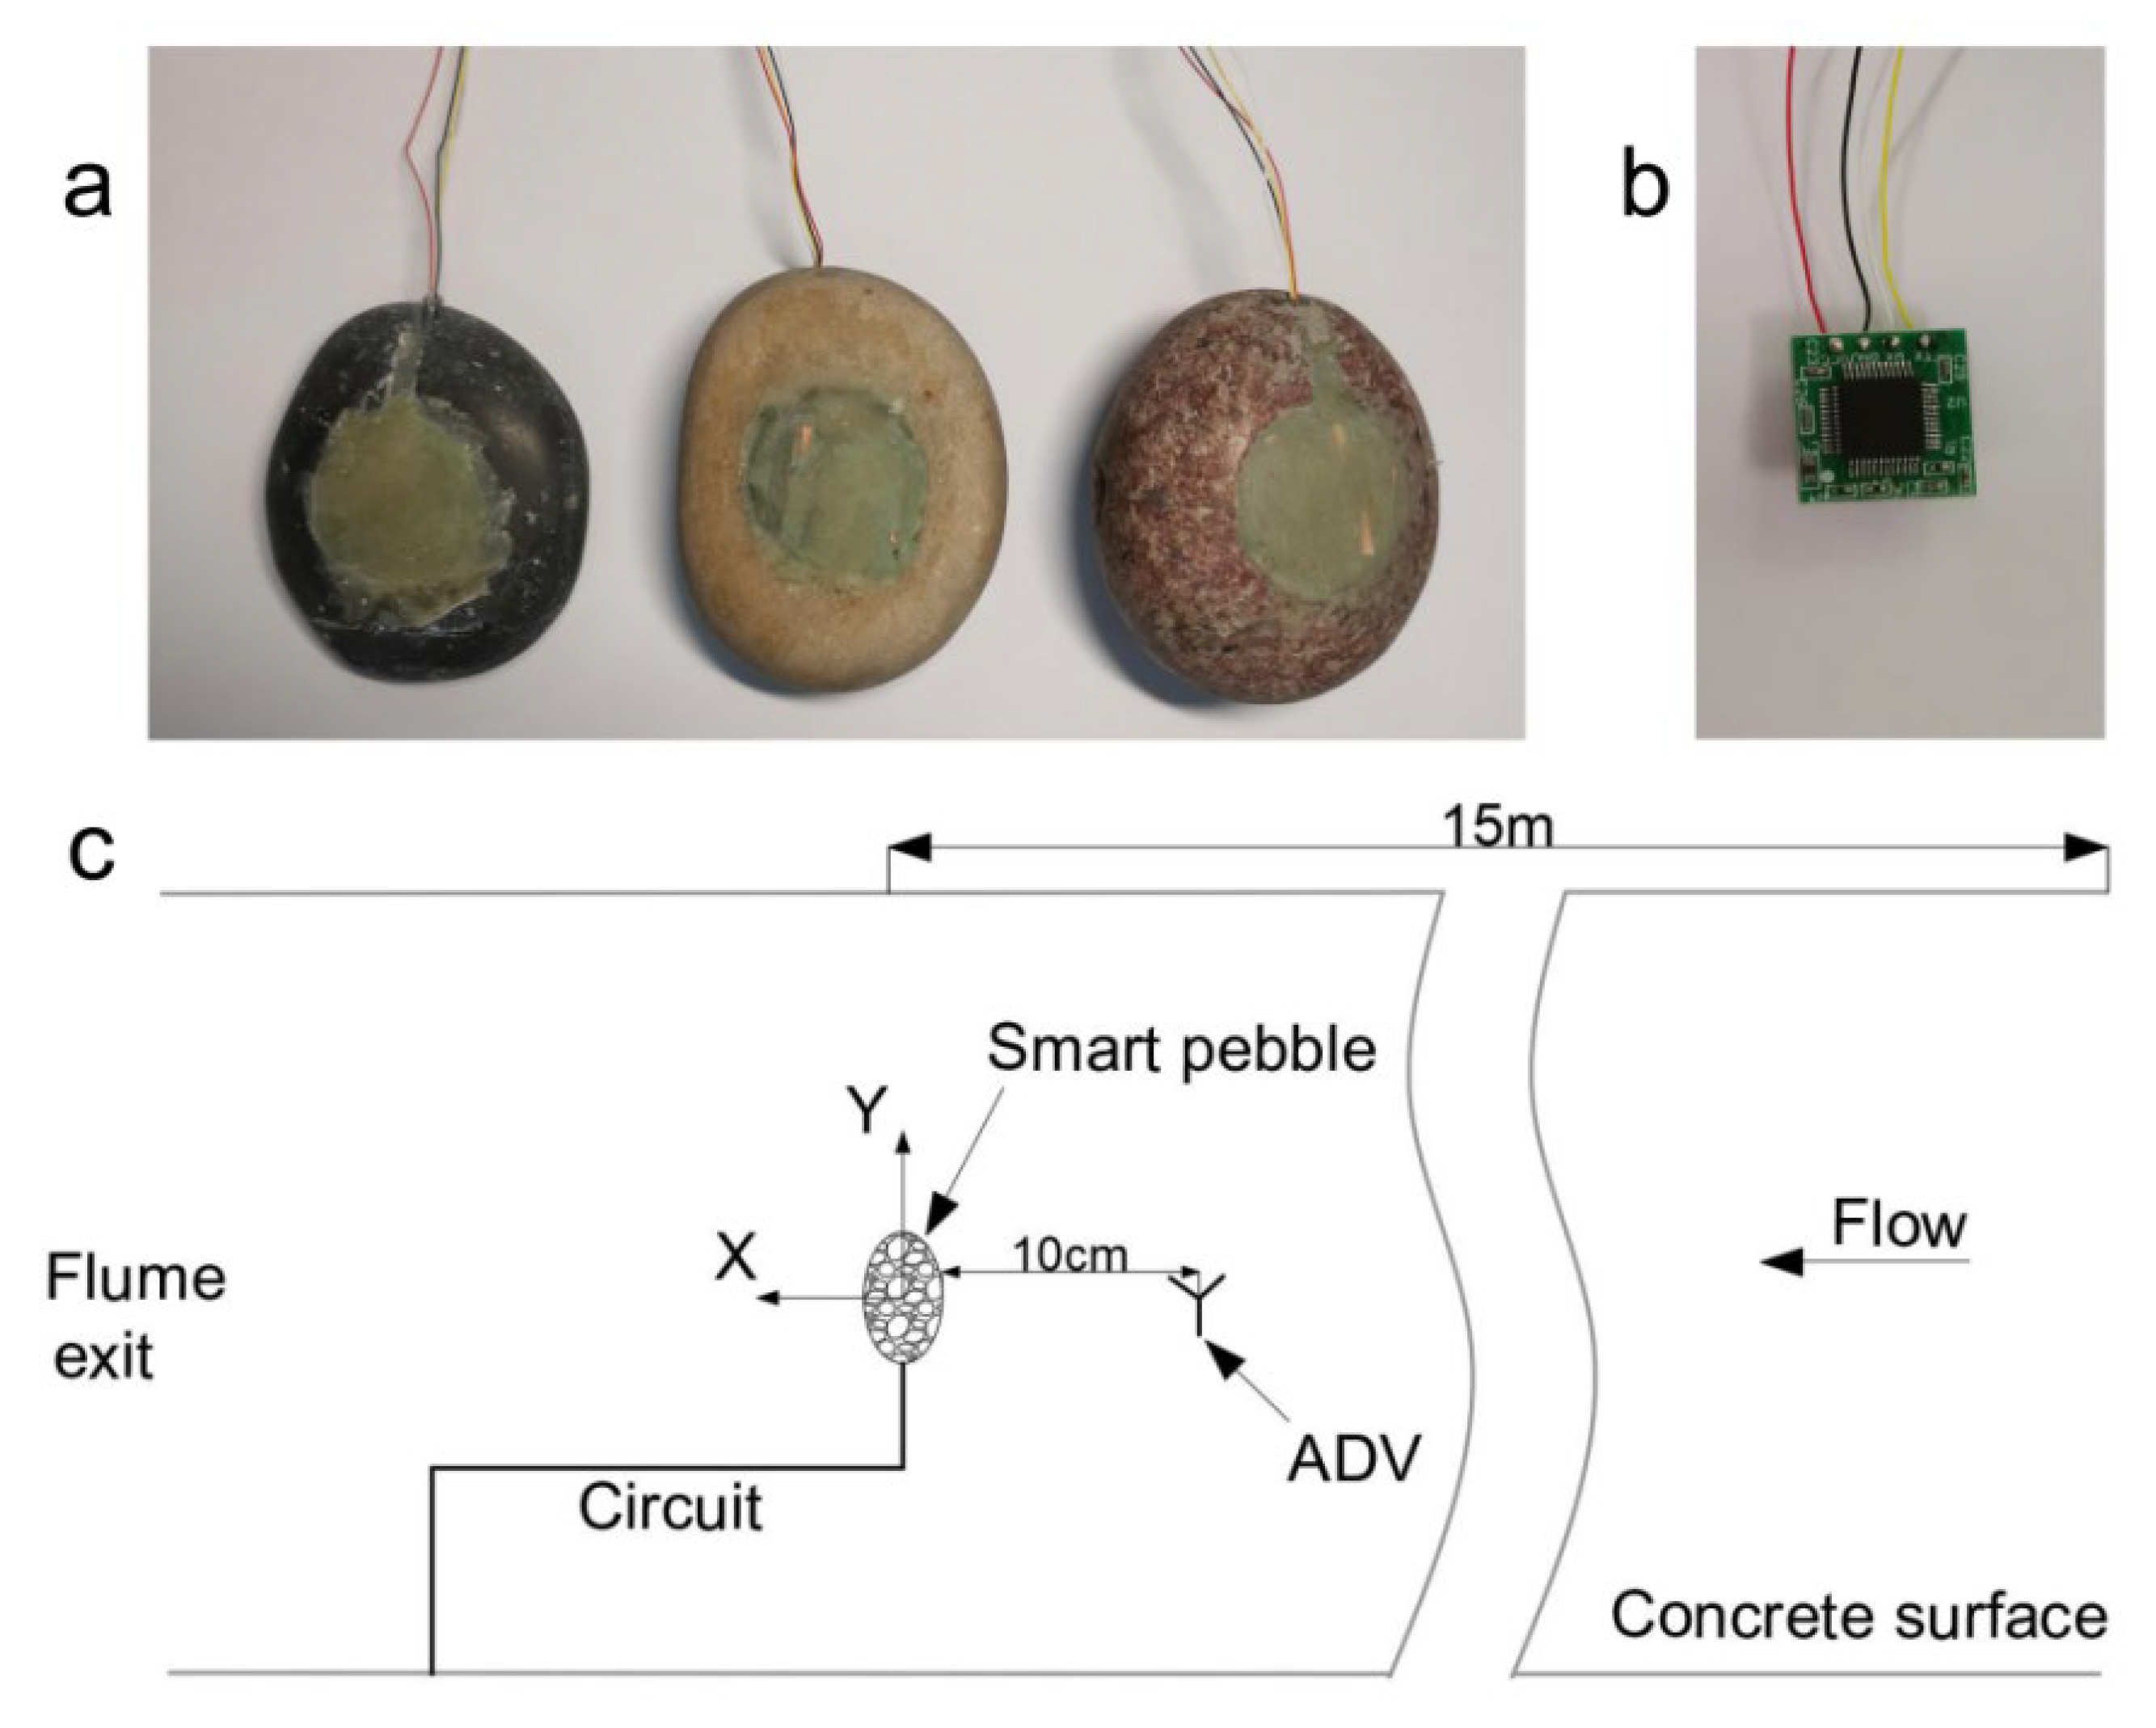
Figure 1. Pictures related to the experimental design. (a) Three smart pebbles; (b) customized acceleration sensor; (c) design of water tank experiment (top view).
Sustainability 15 11972 g001
Figure 2. Smart pebble vibration experiment.
Sustainability 15 11972 g002
Figure 3. Original data and smoothed data.
Sustainability 15 11972 g003
Figure 4. Vibration process of smart pebble. (a) Pebble real vibration process; (b) pebble assume vibrational processes.
Sustainability 15 11972 g004
Figure 5. Time series plot of the acceleration Ax, where gx is the acceleration of gravity and CAx is the acceleration of vibration. The four pictures represent different working conditions: (a) stationary state; (b) grain vibration; (c) sediment rolling; (d) sediment pushing.
Sustainability 15 11972 g005
Figure 6. Time series plot of gravitational acceleration at 5 different locations.
Sustainability 15 11972 g006
Figure 7. Relationship between vibration intensity and near-bed velocity.
Sustainability 15 11972 g007
Figure 8. Plot of pebble height versus vibration intensity. (a) The value of pebble vibration strength for flow rates Q3 = 37 L/h, Q4 = 39 L/h and Q5 = 53 L/h; (b) plot of the mean value of vibration intensity versus pebble height.
Sustainability 15 11972 g008
Figure 9. Frequency distribution chart. (a) Plot of vibration frequency versus flow rate of smart pebble A; (b) plot of vibration frequency versus flow rate for smart pebble B.
Sustainability 15 11972 g009
Figure 10. Plot of vibration frequency versus flow rate for smart pebble C.
Sustainability 15 11972 g010
Figure 11. Plot of smart pebble height versus vibration frequency. (a) Vibration frequency distribution when Q3 = 37 L/h; (b) vibration frequency distribution when Q4 = 39 L/h; (c) vibration frequency distribution when Q5 = 53 L/h; (d) smart pebble average vibration frequency distribution graph.
Sustainability 15 11972 g011
Table 1. Table of pebble parameters.
Pebble TypeLength (cm)Width(cm)Height (cm)Height/WidthWidth/Length
A6.1765.2211.9180.370.84
B6.7625.2743.1130.590.78
C6.5575.3384.0620.760.81
Table 2. Experimental results of motion states of smart pebbles.
Pebble
Type
Q (L/h)Velocity
(cm/s)
Stationary GroupsVibration GroupsEntrainment GroupsMovement
Status
A3028500stationary
3229050vibration
3732050vibration
3934050vibration
5337005entrainment
B3229500stationary
3732320vibration
3934140vibration
5337050vibration
6941050vibration
8644005entrainment
C3229500stationary
3732050vibration
3934050vibration
5337050vibration
6941050vibration
8644005entrainment
Table 3. Time domain statistical parameters of pebble vibration acceleration.
Pebble TypeQ (L/h)Average ValueMean Square ErrorMaximum ValueMinimum Value
A32−1.532.163.10−6.61
37−0.376.9922.29−20.40
392.757.8423.80−14.57
531.405.0524.15−8.15
B370.211.013.96−4.52
39−0.993.7013.48−10.47
533.966.5230.66−14.88
69−1.0412.3633.78−40.66
86−1.9584.498.79−15.03
C379.2212.3541.70−11.98
39−4.8012.0631.08−32.42
536.029.1447.18−11.39
6914.1423.3274.21−56.07
Table 4. Smart pebble vibration frequency distribution table.
Pebble TypeQ (L/h)Energy RatioFreq. (Hz)Energy RatioFreq. (Hz)Energy RatioFreq. (Hz)Energy RatioFreq. (Hz)Energy RatioFreq. (Hz)
A3285%16.3690%20.3695%32.3398%56.7299%75.57
3785%9.5290%13.4695%28.9798%53.3499%71.62
3985%6.590%11.1895%29.8798%57.299%75.9
5385%11.1890%20.6695%41.3598%67.3499%80.06
Avg.85%10.8990%16.4295%33.1398%58.6599%75.79
B3785%12.690%19.6295%34.3698%55.4499%75.02
3985%9.8590%15.5695%28.6898%52.9299%72.23
5385%7.4690%11.3195%28.3198%51.899%70.64
6985%6.8190%10.9295%27.6698%51.2499%70.53
8685%14.4290%19.795%39.0698%64.0699%82.09
Avg.85%10.2390%15.4295%31.6198%55.0999%74.10
C3785%4.690%6.1195%15.3798%43.2599%60.92
3985%6.6790%13.0495%32.6798%60.7499%75.93
5385%8.4790%16.8195%39.0398%68.0899%82.23
6985%4.4290%7.2695%20.6298%48.5799%65.83
Avg.85%6.0490%10.8195%26.9298%55.1699%71.23
Disclaimer/Publisher’s Note: The statements, opinions and data contained in all publications are solely those of the individual author(s) and contributor(s) and not of MDPI and/or the editor(s). MDPI and/or the editor(s) disclaim responsibility for any injury to people or property resulting from any ideas, methods, instructions or products referred to in the content.