
Long-Term Ecological Environment Quality Evaluation and Its Driving Mechanism in Luoyang City


Abstract
:1. Introduction
2. Materials and Data
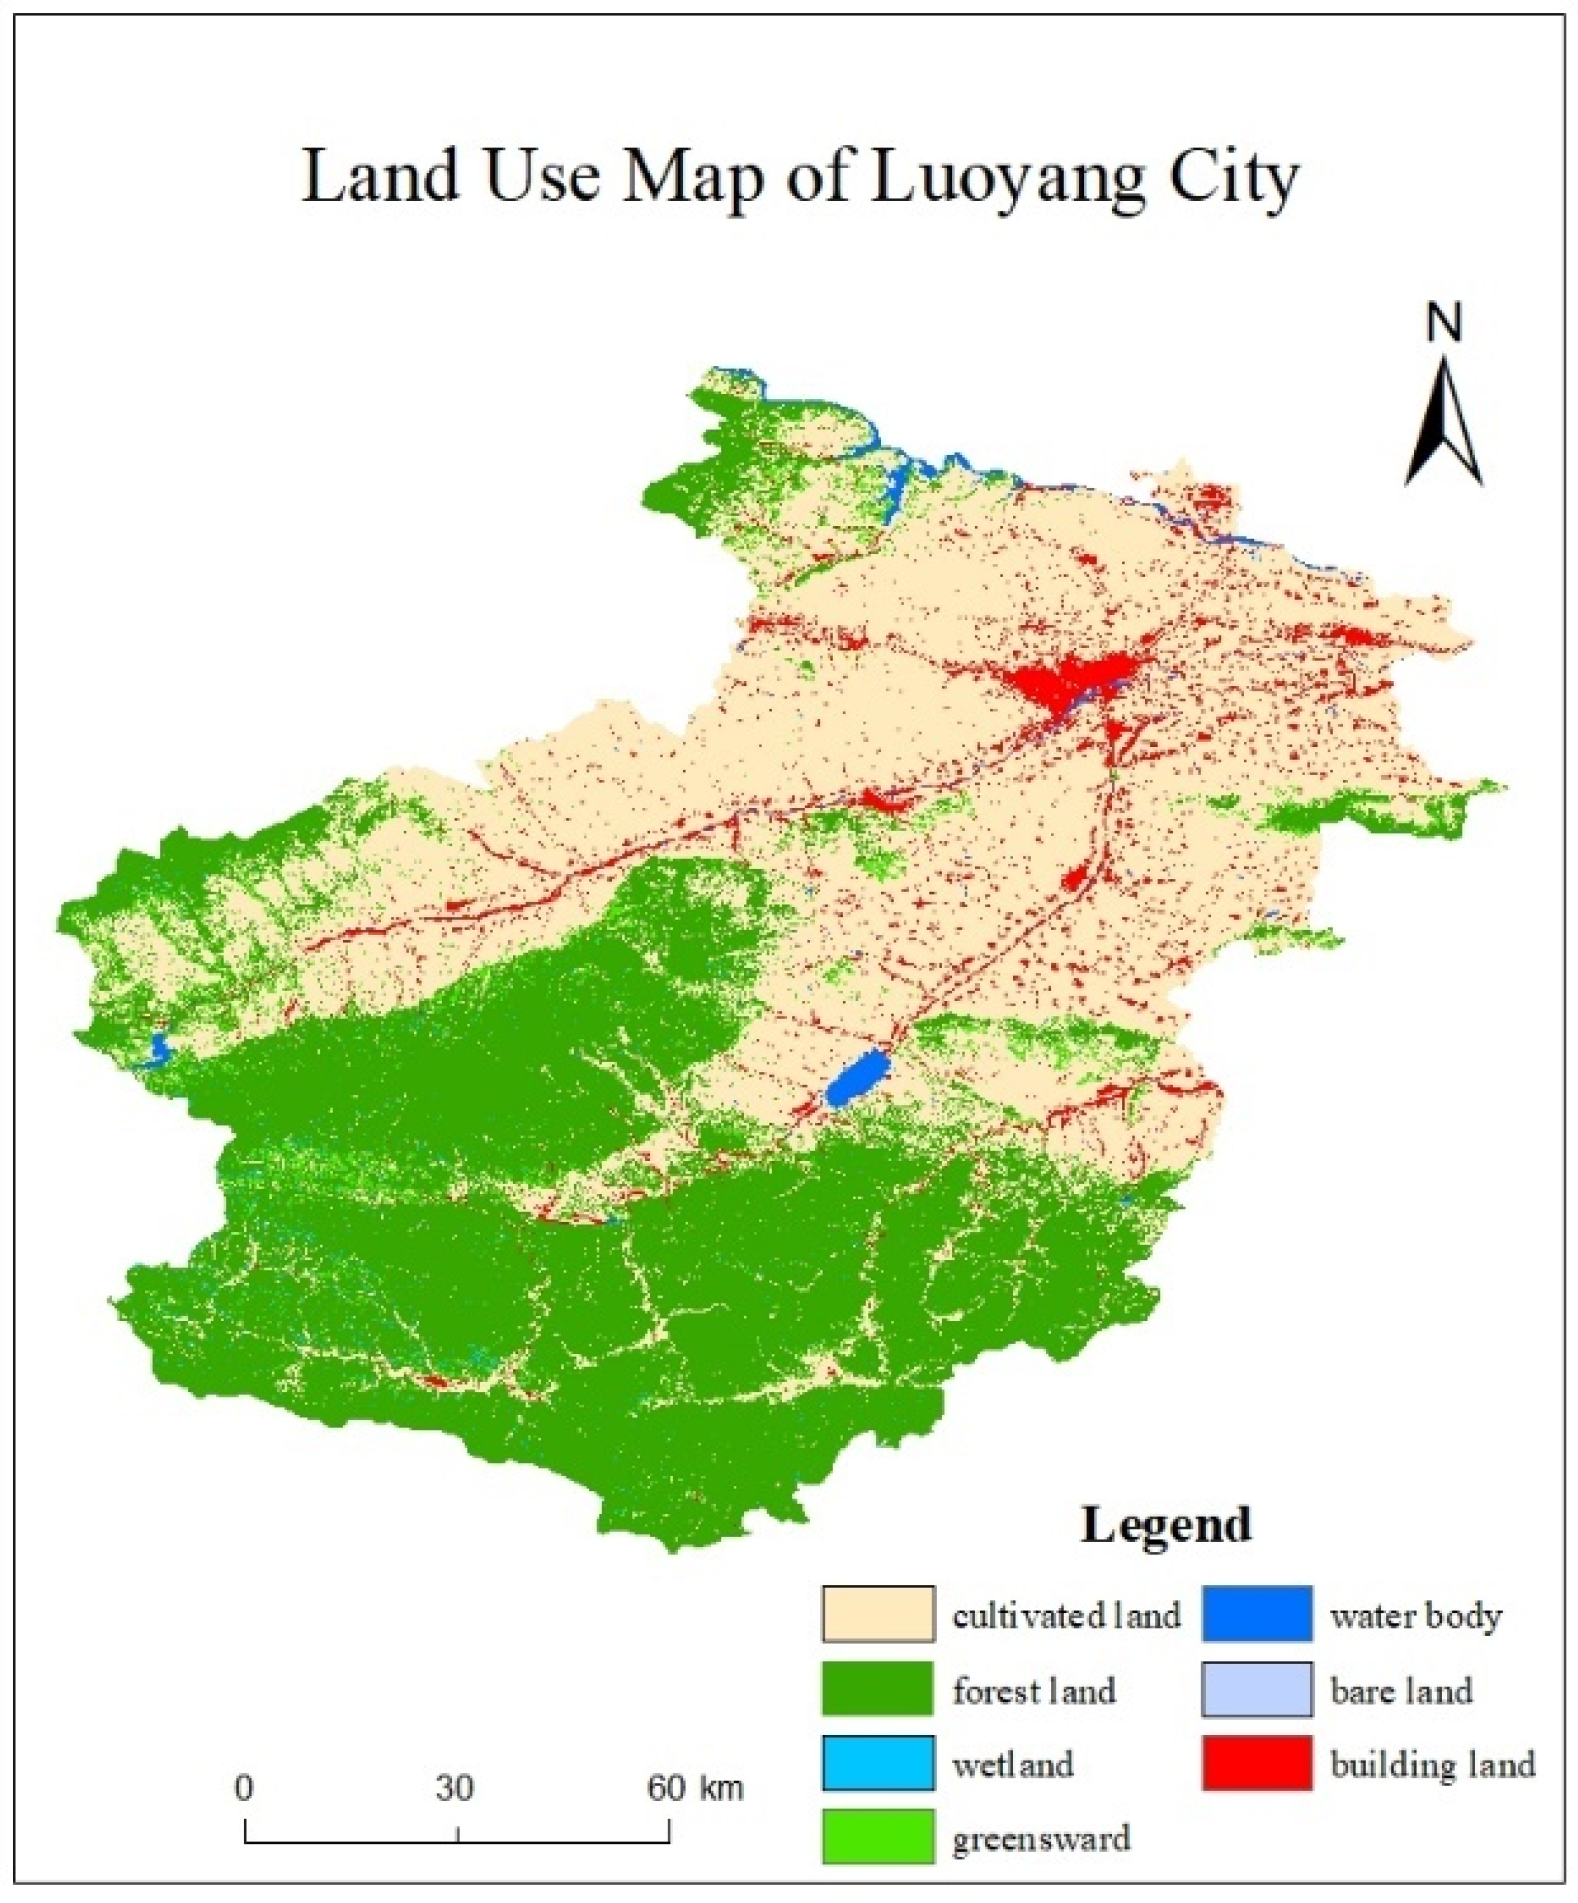
2.1. Study Area
2.2. Data Sources and Preprocessing
3. Methodology
3.1. The Calculation of Remote Sensing Ecological Index Component Indicators
3.2. Construction of Remote Sensing Ecological Index Evaluation Model
3.3. Analysis of Dynamic Changes in Ecological Index
3.3.1. Trend Analysis
3.3.2. Mutation Analysis
3.3.3. Analysis of Impact Factors on Geographic Detectors
4. Results and Analysis
4.1. Changes in the Ecological Environment Quality in Luoyang City
4.1.1. Analysis of Spatiotemporal Changes in Remote Sensing Ecological Index
4.1.2. Mutation Analysis of Remote Sensing Ecological Index
4.2. Trend Analysis of Ecological Environment Quality in Luoyang City
4.3. Driving Factors of Ecological Environment Quality in Luoyang
4.3.1. Factors Affecting Temporal Changes in Ecological Environment Quality
4.3.2. Factors Affecting Spatial Changes in Ecological Environment Quality
5. Discussion and Conclusions
5.1. Discussion
5.1.1. The Spatiotemporal Variation Characteristics of RSEI
5.1.2. The Influence of Different Factors on RSEI Changes
5.1.3. Application and Future Recommendations
5.2. Conclusions
- (1)
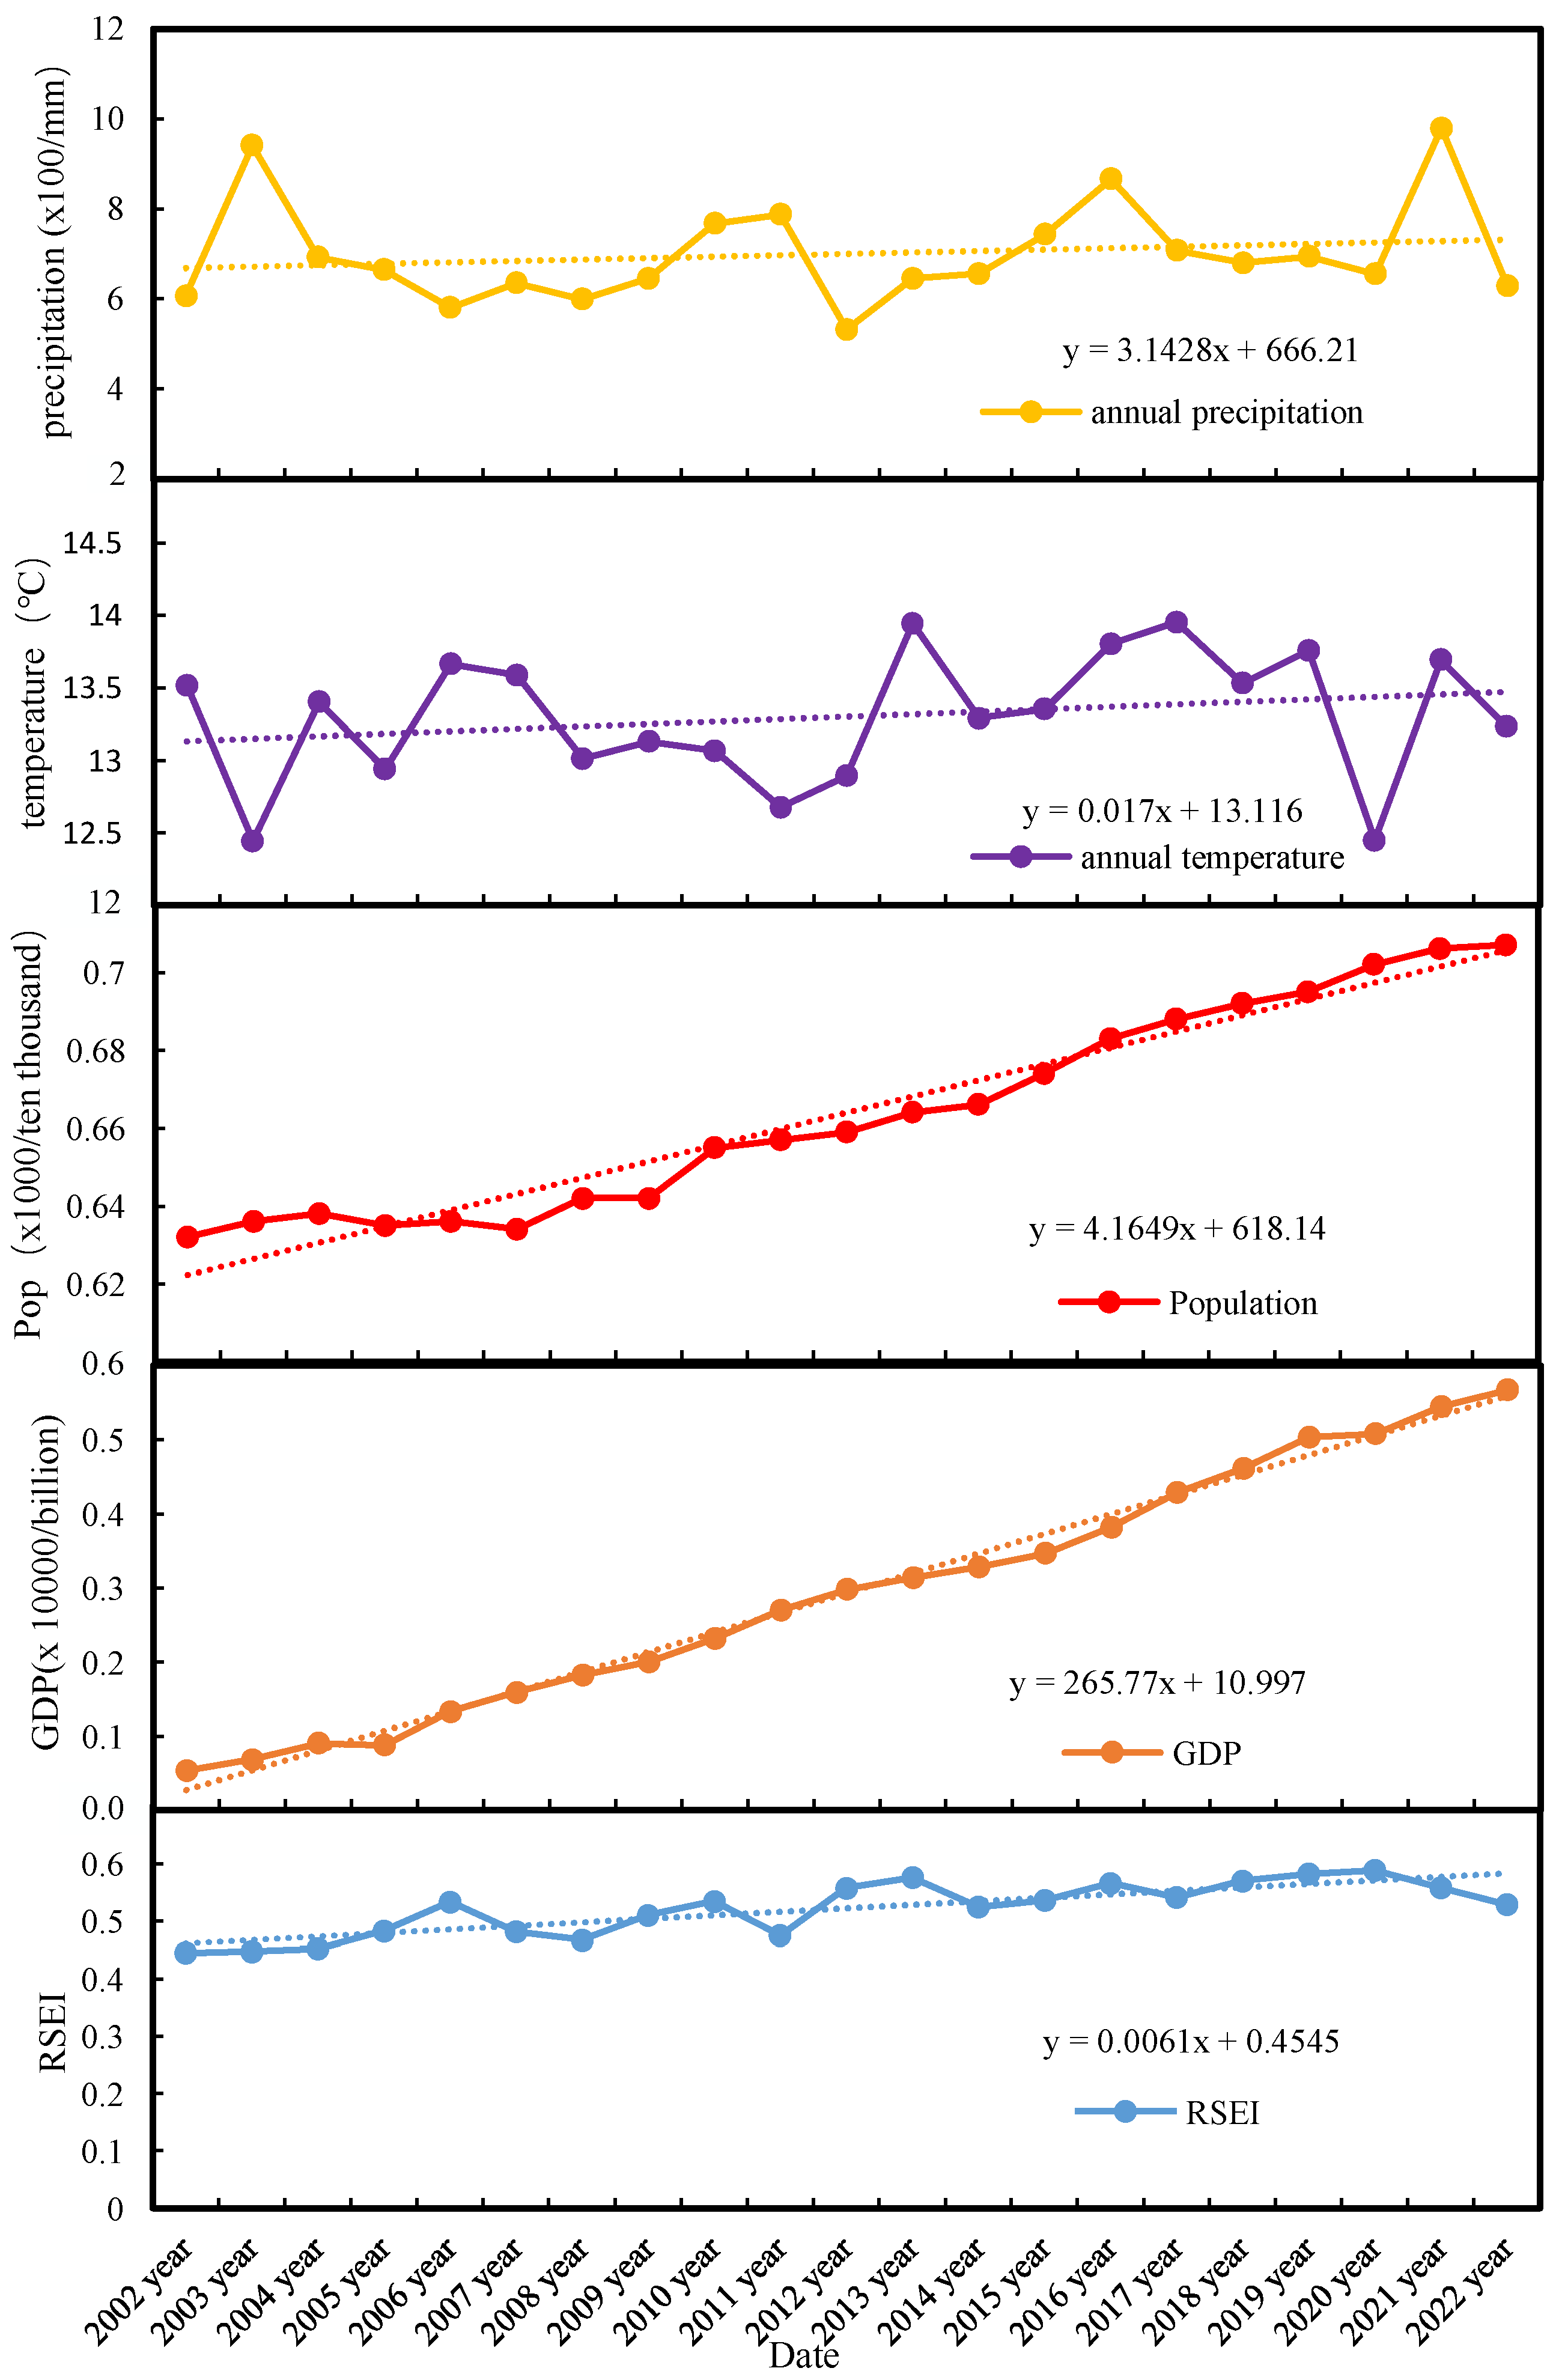
- Utilizing the RSEI model to analyze the dynamics of ecological environment quality in the research of Luoyang city. From a temporal perspective, the RSEI mean value showed a consistent rising trend from 2002 to 2022. The environmental conditions of Luoyang city are progressively enhancing over time.
- (2)
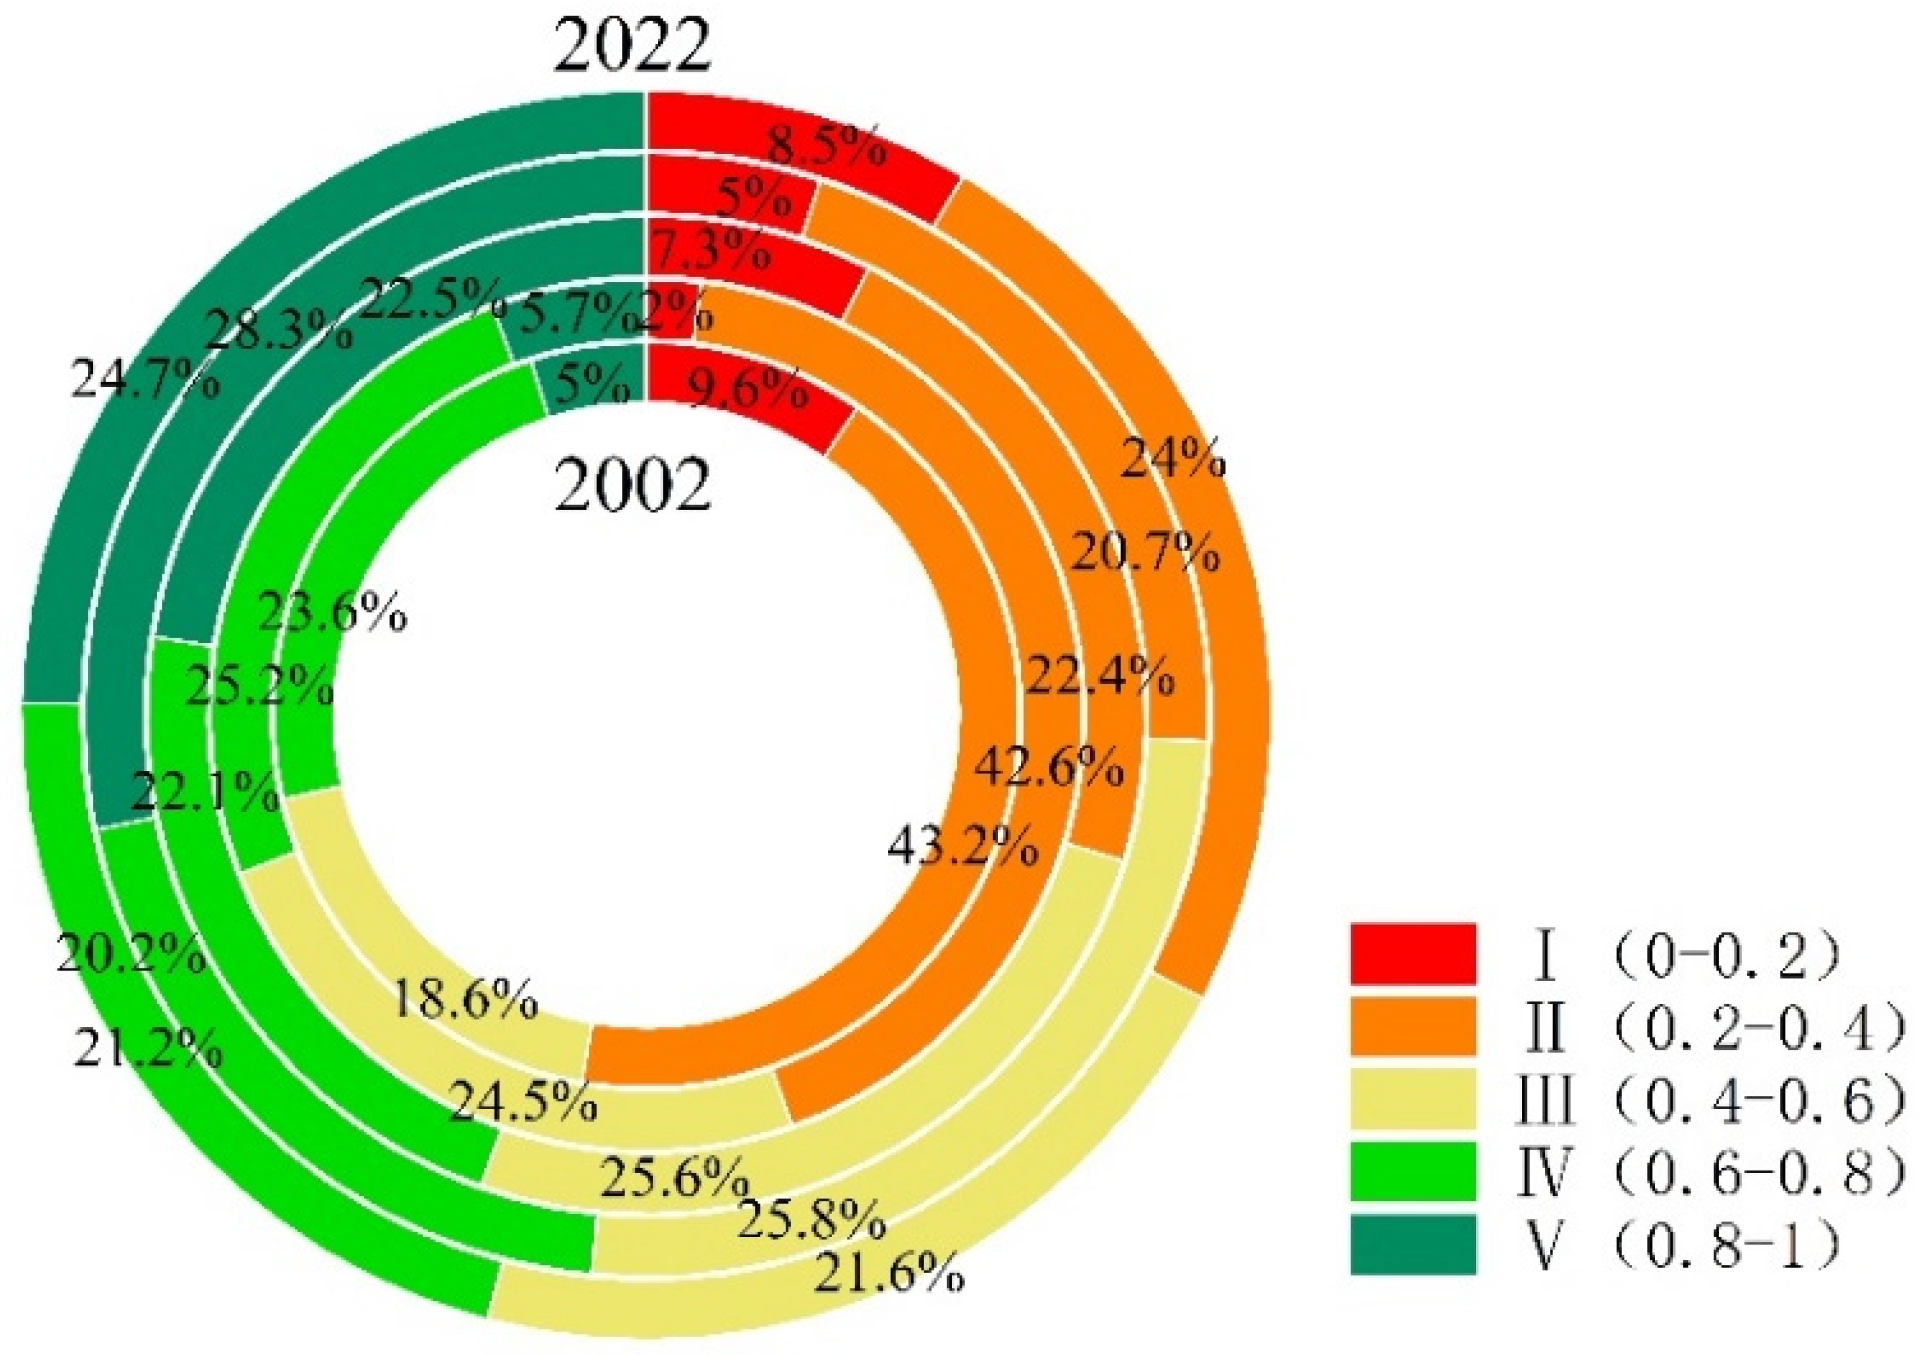
- From a spatial perspective, regions with the poor RSEI values are concentrated in the densely populated urban areas in the north of Luoyang city, while regions with the high elevation and vegetation cover in the southern mountainous areas generally have a better ecological environment quality. The area with ecological environment quality grade at a moderate level or above increased from 47.2% to 67.5%. Moreover, 63.97% of the regions in Luoyang city show an improving trajectory in ecological environment quality.
- (3)
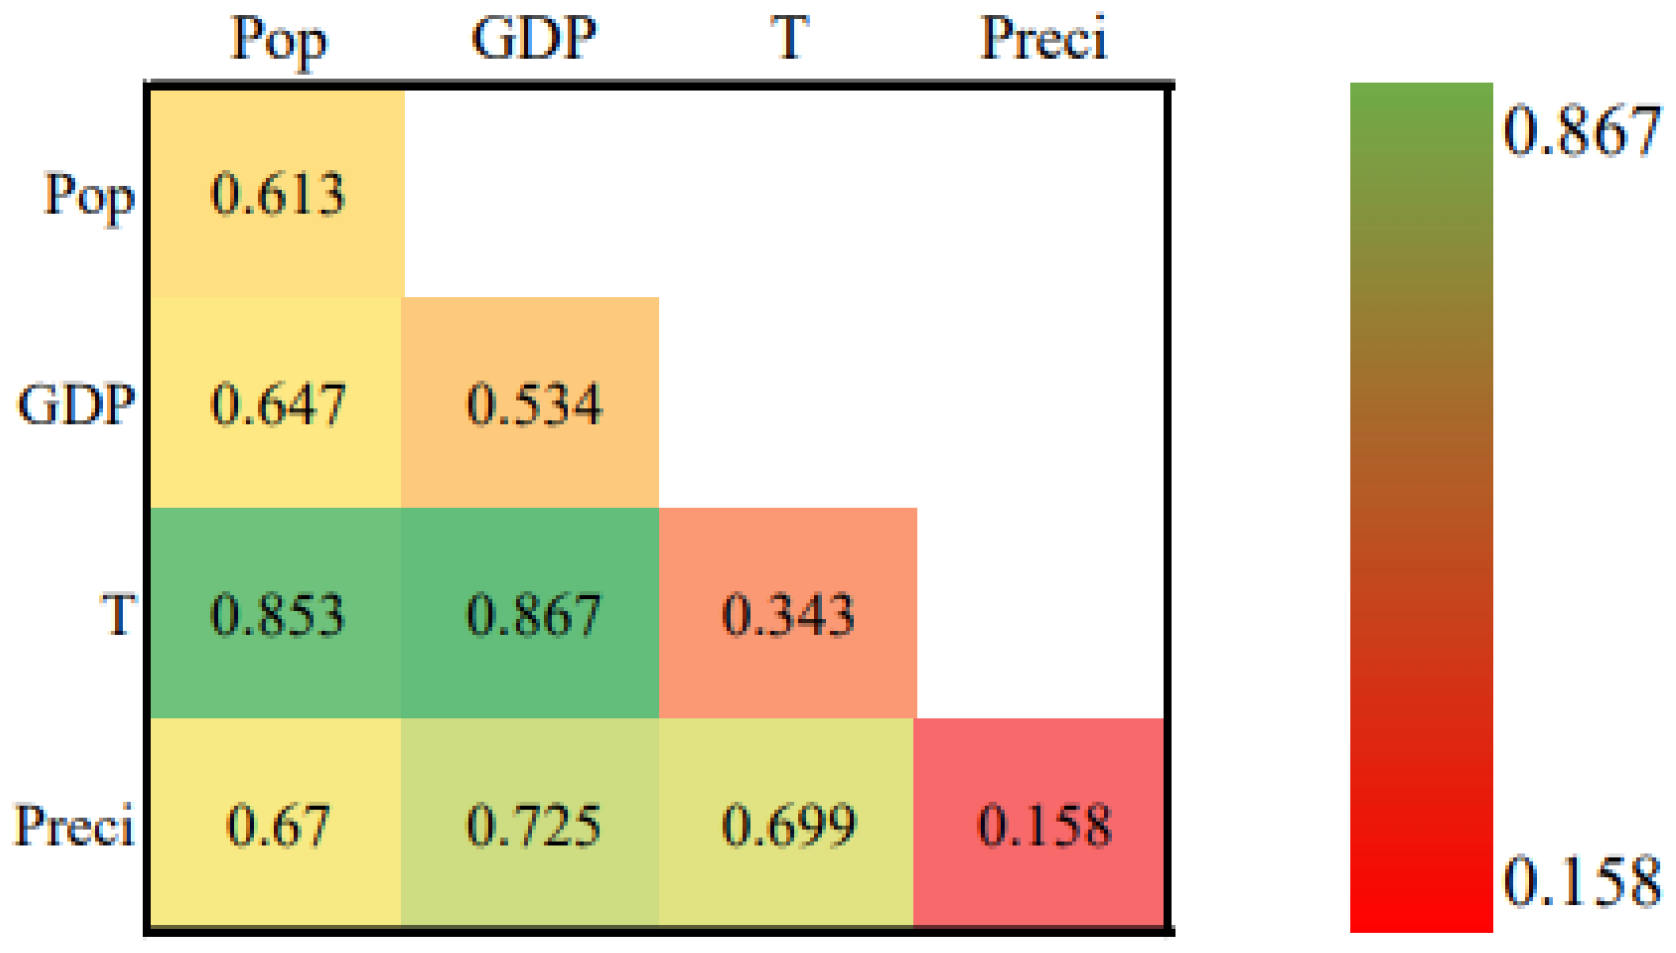
- From the perspective of influencing factors on RSEI changes, population and GDP are key factors driving the temporal changes in the ecological environmental quality of the study area, as indicated by the results of the single-factor analysis. The analysis conducted in the study area reveals that the interaction between temperature and GDP has the highest impact on the fluctuations observed in RSEI; these results highlight the crucial role played by the combined influence of temperature and GDP in shaping the changes in RSEI within the study area. The spatial changes in land use type changes have a close relationship with the spatial changes in high-level RSEI; the existing ecological environment condition in the study area is an outcome shaped by the interplay of both natural and anthropogenic factors.
Author Contributions
Funding
Institutional Review Board Statement
Informed Consent Statement
Data Availability Statement
Acknowledgments
Conflicts of Interest
References
- Cao, J.; Wu, E.; Wu, S.; Fan, R.; Xu, L.; Ning, K.; Li, Y.; Lu, R.; Xu, X.; Zhang, J.; et al. Spatiotemporal Dynamics of Ecological Condition in Qinghai-Tibet Plateau Based on Remotely Sensed Ecological Index. Remote Sens. 2022, 14, 4234. [Google Scholar] [CrossRef]
- Huang, H.; Chen, W.; Zhang, Y.; Qiao, L.; Du, Y. Analysis of ecological quality in Lhasa Metropolitan Area during 1990–2017 based on remote sensing and Google Earth Engine platform. J. Geogr. Sci. 2021, 31, 265–280. [Google Scholar] [CrossRef]
- Popescu, R.; Corboş, R.; Bunea, O. Study on the perception of young Romanians on the eco-marketing and promotion efficiency in increasing the environmental NGOs competitiveness. Calitatea 2018, 19, 417–422. [Google Scholar]
- Popescu, R.; Corbos, R.; Comănescu, M.; Bunea, O. Ecological Marketing-Strategic Option for Business Development in Bucharest. Econ. Comput. Econ. Cybern. Stud. Res. 2017, 51, 67–83. [Google Scholar]
- Sha, Z.; Bofu, Y.; Yao, Z. Global concurrent climate extremes exacerbated by anthropogenic climate change. Sci. Adv. 2023, 9, eabo1638. [Google Scholar]
- Wang, Q.; Li, L. The effects of population aging, life expectancy, unemployment rate, population density, per capita GDP, urbanization on per capita carbon emissions. Sustain. Prod. Consum. 2021, 28, 760–774. [Google Scholar] [CrossRef]
- Wang, Q.; Su, M.; Li, R. Toward to economic growth without emission growth: The role of urbanization and industrialization in China and India. J. Clean. Prod. 2018, 205, 499–511. [Google Scholar] [CrossRef]
- Wang, Q.; Hu, S.; Li, L.; Li, R. Accelerating urbanization serves to reduce income inequality without sacrificing energy efficiency—Evidence from the 78 countries. Sustain. Cities Soc. 2023, 92, 104477. [Google Scholar] [CrossRef]
- Wang, Q.; Wang, X.; Li, R. Does urbanization redefine the environmental Kuznets curve? An empirical analysis of 134 Countries. Sustain. Cities Soc. 2022, 76, 103382. [Google Scholar] [CrossRef]
- Wang, Q.; Su, M.; Li, R.; Ponce, P. The effects of energy prices, urbanization and economic growth on energy consumption per capita in 186 countries. J. Clean. Prod. 2019, 225, 1017–1032. [Google Scholar] [CrossRef]
- Jiang, F.; Zhang, Y.; Li, J.; Sun, Z. Research on remote sensing ecological environmental assessment method optimized by regional scale. Environ. Sci. Pollut. Res. 2021, 28, 68174–68187. [Google Scholar] [CrossRef]
- Zhang, Y.; Liu, L.; Zhao, P. WZ5 water index and validation of its effectiveness in a coastal wetland water extraction. J. Zhejiang A F Univ. 2018, 35, 735–742. [Google Scholar]
- Liang, L.; Huang, T.; Di, L.; Geng, D.; Yan, J.; Wang, S.; Wang, L.; Li, L.; Chen, B.; Kang, J. Influence of Different Bandwidths on LAI Estimation Using Vegetation Indices. IEEE J. Sel. Top. Appl. Earth Obs. Remote Sens. 2020, 13, 1494–1502. [Google Scholar] [CrossRef]
- Xu, H.Q. A remote sensing urban ecological index and its application. Acta Ecol. Sin. 2013, 33, 7853–7862. [Google Scholar]
- Yang, X.; Meng, F.; Fu, P.; Zhang, Y.; Liu, Y. Spatiotemporal change and driving factors of the Eco-Environment quality in the Yangtze River Basin from 2001 to 2019. Ecol. Indic. 2021, 131, 108214. [Google Scholar] [CrossRef]
- Chen, N.; Cheng, G.; Yang, J.; Ding, H.; He, S. Evaluation of Urban Ecological Environment Quality Based on Improved RSEI and Driving Factors Analysis. Sustainability 2023, 15, 8464. [Google Scholar] [CrossRef]
- Junru, Y.; Xuan, L.; Hua, W.; Wei, H.; Enxiang, C. Spatio-temporal variations of ecosystem service values in response to land use/cover change in Luoyang city. Front. Environ. Sci. 2022, 10, 984888. [Google Scholar]
- Xinjian, G.; Yuwen, F.; Yu, M.; Denghua, Y. Water ecology emergy analytic system construction and health diagnosis. Energy Convers. Manag. 2022, 270, 116254. [Google Scholar]
- Kaili, Z.; Rongrong, F.; Zhicheng, Z.; Chun, D.; Hongjuan, Z.; Kang, L. Exploring the Driving Factors of Remote Sensing Ecological Index Changes from the Perspective of Geospatial Differentiation: A Case Study of the Weihe River Basin, China. Int. J. Environ. Res. Public Health 2022, 19, 10930. [Google Scholar]
- Xu, H. Modification of normalised difference water index (NDWI) to enhance open water features in remotely sensed imagery. Int. J. Remote Sens. 2006, 27, 3025–3033. [Google Scholar] [CrossRef]
- Helili, P.; Zan, M. Coupling Coordination Development of Urbanization and Ecological Environment in the Urban Agglomeration on the Northern Slope of the Tianshan Mountains, China. Sustainability 2023, 15, 4099. [Google Scholar] [CrossRef]
- Jing, Y.; Zhang, F.; He, Y.; Johnson, V.C.; Arikena, M. Assessment of spatial and temporal variation of ecological environment quality in Ebinur Lake Wetland National Nature Reserve, Xinjiang, China. Ecol. Indic. 2020, 110, 105874. [Google Scholar] [CrossRef]
- Song, C.; Huang, B.; You, S. Comparison of three time-series NDVI reconstruction methods based on TIMESAT. In Proceedings of the 2012 IEEE International Geoscience and Remote Sensing Symposium, Munich, Germany, 22–27 July 2012. [Google Scholar]
- Crist, E.P. A TM Tasseled Cap equivalent transformation for reflectance factor data. Remote Sens. Environ. 1985, 17, 301–306. [Google Scholar] [CrossRef]
- Baig, M.H.A.; Zhang, L.; Shuai, T.; Tong, Q. Derivation of a tasselled cap transformation based on Landsat 8 at-satellite reflectance. Remote Sens. Lett. 2014, 5, 423–431. [Google Scholar] [CrossRef]
- Rikimaru, A.; Roy, P.S.; Miyatake, S. Tropical forest cover density mapping. Trop. Ecol. 2002, 43, 39–47. [Google Scholar]
- Yun, Z.; Liangjun, Z.; Kai, N.; Asiya, M. Environmental Monitoring in Northern Aksu, China Based on Remote Sensing Ecological Index Model. Open J. Appl. Sci. 2022, 12, 757–768. [Google Scholar]
- Enjun, G.; Fangxin, S.; Zhihui, W.; Qingfeng, H.; Jing, Z.; Hongxin, H. Evaluating Environmental Quality and Its Driving Force in Northeastern China Using the Remote Sensing Ecological Index. Sustainability 2022, 14, 16304. [Google Scholar]
- Wu, Z.; Chen, S.; de Boeck, H.J.; Stenseth, N.C.; Tang, J.; Vitasse, Y.; Wang, S.; Zohner, C.; Fu, Y.H. Atmospheric brightening counteracts warming-induced delays in autumn phenology of temperate trees in Europe. Glob. Ecol. Biogeogr. 2021, 30, 2477–2487. [Google Scholar] [CrossRef]
- Hadad, Y.; Keren, B.; Gurevich, G. Improving demand forecasting using change point analysis. Int. J. Bus. Forecast. Mark. Intell. 2017, 3, 130–151. [Google Scholar] [CrossRef]
- Wang, J.F.; Li, X.H.; Christakos, G.; Liao, Y.L.; Zhang, T.; Gu, X.; Zheng, X.Y. Geographical detectors-based health risk assessment and its application in the neural tube defects study of the Heshun Region, China. Int. J. Geogr. Inf. Sci. 2010, 24, 107–127. [Google Scholar] [CrossRef]
- Wenbo, Y.; Jun, Y.; Feng, W.; Baojie, H.; Bing, X.; Shaohua, W.; Huisheng, Y.; Xiangming, X.; Cecilia, X.J. Realistic characteristics and driving mechanisms of pseudo-human settlements in Chinese cities. Humanit. Soc. Sci. Commun. 2023, 10, 50. [Google Scholar]
- Xiong, Y.; Xu, W.; Lu, N.; Huang, S.; Wu, C.; Wang, L.; Dai, F.; Kou, W. Assessment of spatial–temporal changes of ecological environment quality based on RSEI and GEE: A case study in Erhai Lake Basin, Yunnan province, China. Ecol. Indic. 2021, 125, 107518. [Google Scholar] [CrossRef]
- Gao, W.; Zhang, S.; Rao, X.; Lin, X.; Li, R. Landsat TM/OLI-Based Ecological and Environmental Quality Survey of Yellow River Basin, Inner Mongolia Section. Remote Sens. 2021, 13, 4477. [Google Scholar] [CrossRef]
- Bai, L.; Yang, Y.; Zhang, K.; Liu, S.; Liu, G. Monitoring and Analysis of the Driving Forces of Changes in the Ecological Environment of a Mining Area of Western China from 1986 to 2022. Processes 2023, 11, 1721. [Google Scholar] [CrossRef]
- Jinjie, W.; Jianli, D.; Xiangyu, G.E.; Shaofeng, Q.; Zhe, Z. Assessment of ecological quality in Northwest China (2000–2020) using the Google Earth Engine platform: Climate factors and land use/land cover contribute to ecological quality. J. Arid Land 2022, 14, 1196–1211. [Google Scholar]
- Cui, J.; Zhu, M.; Mi, H.; Liu, Y. Evaluation of Eco-Environmental Quality and Analysis on Spatio-Temporal Variation in Jinan, China. Pol. J. Environ. Stud. 2022, 31, 1061–1072. [Google Scholar] [CrossRef]
- Wu, S.P.; Gao, X.; Lei, J.Q.; Zhou, N.; Guo, Z.K.; Shang, B.J. Ecological environment quality evaluation of the Sahel region in Africa based on remote sensing ecological index. J. Arid Land 2022, 14, 14–33. [Google Scholar] [CrossRef]
- Ma, D.; Huang, Q.; Liu, B.; Zhang, Q. Analysis and Dynamic Evaluation of Eco-Environmental Quality in the Yellow River Delta from 2000 to 2020. Sustainability 2023, 15, 7835. [Google Scholar] [CrossRef]
- Xinran, N.; Zhenqi, H.; Qi, Z.; Mengying, R. Research on Temporal and Spatial Resolution and the Driving Forces of Ecological Environment Quality in Coal Mining Areas Considering Topographic Correction. Remote Sens. 2021, 13, 2815. [Google Scholar]
- Ahmed, G.; Zan, M.; Kasimu, A. Spatial–Temporal Changes and Influencing Factors of Surface Temperature in Urumqi City Based on Multi-Source Data. Environ. Eng. Sci. 2022, 39, 928–937. [Google Scholar] [CrossRef]
- Yang, L.; Shi, L.; Wei, J.; Wang, Y. Spatiotemporal evolution of ecological environment quality in arid areas based on the remote sensing ecological distance index: A case study of Yuyang district in Yulin city, China. Open Geosci. 2021, 13, 1701–1710. [Google Scholar] [CrossRef]
- Zhang, S.; Wang, X. Spatial-temporal variation and driving factors of eco-environmental quality in Henan section of the Yellow River Basin. In Proceedings of the 2022 29th International Conference on Geoinformatics, Beijing, China, 15–18 August 2022. [Google Scholar]
- Wang, S.; Si, J.; Wang, Y. Study on Evaluation of Ecological Environment Quality and Temporal-Spatial Evolution of Danjiang River Basin (Henan Section). Pol. J. Environ. Stud. 2021, 30, 2353–2367. [Google Scholar] [CrossRef]
- Yuanyuan, Z.; Liwen, Y.; Binggeng, X.; Junhan, L.; Jianyong, X.; Jing, X.; Zhixing, L. Analysis of ecological quality changes and influencing factors in Xiangjiang River Basin. Sci. Rep. 2023, 13, 4375. [Google Scholar]
- Xiaoyun, R.; Mingkong, Z.; Juncheng, Q.; Shuangquan, L.; Jingxu, W.; Jun, D. Analyzing Spatio-Temporal Change in Ecosystem Quality and Its Driving Mechanism in Henan Province, China, from 2010 to 2020. Sustainability 2022, 14, 11742. [Google Scholar]
- Gao, C.; Wang, J.; Wang, M.; Zhang, Y. Simulating Urban Agglomeration Expansion in Henan Province, China: An Analysis of Driving Mechanisms Using the FLUS Model with Considerations for Urban Interactions and Ecological Constraints. Land 2023, 12, 1189. [Google Scholar] [CrossRef]
- Dongyu, Z.; Tao, C.; Na, Z.; Ruiqing, N. Monitoring the effects of open-pit mining on the eco-environment using a moving window-based remote sensing ecological index. Environ. Sci. Pollut. Res. Int. 2020, 27, 15716–15728. [Google Scholar]
- Rana, M.M.P. Urbanization and sustainability: Challenges and strategies for sustainable urban development in Bangladesh. Environ. Dev. Sustain. 2011, 13, 237–256. [Google Scholar] [CrossRef]
- Yibo, Y.; Ziyuan, C.; Simayi, Z.; Shengtian, Y. The temporal and spatial changes of the ecological environment quality of the urban agglomeration on the northern slope of Tianshan Mountain and the influencing factors. Ecol. Indic. 2021, 133, 108380. [Google Scholar] [CrossRef]


| Status | Area/km2 | Percentage |
|---|---|---|
| Significantly reduced | 125.08 | 0.82% |
| No significant trend | 5350.06 | 35.21% |
| Significantly increased | 9721.51 | 63.97% |
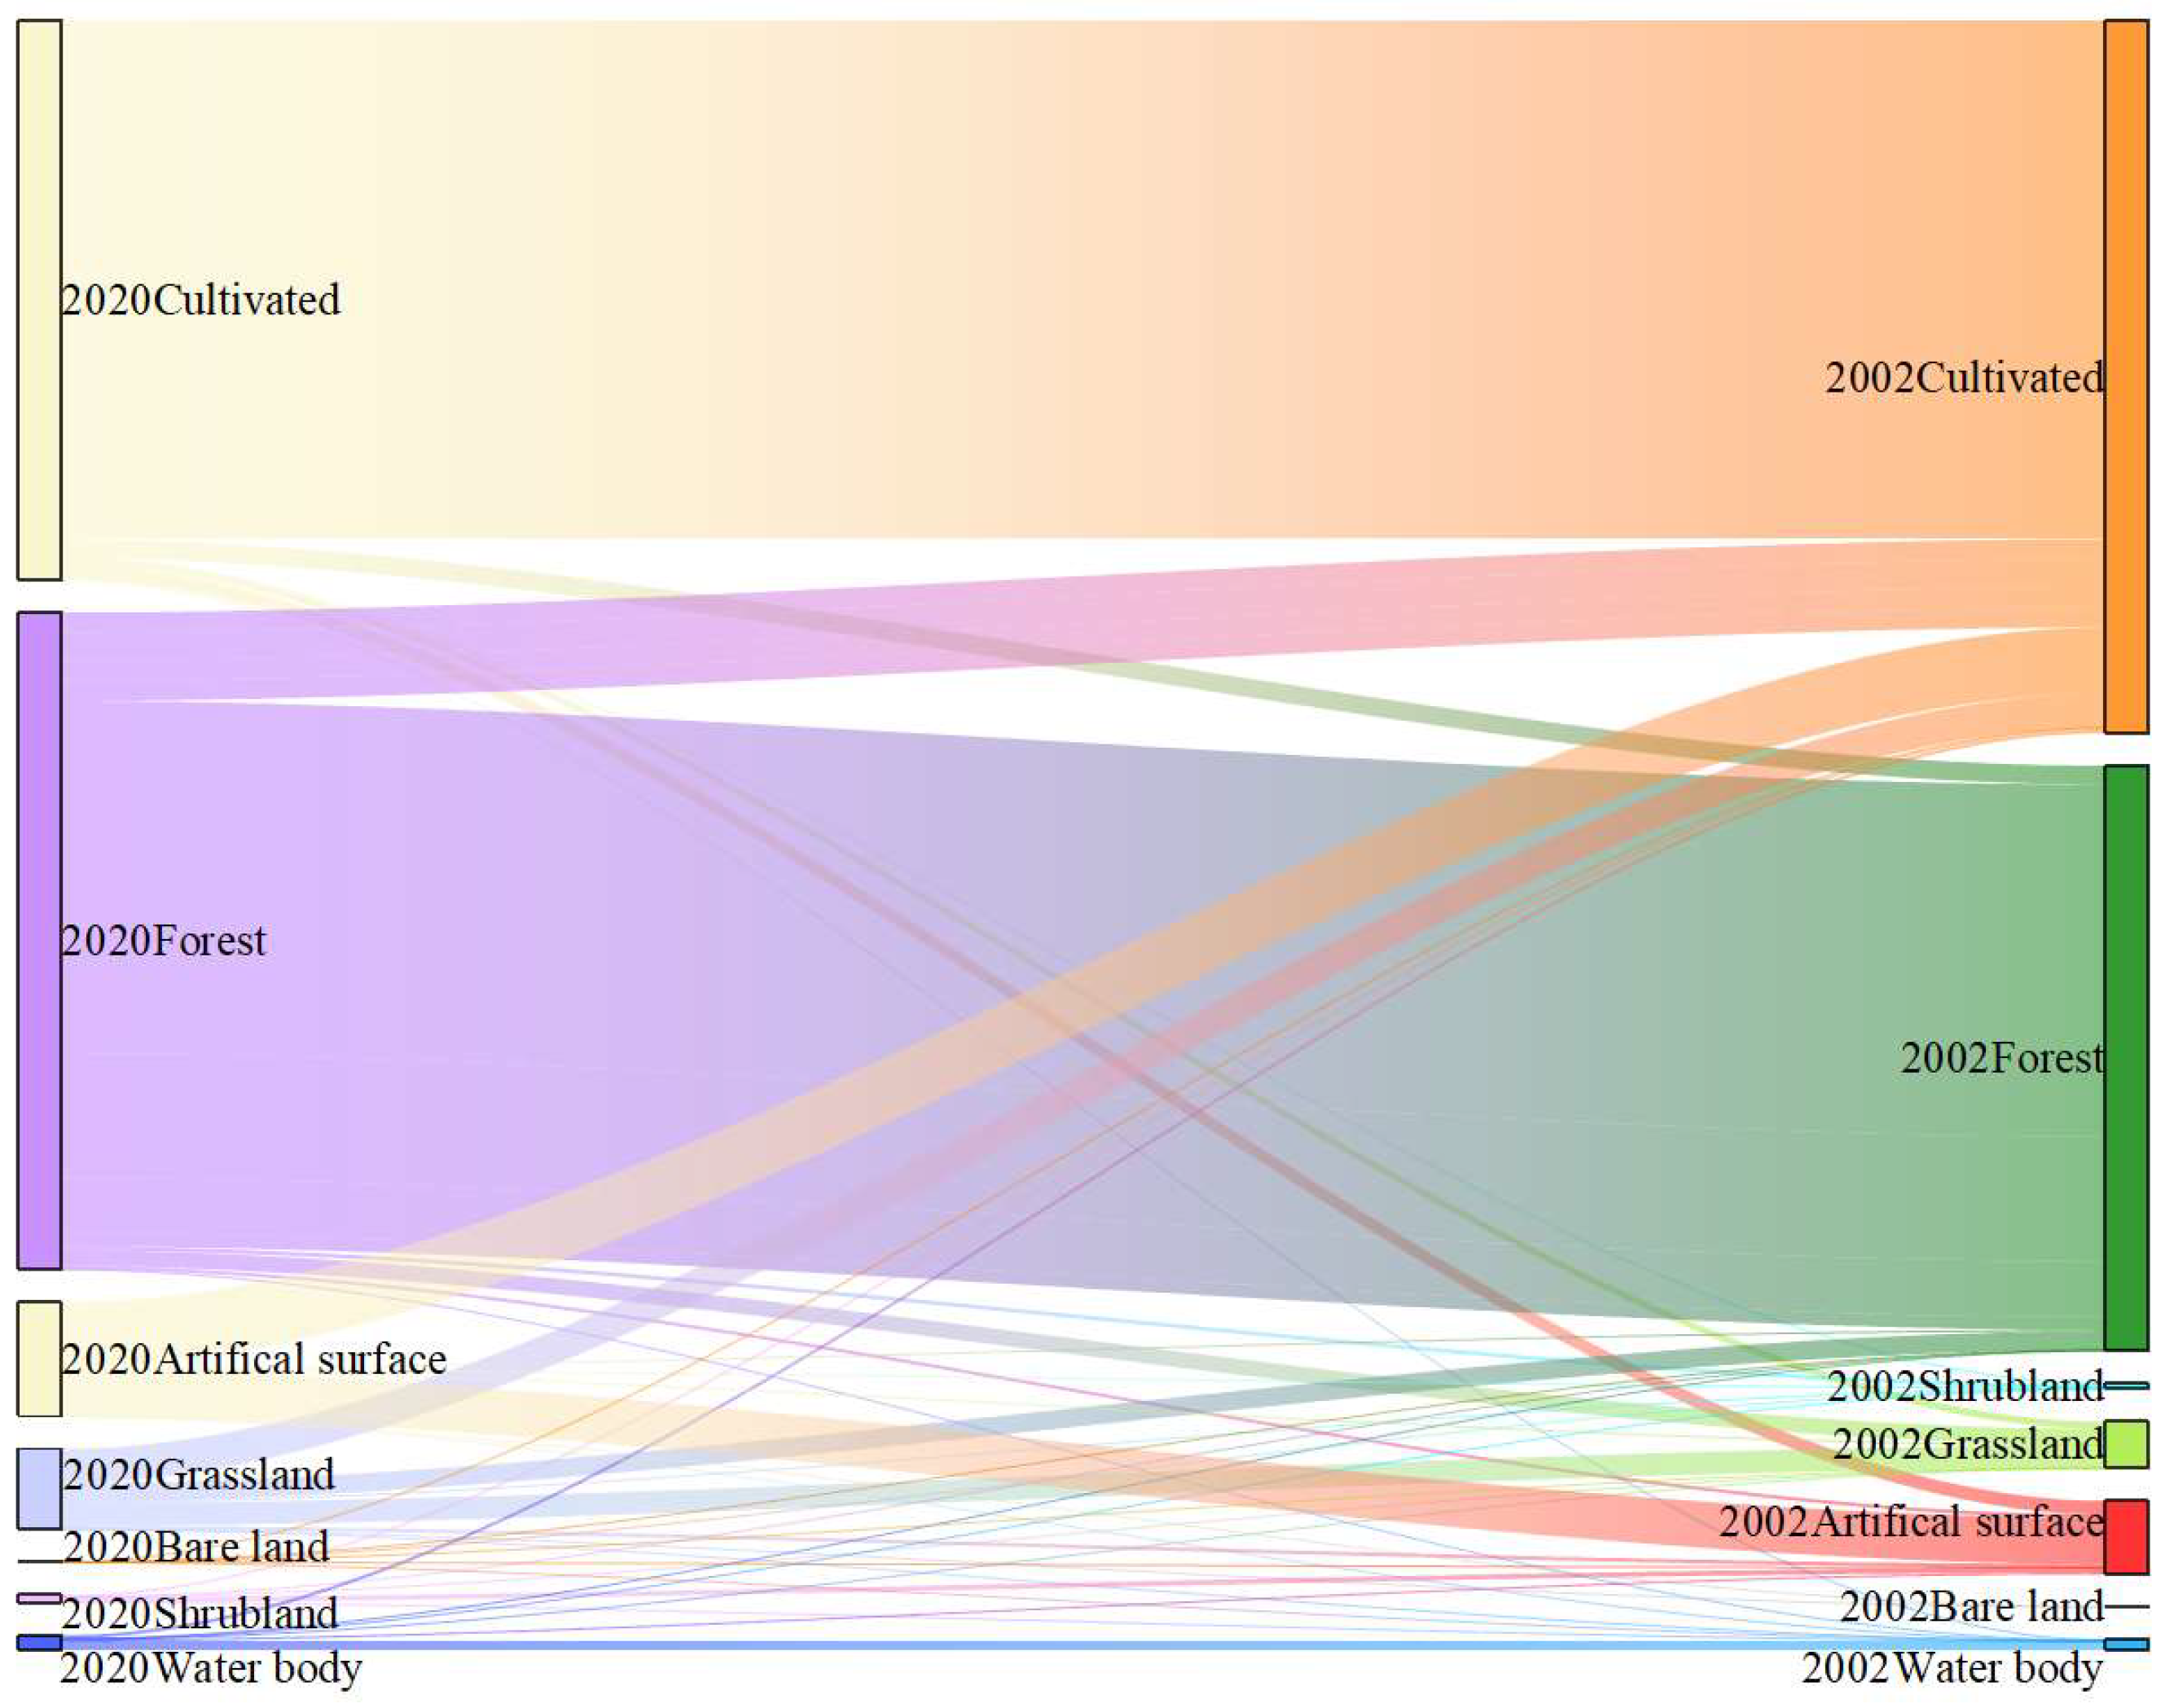
| 2002 | Grass Land | Cultivated Land | Forest Land | Bare Land | Artificial Surface | Wetland | Waterbody | Sum/km2 | |
|---|---|---|---|---|---|---|---|---|---|
| 2020 | |||||||||
| Grass land | 43.086 | 9.557 | 64.943 | 0.027 | 0.609 | - | 0.118 | 118.339 | |
| Cultivated land | 0.042 | 0.110 | 0.088 | - | 0.027 | * | 0.016 | 0.286 | |
| Forest land | 83.240 | 84.694 | 5026.902 | 1.107 | 5.219 | 0.098 | 1.710 | 5202.969 | |
| artificial surface | 0.149 | 0.325 | 0.258 | - | 0.146 | 0.040 | 0.037 | 0.955 | |
| Wetland | 10.085 | 1.046 | 33.503 | 0.082 | 0.036 | - | 0.008 | 44.760 | |
| Waterbody | * | 0.125 | 0.017 | - | - | - | 0.126 | 0.267 | |
| Sum/km2 | 136.602 | 95.856 | 5125.711 | 1.216 | 6.036 | 0.141 | 2.015 | 5367.576 | |
Disclaimer/Publisher’s Note: The statements, opinions and data contained in all publications are solely those of the individual author(s) and contributor(s) and not of MDPI and/or the editor(s). MDPI and/or the editor(s) disclaim responsibility for any injury to people or property resulting from any ideas, methods, instructions or products referred to in the content. |
© 2023 by the authors. Licensee MDPI, Basel, Switzerland. This article is an open access article distributed under the terms and conditions of the Creative Commons Attribution (CC BY) license (https://creativecommons.org/licenses/by/4.0/).
Share and Cite
Li, H.; Jing, H.; Yan, G.; Guo, H.; Luan, W. Long-Term Ecological Environment Quality Evaluation and Its Driving Mechanism in Luoyang City. Sustainability 2023, 15, 11866. https://doi.org/10.3390/su151511866
Li H, Jing H, Yan G, Guo H, Luan W. Long-Term Ecological Environment Quality Evaluation and Its Driving Mechanism in Luoyang City. Sustainability. 2023; 15(15):11866. https://doi.org/10.3390/su151511866
Chicago/Turabian StyleLi, Hui, Haitao Jing, Geding Yan, Huanchao Guo, and Wenfei Luan. 2023. "Long-Term Ecological Environment Quality Evaluation and Its Driving Mechanism in Luoyang City" Sustainability 15, no. 15: 11866. https://doi.org/10.3390/su151511866
APA StyleLi, H., Jing, H., Yan, G., Guo, H., & Luan, W. (2023). Long-Term Ecological Environment Quality Evaluation and Its Driving Mechanism in Luoyang City. Sustainability, 15(15), 11866. https://doi.org/10.3390/su151511866