Article

Simulation of Secondary Frequency Modulation Process of Wind Power with Auxiliary of Flywheel Energy Storage

1
Shenzhen Energy Nanjing Holding Co., Ltd., Nanjing 210000, China
2
School of Energy, Power and Mechanical Engineering, North China Electric Power University, Beijing 102206, China
*
Author to whom correspondence should be addressed.
Sustainability 2023, 15(15), 11832; https://doi.org/10.3390/su151511832
Submission received: 29 June 2023 / Revised: 24 July 2023 / Accepted: 26 July 2023 / Published: 1 August 2023
(This article belongs to the Special Issue Application of Power System in Sustainable Energy Perspective)

Abstract

:
With the rapid increase in the proportion of wind power, the frequency stability problem of power system is becoming increasingly serious. Based on MATLAB/Simulink simulation, the role and effect of secondary frequency modulation assisted by Flywheel Energy Storage System (FESS) in regional power grid with certain wind power penetration rates are studied. First, the linear frequency control of the power system is used to establish the primary frequency modulation control model of FESS assisting wind power, and the frequency characteristics of FESS participating in primary frequency modulation are analyzed according to the transfer function. Then, in the case of step disturbance and continuous disturbance of load power, the frequency characteristics of a regional power grid are simulated and demonstrated through time domain simulation, and conclusions are drawn through comparison; a certain proportion of FESS can quickly respond to the frequency deviation signal. During secondary frequency modulation simulation, the maximum frequency deviation of the system is reduced by 57.1% and the frequency fluctuation range is reduced by 53.8%, effectively improving the frequency quality of the power grid.

1. Introduction

Due to the increasing consumption of fossil energy all over the world, emissions of carbon dioxide have increased continuously, and its impact on the global environment has become increasingly significant [1,2]. Therefore, new energy represented by wind power has gradually become the main source of power generation. Wind turbine connects to the power grid through power electronic equipment. Its rotor kinetic energy is hidden, so the rotor speed and grid frequency of wind turbine are decoupled. With the continuous increasing of the proportion of wind power integration, the power system is developing towards low inertia and low damping abilities [3,4,5]. In addition, due to the randomness and volatility of wind power generation, the frequency stability of the power system is getting worse and worse under condition of high penetration of wind power, which is not conducive to the normal operation of the power grid. Therefore, the way to ensure frequency stability of power system has become an important issue; this issue is also a realistic requirement for the normal operation of the power grid.
In order to improve the adverse effects of wind power integration on power system frequency, energy storage system equipped with fast load response can be used to assist wind turbine to adjust the frequency [6,7,8,9]. According to the random fluctuation characteristics of wind power output, energy storage systemsare configured to reduce the frequency fluctuation caused by wind power integration and improve the stability of power system by using the fast response ability and high-power throughput characteristics of energy storage. Current mainstream energy storage methods include battery energy storage system (BESS), compressed air energy storage (CAES), FESS, superconducting magnetic energy storage (SMES), etc. [10].
CAES is limited by geographical conditions and other factors, so it is not suitable for participating in rapid frequency regulation of the power system; BESS have gained an absolute advantage in the new energy storage market due to its energy density, efficiency, cost, construction cycles, and so on. However, the thermal stability of BESS is poor; When overheated, flammable and explosive gases will be generated, which make them prone to explosions and other safety accidents. As a new type of physical energy storage technology, FESS can carry out millisecond-level rapid charging and discharging which are not affected by the depth of discharge. Its cycle life of charging and discharging exceeds hundreds of thousands of times, and the performance does not deteriorate. The service life is expected to exceed 20 years. The energy conversion efficiency is between 90% and 95%, and there is no carbon dioxide emission during usage. FESS realize the charging and discharging process through the acceleration and deceleration process of the flywheel rotor, which can convert the flywheel from full power discharge to full power charging in a few seconds. The most suitable application scenario of flywheel is for short-term, high-power changes and frequent charge–discharge cycles at the same time, so it is very suitable for grid frequency regulation [11]. In 2008, a 0.5 MW FESS-independent frequency modulation power station was built in Massachusetts, the United States, to maintain the fluctuating balance between power supply and demand throughout the state [12,13]. In 2014, Beacon Power Company of the United States successively built a 20 MW flywheel frequency modulation power station in Pennsylvania and New York [14,15]. The frequency modulation capacity of the flywheel frequency modulation power station accounted for 3.3% of the total frequency modulation capacity in New York and completed 23.8% of the total frequency modulation tasks of the whole network [16,17,18]. In 2014, Canada’s Temporal Power established three FESS power stations in Ontario and the Caribbean for frequency regulation; since 2015, Japan has begun to develop superconducting FESS as the next generation of energy storage system. In September 2020, the Dutch company Leclanche and S4 Energy established a hybrid energy storage frequency modulation power station with FESS and lithium batteries for power system frequency modulation.
Secondary frequency regulation based on automatic generation control can meet the frequency regulation requirements of the system. However, if the frequency fluctuation problem caused by wind power integration is only improved by thermal power units, the effect is not significant. Therefore, it is of great significance to study the frequency fluctuation problem caused by wind power integration through FESS. In this paper, the scene of weak frequency regulation ability of two-area interconnected power system considering wind power grid connection is studied. Firstly, the characteristics of FESS participating in frequency regulation are quantitatively analyzed according to the principle of power grid frequency regulation. Then, a two-area interconnected power grid model considering wind power grid connection is established, and the frequency fluctuation of the power grid is alleviated by adding an FESS. According to the area control deviation, the frequency regulation tasks of the FESS and turbine generator are adjusted to solve the frequency regulation problem of the power system, improve the frequency stability of the system, and further control the frequency deviation of the interconnected power system.

2. Characteristics of FESS

2.1. Principle

The FESS usually consists of several key components:
(1).
A flywheel rotor for energy storage.
(2).
A bearing system supporting the flywheel rotor.
(3).
A power converter system for charge–discharge conversion, including motors and power electronic devices.
(4).
Other auxiliary components.
The specific structure of FESS is shown in Figure 1 [19].
According to Figure 1, the flywheel rotor is the main component of FESS for storing energy. Its material can be metal or composite.
The electric quantity of FESS is stored by using a rotating flywheel rotor, and the mutual conversion of kinetic energy and electric energy can be carried out. Taking the cylindrical flywheel rotor as an example, the energy E (J) stored at the angular velocity ω (rad/s) of the flywheel rotor is expressed in Equation (1) [17]:
E = 1 2 I ω 2
where I represents the inertia moment of the flywheel rotor (kg·m2).
When the FESS works, the torque M (N·m) applied is calculated with Equation (2) [17]:
M = I d ω d t
In order to maintain safe operation, the FESS sets a maximum operating angular velocity ωmax according to the flywheel material. Meanwhile, the FESS needs to limit the angular speed of the FESS to the minimum speed ωmin for actual operational requirements and safety considerations. The maximum energy stored by the flywheel in the normal operating range is expressed in Equation (3) [17].
Δ E = 1 2 I ( ω max 2 ω min 2 )
The active power of the FESS, without considering loss, is obtained with Equation (4) [20].
P = d Δ E d t = I ω d ω d t = M ω

2.2. Charging and Discharging Control Model of FESS

The motor of the FESS adopts an asynchronous motor, and the motor control adopts magnetic-field-oriented control. In the synchronous rotating coordinate system dq, the mathematical model of the induction asynchronous motor is shown in Equation (5) [21]:
{ d φ r d t = R r L r φ r + R r L m L m i sd 0 = R r L m L r i sq ( ω 1 ω ) φ r d i sd d t = L r 2 L s L r 2 R r L m 2 ( R r L m L r 2 φ r R s L r 2 + R r L m 2 L r 2 i sd + L s L r 2 R r L m 2 L s L r 2 ω 1 i sq + u sd ) d i sq d t = L r 2 L s L r 2 R r L m 2 ( L m L r φ r R s L r 2 + R r L m 2 L r 2 i sq L s L r 2 R r L m 2 L s L r 2 ω 1 i sd + u sq ) T e = n p L m L r i sq φ r d ω d t = n p J ( T e T L )
where isd and isq represent stator d-axis and q-axis currents, respectively; ω1 and ω represent the angular velocity of stator and rotor, respectively; usd and usq represent the d-axis and q-axis voltages of the stator, respectively. Lm represents the mutual inductance between the rotor and the stator; Te and TL represent electromagnetic torque and load torque, respectively; and φr represents the rotor flux.
In order to effectively convert the output power of the flywheel motor into torque control, the power tracking control strategy is adopted as the control strategy to better stabilize the output power of the flywheel motor. The converter control of the FESS adopts double PWM control to realize current rectification, output power, and frequency control. In the grid side part, the grid-voltage-oriented vector control method is adopted. In the synchronous rotating coordinate system dq, the grid side circuit model is shown in Equation (6) [21]:
{ L d i d d t = e d R i d S d U dc + L ω g i q L d i q d t = R S q U dc L ω g i d C d U dc d t = S d i d + S q i q U dc e load R load
where ωg is the angular frequency of the network side circuit; L is the grid side filter inductance value; Sd and Sq are power switch state values; R is the equivalent circuit resistance; Udc is the side voltage value; C is the side inductance value; Rload and eload are the load resistance and electromotive forces; id and iq are d-axis and q-axis currents; and ed is the d-axis voltage.
The control of DC bus voltage adopts closed-loop control, and the output is used as the compensation of q-axis current to make the control more stable and effective. The overall control structure of the FESS is shown in Figure 2.

2.3. Response Characteristics of FESS

A 250 kW/50 kWh FESS unit is simulated. The specific parameters are shown in Appendix A. The simulation mainly considers the modeling and simulation of the motor, machine side converter, DC bus voltage, and grid side converter.
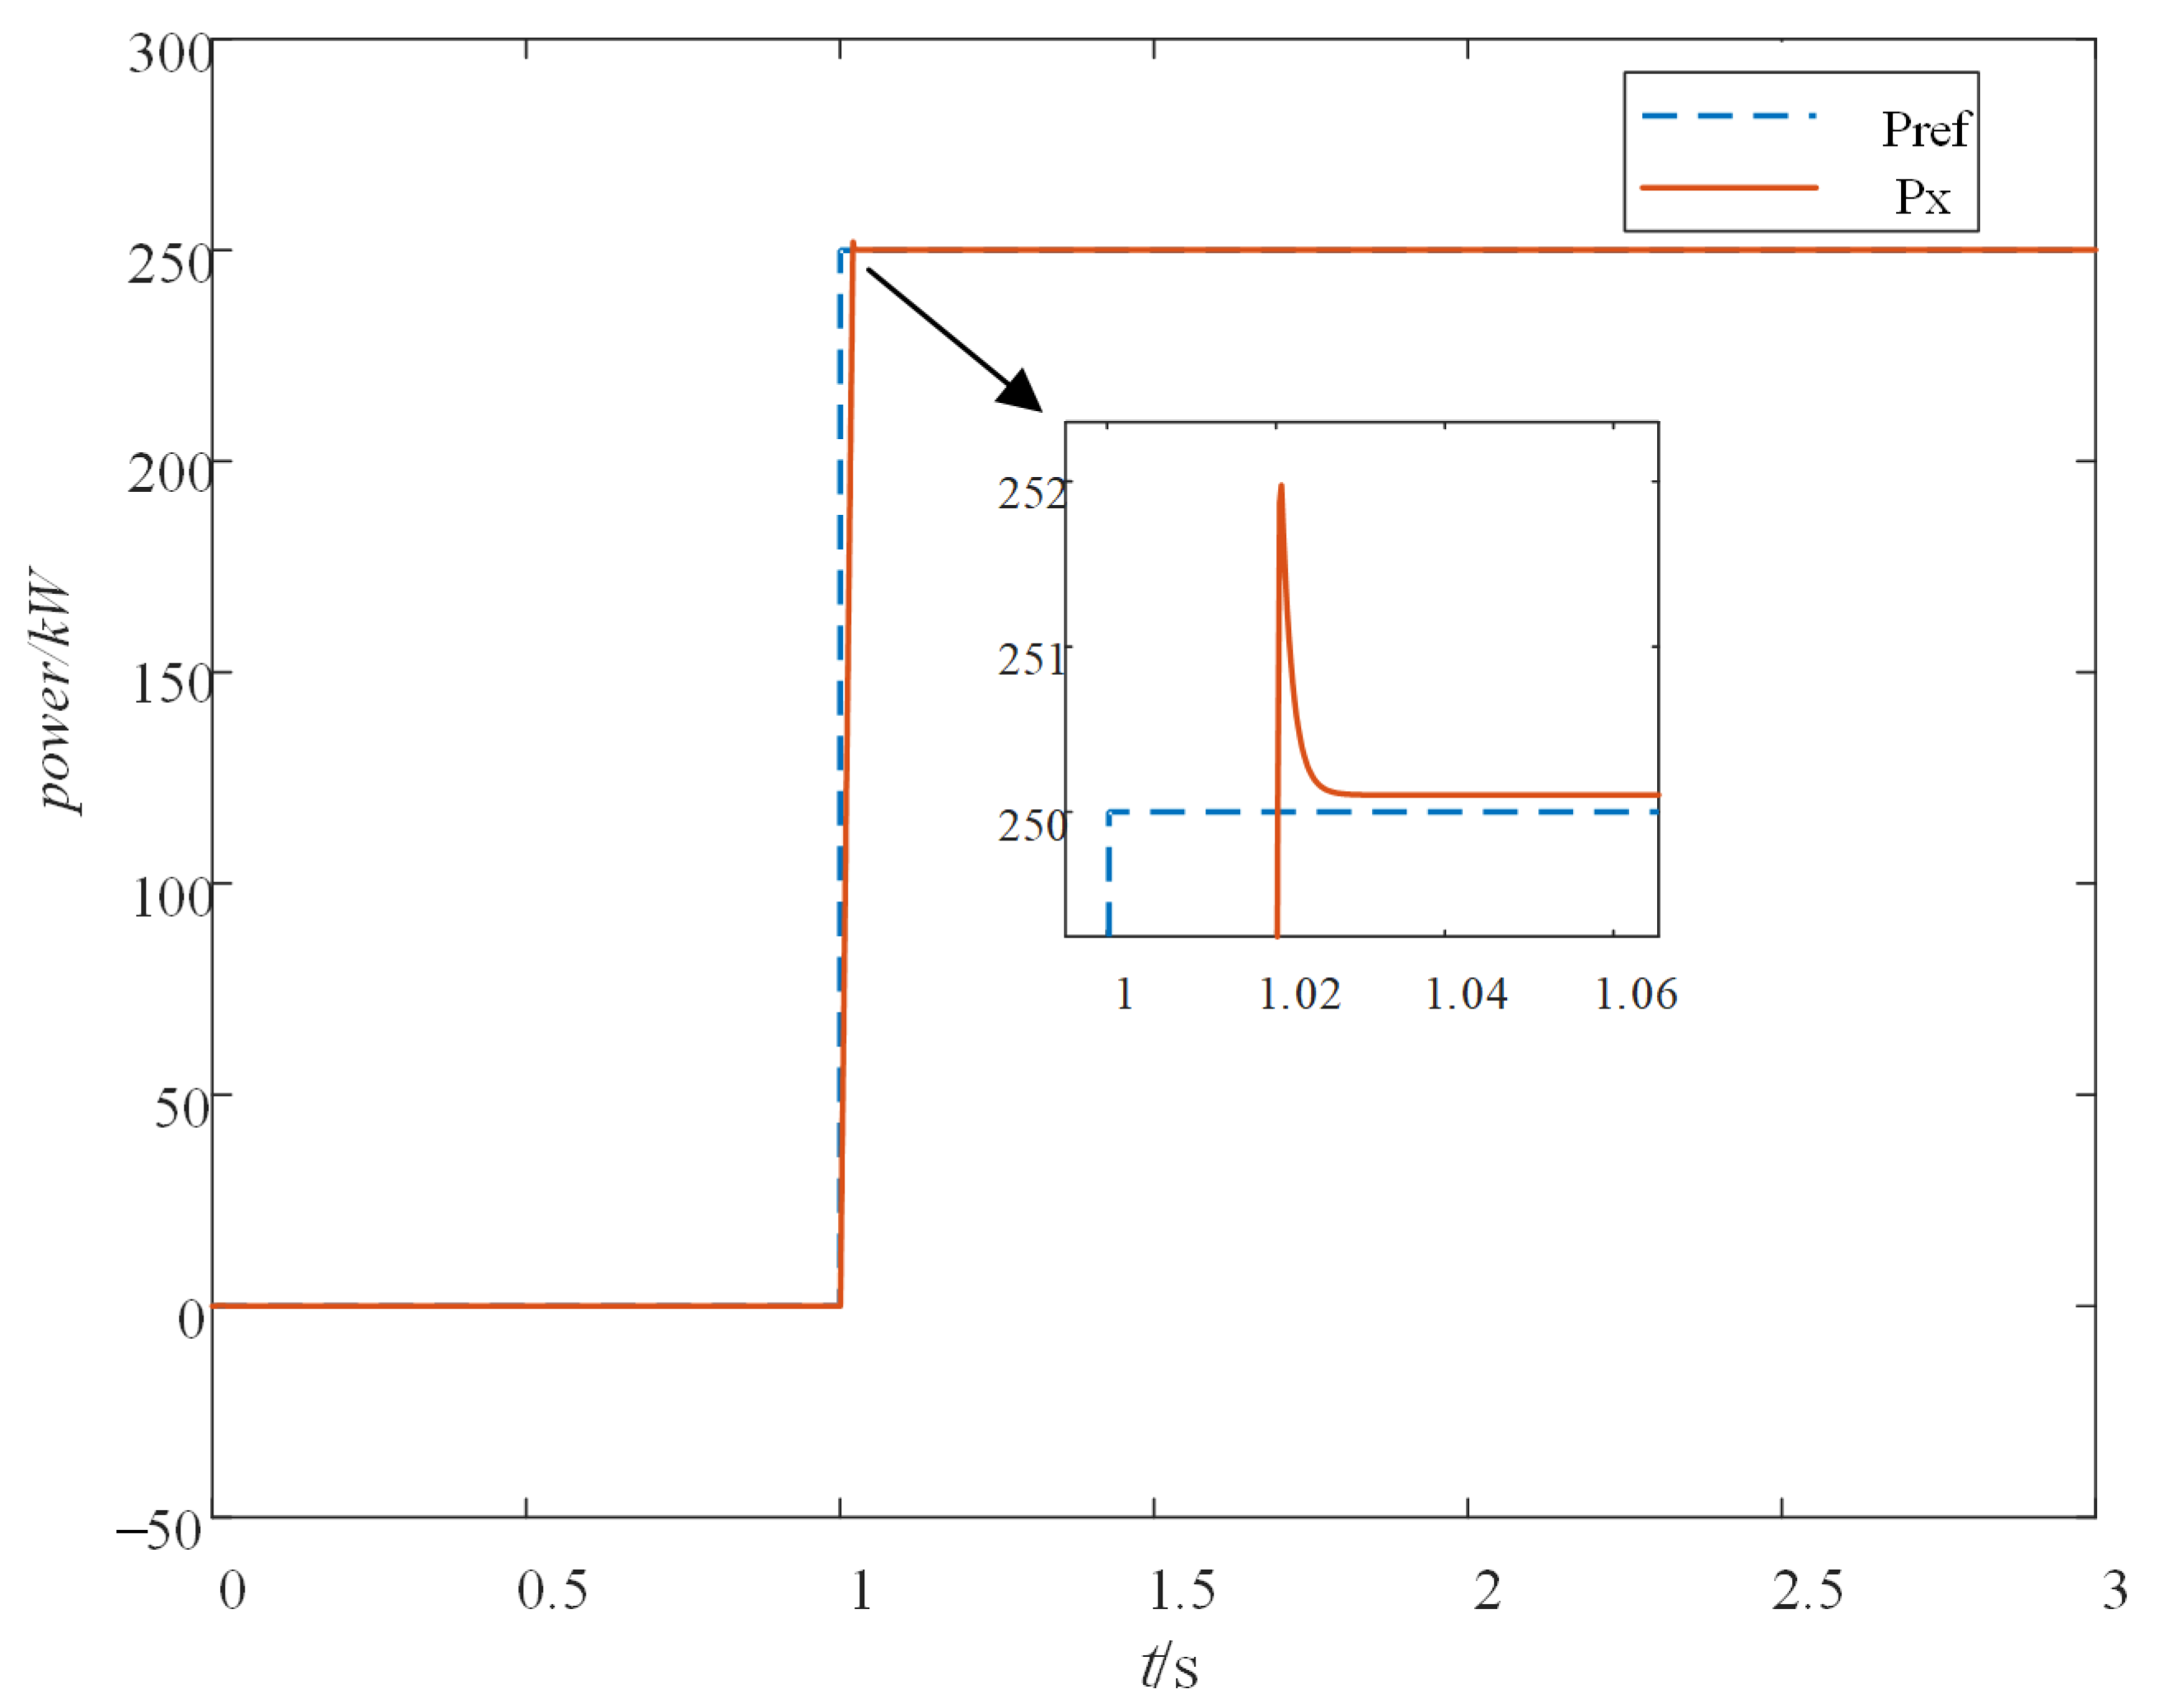
A 250 kW power step signal is the input to the FESS, and the response output of the FESS is shown in Figure 3.
It can be seen from Figure 3 that the FESS starts to change with the given step signal at 1 s. The dashed line refers to the given power of 250 kW (Pref), while the solid line represents the response of the established flywheel model (Px). The FESS can start to respond after 0.02 s, and can then stably track the given step power. This shows that the response capability of the FESS is in milliseconds and the adjustment is rapid. According to the response time, it can be seen that the FESS can effectively meet the frequency regulation of power system.

3. Grid Frequency Regulation Control Based on FESS

3.1. AGC Frequency Modulation Model of Conventional Thermal Power Unit

AGC control is the secondary frequency modulation control of the power system. It means that the generator set can provide the power required when the frequency returns to the reference frequency according to the AGC command issued during the operation; it can also set a certain adjustment rate to ensure that the frequency can return to the normal range in time. In this way, the grid frequency can be maintained within a safe range.
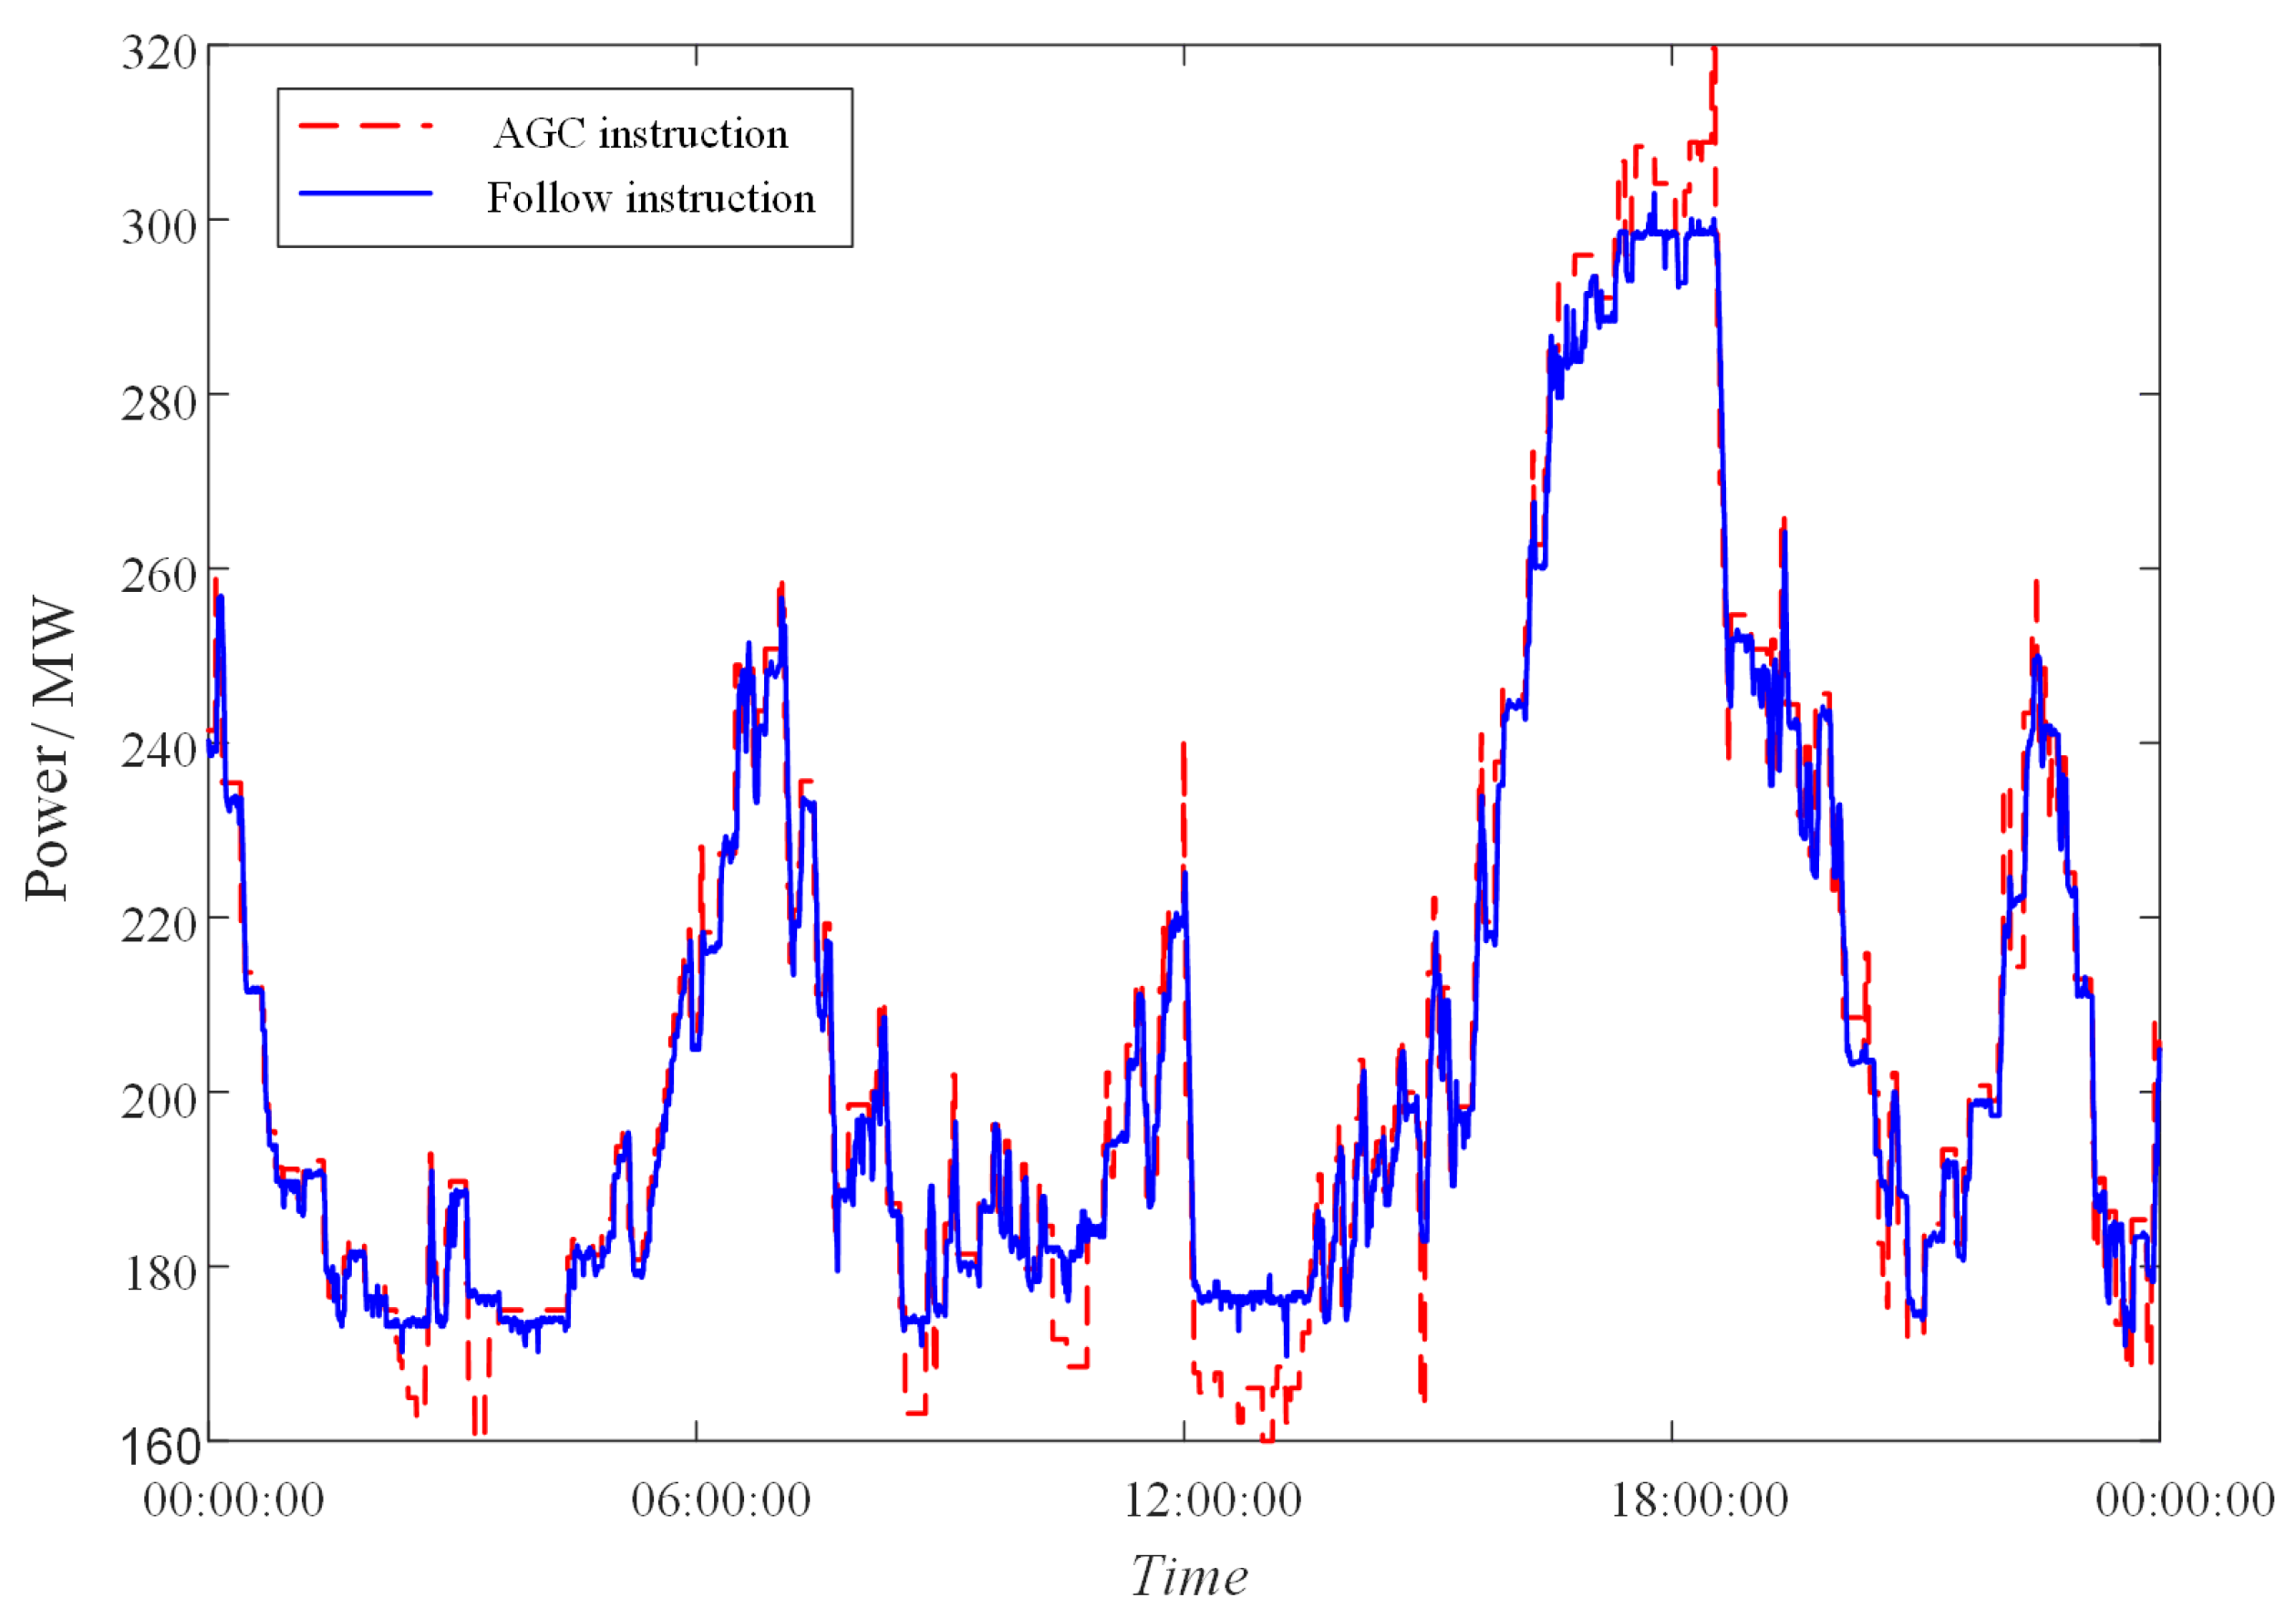
The AGC dispatching instructions received by a unit on 1 October 2021 is taken as an example, shown in Figure 4. The AGC instructions received within 24 h changed a total of 290 times, with an average change of AGC instructions every 5 min. Among them, 56% of the AGC signals last within 3 min, 77% of the AGC signals last within 6 min, and 98% of the AGC signals last within 15 min. It can be seen that the AGC instructions received by the unit fluctuate frequently, but most of the frequency modulation time is within 15 min.
In addition, there is a certain lag in the AGC instruction of the thermal power unit following the scheduling which will affect the frequency adjustment time. As a large amount of wind power connected to the power system will reduce the share of thermal power units and increase the pressure of frequency regulation, the frequency regulation task of thermal power units will be more onerous. If thermal power units fail to respond to dispatching instructions in time, the frequency fluctuation of power grid will further deteriorate.
In the frequency control and regulation of the power system, the small signal analysis model can be established by using the linearization method at the stable operational point. According to the literature [22], based on the single-area power grid dominated by traditional thermal power units, the secondary frequency modulation model of the single-area power grid is established. The model mainly includes the secondary frequency modulation controller, governor, reheat steam turbine, tie line, and load.
The primary frequency modulation is the automatic response of the unit. The dispatcher does not need to issue scheduling instructions. By adding the control link of the secondary frequency modulation in the primary frequency modulation system, the secondary frequency modulation process automatically tracks adjustment, so the frequency deviation is reduced to zero. Therefore, by adding a secondary frequency modulation controller, the influence of load disturbance on the system frequency is minimized; finally, the reference frequency of the power system is reached, and the frequency adjustment process is realized.
The governor of the thermal power unit is the basis of power grid frequency regulation, which can automatically adjust the frequency. The common mathematical model of governor can be expressed with transfer function Gov (s) in Equation (7) [23]:
G ov ( s ) = 1 T gi s + 1
where Tgi is the governor time coefficient.
Compared with non-reheat steam turbines, reheat steam turbines have more intermediate reheat links which can effectively improve the utilization rate of steam. The reheat steam turbine obtained by equivalent polymerization is expressed in Equation (8) [24]:
G ( s ) = F HP T Ri s + 1 ( T Ri s + 1 ) ( T ti s + 1 )
where FHP is the time gain of the reheater; TRi is the reheat time coefficient; and Tti is the time coefficient of steam turbine.
When the power imbalance in the interconnected areaal power grid leads to frequency fluctuation, the power support is carried out by setting the tie line in each area. The transfer function of the tie line is derived in Equation (9) [24].
{ T 12 = 2 π | U 1 | | U 2 | X 12 cos ( φ 1 φ 2 ) Δ P tie = T 12 s ( Δ f 1 Δ f 1 )
where T12 is the power synchronization coefficient; X12 is the equivalent impedance of the tie line; the voltage of Area 1 and Area 2 are U1 and U2, respectively; φ1 and φ2 correspond to the power angles of Area 1 and Area 2, respectively. ∆Ptie is the deviation of tie line switching power in Equation (10) [24].
Δ φ = 2 π Δ f d t
According to the above formula, the transfer function equation of the tie line can be obtained in Equation (11) [24]:
G t ( s ) = 2 π T 12 s
Without considering the power loss caused by grid heating, the transfer function of the system frequency response is shown in Equation (12) [24]:
H ( s ) = 1 2 H s + D
where H is the inertia of the power system and D is damping.
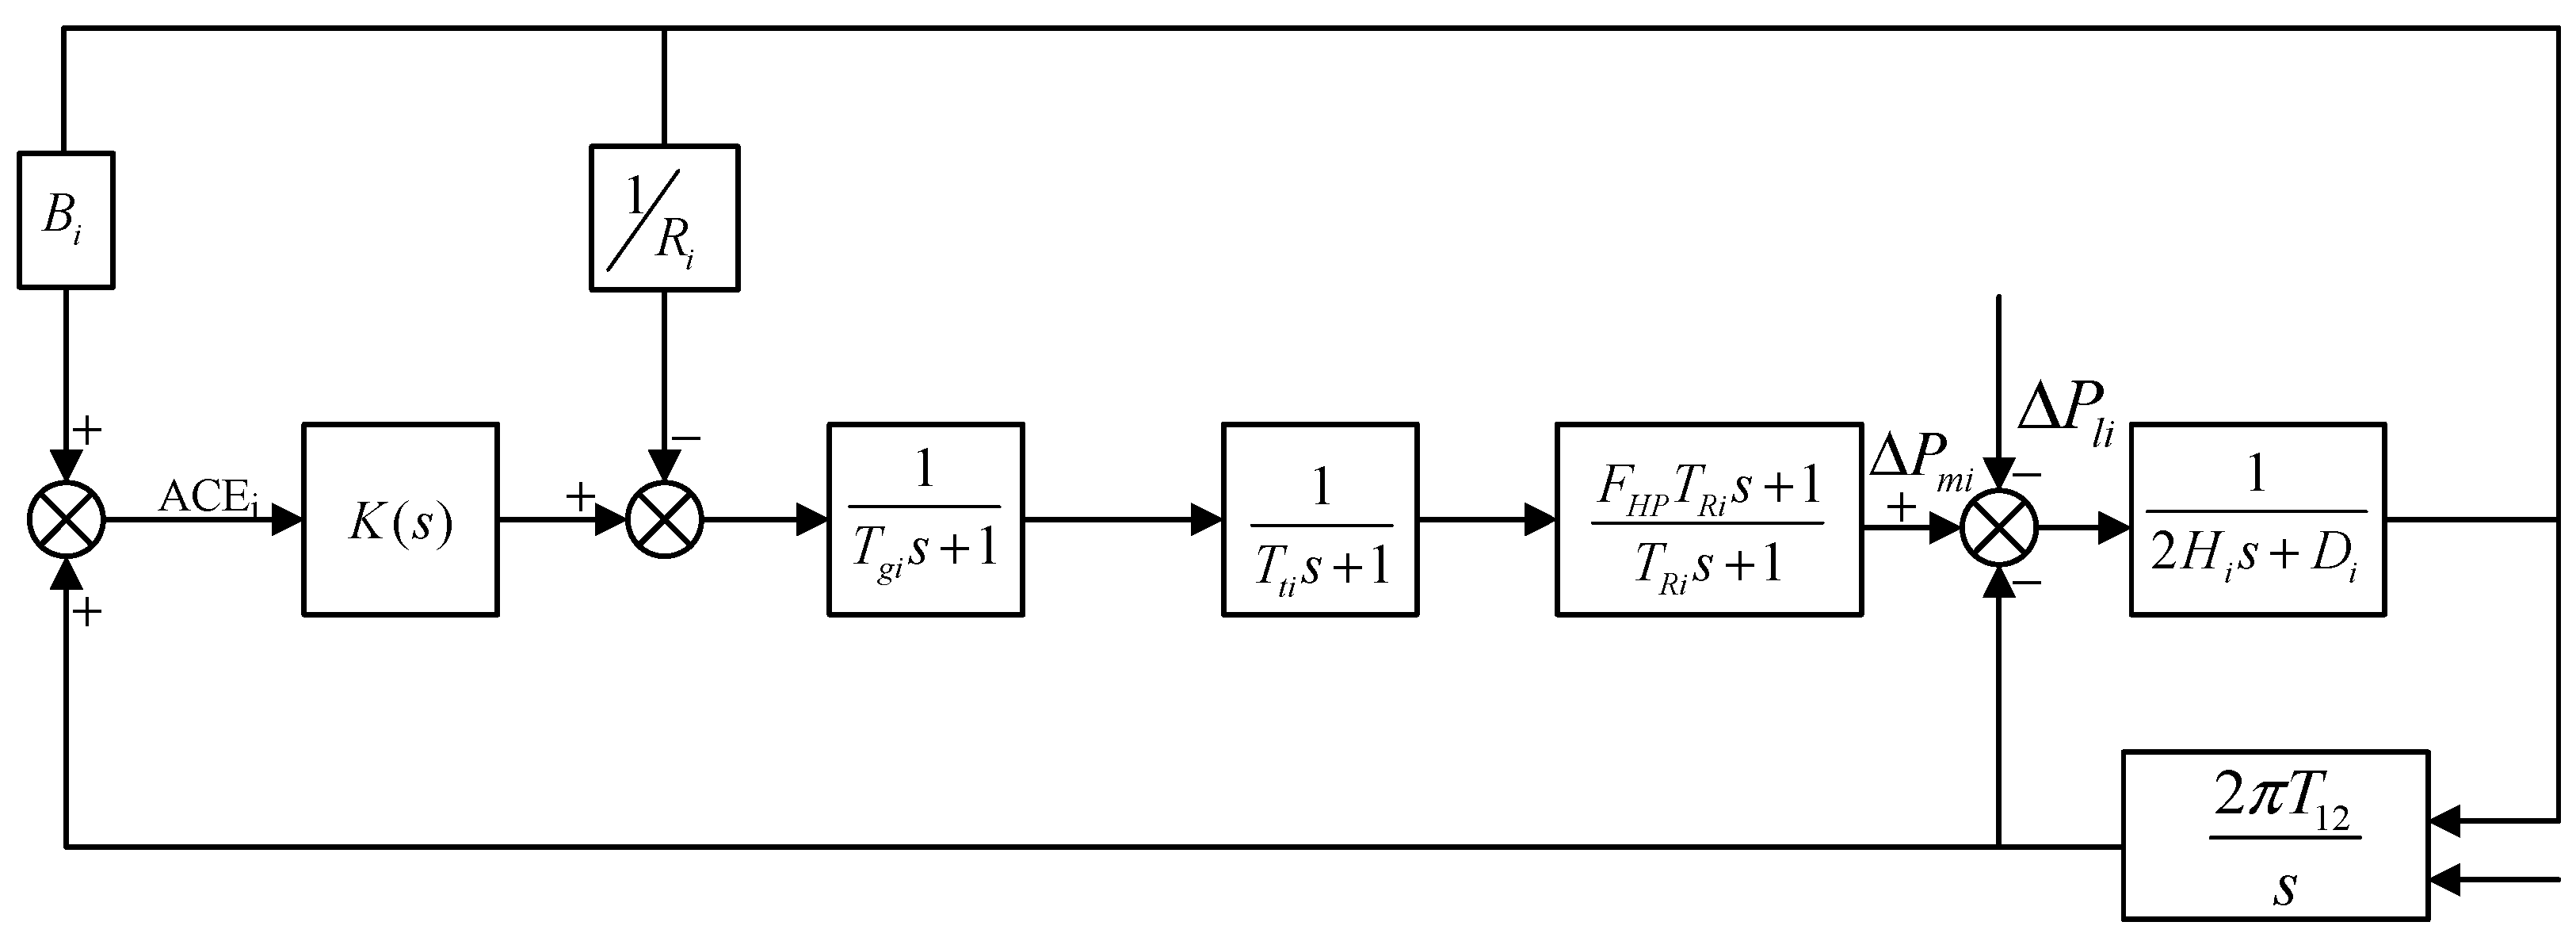
According to the above transfer function, the AGC frequency response model of the single-area power grid is simplified as shown in Figure 5. In Figure 5, Bi and Ri represent the frequency offset coefficient of the system area i and the adjustment coefficient of the equivalent thermal power unit, respectively.
In summary, the power system in each area can be interconnected. When the load in a certain area suddenly changes, a power imbalance occurs in this area, and the frequency changes. The power grid dispatching control department issues a dispatching signal according to the automatic generation control system. The frequency modulator controls the thermal power unit according to the issued command signal to provide additional power, supports the power through the tie line, and finally restores the frequency of the system to the reference frequency.

3.2. Frequency Response Model of Power System Considering Wind Power

Due to the increasing penetration of wind power integration, wind turbines are gradually replacing traditional thermal power units, resulting in a gradual decrease in the inertia of the power system and the ability of the system to resist load disturbances. It is assumed that the power generation unit is composed of thermal power and wind power. Assuming that the proportion of power generation of conventional thermal power units is K, the wind power output penetration rate is p = 1 − K, and the moment of inertia time constant of the power system is negatively correlated with the wind power penetration rate [20]. Based on this, the following expression of system inertia can be obtained in Equation (13) [23]:
H k = ( 1 p ) H 0
where H0 is the initial system inertia time constant, and Hk is the system inertia time constant when the proportion of wind power is p.
Moreover, due to the gradual withdrawal of participating thermal power units from grid-connected power generation, the equivalent adjustment coefficient Ri and the equivalent frequency offset coefficient Bi related to thermal power units have changed, and the two control parameter values in the power system with wind power penetration rate p can be corrected, as shown in Equation (14) [24]:
{ R i = R 0 1 p B i = 1 p R 0 + B
According to the above analysis process, the single-area load frequency control based on thermal power units is improved. Considering the change of system parameters when wind power is introduced, regardless of the frequency modulation ability of wind power, the inertia time constant, equivalent adjustment coefficient, and frequency offset coefficient of system load frequency control are modified, respectively. The wind power penetration rate is introduced into the AGC frequency response model of conventional thermal power unit frequency modulation. The frequency control response characteristics of power system under wind power integration are studied. The frequency response model of power system considering wind power is established as shown in Figure 6.

3.3. Dynamic Response Model of Frequency Modulation with Wind Power Assisted by FESS

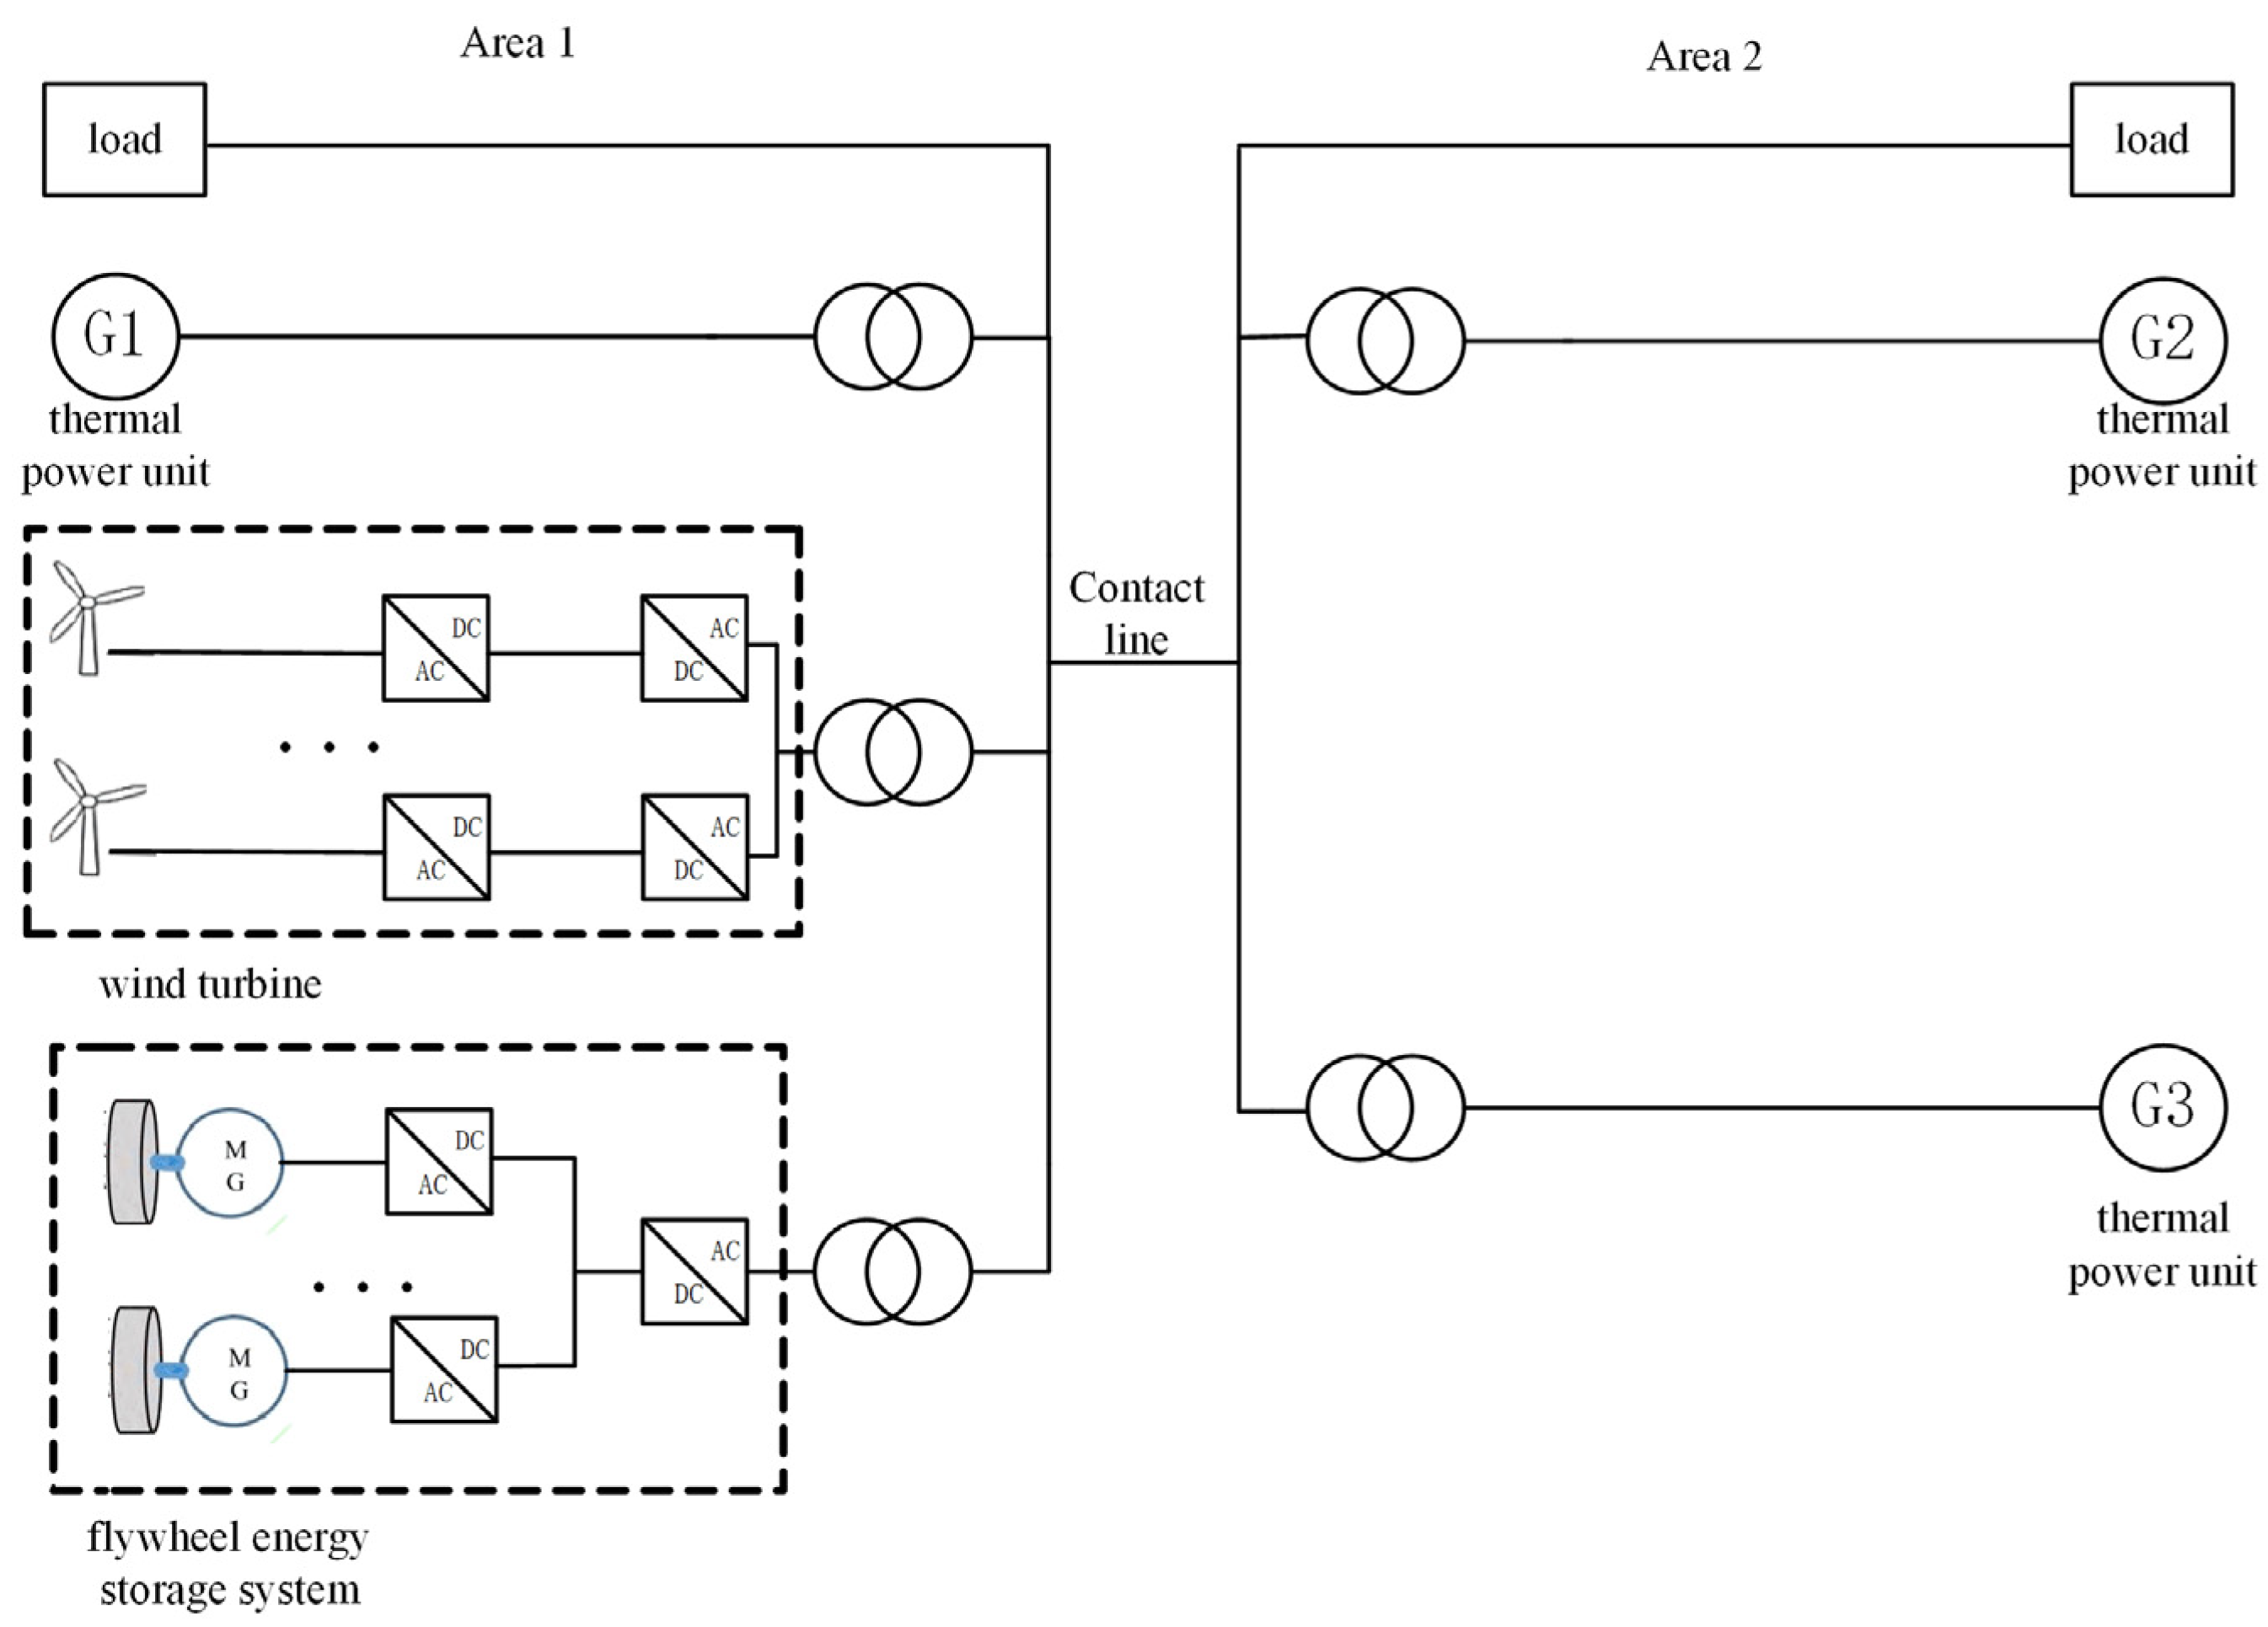
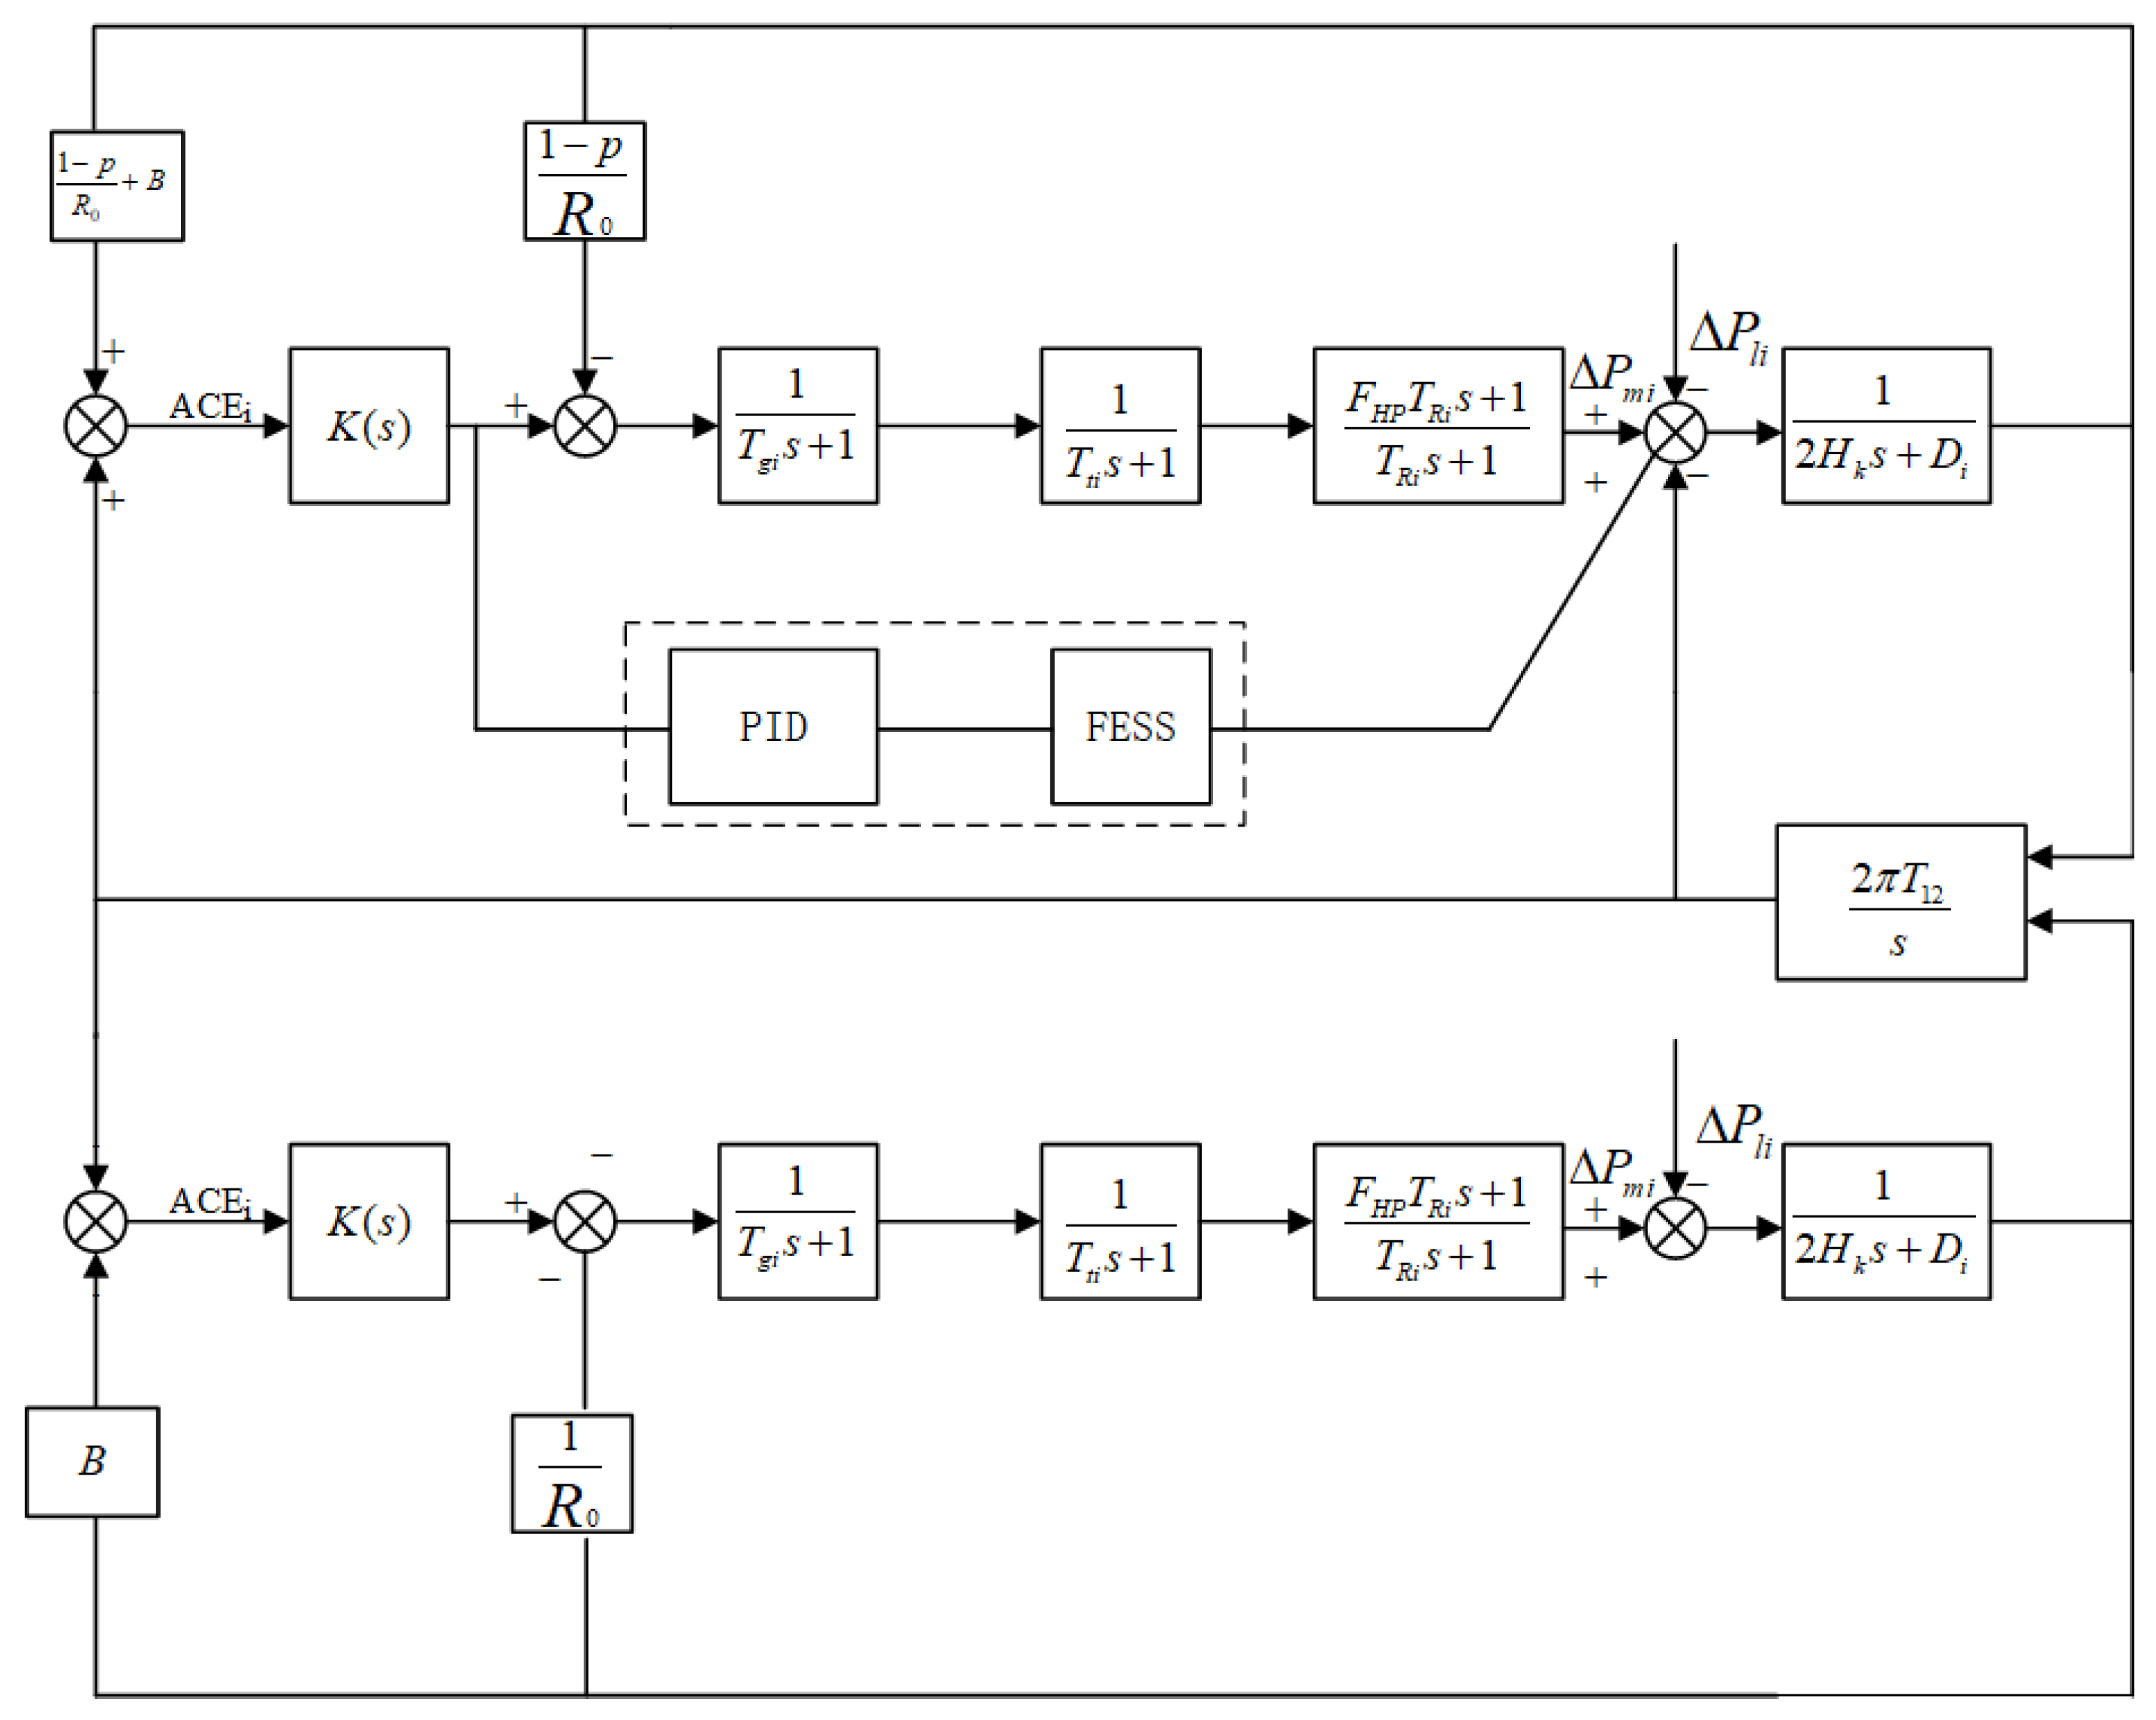
When the wind power grid leads to fluctuation of the system frequency, due to the slow response speed of the thermal power unit, it cannot follow the AGC instructions issued immediately, and the adjustment accuracy of the control is also limited. If it only relies on the use of thermal power units to participate in the frequency modulation by responding to the dispatching instructions, it is difficult to return to the expected reference frequency in time. Therefore, according to the characteristics of FESS, taking into account the two-area interconnected power grid model of wind power, a frequency control method of an interconnected power system regulated by an FESS is designed. The thermal power unit and the FESS undertake the frequency modulation task of areaal control deviation, respectively. FESS is used to assist in the auxiliary frequency regulation of power systems containing wind power. It is assumed that the overall topology of the flying system of the two-area interconnected power grid is as shown in Figure 7. Area 1 withdraws some thermal power units and increases a certain proportion of wind turbines accordingly. In order to alleviate frequency fluctuations, the FESS is used for auxiliary frequency regulation. Area 2 power generation is all provided by thermal power units, and the two areas exchange power through the tie line.
When establishing the control model considering flywheel frequency modulation, the following general assumptions are taken:
(1)
Assume that all conventional units in an area have the same output in each scenario;
(2)
The power load is maintained on the demand side, ignoring the change of D;
(3)
Improve wind power penetration by integrating unconventional units and assume that each wind turbine in an area has the same output.
Therefore, according to the above assumptions and Figure 6, the simplified analysis model of the load frequency control transfer function of the two areas with wind power integration assisted by an FESS is shown in Figure 8.

4. Results Analysis

The MATLAB programming in this paper was all written and performed in MATLAB R2018b; MATLAB R2018b ran on an i7-7700HQ, 2.8 GHz, 8.0 GB RAM personal computer.
According to Figure 8, the corresponding two-area interconnected power grid model was established on MATLAB/Simulink. The grid model includes one equivalent wind farm and three equivalent thermal power units (G1, G2, G3). When there is no wind power access in the initial stage of the system, the initial installed capacity of thermal power units in each area is 1000 MW. The parameters are normalized based on the rated load of 1000 MW and the rated frequency of 50 Hz. The initial parameters of thermal power units are shown in Appendix B below.
Three cases are designed according to the above parameters in MATLAB/Simulink for simulation verification: Case 1 analyzes the influence of different wind power penetration rates in Area 1 on system frequency stability; Case 2 analyzes the frequency response under step disturbance and compares the frequency deviation and tie line power deviation of each area of the flywheel participating in frequency modulation and not participating in frequency modulation. Case 3 analyzes the frequency response under continuous disturbance and further analyzes the feasibility of FESS participating in secondary frequency regulation of interconnected power grid.

4.1. Frequency Response Characteristics of Power Grid with Different Wind Power Penetration

Case 1: When the wind turbine is connected to Area 1, the wind power penetration rate p of Area 1 gradually increases. At this time, the frequency modulation ability of the wind turbine is not considered, and the step load disturbance of 0.1 p.u. is added to Area 1 at 5 s. At this time, the frequency response of Area 1 is shown in Figure 9 below, and the frequency characteristic index of Area 1 under different wind power penetration rates is shown in Table 1.
It can be seen from Figure 9 and Table 1 that if the wind turbine does not have the ability to regulate frequency, when the wind power penetration rate continues increasing, the minimum frequency continues decreasing, and the time to reach steady state gradually increases, so the frequency regulation effect of the power system becomes worse. The fundamental reason is that the wind power cannot provide the inertia time constant of the power system of the part of thermal power units that it replaces. As a result, the inertia time constant of the power system is significantly reduced, and the anti-interference ability of the power grid to sudden power changes is greatly weakened.

4.2. Step Disturbance Simulation Analysis

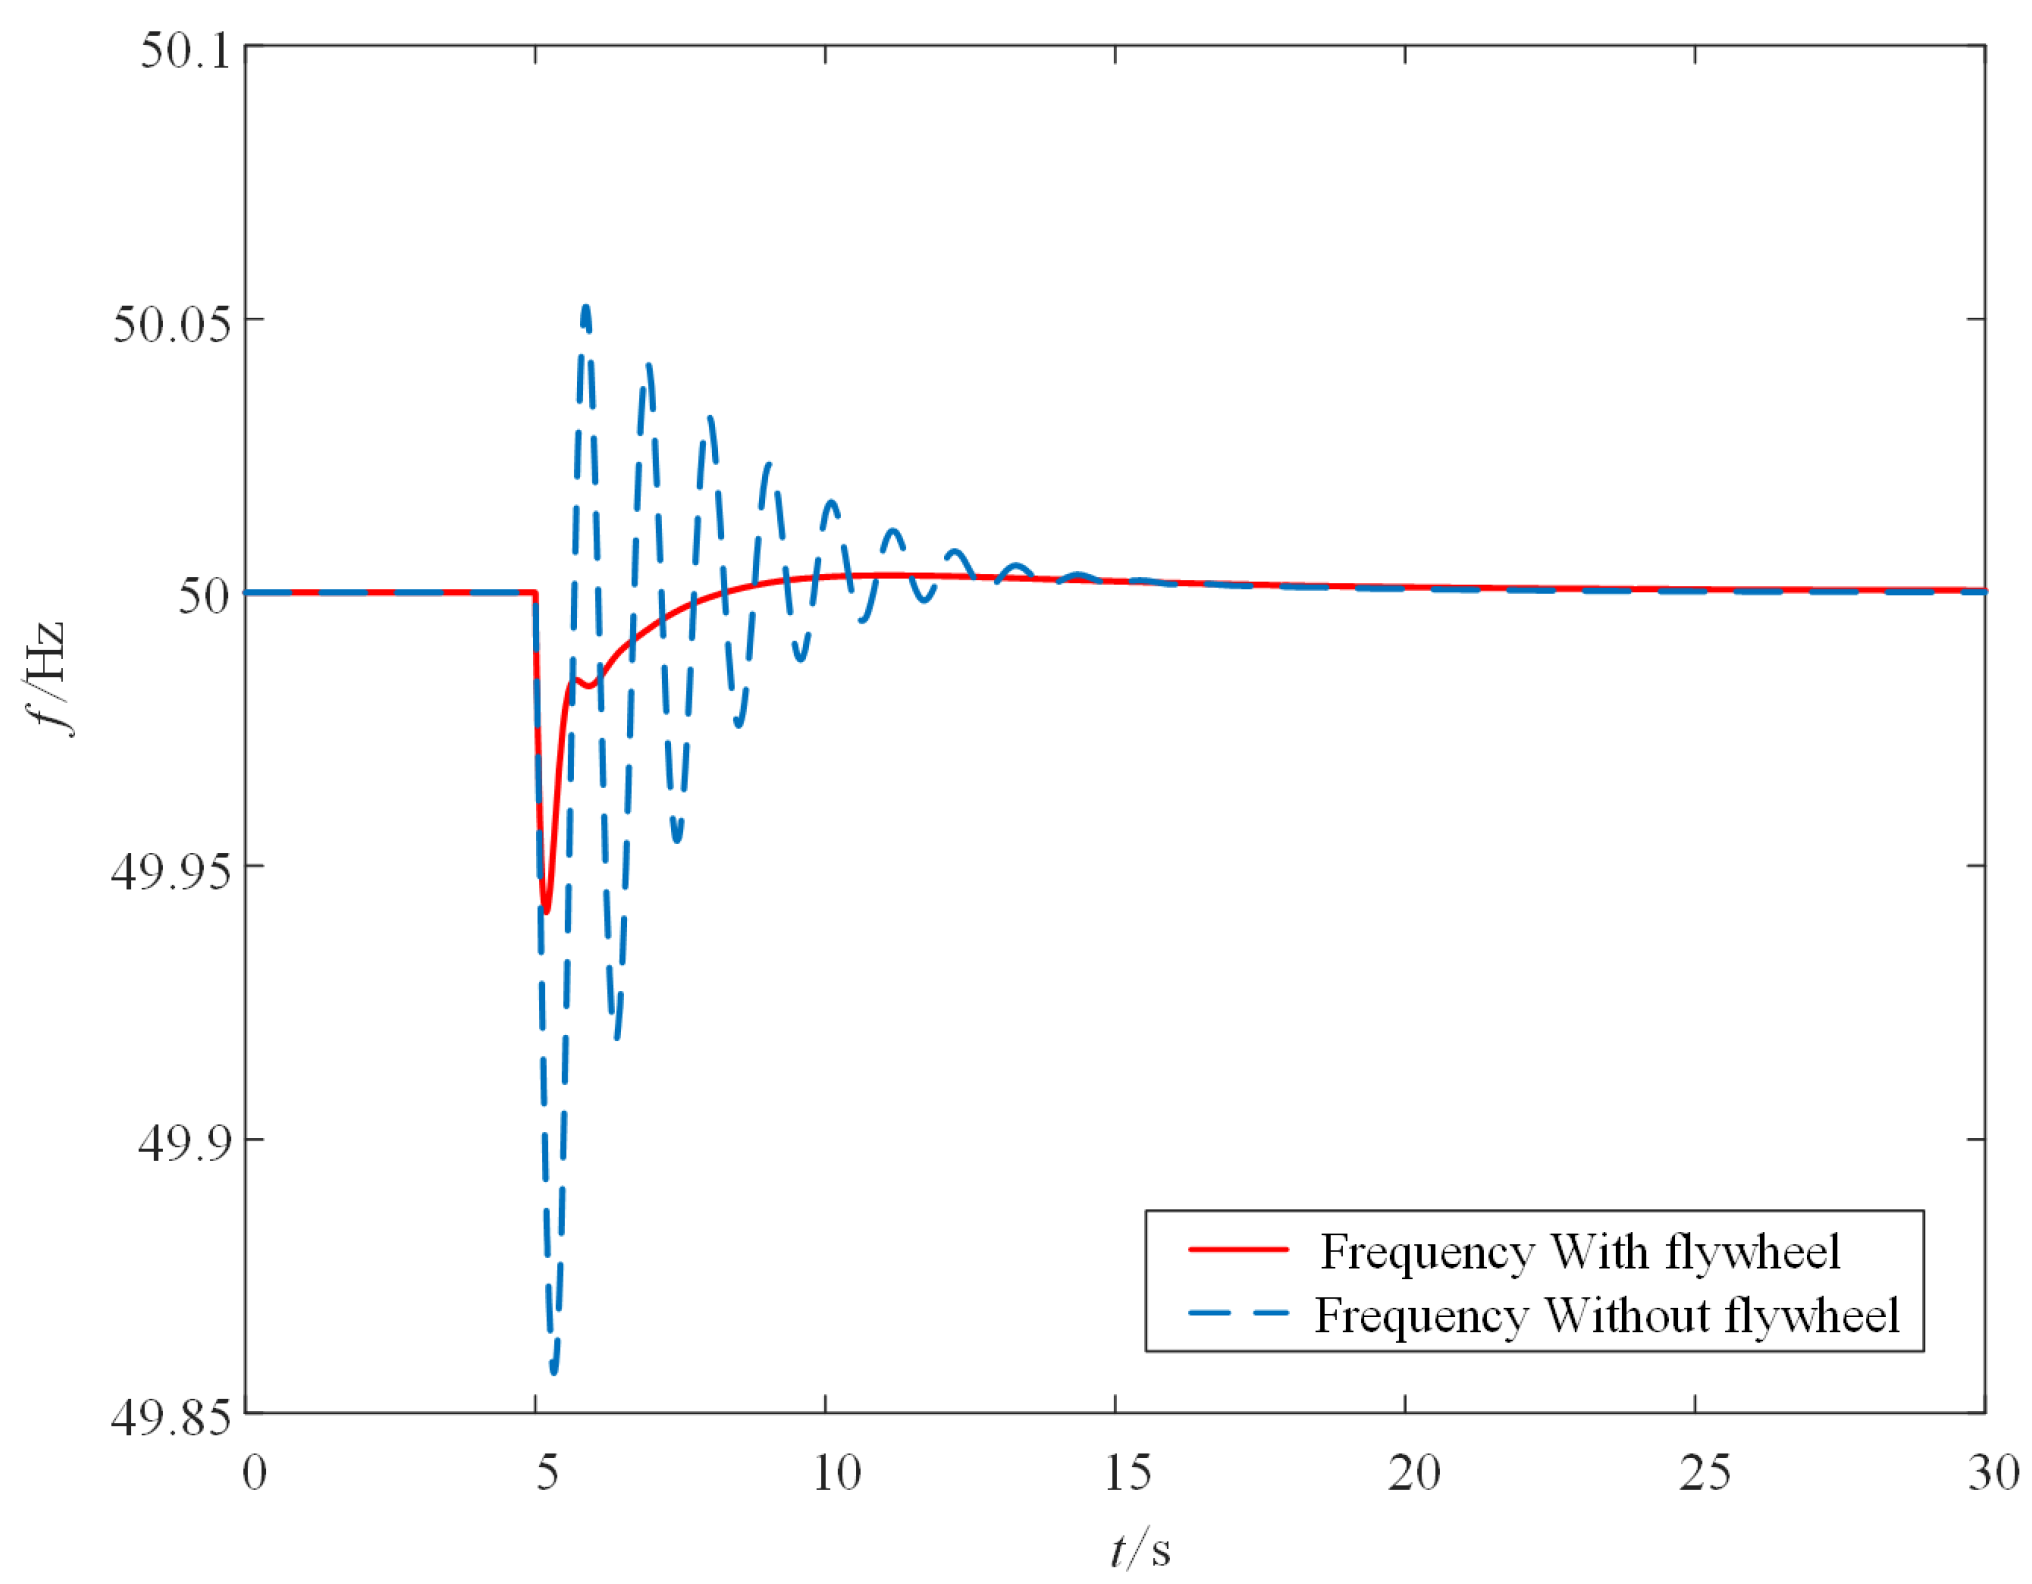
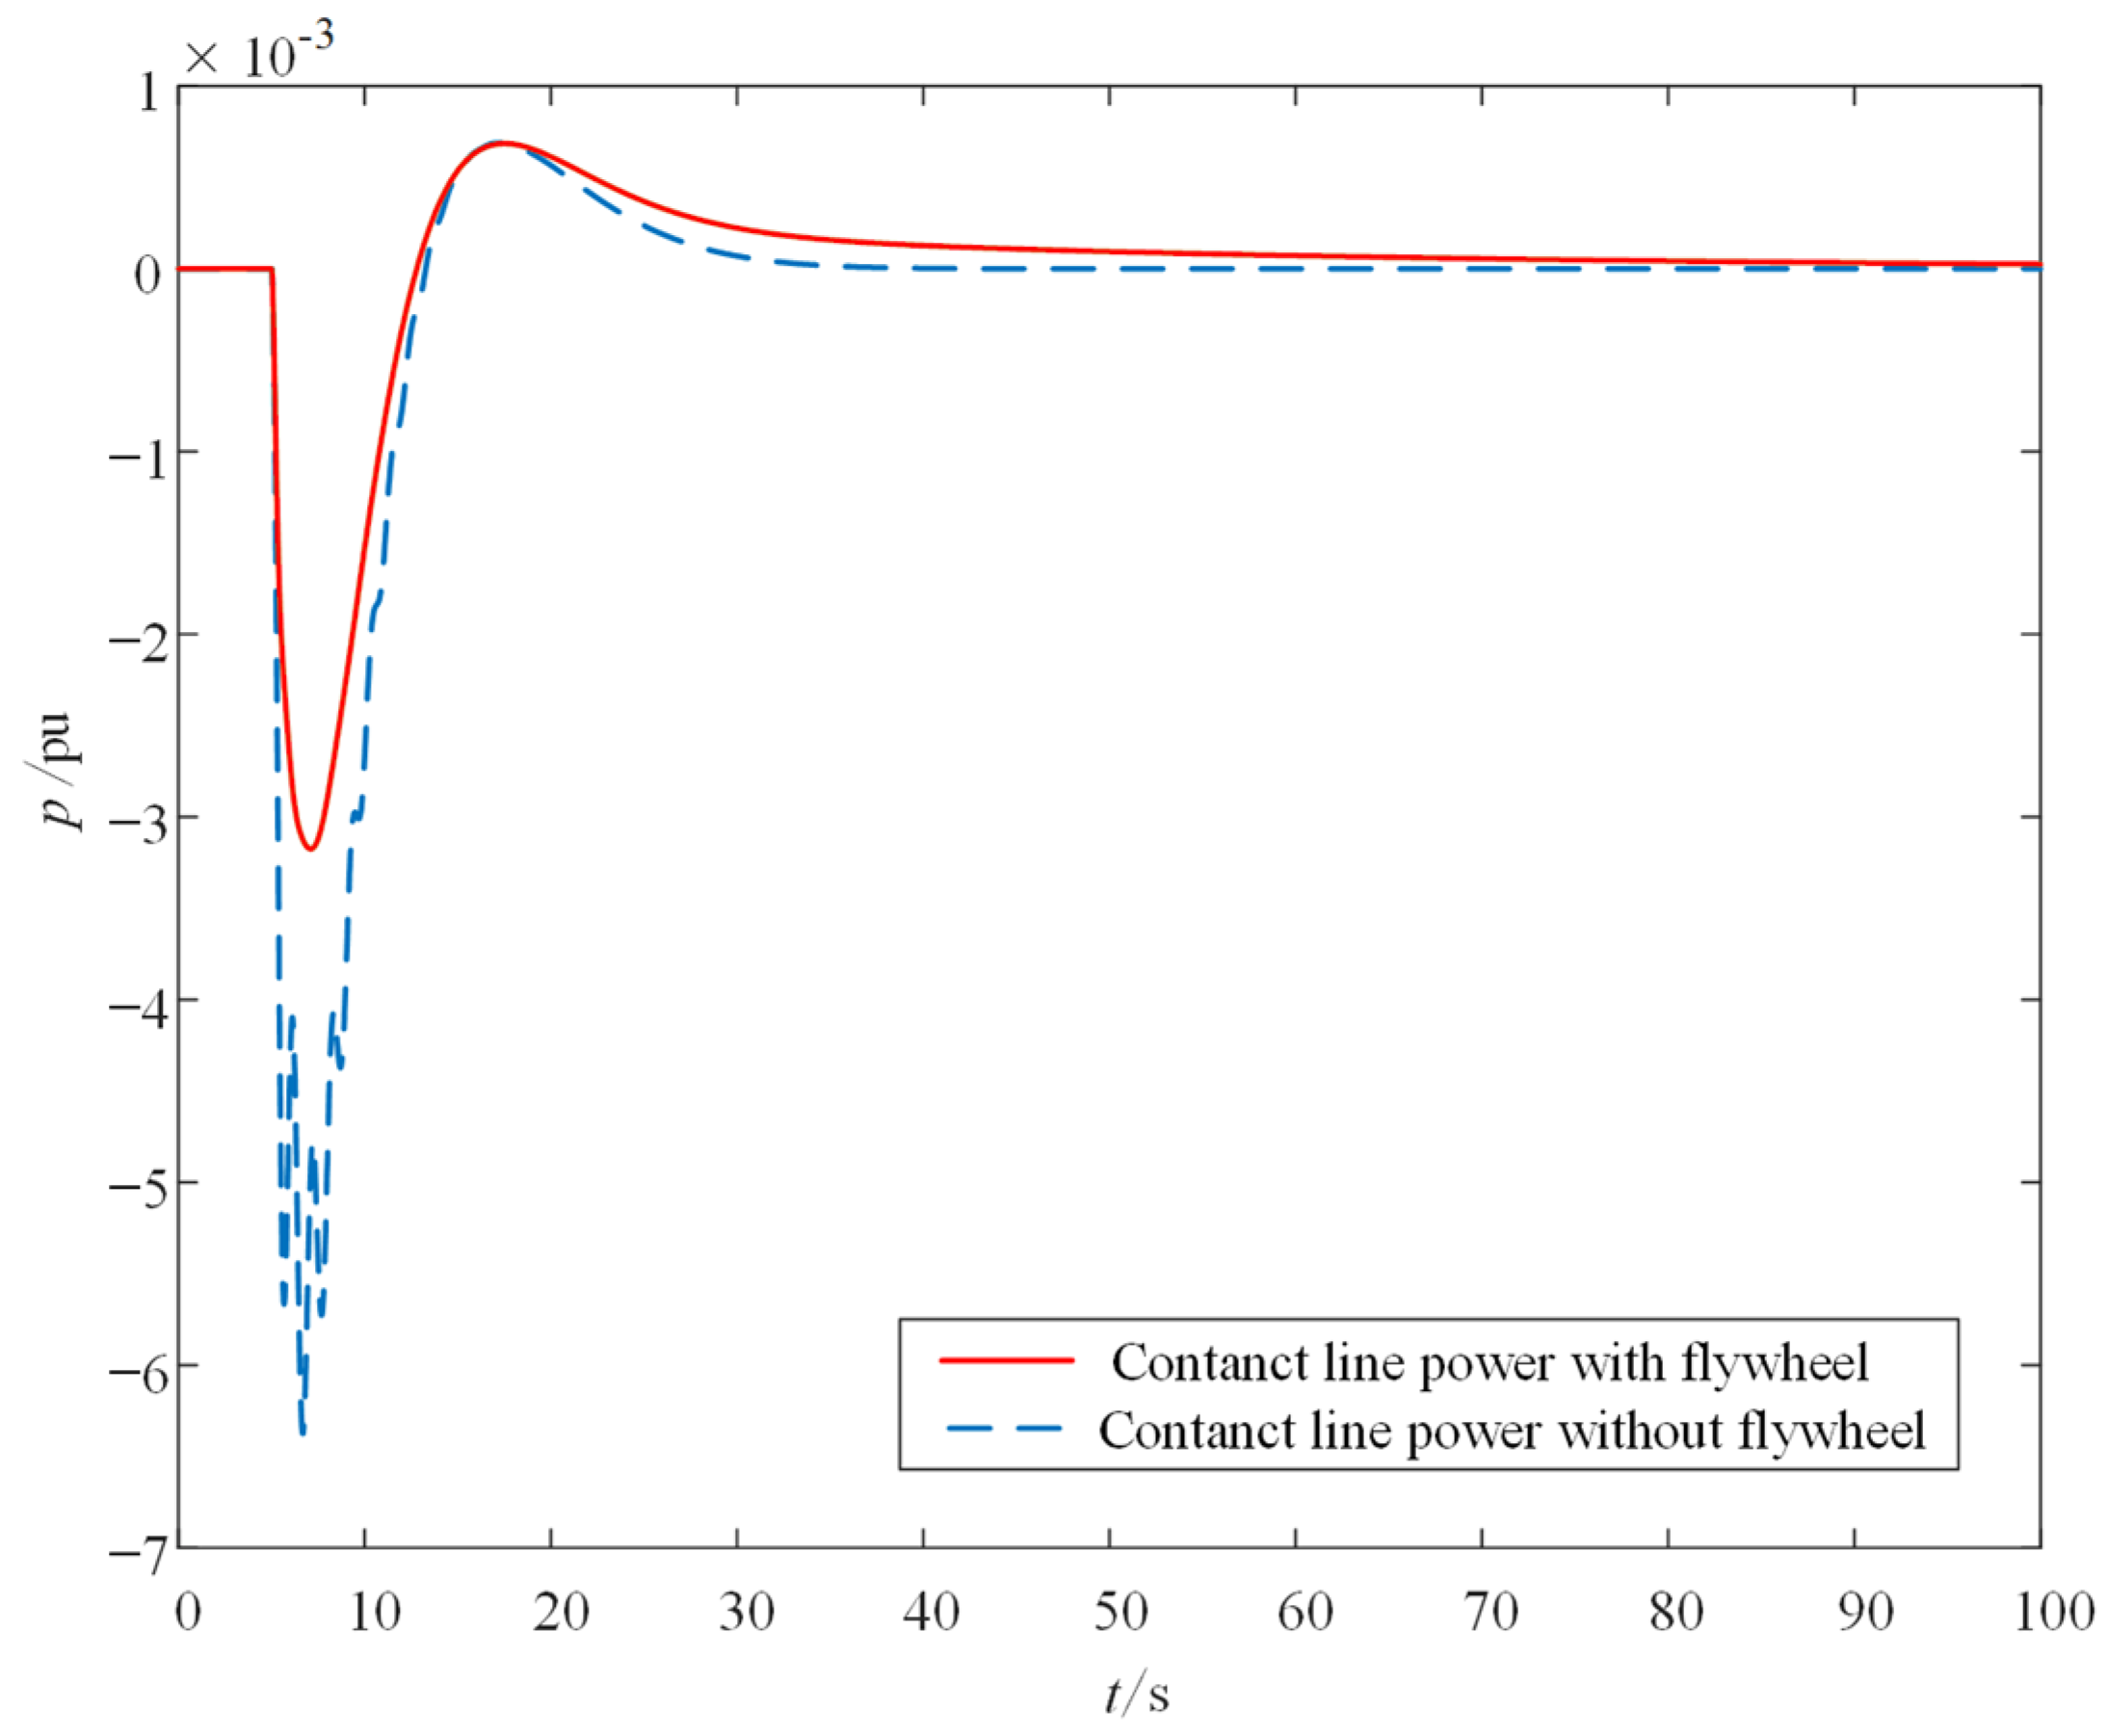
Case 2: When the wind turbine is connected to Area 1, when the wind power permeability p = 30%, the FESS with 10% rated power of wind power installed is used to assist in frequency modulation. A step load disturbance of 0.1 p.u. is added to Area 1 at 5 s. The frequency response of Area 1 and Area 2 and the deviation of tie line are as follows: Figure 10, Figure 11 and Figure 12:
It can be seen from Figure 10, Figure 11 and Figure 12 that the frequency response results of Area 1 show that the frequency regulation capability of the two-area interconnected power system has been greatly improved after the FESS is configured in Area 1 of wind power integration. Compared with having no FESS, only thermal power units are used for frequency regulation; the minimum frequency change of the system is reduced from 49.86 Hz to 49.94 Hz, the maximum frequency deviation is reduced by 57.1%, and the time to restore steady state is shortened by about 5 s. The frequency deviation trend of Area 2 is basically the same as that of Area 1. The minimum frequency is reduced from 49.985 Hz to 49.993 Hz, and the power exchange on the tie line is also reduced by 53.1%. The simulation results show that the addition of an FESS has a significant contribution to reducing frequency deviation and shortening adjustment time.

4.3. Continuous Disturbance Simulation Analysis

When step disturbance of load power occurs, the addition of an FESS can improve the primary frequency modulation effect of wind turbines. However, since the fluctuation of load power is usually irregular and continuous, it is necessary to analyze the effect of primary frequency modulation when the load power is continuously disturbed.
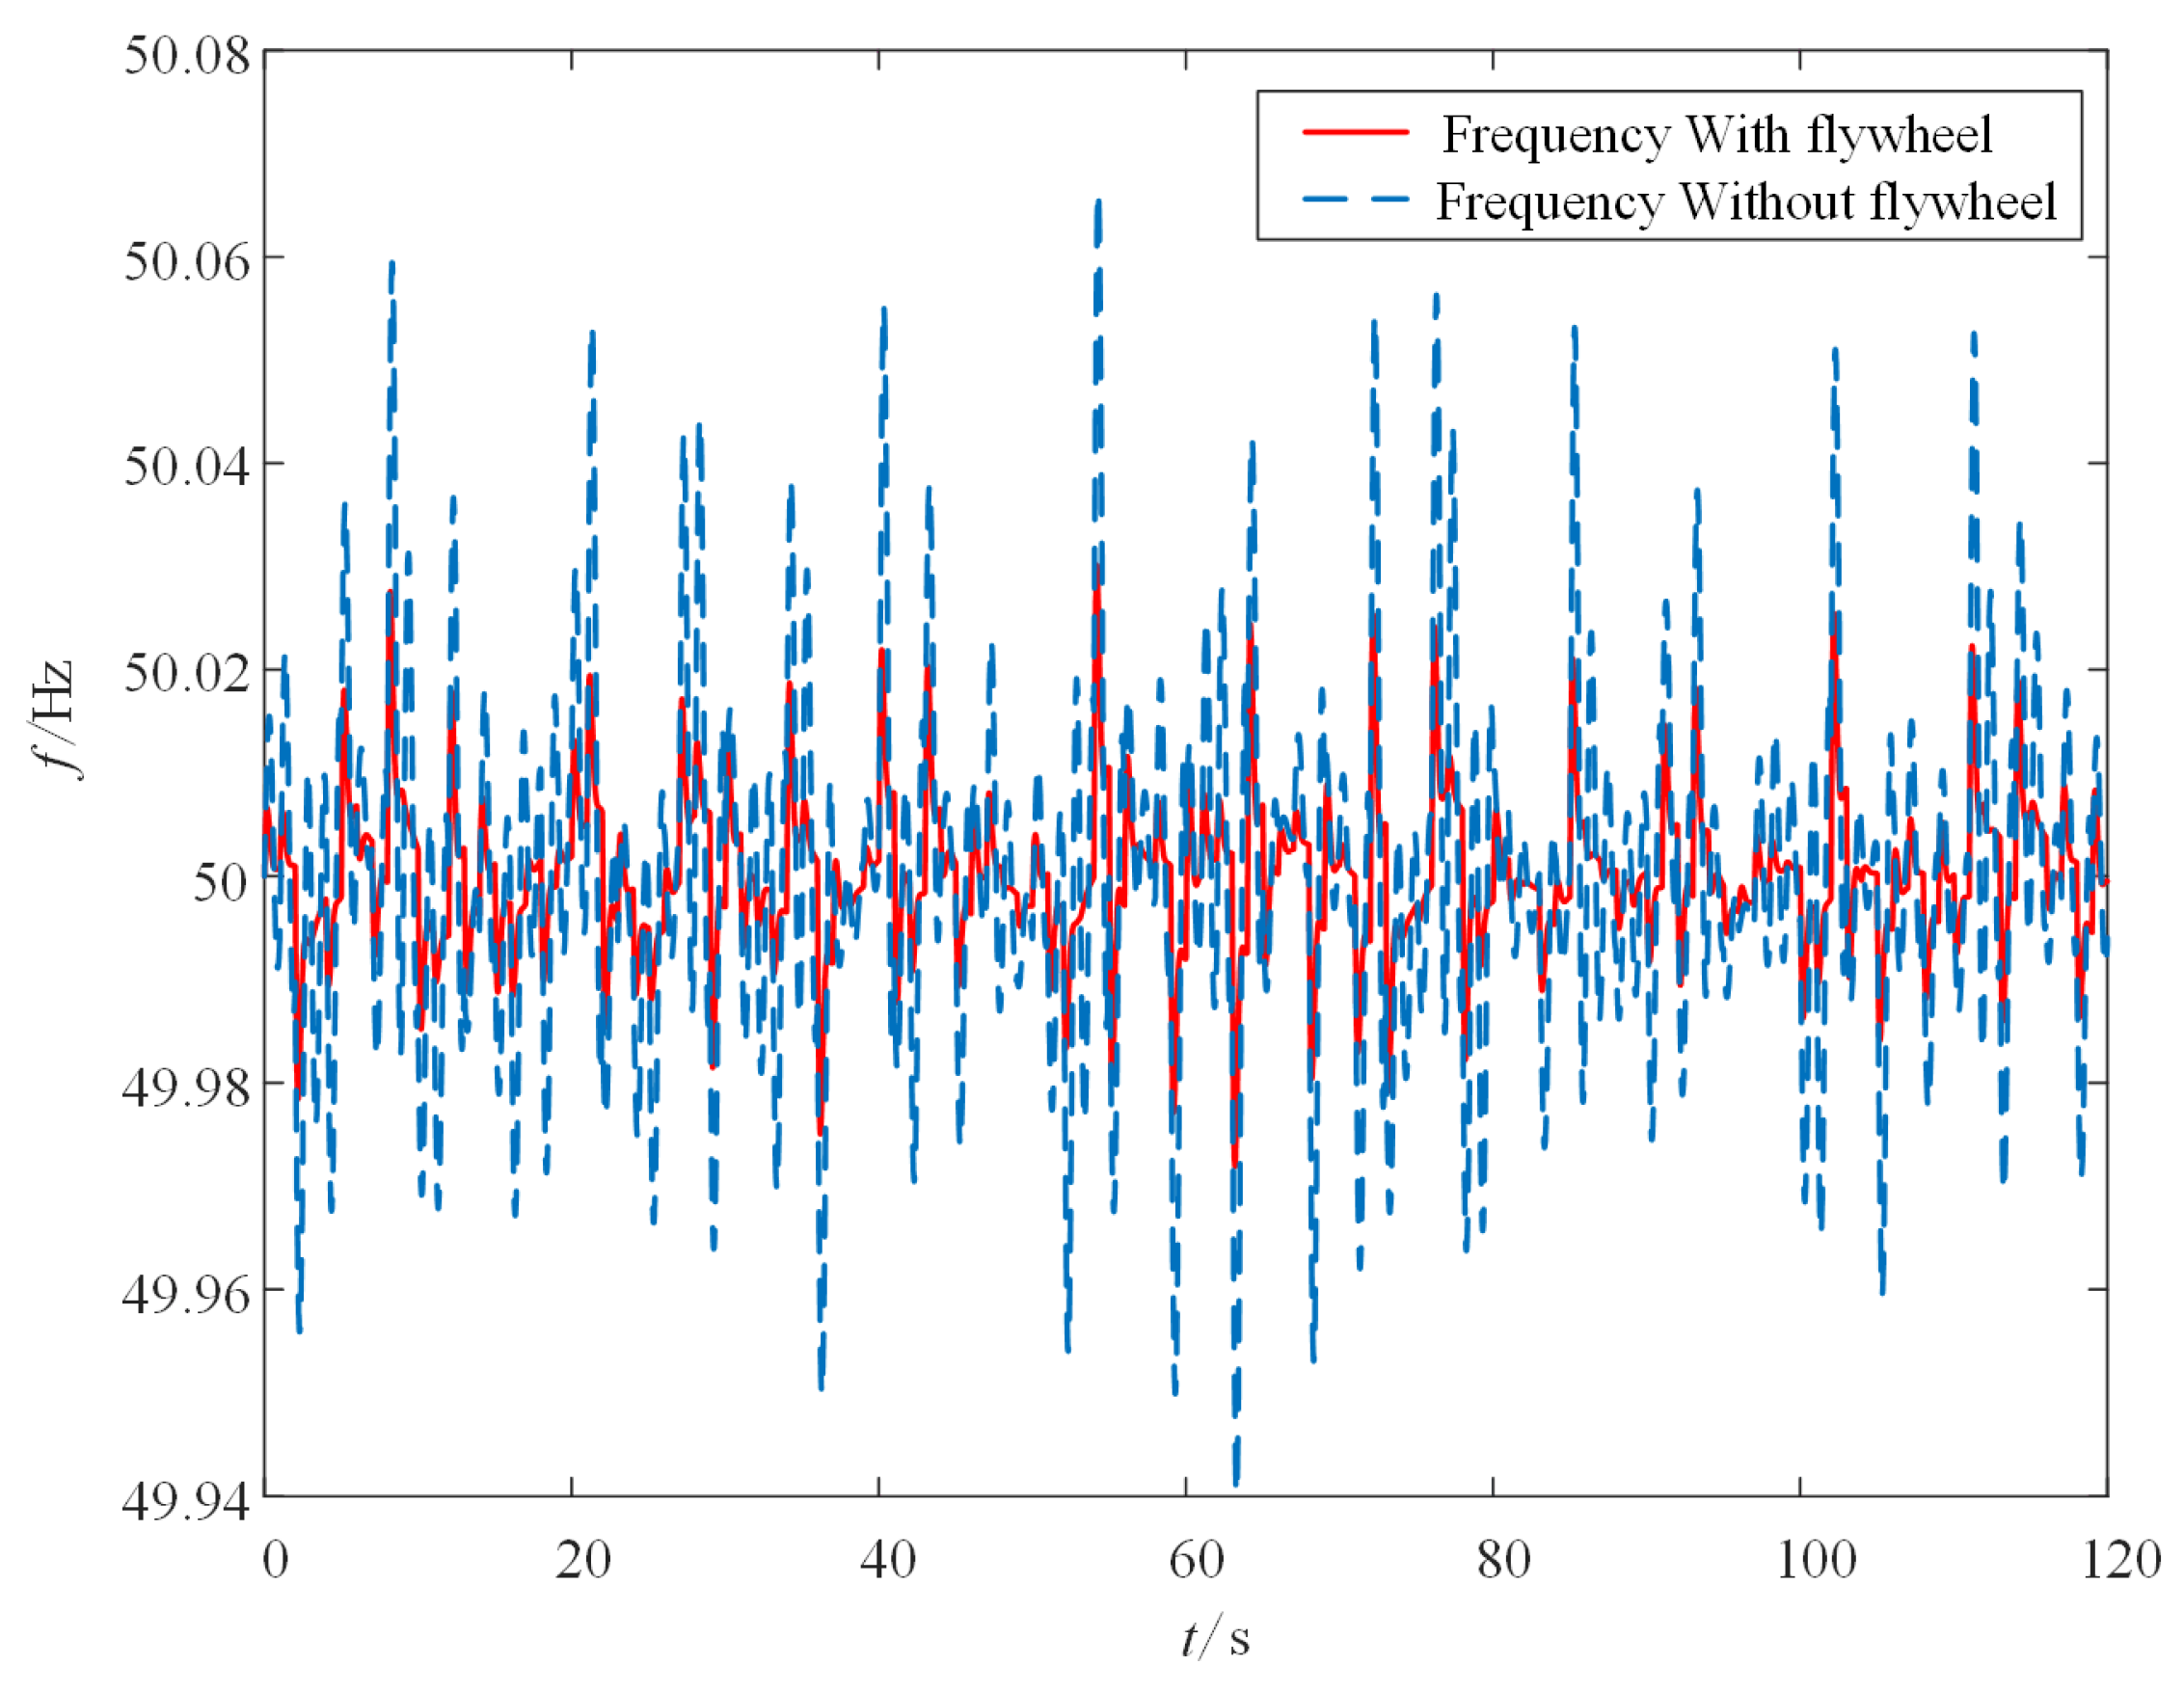
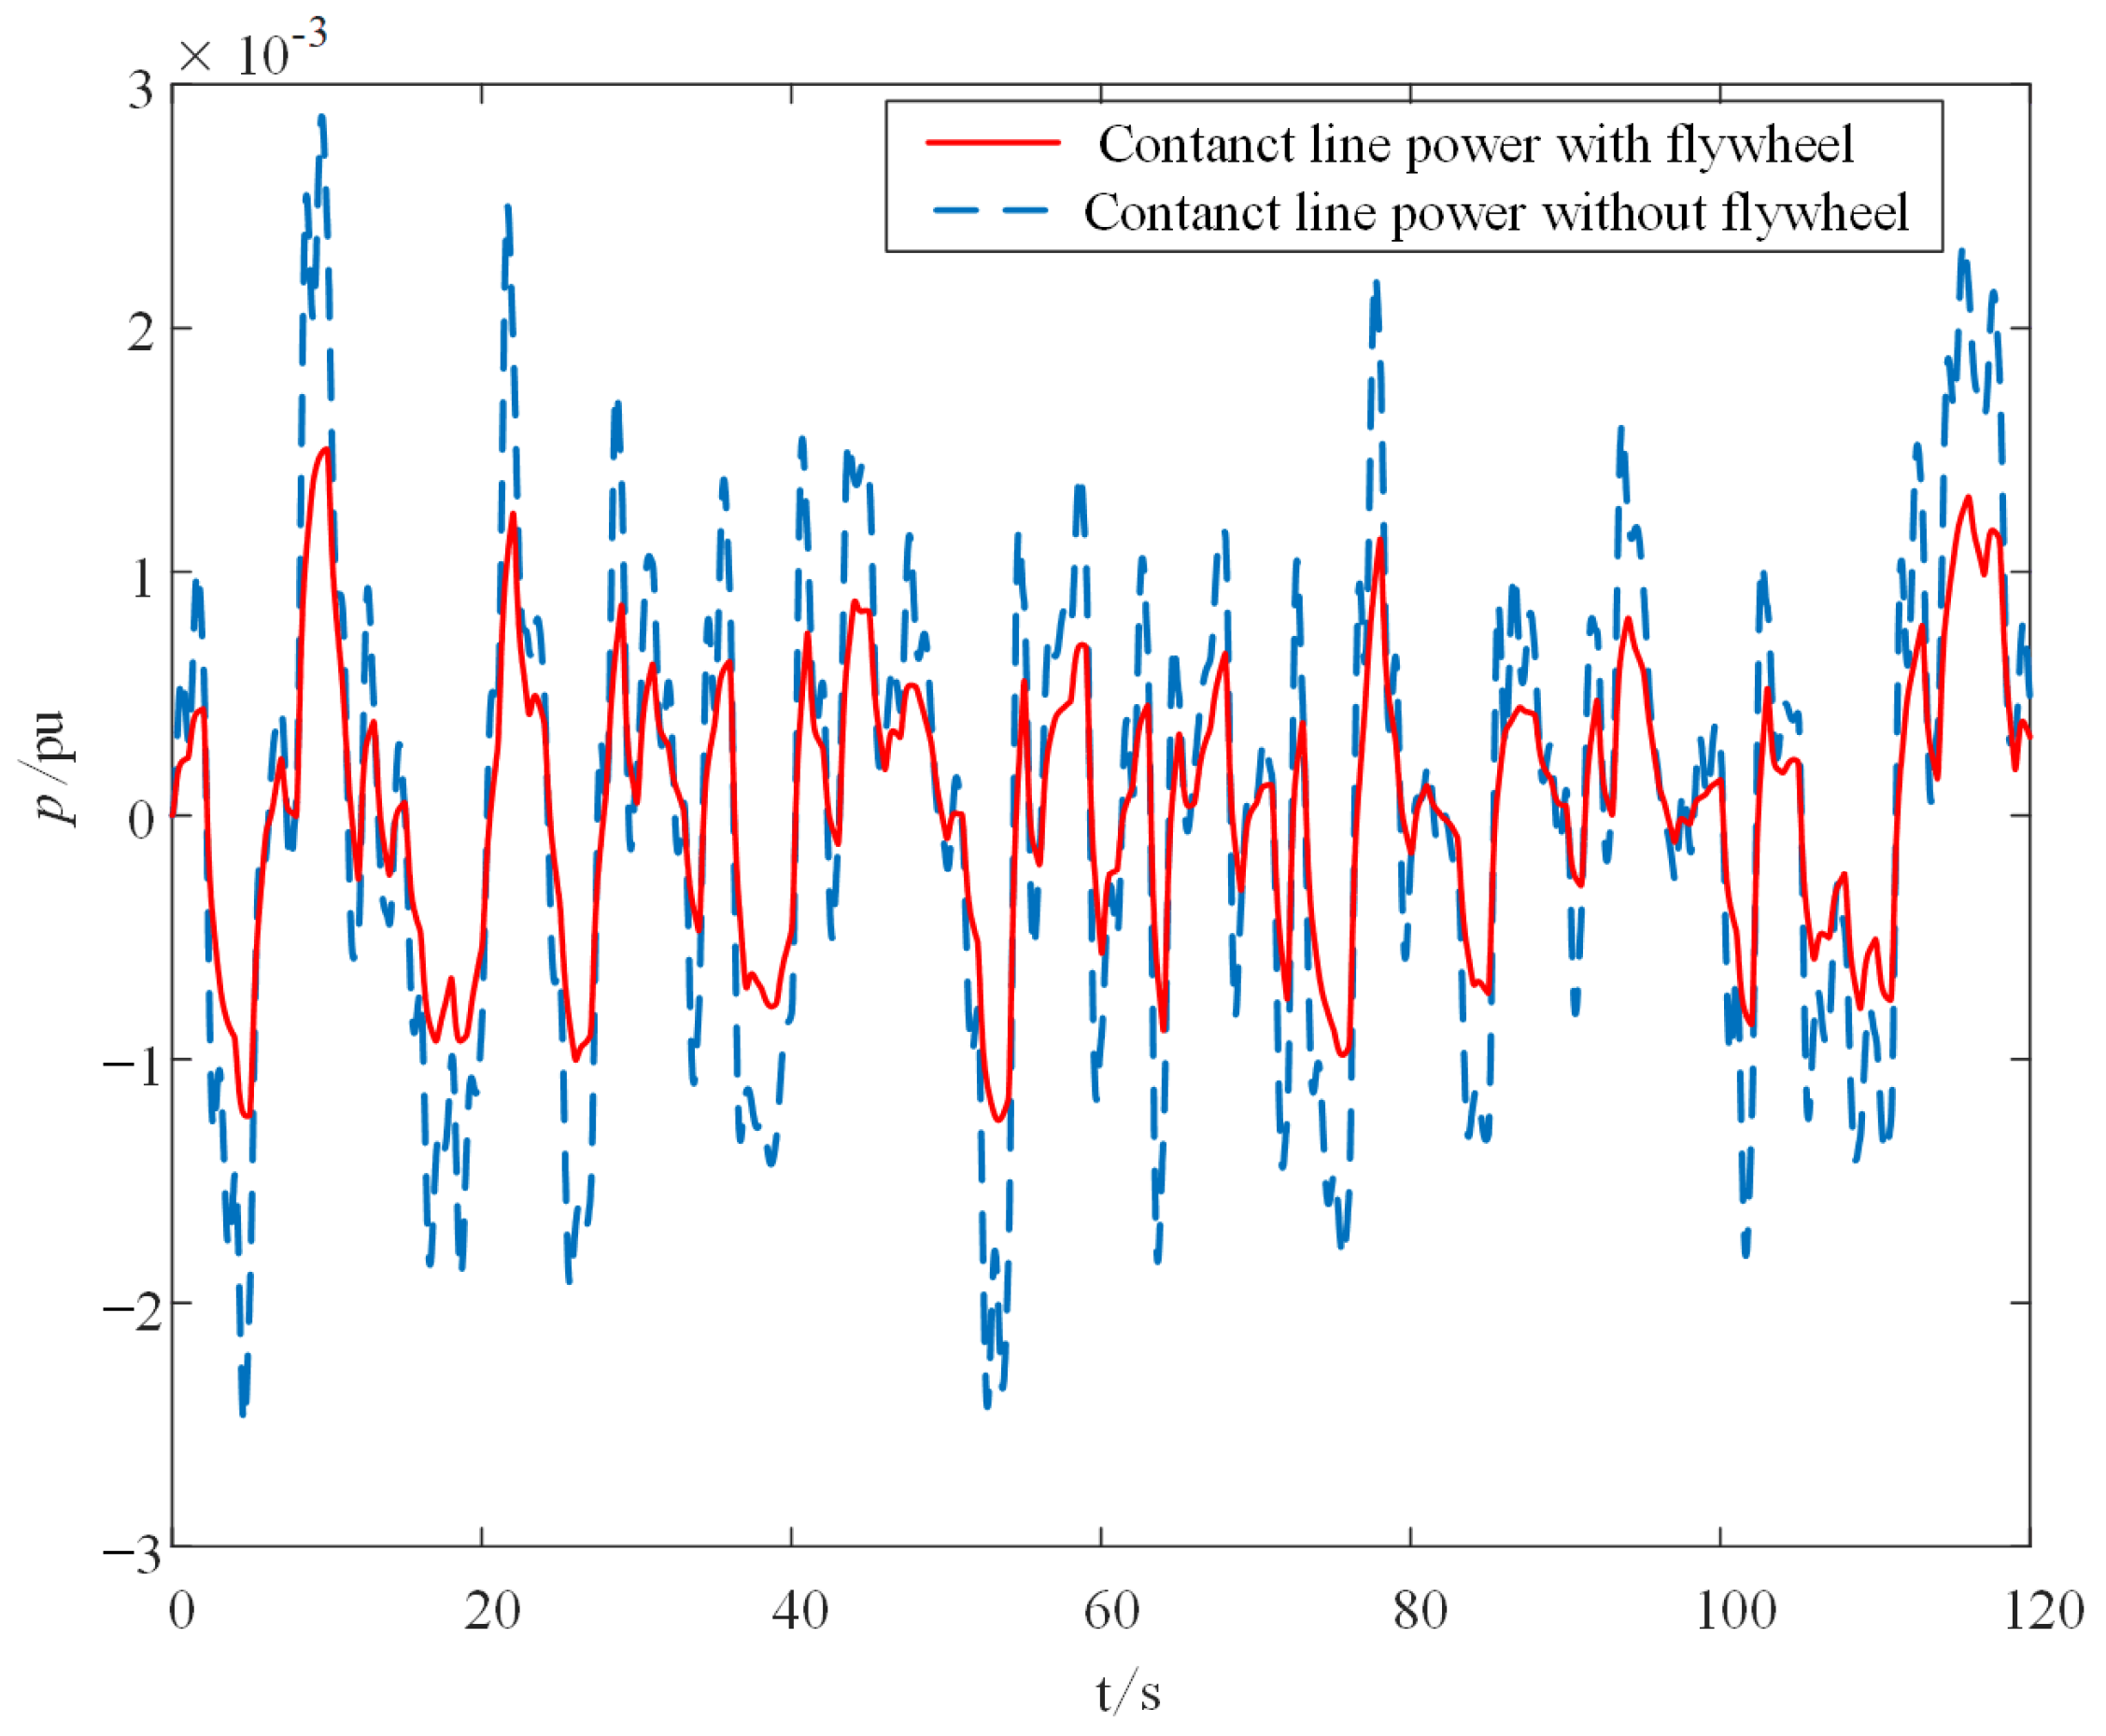
Case 3: In order to simulate the continuous disturbance of the system load, the signal superposition method is used to generate the random disturbance signal. The signal disturbance amplitude range is [−0.035, 0.045] p.u. and the one-way maximum amplitude value is 0.01 p.u. At this time, the frequency response of Area 1 and Area 2 and the change of tie line power are shown in Figure 13, Figure 14 and Figure 15.
From the frequency change data in Figure 13, Figure 14 and Figure 15, it can be seen that in the scenario of continuous load disturbance, compared with the frequency modulation without an FESS, the peak–valley difference of frequency variation in the area power system in Area 1 is reduced from 0.13 Hz to 0.06 Hz, which is reduced by 53.8%, and the standard deviation of frequency variation is reduced from 0.01957 Hz to 0.008508 Hz, which is reduced by 57.1%. The trends of change in Area 2 are the same: contact line power with a flywheel is reduced 51.5% compared with contanct line power without a flywheel. It shows that the FESS operation mode can effectively reduce frequency fluctuations.

5. Conclusions

This paper discusses the influence of adding an FESS on grid frequency in the scenario of large-scale grid-connected wind power. A linear model of FESS assisted wind power secondary frequency modulation is established in MATLAB/Simulink. The following conclusions are drawn through simulation:
(1) With the continuous improvement of wind power penetration and the gradual reduction of the proportion of synchronous generators, the problem of system frequency fluctuation will become more and more serious. The FESS can effectively improve the anti-interference ability of the grid frequency and suppress the frequency drop.
(2) When an FESS with 10% rated power of wind power is coupled to the areaal power grid to participate in the secondary frequency modulation, when the system load power has a step disturbance, the lowest point deviation of the frequency is decreased by 57.1% without frequency modulation, and the time is shortened by 5 s.
(3) When the load power of the system is continuously disturbed, the peak–valley difference of frequency deviation is reduced by 53.8% compared with that without frequency modulation, and the frequency standard deviation is reduced by 57.1%, respectively, which effectively curbs the decline of system frequency characteristics caused by wind power integration.
There is a limitation to the work presented in the article. One limitation is that the proposed model lacks experimental data comparison. Despite this limitation, it is still an important means to reduce frequency fluctuations by using the FESS. In future research work, we can continue to study the cooperation between F
ESS and other long-term energy storage means, such as compressed air energy storage, to better serve the frequency modulation of the power grid.

Author Contributions

Conceptualization, R.Q.; methodology, R.Q.; software, J.C.; validation, Z.L.; formal analysis, Z.L.; investigation, R.Q.; resources, R.Q.; data curation, W.T.; writing—original draft preparation, R.Q.; writing—review and editing, Y.L.; visualization, W.T. All authors have read and agreed to the published version of the manuscript.

Funding

This research received no external funding.

Institutional Review Board Statement

Not applicable.

Informed Consent Statement

Not applicable.

Data Availability Statement

The data used in the study are available from the corresponding author upon request.

Conflicts of Interest

The authors declare no conflict of interest.

Abbreviations

List of abbreviations used in the article (in alphabetical order).
FESSFlywheel Energy Storage System
BESSBattery energy storage system
CAESCompressed air energy storage
SMESSuperconducting Magnetic Energy Storage
AGCAutomatic Generation Control

Variables

EEnergy stored by the flywheel
IInertia moment of the flywheel rotor
MTorque
ωmax, ωminMaximum flywheel speed, Minimum flywheel speed
PFlywheel Power
isd, isqStator d-axis and q-axis currents, respectively
ω1, ωAngular velocity of stator and rotor
usd, usqd-axis and q-axis voltages of the stator
LmMutual inductance between the rotor and the stator
Te, TLElectromagnetic torque and load torque
φrrotor flux
ωgAngular frequency of network side circuit
LGrid side filter inductance value
Sd, SqPower switch state values
REquivalent circuit resistance
UdcSide voltage value
CSide inductance value
Rload, eloadLoad resistance and electromotive force
id, iqd-axis and q-axis currents
edd-axis voltage
Tgi, FHP, TRi, Tti, T12Time constant of governor, reheater gain, f coefficient, steam turbine, tie lines.
HInertia of power system
X12Equivalent impedance of the tie line
U1, U2Voltage of Area 1 and Area 2
φ1, φ2Correspond to the power angles of Area 1 and Area 2
PtieDeviation of tie line switching power

Appendix A

Table A1. Parameter selection of FESS [21].
ParameterNumerical ValueParameterNumerical Value
P (kW)250ωm (r/min)3600
U (V)380f (Hz)120
ωmin (r/min)3600np2
ωmax (r/min)11,500M (N·m)663
E (kWh)50I (kg·m2)250
Rr (Ω)0.0034Rs (Ω)0.0028
Lr (H)0.00124602Ls (H)0.00125399

Appendix B

Table A2. Initial system parameters [24].
Original ParametersArea 1Area 2
Bi (per uit)3621.5
Ri (per uit)0.030.05
Tgi (s)0.100.08
FHP (s)0.2500.375
TRi (s)108
Tti (s)0.20.3
Hi (s)5.256.00
Di (per uit)2.752.0

References

  1. Olabi, A.; Onumaegbu, C.; Wilberforce, T.; Ramadan, M.; Abdelkareem, M.A.; Alami, A.H.A. Critical review of energy storage systems. Energy 2020, 214, 118987. [Google Scholar] [CrossRef]
  2. Li, H.; Chu, J.; Sun, S. High-Performance Flywheel Hybrid Powertrain. Sustainability 2022, 14, 8076. [Google Scholar] [CrossRef]
  3. Huang, H.; Zhou, M.; Li, G. An Endogenous Approach to Quantifying the Wind Power Reserve. IEEE Trans. Power Syst. 2020, 35, 2431–2442. [Google Scholar] [CrossRef]
  4. Li, D.; Wang, L. Small-signal stability analysis of an autonomous hybrid renewable energy power generation energy storage system part i: Time-domain simulations. IEEE Trans. Energy Convers. 2008, 23, 311–320. [Google Scholar]
  5. Mahmouda, M.; Ramadanc, M.; Olabi, A.-G.; Pullen, K.; Naher, S. A review of mechanical energy storage systems combined with wind and solar applications. Energy Convers. Manag. 2020, 210, 112670. [Google Scholar] [CrossRef]
  6. Amrouche, S.O.; Rekioua, D.; Rekioua, T.; Bacha, S. Overview of energy storage in renewable energy systems. Int. J. Hydrog. Energy 2016, 41, 20914–20927. [Google Scholar] [CrossRef]
  7. Akinyele, D.O.; Rayudu, R.K. Review of energy storage technologies for sustainable power networks. Sustain. Energy Technol. Assess. 2014, 8, 74–91. [Google Scholar] [CrossRef]
  8. Kousksou, T.; Bruel, P.; Jamil, A.; El Rhafiki, T.; Zeraouli, Y. Energy storage: Applications and challenges. Sol. Energy Mater. Sol. Cells 2013, 120, 59–80. [Google Scholar] [CrossRef]
  9. Zhao, H.; Wu, Q.; Hu, S.; Xu, H.; Rasmussen, C.N. Review of energy storage system for wind power integration support. Appl. Energy 2015, 137, 545–553. [Google Scholar] [CrossRef]
  10. Diaz, P.M.; El-Khozondar, H.J. Electrical Energy Storage Technologies and the Application Potential in Power System Operation: A Mini Review. In Proceedings of the 2019 IEEE 7th Palestinian International Conference on Electrical and Computer Engineering (PICECE), Gaza, Palestine, 26–27 March 2019; pp. 1–9. [Google Scholar] [CrossRef]
  11. Delille, G.; Francois, B.; Malarange, G. Dynamic Frequency Control Support by Energy Storage to Reduce the Impact of Wind and Solar Generation on Isolated Power System’s Inertia. IEEE Trans. Sustain. Energy 2012, 3, 931–939. [Google Scholar] [CrossRef]
  12. Amiryar, M.E.; Pullen, K.R. A Review of Flywheel Energy Storage System Technologies and Their Applications. Appl. Sci. 2017, 7, 286. [Google Scholar] [CrossRef] [Green Version]
  13. Silva-Saravia, H.; Pulgar-Painemal, H.; Mauricio, J.M. Flywheel Energy Storage Model, Control and Location for Improving Stability: The Chilean Case. IEEE Trans. Power Syst. 2017, 32, 3111–3119. [Google Scholar] [CrossRef]
  14. Boopathi, D.; Jagatheesan, K.; Anand, B.; Samanta, S.; Dey, N. Frequency Regulation of Interlinked Microgrid System Using Mayfly Algorithm-Based PID Controller. Sustainability 2023, 15, 8829. [Google Scholar] [CrossRef]
  15. Qu, H.; Ye, Z. Comparison of Dynamic Response Characteristics of Typical Energy Storage Technologies for Suppressing Wind Power Fluctuation. Sustainability 2023, 15, 2437. [Google Scholar] [CrossRef]
  16. Li, X.; Palazzolo, A. A review of flywheel energy storage systems: State of the art and opportunities. J. Energy Storage 2021, 46, 103576. [Google Scholar] [CrossRef]
  17. Bai, J.; Zhang, X.; Wang, L. A Flywheel Energy Storage System with Active Magnetic Bearings. Energy Procedia 2012, 16, 1124–1128. [Google Scholar] [CrossRef] [Green Version]
  18. Liu, H.; Jiang, J. Flywheel energy storage—An upswing technology for energy sustainability. Energy Build. 2006, 39, 599–604. [Google Scholar] [CrossRef]
  19. Yıldız, A.S.; Sivrioglu, S. Superconducting levitation analysis of a flywheel system using H-formulation. Phys. C Supercond. Its Appl. 2019, 561, 64–70. [Google Scholar] [CrossRef]
  20. Yin, L.; Li, Y. Fuzzy vector reinforcement learning algorithm for generation control of power systems considering flywheel energy storage. Appl. Soft Comput. J. 2022, 125, 109149. [Google Scholar] [CrossRef]
  21. Chen, Y.L.; Wu, X.; Teng, W.; Liu, Y. Power coordinated control strategy of flywheel energy storage array for wind power smoothing. Energy Storage Sci. Technol. 2022, 11, 600–608. [Google Scholar] [CrossRef]
  22. Kundur, P. Power System Stability and Control; McGraw-Hill: New York, NY, USA, 1994. [Google Scholar]
  23. Wang, S.; Tomsovic, K. Fast Frequency Support from Wind Turbine Generators with Auxiliary Dynamic Demand Control. IEEE Trans. Power Syst. 2019, 34, 3340–3348. [Google Scholar] [CrossRef]
  24. Du, M.; Niu, Y.; Hu, B.; Zhou, G.; Luo, H.; Qi, X. Frequency regulation analysis of modern power systems using start-stop peak shaving and deep peak shaving under different wind power penetrations. Int. J. Electr. Power Energy Syst. 2021, 125, 106501. [Google Scholar] [CrossRef]
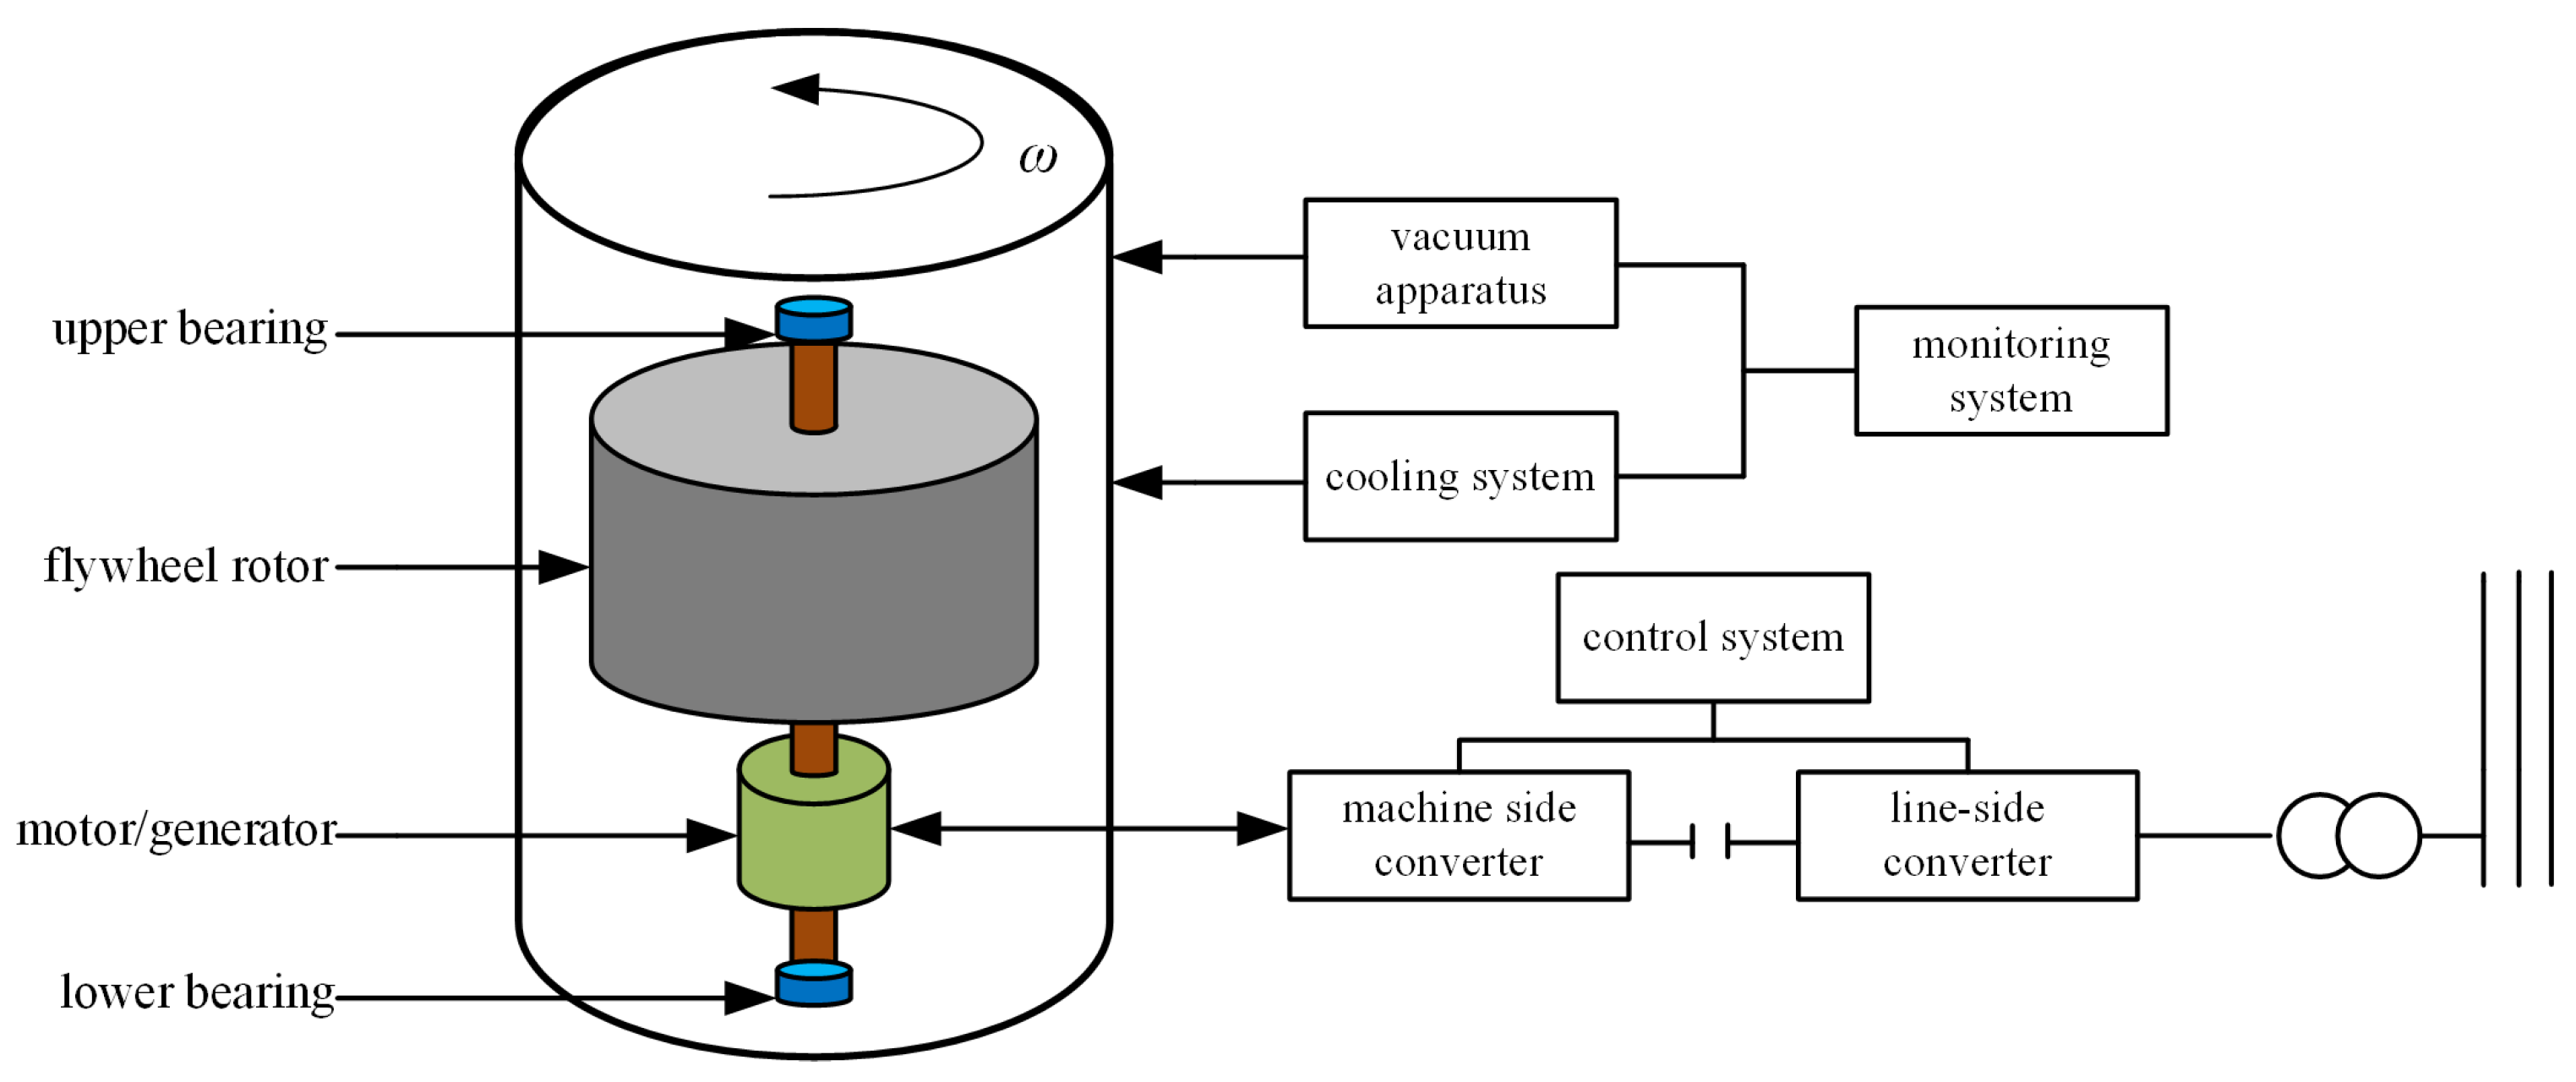
Figure 1. Basic structure of an FESS.
Sustainability 15 11832 g001
Figure 2. Control block diagram of FESS.
Sustainability 15 11832 g002
Figure 3. Step response change of FESS.
Sustainability 15 11832 g003
Figure 4. AGC command change of a unit.
Sustainability 15 11832 g004
Figure 5. AGC model of single-area system.
Sustainability 15 11832 g005
Figure 6. Frequency response model considering wind power.
Sustainability 15 11832 g006
Figure 7. Two area power grid structure diagram.
Sustainability 15 11832 g007
Figure 8. Overall structure of interconnected power system.
Sustainability 15 11832 g008
Figure 9. Area 1 frequency response by different wind power penetration rates.
Sustainability 15 11832 g009
Figure 10. Area 1 frequency response by step disturbance.
Sustainability 15 11832 g010
Figure 11. Area 2 frequency response by step disturbance.
Sustainability 15 11832 g011
Figure 12. Contact line deviation by step disturbance.
Sustainability 15 11832 g012
Figure 13. Area 1 frequency response by continuous disturbance.
Sustainability 15 11832 g013
Figure 14. Area 2 frequency response by continuous disturbance.
Sustainability 15 11832 g014
Figure 15. Contact line deviation by continuous disturbance.
Sustainability 15 11832 g015
Table 1. Frequency response data of different wind power permeability.
Wind Power Penetration (p)Lowest Frequency (Hz)Time to Reach Steady State (s)
0%49.8810
10%49.87514
20%49.86516
30%49.85520
40%49.84525
Disclaimer/Publisher’s Note: The statements, opinions and data contained in all publications are solely those of the individual author(s) and contributor(s) and not of MDPI and/or the editor(s). MDPI and/or the editor(s) disclaim responsibility for any injury to people or property resulting from any ideas, methods, instructions or products referred to in the content.