Characteristics of Land-Use Carbon Emissions and Carbon Balance Zoning in the Economic Belt on the Northern Slope of Tianshan
Abstract
1. Introduction
| Author | Countries | Period | Methods/Model | Results |
|---|---|---|---|---|
| [32] | China | 2005–2017 | Environmentally extended input–output model | Higher CEs; overall efficiency of CE improved; the reduction potential: embodied CEs < direct CEs. |
| [33] | Sichuan, China | 2000–2018 | Corrected carbon emission coefficient method | Higher CEs; CEs were correlated with GDP. |
| [34] | India | 2006–2021 | Threshold regression model | Foreign trade investment greatly affected the industrial CEs both positively and negatively. |
| [35] | China | 2000–2017 | Dynamic panel models Green Solow model | Total technological progress is helpful to reducing carbon emissions; production technology remarkably drives carbon emissions. |
| [38] | Tibetan plateau, China | 2012–2017 | Net primary productivity (NPP) remote estimation model Structural decomposition analysis model | Great potential for carbon neutrality was observed for Tibet; energy consumption was the major contributor for CEs growth. |
| [39] | China | 2003–2019 | Time-varying DID model Mediating model | National Industrial Relocation Demonstration Zones effectively reduced CEs, and its impacts are various. |
| [40] | China | 2000–2019 | Carbon emission model The decoupling analysis | Construction land is the primary and important contributor to CEs; the decoupling between land use and CEs is dynamic. CEs from land use are heterogeneous. |
| [41] | Global | 2000–2019 | Super-EBM model Tobit model | A great difference in CE efficiency among 136 different countries; the CEs efficiency of most countries are not ideal; the CE efficiency supports the EKC hypothesis; urbanization level; economy and energy improved the CEs efficiency. |
| [42] | China | 2000–2020 | Modified gravity model Social network analysis method | The comprehensive development quality level of cities on NST increased; the economic linkages existed in an obvious central orientation and geographical proximity. |
| [43] | China | 2000–2020 | Principal component analysis Unary linear regression Spatial autocorrelation analysis | The environmental quality was graded as poor for more than 40% of the region; the overall trend was toward increasing the areas with good and excellent grades; a spatial relationship between environmental quality and human disturbances is positive. |
2. Materials and Methods
2.1. Study Area
2.2. Data
2.3. Socio-Economic Statistics
2.4. Methodology
2.4.1. Land-Use Structure Evaluation
2.4.2. Carbon Emissions from Land Use
2.4.3. Carbon Emissions from Energy Consumption
2.4.4. Carbon Intensity
2.4.5. Spatial Autocorrelation Model
2.4.6. Global Spatial Autocorrelation Model
2.4.7. Local Spatial Autocorrelation Model
2.4.8. Spatial Carbon Balance Zoning
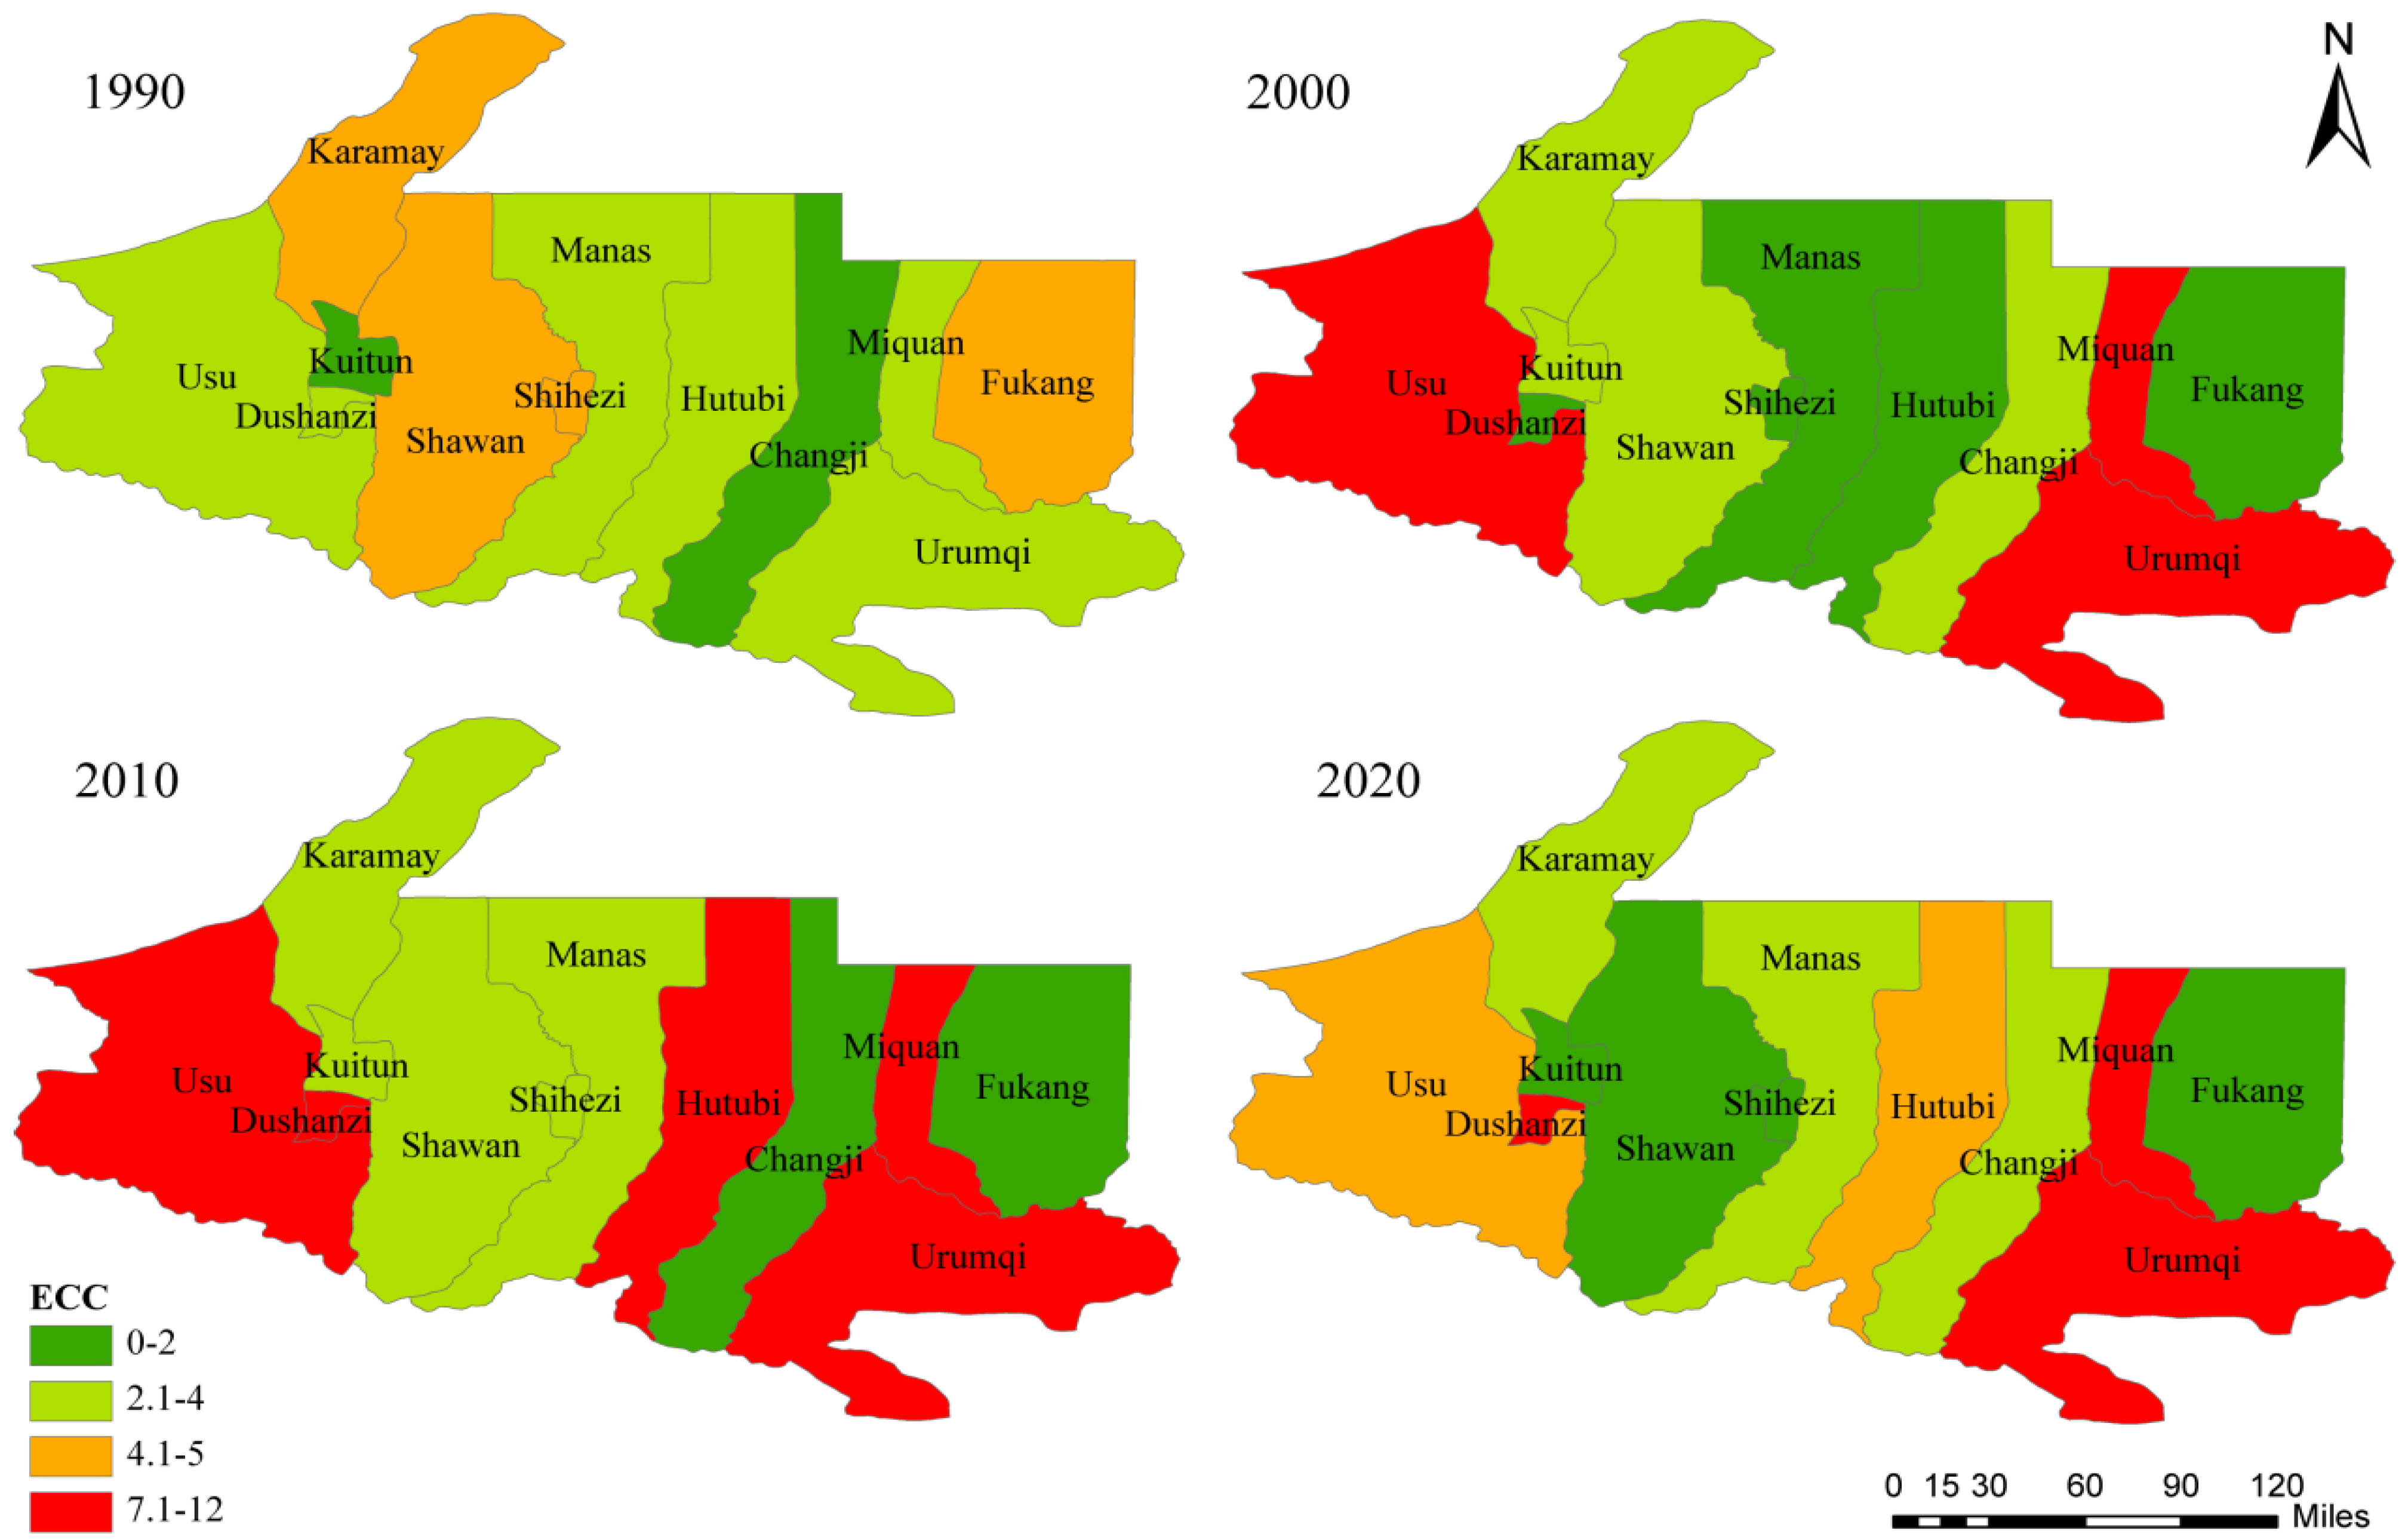
- Economic contribution coefficient
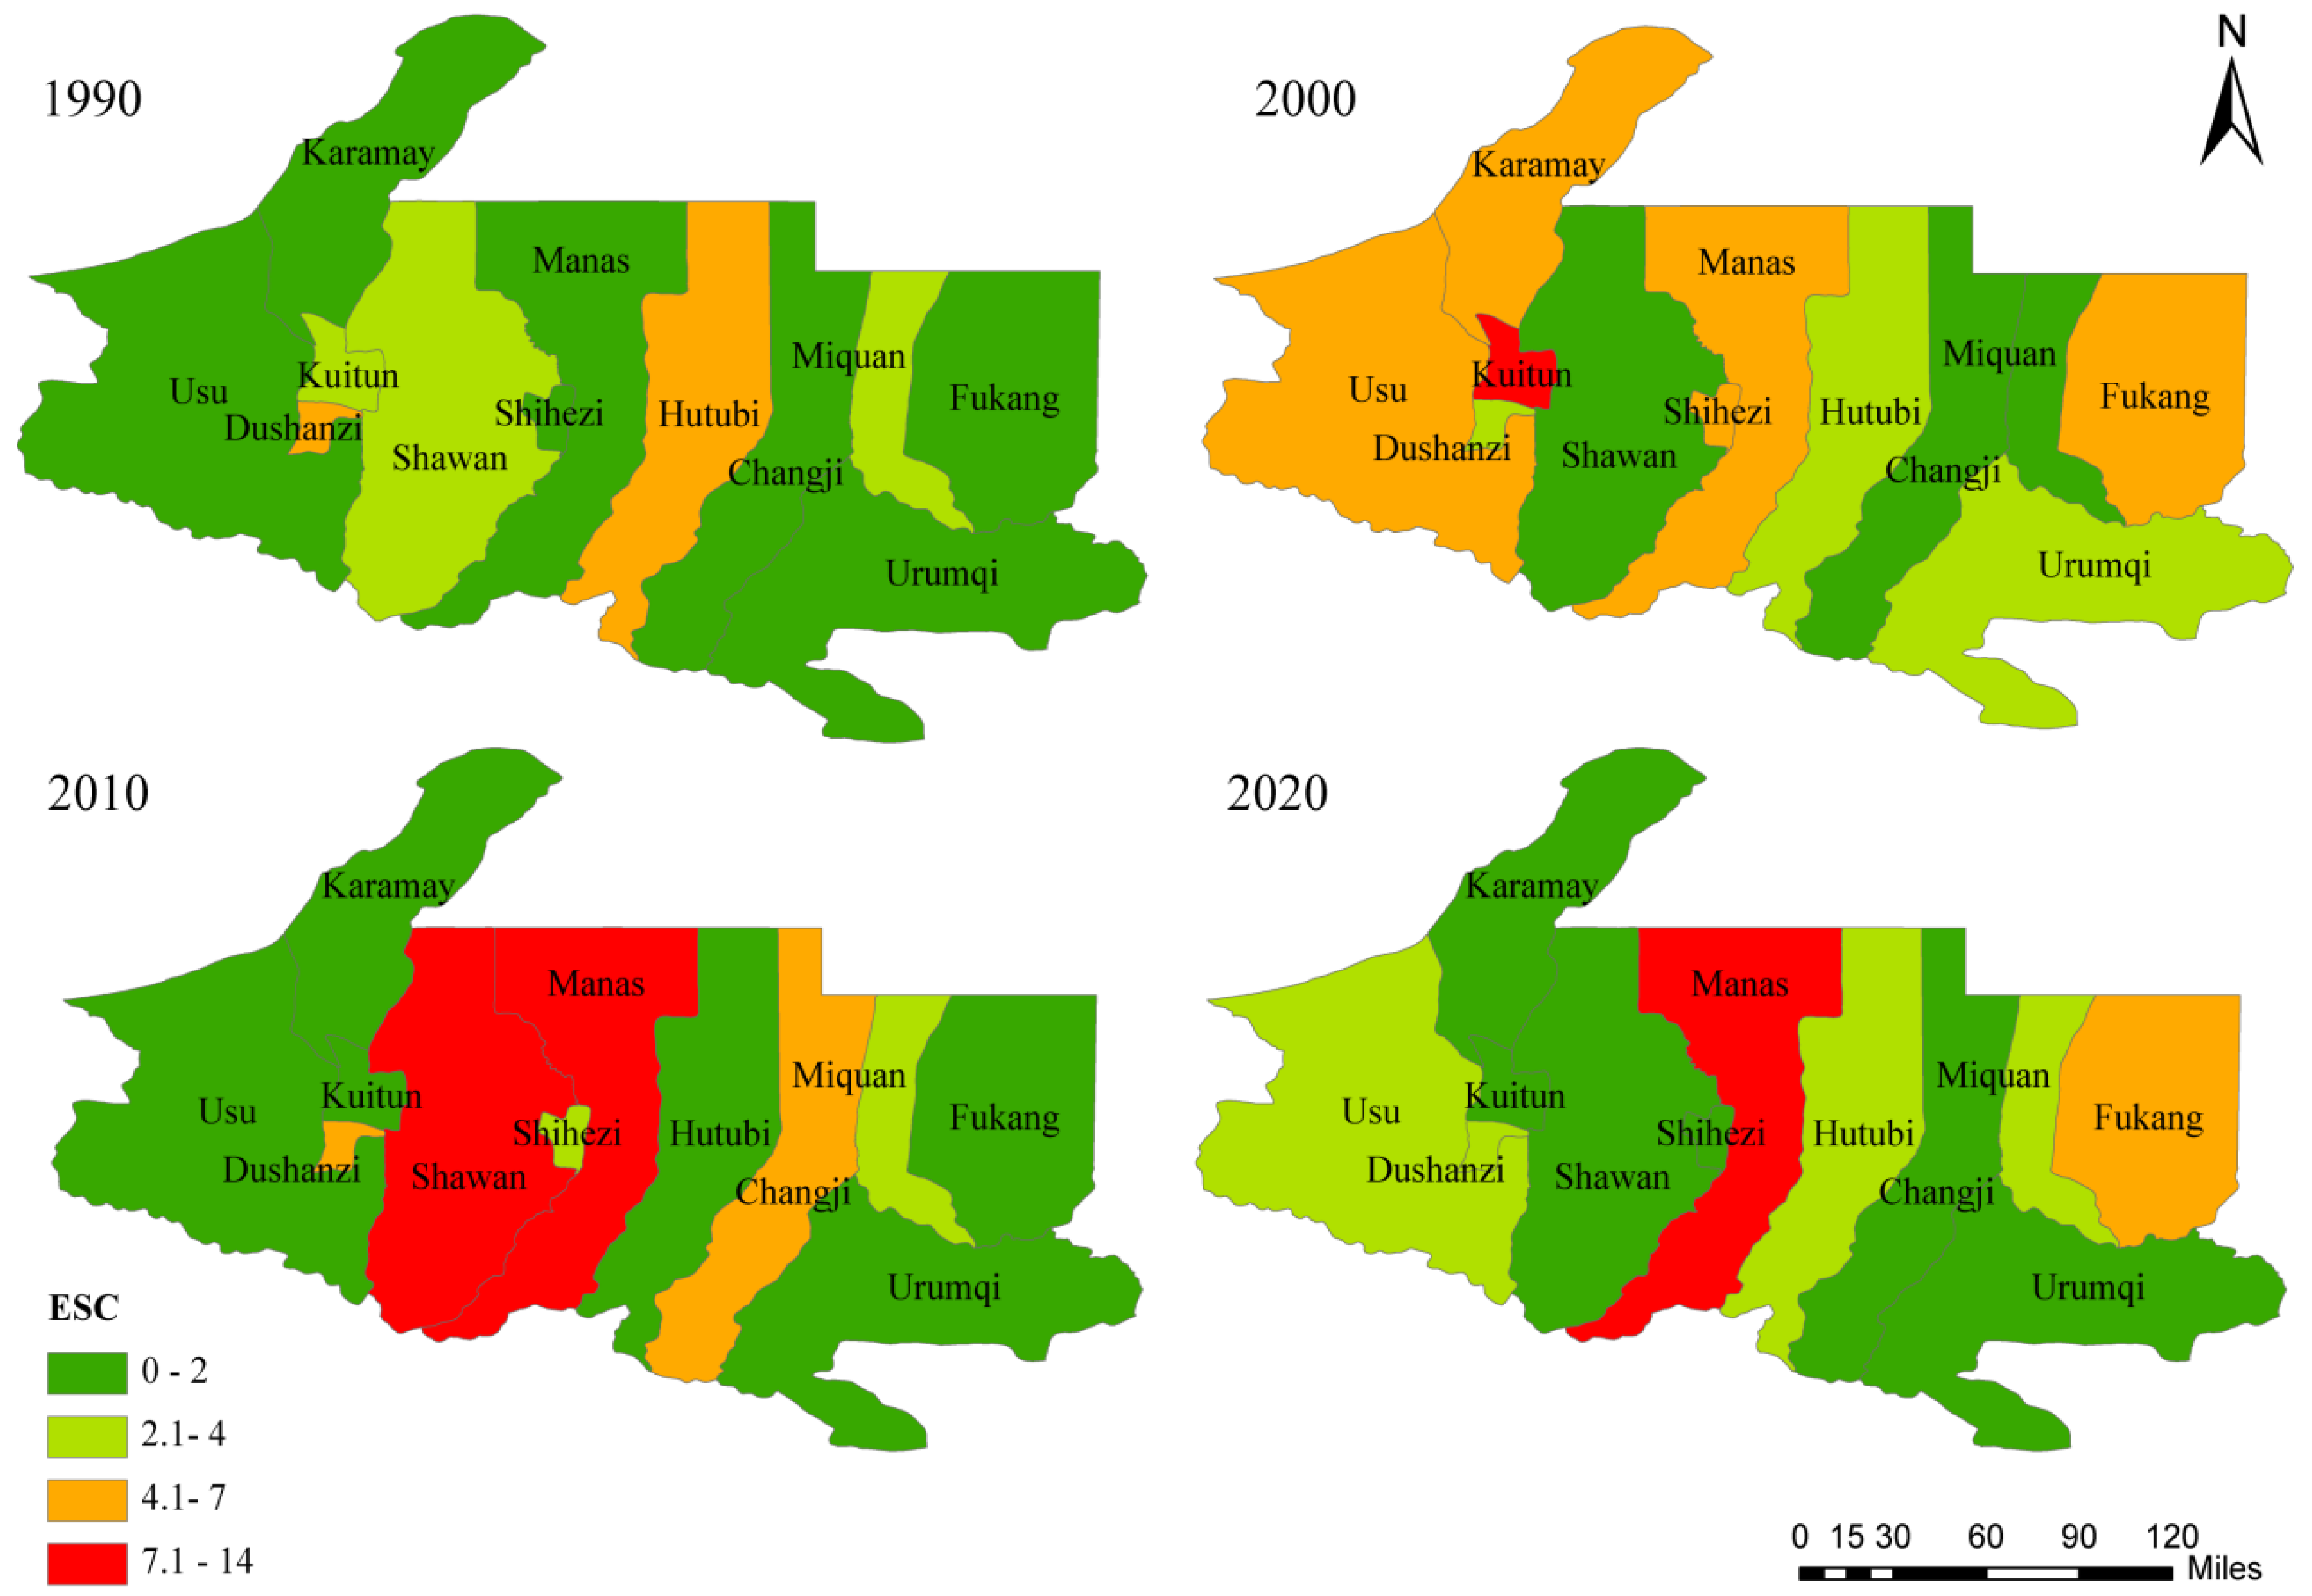
- Ecological support coefficient
3. Results
3.1. Land Use of the Economic Belt on the Northern Slope of Tianshan
3.2. Characteristics of Carbon Emissions of the Economic Belt on the Northern Slope of Tianshan
3.2.1. Temporal Characteristics
3.2.2. Spatial Characteristics
3.3. Spatial Correlation of Carbon Emissions and Carbon Intensity
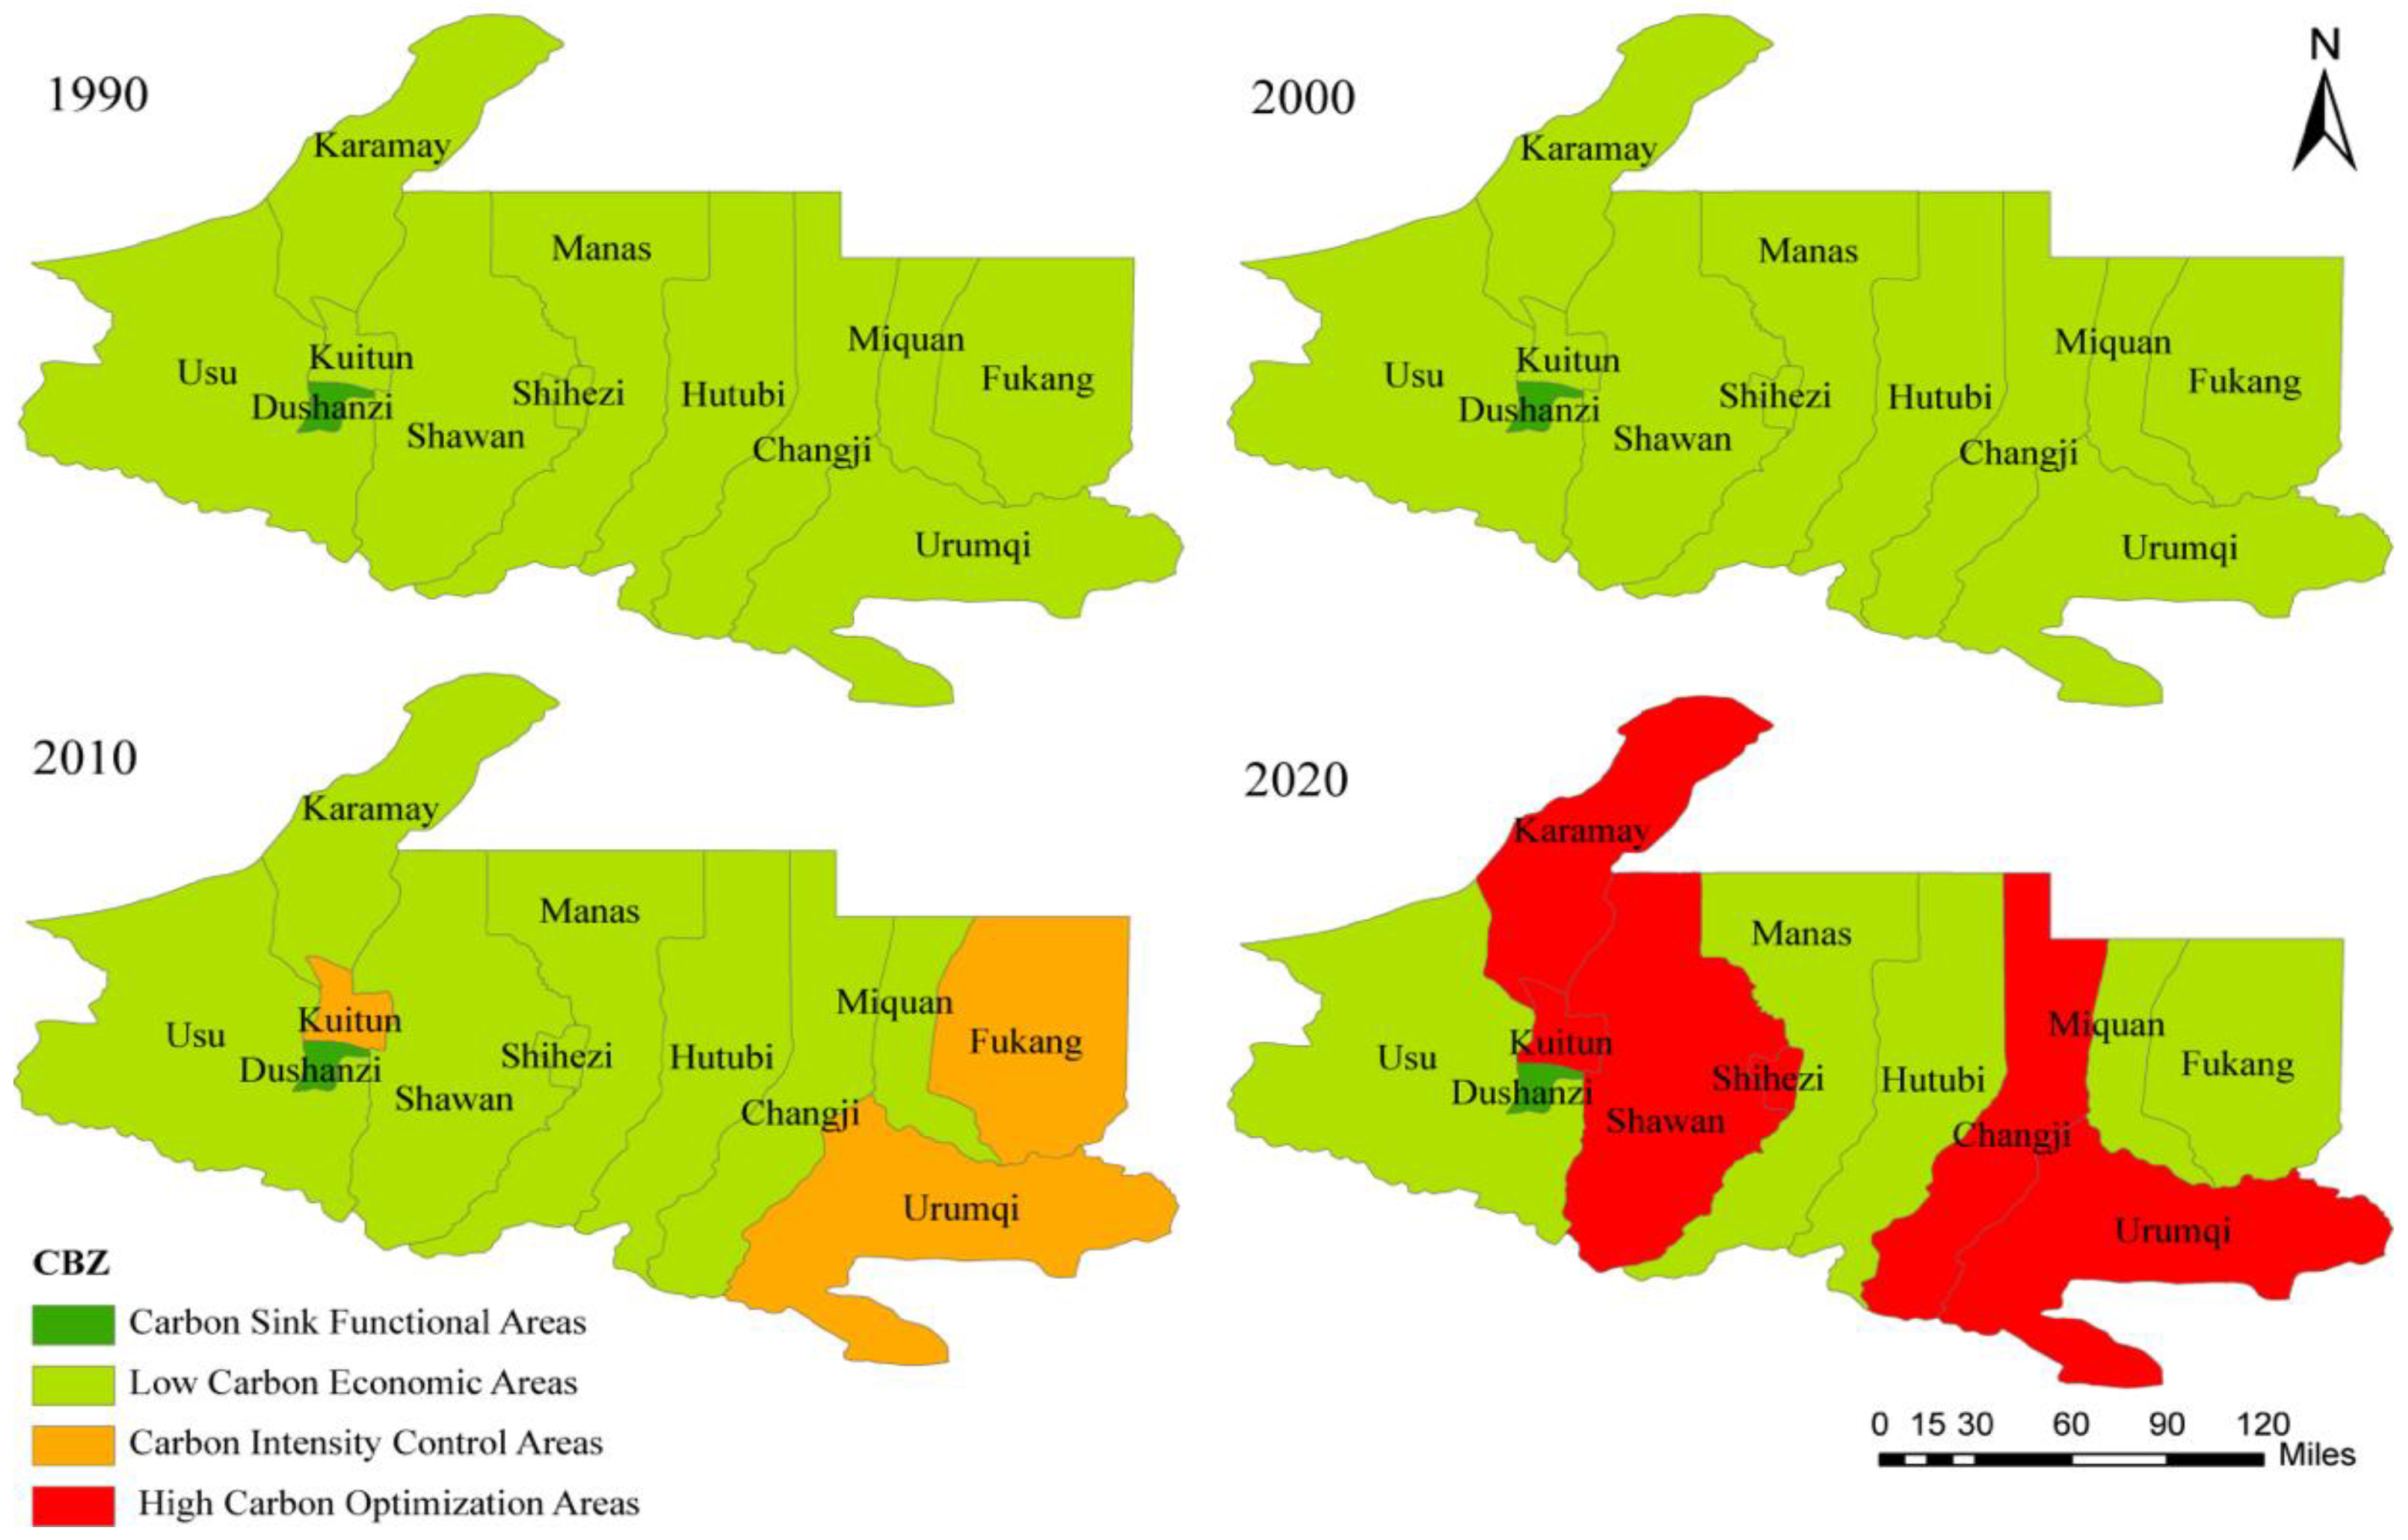
3.4. Spatial Carbon Balance Zoning Analysis
3.5. Spatial Carbon Balance Division of the Economic Belt on the Northern Slope of Tianshan
4. Interpretation and Discussion
4.1. Characteristics of Land Use, Carbon Sources, and Carbon Sinks
4.2. Characteristics of Carbon Emissions and Carbon Intensities
4.3. Spatial Auto Correlation of Carbon Emissions and Carbon Intensities
4.4. Spatial Carbon Balance Zoning and Division Analysis
4.5. Contributions of Research Findings and Improving Management
5. Limitations
6. Conclusions
- (1)
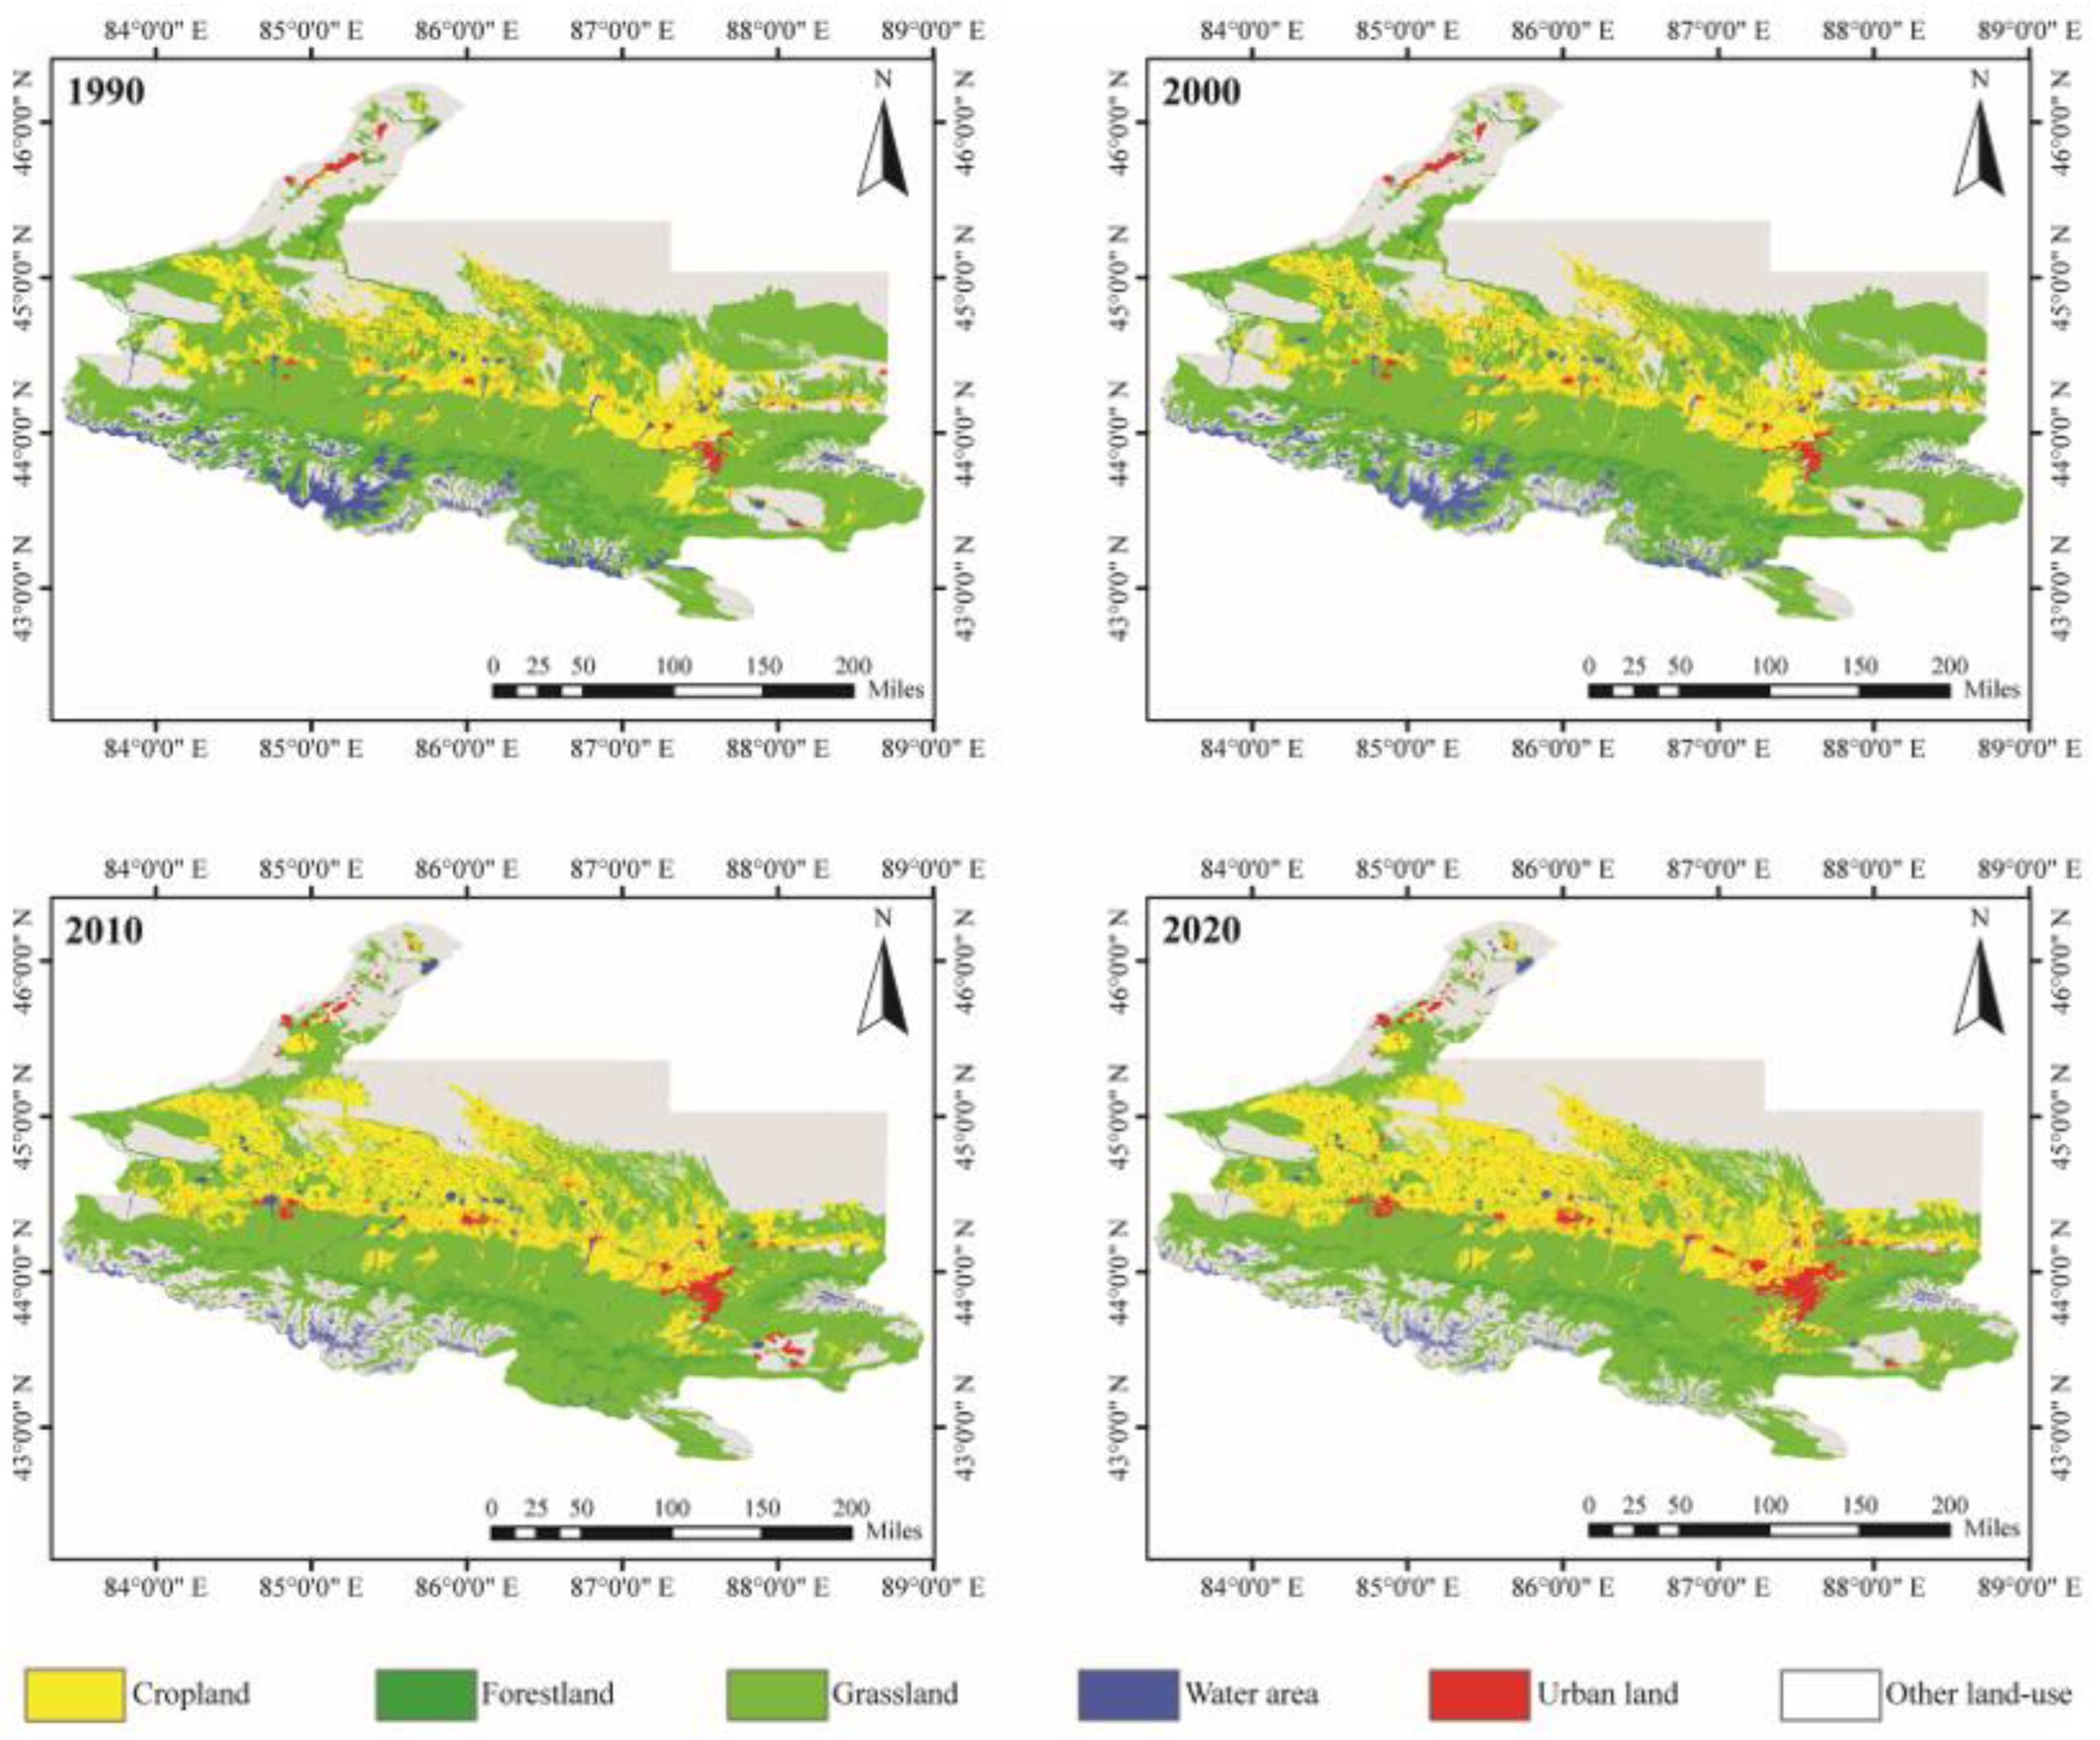
- There were significant changes in land use in the study area in 30 years, and the urbanization speed was significantly accelerated by the development of economy. Urban land and cropland were expending rapidly, while the forestland, grassland, water area, and unused land were decreased remarkably. In addition, urban land was the most dominant contributor for carbon emissions, and it was found that carbon emissions from land use increased significantly over the time period. Policies and adjustments of the land use changing, which are beneficial for carbon balance, should be considered and executed.
- (2)
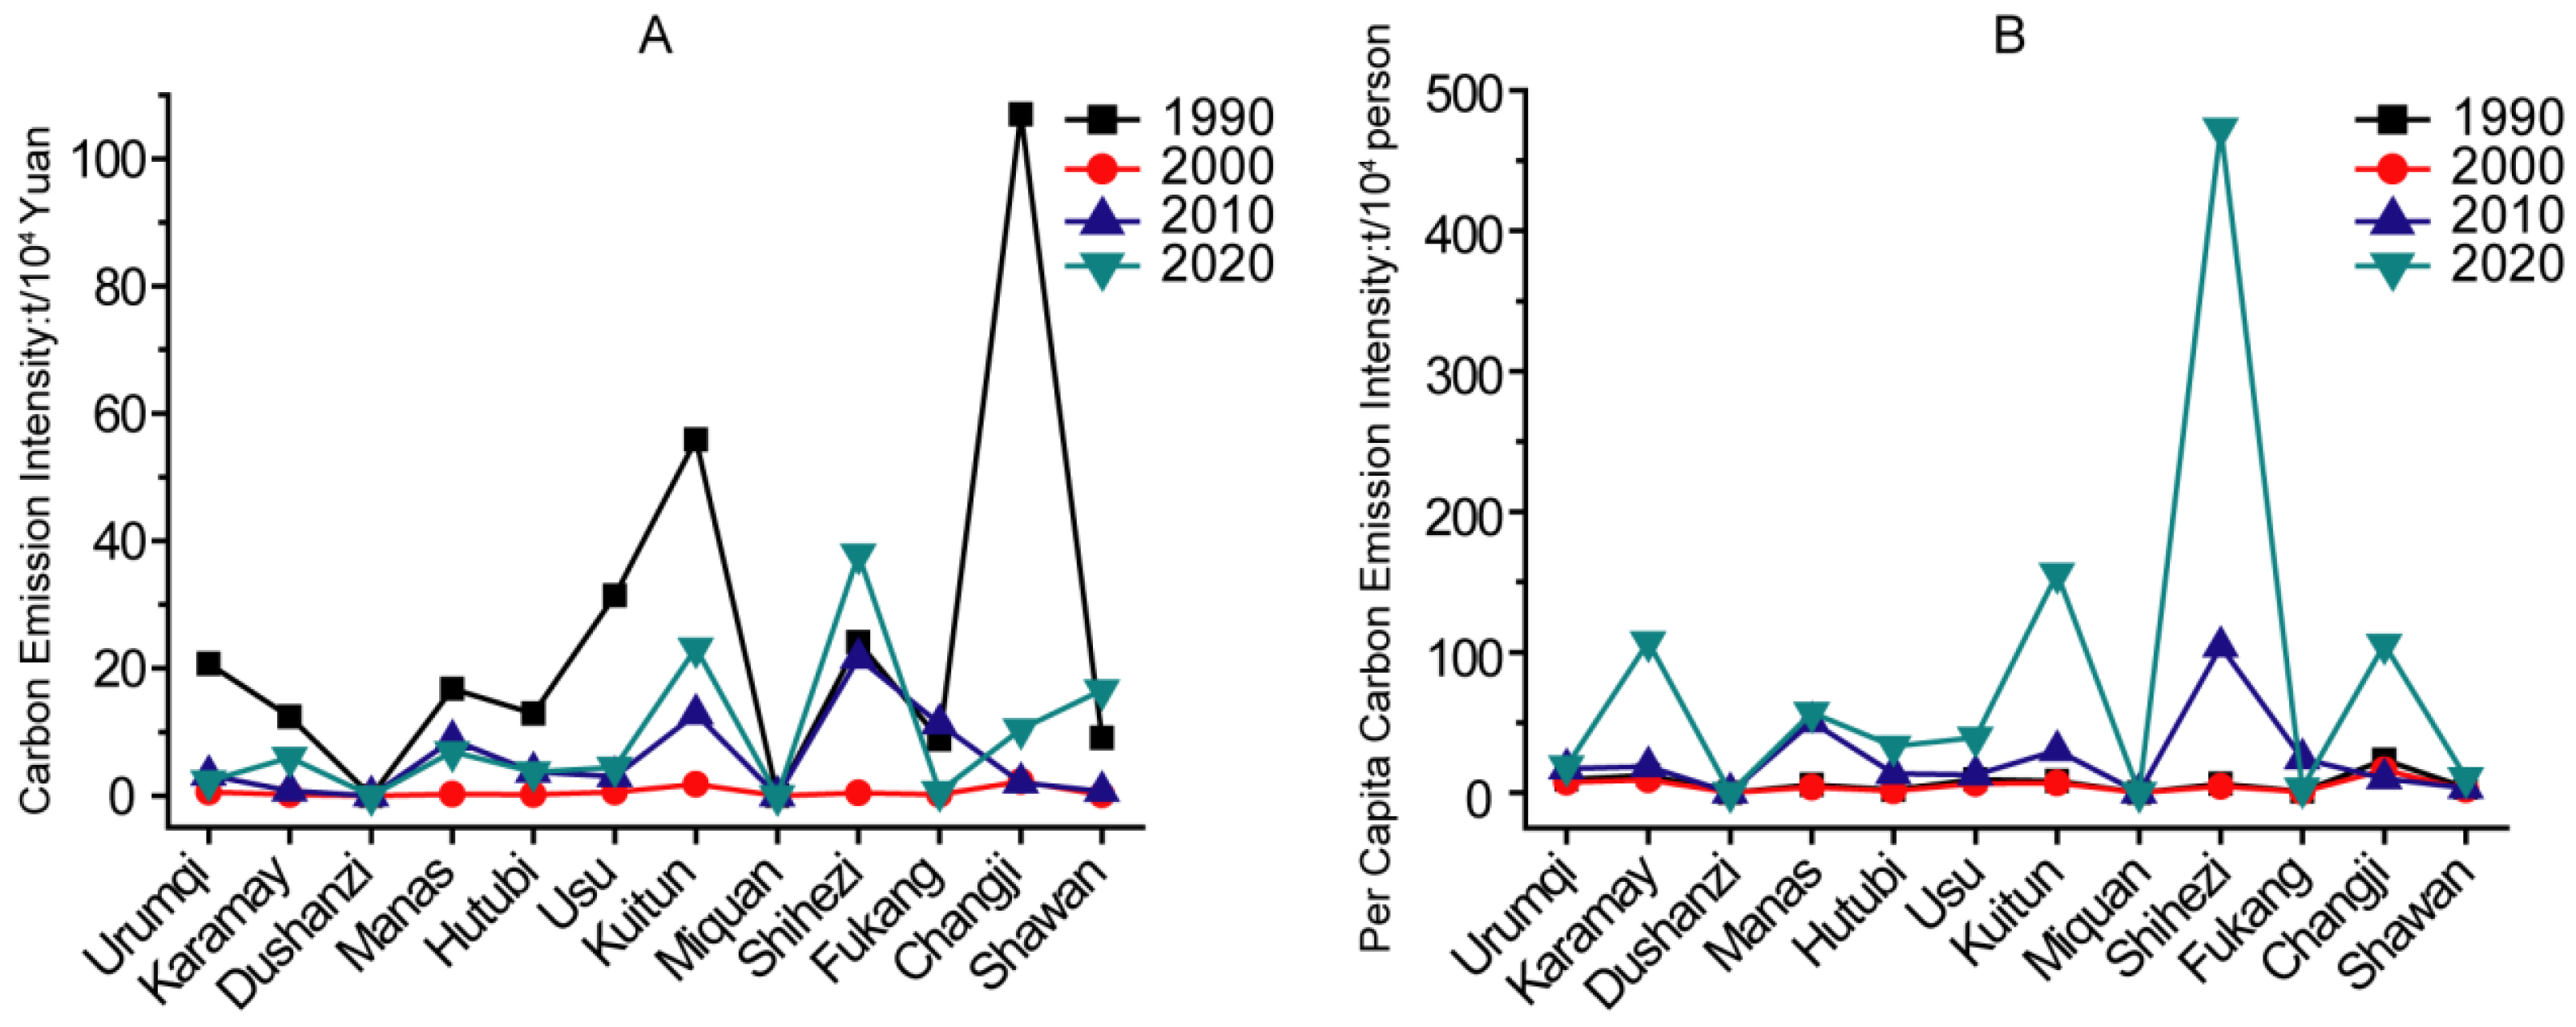
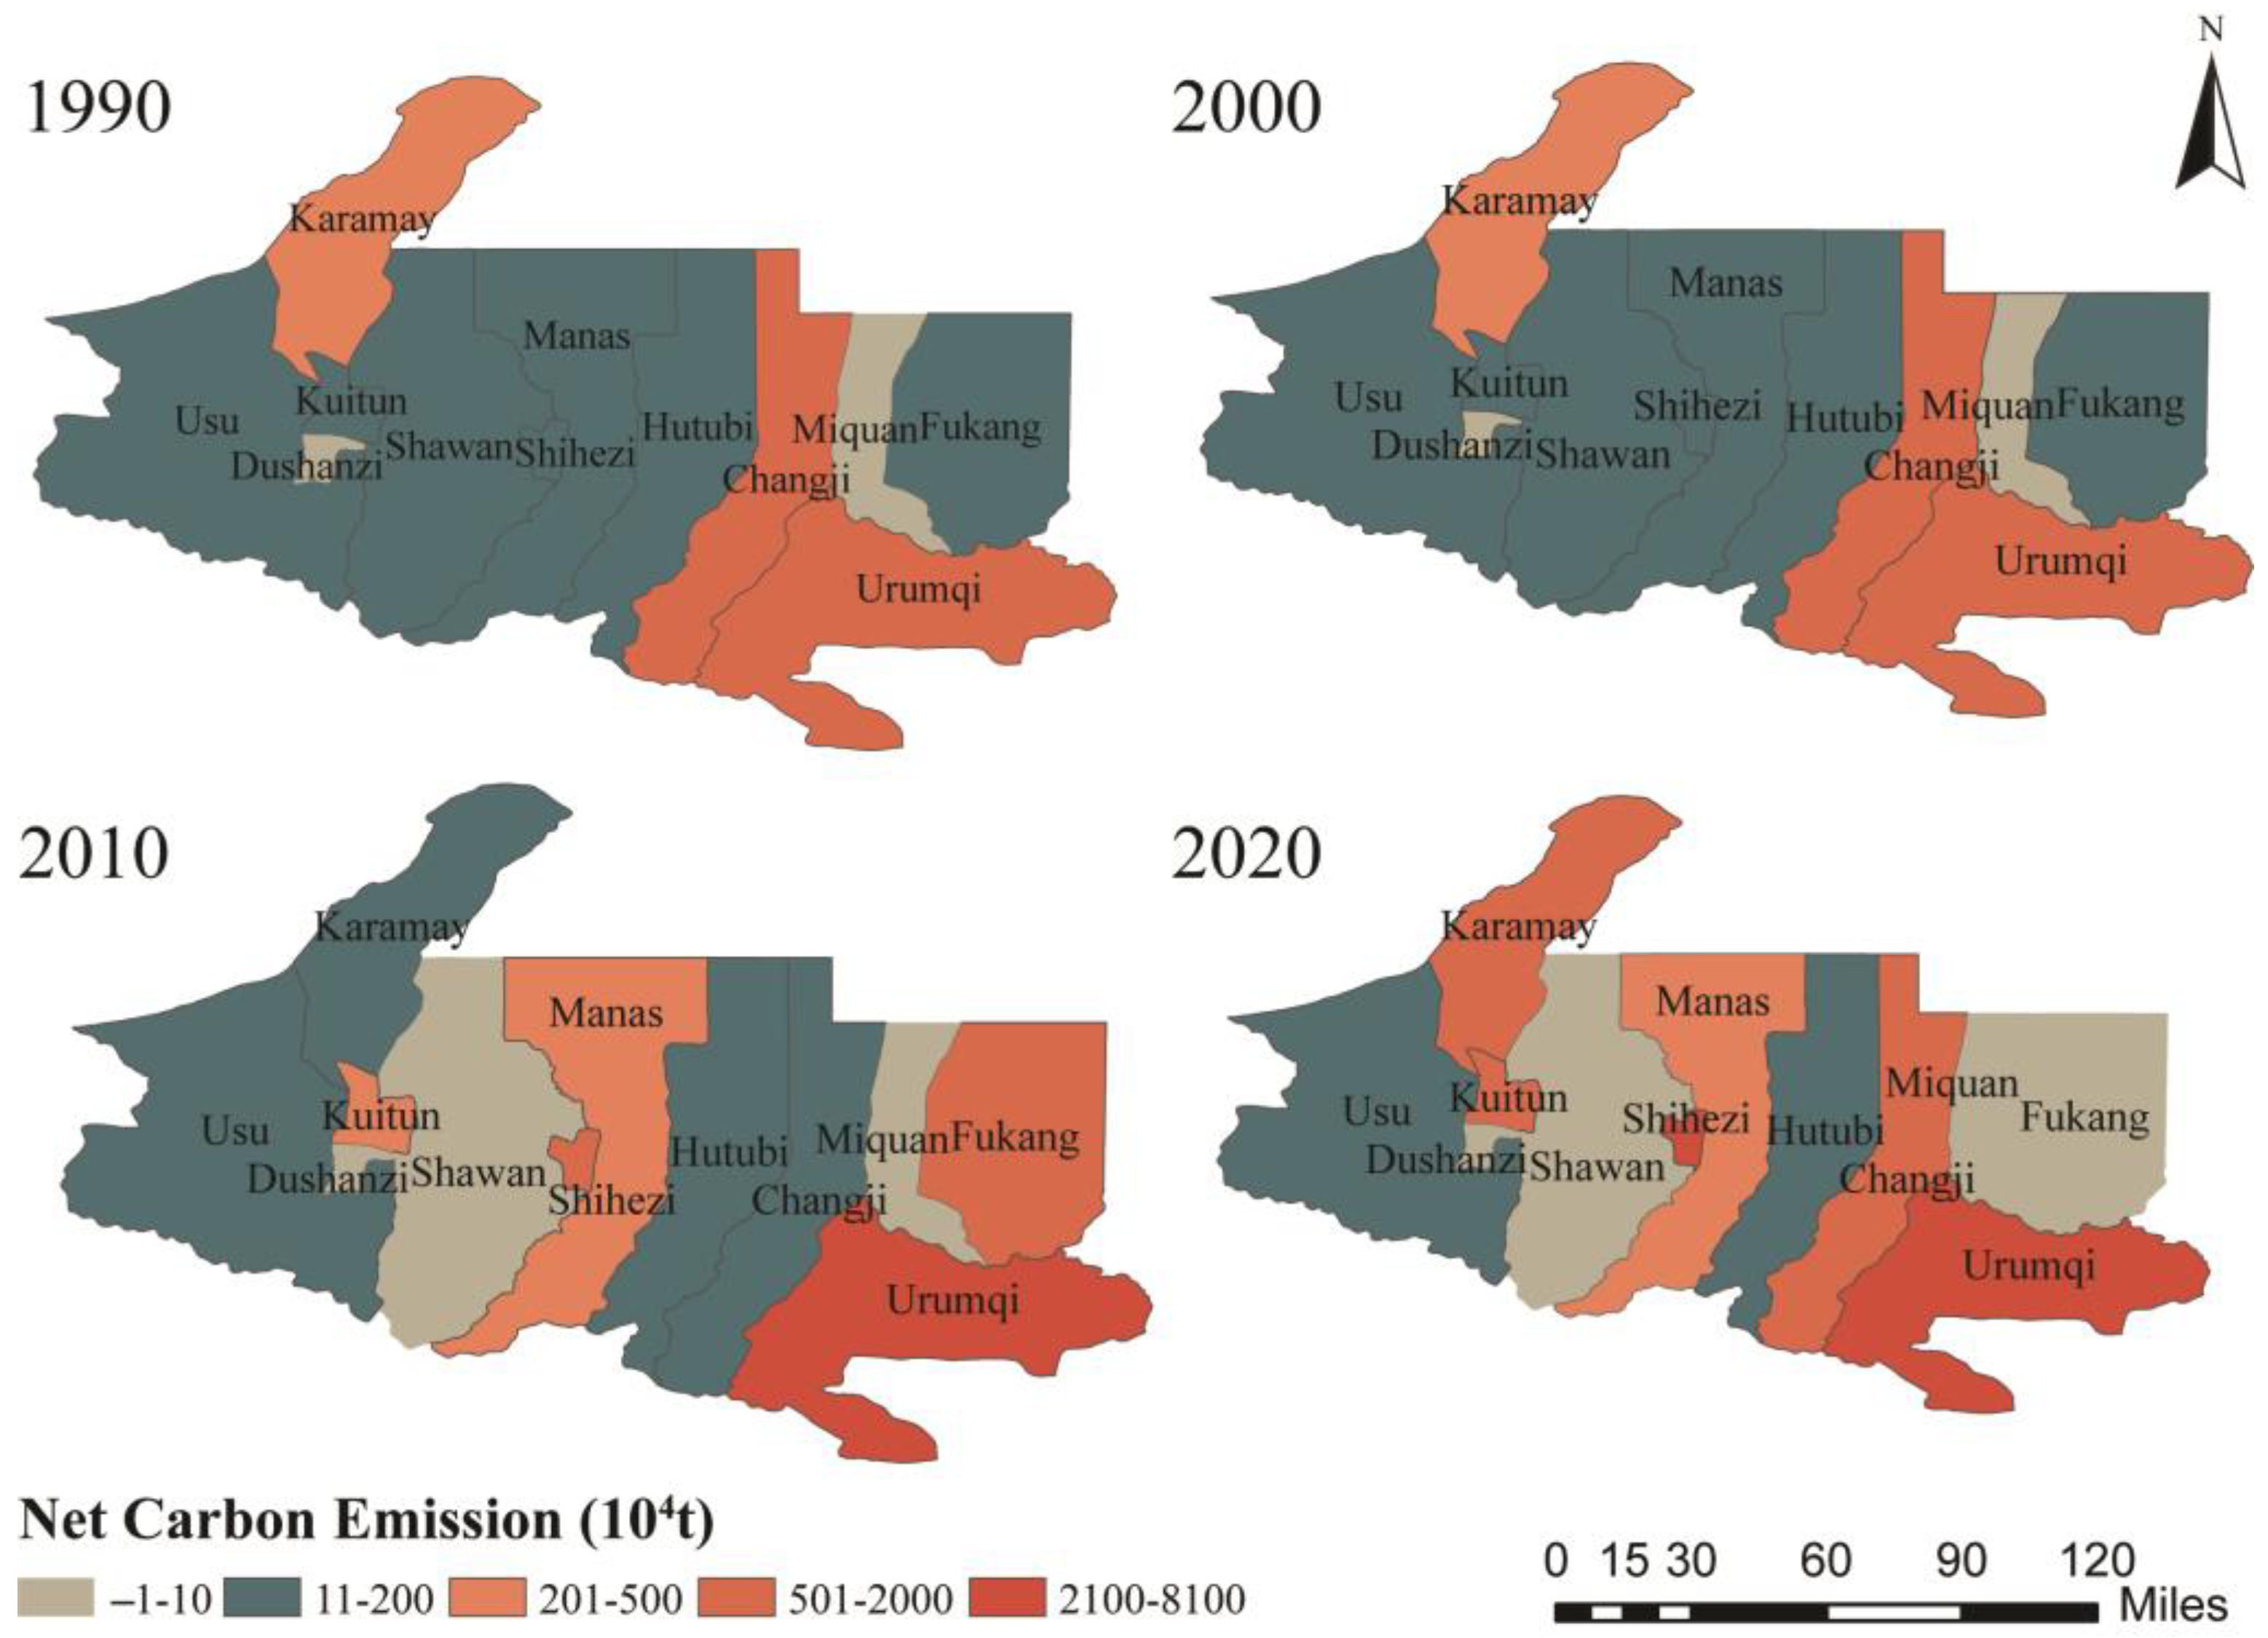
- Carbon emissions of NST were remarkably rising, and the carbon intensities were also higher. Urumqi had the highest carbon emissions during the whole study period; meanwhile, Shihezi possessed a highest speed in net carbon emission (NCE). Changji and Karamay showed a rapidly increased NCE. Thus, carbon emissions of this area should be controlled efficiently. Moreover, the industrial and urban development should be controlled and adjusted for the sustainable and environmentally friendly development.
- (3)
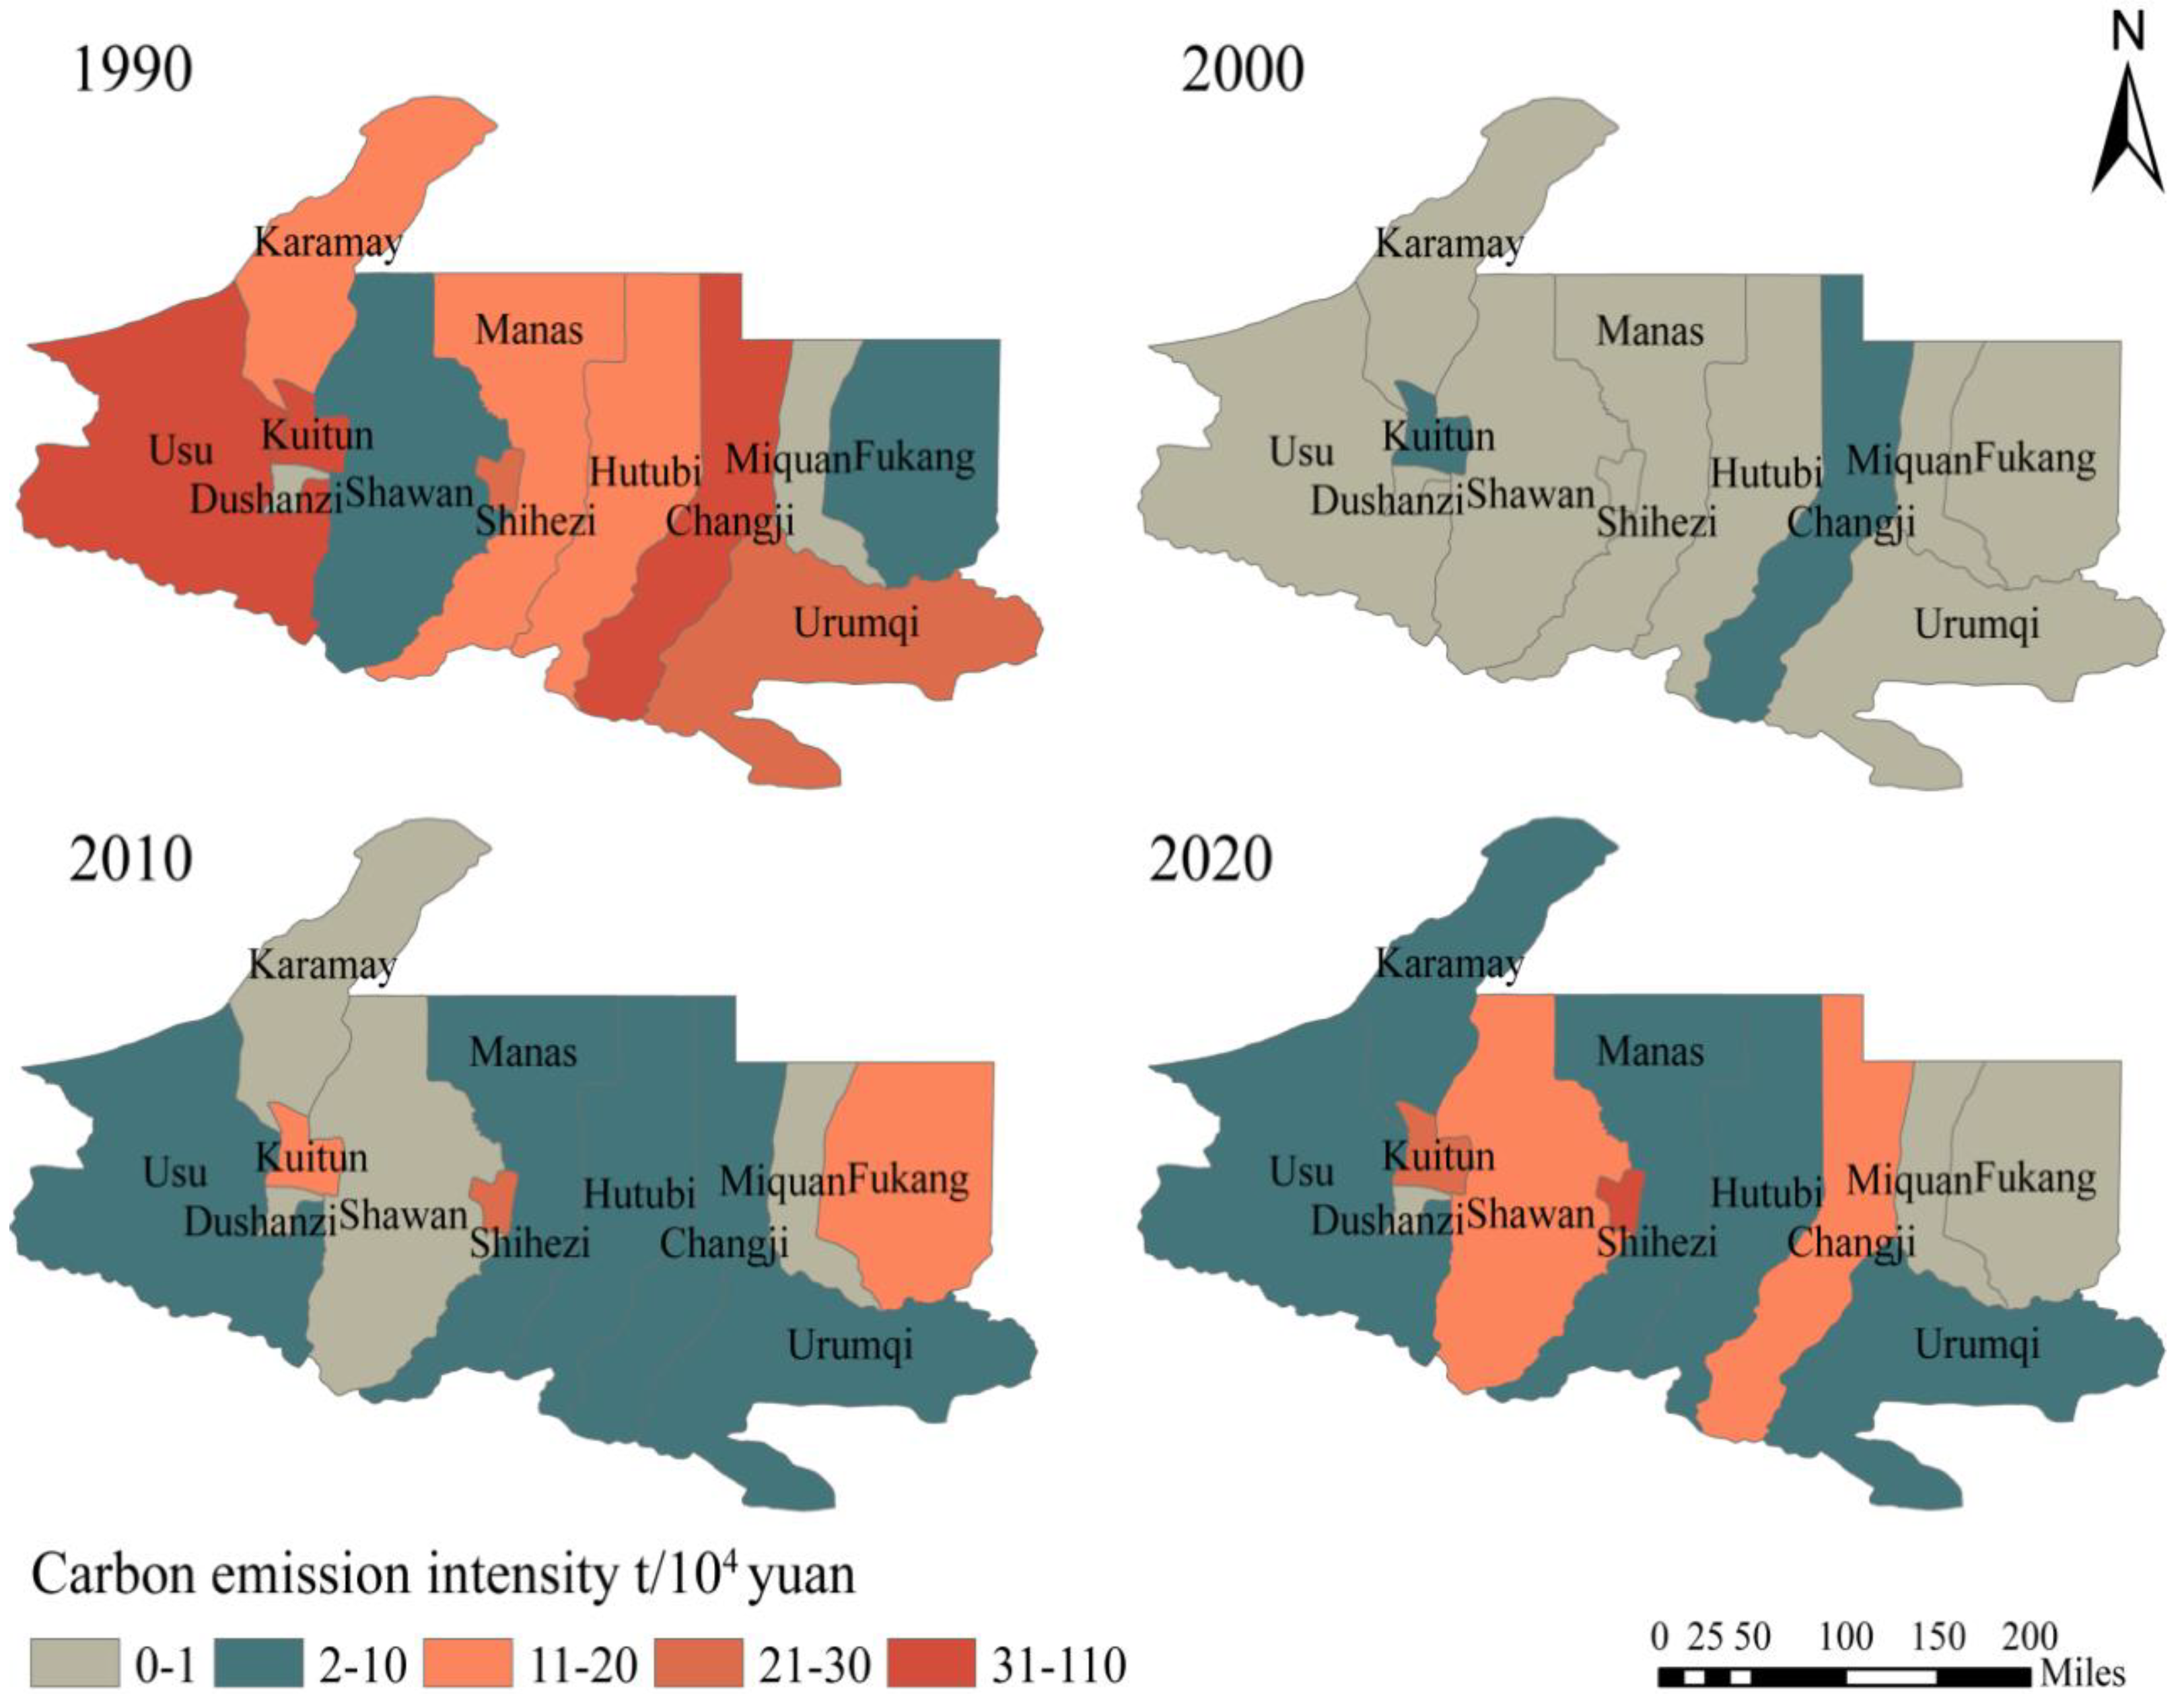
- The increasing ratio of the carbon intensities of Kuitun, Karamay, and Changji City were significantly higher than that of other cities, and these phenomena might be caused by a rapid increase in population and developments in industry. Policies should be considered for the economic development mode and other sides related to carbon intensities.
- (4)
- Based on the carbon balance zoning analysis and related indexes, NST was divided into four areas, which were carbon sink functional areas, low-carbon economic areas, carbon intensity control areas, and high-carbon optimization areas, respectively. Among the study region, the numbers of low-carbon economic areas were relatively abundant, which suggested that the amount of carbon absorptions were insufficient to eliminate the carbon emissions from energy consumption. Thus, future countermeasures should focus on the protection of the carbon sink functions of the area. However, analysis indicated that the number of high-carbon optimization areas was increasing with the timeline, and economic contributions were considerably higher than the contribution of land-use carbon emissions. Furthermore, the carbon sequestration capacity was insufficient, and total net carbon emissions were increasing. Policies related to eco-friendly and environmentally friendly development also embodied the importance of carbon sink function; and thus, future developments should consider the ecological constructions while developing the economic constructions in order to guarantee sustainable development in both economy and ecology.
Supplementary Materials
Author Contributions
Funding
Institutional Review Board Statement
Informed Consent Statement
Data Availability Statement
Acknowledgments
Conflicts of Interest
References
- Alizamir, M.; Othman Ahmed, K.; Shiri, J.; Fakheri Fard, A.; Kim, S.; Heddam, S.; Kisi, O. A New Insight for Daily Solar Radiation Prediction by Meteorological Data Using an Advanced Artificial Intelligence Algorithm: Deep Extreme Learning Machine Integrated with Variational Mode Decomposition Technique. Sustainability 2023, 15, 11275. [Google Scholar] [CrossRef]
- Yao, J.; Yuan, W.; Gao, Z.; Liu, H.; Chen, X.; Ma, Y.; Arntzen, E.; Mcfarland, D. Impact of shifts in vegetation phenology on the carbon balance of a semiarid sagebrush ecosystem. Remote Sens. 2022, 14, 5924. [Google Scholar] [CrossRef]
- Chen, S.; Chen, P.; Ding, L.; Pan, D. Assessments of the above-ocean atmospheric CO2 detection capability of the GAS instrument onboard the next-generation fengyun-3H satellite. Remote Sens. 2022, 14, 6032. [Google Scholar] [CrossRef]
- Neubauer, S.C. Comment on “Extreme Level of CO2 Accumulation into the atmosphere due to the unequal global carbon emission and sequestration” by M. F. Hossain. Water Air Soil Pollut. 2022, 233, 371. [Google Scholar] [CrossRef]
- Chien, F.; Hsu, C.-C.; Ozturk, I.; Sharif, A.; Sadiq, M. The role of renewable energy and urbanization towards greenhouse gas emission in top Asian countries: Evidence from advance panel estimations. Renew. Energy 2022, 186, 207–216. [Google Scholar] [CrossRef]
- Doś, A.; Błach, J.; Lipowicz, M.; Pattarin, F.; Flori, E. Institutional Drivers of Voluntary Carbon Reduction Target Setting—Evidence from Poland and Hungary. Sustainability 2023, 15, 11155. [Google Scholar] [CrossRef]
- Roper, E.; Wang, Y.; Zhang, Z. Numerical investigation of the application of miller cycle and low-carbon fuels to increase diesel engine efficiency and reduce emissions. Energies 2022, 15, 1783. [Google Scholar] [CrossRef]
- Paustian, K.; Ravindranath, N.H.; Amstel, A.V. 2006 IPCC Guidelines for National Greenhouse Gas Inventories; International Panel on Climate Change: Geneva, Switzerland, 2006. [Google Scholar]
- Zhang, C.-Y.; Zhao, L.; Zhang, H.; Chen, M.-N.; Fang, R.-Y.; Yao, Y.; Zhang, Q.-P.; Wang, Q. Spatial-temporal characteristics of carbon emissions from land use change in Yellow River Delta region, China. Ecol. Indic. 2022, 136, 108623. [Google Scholar] [CrossRef]
- Svoboda, J.; Štych, P.; Laštovička, J.; Paluba, D.; Kobliuk, N. Random-forest classification of land use, land-use change and forestry (LULUCF) using sentinel-2 data—A case study of Czechia. Remote Sens. 2022, 14, 1189. [Google Scholar] [CrossRef]
- Wang, Y.; Wang, M.; Teng, F.; Ji, Y. Remote Sensing Monitoring and Analysis of Spatiotemporal Changes in China’s Anthropogenic Carbon Emissions Based on XCO2 Data. Remote Sens. 2023, 15, 3207. [Google Scholar] [CrossRef]
- Zhao, R.Q.; Huang, X.J.; Xiao, W.C. Misunderstandings and Future Trends of Researches on Land Use Carbon Emissions in China. China Land Sci. 2016, 30, 83–92. [Google Scholar]
- Stryczewska, H.D.; Stępień, M.A.; Boiko, O. Plasma and Superconductivity for the Sustainable Development of Energy and the Environment. Energies 2022, 15, 4092. [Google Scholar] [CrossRef]
- Wang, Z.; Li, S.; Li, Z. A novel strategy to reduce carbon emissions of heavy oil thermal recovery: Condensation heat trans-fer performance of flue gas-assisted steam flooding. Appl. Therm. Eng. Des. Process. Equip. Econ. 2022, 205, 118076–118089. [Google Scholar] [CrossRef]
- Zhang, Z.; Wan, L.; Dong, C.; Xie, Y.; Yang, C.; Yang, J.; Li, Y. Impacts of Climate Change and Human Activities on the Surface Runoff in the Wuhua River Basin. Sustainability 2018, 10, 3405. [Google Scholar] [CrossRef]
- Chen, L.; Hang, Y.; Li, Q. Spatial-Temporal Characteristics and Influencing Factors of Carbon Emissions from Land Use and Land Cover in Black Soil Region of Northeast China Based on LMDI Simulation. Sustainability 2023, 15, 9334. [Google Scholar] [CrossRef]
- Mmonen, A.; Kopsakangas, S.M. Capturing consumers’ awareness and the intention to support carbon neutrality through energy efficient consumption. Energies 2022, 15, 4022. [Google Scholar] [CrossRef]
- Zhang, M.; Tan, J.; Huang, X.; Lai, L.; Chuai, X. A GIS-based approach for estimating land use related carbon emissions—A case study in Henan Province. In Proceedings of the 2013 21st International Conference on Geoinformatics, Kaifeng, China, 20–22 June 2013. [Google Scholar]
- Guo, F.; Zhang, Y.; Chang, C.; Yu, Y. Carbon emissions of assembly buildings constrained by flexible resource: A study on cost optimization. Buildings 2023, 13, 90. [Google Scholar] [CrossRef]
- Liu, M.; Chen, Y.; Chen, K.; Chen, Y. Progress and Hotspots of Research on Land-Use Carbon Emissions: A Global Perspective. Sustainability 2023, 15, 7245. [Google Scholar] [CrossRef]
- Cui, Y.; Li, L.; Chen, L.; Zhang, Y.; Cheng, L.; Zhou, X.; Yang, X. Land-use carbon emissions estimation for the yangtze river delta urban agglomeration using 1994–2016 landsat image data. Remote Sens. 2018, 10, 1334. [Google Scholar] [CrossRef]
- Xia, C.; Li, Y.; Xu, T.; Chen, Q.; Ye, Y.; Shi, Z.; Liu, J.; Ding, Q.; Li, X. Analyzing spatial patterns of urban carbon metabolism and its response to change of urban size: A case of the Yangtze River Delta, China. Ecol. Indic. 2019, 104, 615–625. [Google Scholar] [CrossRef]
- Liu, H.; Yan, F.; Tian, H. Towards low-carbon cities: Patch-based multi-objective optimization of land use allocation using an improved non-dominated sorting genetic algorithm-II. Ecol. Indic. 2022, 134, 108455. [Google Scholar] [CrossRef]
- Guo, X.; Wang, X.; Wu, X.; Chen, X.; Li, Y. Carbon emission efficiency and low-carbon optimization in Shanxi province under “Dual Carbon” Background. Energies 2022, 15, 2369. [Google Scholar] [CrossRef]
- Izhar, T.; Xuan, L.P. The estimation of greenhouse gas emission in leachate treatment plant and its carbon credit revenue. IOP Conf. Ser. Earth Environ. Sci. 2021, 646, 012067. [Google Scholar] [CrossRef]
- Chanu, T.N.; Nag, S.K.; Koushlesh, S.K.; Devi, M.S.; Das, B.K. Greenhouse gas emission from inland open water bodies and their estimation process—An emerging issue in the era of climate change. Agric. Sci. 2022, 13, 290–306. [Google Scholar] [CrossRef]
- Wang, Q.; Huang, J.; Zhou, H.; Sun, J.; Yao, M. Carbon emission inversion model from provincial to municipal scale based on nighttime light remote sensing and improved STIRPAT. Sustainability 2022, 14, 6813. [Google Scholar] [CrossRef]
- Yang, X.; Shang, G.; Deng, X. Estimation, decomposition and reduction potential calculation of carbon emissions from urban construction land: Evidence from 30 provinces in China during 2000–2018. Environ. Dev. Sustain. 2021, 24, 7958–7975. [Google Scholar] [CrossRef]
- Zhang, M.; Lai, L.; Huang, X.J.; Chuai, X.W.; Tan, J.Z. The carbon emission intensity of land use conversion in different regions of China. Resour. Sci. 2013, 35, 792–799. [Google Scholar]
- Ali, G.; Nitivattananon, V. Exercising multidisciplinary approach to assess interrelationship between energy use, carbon emission and land use change in a metropolitan city of Pakistan. Renew. Sustain. Energy Rev. 2012, 16, 775–786. [Google Scholar] [CrossRef]
- Zhang, L.; Wang, P. Analysis on the change characteristics of the correlation between land use structure and energy consumption and carbon emissions in Kunming from 1997 to 2017. J. Geosci. Environ. Prot. 2021, 9, 155–166. [Google Scholar] [CrossRef]
- Cai, C.; Fan, M.; Yao, J.; Zhou, L.; Wang, Y.; Liang, X.; Liu, Z.; Chen, S. Spatial-temporal characteristics of carbon emissions corrected by socio-economic driving factors under land use changes in Sichuan Province, southwestern China. Ecol. Inform. 2023, 77, 102164. [Google Scholar] [CrossRef]
- Derindag, O.F.; Maydybura, A.; Kalra, A.; Wong, W.K.; Chang, B.H. Carbon emissions and the rising effect of trade openness and foreign direct investment: Evidence from a threshold regression model. Heliyon 2023, 9, e17448. [Google Scholar] [CrossRef]
- Chen, C.; Luo, Y.; Zou, H.; Huang, J. Understanding the driving factors and finding the pathway to mitigating carbon emissions in China’s Yangtze River Delta region. Energy 2023, 278, 127897. [Google Scholar] [CrossRef]
- Wo, R.; Fang, D.; Song, D.; Chen, B. Analysis of embodied carbon emissions and carbon sequestration in Tibetan Plateau-Case study of Tibet and Qinghai. Appl. Energy 2023, 347, 121449. [Google Scholar] [CrossRef]
- Hung, L.Q.; Asaeda, T.; Thao, V.T.P. Carbon emissions in the field of land use, land use change, and forestry in the Vietnam mainland. Wetl. Ecol. Manag. 2021, 29, 315–329. [Google Scholar] [CrossRef]
- Gao, P.; Yue, S.J.; Chen, H.T. Carbon emission efficiency of China’s industry sectors: From the perspective of embodied carbon emissions. J. Clean. Prod. 2020, 283, 124655. [Google Scholar] [CrossRef]
- Wang, K.L.; Xu, R.Y.; Jiang, W.; Liu, Y. Impact of National Industrial Relocation Demonstration Zones (NIRDZs) policy on urban carbon emissions in China. Environ. Impact Assess. Rev. 2023, 102, 107165. [Google Scholar] [CrossRef]
- Wang, Q.; Yang, C.H.; Wang, M.L.; Zhao, L.; Zhao, Y.C.; Zhang, Q.P.; Zhang, C.Y. Decoupling analysis to assess the impact of land use patterns on carbon emissions: A case study in the Yellow River Delta efficient eco-economic zone, China. J. Clean. Prod. 2023, 412, 137415. [Google Scholar] [CrossRef]
- Xiao, P.; Xu, J.; Yu, Z.; Qian, P.; Lu, M.; Ma, C. Spatiotemporal pattern differentiation and influencing factors of cultivated land use efficiency in hubei province under carbon emission constraints. Sustainability 2022, 14, 7042. [Google Scholar] [CrossRef]
- Yang, Z.; Zhang, S.; Lei, J.; Zhang, X.; Tong, Y.; Duan, Z.; Fan, L. Evolution of economic linkage network of the cities and counties on the northern slope of the Tianshan Mountains, China. Reg. Sustain. 2023, 4, 173–184. [Google Scholar] [CrossRef]
- Yu, T.; Abulizi, A.; Xu, Z.; Jiang, J.; Akbar, A.; Ou, B.; Xu, F. Evolution of environmental quality and its response to human disturbances of the urban agglomeration in the northern slope of the Tianshan Mountains. Ecol. Indic. 2023, 153, 110481. [Google Scholar] [CrossRef]
- Wang, S.; Tan, S.; Xu, J. Evaluation and Implication of the Policies towards China’s Carbon Neutrality. Sustainability 2023, 15, 6762. [Google Scholar] [CrossRef]
- Zhao, M.; Cheng, W.M.; Huang, K.; Wang, N.; Liu, Q. Research on land cover change in Beijing-Tianjin-Hebei region during the last 10 years based on different geomorphic units. J. Nat. Resour. 2016, 31, 252–264. [Google Scholar]
- Chen, X.; Luo, G.; Xia, J.; Zhou, K.; Lou, S.; Ye, M. Ecological response to the climate change on the northern slope of the Tianshan Mountains in Xinjiang. Sci. China Ser. D Earth Sci. 2005, 48, 765–777. [Google Scholar] [CrossRef]
- Zhi, X.; Anfuding, G.; Yang, G.; Gong, P.; Wang, C.; Li, Y.; Li, X.; Li, P.; Liu, C.; Qiao, C.; et al. Evaluation of the water resource carrying capacity on the North Slope of the Tianshan Mountains, Northwest China. Sustainability 2022, 14, 1905. [Google Scholar] [CrossRef]
- Ma, H.; Sun, J. The influence of LUCC on water demand in the north slope of Tianshan Mountain. IOP Conf. Ser. Earth Environ. Sci. 2020, 560, 012079. [Google Scholar] [CrossRef]
- Li, B.; Chong, J.; Liu, H.; Hong, R.; Zhang, S.-H.; Zhang, X.-S. Study on the spatio-temporal changes of ecosystem service value in the northern slope of Tianshan Mountains. Int. Geosci. Remote Sens. Symp. 2009, 2, 335–338. [Google Scholar]
- Duan, F.; An, C.; Wang, W.; Herzschuh, U.; Zhang, M.; Zhang, H.; Liu, Y.; Zhao, Y.; Li, G. Dating of a late Quaternary loess section from the northern slope of the Tianshan Mountains (Xinjiang, China) and its paleoenvironmental significance. Quat. Int. 2020, 544, 104–112. [Google Scholar] [CrossRef]
- Zhuang, Q.; Shao, Z.; Li, D.; Huang, X.; Cai, B.; Altan, O.; Wu, S. Unequal weakening of urbanization and soil salinization on vegetation production capacity. Geoderma 2022, 411, 115712–115720. [Google Scholar] [CrossRef]
- Song, Y.; Luo, D.; Du, J.; Kang, S.; Cheng, P.; Fu, C.; Guo, X. Radiometric dating of late Quaternary loess in the northern piedmont of South Tianshan Mountains: Implications for reliable dating. Geol. J. 2018, 53, 417–426. [Google Scholar] [CrossRef]
- Fan, Z.H. Analysis on the coupling degree of water source ecological environment based on 3S technology. Int. J. Environ. Technol. Manag. 2022, 25, 324–336. [Google Scholar] [CrossRef]
- Luo, G.; Feng, Y.; Zhang, B.; Cheng, W. Sustainable land-use patterns for arid lands: A case study in the northern slope areas of the Tianshan Mountains. J. Geogr. Sci. 2010, 20, 510–524. [Google Scholar] [CrossRef]
- Qing, Y.; Zhao, B.; Wen, C. The coupling and coordination of agricultural carbon emissions efficiency and economic growth in the Yellow River Basin, China. Sustainability 2023, 15, 971. [Google Scholar] [CrossRef]
- Chen, H.; Wang, B.; Wang, W.; Wang, S. Using nighttime light data to achieve precise estimation of residents’ living carbon emissions and landscape pattern characteristics. In Proceedings of the 2022 International Conference on Green Building, Civil Engineering and Smart City, Guilin, China, 8–10 April 2022; pp. 65–77. [Google Scholar]
- Houghton, R.A.; Van der Werf, G.R.; DeFries, R.S.; Hansen, M.C.; House, J.I.; Le Quéré, C.; Pongratz, J.; Ramankutty, N. Carbon emissions from land use and land-cover change. Biogeosci. Discuss. 2012, 9, 835–878. [Google Scholar] [CrossRef]
- Bai, X.; Chen, J.; Shi, P. Landscape urbanization and economic growth in China: Positive feedbacks and sustainability dilemmas. Environ. Sci. Technol. 2012, 46, 132–139. [Google Scholar] [CrossRef] [PubMed]
- Lai, L.; Huang, X.; Yang, H.; Chuai, X.; Zhang, M.; Zhong, T.; Chen, Z.; Chen, Y.; Wang, X.; Thompson, J.R. Carbon emissions from land-use change and management in China between 1990 and 2010. Sci. Adv. 2016, 2, e1601063. [Google Scholar] [CrossRef]
- Shi, D.; Lu, X. Accumulation degree and source apportionment of trace metals in smaller than 63 μm road dust from the areas with different land uses: A case study of Xi’an, China. Sci. Total Environ. 2018, 636, 1211–1218. [Google Scholar] [CrossRef]
- Xia, L.; Zhang, Y.; Sun, X.; Li, J. Analyzing the spatial pattern of carbon metabolism and its response to change of urban form. Ecol. Model. 2017, 355, 105–115. [Google Scholar] [CrossRef]
- Pessôa, A.C.M.; Anderson, L.O.; Carvalho, N.S.; Campanharo, W.A.; Junior, C.H.L.S.; Rosan, T.M.; Reis, J.B.C.; Pereira, F.R.S.; Assis, M.; Jacon, A.D.; et al. Intercomparison of burned area products and its implication for carbon emission estimations in the Amazon. Remote Sens. 2020, 12, 3864. [Google Scholar] [CrossRef]
- Diao, J.; Liu, J.; Zhu, Z.; Li, M.; Sleeter, B.M. Substantially greater carbon emissions estimated based on annual land-use transition data. Remote. Sens. 2020, 12, 1126. [Google Scholar] [CrossRef]
- Ray, R.L.; Ibironke, A.; Kommalapati, R.; Fares, A. Quantifying the impacts of land-use and climate on carbon fluxes using satel-lite data across Texas, U.S. Remote Sens. 2019, 11, 1733. [Google Scholar] [CrossRef]
- Fu, W.J.; Jiang, P.K.; Zhou, G.M.; Zhao, K.L. Using Moran’s I and GIS to study the spatial pattern of forest litter carbon density in a subtropical region of southeastern China. Biogeosciences 2014, 11, 2401–2414. [Google Scholar] [CrossRef]
- Keshavarzi, A.; Bhunia, G.S.; Shit, P.K.; Ertunç, G.; Zeraatpisheh, M. Spatial pattern analysis and identifying soil pollution hotspots using local Moran’s I and GIS at a regional scale in northeast of Iran. In Soil Health and Environmental Sustainability: Application of Geospatial Technology; Springer International Publishing: Cham, Switzerland, 2022; pp. 283–307. [Google Scholar]
- Rong, T.; Zhang, P.; Jing, W.; Zhang, Y.; Li, Y.; Yang, D.; Yang, J.; Chang, H.; Ge, L. Carbon dioxide emissions and their driving forces of land use change based on economic contributive coefficient (ECC) and ecological support coefficient (ESC) in the lower Yellow River Region (1995–2018). Energies 2020, 13, 2600. [Google Scholar] [CrossRef]
- Duc, H.N.; Azzi, M.; Zhang, Y.; Kirkwood, J.; White, S.; Trieu, T.; Riley, M.; Salter, D.; Chang, L.T.-C.; Capnerhurst, J.; et al. Black Carbon Emissions, Transport and Effect on Radiation Forcing Modelling during the Summer 2019–2020 Wildfires in Southeast Australia. Atmosphere 2023, 14, 699. [Google Scholar] [CrossRef]
- Ghosh, S.; Dinda, S.; Chatterjee, N.D.; Dutta, S.; Bera, D. Spatial-explicit carbon emission-sequestration balance estimation and evaluation of emission susceptible zones in an Eastern Himalayan city using Pressure-Sensitivity-Resilience framework: An approach towards achieving low carbon cities. J. Clean. Prod. 2022, 336, 130417–130429. [Google Scholar] [CrossRef]
- Zhang, J.; Li, S.; Lin, N.; Lin, Y.; Yuan, S.; Zhang, L.; Zhu, J.; Wang, K.; Gan, M.; Zhu, C. Spatial identification and trade-off analysis of land use functions improve spatial zoning management in rapid urbanized areas, China. Land Use Policy 2022, 116, 106058–106072. [Google Scholar] [CrossRef]
- Ran, L.; Wang, X.; Li, S.; Zhou, Y.; Xu, Y.; Chan, C.N.; Fang, N.; Xin, Z.; Shen, H. Integrating aquatic and terrestrial carbon fluxes to assess the net landscape carbon balance of a highly erodible semiarid catchment. J. Geophys. Res. Biogeosci. 2022, 127, 6765–6780. [Google Scholar] [CrossRef]
- Zhao, R.Q.; Zhang, S.; Huang, X.J.; Qin, Y.C.; Liu, Y.; Ding, M.; Jiao, S. Spatial variation of carbon budget and carbon balance zoning of Central Plains Eco-nomic Region at county-level. Acta Geogr. Sin. 2014, 69, 1425–1437. [Google Scholar]
- Wei, B.; Kasimu, A.; Reheman, R.; Zhang, X.; Zhao, Y.; Aizizi, Y.; Liang, H. Spatiotemporal characteristics and prediction of carbon emissions/absorption from land use change in the urban agglomeration on the northern slope of the Tianshan Mountains. Ecol. Indic. 2023, 151, 110329. [Google Scholar] [CrossRef]


| Land-Use Types | Carbon Emission Coefficient (kg (C)·m−2·a−1) | Used in the Study |
|---|---|---|
| Cropland | 0.0497 [60] | 0.0497 |
| Forestland | −0.0645, −0.0527 [60] | −0.0586 |
| Grassland | −0.0021 [60] | −0.0021 |
| Water area | −0.0509, −0.0410 [21] | −0.0459 |
| Other land use | −0.0005 [21] | −0.0005 |
| Energy | Average Low Calorific Value (kJ/kg) | Unit Calorific Value Carbon Content (kg/106 KJ) | Carbon Oxidation Rate (%) | Carbon Emission Coefficient (kg/kg) |
|---|---|---|---|---|
| Coal | 20,908 | 26.37 | 94% | 0.5183 |
| Cleaned coal | 26,344 | 25.41 | 93% | 0.6225 |
| Coke | 28,435 | 29.5 | 93% | 0.7801 |
| Gasoline | 43,070 | 18.9 | 98% | 0.7977 |
| Kerosene | 43,070 | 19.5 | 98% | 0.8231 |
| Diesel oil | 42,652 | 20.2 | 98% | 0.8443 |
| Fuel oil | 41,816 | 21.1 | 98% | 0.8647 |
| Liquefied petroleum gas | 50,179 | 17.2 | 98% | 0.8458 |
| Natural gas | 35,585 | 15.3 | 99% | 0.5390 |
| Year | Unit | Cropland | Forestland | Grassland | Water Area | Urban Land | Other Land-Use |
|---|---|---|---|---|---|---|---|
| 1990 | Area(km2) proportion | 10,823.2586 12.36% | 4091.672508 4.76% | 41,313.574668 47.18% | 3408.190828 3.89% | 1094.109508 1.25% | 28,988.061512 33.12% |
| 2000 | Area(km2) proportion | 11,565.984052 13.3% | 4052.581704 4.62% | 39,980.095328 45.66% | 3512.172556 4.01% | 1329.544792 1.52% | 28,391.498704 32.43% |
| 2010 | Area(km2) proportion | 16,557.012452 18.91% | 1832.383800 2.09% | 37,130.093472 42.41% | 1832.715896 2.09% | 1812.855208 2.07% | 27,115.840240 30.97% |
| 2020 | Area(km2) proportion | 17,758.219364 20.28% | 1766.574900 2.02% | 34,869.092688 39.82% | 1722.349804 1.97% | 2452.276364 2.8% | 26,825.591624 30.64% |
| 1990–2020 | Area of change change rate | 6934.9606 64.07% | −2325.097608 −56.82% | −6444.48198 −15.60% | −685.841024 −49.46% | 1358.166856 124.13% | −2162.469888 −7.45% |
| Year | Land-Use-Specific Carbon Emission/Absorptions (104 t) | Total Carbon Emissions | Total Carbon Absorptions | Net Carbon Emissions | |||||
|---|---|---|---|---|---|---|---|---|---|
| Cropland | Forestland | Grassland | Water Area | Urban Land | Other Land Use | ||||
| 1990 | 197.236 | −87.916 | −31.811 | −57.360 | 2821.76 | −5.314 | 3018.996 | −182.401 | 2836.595 |
| 6.53% | 48.20% | 17.44% | 31.45% | 93.47% | 2.91% | 100.00% | 100.00% | ||
| 2000 | 210.771 | −87.076 | −30.785 | −60.120 | 3114.75 | −5.205 | 3325.521 | −183.186 | 3142.335 |
| 6.34% | 47.53% | 16.81% | 32.82% | 93.66% | 2.84% | 100.00% | 100.00% | ||
| 2010 | 301.724 | −39.372 | −28.59 | −30.845 | 11,297.76 | −4.971 | 11,599.484 | −103.778 | 11,495.706 |
| 2.6% | 37.94% | 27.55% | 29.72% | 97.4% | 4.79% | 100.00% | 100.00% | ||
| 2020 | 323.611 | −37.958 | −26.849 | −28.987 | 32,897.53 | −4.918 | 33,221.141 | −98.712 | 33,122.429 |
| 0.97% | 38.45% | 27.20% | 29.37% | 99.03% | 4.98% | 100.00% | 100.00% | ||
| Year | 1990 | 2000 | 2010 | 2020 | 1990 | 2000 | 2010 | 2020 |
|---|---|---|---|---|---|---|---|---|
| Moran’s I | −0.008 | −0.005 | −0.004 | −0.242 | −0.250 | −0.255 | 0.099 | 0.076 |
| Z(I) | 0.5433 | 0.631 | 0.2855 | −0.7371 | −1.0878 | −0.979 | 0.0447 | 1.0281 |
| Carbon Balance Zoning | Division Bases | Zoning Characteristics |
|---|---|---|
| Carbon sink functional areas | ECC > 1, ESC > 1, CA > Ci | Higher ECC and ESC, CA is higher than Ci, possess carbon sink function and carbon sequestration capacity |
| Low-carbon economic areas | ECC > 1, ESC > 1, CA < Ci | Higher ECC and ESC, CA is lower than Ci, lower NCE |
| Carbon intensity control areas | ECC > 1, ESC < 1, CA < Ci | Higher ECC, and lower ESC, CA is lower than Ci, higher NCE |
| High-carbon optimization areas | ECC < 1, ESC < 1, CA < Ci | Extremely higher NCE, lower ECC and ESC |
Disclaimer/Publisher’s Note: The statements, opinions and data contained in all publications are solely those of the individual author(s) and contributor(s) and not of MDPI and/or the editor(s). MDPI and/or the editor(s) disclaim responsibility for any injury to people or property resulting from any ideas, methods, instructions or products referred to in the content. |
© 2023 by the authors. Licensee MDPI, Basel, Switzerland. This article is an open access article distributed under the terms and conditions of the Creative Commons Attribution (CC BY) license (https://creativecommons.org/licenses/by/4.0/).
Share and Cite
Abbas, G.; Kasimu, A. Characteristics of Land-Use Carbon Emissions and Carbon Balance Zoning in the Economic Belt on the Northern Slope of Tianshan. Sustainability 2023, 15, 11778. https://doi.org/10.3390/su151511778
Abbas G, Kasimu A. Characteristics of Land-Use Carbon Emissions and Carbon Balance Zoning in the Economic Belt on the Northern Slope of Tianshan. Sustainability. 2023; 15(15):11778. https://doi.org/10.3390/su151511778
Chicago/Turabian StyleAbbas, Gulmira, and Alimujiang Kasimu. 2023. "Characteristics of Land-Use Carbon Emissions and Carbon Balance Zoning in the Economic Belt on the Northern Slope of Tianshan" Sustainability 15, no. 15: 11778. https://doi.org/10.3390/su151511778
APA StyleAbbas, G., & Kasimu, A. (2023). Characteristics of Land-Use Carbon Emissions and Carbon Balance Zoning in the Economic Belt on the Northern Slope of Tianshan. Sustainability, 15(15), 11778. https://doi.org/10.3390/su151511778


