Article

Butterfly Algorithm for Sustainable Lot Size Optimization

1
Faculty of Engineering, Liwa College of Technology, Abu Dhabi 41009, United Arab Emirates
2
National School for Applied Sciences, Abdelmalek Essaadi University, Tangier 93000, Morocco
3
LARILE ENSEM, Hassan II University of Casablanca, Casablanca 20202, Morocco
4
GS Laboratory, Sultan Moulay Slimane University, Beni Mellal 23000, Morocco
5
ANISSE, Faculty of Sciences, Mohammed V University in Rabat, Rabat 10170, Morocco
6
ISCAE, Casablanca 27182, Morocco
*
Author to whom correspondence should be addressed.
Sustainability 2023, 15(15), 11761; https://doi.org/10.3390/su151511761
Submission received: 18 May 2023 / Revised: 21 July 2023 / Accepted: 21 July 2023 / Published: 31 July 2023
(This article belongs to the Section Economic and Business Aspects of Sustainability)

Abstract

:
The challenges faced by classical supply chain management affect efficiency with regard to business. Classical supply chain management is associated with high risks due to a lack of accountability and transparency. The use of optimization algorithms is considered decision-making support to improve the operations and processes in green manufacturing. This paper suggests a solution to the green lot size optimization problem using bio-inspired algorithms, specifically, the butterfly algorithm. For this, our methodology consisted of first collecting the real data, then the data were expressed with a simple function with several constraints to optimize the total costs while reducing the CO2 emission, serving as input for the butterfly algorithm BA model. The BA model was then used to find the optimal lot size that balances cost-effectiveness and sustainability. Through extensive experiments, we compared the results of BA with those of other bio-inspired algorithms, showing that BA consistently outperformed the alternatives. The contribution of this work is to provide an efficient solution to the sustainable lot-size optimization problem, thereby reducing the environmental impact and optimizing the supply chain well. Conclusions: BA has shown that it can achieve the best results compared to other existing optimization methods. It is also a valuable chainsaw tool.

1. Introduction

Manufacturing is experiencing an extraordinary evolution in the availability of data. These data have a variety of forms, representations, and quality levels as they are composed of the smaller data of a production line, the machine process parameters of production resources, and the raw material records from suppliers [1].
Optimization based on these data is a way to achieve the objectives of supply chain management: to produce articles with good quality at the lowest cost that meet the customer demand. Procurement management, inventory management, and supply chain planning are characterized by many uncertainties including customer demand and supplier lead times. Standard supply chain management is unable to deal with the uncertainty of customer demand [2].
Under all of these uncertainties, inventory managers need to determine the inventory level for all items and the reduction in various logistics costs while bearing in mind the desired level of customer service. The goal of inventory management remains to detect a composition linking the inventory levels and customer satisfaction by increasing the service levels and minimizing the shortage costs. On the one hand, if the interest is to minimize the cost of inventory without caring about the service level, it means that customers are not satisfied, some orders are lost, and customers cannot even be served. On the other hand, high inventory levels lead to high storage costs.
A lot sizing decision takes all of these factors into account, measuring them and assessing their impact on the entire system. An ordering error can lead to excess inventory, which affects the cost of capital. A better decision regarding the quantity is a guarantee of the lowest cost [3]. For many companies, producing products that they are certain to sell is their only option, thus they devote all resources to supply chain optimization, innovation, and client satisfaction [4].
As another option, if the inventory becomes high, there is a risk that the product will become obsolete, which can affect the company and the environment.
For this reason, it is always interesting to develop new designs and use new optimization algorithms to determine an optimal batch size. For example, General Motors reduced their logistics costs in one of its divisions by about 26%. This was due to an integrated inventory and transportation model that the company used to change its approach to distribution operations [5].
The diversity of industries requires specific indicators [6]. However, for some specific industries and processes, there is a lack of measurement and testing methods and models [7].
This paper aimed to provide solutions for sustainable lot size optimization in supply chains using bio-inspired algorithms. The motivation for this study was to optimize lot sizes when considering environmental impacts, especially in terms of CO2 reduction. By incorporating sustainability considerations into the optimization process, companies can achieve simultaneous cost savings and improve their environmental performance.
The main contribution of this study is the development of a method for green lot size optimization. The method collects real data and formulates it as a simple function with constraints to optimize the total costs and reduce CO2 emissions. The butterfly algorithm (BA) was proposed as an optimization model to obtain an optimal lot size plan.
A comparison was made between the deterministic method and other bioinspired algorithms to evaluate the efficiency of the proposed method The findings show that lot size optimization obtained by the butterfly algorithm (BA) is more suitable and effective compared to other methods.
In summary, this paper addresses the need for continuous lot size optimization in supply chain management. By incorporating environmental considerations and using bio-inspired algorithms, companies can reduce their costs and environmental footprint. The proposed method and the results of the butterfly algorithm contribute to the development of optimization techniques in the context of sustainable supply chain management.
The rest of this article is structured as follows. Section 2 presents a literature review of the research streams contributing to the optimization of the inventory problem. Section 3 describes the study methodology for defining the objective function for the total cost optimization with the butterfly algorithm. Section 4 presents a case study using the model and the results of applying the algorithm. Section 5 concludes the paper.

2. Literature Review

Companies operating within local and international supply chains (SCs) are increasingly considering sustainability when making decisions [8,9]. In addition, sustainability is usually split into three categories depending on the area of interest: social, economic, and environmental sustainability [10]. A complex supply chain structure can result from a supply chain with multiple channels. The management of both offline and e-commerce supply chains has recently become increasingly dependent on the use of different supply chain procedures [11]. In markets with high demand, fast supply chain management is essential because managing supply in response to high demand may have an impact on the quality of the goods and services [12].
Managing a supply chain is a difficult task. This challenge is exacerbated when two or more competing goals are involved in the decision-making process. Emissions incorporation concerns with standard supply chain concerns is an example of such increased complexity. As a result, all-encompassing complex problem settings of low carbon supply chain management (LCSCM) must be considered. Despite the fact that several studies on LCSCM have been conducted, there are few review publications on carbon emission challenges in supply chain management (Plambeck, 2012) [13]. Previously, the research primarily looked at the carbon footprint (CF) difficulties in vehicle routing problems (Lin et al., 2014) [14], problems with CF measurement (Edwards et al., 2011 [15]; Jensen, 2012 [16]; Gaussin et al., 2013) [17] as well as cleaner technologies (Subramanian and Gunasekaran, 2015) [18]. Finding the quickest way not only saves money but also helps to minimize carbon dioxide emissions in the environment [19,20,21,22].

2.1. Lot Sizing

One important part of supply chain management is lot size optimization, which involves figuring out how many products should be made and/or ordered to save money and increase efficiency [23]. Among the most well-known supply chain problems is lot sizing when the costs and lead times are considered, which dates back to 1915 with Harris, who developed the concept of the economic order quantity (EOQ) to determine the lot size amount that well-satisfy the requirements at the lowest cost achievable [3], which concentrated on when to place the order and how much to order. This idea was developed in 1958 by Wagner and Whitin, with an order quantity function that allowed for variation over time for demands, inventory holding costs, and setup costs [24]. However, it only considers economic issues, ignoring environmental ones. At present, businesses currently face challenges related to the environment that are a cause of concern for development, in addition to worries about economic output. The creation of approaches to aid decision-making in the direction of sustainable development is gaining more and more attention [25] as a result of incorporating both social and environmental variables into the process of decision-making [26]. The various economic, societal, governmental, and environmental factors make this difficult [27]. To accurately portray the real challenges, a new phase of responsibilities and innovative inventory techniques that also consider environmental costs (such as transportation air pollution costs, storage emigration costs, and waste management emigration costs) is required. As a result, in recent years, academics have created sustainable inventory models that consider economic, social, and environmental variables. These models assist businesses in minimizing pollution in the environment and fending off social impacts [28]. Consequently, these approaches are consistent with Elkington’s “triple bottom line” (TBL) concept [29]; It says that in order to evaluate a company’s success, three factors should be considered: the economic, social, and environmental dimensions. In fact, the idea of sustainability accepts that companies need to focus on societal goals including economic development, social justice, and conserving the environment [30,31,32,33]. Consequently, many industries have been working to identify the best procurement strategies in cases with demand destabilization and to incorporate CSR “corporate social responsibility” considerations into their logistical operations [34].

2.2. Optimization Algorithms and BA

In order to handle practical combinatorial or global optimization issues, a variety of metaheuristic algorithms have already been studied such as the “artificial bee colony” (ABC) developed by Karaboga and Basturk in 2007 [35], differential evolution (DE) published by Storn and Price in 1997 [36], Cuckoo Search (CS) by Yang and Deb in 2009 [37], and others.
Yang’s 2010 firefly algorithm (FA) [38], Goldberg and Holland’s genetic algorithm (GA) in 1988 [39], “particle swarm optimization” PSO [40], and monarch butterfly optimization (MBO) [41] are other examples of optimization techniques.
-
ABC is based on honeybee swarm intelligence, which divides the bees in a hive into three types: scout bees, worker bees, and onlooker bees. Scout bees fly at random. Worker bees investigate the area around their sites for food sources and relay this information to spectator bees. Onlooker bees employ population fitness to choose a guiding solution for exploitation. These onlooker bees prefer to pick good food sources from those found by the employed bees. The higher-quality food sources are more likely to be chosen by onlooker bees than lesser-quality food sources (Karaboga and Basturk 2007) [35]. The scout bees are derived from a few employed bees that quit their food sources in the quest for new ones. This technique is mostly used for multifunctional service optimizing (Karaboga and Basturk 2008) [42].
-
CS is an algorithm known as a metaheuristic based on some cuckoo species’ obligatory brood parasite behavior, in which cuckoo birds deposit their eggs in the nests of other birds (Gandomi et al. 2013a) [43]. Every answer is represented by an egg, and a new solution with an egg of the cuckoo. The primary concept of the algorithm is built on replacing a subpar answer with fresh or potentially superior options. Cuckoo looks to optimize like a breeding technique (Arora and Singh 2013b) [44].
-
DE is an easy-to-use but effective community-based stochastic-looking approach that employs vector differences to disrupt the population of vectors and generates a population of potential solutions that are exposed to repeats of recombination, assessment, and selection (Storn and Price 1997) [36]. The weighted difference between two randomly chosen people joined to a third population participant, using a recurrence technique, makes it easier to create novel approaches. In relation to the distribution of the larger population, this disturbs members of the population. The hyper-search space’s sample is further self-organized by the perturbation impact at choosing, restricting it to known regions of interest.
-
FA, used to find the best answers to any given challenge, is an algorithmic model of the communal moving conduct of fireflies (Arora and Singh 2013a) [45]. The fundamental principle is that each firefly is drawn to the distinctive flashing pattern made by the other fireflies due to bioluminescence. The individual’s fitness has a direct correlation with the flash’s intensity (Gupta and Arora 2015) [46]. FA takes advantage of the idea of attraction, whereby a less bright object attracts a brighter one, enabling people to move around from one spot to another. This mobility allows the swarm to seek the search space for the best option (Yang 2009) [47].
-
GA is where a person’s chromosome is thought of as a problem-solving mechanism, and a population of such people tries to live in hostile environments (Holland 1992 [48]; The Darwinian notion of “survival of the fittest” is the foundation of GA. Three operators—selection, crossover, and mutation—form the foundation of GA (Goldberg and Holland 1988) [39]. Highly-matched people are chosen through selection to produce offspring that the crossover operator uses. Depending on the kind of chromosomal encoding utilized, a specific site within the chromosome is chosen for mutation, and its value is altered.
-
MBO is built on the eastern North American monarch population’s southern migration to Mexico. The butterfly population is split into two groups in this algorithm: southern Canada and the northern United States (Land 1), and Mexico (Land 2). Two operators, namely the migratory operator and the butterfly adjustment operator, are used to update the location of individual butterflies. While the butterfly adjusting operator is used to alter the placements of other butterfly individuals, the migration operator’s function is to produce new progeny. The movement rate serves as the determining element for the movement operator, which produces new monarch butterfly progeny (Wang et al. 2015) [41].
-
PSO method simulates how different species interact such as fish and birds to identify the best answer in challenging search areas (Eberhart and Shi 2001) [49]. A swarm of particles is used to symbolize the group, and the method explains how the particles move as their neighbors discover more effective search solutions. People gravitate toward one another’s accomplishments over time, which causes them to group together in advantageous parts of the environment. PSO makes use of two different types of knowledge: (first) cognitive learning, in which the particle gains knowledge from itself prior experiences, and (second) social learning, in which the particle gains knowledge from the experiences of others. The method incorporates both, with the learning phenomena causing the answer to improve as the algorithm runs [50].
Arora introduced the butterfly optimization algorithm (BA) in 2015, which is a brand-new metaheuristic algorithm that takes inspiration from nature and is built on how butterflies find food [51]. BA uses butterflies as search tools to carry out the optimization process. In terms of biology, butterflies employ sensory organs to locate sources of meals. The antennae as well as legs, palps, and other regions of the butterfly’s body are covered with these taste sensors, which are utilized to detect scent or smell [52]. In 2019, Arora and Singh developed a novel approach for the butterfly optimization algorithm [53]:
Figure 1 illustrates the growth in BA as publications per year. Through that period, the BA was regarded as the primary algorithm by the study authors from several fields. This factor has significantly raised given that there were nine BA-based articles in 2018, in addition to which there were 31 by the end of 2021. Researchers placed a special focus on BA by the last year, which could result in 51 publications appearing in 2022.
Numerous alterations to BA are being proposed. While the most advanced BA variations include new operators or techniques, they inadvertently still pose a serious problem in the majority of the present BA models. Table 1 displays the list of butterfly optimization algorithms cited from 2018 to 2022.
Arora and Singh [53]: BA is basically extremely simple and straightforward to implement. The suggested BA’s results were compared with common optimization algorithms such as GA, DE, CS, MBO, ABC, PSO, and FA by exploring 30 benchmark issues with varying properties such as multimodality, regularity, and dimension. The utility of BA was further assessed by completing three engineering design problems with varying types of objective functions, restrictions, and decision factors.
In summary, sustainable lot size optimization is a vital aspect of supply chain management that can significantly reduce the environmental impact of the supply chain while improving efficiency and reducing costs. Various approaches and methodologies have been proposed to achieve these objectives, and in order to increase the sustainability of lot size optimization, additional research is required.

3. Methodology of the Study

This section presents the methodology used in this study, which integrates the butterfly algorithm (BA) and sustainable lot size optimization in supply chain management. The proposed methodology has several key improvements and concepts that contribute to algorithmic and optimization problems.

3.1. Lot Size Optimization

The supply chain is a set of processes to optimize the movement of products in space and time to meet the customer’s requirements more effectively. Good supply chain management consists of the strategic planning of operations in procurement through the development of good environments of cooperation between partners to produce and distriute effectively, adding levels of services and networks of optimized supplies. Inventory management includes all links in the supply chain, from the supplier to the final customer. Emphasis should be placed on developing sustainable and profitable relationships between these links. In order to meet the factors of price, delay, and quality for the customer, stock is needed, which is called inventory. The purpose is to determine the quantity that should be kept in stock [77]. This is called lot size; it is the quantity of items to be launched for procurement or production when a need for stock replenishment occurs. The procurement and production lot sizes are often different from the quantities that the end customer buy; this is the consequence of this fact and the creation of an inventory that realizes the necessary decoupling between deliveries and customer requirements. In addition, the inventory must be managed for each delivery without demand from the customer. This management is more difficult when the demand is variable and unclear. Inventories are used in production and supply chain management to coordinate cycles and avoid uncertainty risks. The importance of inventory management in industry stems from the influence of lot size on the satisfaction of the customer and the influence of inventory on the economic bottom line of companies [77]. To be sure that the objectives of the chain are achieved, it is necessary to know the time when the lot size is needed, the cost of the lot size, the parameters that determine the level of the lot size, the strategy to be chosen, and, finally, the way to optimize this lot size while improving the level of service (Figure 2).
Without lot sizing optimization, companies generally set a target inventory level and decide on the daily consumption coverage, taking the average customer demand and average lead time into account. There are two different kinds of optimization models for lot sizing: the first is a deterministic model, in which all variables are determined depending on the model’s parameters, and the second one is stochastic, which takes variability and uncertainty into consideration.
Harris proposed the concept of the total cost of inventory in 1913, which includes setup expenses, holding costs, and economic lot size [3]. This idea was further refined, and a dynamic form of economic lot size, which accounts for potential variations in demand, holding costs, and setup costs over time, was introduced by Wagner and Whitin in 1958 [79].
The Harris economic ordering quantity model, which typically considers two types of processes, is one of the traditional methods for optimizing lot size [3]. The second floor determines the optimal delivery lot size, which is fixed over the entire horizon under consideration; the order is triggered when the product is needed. The frequency of delivery is not determined in advance but can be derived from the ratio of the average sales and lot size. Conversely, in the second type of method, the optimal frequency of orders is determined; the quantity to be ordered varies with each order. Methods that optimize both methods simultaneously are somewhat more difficult to implement. However, to apply the classical economic order quantity model, the basic assumptions are that demand is established and static, there is zero delivery time, and quantity is obtained for a single product at that time.
The economic lot size assumes that Ch refers to the inventory holding cost, Da is the annual demand, and C is the order placement cost:
Q = √ (2C × Da/Ch)

3.2. Sustainable Lot Size Optimization

The growing importance of the supply chain concept has given rise to new expectations for supply chain improvement among leading companies. While improvements based on cost reduction (purchasing, lean manufacturing, outsourcing of certain logistics activities) have contributed to improving the alignment of physical and informational flows, a new trend has marked supply chains. Indeed, the latter are targeting a global design of their network to limit losses at the interface, lower inventory levels, and improve customer satisfaction. As a result, this global design has been able to contribute to a competitive advantage in terms of cost-cutting and a reduction in operating cost, particularly in the current environment of fierce competition and globalization, engaged consumers, and high inventory revolutions. However, the latter impacts the environment through high emission rates [80]. Consequently, increasing public attention to climate change and corporate social and societal responsibility including greenhouse gas emissions, quality of life, and job creation has led to the advent of sustainable supply chain management [81,82,83]. This work developed an integrated inventory-emission CO2 model to reduce the costs associated with the lot size inventory while considering the carbon tax resulting from the CO2 emissions generated by the transport of the goods under uncertain demand.
Many investigations have tried to decide which emission models are the best. This study focused on the emission cost presented by Mortazavi et al. [84] because of its simplicity and because it also fit our case of emissions coming from transportation. Thus, based on the standard tax costs, transportation distance, and average CO2 emissions per kilometer, the emission cost C E will be expressed as follows:
C E = E C O 2 × d i s t × t C O 2
where E C O 2 is the average CO2 emission per kilometer; d i s t is the total distance separation between the supplier and the warehouse; t C O 2 is the CO2 emission tax/gr.
As one can easily see, contrary to the classic economic quantity, ordering items in larger quantities actually reduces the transportation costs and the associated CO2 emissions.
Several successful metaheuristic approaches are based on biological inspiration. These algorithms consider swarm intelligence (SI) and are flexible and versatile. Particle swarm optimization (Kennedy), which was created in 1995 and is one of these algorithms, is based on the behavior of swarms such as the swarming behavior of fish and birds in the field. It is currently used to locate answers for many optimization applications.
The cuckoo search algorithm (CS), another example, exhibits promising superiority. The butterfly algorithm (BA) is one of the last metaheuristic algorithms that was inspired by nature.

3.3. Butterfly Algorithm

The butterfly optimization algorithm (BA) is an advanced metaheuristic for optimization created by Arora that draws inspiration from biology [53], which is centered on the behavior of butterflies when they are seeking food. According to BA, a butterfly’s fitness is correlated with its ability to produce a certain intensity of fragrance.
A social knowledge network is created as a result of the produced scent being distributed over a given distance and being detectable by other butterflies in the colony. During the worldwide research phase, every single butterfly flies in the direction of the one with the best scent among the others in the area.
While a butterfly cannot smell the scent of others, it moves randomly through the search area during the local search phase. This algorithm is a novel approach to complex optimization problems that offers a different solution.
Understanding the calculation of fragrance in the BA requires knowledge of how stimuli are perceived and processed by the senses. Three key components—sensory modality (c), stimulus intensity (I), and power exponent (a)—form the basis of this idea.
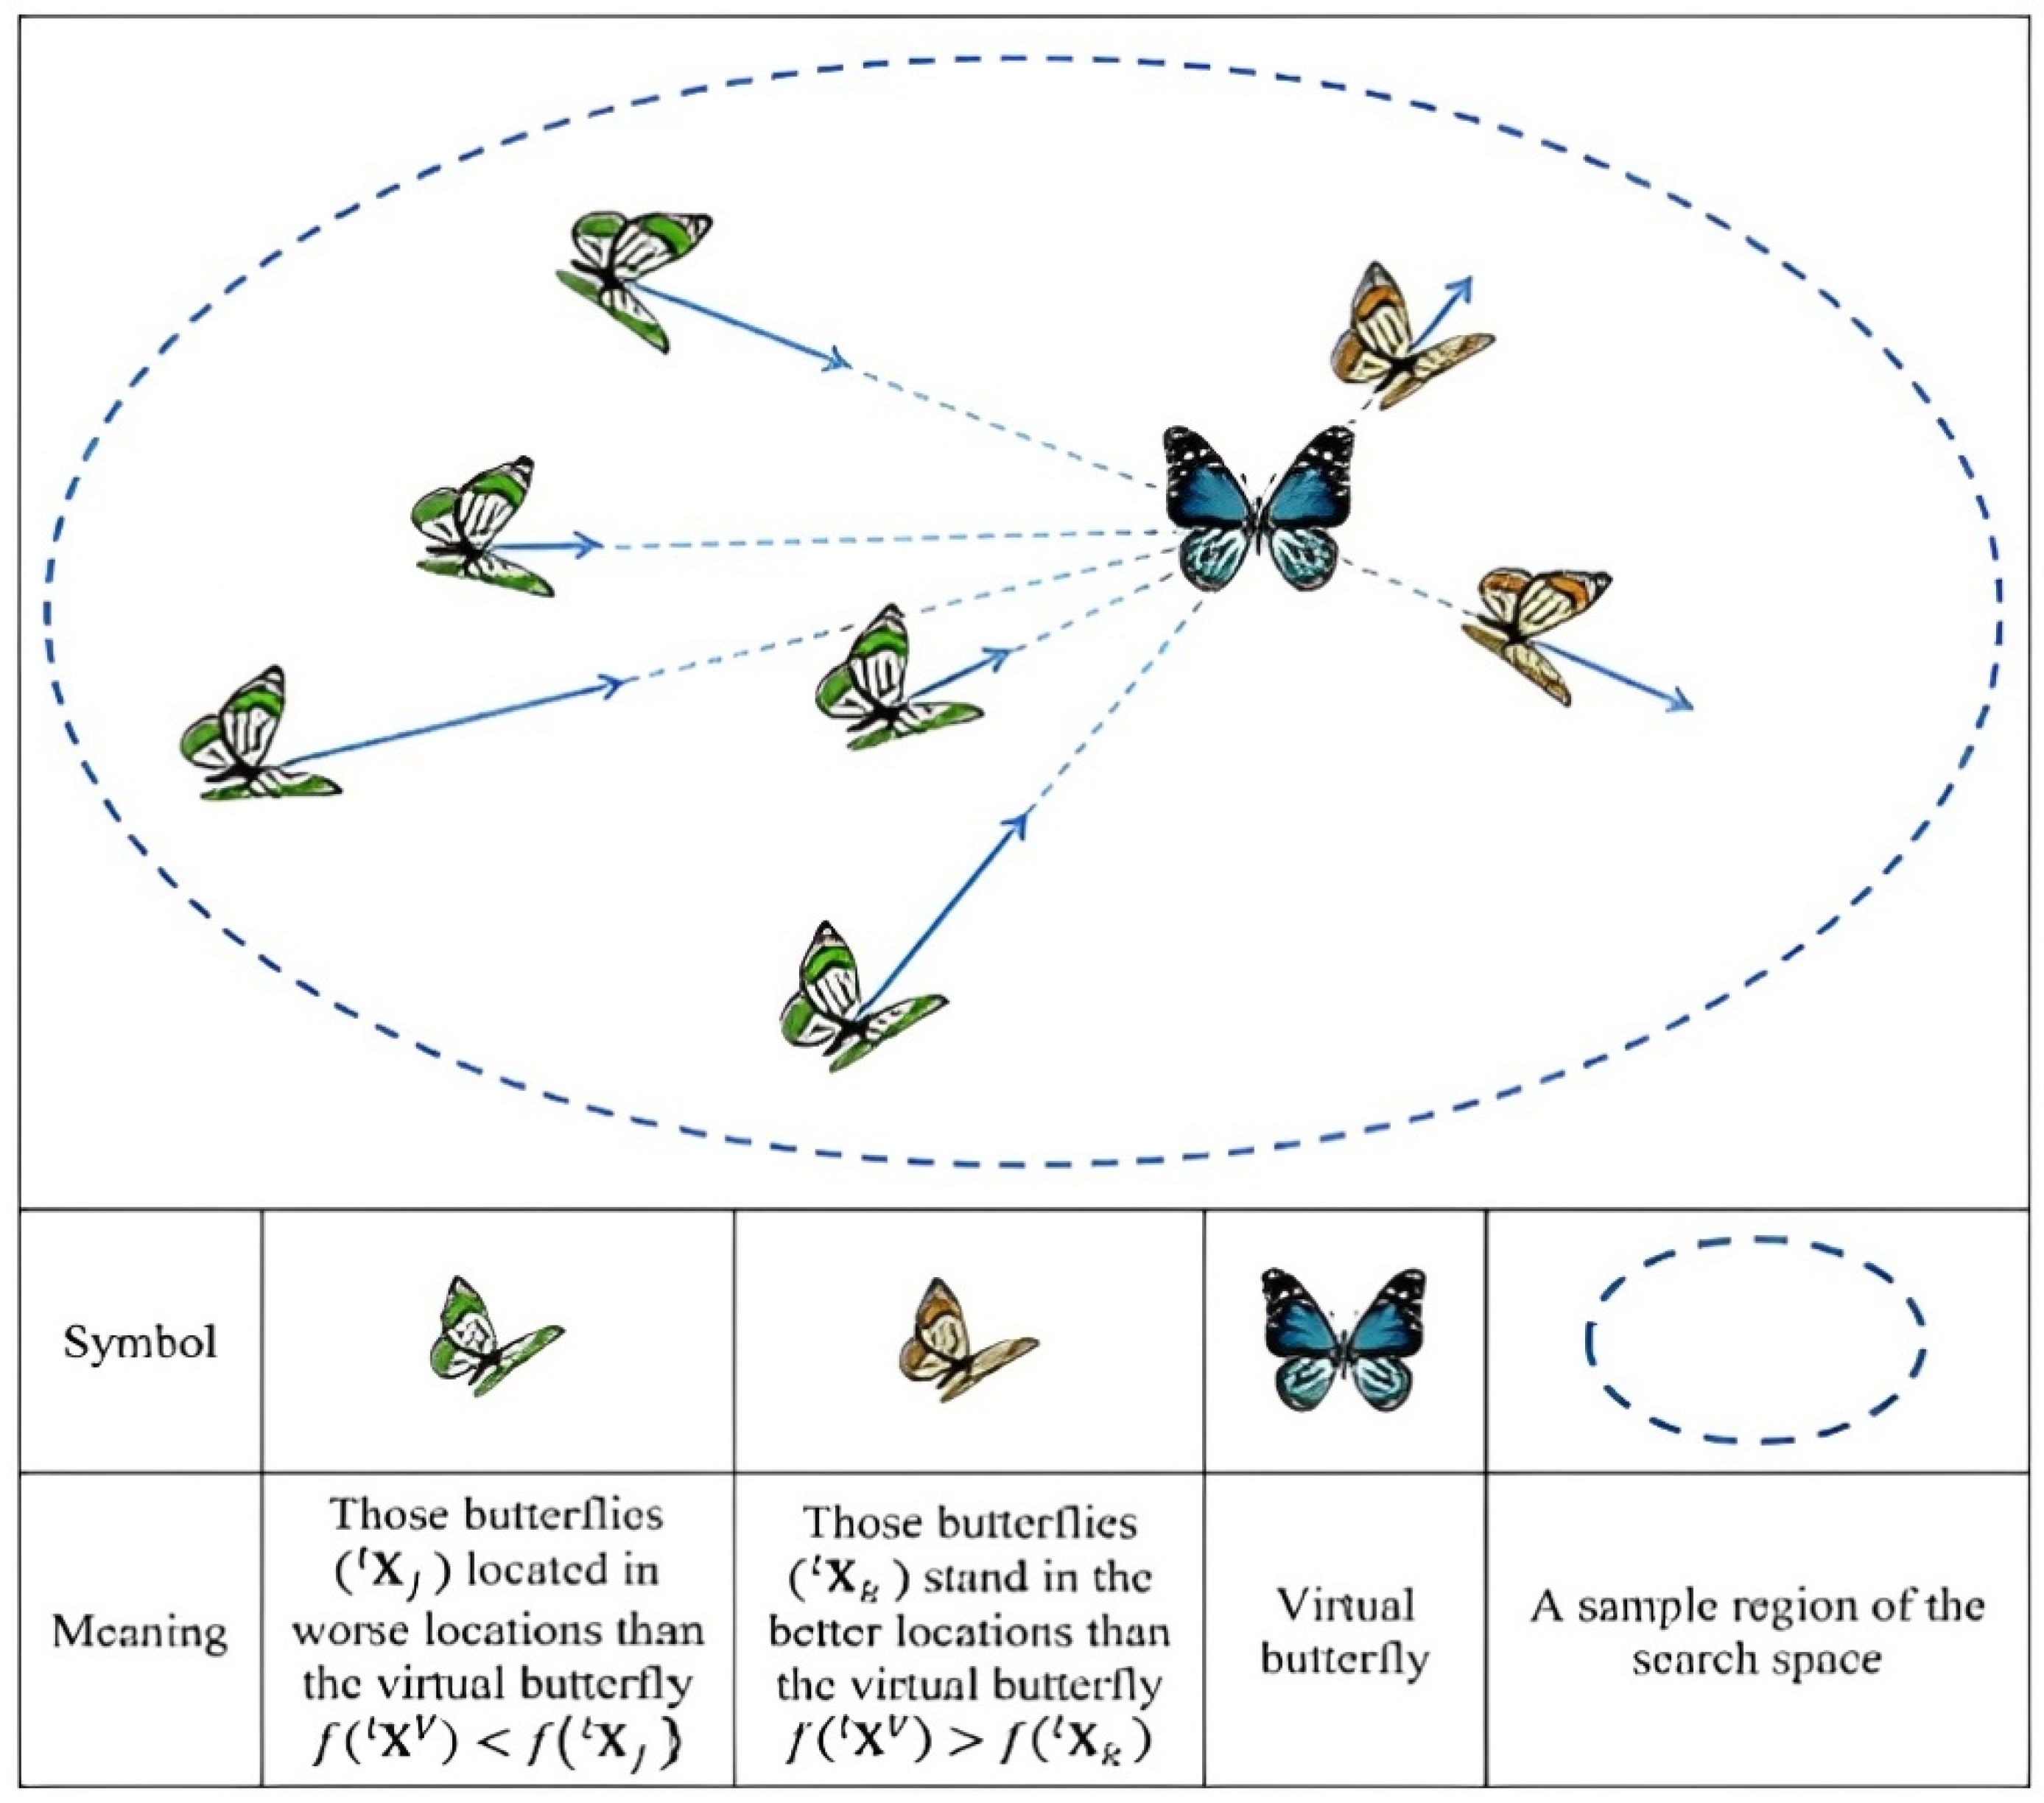
A sensory modality is a specific sort of perception such as smell, sound, or light. The stimulus intensity, which in the instance of BA is connected to the butterfly’s fitness, is the strength of the physical or real stimulus. The power exponent happens when butterflies elsewhere in the area notice the fragrance that a butterfly emits and are attracted to its location (Figure 3).
The research on butterflies is centered on two crucial factors considering the biological aspects. The first element is concerned with the alteration of I, while the other factor is concerned with the formulation of h.
To elaborate, a butterfly’s physical stimulation level is related to an objective function, while h represents a relative concept that other butterflies must understand. Hence, in BA, the fragrance is displayed as a follow-up feature:
h i = c × I a
where (c) is the sensory modality, (I) is the stimulus of intensity, and (a) is the power exponent.

3.4. Butterflies Movement

In the context of food research, a butterfly’s physical stimulus intensity is connected to a given important function. Butterflies use a three-phase approach to guide their movements: local, global, and solution examination. Each butterfly releases fragrance as it moves during the global search phase, and other butterflies are drawn to it based on the potency of its fragrance.
X i i + 1 = X i j + h i × ( r a n d ( r ) 2 g j * X i j )
where i ∈ {1, 2,… N B } and j ∈ {1, 2,‥, N}, where N is the number of iterations and N B represents the sum of butterflies; X i j represents the ith vector solution of the problem, in number of iterations; g j * denotes the best solution currently discovered in iteration j; h i is the ith butterfly’s fragrance.
In the local search stage of the butterfly optimization process, a butterfly will move around randomly in the search area if it is unable to identify fragrance released by other butterflies. This is demonstrated by:
X i j + 1 = X i j + h i × ( r a n d ( r ) 2 × X m j X k j )
where X m j and X k j represent the mth and kth butterflies refer to specific butterflies in the search space, respectively, identified by their respective indices’ “m” and “k”.
In the same swarm, if another butterfly’s fragrance is detected by the BA algorithm’s butterfly and a random number between 0 and 1 is generated, then the butterfly starts to fly in a local random way.
The objective function is evaluated during the solution evaluation phase, which is symbolized by a butterfly’s degree of fragrance. Butterflies can find partners and food locally or globally. To switch between a local and global search, the BA algorithm uses probability, and the stopping criterion is based on the maximum number of iterations. The algorithm provides the best-fitting optimal solution after the iteration step. The following algorithm is a summary of the algorithm presented as pseudocode (Algorithm 1). In Algorithm 1, NPF: represents the number of Pareto fronts to be generated. Each Pareto front consists of non-dominated solutions, and the algorithm aims to find multiple Pareto fronts that represent trade-offs between different objectives. P0: refers to the initial population of butterflies. It represents a set of butterflies that will be used as the starting point for the optimization process. 𝜔i: represents the weight vector associated with each butterfly. The weight vector is used to calculate the fitness of the butterfly’s position, and it affects how the butterfly contributes to the search for Pareto fronts. f(xi): represents the fitness function, where xi represents the position of a butterfly. The fitness function evaluates the performance or quality of a solution based on the given objectives. Ij: represents the intensity of the stimulus at position xj. The stimulus intensity is determined using the fitness values (F(xj)) associated with the position xj. NB: represents the number of butterflies in the population. It determines the size of the initial population and influences the exploration and exploitation capabilities of the algorithm. ps: represents the probability of a butterfly moving toward the best solution. It determines the likelihood of butterflies being attracted to the best solution found so far. c: represents the scaling factor used in the movement toward the best solution. It controls the step size or distance that a butterfly moves toward the best solution. a: is an update value used in the algorithm. It may represent a parameter that changes over time or adapts during the execution of the algorithm.
Algorithm 1: Btteterly Optimization Algorithm
1: for i = 1,2…, NPF do
2: Generate the initial population P0 of butterflies
3: Generate weight vector 𝜔i
4: fitness F(x)= (f(x1), f(x2),…, f(xNf))
5: Stimulus Intensity Ij at xj is determined using F(xj)
6: Define the parameters of the algorithm Ps, c and a
7:  while sopping criteria is not saisfied do
8:   for each butterfly k in the population do
9:    Calculate the fagrance value hk by (3).
10:    end for
11: Find the best butterfly k that minimizes λ
12:    for each butterfly k in the population do
13:     Generate a rand(r) from [0, 1]
14:     if rand()< Ps then
15:     Move towards best solution using (4)
16:     else
17:     Move randomly by (5)
18:     end if
19:   end for
20:   Update the value of a.
21: end while new optima data found.
22: end for
23: return The Pareto front is extracted from the data set.
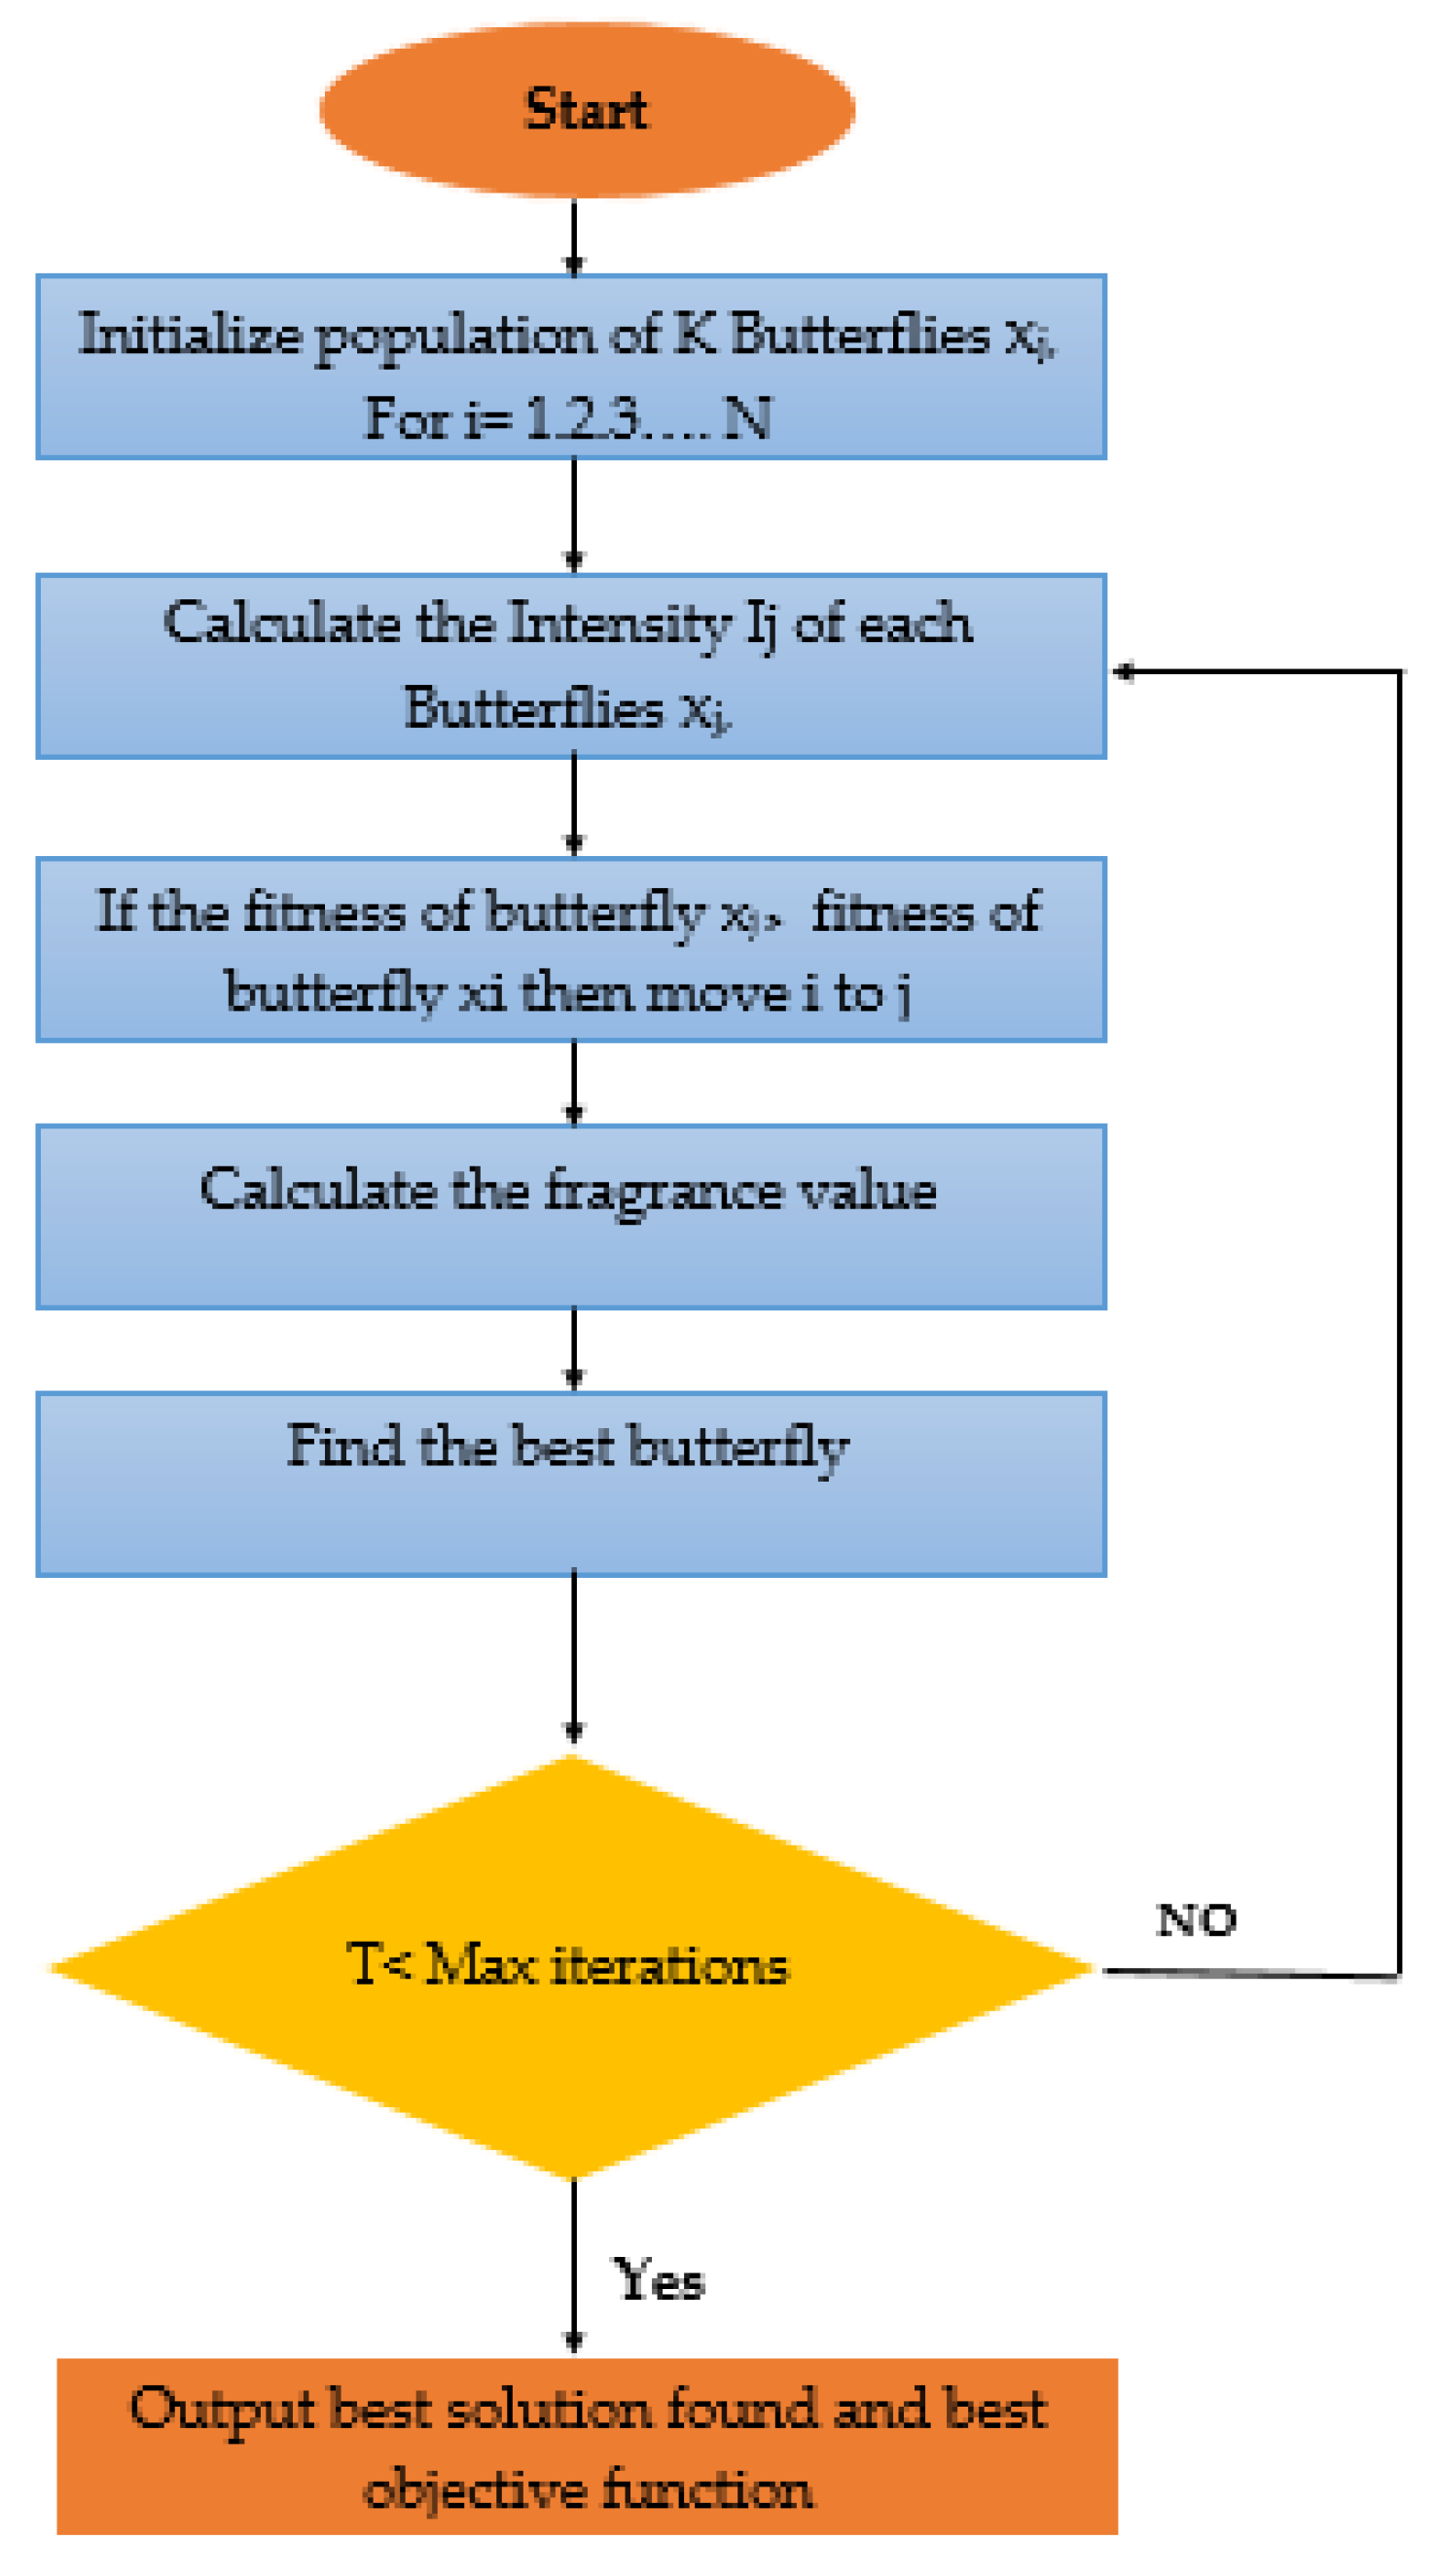
The flowchart of the butterfly algorithm is shown in Figure 4, which outlines a process for initializing and optimizing a population of K butterflies. Each butterfly’s position, represented by xj, is evaluated by calculating its intensity, Ij, based on a fitness function. The algorithm iteratively compares the fitness of each butterfly with others in the population and moves a butterfly from position i to position j, if its fitness is greater than that of another butterfly, xi. The fragrance value is then calculated. The algorithm continues until a maximum number of iterations, T, is reached. Finally, the best solution found and its corresponding objective function are outputted.
In summary, this algorithm aims to optimize the positions of a population of butterflies based on their fitness values. Butterflies with higher fitness values have a higher likelihood of moving to a better position, promoting exploration and exploitation of the search space. The algorithm iteratively refines the population until a termination condition such as the maximum number of iterations is met. The output provides the best solution found, along with its corresponding objective function value, representing the optimized result obtained by the algorithm.

3.5. Simulations and Comparison

Various scientific publications have provided evidence and demonstrated that the firefly algorithm (FA) outperforms various other heuristics including genetic algorithms (GA) in several fields of applications. This section aims to compare the butterfly algorithm (BA) with FA and both GA and PSO using different standard test functions. To ensure a reliable and fair comparison, all algorithms in the simulations utilized the same population size of n = 60. The summarized results of the implementation and simulation, conducted using Python, are presented in Table 2. To obtain statistically meaningful results, each algorithm must have been executed at least 100 times. The termination criterion for all algorithms is when the variations in function values fall below a specified tolerance of 1 × 10⁻⁵.
As evident from Table 2, the butterfly optimization algorithm (BA) outperformed the genetic algorithm (GA), particle swarm optimization (PSO), and firefly algorithm (FA) in terms of the efficiency and success rates in finding the global optima. This superiority can be attributed to BA’s minimal number of parameters. The simplicity of BA makes it more versatile and applicable to a wide range of problems. Similar observations can be made for other heuristics, indicating that reducing the number of parameters can lead to improved performance across different optimization algorithms. By conducting extensive tests on a set of benchmark instances, we investigated the performance of BA and other heuristic algorithms in terms of solution quality and computational efficiency. The test results provide insight into the strengths and weaknesses of each algorithm and show how our enhanced BA is superior for sustainable lot size optimization.
The sustainable lot size optimization problem considered in this study incorporated environmental considerations, especially those focused on CO2 emissions reduction. The main objective of traditional lot size optimization is to minimize costs by ignoring environmental factors. However, by integrating sustainable development into a quality system, companies can reduce their costs and environmental footprint. In this study, we proposed a comprehensive cost model that accounts for economic costs and CO2 emissions. The objective of the optimization process is to find a lot size structure that minimizes the total costs and simultaneously reduces CO2 emissions.
By combining an enhanced butterfly algorithm with a constant braid size problem, our method provides an innovative and efficient solution for optimizing lot sizes in the supply chain when measuring environmental sustainability.
In summary, Section 3 presents the methodology used in this study, focusing on improvements to the author’s butterfly algorithm and sustainability considerations combined with lot-size optimization.

4. Case Study

In this section, we present a case study demonstrating the effectiveness of an enhanced butterfly algorithm (BA) for consistent lot size optimization in a real-world supply chain. In order to ensure transparency and reproducibility, we developed the data, model, and parameter settings, the algorithm and parameter settings, and provided feedback on the test environment. Furthermore, we provide a comprehensive analysis of our obtained results to provide insights into the performance of our proposed method.

4.1. Data Description

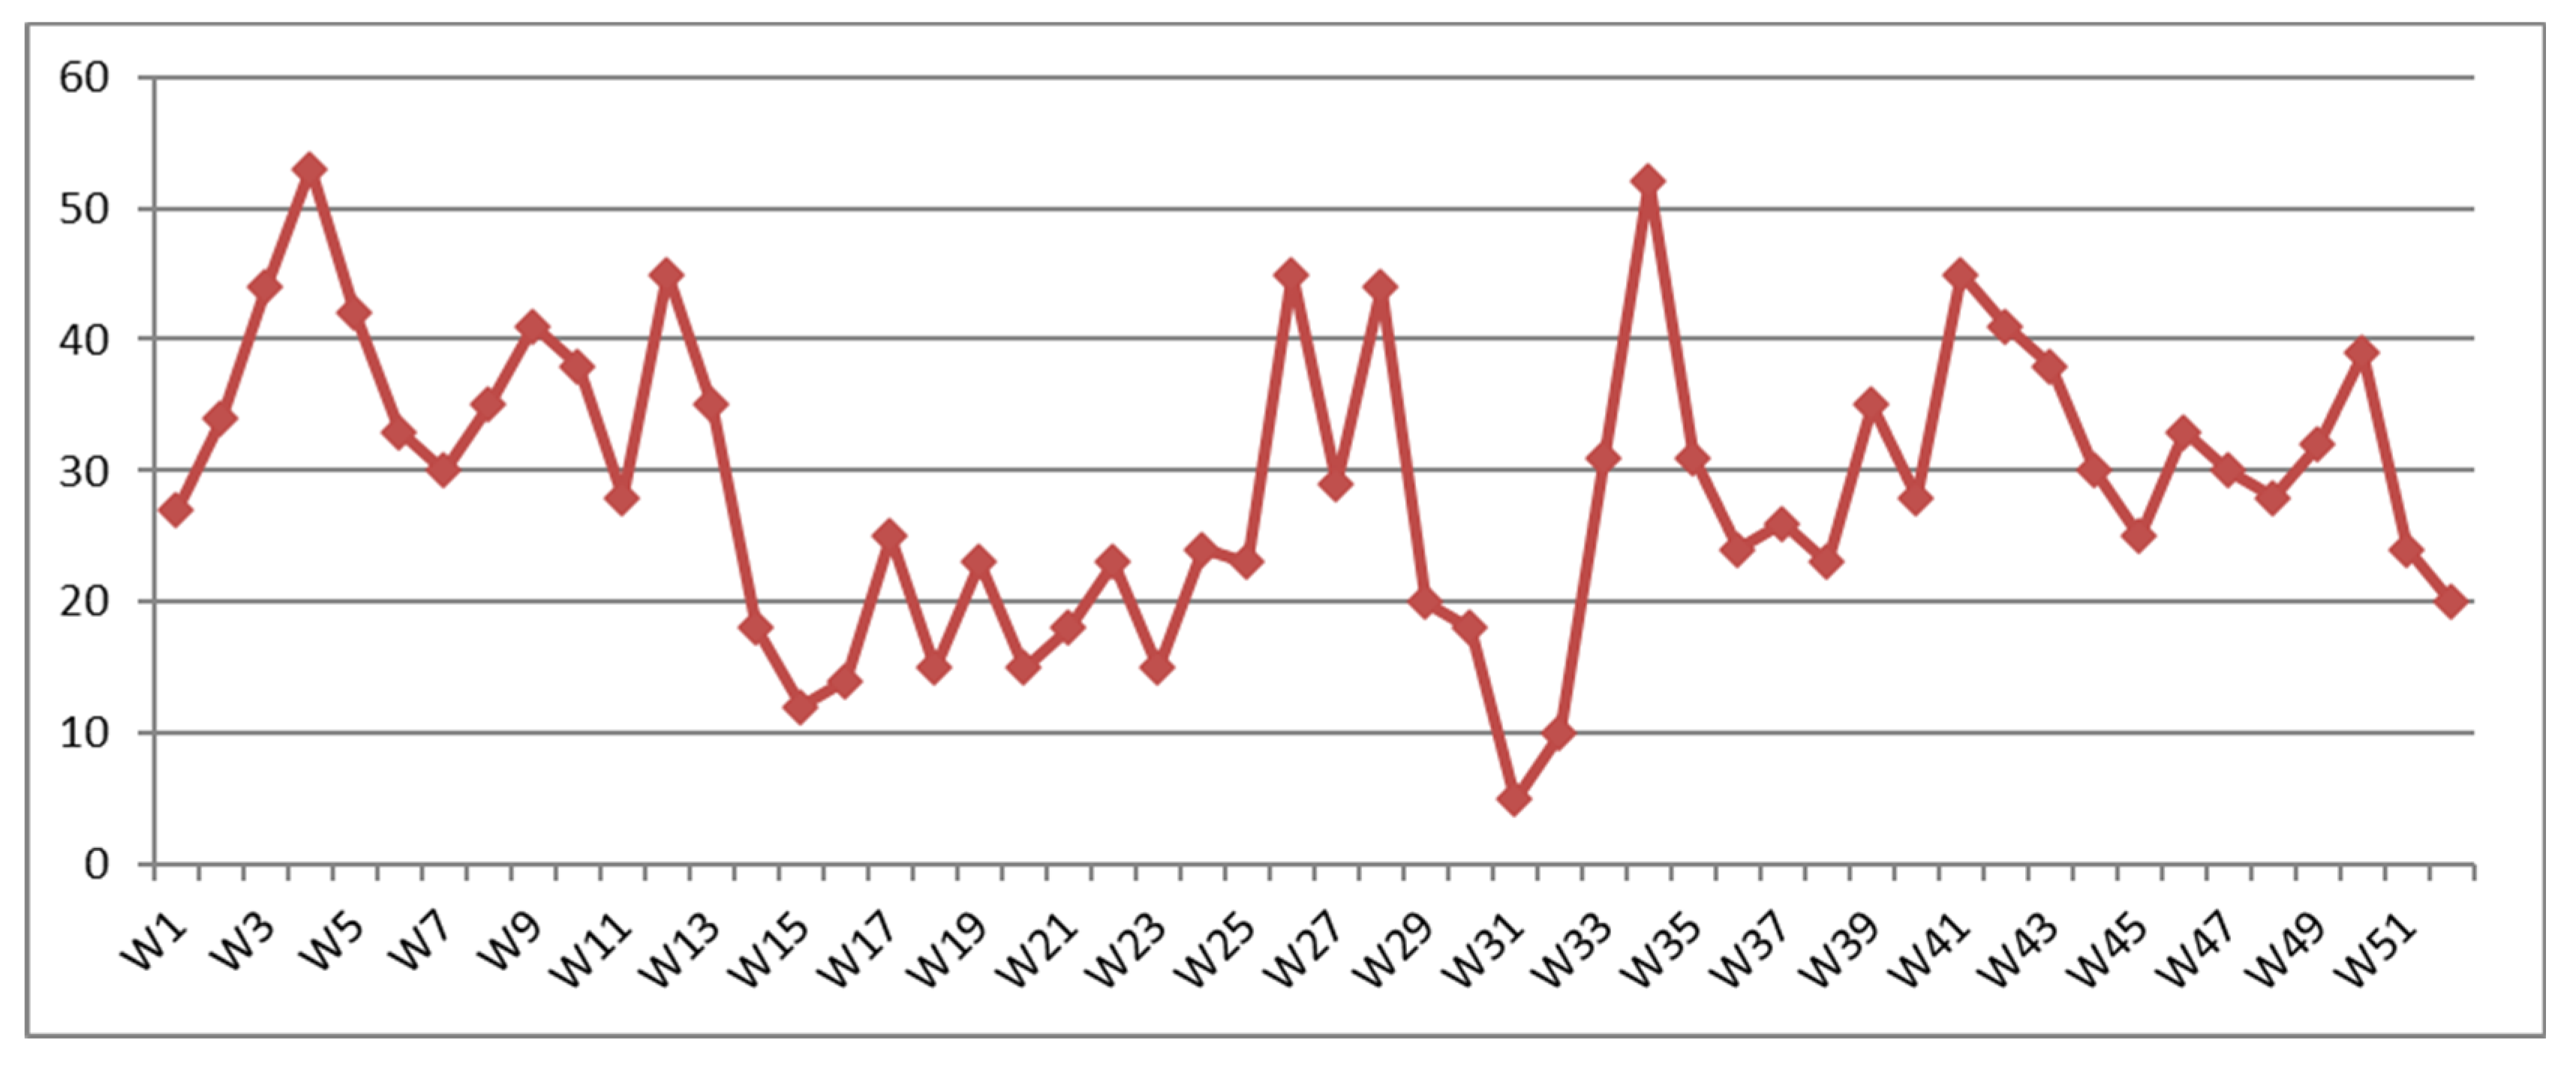
The case study was applied to an aircraft company specializing in wiring assembly. Last year’s data, which were used in our study, included data on the demand, transportation costs, inventory costs, and CO2 emissions associated with activities in the supply chain of the dataset represent a real-world situation and were carefully compiled and validated to ensure their reliability and accuracy. The value of the significant stocks held by businesses in the aircraft industry constitutes genuine leverage. In fact, these stocks are frequently the result of specific manufacturer orders: space launchers, aircraft or rocket engines, satellites, and many other things. Even if these inventories are made to meet orders for several years, the forecasts for raw materials are not accurate, references and quantities change frequently, and requests for spare parts are less predictable and require shorter production times. In order to avoid incidents involving this type of aircraft on the ground, these spare parts must be delivered promptly. Both the delivery times and the need are uncertain. It is not just about a single delivery date when using expensive materials; from component replacement to material supply, the entire chain needs to be taken into consideration. There are a number of stages to the deadline for the entire supply: deadlines for administrative tasks, procurement, transportation, receipt, inventory handling, and warehouse processing time. Segmentation of the references was made using the order history, stock data, and technical data, which indicates a lot of bottlenecks. The diagram in Figure 5 shows the quantity of shortages each week.
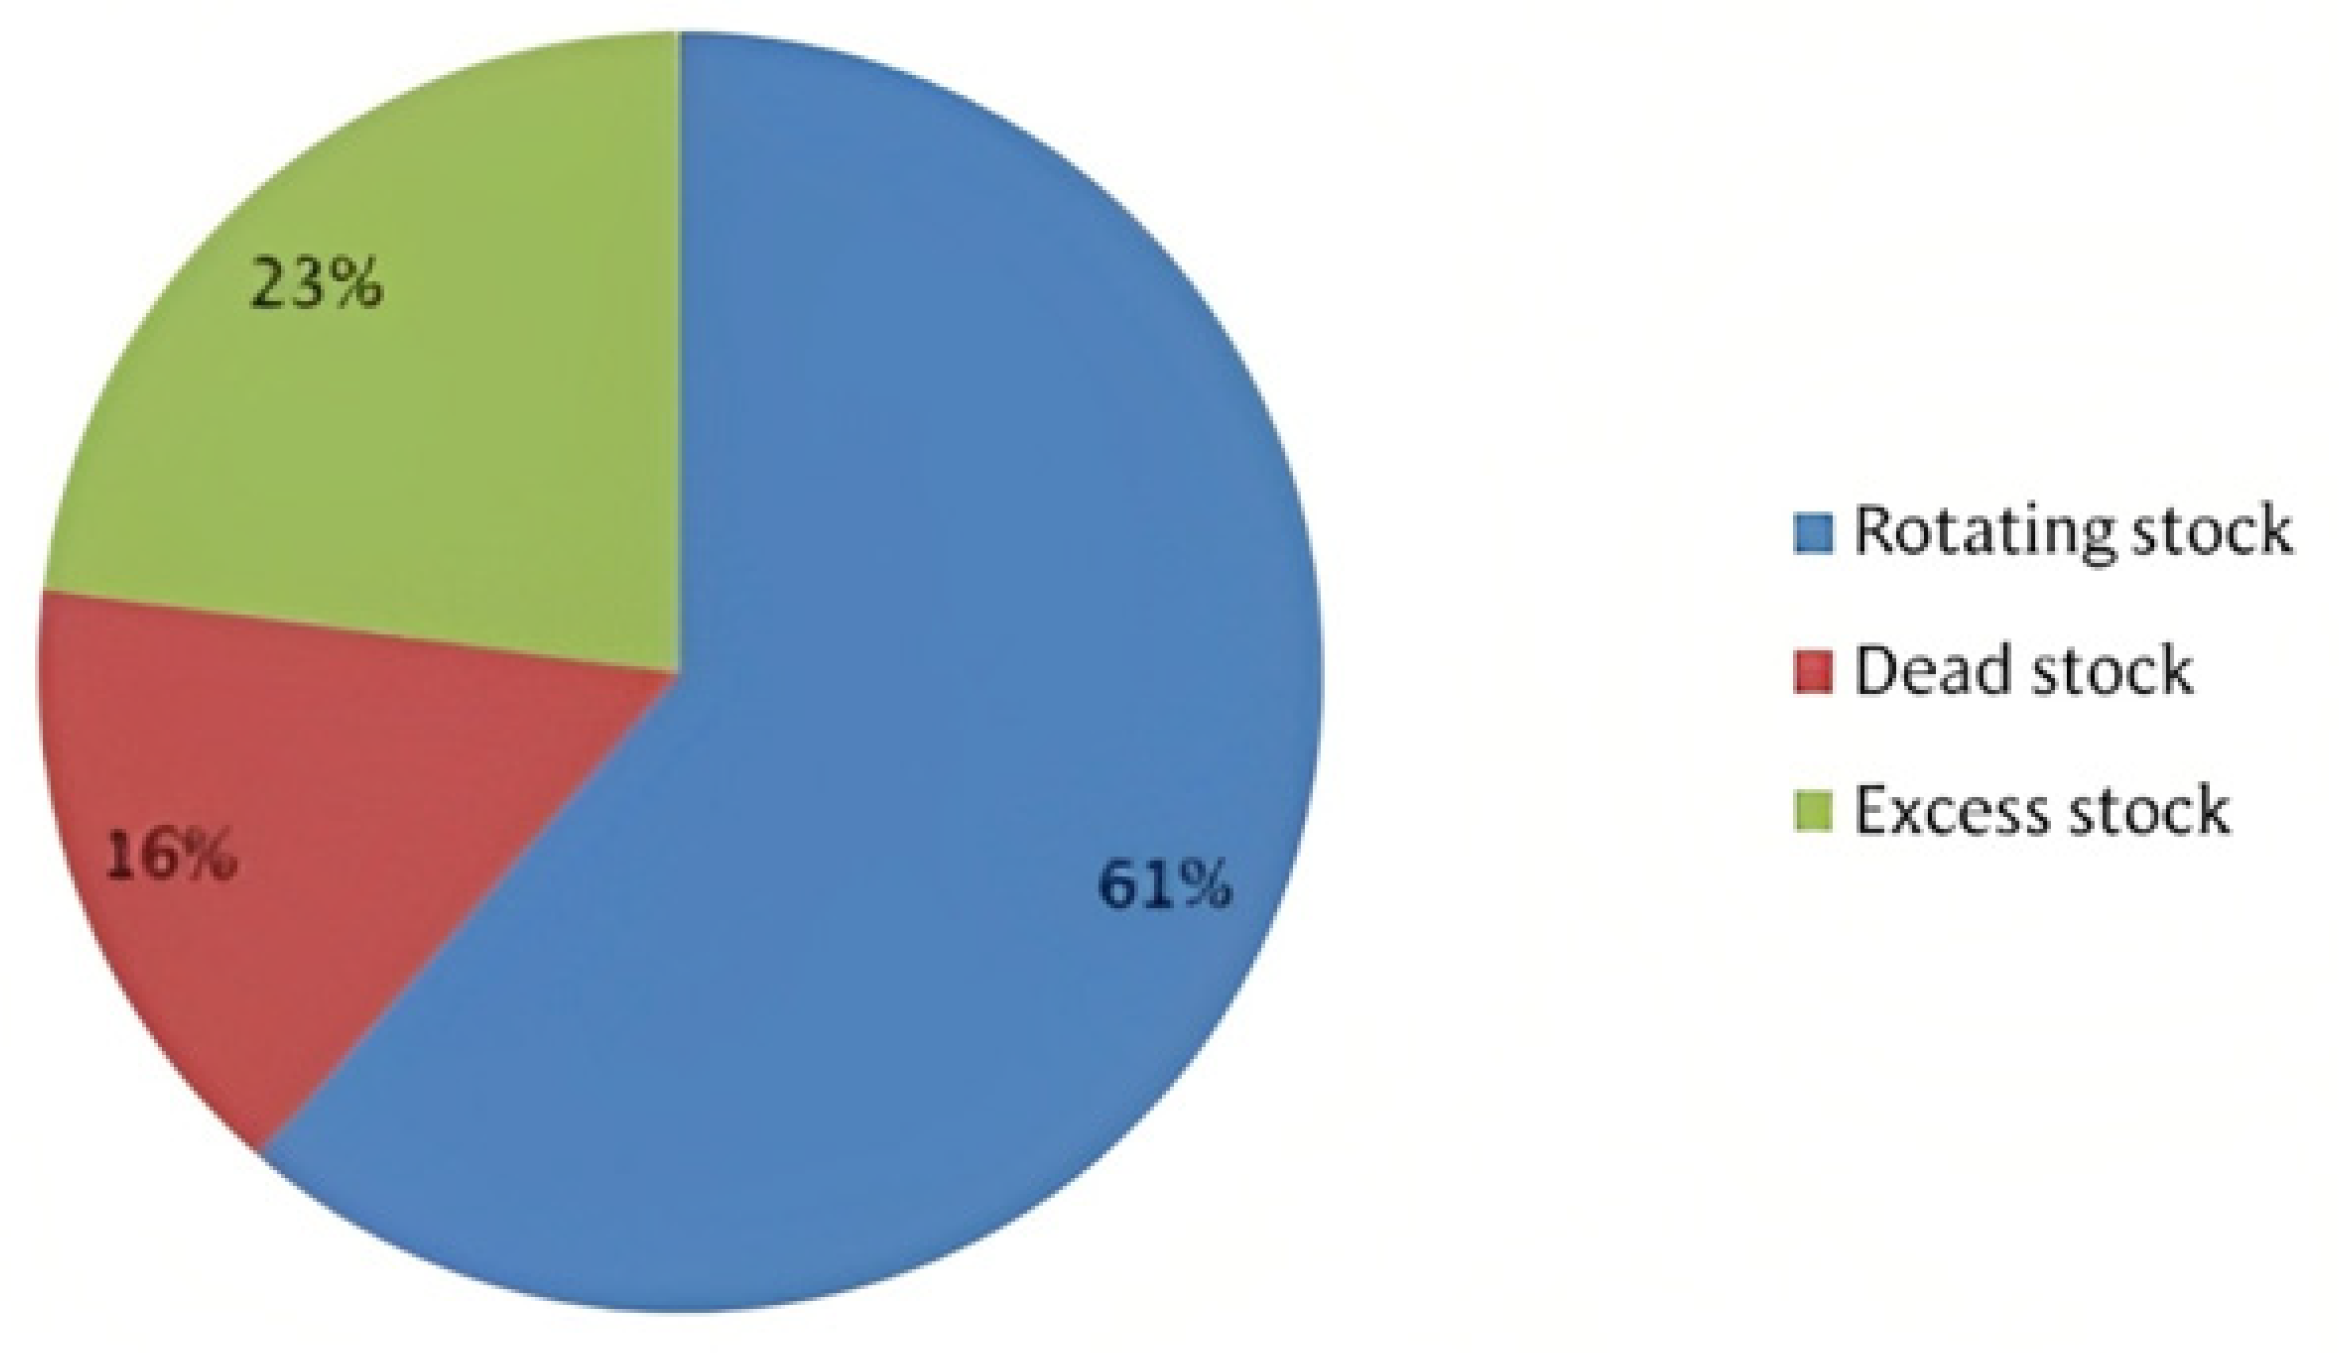
A shortage does not mean that the company does not have a surplus. For enterprises, inventory generally takes up between 10% and 40% of the working capital [2]. In this company, inventory takes up more than 30% of the working capital. In the graph in Figure 6, excess inventory accounts for 39% of the total inventory.

4.2. Model and Parameter Setting

To formulate the sustainable lot size optimization problem, we adopted a mathematical model that considered both the economic costs and environmental impacts. The objective was to determine the optimal lot size at each stage of the supply chain that minimizes the CO2 emissions and overall costs. The model incorporates various constraints such as production, inventory constraints, and demand satisfaction requirements. In addition, specific sustainability constraints were included to prevent the maximum allowable CO2 emissions associated with manufacturing, transportation, and storage activities. The audit process looks like a deterministic solution. Wisdom balances economic prosperity with environmental sustainability.
The company needs to minimize shortages, maximize excess inventory, and choose the optimal quantity for the lot size. Once the customer demand arrives, the shortage inventory must be checked to start production or make the order quantity decision to place the order. The remaining inventory represents the backlog, which should be checked to avoid excess inventory and plan actions to reduce it if attempted. The flowchart in Algorithm 1 represents a model for an optimized inventory process.
T C = C c D Q + C p P ( Q + S S ) 2 + p A D Q + C e D Q
F [TC] = Total Cost [Cc, Q, D, Cp, SS, A, Ce, P, p]
where:
Cc: Order cost/unit;
Cp: Holding cost/unit;
P: Price;
p: Shortage cost/unit;
A: Expected shortage/cycle;
D: Annual demand;
Ce: Footprint emission cost;
Q: Quantity;
SS: Shortage;
TC: Total cost;
F [TC]: Objective function for lot size.

4.3. Algorithm and Parameter Setting

We used the heuristic butterfly algorithm (BA) introduced in Section 3.3 to solve the problem of consistent lot size optimization. The algorithm was implemented using the programming language Python on a computer system equipped with an Intel Core i7 processor and 16 GB RAM.
The BA parameter settings were as follows:
  • Population size: 8000
  • Number of iterations: 500
Based on the total cost model, the parametric for the butterfly algorithm (BA) application was turned on.

4.4. Experimental Environment

Lot size optimization is influenced by the demand data, which determines the number of items required to meet the customer demand. Variability and uncertainty in demand patterns influence the lot size decision-making process. Considering changes in demand and accurate forecasting, the optimal lot size can be identified to balance the customer satisfaction with inventory costs. Lot size optimization is considered as an important decision factor in terms of transportation costs. Larger lot sizes can increase the economies of scale and lower the transportation costs per unit, resulting in cost savings, but larger lot sizes can also increase the storage and warehousing costs to balance the transportation cost savings. Lot size optimization aims to reduce the inventory costs associated with storing and maintaining inventory levels. Higher lot sizes can increase the inventory holding costs due to longer storage periods. Smaller lot sizes place orders, often with setup costs, which should be considered. Upgrading lot sizes in a sustainable manner incorporates environmental considerations such as CO2 emissions. Increased transportation demand due to lot sizes can lead to increased CO2 emissions. By optimizing lot sizes, a balance can be achieved between the inventory costs, transportation costs, and CO2 emissions.
Combining the lot size optimization model with the BA algorithm enables the consideration of demand data, transportation costs, inventory costs, and CO2 emissions in the decision-making process This holistic approach helps to obtain lot sizes sustainability, which improves the diversity with business objectives and environmental considerations.
The tests were conducted using benchmark instances derived from real-world supply chain data. Models varied in the number of nodes, requirement structures, and products to represent different types of complexity.
BA performance was evaluated based on various metrics including solution quality, convergence speed, and computational efficiency. In order to provide a fair comparison, we compared the BA results with other state-of-the-art heuristic algorithms commonly used for lot size optimization such as genetic algorithm and particle swarm optimization.
Tests were repeated to ensure the reliability of the results, and the mean values were reported with standard deviations for a complete analysis.
Table 3, as an extraction, compares the TC values recommended by the butterfly algorithm with the initial values of the deterministic approach and optimal structure.

4.5. Results and Analysis

The obtained results were presented and analyzed in terms of the solution quality, convergence speed, and computational efficiency. We compared BA with other heuristic algorithms in benchmark instances to evaluate its performance and superiority.
The evaluation included a detailed analysis of the quality of the solutions achieved by BA in terms of the total cost and a reduction in CO2. We provide a comparison of results obtained with BA and other algorithms and highlight the advantages of our proposed method. Furthermore, we examined the convergence behavior of BA. The butterfly algorithm produced the best solution six out of ten times, or 60%, according to the table’s findings. Nevertheless, it demonstrates the butterfly’s effectiveness in enhancing our objective function (TC).

4.6. Managerial Insights

The sustainable lot size optimization model presented in this study provides valuable insights for managers in the supply chain industry. Incorporating economic costs and environmental impacts, the model provides a comprehensive framework for decision-making that balances economic efficiency with sustainability objectives.
One key managerial insight from our study is the trade-off between cost reduction and CO2 reduction. The model enables decision-makers to assess the impact of various production and transport options on economic growth and environmental sustainability. Considering these trade-offs empowers managers to identify optimal lot sizes at every stage of the supply chain, reducing CO2 emissions and costs, thereby encouraging sustainable development actions.
Furthermore, the model highlights the importance of collaboration, especially collaboration between supply chain partners. By sharing information, coordinating production processes, and establishing sustainability goals, supply partners can jointly produce lot sizes more efficiently and reduce the environmental impact. Such collaboration can result in significant cost savings and environmental benefits as well as improved overall supply chain performance.
The insights provided by this model can guide managers to make informed decisions about production scheduling, inventory management, and transportation strategies. By harnessing the power of the enhanced butterfly algorithm (BA) and applying the proposed sustainable lot size optimization model, managers can enforce sustainable practices in their supply chains, reduce costs, and increase their environmental performance.

5. Conclusions

In this article, a total cost model was established that considered many parameters such as the order cost per unit, holding cost per unit, price, shortage cost per unit, expected shortage per cycle, annual demand, footprint emission cost, quantity, and shortage by using the total cost formula. The algorithm of butterfly optimization was applied to the total cost and utilized to resolve the inventory model. These models were applied using a numerical example at an aeronautics company. The two models were compared, and it was found that the butterfly algorithm decreased the cost. Although the inventory problem is a classic issue, the application of new algorithms in this area is beneficial, especially when implemented with real-life data for an industrial organization affected by this problem. The lot size of the proposed model covered the forecast without over- or under-coverage, which gives it an advantage over the ones currently used. The suggested solution can assist inventory management professionals in working with stochastic demand, which is the decision-maker’s goal in determining the level of service provided to customers. The desire and acceptance of change for businesses that use simple models without taking stochastic demand and other variables into account is the work’s main constraint. This project offers the chance to apply and contrast this subject with other new metaheuristics for inventory optimization to identify a perfect solution using these algorithms to optimize a model, taking into account the environmental impact. A study that splits slow- and fast-moving items with the contribution of the optimization algorithm could also be an extension of this work.

6. Future Research

In this study, we demonstrated the effectiveness of the butterfly algorithm (BA) in addressing the sustainable lot size optimization problem. However, there are many other advanced optimization algorithms available that hold potential for further enhancing decision-making in challenging problem domains. In future research, we encourage exploring a broader range of optimization techniques including hybrid heuristics and metaheuristics, adaptive algorithms, self-adaptive algorithms, and island algorithms to tackle various decision problems across different domains. The importance of advanced optimization algorithms extends beyond the specific decision problem addressed in this study and has found applications in diverse areas such as online learning, scheduling, multi-objective optimization, transportation, medicine, data classification, and more [86,87,88]. The effectiveness of these advanced algorithms in different domains and their potential applications for the sustainable lot size optimization problem is being explored.
For example, recent studies have shown the success of algorithms like the self-adaptive fast fireworks algorithm [88], the adaptive polyploid memetic algorithm [89], and the diffused memetic optimizer [90] in addressing various optimization challenges. Evaluating how these algorithms fare against the BA for the sustainable lot size optimization problem could provide valuable insights into their respective strengths and weaknesses. Furthermore, research can be conducted to explore novel hybrid approaches that combine the strengths of different algorithms to achieve even better results. For instance, integrating the BA with other optimization techniques could lead to more robust and efficient solutions.

Author Contributions

Conceptualization, Z.B.; Methodology, W.F.; Formal analysis, W.F. and M.A.; Investigation, M.A. and M.E.; Data curation, W.F. and M.E.; Writing—original draft, Z.B., W.F. and I.J.; Writing—review & editing, Z.B.; Supervision, M.B. All authors have read and agreed to the published version of the manuscript.

Funding

This research received no external funding.

Institutional Review Board Statement

Not applicable.

Informed Consent Statement

Not applicable.

Data Availability Statement

Not applicable.

Conflicts of Interest

The authors declare no conflict of interest.

References

  1. Xu, L.D.; Xu, E.L.; Li, L. Industry 4.0: State of the art and future trends. Int. J. Prod. Res. 2018, 56, 2941–2962. [Google Scholar] [CrossRef] [Green Version]
  2. Benmamoun, Z.; Hachimi, H.; Amine, A. Comparison of Inventory Models for Optimal Working Capital; Case of Aeronautics Company. Int. J. Eng. 2018, 31, 605–611. [Google Scholar]
  3. Harris, F.W. How many parts to make at once. Fact. Mag. Manag. 1913, 10, 135–136. [Google Scholar] [CrossRef]
  4. Sboui, S. Unsold and Excess Inventory: Between optimization and management: A New challenge for the Supply Chain Management. In Proceedings of the 2006 International Conference on Service Systems and Service Management, Troyes, France, 25–27 October 2006; pp. 283–289. [Google Scholar]
  5. Benmamoun, Z.; Hachimi, H.; Amine, A. Green logistics practices. In Proceedings of the 2017 International Renewable and Sustainable Energy Conference (IRSEC), Tangier, Morocco, 4–7 December 2017; pp. 1–5. [Google Scholar]
  6. Cherrafi, A.; Elfezazi, S.; Chiarini, A.; Mokhlis, A.; Benhida, K. The integration of lean manufacturing, Six Sigma and sustainability: A literature. J. Clean. Prod. 2016, 139, 828–846. [Google Scholar] [CrossRef]
  7. Baryannis, G.; Dani, S.; Antoniou, G. Predicting supply chain risks using machine learning: The trade-off between performance and interpretability, Future Gener. Comput. Syst. 2019, 101, 993–1004. [Google Scholar] [CrossRef]
  8. Tseng, M.-L.; Islam, M.S.; Karia, N.; Fauzi, F.A.; Afrin, S. A literature review on green supply chain management: Trends and future challenges. Resour. Conserv. Recycl. 2019, 141, 145–162. [Google Scholar] [CrossRef]
  9. Elkhechafi, M.; Benmamoun, Z.; Hachimi, H.; Amine, A.; Elkettani, Y. Firefly Algorithm for Supply Chain Optimization. Lobachevskii J. Math. 2018, 39, 355–367. [Google Scholar] [CrossRef]
  10. Mujkic, Z.; Qorri, A.; Kraslawski, A. Sustainability and Optimization of Supply Chains: A Literature Review. OSCM Int. J. 2018, 11, 186–199. [Google Scholar] [CrossRef] [Green Version]
  11. Bressanelli, G.; Perona, M.; Saccani, N. Challenges in supply chain redesign for the Circular Economy: A literature review and a multiple case study. Int. J. Prod. Res. 2019, 57, 7395–7422. [Google Scholar] [CrossRef] [Green Version]
  12. Ghobakhloo, M. Industry 4.0, digitization, and opportunities for sustainability. J. Clean. Prod. 2020, 252, 119869. [Google Scholar] [CrossRef]
  13. Plambeck, E.L. Reducing greenhouse gas emissions through operations and supply chain management. Energy Econ. 2012, 34, S64–S74. [Google Scholar] [CrossRef]
  14. Lin, C.; Choy, K.L.; Ho, G.T.; Chung, S.H.; Lam, H.Y. Survey of green vehicle routing problem: Past and future trends. Expert Syst. Appl. 2014, 41, 1118–1138. [Google Scholar] [CrossRef]
  15. Edwards, J.; McKinnon, A.; Cullinane, S. Comparative carbon auditing of conventional and online retail supply chains: A review of methodological issues. Supply Chain Manag. Int. J. 2011, 16, 57–63. [Google Scholar] [CrossRef]
  16. Jensen, J.K. Product carbon footprint developments and gaps. Int. J. Phys. Distrib. Logist. Manag. 2012, 42, 338–354. [Google Scholar] [CrossRef]
  17. Gaussin, M.; Hu, G.; Abolghasem, S.; Basu, S.; Shankar, M.R.; Bidanda, B. Assessing the environmental footprint of manufactured products: A survey of current literature. Int. J. Prod. Econ. 2013, 146, 515–523. [Google Scholar] [CrossRef]
  18. Subramanian, N.; Gunasekaran, A. Cleaner supply-chain management practices for twenty-first-century organizational competitiveness: Practice-performance framework and research propositions. Int. J. Prod. Econ. 2015, 164, 216–233. [Google Scholar] [CrossRef]
  19. Jemai, J.; Chung, B.D.; Sarkar, B. Environmental effect for a complex green supply-chain management to control waste: A sustainable approach. J. Clean. Prod. 2020, 278, 12219. [Google Scholar] [CrossRef]
  20. Yadav, D.; Kumari, R.; Kumar, N.; Sarkar, B. Reduction of waste and carbon emission through the selection of items with cross-price elasticity of demand to form a sustainable supply chain with preservation technology. J. Clean. Prod. 2020, 297, 126298. [Google Scholar] [CrossRef]
  21. Sarkar, B.; Sarkar, M.; Ganguly, B.; Cárdenas-Barrón, L.E. Combined effects of carbon emission and production quality improvement for fixed lifetime products in a sustainable supply chain management. Int. J. Prod. Econ. 2021, 231, 107867. [Google Scholar] [CrossRef]
  22. Vandana; Singh, S.R.; Yadav, D.; Sarkar, B.; Sarkar, M. Impact of energy and carbon emission of a supply chain management with two-level trade-credit policy. Energies 2021, 14, 1569. [Google Scholar] [CrossRef]
  23. Husna, A.; Amin, S.H.; Shah, B. Demand Forecasting in Supply Chain Management Using Different Deep Learning Methods. In Demand Forecasting and Order Planning in Supply Chains and Humanitarian Logistics; IGI Global: Hershey, PA, USA, 2021; pp. 140–170. [Google Scholar]
  24. Wagner, H.M.; Whitin, T.M. Dynamic version of the economic lot size model. Manag. Sci. 1958, 5, 89–96. [Google Scholar] [CrossRef]
  25. Suprayoga, G.B.; Witte, P.; Spit, T. Identifying barriers to implementing a sustainability assessment tool for road project planning:An institutional perspective from practitioners in Indonesia. J. Environ. Plan. Manag. 2020, 63, 2380–2401. [Google Scholar] [CrossRef]
  26. Robinson, K.F.; Fuller, A.K.; Stedman, R.C.; Siemer, W.F.; Decker, D.J. Integration of social and ecological sciences for natural resource decision making: Challenges and opportunities. Environ. Manag. 2019, 63, 565–573. [Google Scholar] [CrossRef] [PubMed]
  27. Poplawska, J.; Labib, A.; Reed, D.M. From vicious to virtuous circles: Problem structuring for quantified decision making in operationalization of corporate social responsibility. J. Oper. Res. Soc. 2017, 68, 291–307. [Google Scholar] [CrossRef] [Green Version]
  28. Zadjafar, M.A.; Gholamian, M.R. A sustainable inventory model by considering environmental ergonomics and environmental pollution, case study: Pulp and paper mills. J. Clean. Prod. 2018, 199, 444–458. [Google Scholar] [CrossRef]
  29. Elkington, J. Partnerships from cannibals with forks: The triple bottom line of 21st-century business. Environ. Qual. Manag. 1998, 8, 37–51. [Google Scholar] [CrossRef]
  30. Yıldızbaşi, A.; Öztürk, C.; Efendioğlu, D.; Bulkan, S. Assessing the social sustainable supply chain indicators using an integrated fuzzy multi-criteria decision-making method: A case study of Turkey. Environ. Dev. Sustain. 2021, 23, 4285–4320. [Google Scholar] [CrossRef]
  31. Raza, F.; Alshameri, B.; Jamil, S.M. Assessment of triple bottom line of sustainability for geotechnical projects. Environ. Dev. Sustain. 2021, 23, 4521–4558. [Google Scholar] [CrossRef]
  32. Bouazza, S.; Benmamoun, Z.; Hachimi, H. Maritime Bilateral Connectivity Analysis for Sustainable Maritime Growth: Case of Morocco. Sustainability 2023, 15, 4993. [Google Scholar] [CrossRef]
  33. Benchekroun, H.T.; Benmamoun, Z.; Hachimi, H. Implementation and Sustainability Assessment of a Public Procurement Strategy. Sustainability 2022, 14, 15565. [Google Scholar] [CrossRef]
  34. Jokar, A.; Hosseini-Motlagh, S.-M. Simultaneous coordination of order quantity and corporate social responsibility in a two- Echelon supply chain: A combined contract approach. J. Oper. Res. Soc. 2020, 71, 69–84. [Google Scholar] [CrossRef]
  35. Karaboga, D.; Basturk, B. A powerful and efficient algorithm for numerical function optimization: Artificial bee colony (abc) algorithm. J. Glob. Optim. 2007, 39, 459–471. [Google Scholar] [CrossRef]
  36. Storn, R.; Price, K. Differential evolution-a simple and efficient heuristic for global optimization over continuous spaces. J. Glob. Optim. 1997, 11, 341–359. [Google Scholar] [CrossRef]
  37. Yang, X.-S.; Deb, S. Cuckoo search via lévy flights. In Proceedings of the World Congress on Nature and Biologically Inspired Computing, NaBIC 2009, Coimbatore, India, 9–11 December 2009; pp. 210–214. [Google Scholar]
  38. Yang, X.-S. Firefly algorithm, levy flights and global optimization. In Research and Development in Inteligent Systems XXVI; Bramer, M., Ellis, R., Petridis, M., Eds.; Springer: Berlin, Germany, 2010; pp. 209–218. [Google Scholar]
  39. Goldberg, D.E.; Holland, J.H. Genetic algorithms and machine learning. Mach. Learn. 1988, 3, 95–99. [Google Scholar] [CrossRef]
  40. Eberhart, R.C.; Shi, Y. Particle swarm optimization: Developments, applications and resources. In Proceedings of the 2001 Congress on Evolutionary Computation, Seoul, Republic of Korea, 27–30 May 2001; Volume 1, pp. 81–86. [Google Scholar]
  41. Wang, G.-G.; Deb, S.; Cui, Z. Monarch butterfly optimization. Neural Comput. Appl. 2015, 31, 1995–2014. [Google Scholar] [CrossRef] [Green Version]
  42. Karaboga, D.; Basturk, B. On the performance of artificial bee colony (abc) algorithm. Appl. Soft Comput. 2008, 8, 687–697. [Google Scholar] [CrossRef]
  43. Gandomi, A.H.; Yang, X.-S.; Alavi, A.H. Cuckoo search algorithm: A metaheuristic approach to solve structural optimization problems. Eng. Comput. 2013, 29, 17–35. [Google Scholar] [CrossRef]
  44. Arora, S.; Singh, S. A conceptual comparison of firefly algorithm, bat algorithm and cuckoo search. In Proceedings of the 2013 International Conference on Control Computing Communication and Materials (ICCCCM), Allahabad, India, 3–4 August 2013; pp. 1–4. [Google Scholar]
  45. Arora, S.; Singh, S. The firefly optimization algorithm: Convergence analysis and parameter selection. Int. J. Comput. Appl. 2013, 69, 48–52. [Google Scholar] [CrossRef]
  46. Gupta, S.; Arora, S. A hybrid firefly algorithm and social spider algorithm for multimodal function. Intell. Syst. Technol. Appl. 2015, 1, 17. [Google Scholar]
  47. Yang, X.-S. Firefly algorithms for multimodal optimization. In Stochastic algorithms: Foundations and Applications, SAGA 2009; Lecture Notes in Computer Science; Watanabe, O., Zeugmann, T., Eds.; Springer: Berlin/Heidelberg, Germany, 2009; Volume 5792. [Google Scholar]
  48. Holland, J.H. Adaptation in Natural and Artificial Systems: An Introductory Analysis with Applications to Biology, Control, and Artificial Intelligence; MIT Press: Cambridge, MA, USA, 1992. [Google Scholar]
  49. Kennedy, J. Particle swarm optimization. In Encyclopedia of Machine Learning; Sammut, C., Webb, G.I., Eds.; Springer: Boston, MA, USA, 2010. [Google Scholar]
  50. Arora, S.; Singh, S. Butterfly algorithm with l’evy flights for global optimization. In Proceedings of the 2015 International Conference on Signal Processing, Computing and Control (ISPCC), Waknaghat, India, 24–26 September 2015. [Google Scholar]
  51. RBlair, B.; Launer, A.E. Butterfly diversity and human land use: Species assemblages along an urban grandient. Biol. Conserv. 1997, 80, 113–125. [Google Scholar]
  52. Arora, S.; Singh, S. Butterfly optimization algorithm: A novel approach for global optimization. Soft Comput. 2019, 23, 715–734. [Google Scholar] [CrossRef]
  53. Arora, S.; Singh, S.; Yetilmezsoy, K. A modified butterfly optimization algorithm for mechanical design optimization problems. J. Braz. Soc. Mech. Sci. Eng. 2018, 40, 21. [Google Scholar] [CrossRef]
  54. Feng, Y.; Wang, G.-G.; Li, W.; Li, N. Multi-strategy monarch butterfly optimization algorithm for discounted {0–1} knapsack problem. Neural Comput. Appl. 2018, 30, 3019–3036. [Google Scholar] [CrossRef]
  55. Hu, H.; Cai, Z.; Hu, S.; Cai, Y.; Chen, J.; Huang, S. Improving monarch butterfly optimization algorithm with self-adaptive population. Algorithms 2018, 11, 71. [Google Scholar] [CrossRef] [Green Version]
  56. Singh, B.; Anand, P. A novel adaptive butterfly optimization algorithm. Int. J. Comput. Mater. Sci. Eng. 2018, 7, 4. [Google Scholar] [CrossRef]
  57. Dhanya, K.M.; Kanmani, S. Mutated butterfly optimization algorithm. Int. J. Eng. Adv. Technol. 2019, 8, 375–381. [Google Scholar]
  58. Li, G.; Shuang, F.; Zhao, P.; Le, C. An improved butterfly optimization algorithm for engineering design problems using the cross-entropy method. Symmetry 2019, 11, 1049. [Google Scholar] [CrossRef] [Green Version]
  59. Sharma, T.K.; Sahoo, A.K.; Goyal, P. Bidirectional butterfly optimization algorithm and engineering applications. Mater. Today: Proc. 2019, 34, 736–741. [Google Scholar] [CrossRef]
  60. Sun, L.; Chen, S.; Xu, J.; Tian, Y.; Zhou, Y. Improved Monarch Butterfly Optimization Algorithm Based on Opposition-Based Learning and Random Local Perturbation. Complexity 2019, 2019, 4182148. [Google Scholar] [CrossRef] [Green Version]
  61. Yazdani, S.; Hadavandi, E. LMBO-DE: A linearized monarch butterfly optimization algorithm improved with differential evolution. Soft Comput. 2019, 23, 8029–8043. [Google Scholar] [CrossRef]
  62. Sharma, S.; Saha, A.K. m-MBOA: A novel butterfly optimization algorithm enhanced with mutualism scheme. Soft Comput. 2020, 24, 4809–4827. [Google Scholar] [CrossRef]
  63. Tubishat, M.; Alswaitti, M.; Mirjalili, S.; Al-Garadi, M.A.; Alrashdan, M.T.; Rana, T.A. Dynamic butterfly optimization algorithm for feature selection. IEEE Access 2020, 8, 194303–194314. [Google Scholar] [CrossRef]
  64. Utama, D.M.; Widodo, D.S.; Ibrahim, M.F.; Dewi, S.K. A New Hybrid Butterfly Optimization Algorithm for Green Vehicle Routing Problem. J. Adv. Transp. 2020, 2020, 8834502. [Google Scholar] [CrossRef]
  65. Zhang, M.; Long, D.; Qin, T.; Yang, J. A chaotic hybrid butterfly optimization algorithm with particle swarm optimization for high-dimensional optimization problems. Symmetry 2020, 12, 1800. [Google Scholar] [CrossRef]
  66. Zhi, Y.; Wang, W.; Wang, H.; Khodaei, H. Improved butterfly optimization algorithm for CCHP driven by PEMFC. Appl. Therm. Eng. 2020, 173, 114766. [Google Scholar] [CrossRef]
  67. Hu, K.; Jiang, H.; Ji, C.-G.; Pan, Z. A modified butterfly optimization algorithm: An adaptive algorithm for global optimization and the support vector machine. Expert Syst. 2021, 38, e12642. [Google Scholar] [CrossRef]
  68. Geetha, J.; Raja, J.B. An Advanced Circular Adaptive Search Butterfly Optimization Algorithm for the CNN-based Sleep Apnea Detection Approach. IETE J. Res. 2022. [Google Scholar] [CrossRef]
  69. Long, W.; Jiao, J.; Wu, T.; Xu, M.; Cai, S. A balanced butterfly optimization algorithm for numerical optimization and feature selection. Soft Comput. 2022, 26, 11505–11523. [Google Scholar] [CrossRef]
  70. Rajesh, B.M.; Thanamani, A.S.; Chithra, B.; FinnyBelwin, A.; LindaSherin, A. Adaptive weight butterfly optimization algorithm (AWBOA) based cluster head selection (CHS) and optimized energy efficient cluster based scheduling (OEECS) approach in wireless sensor networks (WSNS). Int. J. Syst. Assur. Eng. Manag. 2022. [Google Scholar] [CrossRef]
  71. Sahoo, A.K.; Panigrahi, T.K.; Das, S.R.; Behera, A. Chaotic Butterfly Optimization Algorithm Applied to Multi-objective Economic and Emission Dispatch in Modern Power System. Recent Adv. Comput. Sci. Commun. 2022, 15, 170–185. [Google Scholar] [CrossRef]
  72. Sharma, S.; Chakraborty, S.; Saha, A.K.; Nama, S.; Sahoo, S.K. mLBOA: A Modified Butterfly Optimization Algorithm with Lagrange Interpolation for Global Optimization. J. Bionic Eng. 2022, 19, 1161–1176. [Google Scholar] [CrossRef]
  73. Sihwail, R.; Solaiman, O.S.; Ariffin, K.A.Z. New robust hybrid Jarratt-Butterfly optimization algorithm for nonlinear models. J. King Saud Univ.—Comput. Inf. Sci. 2022, 34, 8207–8220. [Google Scholar] [CrossRef]
  74. Xu, H.; Lu, Y.; Guo, Q. Application of Improved Butterfly Optimization Algorithm Combined with Black Widow Optimization in Feature Selection of Network Intrusion Detection. Electronics 2022, 11, 3531. [Google Scholar] [CrossRef]
  75. Yadav, P.; Kumar, S.; Saini, D.K.J. A Novel Method of Butterfly Optimization Algorithm for Load Balancing in Cloud Computing. Int. J. Recent Innov. Trends Comput. Commun. 2022, 10, 110–115. [Google Scholar] [CrossRef]
  76. Rao, U.; Scheller-Wolf, A.; Tayur, S. Development of a rapid-response supply chain at Caterpillar. Oper. Res. 2000, 48, 189–204. [Google Scholar] [CrossRef] [Green Version]
  77. Benmamoun, Z.; Hachimi, H.; Amine, A. Inventory management optimization using lean six-sigma. In Proceedings of the International Conference on Industrial Engineering and Operations Management, Rabat, Morocco, 11–13 April 2017; pp. 1722–1730. [Google Scholar]
  78. Zhang, D.-Z.; Liu, X.-H.; Li, S.-Y. An optimization model for multi-period collaborative inventory control based on target performance management. In Proceedings of the 2012 IEEE 16th International Conference on Computer Supported Cooperative Work in Design (CSCWD), Wuhan, China, 23–25 May 2012. [Google Scholar]
  79. Caballero-Morales, S.-O.; Martínez-Flores, J.-L. Analysis and Reduction of CO2 Emissions and Costs Associated to Inventory Replenishment Strategies with Uncertain Demand. Polish J. Environ. Stud. 2020, 29, 3997–4005. [Google Scholar] [CrossRef]
  80. Benmamoun, Z.; Fethallah, W.; Bouazza, S.; Abdo, A.A.; Serrou, D.; Benchekroun, H. A framework for sustainability evaluation and improvement of radiology service. J. Clean. Prod. 2023, 401, 136796. [Google Scholar] [CrossRef]
  81. Ahlaqqach, M.; Benhra, J.; Mouatassim, S.; Lamrani, S. Closed loop location routing supply chain network design in the end of life pharmaceutical products. Supply Chain Forum 2020, 21, 79–92. [Google Scholar] [CrossRef]
  82. Zarbakhshnia, N.; Soleimani, H.; Goh, M.; Razavi, S.S. A novel multi-objective model for green forward and reverse logistics network design. J. Clean. Prod. 2019, 208, 1304–1316. [Google Scholar] [CrossRef]
  83. Bonilla-Enriquez, G.; Cano-Olivos, P.; Peng, L.Q.; Gan, W.; Martinez-Flores, J.L.; Partida, D.S. Modelling Sustainable Development Aspects within Inventory Supply Strategies. Model. Simul. Eng. 2021, 2021, 5232814. [Google Scholar] [CrossRef]
  84. Mortazavi, A.; Moloodpoor, M. Enhanced butterfly optimization algorithm with a new fuzzy regulator strategy and virtual butterfly concept. Knowl. Based Syst. 2021, 228, 107291. [Google Scholar] [CrossRef]
  85. Pasha, J.; Nwodu, A.L.; Fathollahi-Fard, A.M.; Tian, G.; Li, Z.; Wang, H.; Dulebenets, M.A. Exact and metaheuristic algorithms for the vehicle routing problem with a factory-in-a-box in multi-objective settings. Adv. Eng. Inform. 2022, 52, 101623. [Google Scholar] [CrossRef]
  86. Gholizadeh, H.; Fazlollahtabar, H.; Fathollahi-Fard, A.M.; Dulebenets, M.A. Preventive maintenance for the flexible flowshop scheduling under uncertainty: A waste-to-energy system. Environ. Sci. Pollut. Res. 2021, 1–20. [Google Scholar] [CrossRef]
  87. Singh, E.; Pillay, N. A study of ant-based pheromone spaces for generation constructive hyper-heuristics. Swarm Evol. Comput. 2022, 72, 101095. [Google Scholar] [CrossRef]
  88. Chen, M.; Tan, Y. SF-FWA: A Self-Adaptive Fast Fireworks Algorithm for effective large-scale optimization. Swarm Evol. Comput. 2023, 80, 101314. [Google Scholar] [CrossRef]
  89. Dulebenets, M.A. An Adaptive Polyploid Memetic Algorithm for scheduling trucks at a cross-docking terminal. Inf. Sci. 2021, 565, 390–421. [Google Scholar] [CrossRef]
  90. Dulebenets, M.A. A Diffused Memetic Optimizer for reactive berth allocation and scheduling at marine container terminals in response to disruptions. Swarm Evol. Comput. 2023, 80, 101334. [Google Scholar] [CrossRef]
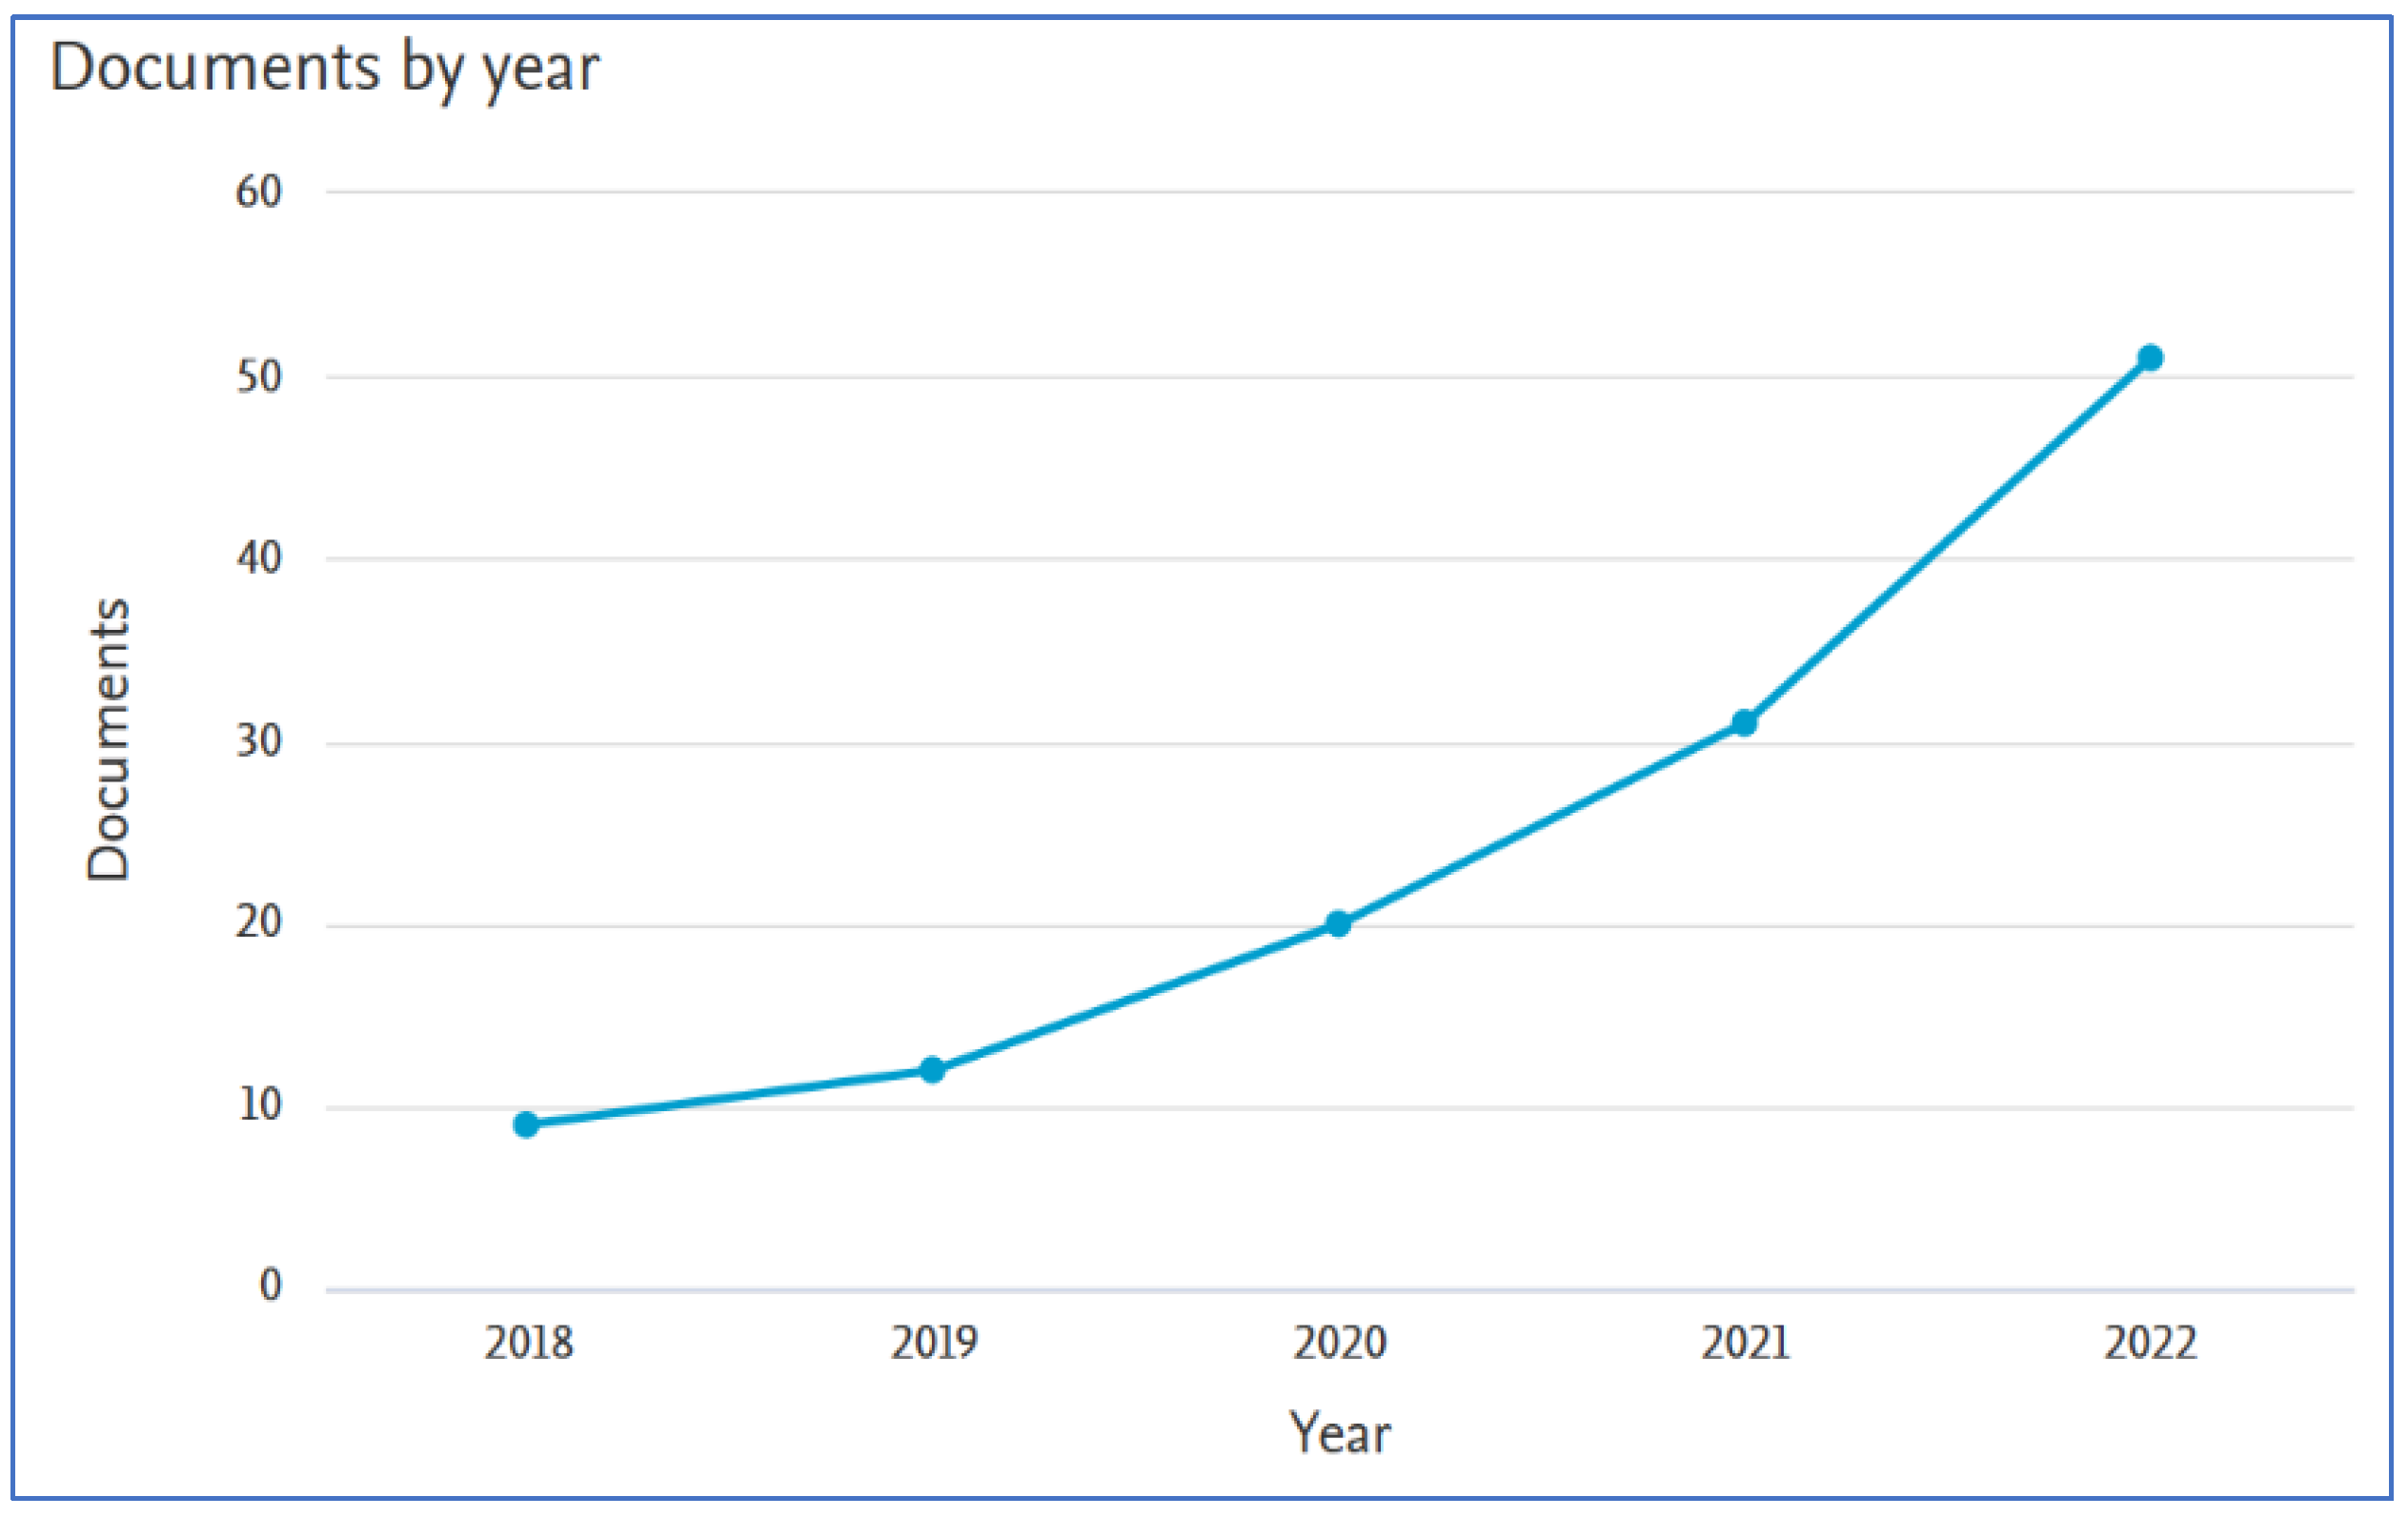
Figure 1. The annual number of publications subject to BA “2018–2022”.
Sustainability 15 11761 g001
Figure 2. Balance between working capital and cost reduction [78].
Sustainability 15 11761 g002
Figure 3. The virtual butterfly concept [85].
Sustainability 15 11761 g003
Figure 4. Butterfly algorithm flowchart.
Sustainability 15 11761 g004
Figure 5. Number of shortages per week.
Sustainability 15 11761 g005
Figure 6. Percentage of excess stock.
Sustainability 15 11761 g006
Table 1. Important butterfly algorithm optimizations cited from 2018 to 2022.
AuthorsYearJournalReview
Arora et al.2018Brazilian Society of Mechanical Sciences and EngineeringAn improved butterfly algorithm for the purpose of solving optimization issues in mechanical engineering [54].
Feng, Y., Wang et al.2018Neural Computing and ApplicationsDiscounted 0–1 knapsack issue optimization using a proposed improved-strategy monarch butterfly algorithm [55].
Hu, H., Cai, Z. et al.2018AlgorithmsEnhanced the algorithm for optimization of the monarch butterfly with a population that can adapt to itself [56].
Singh, B. and Anand, P.2018International Journal of Computational Materials Science and EngineeringA novel adaptive butterfly optimization algorithm [57].
Dhanya, K. M. et al.2019 International Journal of Engineering and Advanced TechnologyMutated butterfly optimization algorithm [58].
Li, G., Shuang et al.2019SymmetryApplied the cross-entropy approach, an enhanced butterfly algorithm for optimization of the design in engineering issues [59].
Sharma, T. K. et al.2019Materials Today: ProceedingsBidirectional butterfly optimization algorithm and engineering applications [60].
Sun, L. et al.2019ComplexityOn the basis of opposition-based learning and random local perturbation, a better algorithm for the monarch butterfly optimization method was developed [61].
Yazdani, S. et al.2019Soft ComputingA linear algorithm for monarch butterfly optimization using differential evolution (DE) is known as “LMBO-DE” [62].
Sharma, S. et al.2020 Soft Computingm-MBOA: A novel butterfly optimization algorithm enhanced with a mutualism scheme [63].
Tubishat, M., Alswaitti et al.2020IEEE AccessAlgorithm of dynamic butterfly optimization for the selection of features [64].
Utama, D. M. et al.2020Journal of Advanced TransportationA new hybrid butterfly optimization algorithm for green vehicle routing problem [65]
Zhang, M. et al.2020Symmetry The algorithm for a chaotic hybrid particle swarm optimization combined with the algorithm of butterfly optimization for highly dimensional optimization issues [66].
Zhi, Y., Weiqing et al.2020Applied Thermal EngineeringThe algorithm of butterfly optimization for CCHP powered by PEMFC improved [67].
Hu, K., Jiang et al. 2021Expert SystemsAn adjustable algorithm for assistance vector machines and global optimization [68].
Geetha, J. et al.2022IETE Journal of ResearchAn enhanced algorithm of butterfly optimization for circular adaptive searching for the CNN-based sleep apnea diagnosis method [69].
Long, W., Jiao et al.2022Soft ComputingAn algorithm balanced for feature selection and numerical optimization [70].
Rajesh, B. M. et al.2022System Assurance Engineering and Management International JournalCHS and OEECS techniques are both based on the algorithm of the adaptive weight butterfly optimization in wireless sensing networks [71].
Sahoo, A. K. et al.2022Recent Advances in Computer Science and CommunicationsMulti-objective economic and emission dispatching using the algorithm of chaotic butterfly optimization in an advanced power system [72].
Sharma, S. et al.2022Journal of Bionic EngineeringLagrange interpolation was added to a modified algorithm of butterfly optimization for overall optimization [73].
Sihwail, R. et al.2022King Saud University—Computer and Information SciencesA new efficient algorithm for hybrid Jarratt–butterfly optimization was used for nonlinear theories [74].
Xu, H., Lu, Y. et al. 2022Electronics (Switzerland)To choose attributes for the detection of network intrusions, an updated algorithm of butterfly optimization was paired with black widow optimization [75].
Yadav, P., Kumar et al.2022International Journal on Recent and Innovation Trends in Computing and CommunicationBalanced load in cloud-based computing using a new algorithm for butterfly optimization [76].
Table 2. Comparison of GA, PSO, and FA with BA.
FunctionGAPSO FABA
Michalewicz90,025 ± 8011 (93%)6012 ± 488 (99%)2890 ± 709 (100%)2898 ± 688 (100%)
Rosenbrock55,644 ± 8973 (89%)34,312 ± 5015 (97%)6121 ± 501 (100%)6023 ± 420 (100%)
De Jong26,355 ± 1025 (98%)17,144 ± 2126 (100%)5701 ± 706 (100%)5688 ± 696 (100%)
Schwefel206,005 ± 8321 (95%)261,333 ± 1188 (99%)79,961 ± 3536 (97%)7920 ± 521 (100%)
Ackley36,356 ± 3422 (91%)2720 ± 4356 (98%)4398 ± 2730 (100%)4388 ± 2680 (100%)
Rastrigin112,265 ± 6089 (75%)77,323± 3025 (92%)12,055 ± 3830 (100%)9005 ± 859 (100%)
Easom20,036 ± 3405 (93%)16,418± 2011 (98%)14,042 ± 2550 (95%)6100 ±1598 (100%)
Griewank68,863 ± 7704 (94%)54,800± 3966 (95%)13,995 ± 4973 (97%)10,800 ± 2950 (100%)
Yang37,198 ± 7625 (90%)20,004± 3104 (98%)5162 ± 2485 (100%)5122 ± 2456 (100%)
Shubert55,144 ± 5001 (91%)24,885 ± 3536 (93%)9937 ± 2510 (100%)9907 ± 2517 (100%)
Table 3. Comparison of results.
PartTCTC_FireflyIC_ButterflyTC_PSOTC_GABest Value
Part11,015,112518,627.74508,627.74519,663.74508,827.74BOA
Part295,241.9849,564.1749,526.0249,487.8649,487.86GA
Part3392,067.8211,768.25212,460.96211,868.25211,968.25FA
PART4479,668.83258,055.98371,729.62257,477.24257,477.24PSO
Part51,021,387.52511,322.56511,398.78511,412.565,034,696.40GA
Part61,679,063.76855,397.67845,090.37855,397.67855,397.67BOA
Part7517,979.04275,045.63276,286.56275,005.22275,115.22PSO
Part8125,647.7267,256.036618.3871,309.4567,256.03BOA
Part95607.995132.905049.095060.585051.09BOA
Part10 90,380.6255,253.9747,419.4647,526.4647,623.46BOA
Disclaimer/Publisher’s Note: The statements, opinions and data contained in all publications are solely those of the individual author(s) and contributor(s) and not of MDPI and/or the editor(s). MDPI and/or the editor(s) disclaim responsibility for any injury to people or property resulting from any ideas, methods, instructions or products referred to in the content.