Article

Preliminary Experimental Laboratory Methods to Analyse the Insulation Capacity of Vertical Greening on Temperature and Relative Humidity

1
Antwerp Cultural Heritage Sciences (ARCHES), Faculty of Design Sciences, University of Antwerp, Mutsaardstraat 31, 2000 Antwerp, Belgium
2
Institute for Sustainable Heritage, University College London, Central House, 14 Upper Woburn Pl, London WC1H 0NN, UK
*
Author to whom correspondence should be addressed.
Sustainability 2023, 15(15), 11758; https://doi.org/10.3390/su151511758
Submission received: 4 July 2023 / Revised: 17 July 2023 / Accepted: 18 July 2023 / Published: 30 July 2023
(This article belongs to the Special Issue Advances in Nature-Based Solutions for Sustainable Green Buildings)

Abstract

:
Ground-based vertical greening is one of the well-known nature-based solutions that is widely used in city centres due to its small footprint and the large surface area of vegetation. Although the impact of vertical greening on the local microclimate has already been extensively researched, there is a poor understanding of the impact of vertical greening on historic building fabrics. The impact of vertical greening on microclimate environments has primarily been researched through in situ case-study monitoring; as such, there are currently no standard protocols for investigating this impact in laboratory studies. By performing simulations in controlled laboratory conditions, the influence of vertical greening on specific environmental conditions can be assessed as well as the significance for key mechanisms, such as the insulation capacity of a vegetation layer. Experimental results on the insulation capacity of vertical greening illustrate that the presence of vertical greening reduces the rate of heat exchange between the wall and the surrounding environment compared to the bare wall, resulting in a delayed temperature response of the wall. This delay varies across the seasons or its intensity, which is represented, for instance, by a more pronounced delay in the wall’s surface temperature response in summer than in winter. However, the magnitude of the insulation capacity is more pronounced in winter (up to +2.1 °C) compared to summertime. The insulation capacity of vertical greening is more likely to have a significant impact on façades with a lack of solar irradiation, such as façades facing north or shaded by built surroundings. This experimental investigation can help build an understanding of these processes more fundamentally and support the interpretation of in situ case-study monitoring as well as provide a standardized approach to investigate the environmental performance of vertical greening across climatic regions and seasons.

1. Introduction

Nature-based Solutions (NbS) are widely implemented in cities to mitigate the urban heat island effect. There are two types of nature-based solutions that can be differentiated: water-based and plant-based solutions. Some examples of plant-based nature-based solutions are vertical greening, green roads, parks, etc., while water-based solutions are ponds and rain gardens. [1,2,3].
One of the most favourable green initiatives in urban centres is ground-based vertical greening, as it is able to cover a large surface area of greening with only a small footprint [4,5,6,7]. Previous research acknowledges that ground-based vertical greening uses several mechanisms to mitigate the local environment [8]. Koch et al. (2020) differentiated three mechanisms caused by the presence of vertical greening that determine the impact of vertical greening on the local environment: transpiration, shading, and insulation. The transpiration process of plants cools the environment by releasing oxygen in a gaseous form through the stomata of their leaves. This process can only occur when plants are subjected to solar irradiation. A low amount of moisture in the environment, associated with a warm environment, accelerates the cooling rate of the environment [8,9,10]. The shading effect of the wall is caused by the extra layer of vegetation in front of the wall and provides a lower surface temperature at the underlaying wall during the heating process of the wall relative to a corresponding bare wall while exposed to solar irradiation. The insulation effect is a mechanism whereby the extra layer of vertical greening hinders the heat exchange between the wall and the environment, decelerating the heat exchange rate of the wall behind the vertical greening relative to a corresponding bare wall [8].
In current urban environments, built heritage is, due to its centrality, geographically well positioned to contribute to tackling broader sustainable challenges such as the urban heat island effect by incorporating green initiatives, and hence able to mitigate the increasing risk of various degradation processes due to a changing microclimate. However, even though the impact of vertical greening on the local microclimate is well known, the impact of vertical greening on historic fabric is poorly understood.
Most of the time, the impact of vertical greening on the local microclimate is investigated through in situ monitoring, as there are currently no standard approaches for laboratory experiments of these processes. Several studies scope various significant parameters affected by the implementation of vertical greening: Kenai et al. (2021) illustrated that vertical greening can lower the surface temperatures up to −28 °C relative to the bare wall, especially on surfaces receiving a high amount of solar irradiation, due to the shadow effect and evaporation of plants; Sternberg et al. (2010) showed that vertical greening can lower the surrounding air pollution by, for example, 40.4% of PM2.5 due to the characteristics of plants, such as surface roughness or the surface area of leaves; Koyama et al. (2013) showed that vertical greening can lower the air temperature up to −11.3 °C, which improves the comfort of people in the city and the urban heat island effect [11,12,13]. However, to foster an understanding of the mechanism responsible for the global impact of vertical greening on the local microclimate, laboratory studies are one of the methods to investigate this.
Therefore, this paper sets out a preliminary experimental laboratory method to analyse the impact of vertical greening on specific environmental conditions such as temperature and relative humidity. The following experiments can help us understand the mechanisms determining the environmental impact of vertical greening, such as the insulation effect of vertical greening, and create more understanding in the interpretation of in situ monitoring. The laboratory investigation in controlled climate conditions allows repeated tests to be conducted, which minimizes the impact of the stochasticity of the processes, reproducing certain climate events and controlling certain boundary conditions, such as the distance between the green layer and the wall surface. The opportunities arising from a laboratory-based approach enables this paper to explore how boundary conditions such as seasonality and its intensity affect the insulation capacity of vertical greening on surface temperature and relative humidity. This could provide us the first steps to a standardized approach to investigate the environmental performance of vertical greening across climates and seasons.

2. Materials and Methods

2.1. Equipment

The laboratory experiments are performed in an environmental chamber (Weiss Technik (ClimeEvent C/180/40/5) able to control the ambient air conditioning parameters, such as temperature and relative humidity, and to simulate climatic events by importing climate data. In order to achieve an evenly distributed climatic condition, the environmental chamber provides a continuous air flow during the experiments. The test space dimensions of this environmental chamber are 750 mm × 580 mm × 450 mm. The experimental setup was scaled to the dimensions of the environmental chamber, allowing enough air circulation around the masonry wall to maintain the uniform conditions in the climate chamber. The climate chamber has an internal variation in temperature of ±0.5–±1.0 °C and in relative humidity of ±1–±3%.
A small masonry wall made of authentic period 16th-century bricks and modern lime mortar (NHL 3.5) was constructed for performing the experiment on a historic wall. The bricks originate from Kipdorpsite, an archaeological site in Antwerp, Belgium, and were used in this experiment because the authentic materials represent the same characteristics as most built heritage in Antwerp. To achieve a unidirectional impact of vertical greening on the wall, a polystyrene insulation board of 60 mm was installed at the back surface of the masonry wall. During the experiment, four iButtons (DS1923 hygrochron [14]) were mounted on the surface of the masonry wall to measure the temperature and relative humidity with a frequency of 5 min. Two iButtons were installed on the front surface of the masonry wall: one facing up and the other facing down. The latter were added to the method to measure on the surface of the wall without taking the thickness of the measuring device in account. A similar set of iButtons was installed at the back surface of the masonry wall. In order to measure the impact of vertical greening on the experimental environment, young ivy (Hedera helix ‘Glacier’) was used. Hedera helix ‘Glacier’ is an evergreen climber with small three-to-five-lobed leaves. They were planted in moderate, well-drained soil by professionals. The vertical greening was placed on a rigid metal trellis with a diameter of 3 mm, enabling the vegetation to remain fixed in place (Figure 1).

2.2. Methodology

Three different experimental setups were used to understand how vertical greening affects temperature and relative humidity without the impact of solar irradiation and to what extent the distance from the surface of vertical greening affects the impact on those environmental parameters. The first experimental setup consists solely of a bare wall. The second and third setups have vertical greening in front of the bare wall. One setup has vertical greening as close as possible to the masonry wall’s surface, whilst the second setup has vertical greening at a 10 cm distance from the masonry wall’s surface. To ensure accurate measurement of the impact of vertical greening on the temperature and relative humidity, the masonry wall was calibrated in a climate chamber at environmental conditions of 20 °C and 85% one month prior to the start of this experiment.
Each of the three different setups was subjected to the same environmental simulations. The experimental data responsible for those simulations exist of processed climate data from the VLINDER project [15]. The VLINDER project is a collection from 59 weather stations in the northern part of Belgium, all subjected to the same temperate oceanic climate (Cfb). One of the monitoring locations is in the historic city centre of Antwerp, Belgium, and was used herein because it has the strongest relationship with ongoing case studies in the wider research project. The weather station contains data from November 2019 to the present, but the modified data were cut in November 2022 to ensure that each season had the same number of days for further calculations.
The experimental data consist conceptually of six standalone test periods of 24 h but were simulated as six consecutive days with some buffer period for equilibrium in between. To provide the masonry enough time to adjust to the new climatic circumstances, six hours were simulated between each simulation day on the first values of temperature and relative humidity of the following simulation day.
Four 24-h test periods of the experimental data represent a typical day in each season, while the other two are associated with a more extreme day in summer and winter. This allows us to observe varying performances of vertical greening on the temperature and relative humidity for each season and more extreme situations in winter and summer. The latter is important for some common degradation processes in historic building materials, such as salt crystallization or freeze–thaw weathering. An average “representative” day for each season was calculated by using the mean value of the recorded air temperature (50 percentile) over those three years. For each season, the day with the most similar average air temperature relative to the calculated average air temperature was chosen to be simulated. This means that the climate chamber accurately simulates the temperature and relative humidity of that actual day with recordings of each half-hour. The experimental hourly data were based on the exact 24-hour diurnal measurements of the chosen day to foster a more accurate understanding of microclimatic changes on deterioration processes of historic building materials in comparison with the experimental hourly data based on the average temperature of three-year data per hour, which varied insufficiently to see any differences. Performing the experiment with monthly or daily mean temperature can result in a loss of data when the aim is measuring significant variations across seasons [16]. The average day of each investigated season is referred to in this paper as the representative day of the corresponding season. The extreme representative days were selected in a similar way, except that they were calculated by the 95th percentile of the air temperature in summer and the fifth percentile of the air temperature in winter instead of using the mean air temperature values [16]. The 95th percentile of the whole set corresponds to the five hottest days per year (15 warmest days in total). The opposite holds for the fifth percentile corresponding to the five coldest days per year (15 coldest days in total). This paper will refer to both extreme days as the extreme representative summer day and extreme representative winter day.

3. Results

3.1. Temperature

The experimental results show that the surface of the vertically greened wall relative to the corresponding bare wall almost always had higher temperature and humidity values. The surface temperature curves from all three experimental setups follow a similar course as the environmental temperature curves of the climate chamber in all seasons. Due to the presence of a vegetation layer, there is an insulation impact on the underlaying wall: the vegetation layer reduced the rate of heat exchange between the masonry wall and its environment, slowing down the temperature response of the masonry wall.
However, there is an absolute difference between the temperature curves of the three experimental setups, which varied across different simulation days representing different seasons. For instance, Figure 2 illustrates that the temperature curve of the vertically greened wall during a representative winter day deviates more from the temperature curve of the bare wall than during a representative summer day. Even more, the further the vertical greening is located from the bare wall, the more the surface temperature values of a vertically greened wall deviate from the surface temperature of the bare wall. Statistical analysis confirms this observation: a Kruskal–Wallis test proves that the results are statistically significant for vertical greening on a 10 cm distance of the masonry wall: winter (50%) and summer (50%) have p-values of <0.0001 and 0.02805, respectively. For the experimental setup with vertical greening near the masonry wall, the p-values are 0.15105 for summer (50%) and <0.00001 for winter (50%).
This observation is especially significant during the cooling process of a wall. During the heating process of the wall, the temperature curves closely follow the course of the climate chamber. During the cooling process, the temperature curves of the three experimental setups show a delay relative to the environmental conditions of the climate chamber but still follow the same temperature course. This magnitude of this delay varies depending on the season or its intensity. An example of this variation is clearly observed in the temperature course of the extreme representative days of summer and winter (Figure 2). The solid green temperature curve, representing the surface temperature of the vertically greened wall at 10 cm, has a more delayed temperature response during the cooling phase relative to the corresponding bare wall.
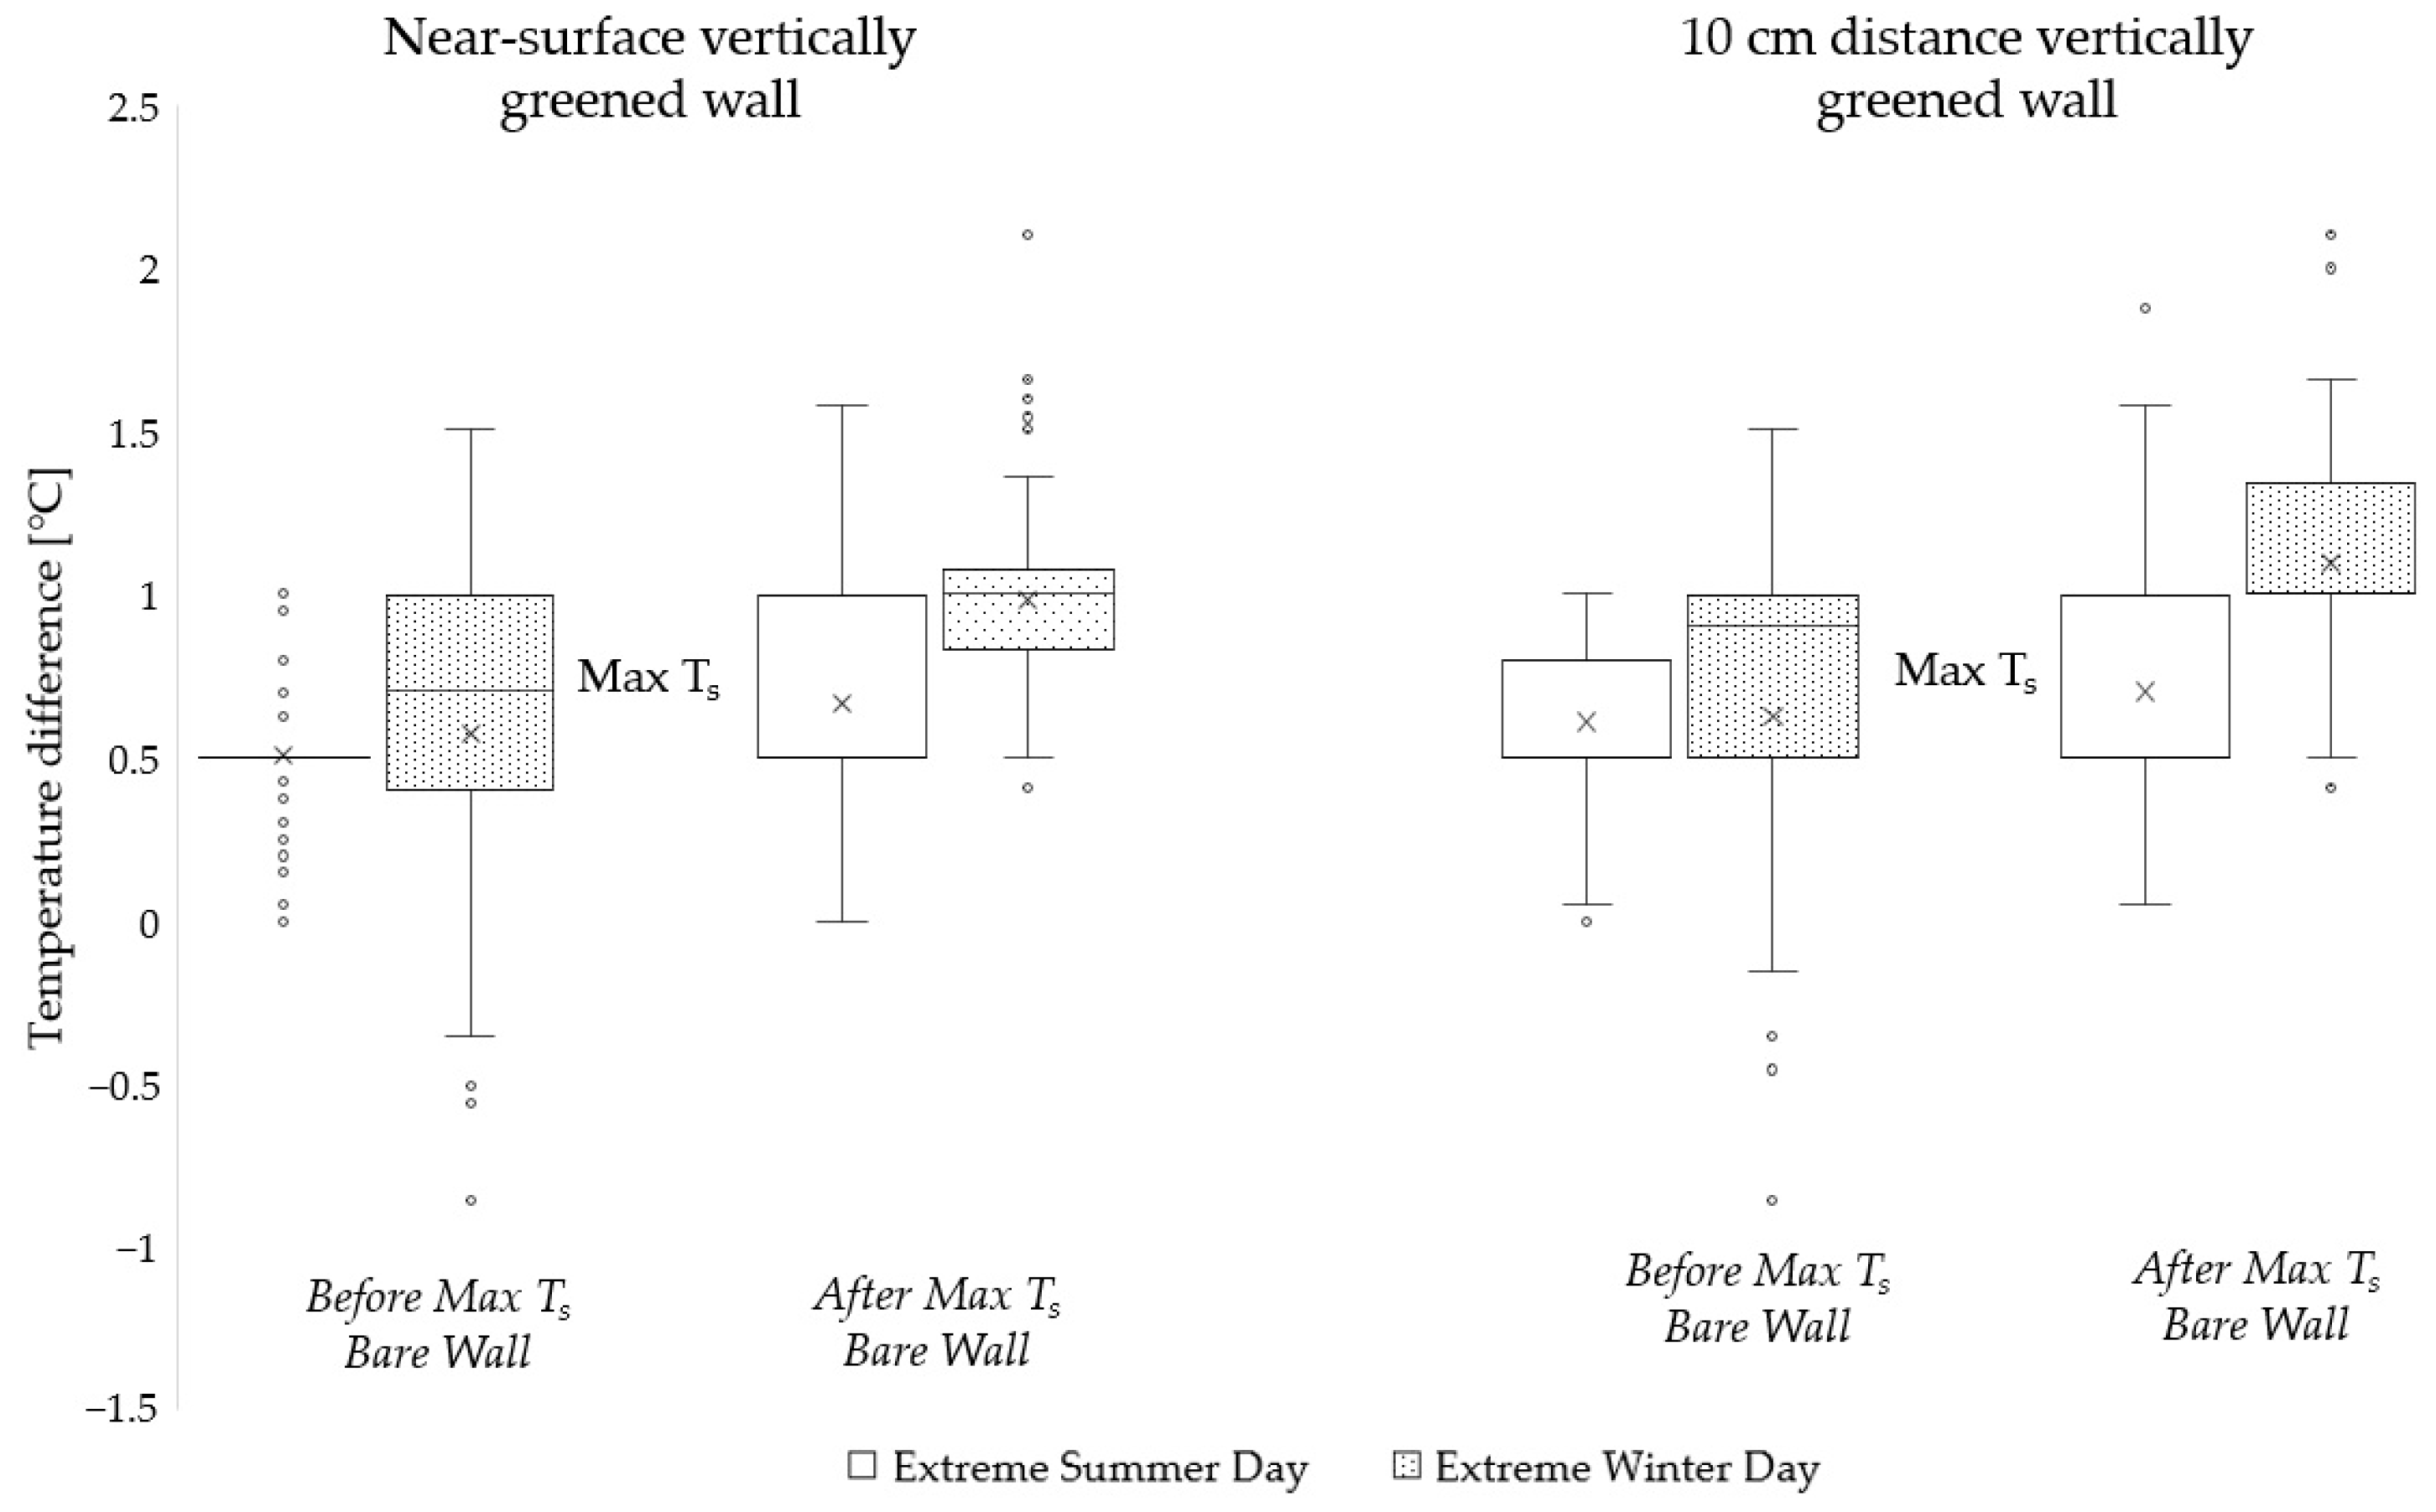
Additionally, how much the temperature curves from the vertically greened walls deviate from the bare wall is seasonally dependent as well. By comparing the heating phase (before reaching the maximum surface temperature of the bare wall) and the cooling phase (after reaching the maximum surface temperature of the bare wall) of the experimental setups with vertical greening relative to the experimental setup without greening, the temperature difference in the heating and cooling phase is more significant on an extreme winter day than on an extreme summer day (Figure 3). In the cooling phase, this difference, due to the insulation capacity of vertical greening, goes up to 0.4 °C. The further the vertical greening is positioned, the more significant this difference is between summer and winter. It was observed that the insulation capacity of vertical greening is responsible for a seasonality difference of 0.3 °C for vertical greening positioned near the surface and 0.4 °C for vertical greening at 10 cm distance. However, the Kruskal–Wallis test shows insignificant p-values for vertical greening near (p = 0.43581) and at a distance of 10 cm (p = 0.38407) from the masonry wall during an extreme summer day. The experimental setups during an extreme winter day have more significant results: the p-values for vertical greening near the masonry wall and at a distance of 10 cm from the masonry wall are, respectively, 0.23041 and 0.04338.
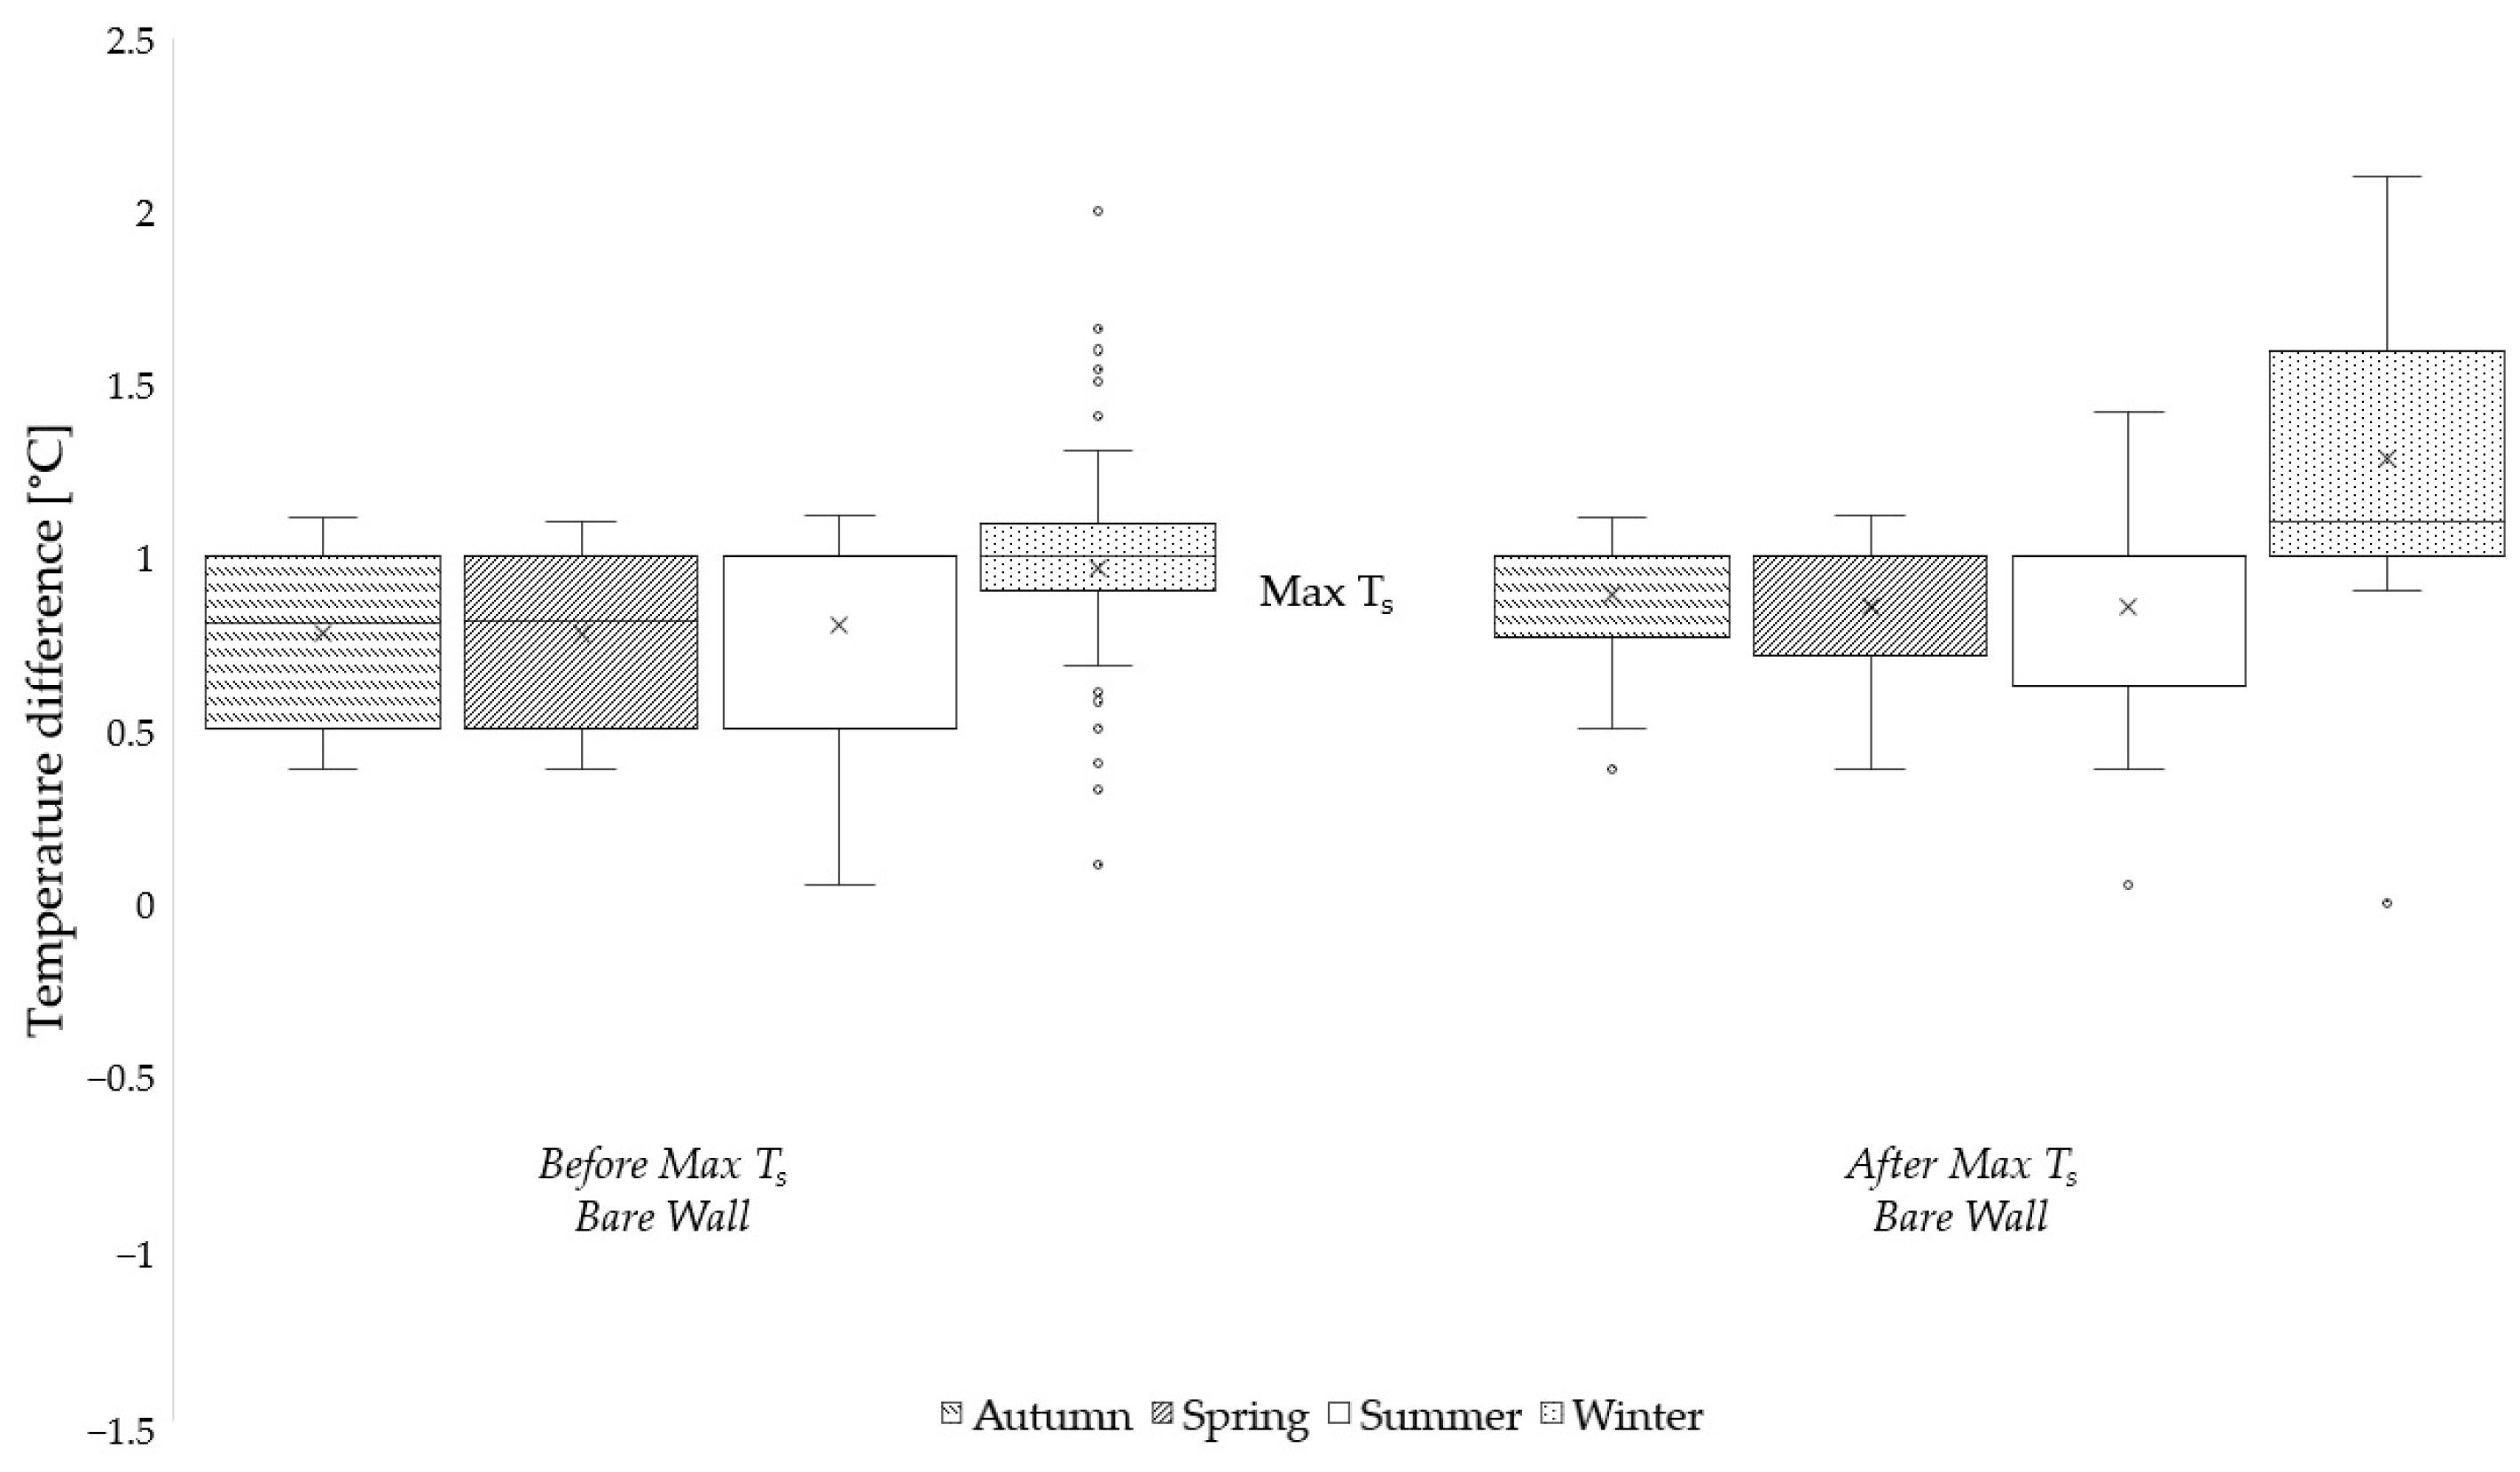
Another difference was observed in the heating and cooling process of the experimental setups during the representative days of each season (Figure 4). Vertical greening has clearly the most significant insulation capacity in winter, both during heating and cooling phase. The insulation capacity of vertical greening in wintertime is twice as strong as the insulation capacity during other seasons. This observation is confirmed by the statistical analysis of a Kruskal–Wallis test: the results of the experimental setup with vertical greening near the masonry wall during a representative autumn, spring, summer, and winter day have p-values of 0.02544, 0.03226, 0.15105, and <0.00001, respectively. When vertical greening has a distance of 10 cm from the masonry wall, the p-values are, respectively, 0.00008, 0.00704, 0.02805, and <0.00001 during a representative autumn, spring, summer, and winter day.
Meanwhile, the temperature measured at the back of the masonry wall illustrates a delay in the heating and cooling process due to the insulation at the back of the masonry wall. Consequently, the surface temperature of the three experimental setups is lower than the environmental conditions of the climate chamber during the heating process, causing the cooling process to start later in the back of the masonry wall than in front of the masonry wall. During cycles with greater rates of temperature increases, the temperature curve of the back of the masonry deviates more from the environmental conditions of the climate chamber (Figure 5). Furthermore, the temperature at the back of the masonry wall does not reach the same maximum and minimum values as the temperature measured at the front surface of the masonry wall. This difference reached up to 1.5 °C in extreme winter and summer situations.

3.2. Relative Humidity

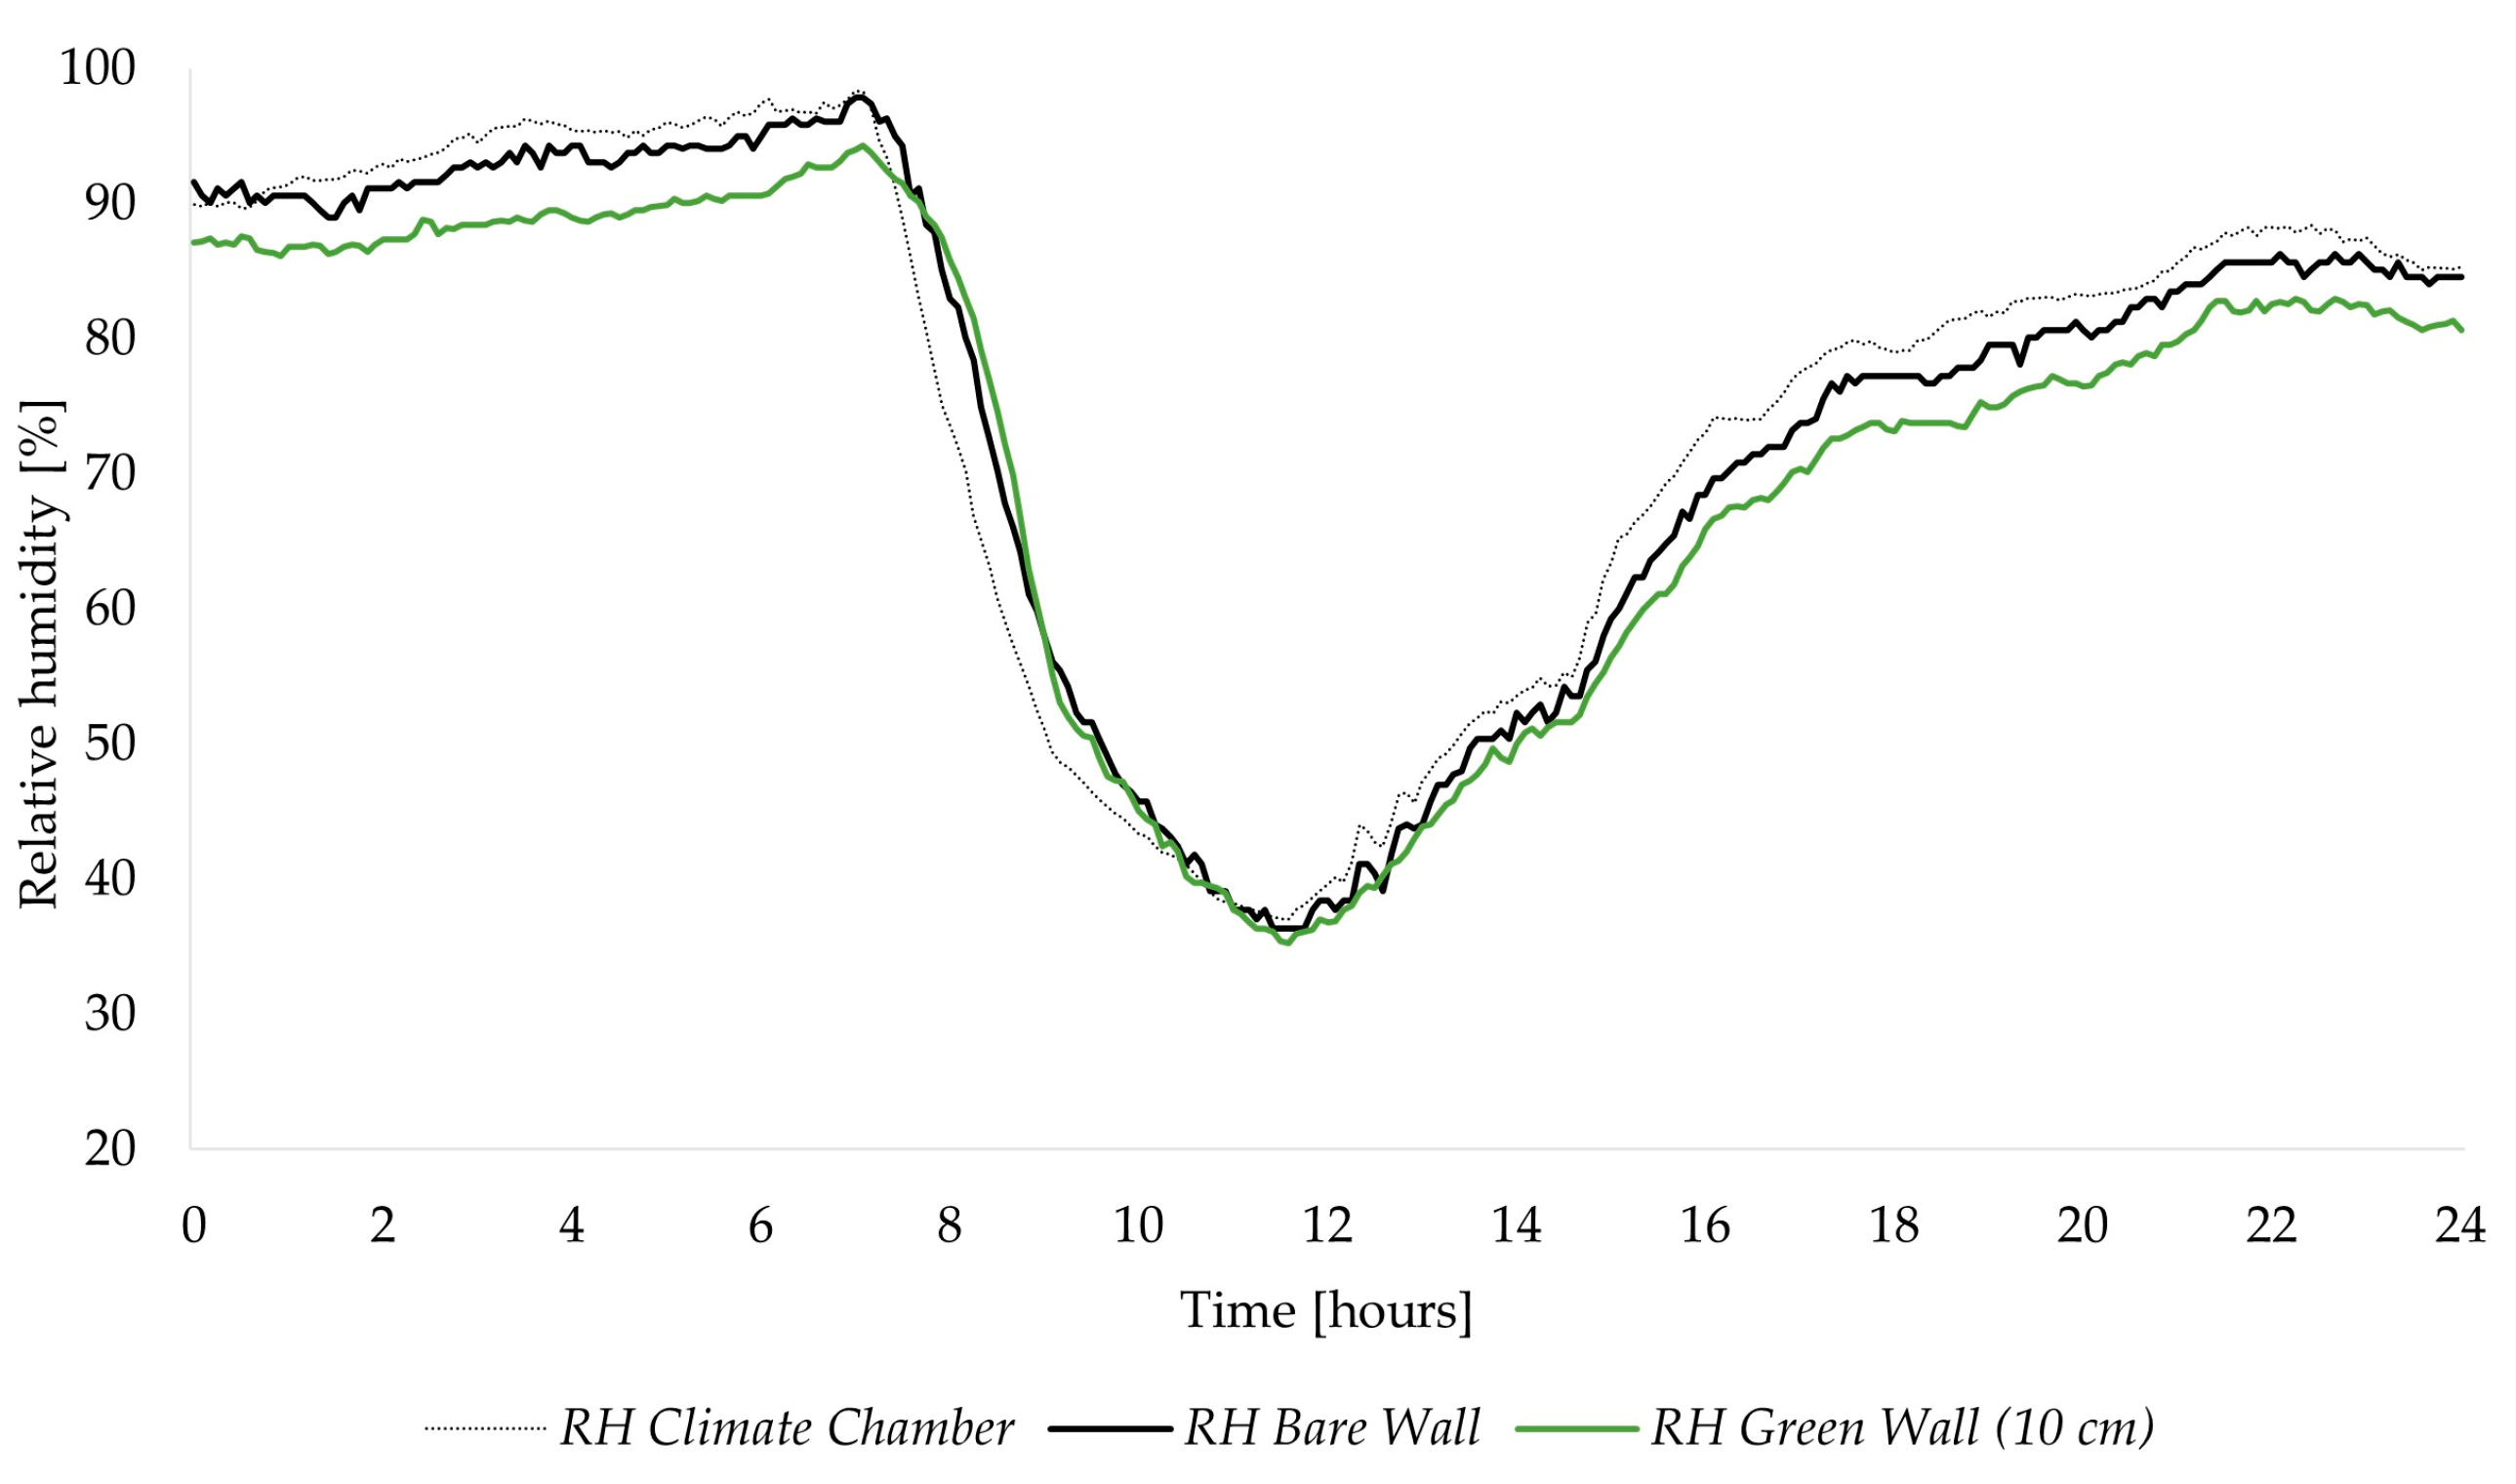
Since relative humidity is a direct function of temperature (and inversely proportional if the moisture content remains constant) and solar irradiation, which is responsible for evaporation, is excluded in the laboratory study, the relative humidity changes caused by vertical greening are dominated by the changes in surface temperature. More specifically, the relative humidity of a vertically greened wall are lower than the relative humidity of the corresponding bare wall, as there is no increase in moisture content due to evaporation. This delaying effect in the relative humidity response is mainly true during the cooling process of the wall. The further the vertical greening is positioned from the masonry wall, the more the relative humidity values of the vertically greened wall differentiate from the relative humidity values of the corresponding bare wall (Figure 6).

4. Discussion

4.1. Advantages of Laboratory Environmental Simulations

The experimental results exploring the impact of vertical greening on individual parameters, such as temperature and relative humidity, were only feasibly obtained by performing lab experiments. By using only the ambient air conditions and excluding solar irradiation, laboratory studies enable an understanding in mechanisms, determining the environmental impact of an implementation of vertical greening, such as the insulation capacity of an extra vegetation layer.
Performing laboratory studies allows us to search for a standardized approach to support the interpretation of in situ monitoring or simulations. The use of authentic materials in the laboratory studies can make the experimental results more comparable with the in situ monitoring of the wider research project performed on historic buildings in the city centre of Antwerp. By working with controlled climatic conditions, it is possible to obtain reproducible results and minimize the impact of stochasticity associated with the relevant physical processes. The possibility of repeating experiments also enables factors of specific interest to be manipulated in a controlled way, such as the distance of the wall under the same climatic conditions, or to vary in climatic events while maintaining the same characteristics across all experiments.

4.2. Towards a Standardised Climate Chamber-Based Approach

As with many other studies, the laboratory studies of this paper faced some challenges regarding the equipment and the experimental setups. The climate chamber (Weiss Technik ‘ClimeEvent C/180/40/5′) was not able to control the relative humidity when temperature was lower than five degrees, which made gathering results on the relative humidity during an extreme winter day quite difficult. Due to the limitations of the relative humidity control during climate tests, this laboratory experiment only provided accurate results on the relative humidity during summertime for both intensities. The fan regulating the air conditioning equally over the test space was not able to change its intensity, which could possibly affect the experimental results. A two-sided environmental chamber (sometimes called a “hot-cold” box) could be more advantageous in exploring the environmental impact of vertical greening [17]. Additionally, the internal dimensions of the climate chamber also limit the size of the experimental setup, such as the masonry wall and the vegetation. A larger masonry wall or more plants could possibly have an effect on the environmental impact of vertical greening during laboratory experiments.
Further, livings plants in a laboratory studies present their own challenges. The plants used for vertical greening need water and light to stay healthy during the experiment. Therefore, a self-watering system was installed during the experiments, and the light of the climate chamber stayed on during the time of the environmental simulations. Unfortunately, the lamp did not turn off independently, which endangered the plants of dying when the environmental conditions were not controlled anymore (such as when the environmental simulations were finished).

4.3. Comparison to Case Study Approaches

This experimental laboratory study provides contradictory results compared with results from case studies or simulations. Several studies [11,18,19,20,21,22], either case studies or simulations, show that vertical greening reduces the amplitude of the surface temperature and the relative humidity fluctuations, reduces the average surface temperature, and increases the average relative humidity of a wall surface. Meanwhile, the experimental results show a higher surface temperature and a lower relative humidity on a vertically greened wall relative to the bare wall. These results were reached because the experiments and the methods proposed herein, based on the ambient air conditions and excluding solar irradiation, allow us to focus on one of the mechanisms responsible for the environmental impact of vertical greening: the insulation capacity of a vegetation layer.
The differences between both approaches suggest that shading and evaporation, which both only exist when solar irradiation is present, have a more significant role in determining the environmental impact of vertical greening than the insulation impact of the vegetation layer on the wall. Several in situ studies illustrate that vertical greening can reduce the maximum surface temperature significantly, by up to 28 °C [20], relative to the bare wall, while the insulation capacity of vertical greening can increase the maximum surface temperature by up to 2 °C in the laboratory studies of this paper. The latter is supported by an in situ study examining the impact of vertical greening on a façade receiving almost no solar irradiation. Daemei et al. (2021) illustrated that vertical greening can increase the surface temperature in the absence of solar irradiation because evaporation and shading do not occur [20].
In both methodological approaches, the mechanisms responsible for the environmental impact of vertical greening are dependent on certain boundary conditions, such as seasonality or its intensity, climate type, plant, or material characteristics. One benefit of performing laboratory studies is that it allows to compare the performance of vertical greening across seasons or intensities while maintaining the same characteristics during all experiments, which improves the comparability of the results. Due to the living character of vertical greening, it is impossible to carry out the same analysis in case studies. In order to test all seasons and intensities, the analysis would take at least a year, which causes a high risk of changing a plant’s environmental characteristics over the course of the year, which can affect the experiments’ outcomes. For instance, the leaf area index of plants varies through the year and reaches its peak density in the summer [23].

4.4. Experimental Results and the Impact of Boundary Conditions

To foster a better understanding of the insulation properties of a vertical vegetation layer and the experimental approach to investigate this, there is a need for further research. Following investigations could provide more knowledge into significant boundary conditions determining the magnitude of the insulation properties of vertical greening.
These preliminary experimental results show that the temperature difference between the bare wall and the vertically greened wall (at any distance) will most likely change in different environmental boundary conditions. It would be interesting to explore the impact of climate type or seasonality and its intensity on the temperature and relative humidity changes during the cooling process of a wall due to vertical greening or the impact of duration and temperature range of the cooling process on the insulation performances of vertical greening.
Comparing the environmental impact of vertical greening across the representative days of each season can support our assumption (Table 1). The cooling phase of the winter simulation had a temperature difference between start and end of the cooling phase of 3.5 °C and a duration of 9.3 h, while the cooling process of the autumn simulation had similar conditions. Despite having the same characteristics of the cooling phase, vertical greening in winter has a more significant insulation capacity than vertical greening in autumn (Figure 4). The could assume that a lower start and end temperature of the cooling phase could depend on the magnitude of the insulation impact of vertical greening on a wall. The winter simulation has a start temperature of 8.6 °C and end temperature of 5.0 °C, and the cooling phase of the autumn simulation has a start and end temperature of six degrees higher. Another observation is based on the cooling rate of the cooling phase. This is calculated by dividing the temperature differences between the start and end temperature of the cooling phase by the duration of the cooling phase. The higher the cooling rate, the lower the insulation capacity of vertical greening. This is supported by Table 1: the extreme representative summer day and the representative summer and spring days have the highest cooling rates compared to the other simulation days and have the lowest temperature differences between the bare wall and the vertically greened wall near the surface and at a 10 cm distance from the wall surface. Additionally, the average and maximum temperature differences between each temperature value of a bare wall and a vertically greened wall are the most significant, with low absolute temperatures during a representative day.
The statical analysis is summarized in Table 1 and can confirm most of the observations. Vertical greening on a masonry wall during representative days for each season shows more statistically significant results than vertical greening implemented on a wall during an extreme representative day. Generally, the results of every simulation day show more significant results in the experimental setup with vertical greening at a distance of 10 cm from the masonry wall relative to the masonry wall with vertical greening near the surface; hence, vertical greening on a distance would have a more significant impact on the microclimate.
However, the experimental results are not only dependent on the environmental boundary conditions but on the characteristics of plants and materials. The properties of the vegetation or materials can affect the magnitude at which vertical greening modifies the local microclimate, which also includes the insulation properties of the vegetation layer. Plant characteristics such as the leaf area indexes, the thickness of the vertical greening, and the type of plant affect the environmental impact of the vertically greened layer [8,10,24]. Material properties such as the heat capacity of materials or the reflexivity of a material can influence the temperature differences between the vertically greened part and the bare part of the wall [25,26,27].
Furthermore, as the insulation mechanism has a contrasting effect on the environmental impact of vertical greening compared to shading and evaporation in the period with solar irradiation, it can have a beneficial effect on managing degradation processes of historic building materials in areas with a low amount of solar irradiation. The constantly higher surface temperature and lower relative humidity could have the capacity to lower the risk of frost damage on historic façades [28,29,30,31]. Unfortunately, the insulation capacity of vertical greening generally increases the risk of salt crystallization or biodegradation: the higher temperature in combination with the lower humidity are favourable for salts to crystallize [30,32,33].
As the insulation properties are present when solar irradiation is absent and overruled by other mechanisms such as transpiration or shading, when solar irradiation is present, the insulation effect of vertical greening will be the most relevant for areas with a low amount of solar irradiation, such as a façade that is north-oriented or shaded by surrounding buildings. Since the insulation capacity of vertical greening on building façades has the same characteristics as insulation materials, the energy-efficiency-related challenges faced by insulation materials can also apply to the insulation capacity of vertical greening.
Nevertheless, the aforementioned degradation processes, just like the insulation capacity of vertical greening, depend on several boundary conditions, such as seasonality and its intensity, climate types or orientation, and also on the absolute values of temperature and relative humidity. For instance, the most significant insulation impact of vertical greening is reached during wintertime, which is the season with the highest risk of frost damage due to reoccurring freeze–thaw cycles. Depending on the change in absolute value of the minimum surface temperature of the wall, the amount of freeze–thaw cycles will change, varying in effect between beneficial and adverse. The same principle of reoccurring cycles is applicable for salt crystallization but is mainly dependent on the relative humidity values.

5. Conclusions

It is well established that ground-based vertical greening has an impact on the local environment, which has been widely researched through case studies or simulations. However, the mechanisms supporting and realising the environmental impact of vertical greening is poorly understood. Laboratory studies create opportunities to investigate different mechanisms, such as the insulation effect, by controlling the right environmental conditions. This paper demonstrates a preliminary methodology to investigate the insulation impact of vertical greening by laboratory studies and presents the initial results on the insulation capacity of vertical greening by excluding solar irradiation and working with only ambient air conditioning in laboratory studies. The experimental results provide the first insights into the crucial boundary conditions for estimating the magnitude of influence of vertical greening’s insulation capacity. The characteristics of the cooling phase of a wall, such as duration, temperature difference, and cooling rate, are dependent on the seasons and clearly have an impact on the insulation properties of a vegetation layer on a wall. Further research could contribute to develop a standardised laboratory approach to support the interpretation of case studies and could broaden our knowledge about all boundary conditions affecting the insulation capacity.

Author Contributions

M.D.G., writing—original draft, visualization, resources, methodology, investigation, and conceptualization; E.K., writing—review and editing, methodology, and conceptualization; S.A.O., writing—review and editing, supervision, methodology, funding acquisition, and resources; T.D.K., writing—review and editing, supervision, methodology, funding acquisition, and resources. All authors have read and agreed to the published version of the manuscript.

Funding

The authors gratefully acknowledge Research Foundation—Flanders (FWO) for funding this project (43365) and BOF Research grants for funding this project (44623).

Institutional Review Board Statement

Not applicable.

Informed Consent Statement

Not applicable.

Data Availability Statement

Data are available by contacting the corresponding authors.

Acknowledgments

The authors gratefully acknowledge the support of the University College of London for all technical support and the ability to use their facilities and equipment during the experiment.

Conflicts of Interest

The authors declare no conflict of interest.

References

  1. Lafortezza, R.; Chen, J.; van den Bosch, C.K.; Randrup, T.B. Nature-based solutions for resilient landscapes and cities. Environ. Res. 2018, 165, 431–441. [Google Scholar] [CrossRef]
  2. Faivre, N.; Fritz, M.; Freitas, T.; de Boissezon, B.; Vandewoestijne, S. Nature-Based Solutions in the EU: Innovating with nature to address social, economic and environmental challenges. Environ. Res. 2017, 159, 509–518. [Google Scholar] [CrossRef] [PubMed]
  3. Xing, Y.; Jones, P.; Donnison, I. Characterisation of Nature-Based Solutions for the Built Environment. Sustainability 2017, 9, 149. [Google Scholar] [CrossRef] [Green Version]
  4. Dover, J.W. Green Infrastructure: Incorporating Plants and Enhancing Biodiversity in Buildings and Urban Environments; Routledge: London, UK, 2015. [Google Scholar]
  5. Norton, B.A.; Coutts, A.M.; Livesley, S.J.; Harris, R.J.; Hunter, A.M.; Williams, N.S.G. Planning for cooler cities: A framework to prioritise green infrastructure to mitigate high temperatures in urban landscapes. Landsc. Urban Plan. 2015, 134, 127–138. [Google Scholar] [CrossRef]
  6. Ottelé, M. The green building envelope: Vertical greening. Ph.D. Thesis, TU Delft, Delft, The Netherlands, 2011. [Google Scholar]
  7. Wang, P.; Wong, Y.H.; Tan, C.Y.; Li, S.; Chong, W.T. Vertical Greening Systems: Technological Benefits, Progresses and Prospects. Sustainability 2022, 14, 12997. [Google Scholar] [CrossRef]
  8. Koch, K.; Ysebaert, T.; Denys, S.; Samson, R. Urban heat stress mitigation potential of green walls: A review. Urban For. Urban Green. 2020, 55, 126843. [Google Scholar] [CrossRef]
  9. National Weather Service. Discussion on Humidity. Available online: https://www.weather.gov/lmk/humidity (accessed on 5 December 2022).
  10. De Bock, A.; Belmans, B.; Vanlanduit, S.; Blom, J.; Alvarado-Alvarado, A.; Audenaert, A. A review on the leaf area index (LAI) in vertical greening systems. Build. Environ. 2023, 229, 109926. [Google Scholar] [CrossRef]
  11. Kenai, M.-A.; Libessart, L.; Lassue, S.; Defer, D. Impact of green walls occultation on energy balance: Development of a TRNSYS model on a brick masonry house. J. Build. Eng. 2021, 44, 102634. [Google Scholar] [CrossRef]
  12. Sternberg, T.; Viles, H.; Cathersides, A.; Edwards, M. Dust particulate absorption by ivy (Hedera helix L) on historic walls in urban environments. Sci. Total. Environ. 2010, 409, 162–168. [Google Scholar] [CrossRef]
  13. Koyama, T.; Yoshinaga, M.; Hayashi, H.; Maeda, K.-I.; Yamauchi, A. Identification of key plant traits contributing to the cooling effects of green façades using freestanding walls. Build. Environ. 2013, 66, 96–103. [Google Scholar] [CrossRef]
  14. Msl. IButton DS1923 Hygrochron Temperature/Humidity Data Logger. Available online: https://www.measurementsystems.co.uk/data-logging/miniature_temperature_loggers/ds1923_hygrochron_temperature_humidity_data_logger (accessed on 11 June 2023).
  15. Caluwaerts, S.; Top, S.; Vergauwen, T.; Wauters, G.; De Ridder, K.; Hamdi, R.; Mesuere, B.; Van Schaeybroeck, B.; Wouters, H.; Termonia, P. Engaging Schools to Explore Meteorological Observational Gaps. Bull. Am. Meteorol. Soc. 2021, 102, E1126–E1132. [Google Scholar] [CrossRef]
  16. Ramon, D.; Allacker, K.; De Troyer, F.; Wouters, H.; van Lipzig, N.P. Future heating and cooling degree days for Belgium under a high-end climate change scenario. Energy Build. 2020, 216, 109935. [Google Scholar] [CrossRef]
  17. Ottelé, M.; Perini, K. Comparative experimental approach to investigate the thermal behaviour of vertical greened façades of buildings. Ecol. Eng. 2017, 108, 152–161. [Google Scholar] [CrossRef] [Green Version]
  18. Vox, G.; Blanco, I.; Fuina, S.; Campiotti, C.A.; Mugnozza, G.S.; Schettini, E. Evaluation of wall surface temperatures in green facades. Proc. Inst. Civ. Eng. Eng. Sustain. 2017, 170, 334–344. [Google Scholar] [CrossRef]
  19. Vox, G.; Blanco, I.; Schettini, E. Green façades to control wall surface temperature in buildings. Build. Environ. 2018, 129, 154–166. [Google Scholar] [CrossRef]
  20. Daemei, A.B.; Shafiee, E.; Chitgar, A.A.; Asadi, S. Investigating the thermal performance of green wall: Experimental analysis, deep learning model, and simulation studies in a humid climate. Build. Environ. 2021, 205, 108201. [Google Scholar] [CrossRef]
  21. Blanco, I.; Schettini, E.; Vox, G. Effects of vertical green technology on building surface temperature. Int. J. Des. Nat. Ecodynamics Urban Agric. City Sustain. 2018, 13, 384–394. Available online: https://www.witpress.com/elibrary/dne-volumes/13/4/2349 (accessed on 3 July 2023). [CrossRef] [Green Version]
  22. Blanco, I.; Schettini, E.; Vox, G. Predictive model of surface temperature difference between green façades and uncovered wall in Mediterranean climatic area. Appl. Therm. Eng. 2019, 163, 114406. [Google Scholar] [CrossRef]
  23. Pérez, G.; Coma, J.; Chàfer, M.; Cabeza, L.F. Seasonal influence of leaf area index (LAI) on the energy performance of a green facade. Build. Environ. 2021, 207, 108497. [Google Scholar] [CrossRef]
  24. Cameron, R.W.; Taylor, J.E.; Emmett, M.R. What’s ‘cool’ in the world of green façades? How plant choice influences the cooling properties of green walls. Build. Environ. 2014, 73, 198–207. [Google Scholar] [CrossRef] [Green Version]
  25. Akbari, H.; Cartalis, C.; Kolokotsa, D.; Muscio, A.; Pisello, A.L.; Rossi, F.; Santamouris, M.; Synnefa, A.; Wong, N.H.; Zinzi, M. Local Climate Change and Urban Heat Island Mitigation Techniques—The State of the Art. J. Civ. Eng. Manag. 2015, 22, 1–16. [Google Scholar] [CrossRef] [Green Version]
  26. Zhao, L.; Lee, X.; Smith, R.B.; Oleson, K. Strong contributions of local background climate to urban heat islands. Nature 2014, 511, 216–219. [Google Scholar] [CrossRef] [PubMed]
  27. Akbari, H.; Pomerantz, M.; Taha, H. Cool surfaces and shade trees to reduce energy use and improve air quality in urban areas. Sol. Energy 2001, 70, 295–310. [Google Scholar] [CrossRef]
  28. Hall, K. Rock moisture content in the field and the laboratory and its relationship to mechanical weathering studies. Earth Surf. Process. Landf. 1986, 11, 131–142. [Google Scholar] [CrossRef]
  29. Deprez, M.; De Kock, T.; De Schutter, G.; Cnudde, V. A review on freeze-thaw action and weathering of rocks. Earth-Sci. Rev. 2020, 203, 103143. [Google Scholar] [CrossRef]
  30. Siegesmund, S.; Snethlage, R. Stone in Architecture; Springer: Berlin/Heidelberg, Germany, 2014. [Google Scholar] [CrossRef]
  31. Camuffo, D. Microclimate for Cultural Heritage: Conservation, Restoration, and Maintenance of Indoor and Outdoor Monuments, 2nd ed.; Elsevier: Amsterdam, The Netherlands, 2014. [Google Scholar]
  32. Fiscbetti, D.C.; Baer, N.S.; Fitz, S.; Livingston, R.A. Conservation of Historic Brick Structures—Case Studies and Reports of Research. APT Bull. 2001, 32, 73. [Google Scholar] [CrossRef]
  33. Godts, S.; Orr, S.A.; Desarnaud, J.; Steiger, M.; Wilhelm, K.; De Clercq, H.; Cnudde, V.; De Kock, T. NaCl-related weathering of stone: The importance of kinetics and salt mixtures in environmental risk assessment. Herit. Sci. 2021, 9, 44. [Google Scholar] [CrossRef]
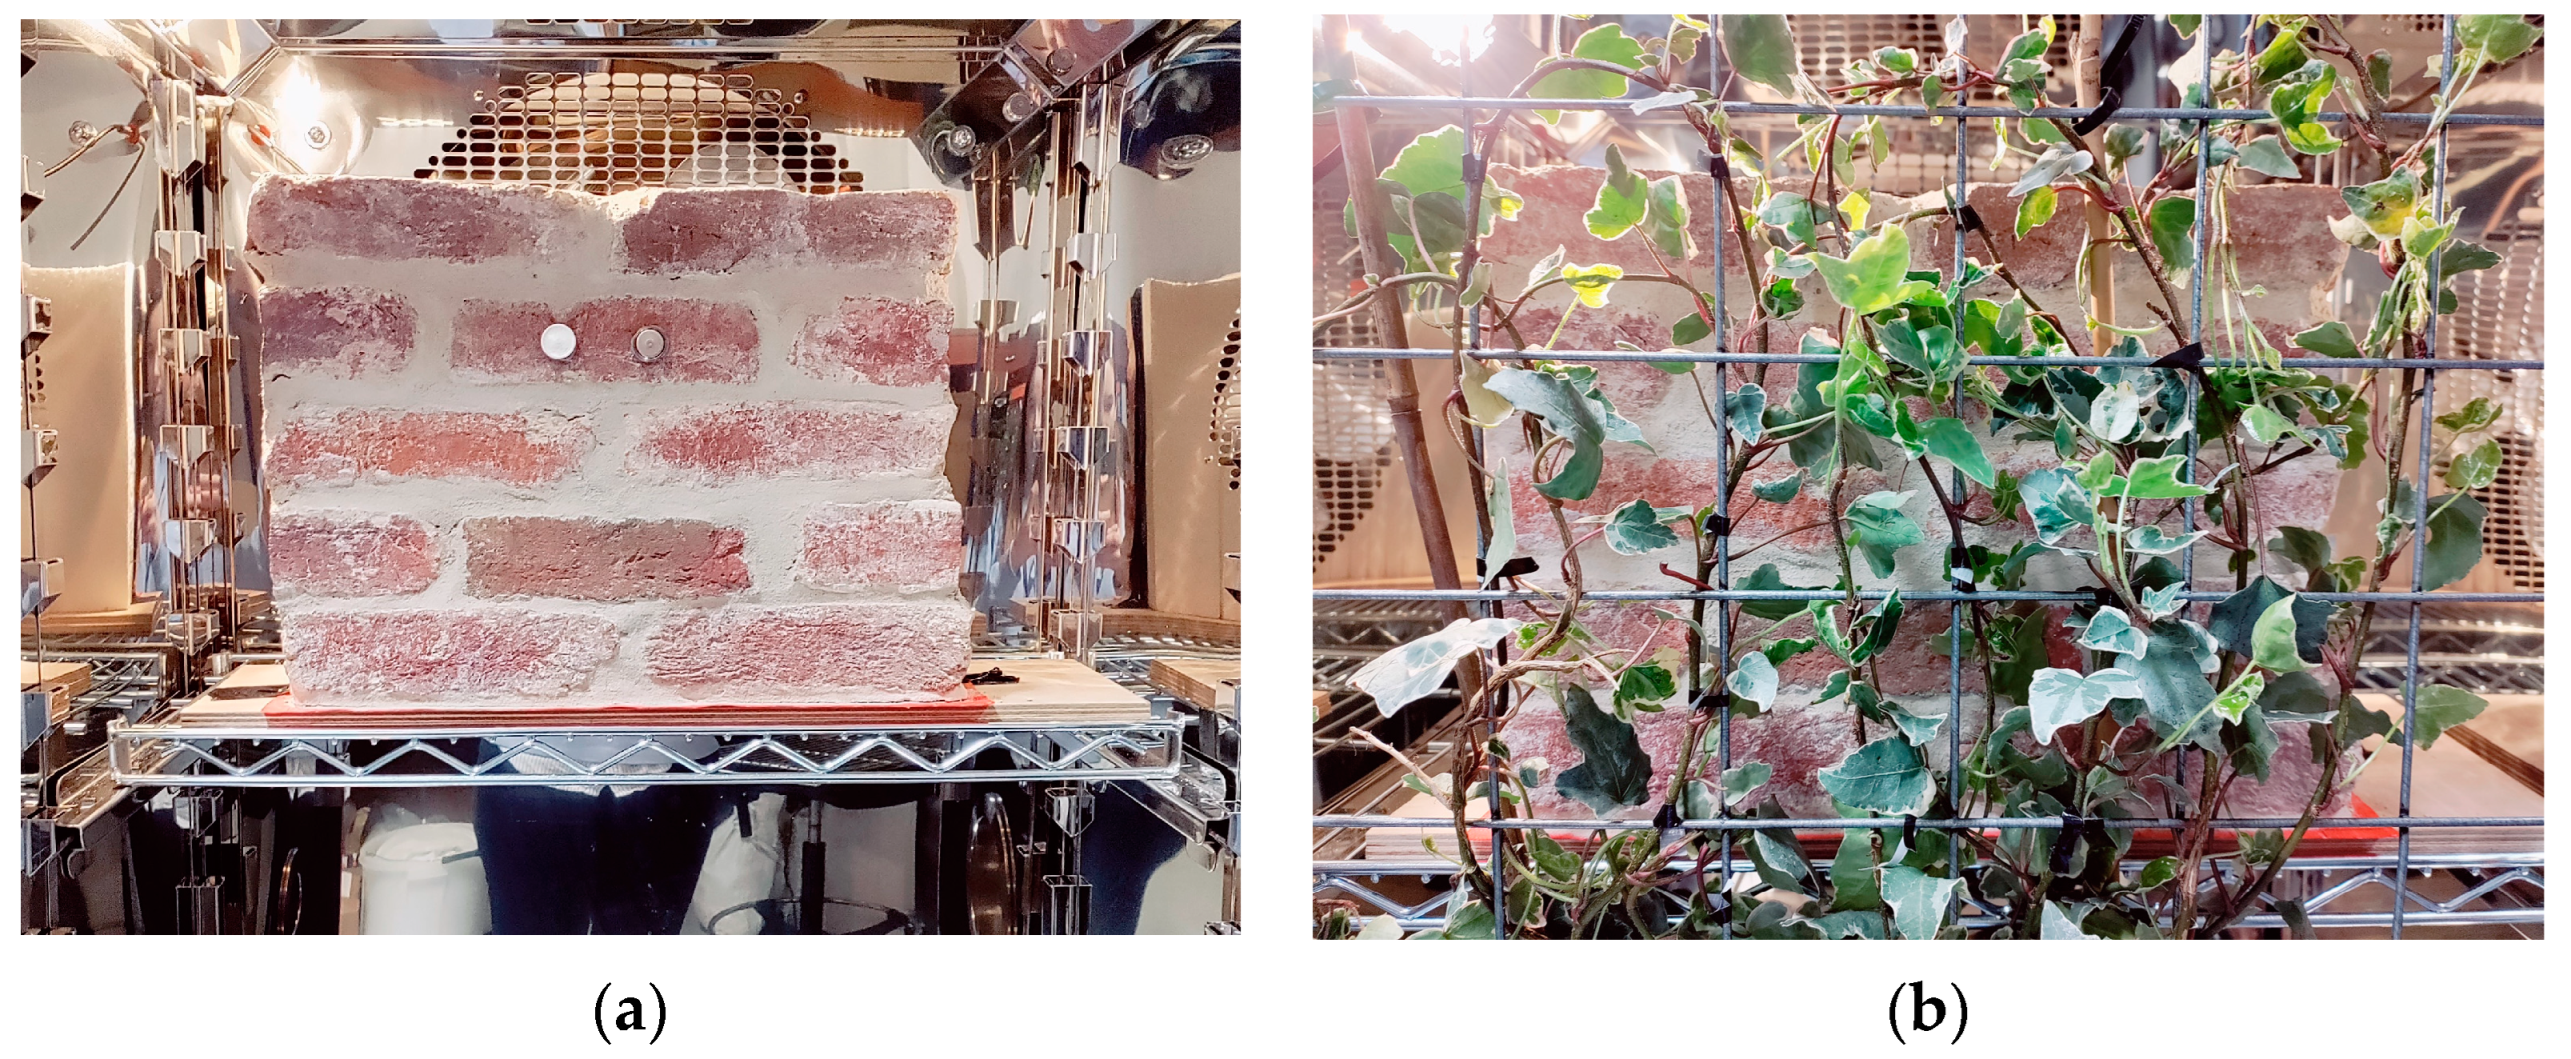
Figure 1. Image of experimental setup in the climate chamber: (a) a masonry wall without vertical greening and (b) a masonry wall with vertical greening.
Sustainability 15 11758 g001
Figure 2. Measured environmental and surface temperatures during a simulated 24 h diurnal cycle of a representative summer day at the front surface of the masonry wall and a representative winter day at the front surface of the masonry wall.
Sustainability 15 11758 g002
Figure 3. Boxplots illustrating the temperature differences of the vertically greened wall relative to the corresponding bare wall. The left part of the figure shows the temperature differences of the wall with vertical greening as close as possible to the surface relative to the bare wall during an extreme representative winter day and an extreme representative summer day. The right part shows the temperature difference of the wall with vertical greening at a distance of 10 cm relative to the bare wall during an extreme representative winter day and an extreme representative summer day. Each part of the figure represents temperature differences before and after the maximum surface temperature (Max Ts) of the bare wall. The cross in the boxplots represents the mean value of the data set of temperature differences between a vertically greened wall and a bare wall. The dots represents the outliers of the data containing the temperature differences between a vertically greened wall and a bare wall.
Sustainability 15 11758 g003
Figure 4. Boxplots illustrating the temperature differences of the vertically greened wall at a distance of 10 cm relative to the corresponding bare wall across all representative days (one for each seasons). The cross in the boxplots represents the mean value of the data set of temperature differences between a vertically greened wall and a bare wall. The dots represents the outliers of the data containing the temperature differences between a vertically greened wall and a bare wall.
Sustainability 15 11758 g004
Figure 5. Measured environmental and surface temperatures during a simulated 24 h diurnal cycle of a representative summer day at the back surface of the masonry wall and a representative winter day at the back surface of the masonry wall.
Sustainability 15 11758 g005
Figure 6. Graphs illustrate the relative humidity curves of the two experimental setups (the bare wall and the vertically greened wall at a distance of 10 cm) and the climate chamber during an extreme representative summer day.
Sustainability 15 11758 g006
Table 1. Description of the characteristics of the cooling phase (temperature difference between start and temperature of the cooling phase, duration of cooling phase, and the cooling rate) in each season and its variation in intensity. The average and maximum temperature differences are calculated by subtracting the bare wall temperature from the vertically greened wall temperature for each temperature value during the cooling phase, which is every 5 min.
Season (Intensity)Autumn (50)Spring (50)Summer (50)Winter (50)Summer (95)Winter (95)
Characteristics of cooling phase of the bare wall
Temperature difference (°C)3.629.028.003.5111.506.53
Duration (h)9.409.429.009.3012.758.25
Cooling rate (°C/h)0.380.960.890.380.900.79
Impact of vertical greening on the temperature differences of the cooling phase
Average temperature difference (°C)Near0.57 0.61 0.65 1.23 0.670.98
10 cm0.89 0.86 0.86 1.28 0.701.10
Maximum temperature difference (°C)Near1.111.111.192.101.582.10
10 cm1.111.121.422.101.882.10
Significancy test cooling phase
p-value, Kruskal–Wallis testNear0.025440.032260.15105<0.000010.435810.23041
10 cm0.000080.007040.02805<0.000010.384070.04338
Disclaimer/Publisher’s Note: The statements, opinions and data contained in all publications are solely those of the individual author(s) and contributor(s) and not of MDPI and/or the editor(s). MDPI and/or the editor(s) disclaim responsibility for any injury to people or property resulting from any ideas, methods, instructions or products referred to in the content.