Article

Sustainable Design of Circular Reinforced Concrete Column Sections via Multi-Objective Optimization

Faculty of Civil Engineering, Transportation Engineering and Architecture, University of Maribor, Smetanova 17, 2000 Maribor, Slovenia
*
Author to whom correspondence should be addressed.
Sustainability 2023, 15(15), 11689; https://doi.org/10.3390/su151511689
Submission received: 5 June 2023 / Revised: 27 July 2023 / Accepted: 27 July 2023 / Published: 28 July 2023

Abstract

:
An optimization model for reinforced concrete circular columns based on the Eurocodes is presented. With the developed optimization model, which takes into account the exact distribution of the steel reinforcement, which is not the case when designing with conventional column design charts, an optimal design for the reinforced concrete cross section is determined. The optimization model uses discrete variables, which makes the results more suitable for actual construction practice and fully exploits the structural capacity of the structure. A parametric study of the applied axial load and bending moment was performed for material cost and CO2 emissions. The results based on a single objective function show that the optimal design of the reinforced concrete column cross section obtained for the material cost objective function contains a larger cross-sectional area of concrete and a smaller area of steel compared with the optimization results when CO2 emissions are determined as the objective function. However, the optimal solution in the case where the material cost was assigned as the objective function has much more reserve in axial load capacity than in the optimal design where CO2 was chosen as the objective function. In addition, the multi-objective optimization was performed to find a set of solutions that provide the best trade-offs between the material cost and CO2 emission objectives.

1. Introduction

Column design charts are commonly used to determine the steel reinforcement required for a given axial loading and bending moment (Figure 1a). Each pair of axial load (N) and bending moment (M) corresponds to a specific neutral axis position and can be plotted as a point on an N-M graph. Connecting those points to a curve forms an envelope of column resistance against the axial load and bending moment. A stress state (caused by axial and bending) outside the curve is not possible since the column resistance is overreached. Alternatively, the area of steel reinforcement required is determined by non-dimensional design charts such as those presented in Figure 1b. Steel reinforcement configuration affects the column axial and bending resistances. As steel reinforcement increases the cross section, the overall load-carrying capacity of the member increases, making it more resistant to cracking and failure under applied loads. With more steel, the cross section also becomes more ductile, allowing it to deform more before failure. This results in a more gradual and favorable load–moment interaction diagram, as the capacity of the cross section is utilized to a greater extent. In the design of reinforced concrete, a balanced steel reinforcement ratio is often sought. This ratio is the point at which the concrete and steel simultaneously reach their respective limits so that both materials can be used as efficiently as possible.
Research on the optimization of reinforced concrete columns shows the evolution of optimization methods, from linear programming to nonlinear programming [1] to genetic algorithms [2] and particle swarm optimization [3]. Recent research has also introduced multi-objective optimization methods that can simultaneously consider different objectives and constraints, which enables cost-effective, environmentally friendly, and safe design of reinforced concrete columns. The main objective of the optimization models is to find the optimal cross-sectional dimensions and arrangement of steel reinforcement that can support the applied loads with minimum cost, minimum CO2 emissions, and maximum safety.
In the field of optimization and sustainability within structural engineering, researchers have introduced various optimization techniques and objectives for different types of structural elements. One such study, conducted by Zaforteza et al. [4], focused on the application of the simulated annealing algorithm (SA) in optimizing reinforced concrete frames. They considered two objective functions: the embedded CO2 emissions and the economic cost. Another study, by Camp and Huq [5], utilized a hybrid algorithm called big bang–big crunch (BB-BC) for the optimal design of reinforced concrete frames. Their objective was to minimize either the total cost or the CO2 emissions associated with the structures. Trinh et al. [6] employed a branch-and-reduce deterministic algorithm to optimize the design of flat plate buildings based on carbon footprint. Alonso and Berdasco [7] proposed a method to assess the carbon footprint of sawn timber products. Yeo and Gabbai [8] introduced a sustainable design approach for rectangular beams, aiming to minimize both the embodied energy and cost. Zhang and Zhang [9] presented a study where a multi-objective genetic algorithm was adopted for the sustainable design of reinforced concrete members, considering both the embodied emissions and costs. Jayasinghe et al. [10] minimized the embodied carbon in three different optimization approaches, namely theoretical optimum shape finding, feasible optimum shape finding, and optimizing prismatic beams. Sahebi and Dehestani [11] considered the objectives of cost and CO2 footprint in optimizing the sustainable design of reinforced beams.
The work of Ahmed et al. [12] and Tayem and Najmi [13] concerned with the optimal design of circular reinforced concrete columns using a nonlinear optimization approach to minimize the material cost considering constraints on axial load capacity, bending capacity, and maximum steel ratio. The hybrid optimization algorithm was also used to minimize the total material cost and for predictive modeling of circular reinforced concrete columns [14]. Camp and Assadollah [15] also presented a hybrid optimization algorithm for the CO2 and cost optimization of reinforced concrete foundations. The work of Zhao et al. [16] aimed to optimize the design of reinforced concrete columns strengthened with square steel tubes and sandwiched concrete. Jelušič and Žlender [17] optimized the reinforced cross sections of the geothermal energy piles using design column charts fitted with approximation functions. Payá-Zaforteza et al. [18] proposed a multi-objective optimization approach to optimize the cost and sustainability of reinforced concrete building frames considering the constraints on structural performance, environmental impact, and economic feasibility. Hong et al. [19] investigated an artificial-neural-network-based Lagrangian optimization approach for a multi-objective optimization model in which both the cost and performance of the reinforced concrete circular columns were optimized.
In this paper, a genetic algorithm is used to solve a multi-objective optimization problem, since it offers several advantages over other optimization techniques [20,21,22]. Genetic algorithms preserve diversity within the population, which helps to explore a wide range of solutions and avoid premature convergence to suboptimal solutions. This is important in multi-objective optimization, where there may be multiple solutions that are equally good but differ in terms of the tradeoffs between objectives. In addition, genetic algorithms do not require differentiable functions, which is advantageous for complex nonlinear functions that are common in multi-objective optimization. Finally, the genetic algorithm can be easily parallelized to perform multiple evaluations simultaneously, allowing faster convergence to optimal solutions. This is useful in multi-objective optimization, where the evaluation of solutions can be computationally expensive. However, using genetic algorithms for multi-objective optimization also has drawbacks, such as slow convergence speed, non-deterministic results, and scalability issues. Tuning parameters or selecting appropriate values such as population size, mutation rate, crossover probability, etc., can also be challenging, and incorrect selection can affect the performance of the genetic algorithm.
The main objective of this paper is to present an optimization model based on mixed-integer nonlinear programming solved by a genetic algorithm. The optimization model was developed, and optimal designs were determined using MATLAB [23]. The development optimization model is used to determine the difference in the design of reinforced concrete circular columns in terms of the environmental and economic aspects.
Parametric optimization is performed separately for different combinations of applied axial load and bending moments and for the two objective functions of material cost and CO2 emissions, which are generated during the production of the reinforced concrete. Furthermore, a multi-objective optimization was executed with the aim of identifying a range of solutions that offer optimal balances between material cost and CO2 emission objectives.

2. Optimization Model: Reinforced Circular Concrete Section (RCCS)

The optimization model, named the reinforced circular concrete section (RCCS), was developed to minimize material cost, minimize CO2 consumption, or minimize both material cost and CO2 consumption simultaneously through multi-objective optimization. Therefore, the optimization model includes input data, two objective functions, and constraints derived from the structural analysis of a reinforced circular concrete section. The structural analysis of the reinforced concrete section considers the relationship between the axial force and the bending moment in the different positions of the neutral axis.
The input data represent the design and economic data (constants) for the optimization. The design data comprise the design value of the applied axial load NEd (kN), the design value of the applied bending moment MEd (kNm), the length of the column section L (m), the characteristic value of the compressive strength of the concrete fck (MPa), the characteristic value of the tensile strength of the steel fyk (MPa), the modulus of elasticity of steel Es (MPa), the steel density ρsteel (kg/m3), the diameter of shear reinforcement Φlink (mm), a coefficient taking account of sustained compression αcc, the safety factor for concrete γc, safety factor for steel γs, and the concrete cover ccon. The input data also included all the defined values of the necessary material cost and CO2 consumption coefficients included in the objective functions, as well as all the other coefficients included in the objective function and the structural analysis of a circular reinforced concrete section (see Table 1) and the discrete alternatives of the circular reinforced concrete column section (see Table 2). It should be noted that the construction costs and the CO2 emissions that arise during the construction of reinforced concrete are not included in the objective functions. The circular reinforced concrete section has the following design variables: column diameter (Φ), location of neutral axis (cx), steel reinforcement area (As,main), which is determined by the number of rebars (n), and reinforcement diameter (Φmain), see Figure 2.

2.1. Objective Functions of the Optimization Model RCCS

Material cost optimization refers to the process of reducing the cost of producing a product or service by selecting the least expensive materials or minimizing the amount of materials used. This process is primarily focused on reducing the financial cost of producing a product. Optimizing the amount of CO2 generated by the use of materials, on the other hand, refers to the process of reducing the greenhouse gas emissions generated in the production of a product or service. This process is primarily aimed at reducing the environmental impact of producing a product. Although these two concepts may overlap to some degree, they are ultimately different. For example, it is possible to reduce the material cost of a product by selecting a cheaper material, but this may result in a higher amount of CO2 emissions during production. Conversely, it is possible to reduce the amount of CO2 emissions by using more environmentally friendly materials, but this may result in higher material costs. Ultimately, companies and investors need to find a balance between optimizing the cost of materials and optimizing the amount of CO2 generated by the use of materials in order to achieve their economic and environmental goals. Therefore, the two objective functions are determined in the optimization model RCCS. The material cost objective function is defined with Equation (1):
m i n :   C O S T = c c o n   ·   ( π   ·   Φ 2 / 4 )   ·   L + c s t e e l   ·   ρ s t e e l   ·   ( π   ·   Φ m a i n 2 / 4 )   ·   L   ·   n
whereas the objective function for the quantity of CO2 emissions during the production of reinforced concrete sections is defined by Equation (2):
m i n :   C O 2 = C O 2 , c o n   ·   ( π   ·   Φ 2 / 4 )   ·   L + C O 2 , s t e e l   ·   ρ s t e e l   ·   ( π   ·   Φ m a i n 2 / 4 )   ·   L   ·   n
In Equation (1), ccon (€/m3) represents the unit price of concrete and csteel (€/kg) is the unit price of the steel reinforcement, whereas in Equation (2), the CO2,con (kgCO2/m3) represents the unit emissions of CO2 generated by the use of concrete and the CO2,steel (kgCO2/kg) is the unit emissions of CO2 generated by the use of steel reinforcement.

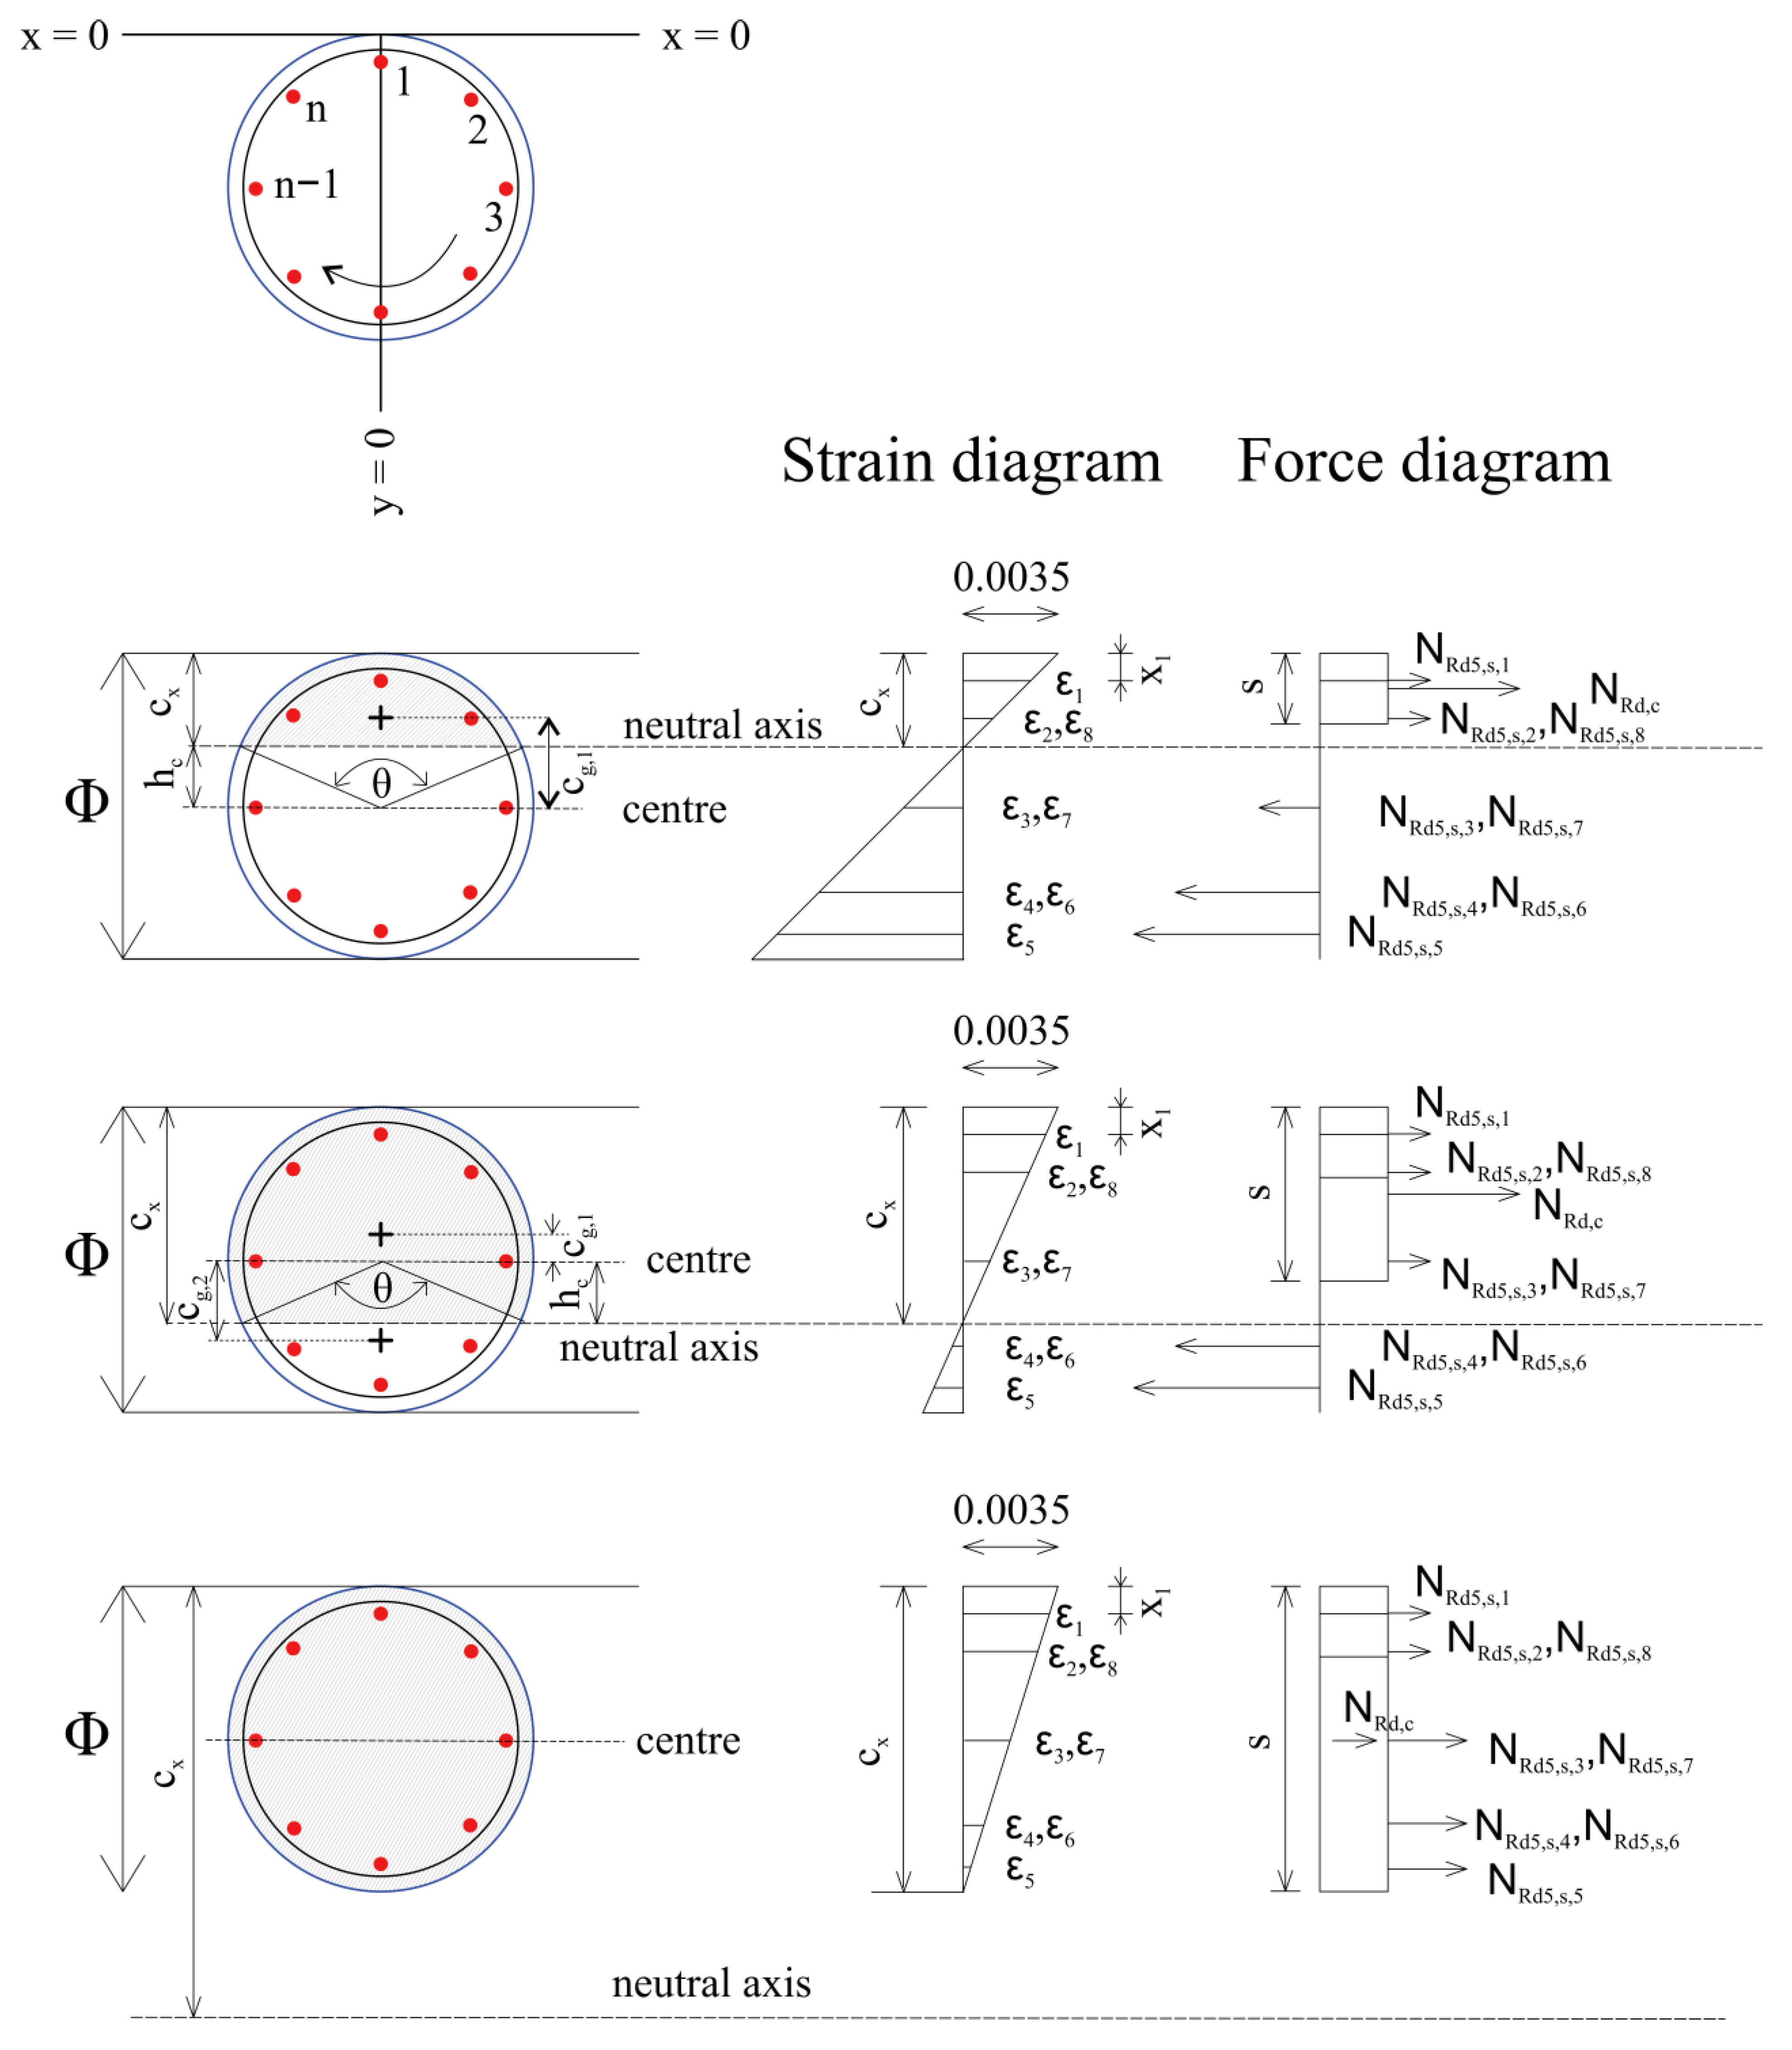
2.2. Structural Analysis of a Reinforced Circular Concrete Section and Design Constraints

Both objective functions aim to minimize the amount of concrete and steel reinforcement; however, the circular reinforced concrete cross section must be able to resist the applied loads with a sufficient amount of material. The resistance of a circular reinforced concrete section is calculated based on the location of the neutral axis. The neutral axis is located at a distance cx below the compression face, where the cross section experiences neither compression nor tension, resulting in zero strain at that level. Five main conditions are defined in accordance with the Eurocode 2 [24] standard in the form of five inequality constraints:
Condition 1: the design bending moment MEd in the circular reinforced concrete cross section needs to be limited to under the design bending resistance MRd, see Equation (3).
M E d M R d
Condition 2: the design axial load NEd applied to the circular reinforced concrete cross section needs to be limited to under the design axial resistance or cross section NRd, see Equation (4).
N E d N R d
Condition 3: the minimum area of the main reinforcement must be provided, see Equation (5).
A s , t o t a l A s , m i n
Condition 4: the distance between the neutral axis cx and the edge of the cross section must always be positive, see Equation (6).
c x 0
Condition 5: the maximum area of the main reinforcement must not be exceeded, see Equation (5).
A s , t o t a l A s , m a x
The calculation procedure to determine the design bending resistance MRd and the design axial resistance NRd of the reinforced concrete circular cross section is presented in Equations (8)–(50). First, the design compressive strength of the concrete fcd (see Equation (8)) and the design tensile strength of the steel fyd (see Equation (9)) are calculated:
f c d = α c c   ·   f c k / γ c ,
f y d = f y k / γ s
In the proposed model, each rebar is assigned a unique identification number (ID) along with its exact position in the coordinate system. The diameter of circle that joins the centroid of the rebars can be calculated with Equation (10), and the circumference of this internal circle is calculated by Equation (11):
Φ i n = Φ 2 · c c o n 2 · Φ l i n k Φ m a i n ,
P i n = π   ·   Φ i n
It should be noted that ccon represents the depth of concrete cover. The center to center spacing between rebars that are evenly placed is calculated by using Equation (12):
s m a i n = π   ·   Φ i n / n
The clear spacing between rebars sclear is therefore calculated by Equation (13); the angle between each adjacent rebar θr is calculated by Equation (14):
s c l e a r = s Φ m a i n ,
θ r = s m a i n / r
where
r = Φ i n / 2 ,
s = 0.8   ·   c x
The steel reinforcement of area As of a single rebar is calculated as:
A s = π   ·   Φ m a i n 2 / 4
For each rebar (where i is from 1 to n), the position relative to the center of the circular cross section can be defined with:
x n c , i = r   ·   cos θ c u m m , i ,
y n c , i = r   ·   sin θ c u m m , i
where the cumulative angle from the vertical in a clockwise direction is determined as:
θ c u m m , i = ( i 1 )   ·   θ r
The location according to selected coordinate system (see, Figure 1 and Figure 2) is therefore defined with:
x n , i = Φ m a i n / 2 x n c , i ,
y n , i = y n c , i ,
To calculate the strain in each rebar εi at various locations of neutral axis, Equations (23)–(31) are used:
x i i = c x   ·   ( i ( i 1 ) ) ,
T i = x i i x n , i ,
U i = x n , i x i i ,
A i = 0.0035   ·   ( T i / x i i ) ,
B i = 0.0035   ·   ( U i / x i i ) ,
C i = f y d / E s ,
D i = min ( B i ; C i ) ,
z e r o i = 0 ,
ε i = { A i ;   T i z e r o i   and   s Φ   D i ;   T i < z e r o i 0.00175
The resistance force developed in rebars (NRd5,s,i) under compression (NRd3,s,i) or under tension (NRd4,s,i) is determined by Equations (32)–(36):
N R d 1 , s , i = min ( E s   ·   ε i   ·   A s ; f y d   ·   A s ) ,
N R d 2 , s , i = min ( ( E s   ·   ε i ( α c c / γ c )   ·   f c k )   ·   A s ; ( f y d ( α c c / γ c )   ·   f c k )   ·   A s ) ,
N R d 3 , s , i = { N R d 1 , s , i ;     s x n , i   N R d 2 , s , i ,
N R d 4 , s , i = min ( E s   ·   ε i   ·   A s ; f y d   ·   A s ) ,
N R d 5 , s , i = { N R d 3 , s , i ;     T i > z e r o i   N R d 4 , s , i
The design bending resistance of concrete and reinforcing bars is calculated by multiplying the developed resistance force by the lever arm from the center of the column cross section, as determined in Figure 2. Since the cross section is symmetrical, the center point is located at the center of the column cross section. The lever arm for concrete varies with the position of the neutral axis, but the lever arm for each rebar can be determined by Equation (37):
l n , i = Φ / 2 x n , i
Once the resistance force and the lever arm for each rebar is determined, the bending moment resistance (MRd,s,i) for each rebar is calculated by Equation (38):
M R d , s , i = N R d 5 , s , i   ·   l n , i
Finally, the total axial load resistance (NRd,s,total) and the total bending moment resistance (MRd,s,total) due to all reinforcing bars are calculated using Equation (39) and Equation (40), respectively:
N R d , s , t o t a l = i = 1 n N R d 5 , s , i ,
M R d , s , t o t a l = i = 1 n M R d , s , i
The distance from neutral axis and the center of the section hc is determined as:
h c = { Φ / 2 s   ;   s Φ / 2   s Φ / 2 ;   s Φ   and   s > Φ / 2 0
To calculate the bending moment resistance due to the concrete resisting force, the lever arm for the concrete force (cg,1 or cg,2) and the concrete area under compression (Ac) are calculated using Equations (42)–(47), see Figure 2:
A c = {   θ 2   ·   π   ·   π   ·   Φ 2 4 1 2   ·   ( Φ 2 ) 2   ·   sin θ ;   s Φ / 2   ( 2   ·   π θ ) 2   ·   π   ·   π   ·   Φ 2 4 + 1 2   ·   ( Φ 2 ) 2   ·   sin θ ;   s Φ   and   s > Φ / 2 π   ·   Φ 2 4 ;     s > Φ
where the inner angle θ is calculated as:
θ = 2   ·   cos 1 ( h c ( Φ / 2 ) ) ,
A c 1 = 1 2   ·   π   ·   Φ 2 4 ,
A c 2 = θ 2   ·   π   ·   π   ·   Φ 2 4 1 2   ·   ( Φ 2 ) 2   ·   sin θ ,
c g , 1 = { 4   ·   ( Φ 2 )   ·   sin 3 ( θ 2 ) 3   ·   ( θ sin θ ) ;     s Φ / 2   4   ·   ( Φ 2 )   ·   sin 3 ( π 2 ) 3   ·   ( π sin π ) ,
c g , 2 = { 4   ·   ( Φ 2 )   ·   sin 3 ( θ 2 ) 3   ·   ( θ sin θ ) ;     s < Φ / 2   0
Therefore, the bending moment resistance provided by concrete for any position of the neutral axis (MRd,c) is determined by Equation (48), whereas the axial resistance of concrete (NRd,c) is determined by Equation (49):
M R d , c = {   A c   ·   f c d   ·   c g , 1 ;   s Φ / 2   A c 1   ·   f c d   ·   c g , 1 ( A c 1   ·   f c d   ·   c g , 1 A c 2   ·   f c d   ·   c g , 2 ) ;   s Φ   and   s > Φ / 2 0 ,
N R d , c = f c d   ·   A c
Summing the total axial resistance of all reinforcing bars (NRd,s,total) and the axial resistance of the concrete (NRd,c) gives the design axial resistance or cross section (NRd) according to Equation (50), whereas summing the total bending moment resistance of all reinforcing bars (MRd,s,total) and the bending moment resistance of the concrete (MRd,c) gives the design moment resistance or cross section (MRd) according to Equation (51).
N R d = N R d , c + N R d , s , t o t a l ,
M R d = M R d , c + M R d , s , t o t a l
Once the design axial and bending moment resistance or cross section is available, conditions 1 and 2 can be verified. However, for the verification of condition 3, the required minimum area of steel reinforcement (As,min) and the total area of steel reinforcement (As,total) must be calculated according to Equation (52) and Equation (53), respectively:
A s , m i n = max ( 0.1   ·   N E d f y d ; 0.002   ·   π   ·   Φ 2 4 ) ,
A s , t o t a l = A s   ·   n
The upper limit of the steel reinforcement area (As,max) is determined by Equation (54).
A s , m a x = 0.04   ·   ( π   ·   Φ 2 4 )
The structural analysis of a circular reinforced concrete cross section also includes design (in)equality constraints that ensure that the dimensions of the circular reinforced concrete cross section do not lie outside the specified limits. In addition, the discrete/standardized values for the dimensions are used in the RCCS optimization model (see Table 2). However, the diameter of the concrete cross section Φ (m) is limited by Equation (55), the number of reinforcing bars n (-) varies between the lower and upper limits, see Equation (56), and, finally, the diameter of the reinforcing bars Φmain (mm) is limited by Equation (57).
Φ L O Φ Φ U P ,
n L O n n U P ,
Φ m a i n L O Φ m a i n Φ m a i n L O
Table 1. The input data involved in objective functions and structural analysis of a reinforced circular concrete section.
SymbolDescriptionValue
cconunit price of concrete C30/37115 EUR/m3
csteelunit price of the steel reinforcement S5001.45 EUR/kg
CO2,con *unit emissions of CO2 for concrete308.2 kgCO2/m3
CO2,steel *unit emissions of CO2 for steel reinforcement0.87 kgCO2/kg
ρsteelsteel density7850 kg/m3
Llength of the column section1 m
fckthe compressive strength of the concrete30 MPa
fyktensile strength of the steel500 MPa
Esmodulus of elasticity of steel 200,000 MPa
γcsafety factor for concrete 1.5
γssafety factor for steel 1.15
αcccoefficient for sustained compression 0.85
Φlinkdiameter of shear reinforcement6 mm
cconconcrete cover30 mm
* The carbon footprint emission factors used in the study are taken from the literature [25].
Table 2. Discrete alternatives for the dimensions of the circular reinforced concrete cross section.
VariableDiscrete Alternatives
Φ (mm)400, 450, 500, 550, 600, 650, 700, 750, 800, 850, 900, 950, 1000
n (-)6, 8, 10, 12, 14, 16, 18, 20, 22
Φmain (mm)12, 14, 16, 18, 20, 22, 24, 26, 28

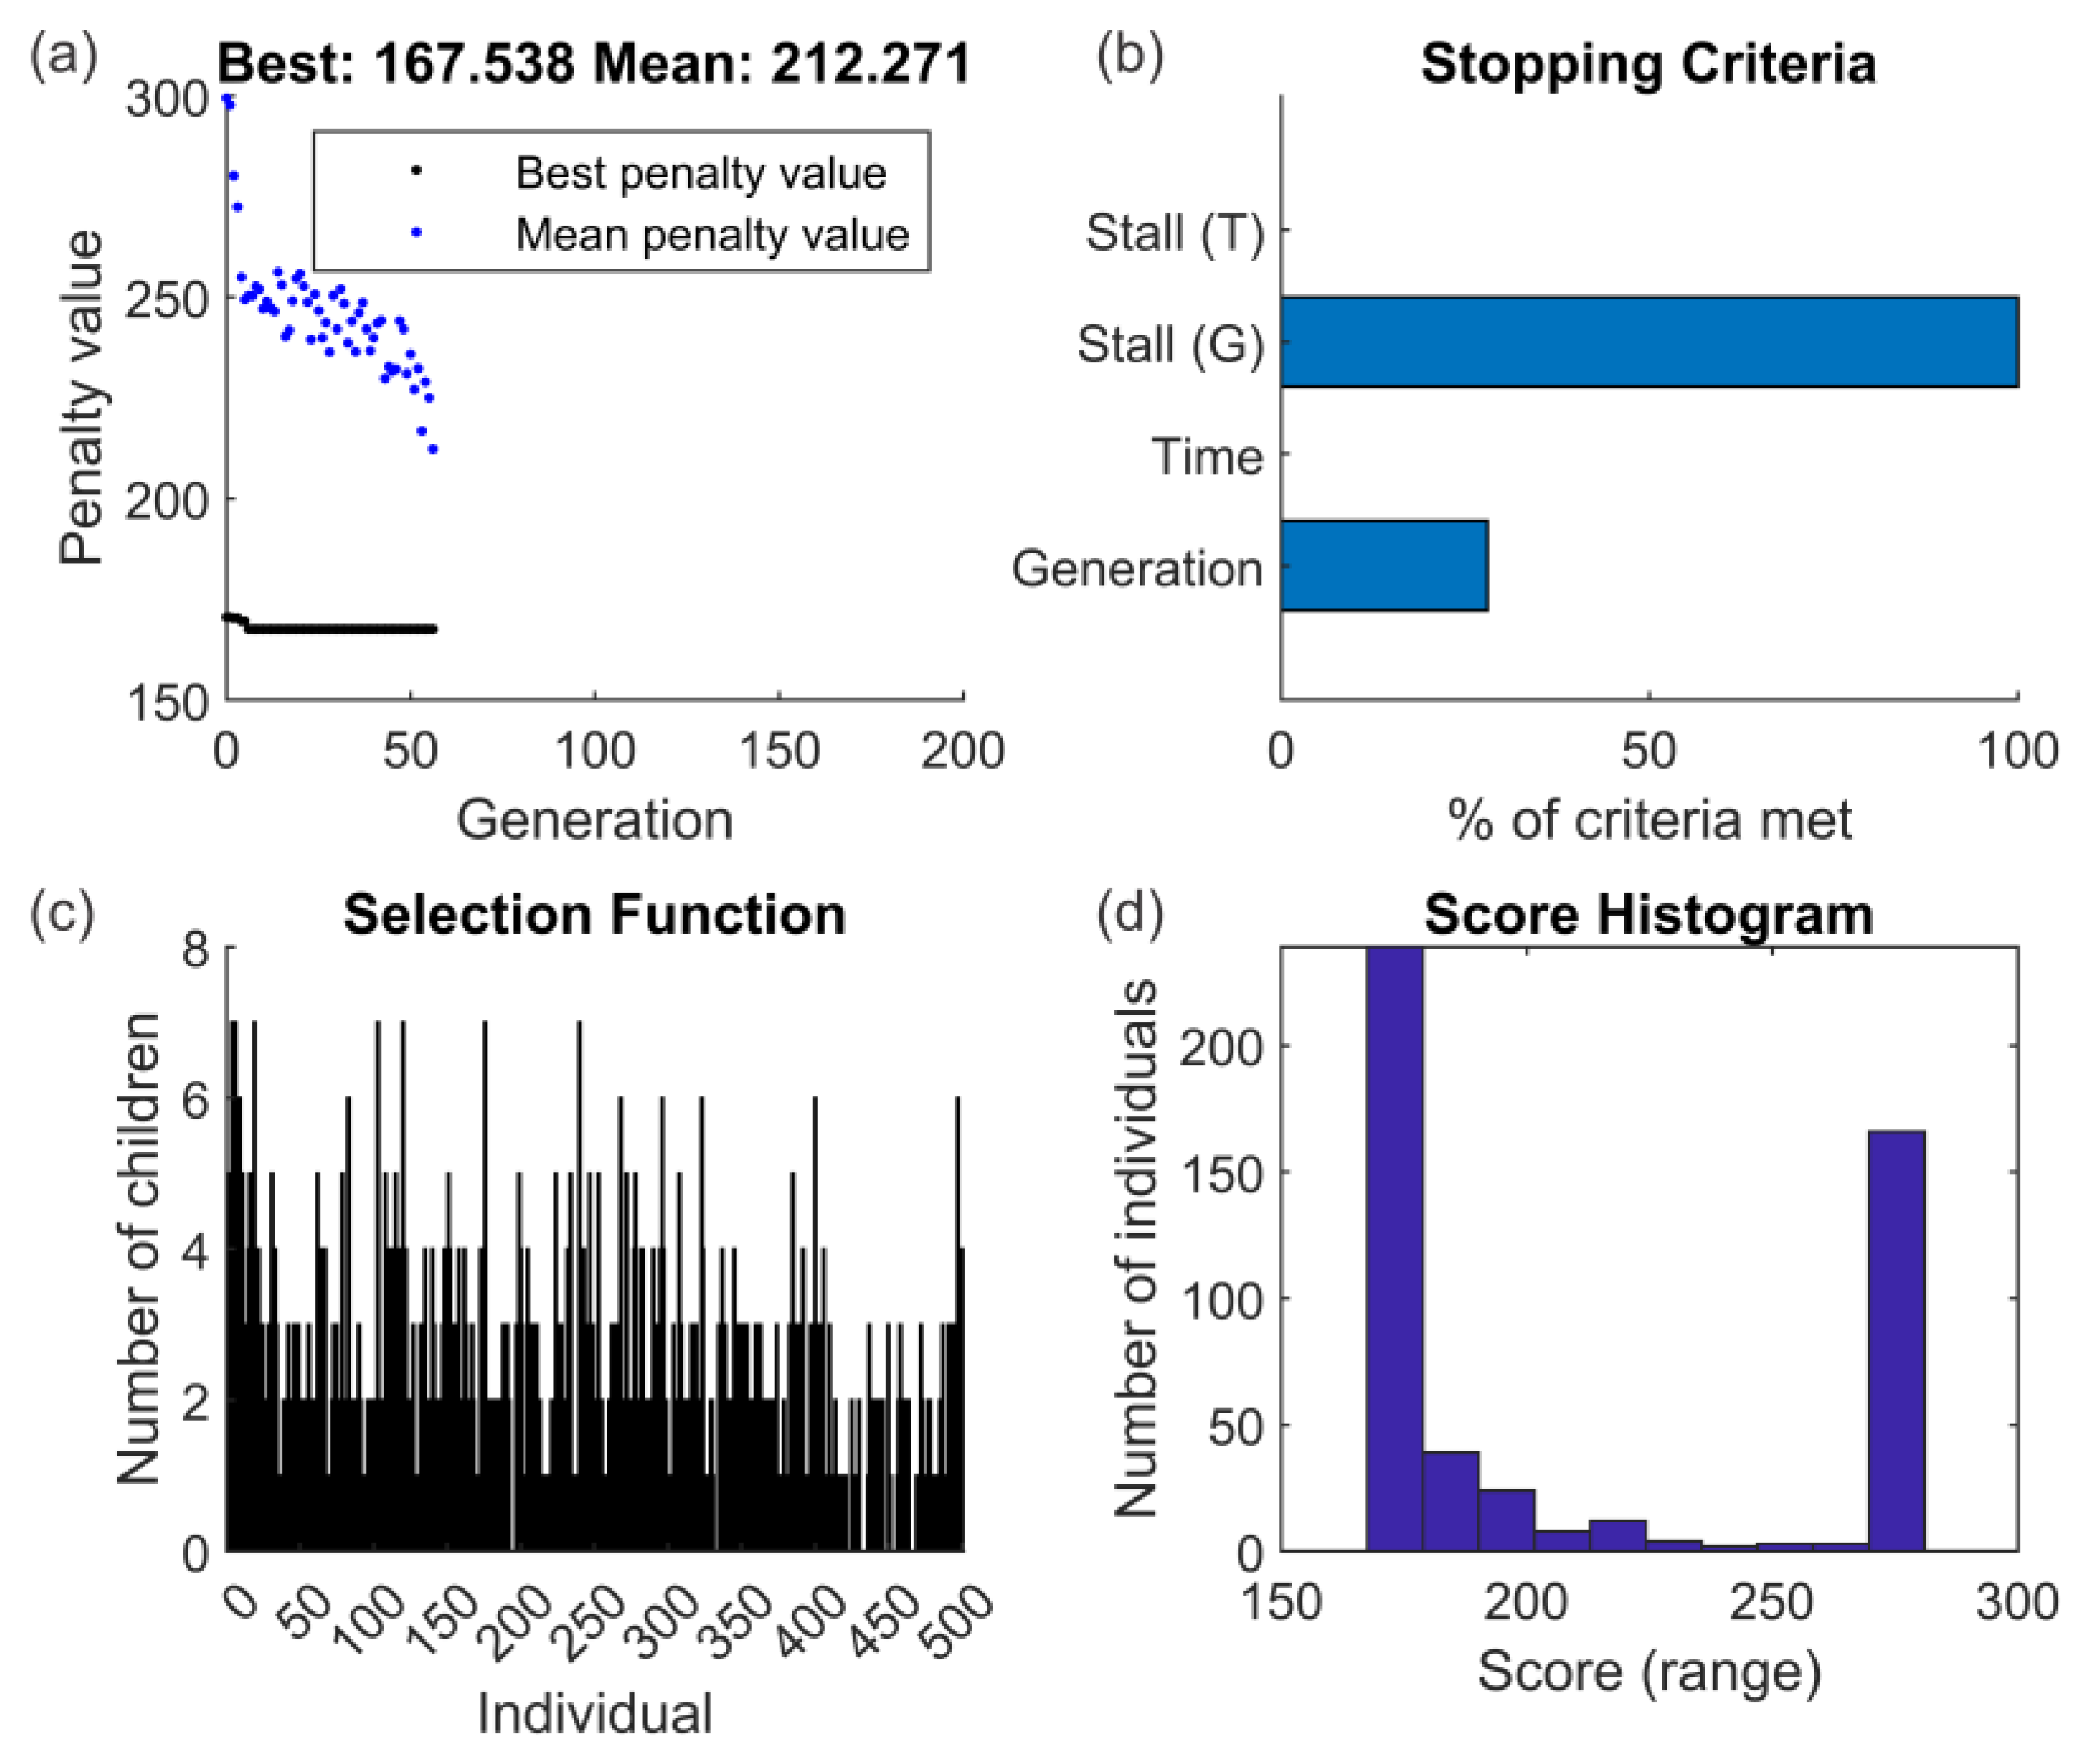
2.3. Genetic Algorithm

In MATLAB [23], the genetic algorithm (GA) provides built-in functions for implementing genetic algorithms. To use GAs for mixed-integer design problems, the following steps were performed: First, the objective functions (COST and CO2 emissions) and constraints (four conditions) were defined. The design variables were also defined. One variable is continuous (neutral axis location), whereas the other three variables are discrete (number of rebars, diameter of steel reinforcement, and diameter of column). The fitness function was determined to evaluate the objective(s) of the optimization problem. This function was included in the design variables and returns a scalar fitness value. Constraints that must be satisfied are also defined, such as upper and lower bounds for the design variables. The parameters of GA, such as population size, maximum number of generations, tolerance threshold for the fitness function, mutation rate, and crossover proportion, are selected to improve the optimization results. Once the best solution is found, the integer variables are mapped to a discrete set. To map integer variables to a discrete set, the MATLAB toolbox provides built-in options for integer constraints. These methods were used to constrain integer variables to a finite set of values. The results of the optimization, including the fitness value and the values of the design variables, are evaluated separately for each objective function in the multiparametric optimization section and simultaneously for both objective functions in the multi-objective optimization section, whereas the optimal solution is presented as a set of Pareto-optimal solutions. In the multi-objective optimization problem presented, the main objective is to minimize the first objective function subject to the condition that the value of the second objective function does not exceed the threshold. This threshold represents the maximum allowable value for the second objective function that the decision maker is willing to accept given the importance of the first objective and the tradeoffs between the two objectives. The threshold values are implicitly determined by the fitness scaling function and the selection criteria used in the genetic algorithm. The fitness scaling function maps the objective values of the solutions in the population to a common scale that allows the algorithm to compare solutions with different objective function values. The selection criteria are used to select the solutions that will be used to generate the next generation of solutions. These criteria consider both the objective values of the solutions and their dominance relationship with other solutions in the population. The main options of the genetic algorithm were set as follows: a population size of 500, a maximum number of generations of 200, a number of elites of 20, and a function tolerance for the fitness function of 1 × 10⁻⁸. In the multi-objective optimization, a large population size of 1000 was used to increase the diversity of the population and improve the chance of finding better solutions; a maximum of 50 was used to limit the number of generations without progress and 100 generations was used to set the maximum number of generations for the execution of the GA. By setting these parameters correctly, it is possible to optimize the GA for multi-objective optimization and obtain high-quality solutions. The obtained solutions satisfy the optimization criteria, and the genetic algorithm has effectively explored the search space, efficiently evaluated potential solutions, and found solutions that are close to the best possible solution.

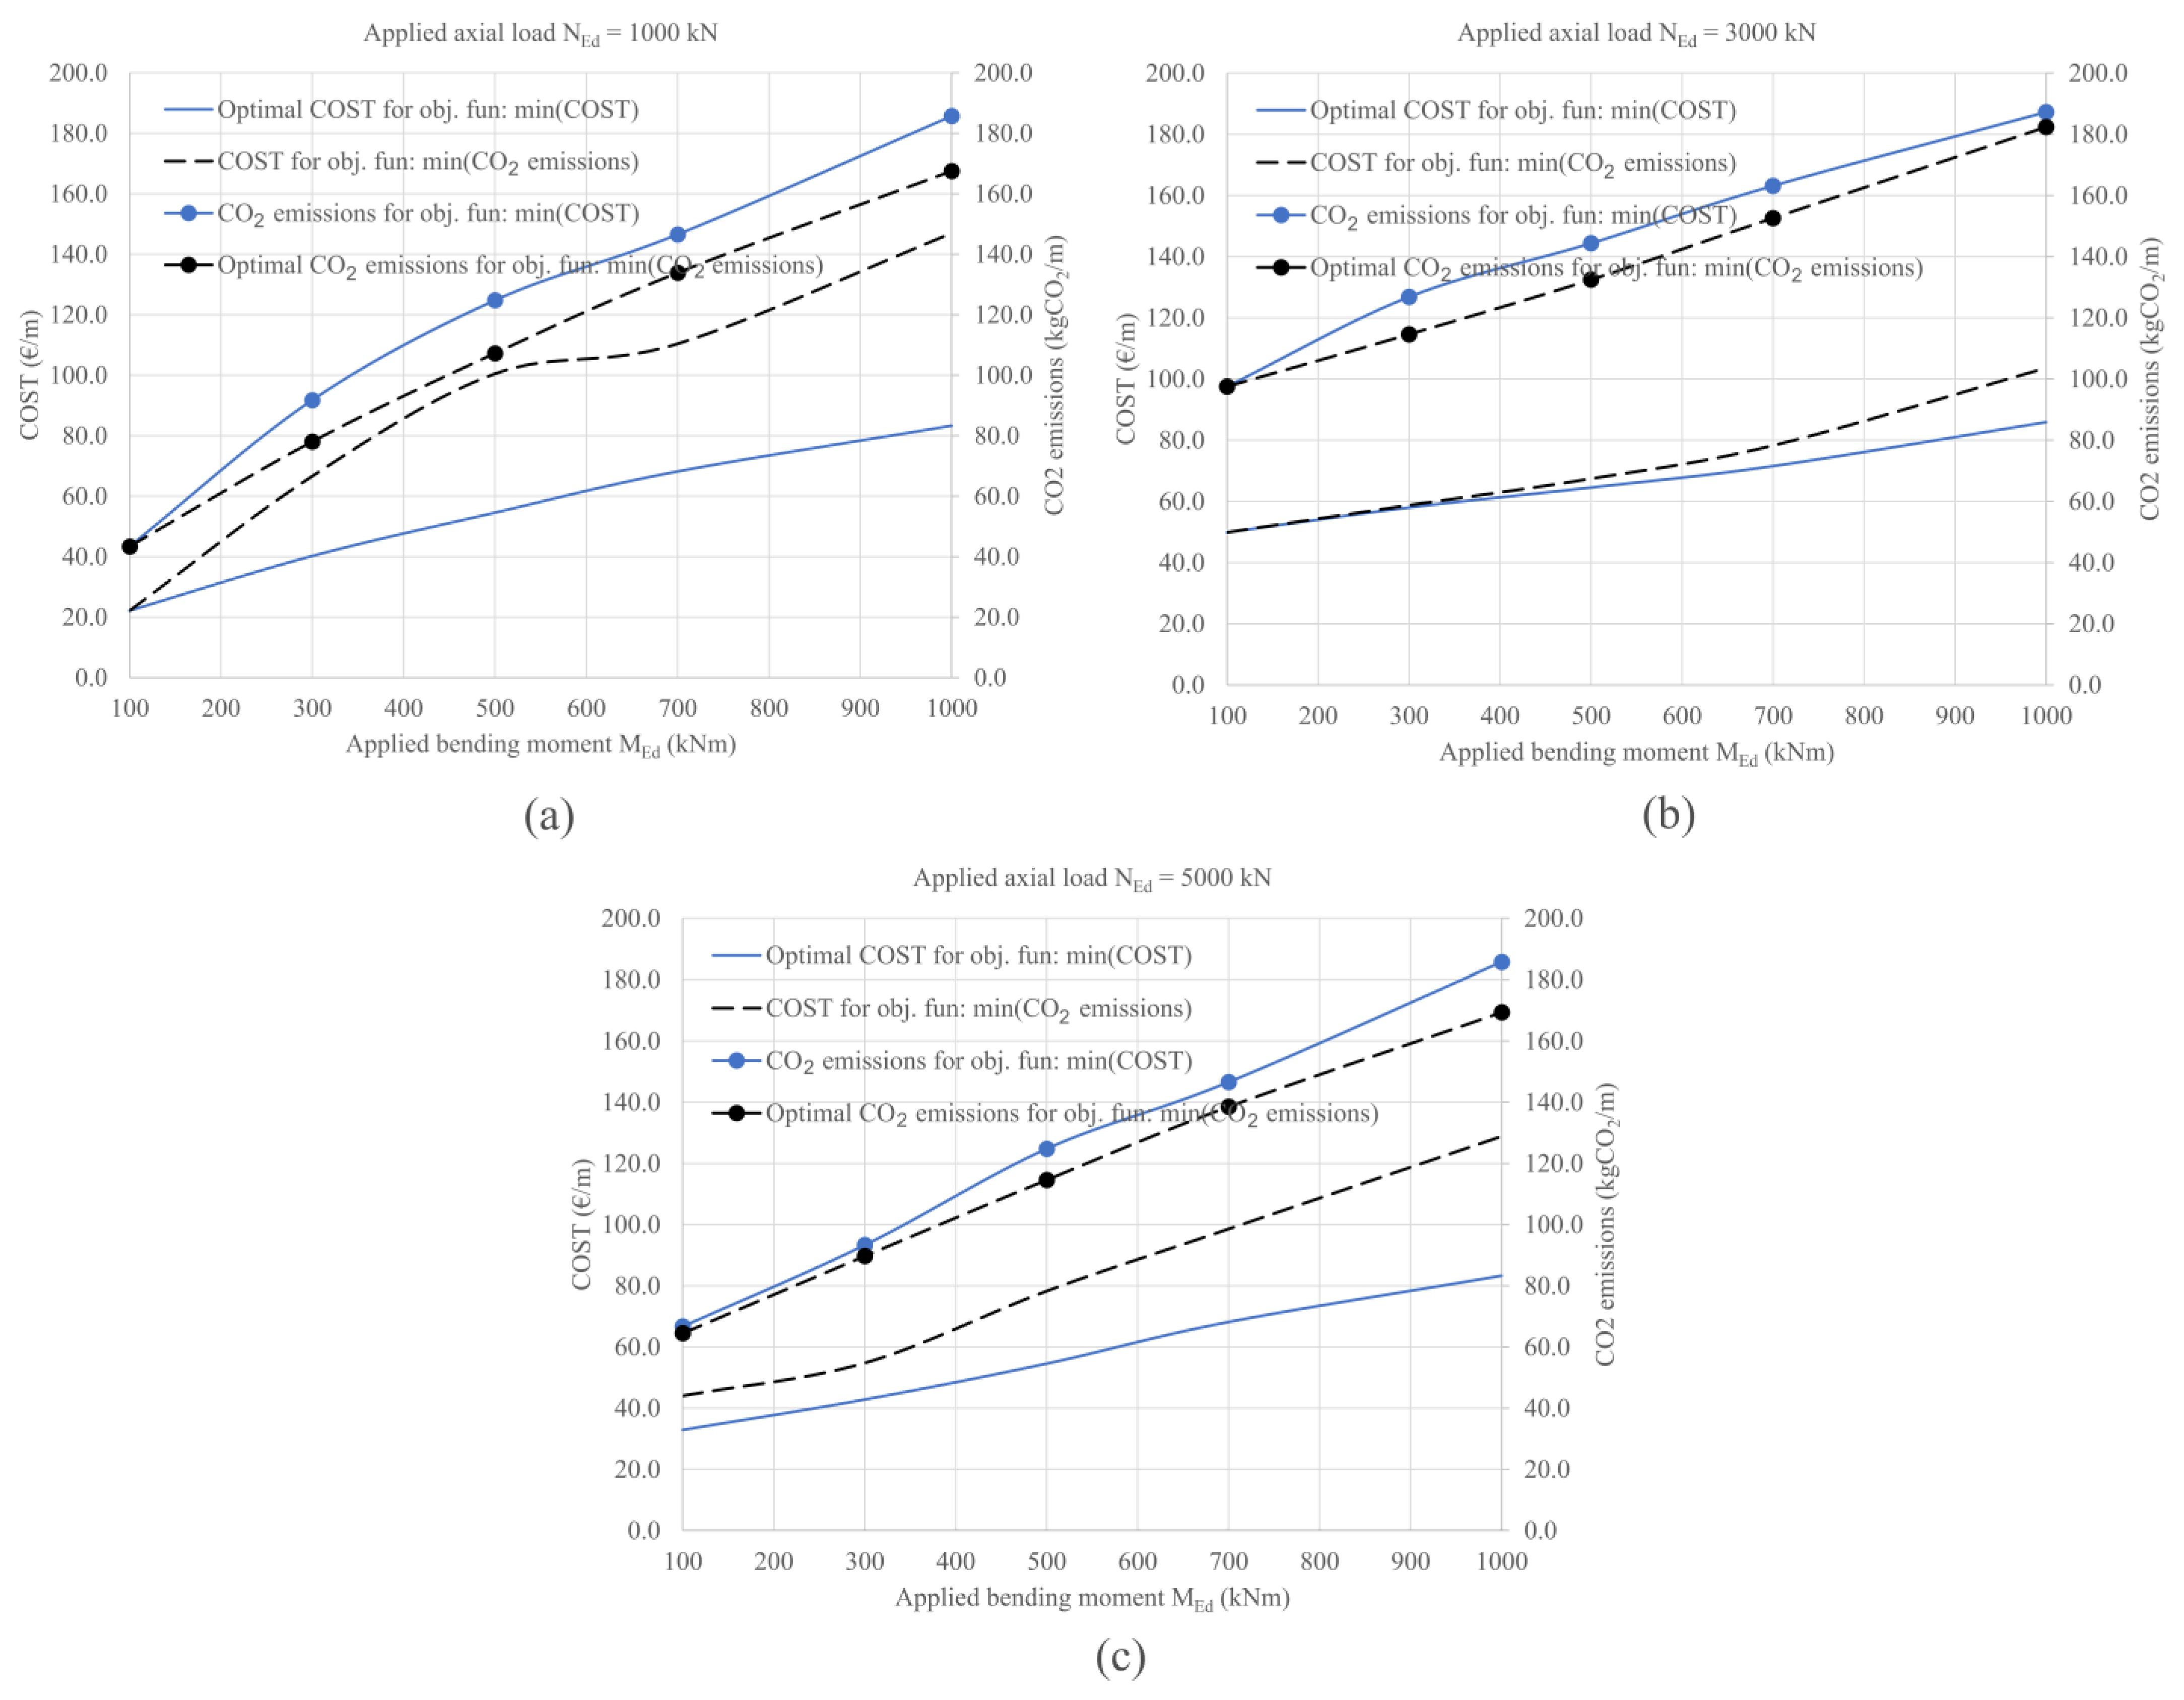
3. Multiparametric Optimization

The previously defined optimization model RCCS was used to obtain the optimal designs for different combinations of applied axial load NEd and bending moments MEd and for the two objective functions material cost and CO2 emissions separately. The multiparametric optimization was therefore performed for 30 combinations between the following different design parameters:
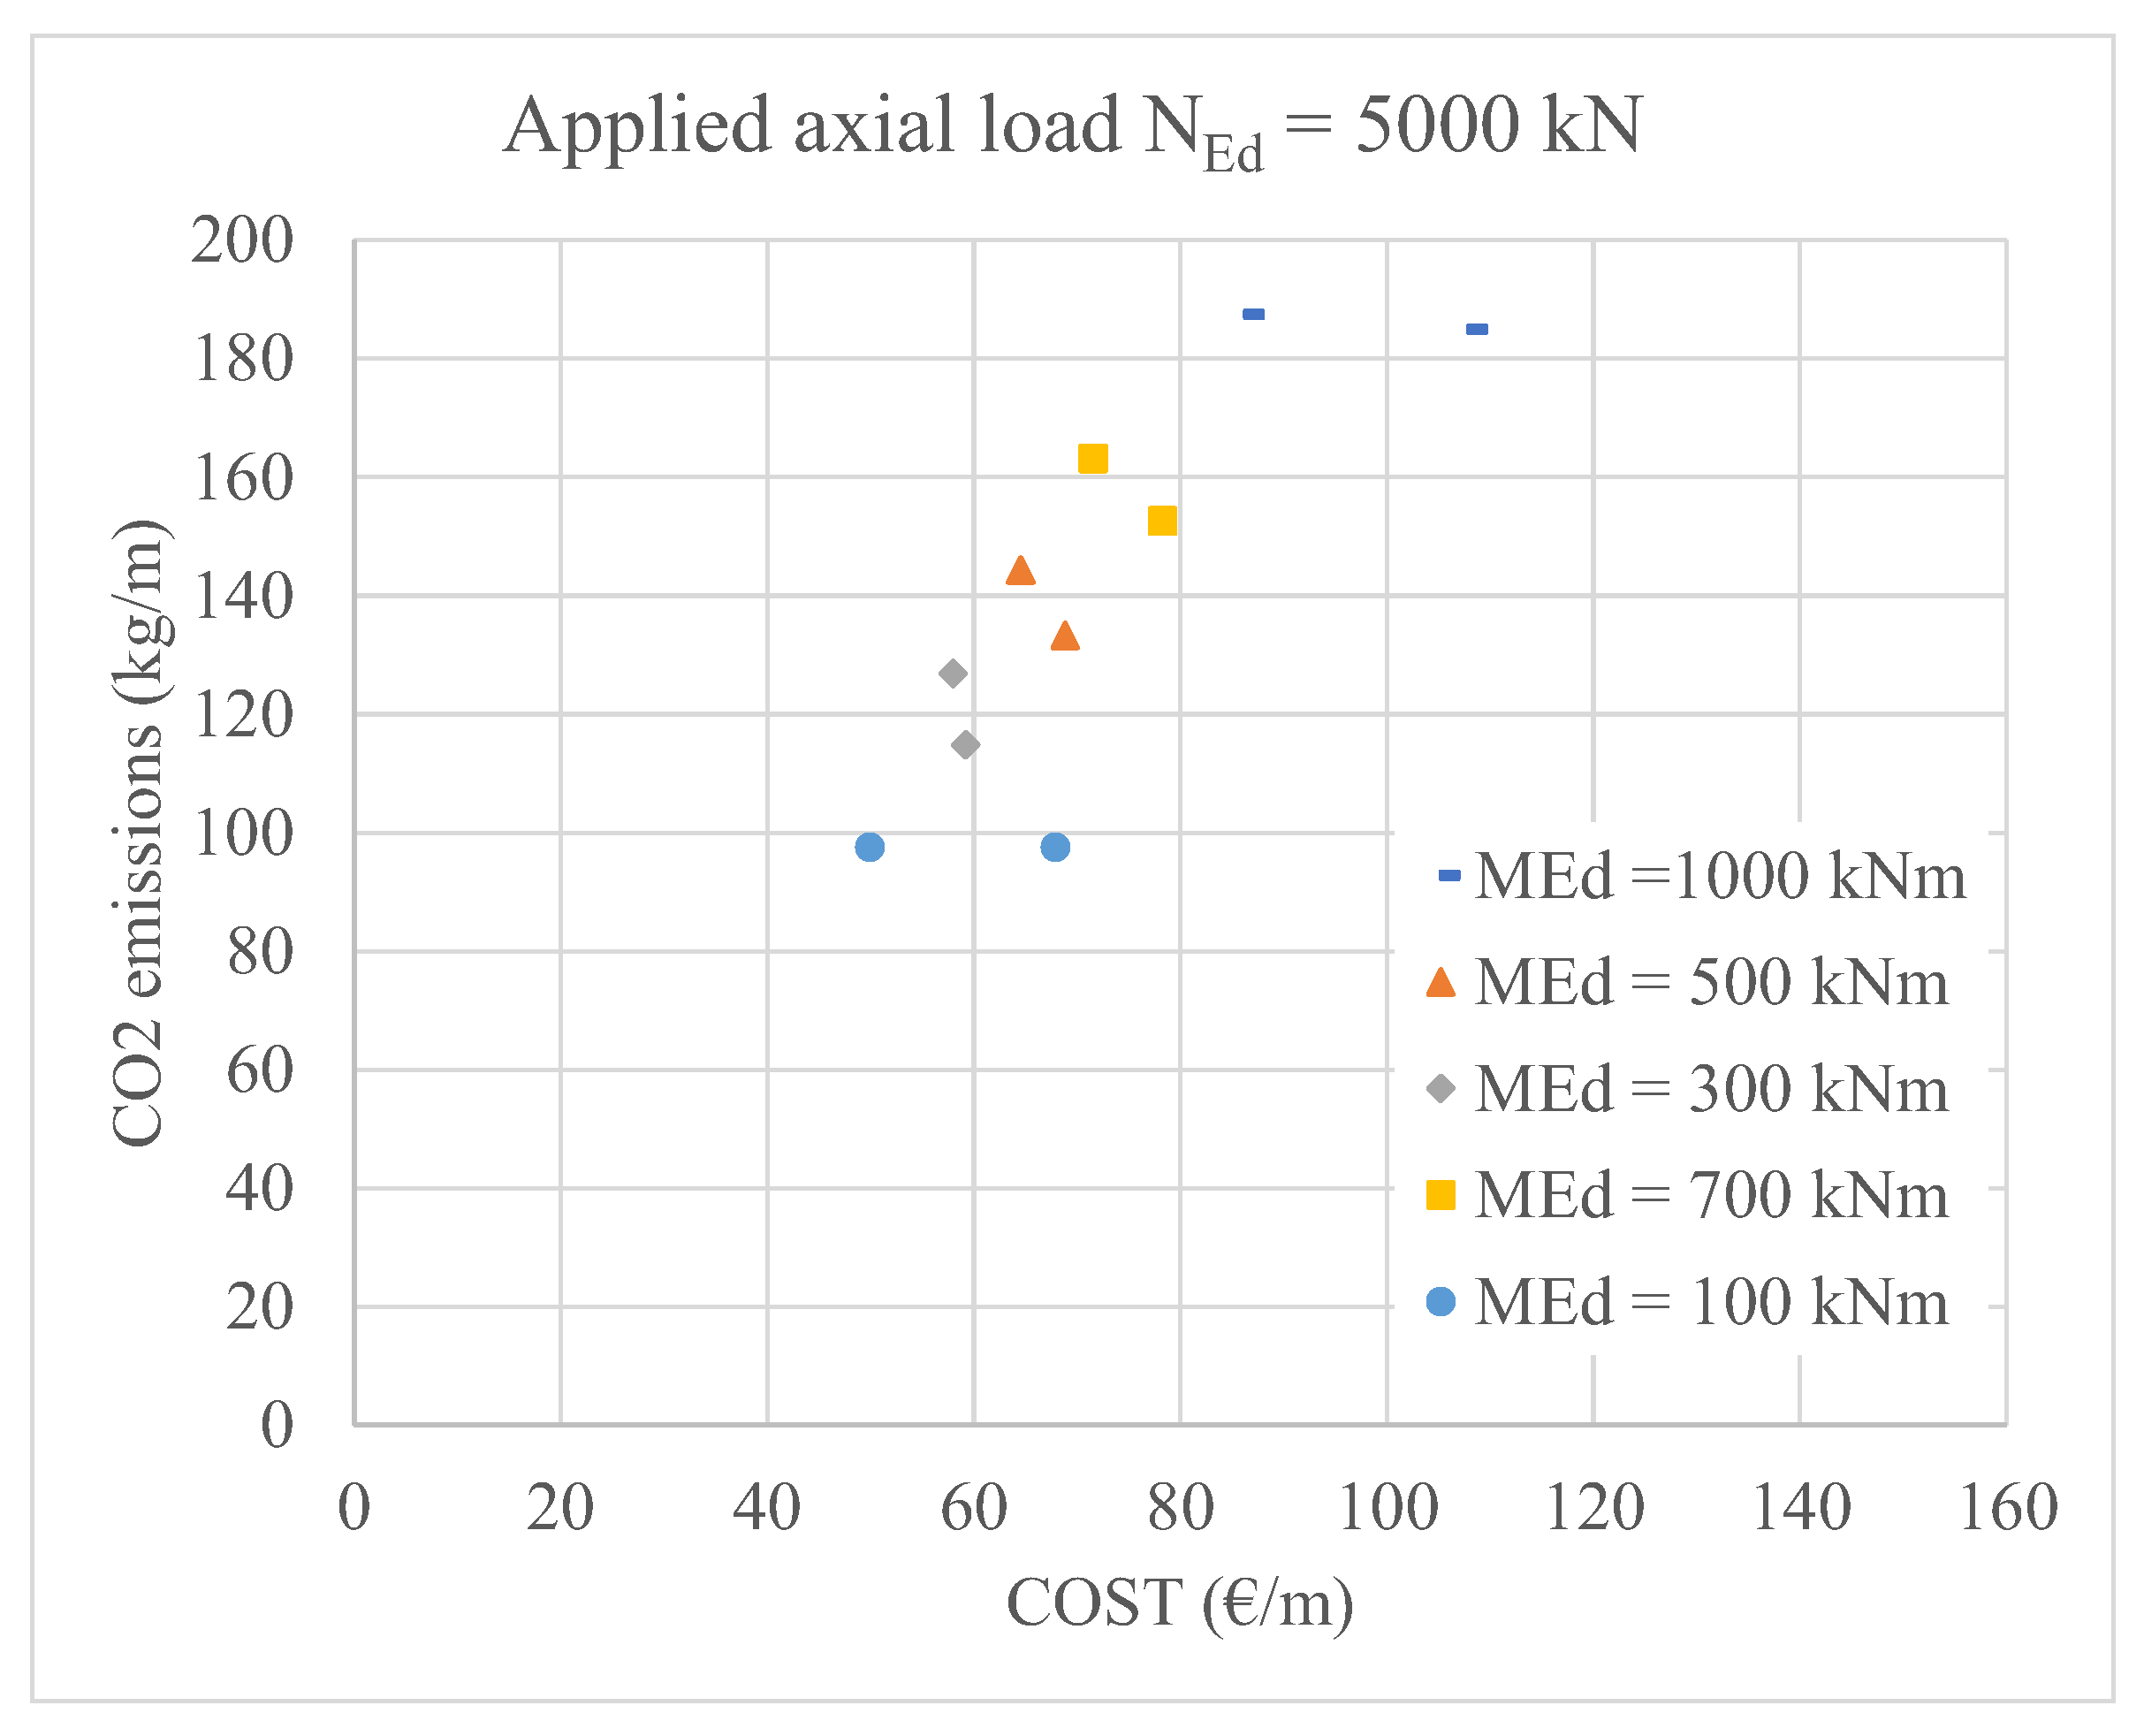
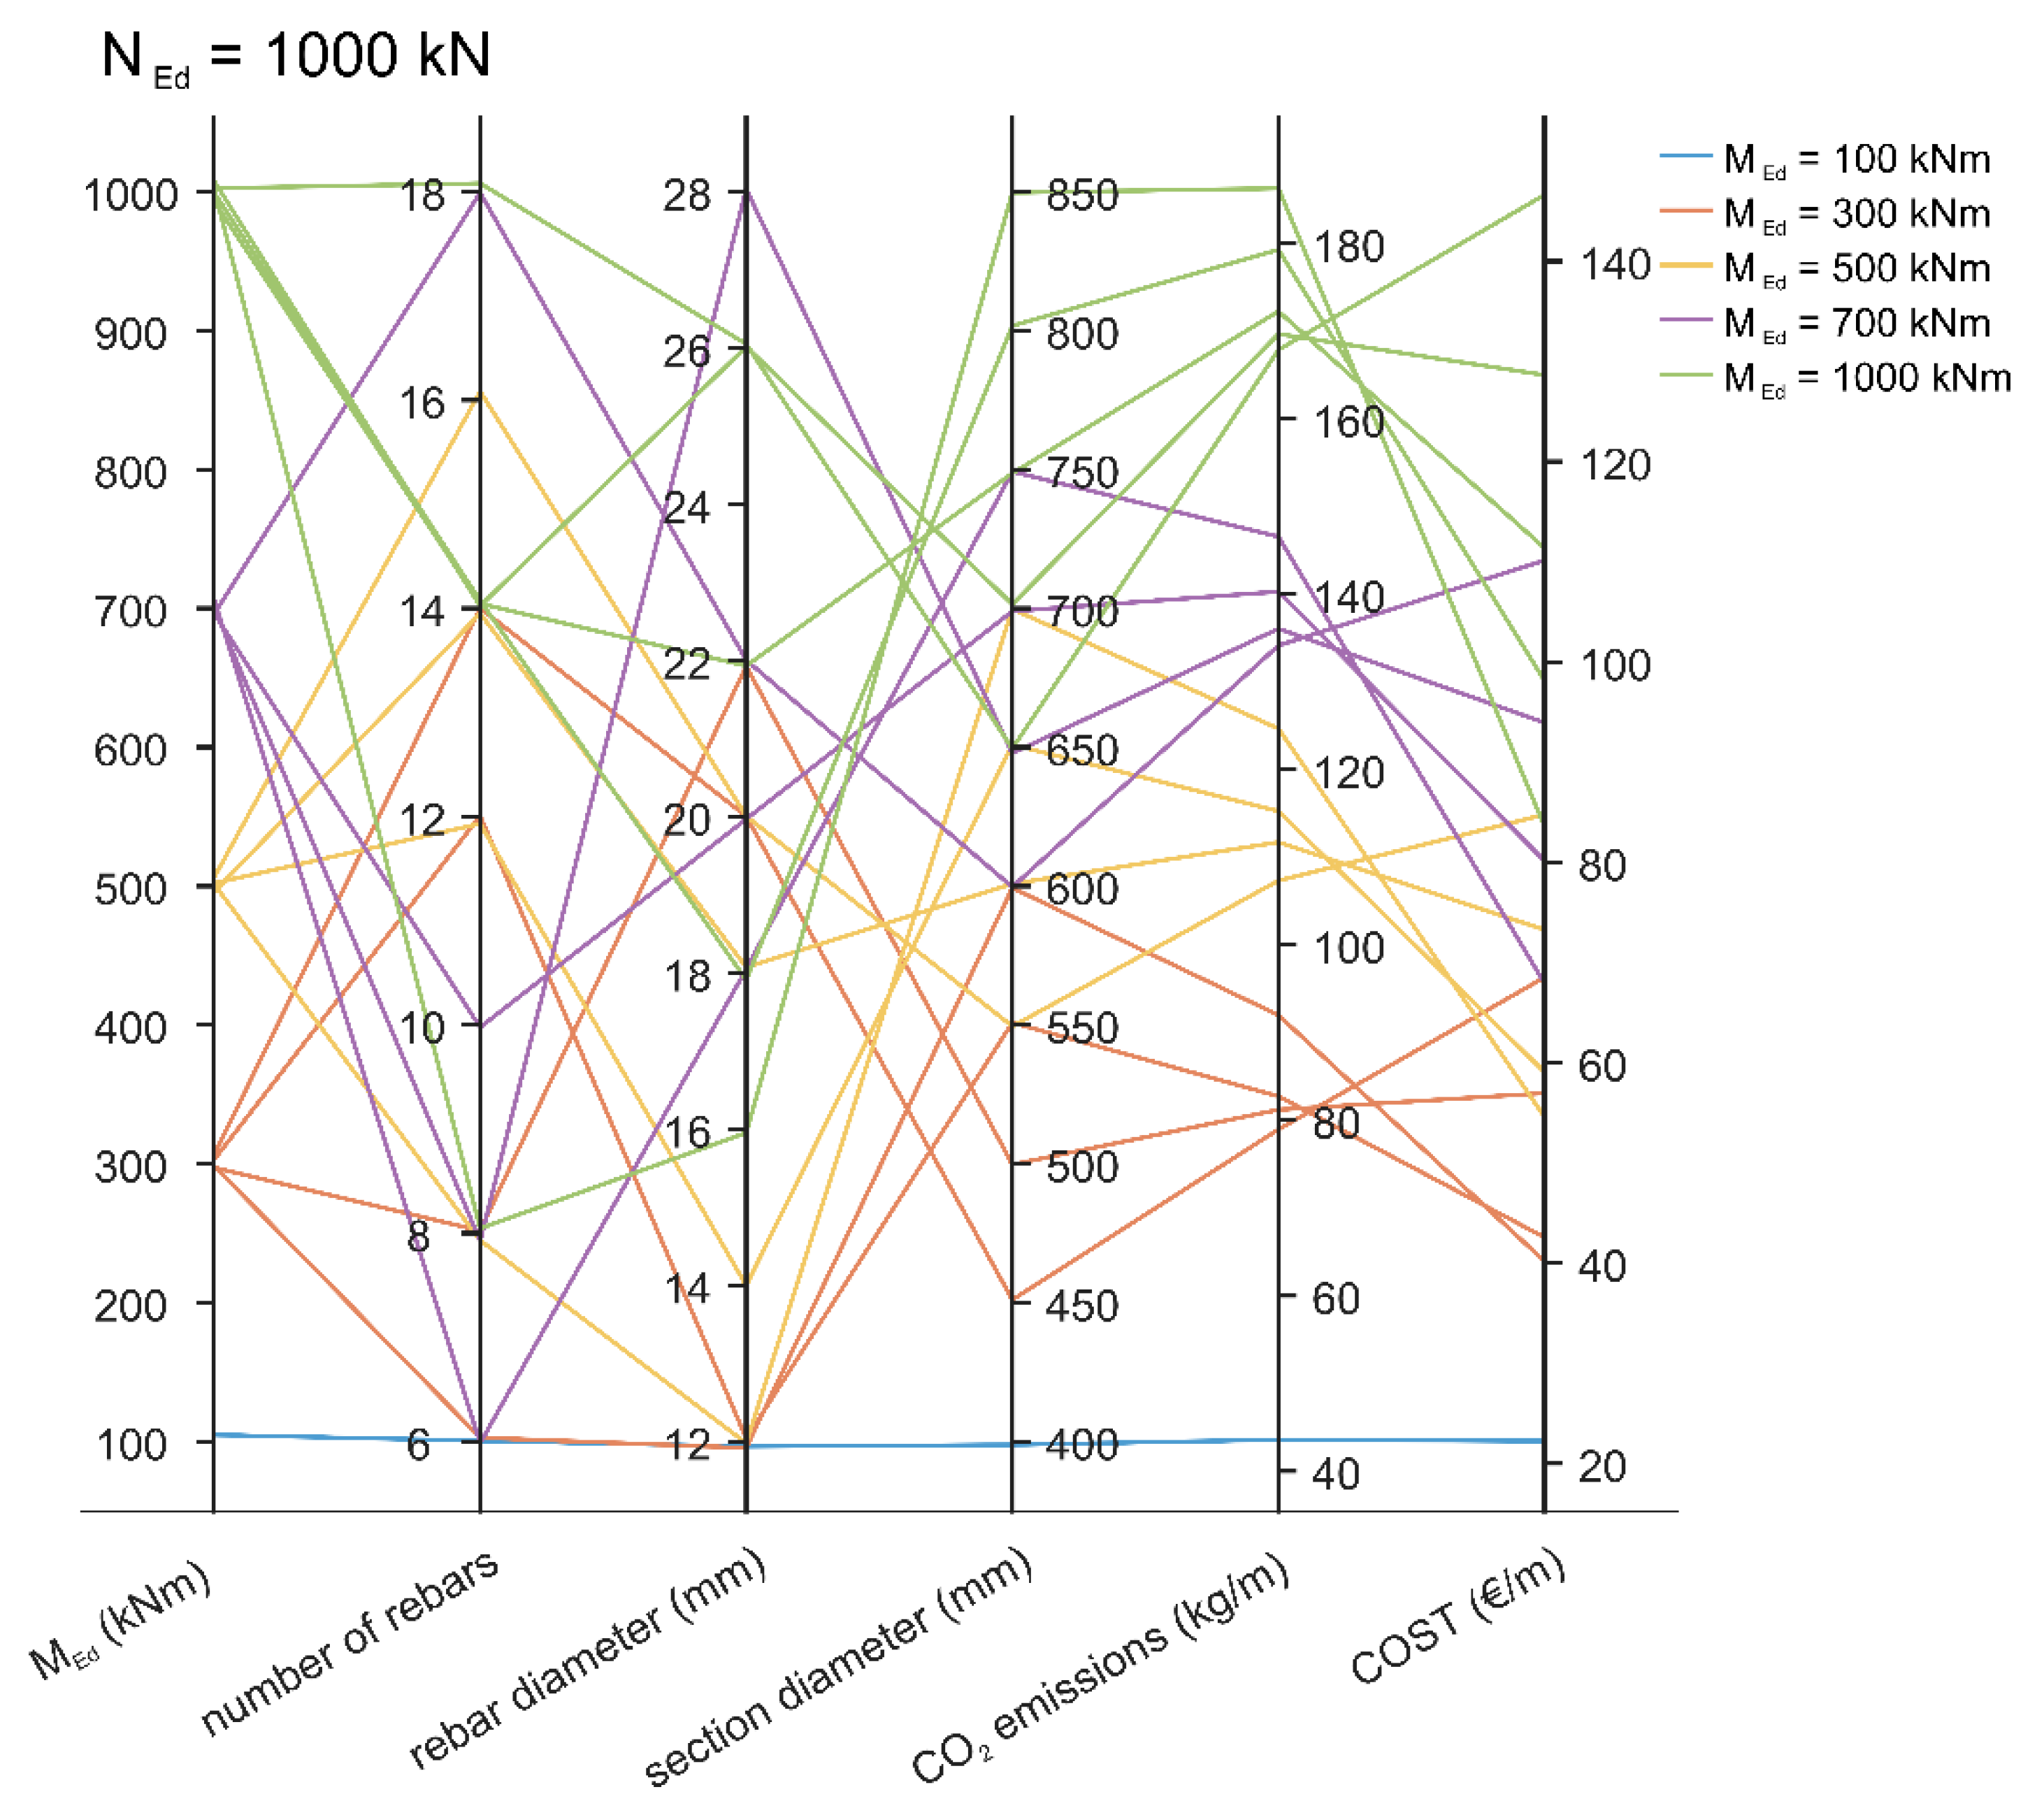
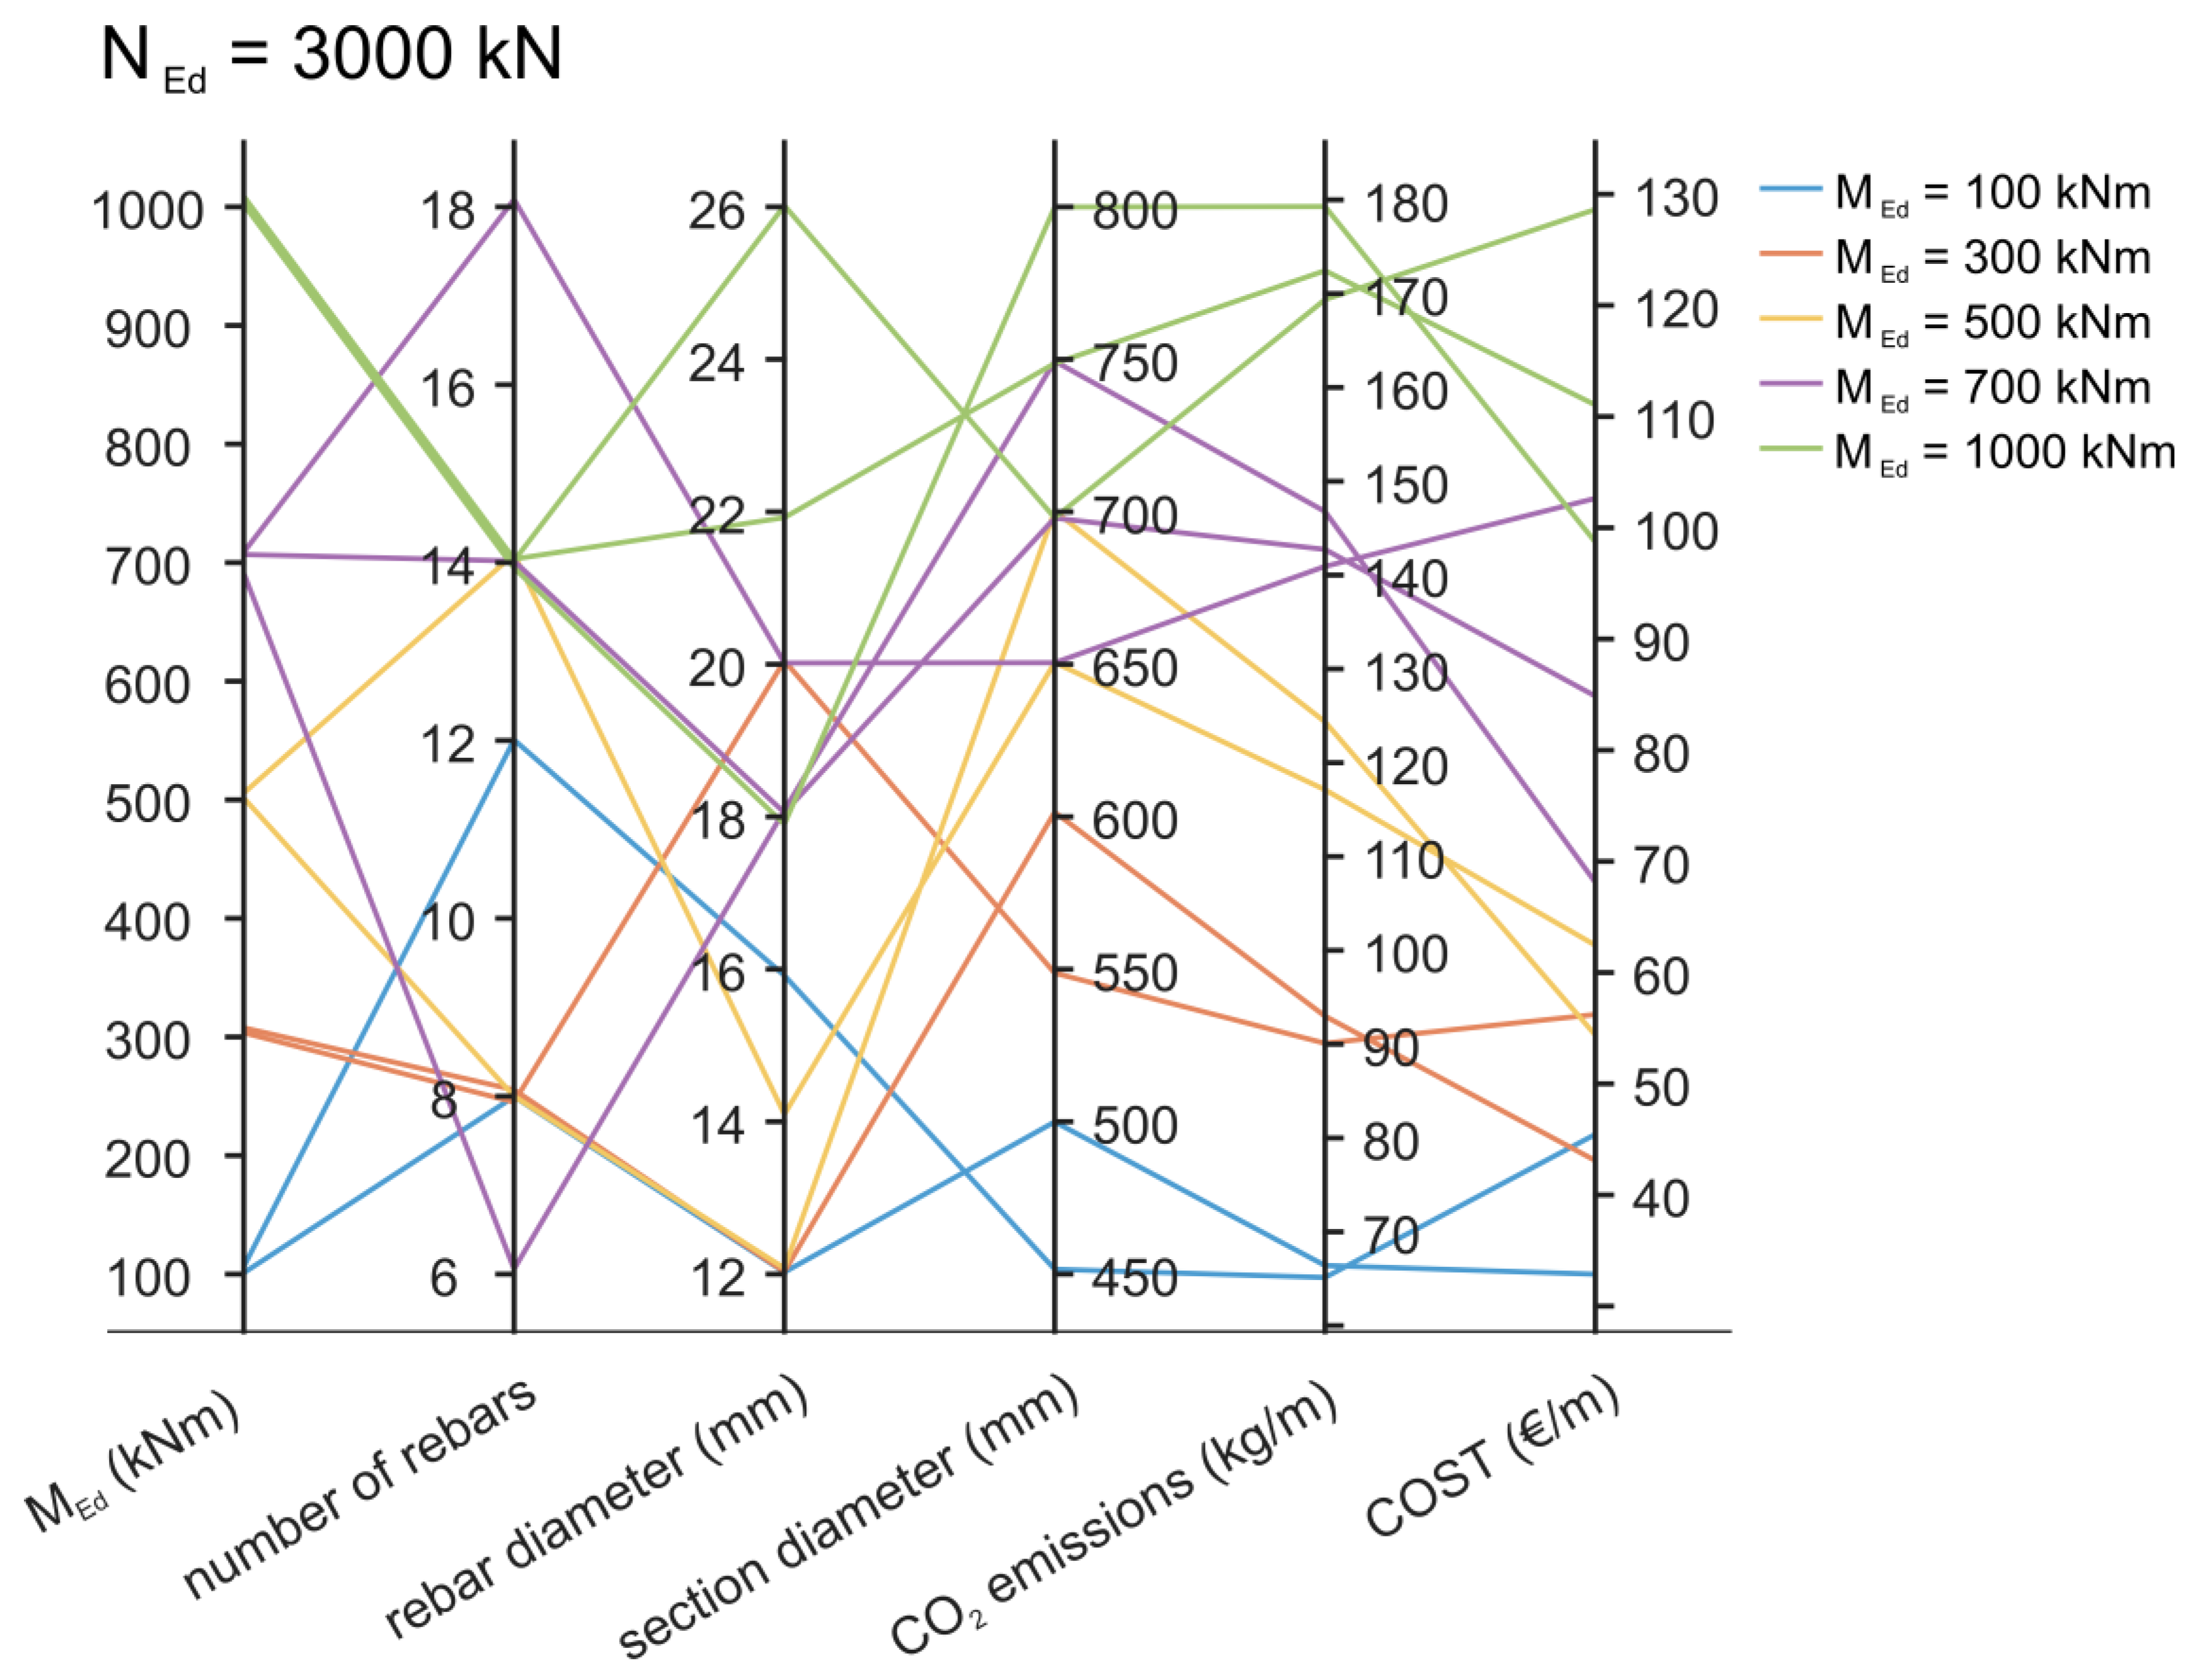
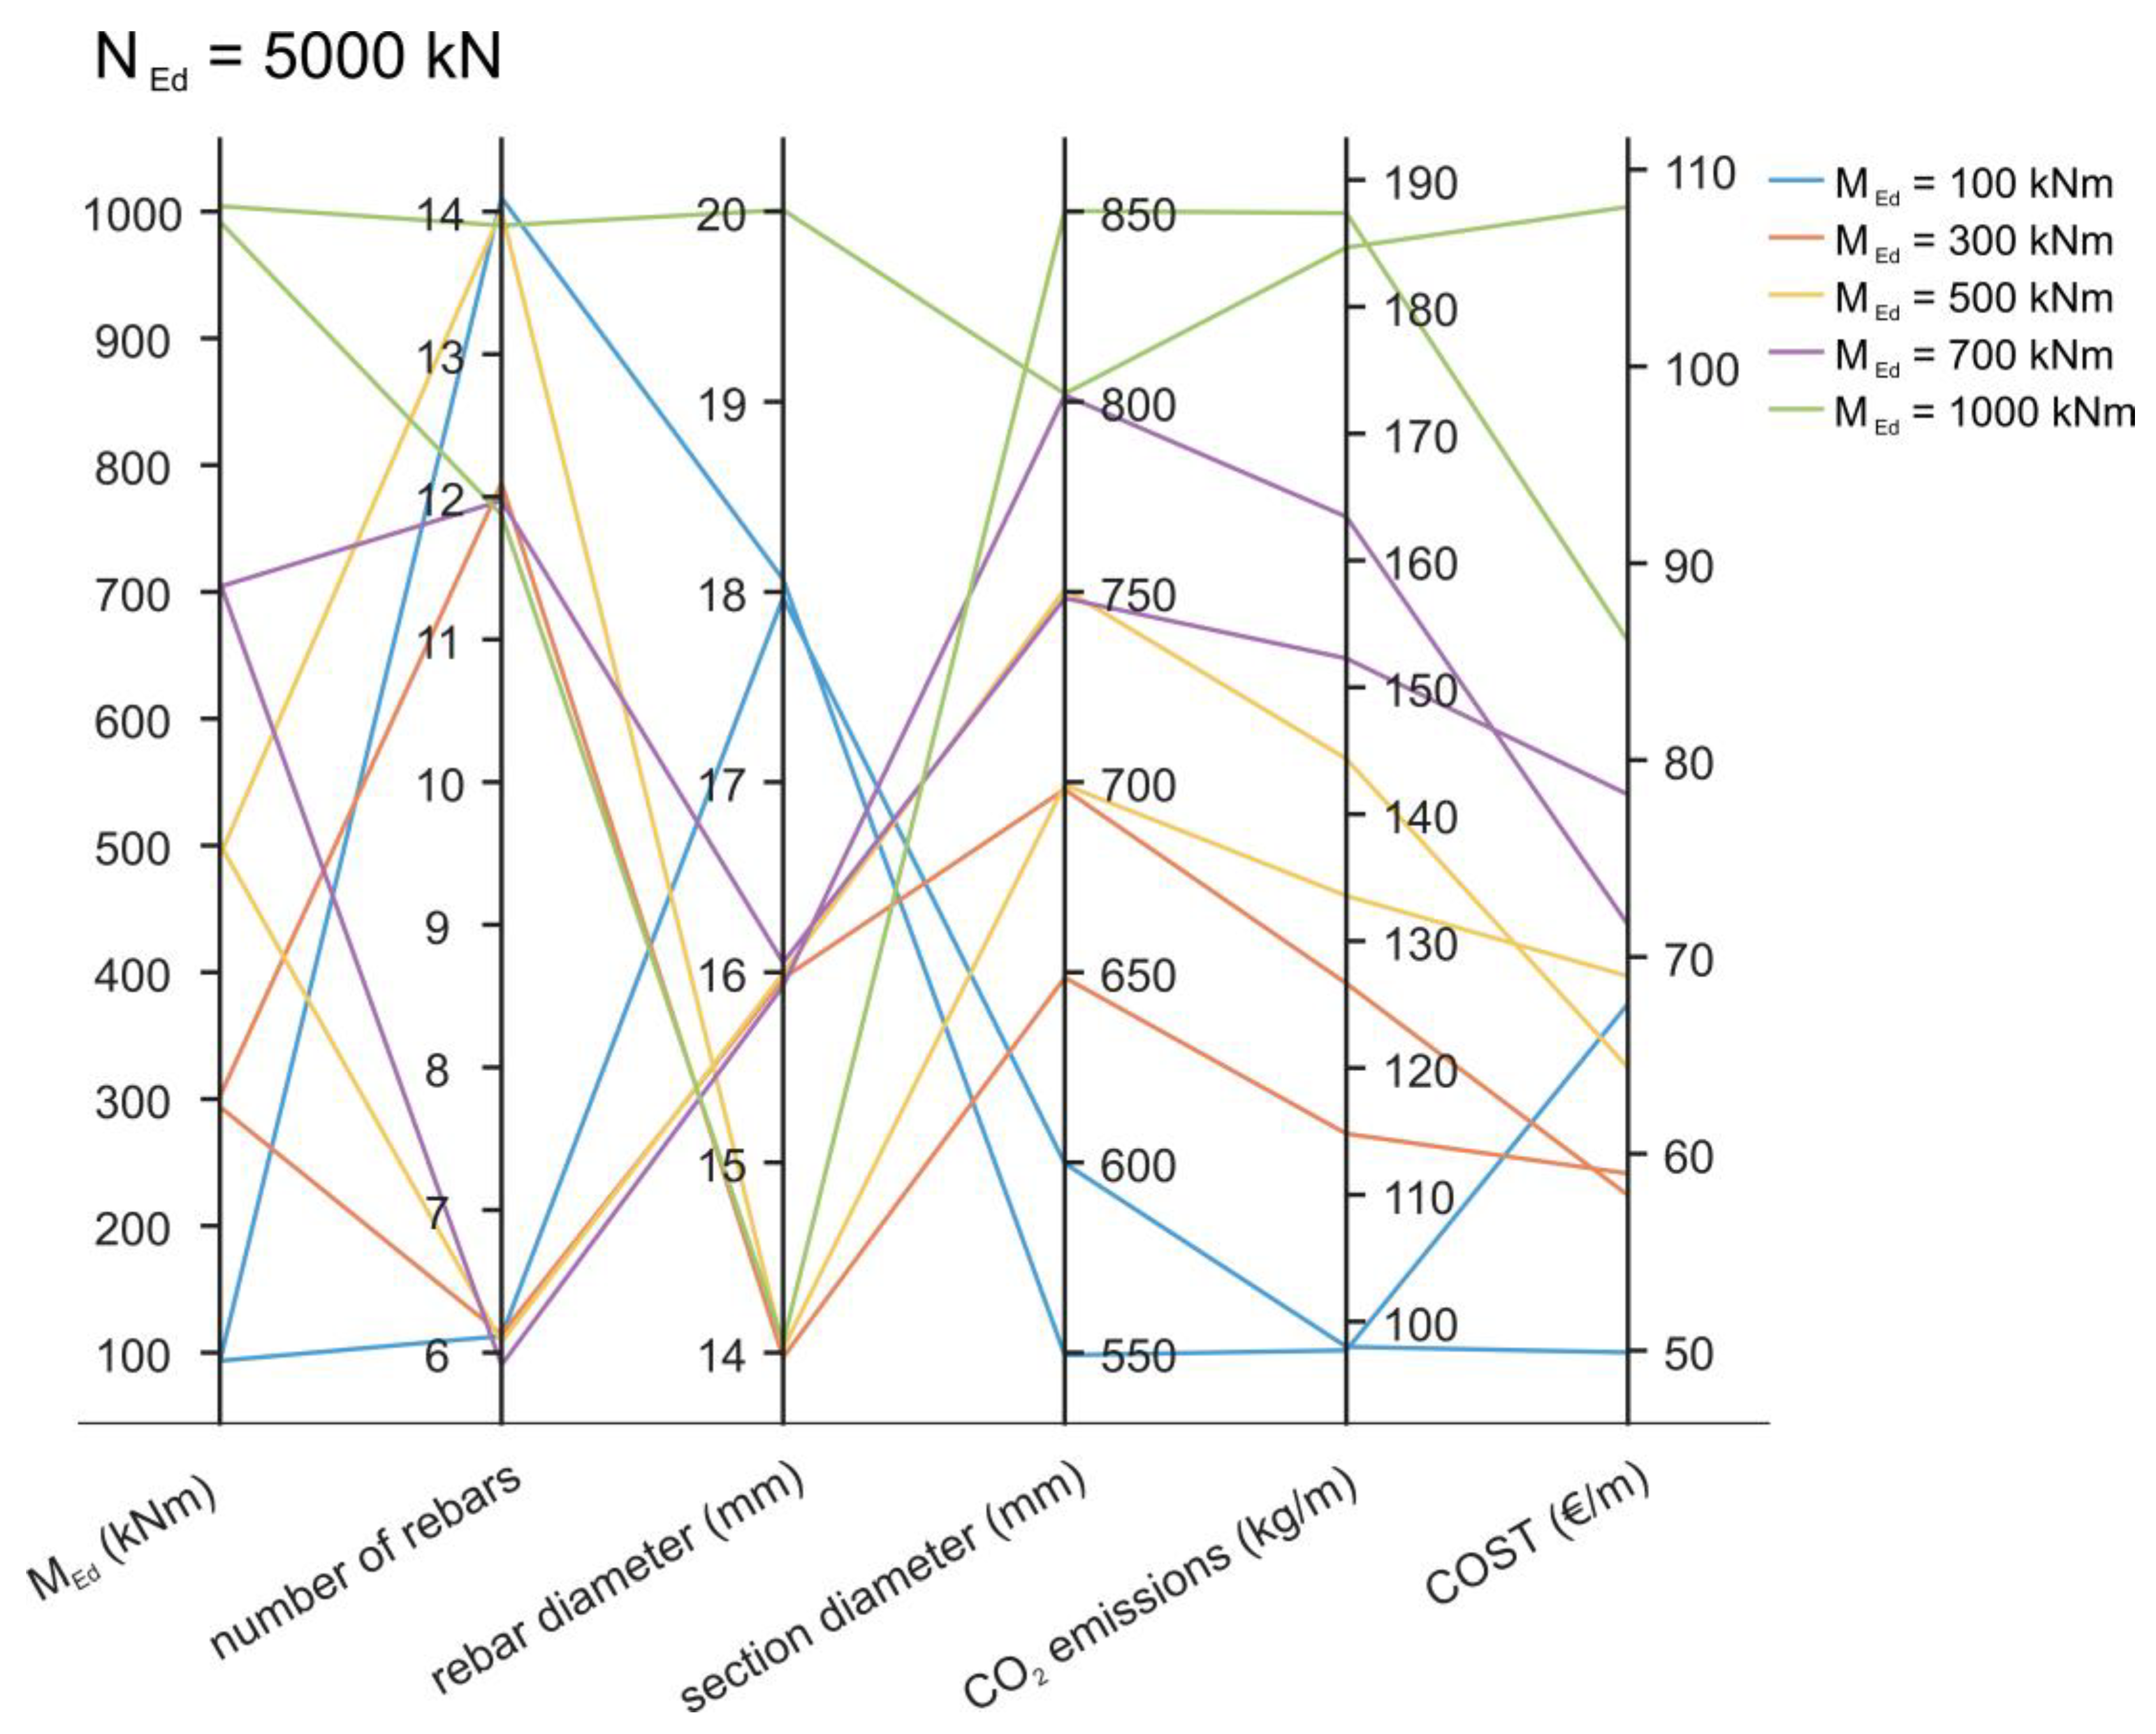
  • Three different axial loads: 1000 kN, 3000 kN, and 5000 kN;
  • Five different bending moments: 100 kNm, 300 kNm, 500 kNm, 700 kNm, and 1000 kNm;
  • Two objective functions: material cost and quantity of CO2 emissions.
The results of the 30 individual optimizations performed are shown in Table 3 and Table 4 and in Figure 3. Table 3 shows the optimal design variables and associated material costs, as well as the amount of CO2 emissions generated for the case where the material cost is set as the objective function. Table 4 also shows optimal solutions for various design parameters, but the results correspond to the case where the objective function was the amount of CO2 emissions caused by the production of the reinforced concrete member. Figure 3 directly compares the material costs where the optimization function was the material costs and where the optimization function was the CO2 emissions. Note that the dotted curves represent the values for the CO2 emissions. It can be concluded that when the material COST was used as the objective function, a different design for the concrete cross section was obtained than when CO2 emissions were chosen as the objective function. The optimal design of the reinforced concrete cross section obtained for the material cost objective function contains a larger cross-sectional area of concrete and a smaller area of steel compared with the optimization results when CO2 emissions are determined as the objective function. In general, exploitation of condition 1 (bending moment resistance) was the top priority in both optimization models, regardless of whether material cost or CO2 emissions were chosen as the objective function. However, the optimal solution in the case where the material cost was assigned as the objective function has much more reserve in axial load capacity than in the optimal design where CO2 was chosen as the objective function.
The performance of the genetic algorithm is illustrated in the case where CO2 emissions were assigned as the objective function and the reinforced concrete section was subjected to an axial load of NEd = 1000 kN and bending moments of MEd = 1000 kNm. The progress of the genetic algorithm, in terms of the best score value and mean score value, is plotted out in Figure 4a. The genetic algorithm stopped when the average relative change in the best fitness function value over stall generations was less than or equal to the function tolerance (see, Figure 4b). The maximum number of iterations for the genetic algorithm to perform was assigned to 200. Figure 4c shows a histogram of the parents and a population size of 500 individuals. The score at each generation is plotted in Figure 4d.

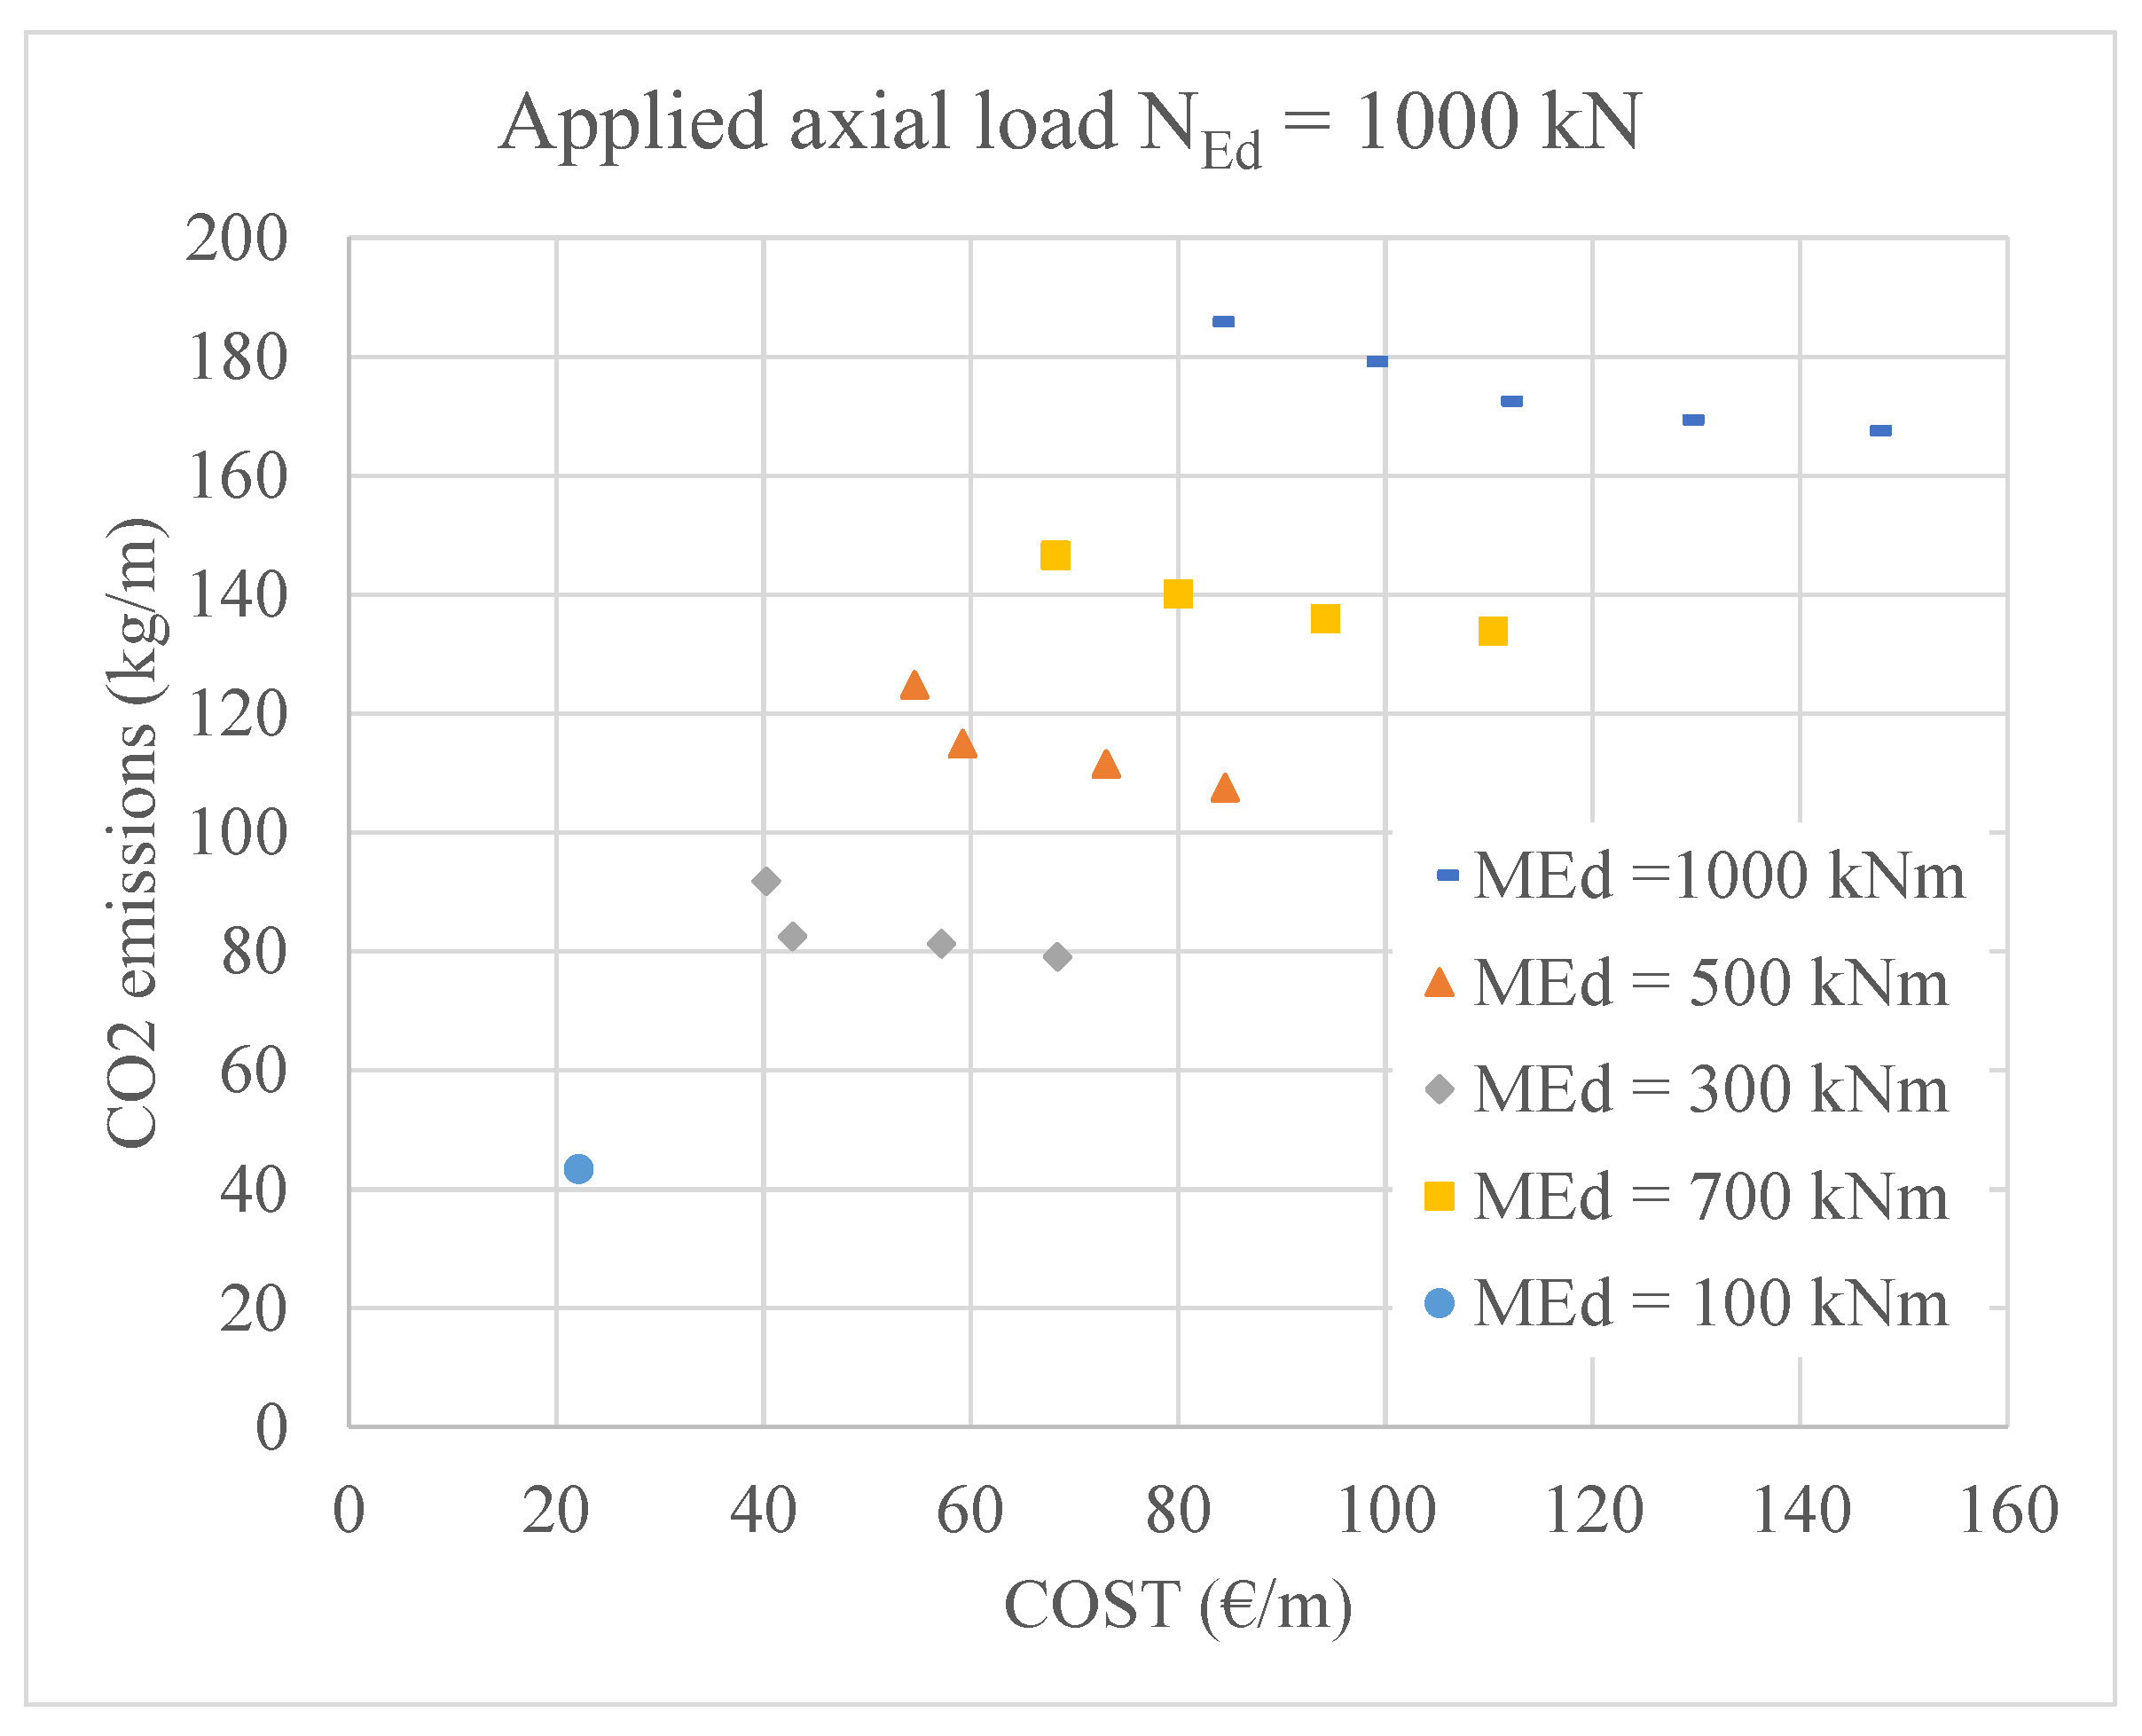
4. Multi-Objective Optimization

In the above optimizations, where a single objective function (material cost or CO2 emissions) was used, the optimization problem is relatively simple where the objective is to find the optimal value of the chosen objective function. In a multi-objective optimization, there is no unique optimal solution because the optimization problem involves tradeoffs between the objectives of material cost and CO2 emissions. The objective of the multi-objective function is to find a set of solutions that provide the best trade-offs between the different objectives. In multi-objective optimization, the optimal solution is represented as a set of Pareto-optimal solutions, where no solution can be improved in one objective without making it worse in at least one other objective. The Pareto-optimal solutions represent the best possible tradeoffs among the different objectives, and the goal is to find the set of solutions that is most desirable given the decision maker’s preferences. The main difference between the Pareto front in optimization with discrete variables and optimization with continuous variables lies in the nature of the design variables. Discrete variables can only take a limited number of values, whereas continuous variables can take any value within a certain range. In this optimization model, RCCS, discrete variables are used so that the Pareto front consists of a set of discrete points, each point representing a combination of the design variables that gives an optimal solution. In contrast, when continuous variables are used, the Pareto front is a continuous curve representing an infinite number of optimal solutions. Moreover, optimization with discrete variables results in a Pareto front that is less smooth and more jagged than the Pareto front obtained with continuous variables. The reason for this is that the set of feasible solutions is limited by the discrete nature of the design variables. Figure 5, Figure 6 and Figure 7 show the Pareto front for axial loads of 1000 kN, 3000 kN, and 5000 kN, respectively. From all figures, it can be seen that not many solutions were found, which is due to the use of discrete variables. It can also be seen that the curves are flat, which means that a small reduction in CO2 emissions is accompanied by a high increase in material costs, especially for an axial load of 1000 kN.
Since the above Pareto notation only shows the tradeoff between CO2 emissions and material costs and not the optimal solutions of the design variables, the parallel coordinate representation is provided. A parallel coordinate representation is a visualization technique that can be used to display multidimensional data in a compact and informative manner. In a parallel coordinate plot, the data points are shown as connected lines and the parallel axes represent the different variables (applied bending moment, number of rebars, values of optimal CO2 emissions, and material costs) and the optimal dimensions (rebar and column diameters). The data points are grouped based on the applied bending moment and plotted in different colors. Figure 8 shows that five different combinations of reinforcement number, rebar diameter, and section diameter for an axial load of 1000 kN and CO2 emissions for a bending moment of 1000 kNm result in five different optimal costs and CO2 emissions, whereas only one optimal solution was obtained for an applied bending moment of 100 kNm. Figure 9 and Figure 10 show that for an applied bending moment of 100 kNm, the choice of different optimal designs achieves only a small reduction in CO2 emissions but causes a significant increase in material costs. The parallel plot can be read as follows, as in Figure 9, see blue lines: for an applied axial load of NEd = 3000 kN and a bending moment of MEd = 100 kNm, two optimal solutions are determined. The first option includes the following values for the design variables: number of rebars n = 12, rebar diameter Φmain = 16 mm, cross-sectional diameter Φ = 450 mm, CO2 emissions = 65.5 kgCO2/m, and production COST = 45.8 EUR/m. The second option includes the following values for the design variables: number of rebars n = 8, rebar diameter Φmain = 12 mm, cross-sectional diameter Φ = 500 mm, CO2 emissions = 66.7 kgCO2/m, and production COST = 32.9 EUR/m. It can be seen that a small increase in CO2 emissions (by 1.8%) leads to a significant reduction in production costs (by 28.2%). The general observation is also that when designing the reinforced concrete cross section in multi-objective optimization, not many optimal solutions are found for the designer to choose from due to the discrete set of variables. In this case, the multi-objective optimization of material cost and CO2 emissions no longer causes difficulties for the designer due to the large number of different optimal solutions.

5. Summery and Conclusions

An optimization model for reinforced concrete circular columns based on the Eurcode 2 standard is presented. Discrete variables are used for the practical design of the cross section, which is particularly important for the number of reinforcing bars included in the cross section. The optimization model enables a comparison of the optimal solutions for the objective function material costs and CO2 emissions. The genetic algorithm was used to solve the optimization problem, and the entire model was created in MATLAB software (R2021a). The parametric study of applied axial load and bending moment was performed for material cost and CO2 emissions. The results based on a single objective function show that the optimal design of the reinforced concrete column cross section obtained for the material cost objective function contains a larger cross-sectional area of concrete and a smaller area of steel compared with the optimization results when CO2 emissions are determined as the objective function. The utilization of bending moment resistance was the top priority for both optimal solutions, regardless of whether material cost or CO2 emissions were chosen as the objective function. However, the optimal solution in which material cost was assigned as the objective function has much more reserve in axial load carrying capacity than the optimal design in which CO2 was selected as the objective function. Furthermore, the multi-objective optimization was performed to find a set of solutions that provide the best trade-offs between the material cost and CO2 emission objectives. The general observation that emerges from the multi-objective optimization is that when designing the reinforced concrete cross section, due to the discrete set of variables, there are not many optimal solutions that the designer can choose from. However, material costs are much more sensitive to the choice of optimal design than CO2 emissions. The mixed-integer nonlinear optimization model RCCS was developed in a general form that can provide an optimal solution for various design parameters including different concrete strength properties. Based on numerical analysis, the following conclusions can be stated:
-
The optimal design of the reinforced concrete cross section, considering the material cost as the objective function, results in a larger cross-sectional area of concrete and a smaller area of steel compared with the optimization results when CO2 emissions are considered as the objective function;
-
The optimal solution obtained with material cost as the objective function exhibits a significantly higher reserve in axial load capacity than the optimal design when CO2 emissions are selected as the objective function;
-
Analyzing the Pareto front reveals that a marginal decrease in CO2 emissions is accompanied by a substantial increase in material costs;
-
In addition, the model can be integrated into the design of structural elements such as columns and piles.

Author Contributions

Conceptualization, P.J. and T.Ž.; methodology, P.J. and T.Ž.; software, P.J. and T.Ž.; validation, P.J. and T.Ž.; writing—original draft preparation, P.J. and T.Ž.; writing—review and editing, P.J. and T.Ž. All authors have read and agreed to the published version of the manuscript.

Funding

This research was funded by the Slovenian Research Agency (grant number P2-0268 and P2-0129) and the GEOLAB project (grant number 101006512).

Institutional Review Board Statement

Not applicable.

Informed Consent Statement

Not applicable.

Data Availability Statement

The data presented in this study are available on request from the corresponding author.

Conflicts of Interest

The authors declare no conflict of interest.

References

  1. Kanagasundaram, S.; Karihaloo, B.L. Minimum-cost design of reinforced concrete structures. Comput. Struct. 1991, 41, 1357–1364. [Google Scholar] [CrossRef]
  2. Menezes, I.S.; Tinoco, V.N.V.; Christoforo, A.L.; Bomfim Junior, F.C.; Narques, T.V.N. Optimization of reinforced concrete columns via genetic algorithm. Acta Sci. Technol. 2022, 45, e61562. [Google Scholar] [CrossRef]
  3. de Oliveira, L.C.; de Almeida, F.S.; Gomes, H.M. Optimization of RC polygonal cross-sections under compression and biaxial bending with QPSO. Comput. Concr. 2022, 30, 127–141. [Google Scholar] [CrossRef]
  4. Paya-Zaforteza, I.; Yepes, V.; Hospitaler, A.; González-Vidosa, F. CO2-optimization of reinforced concrete frames by simulated annealing. Eng. Struct. 2009, 31, 1501–1508. [Google Scholar] [CrossRef]
  5. Camp, C.V.; Huq, F. CO2 and cost optimization of reinforced concrete frames using a big bang-big crunch algorithm. Eng. Struct. 2013, 48, 363–372. [Google Scholar] [CrossRef]
  6. Trinh, H.T.M.K.; Chowdhury, S.; Nguyen, M.T.; Liu, T. Optimising flat plate buildings based on carbon footprint using Branch-and-Reduce deterministic algorithm. J. Clean. Prod. 2021, 320, 128780. [Google Scholar] [CrossRef]
  7. Martínez-Alonso, C.; Berdasco, L. Carbon footprint of sawn timber products of Castanea sativa Mill. in the north of Spain. J. Clean. Prod. 2015, 102, 127–135. [Google Scholar] [CrossRef]
  8. Yeo, D.; Gabbai, R.D. Sustainable design of reinforced concrete structures through embodied energy optimization. Energy Build. 2011, 43, 2028–2033. [Google Scholar] [CrossRef]
  9. Zhang, X.; Zhang, X. Sustainable design of reinforced concrete structural members using embodied carbon emission and cost optimization. J. Build. Eng. 2021, 44, 102940. [Google Scholar] [CrossRef]
  10. Jayasinghe, A.; Orr, J.; Ibell, T.; Boshoff, W.P. Minimising embodied carbon in reinforced concrete beams. Eng. Struct. 2021, 242, 112590. [Google Scholar] [CrossRef]
  11. Sahebi, M.; Dehestani, M. Sustainability assessment of reinforced concrete beams under corrosion in life-span utilizing design optimization. J. Build. Eng. 2023, 65, 105737. [Google Scholar] [CrossRef]
  12. Ahmed, M.A.; Amin, A.H.; Khalil, A.B.I. Optimal circular reinforced concrete columns. J. Eng. Appl. Sci. 1997, 44, 69–84. [Google Scholar]
  13. Tayem, A.; Najmi, A. Design of Round Reinforced-Concrete Columns. J. Struct. Eng. 1996, 122, 1062–1071. [Google Scholar] [CrossRef]
  14. Bekdaş, G.; Cakiroglu, C.; Kim, S.; Geem, Z.W. Optimization and Predictive Modeling of Reinforced Concrete Circular Columns. Materials 2022, 15, 6624. [Google Scholar] [CrossRef]
  15. Camp, C.V.; Assadollahi, A. CO2 and cost optimization of reinforced concrete footings using a hybrid big bang-big crunch algorithm. Struct. Multidiscip. Optim. 2013, 48, 411–426. [Google Scholar] [CrossRef]
  16. Zhao, X.; Lu, Y.; Liang, H.; Wang, Y.; Yan, Y. Optimal design of reinforced concrete columns strengthened with square steel tubes and sandwiched concrete. Eng. Struct. 2021, 244, 112723. [Google Scholar] [CrossRef]
  17. Jelušič, P.; Žlender, B. Determining optimal designs for conventional and geothermal energy piles. Renew. Energy 2020, 147, 2633–2642. [Google Scholar] [CrossRef]
  18. Payá-Zaforteza, I.; Yepes, V.; González-Vidosa, F.; Hospitaler, A. Cost versus sustainability of reinforced concrete building frames by multiobjective optimization. In Proceedings of the Life-Cycle Civil Engineering—1st International Symposium on Life-Cycle Civil Engineering, IALCCE ’08, Commo, Italy, 10–14 June 2008; pp. 953–958. [Google Scholar]
  19. Hong, W.-K.; Le, T.-A.; Nguyen, M.C.; Pham, T.D. ANN-based Lagrange optimization for RC circular columns having multiobjective functions. J. Asian Archit. Build. Eng. 2023, 22, 961–976. [Google Scholar] [CrossRef]
  20. Sun, L.; Zhang, B.; Wang, P.; Gan, Z.; Han, P.; Wang, Y. Multi-Objective Parametric Optimization Design for Mirrors Combined with Non-Dominated Sorting Genetic Algorithm. Appl. Sci. 2023, 13, 3346. [Google Scholar] [CrossRef]
  21. Khouri Chalouhi, E.; Zelmanovitz Ciulla, G.; García-Brioles Bueno, J.; Pacoste, C.; Karoumi, R. Environmental and economical optimization of reinforced concrete overhang bridge slabs. Struct. Multidiscip. Optim. 2023, 66, 66. [Google Scholar] [CrossRef]
  22. Di, L.; Sun, Z.; Zhi, F.; Wan, T.; Yang, Q. Assessment of an Optimal Design Method for a High-Energy Ultrasonic Igniter Based on Multi-Objective Robustness Optimization. Sustainability 2023, 15, 1841. [Google Scholar] [CrossRef]
  23. The MathWorks, Inc., R. How the Genetic Algorithm Works. 2021. Available online: https://se.mathworks.com/help/gads/how-the-genetic-algorithmworks.html (accessed on 5 May 2023).
  24. EN1992-1-1 2004; CEN Eurocode 2 Design of Concrete Structures–Part 1-1: General Rules and Rules for Buildings. EU: Brussels, Belgium, 2004.
  25. The Model of the Eco-costs/Value Ratio (EVR). Available online: www.ecocostsvalue.com/eco-costs/eco-costs-emissions/ (accessed on 5 May 2023).
Figure 1. Typical column design charts. (a) Axial and bending resistance, (b) non-dimensional design charts.
Sustainability 15 11689 g001
Figure 2. Strain and force diagrams under different positions of the neural axis.
Sustainability 15 11689 g002
Figure 3. Optimal material costs and optimal CO2 emissions for different applied bending moments (a) at an applied axial load of 1000 kN, (b) at an applied axial load of 3000 kN, and (c) at an applied axial load of 5000 kN.
Sustainability 15 11689 g003
Figure 4. Performance of the genetic algorithm (objective function: CO2 emissions, NEd = 1000 kN and MEd = 1000 kNm): (a) progress of the genetic algorithm; (b) stopping criteria; (c) population size; (d) score histogram.
Sustainability 15 11689 g004
Figure 5. Pareto front for a reinforced concrete circular cross section loaded with an axial load of 1000 kN for different applied bending moments.
Sustainability 15 11689 g005
Figure 6. Pareto front for a reinforced concrete circular cross section loaded with an axial load of 3000 kN for different applied bending moments.
Sustainability 15 11689 g006
Figure 7. Pareto front for a reinforced concrete circular cross section loaded with an axial load of 5000 kN for different applied bending moments.
Sustainability 15 11689 g007
Figure 8. Parallel coordinate representation of the optimum design variables of a reinforced concrete circular cross section loaded with an axial load of 1000 kN for different applied bending moments.
Sustainability 15 11689 g008
Figure 9. Parallel coordinate representation of the optimum design variables of a reinforced concrete circular cross section loaded with an axial load of 3000 kN for different applied bending moments.
Sustainability 15 11689 g009
Figure 10. Parallel coordinate representation of the optimum design variables of a reinforced concrete circular cross-section loaded with an axial load of 5000 kN for different applied bending moments.
Sustainability 15 11689 g010
Table 3. Optimal design for the case where the material cost has been assigned as an objective function.
NEd
(kN)
MEd
(kNm)
cx
(mm)
n
(-)
Φmain (mm)Φ (mm)NRd (kN)MRd (kNm)As,min (cm2)As,total (cm2)COST (€/m)CO2 (kg/m)
1000100274.136124001304.0107.62.516.7922.1843.36
1000300345.246126002196.8342.75.656.7940.2491.78
1000500420.778127003180.4545.87.709.0554.56124.79
1000700412.146187503230.4701.98.8415.2768.18146.59
10001000518.1614128504795.61000.811.3515.8383.28185.70
3000100484.118125003021.5122.06.909.0532.8866.69
3000300433.118126003021.3333.76.909.0542.8193.32
3000500457.158127003560.1538.67.709.0554.56124.79
3000700470.556187503927.1701.88.8415.2768.18146.59
30001000487.0014128504385.91002.811.3515.8383.28185.70
5000100670.256186005002.9102.811.5015.2749.8997.57
5000300670.676167005699.5335.111.5012.0657.99126.85
5000500623.146167505571.6558.711.5012.0664.54144.40
5000700559.916168005111.5787.911.5012.0671.54163.16
50001000539.4116128505091.31011.311.5018.1085.85187.25
Table 4. Optimal design for the case where CO2 emissions were assigned as the objective function.
NEd
(kN)
MEd
(kNm)
cx
(mm)
n
(-)
Φmain (mm)Φ (mm)NRd (kN)MRd (kNm)As,min (cm2)As,total (cm2)COST (€/m)CO2 (kg/m)
1000100301.796124001483.3100.92.516.7922.1843.36
1000300231.218264501080.1300.03.1842.4766.6478.02
1000500241.5718225001064.8502.33.9368.42100.46107.25
1000700276.9218226001387.2703.75.6568.42110.40133.87
10001000353.5318266502591.71000.56.6495.57146.94167.54
3000100455.8420124503001.1100.26.9022.6244.0464.47
3000300421.9312165503067.8301.26.9024.1354.7989.70
3000500391.5220166003015.0501.26.9040.2178.29114.60
3000700386.6610266503015.2700.66.9053.0998.59138.53
30001000387.0014267003024.41002.77.7074.33128.86169.37
5000100671.736186005011.1100.911.5015.2749.8997.57
5000300615.7016126505063.0300.411.5018.1058.76114.63
5000500575.8618127005001.6501.311.5020.3667.43132.51
5000700551.1712167505003.8702.211.5024.1378.27152.64
50001000524.8220168005008.21000.811.5040.21103.58182.38
Disclaimer/Publisher’s Note: The statements, opinions and data contained in all publications are solely those of the individual author(s) and contributor(s) and not of MDPI and/or the editor(s). MDPI and/or the editor(s) disclaim responsibility for any injury to people or property resulting from any ideas, methods, instructions or products referred to in the content.

