A Computational Fluid Dynamics Modelling Approach for the Numerical Verification of the Bioclimatic Design of a Public Urban Area in Greece
Abstract
1. Introduction
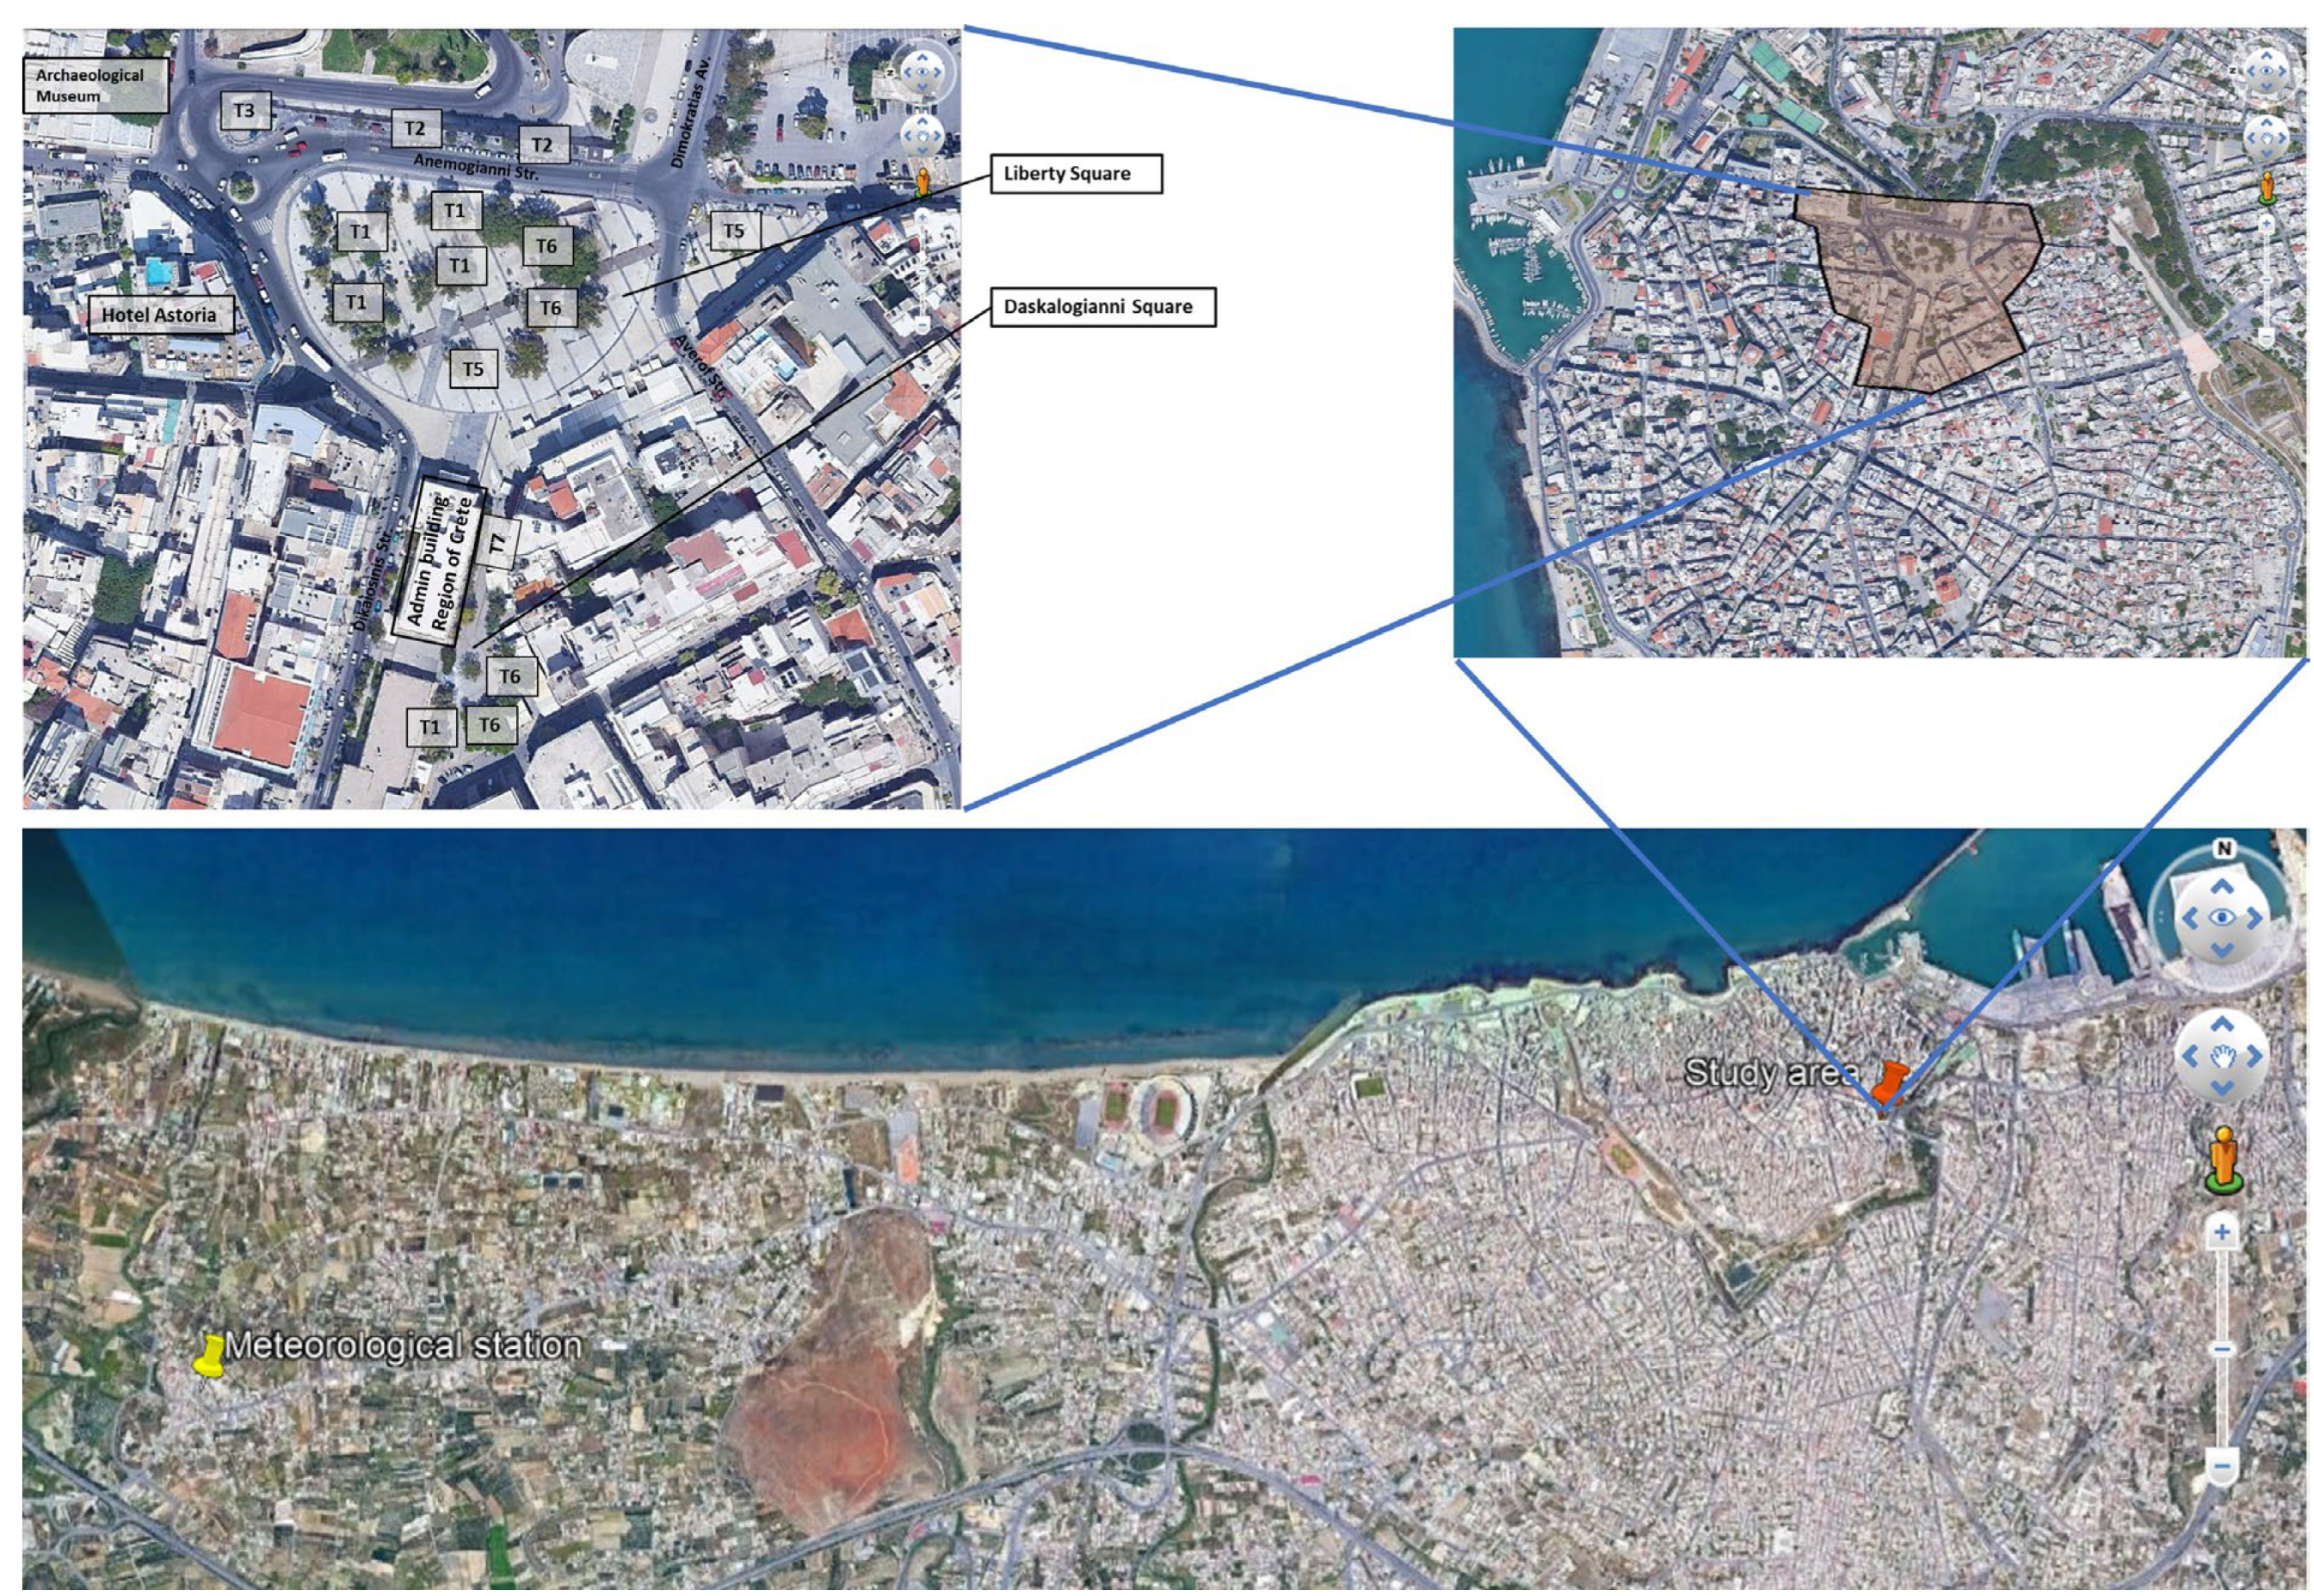
- Presentation of the study area considered;
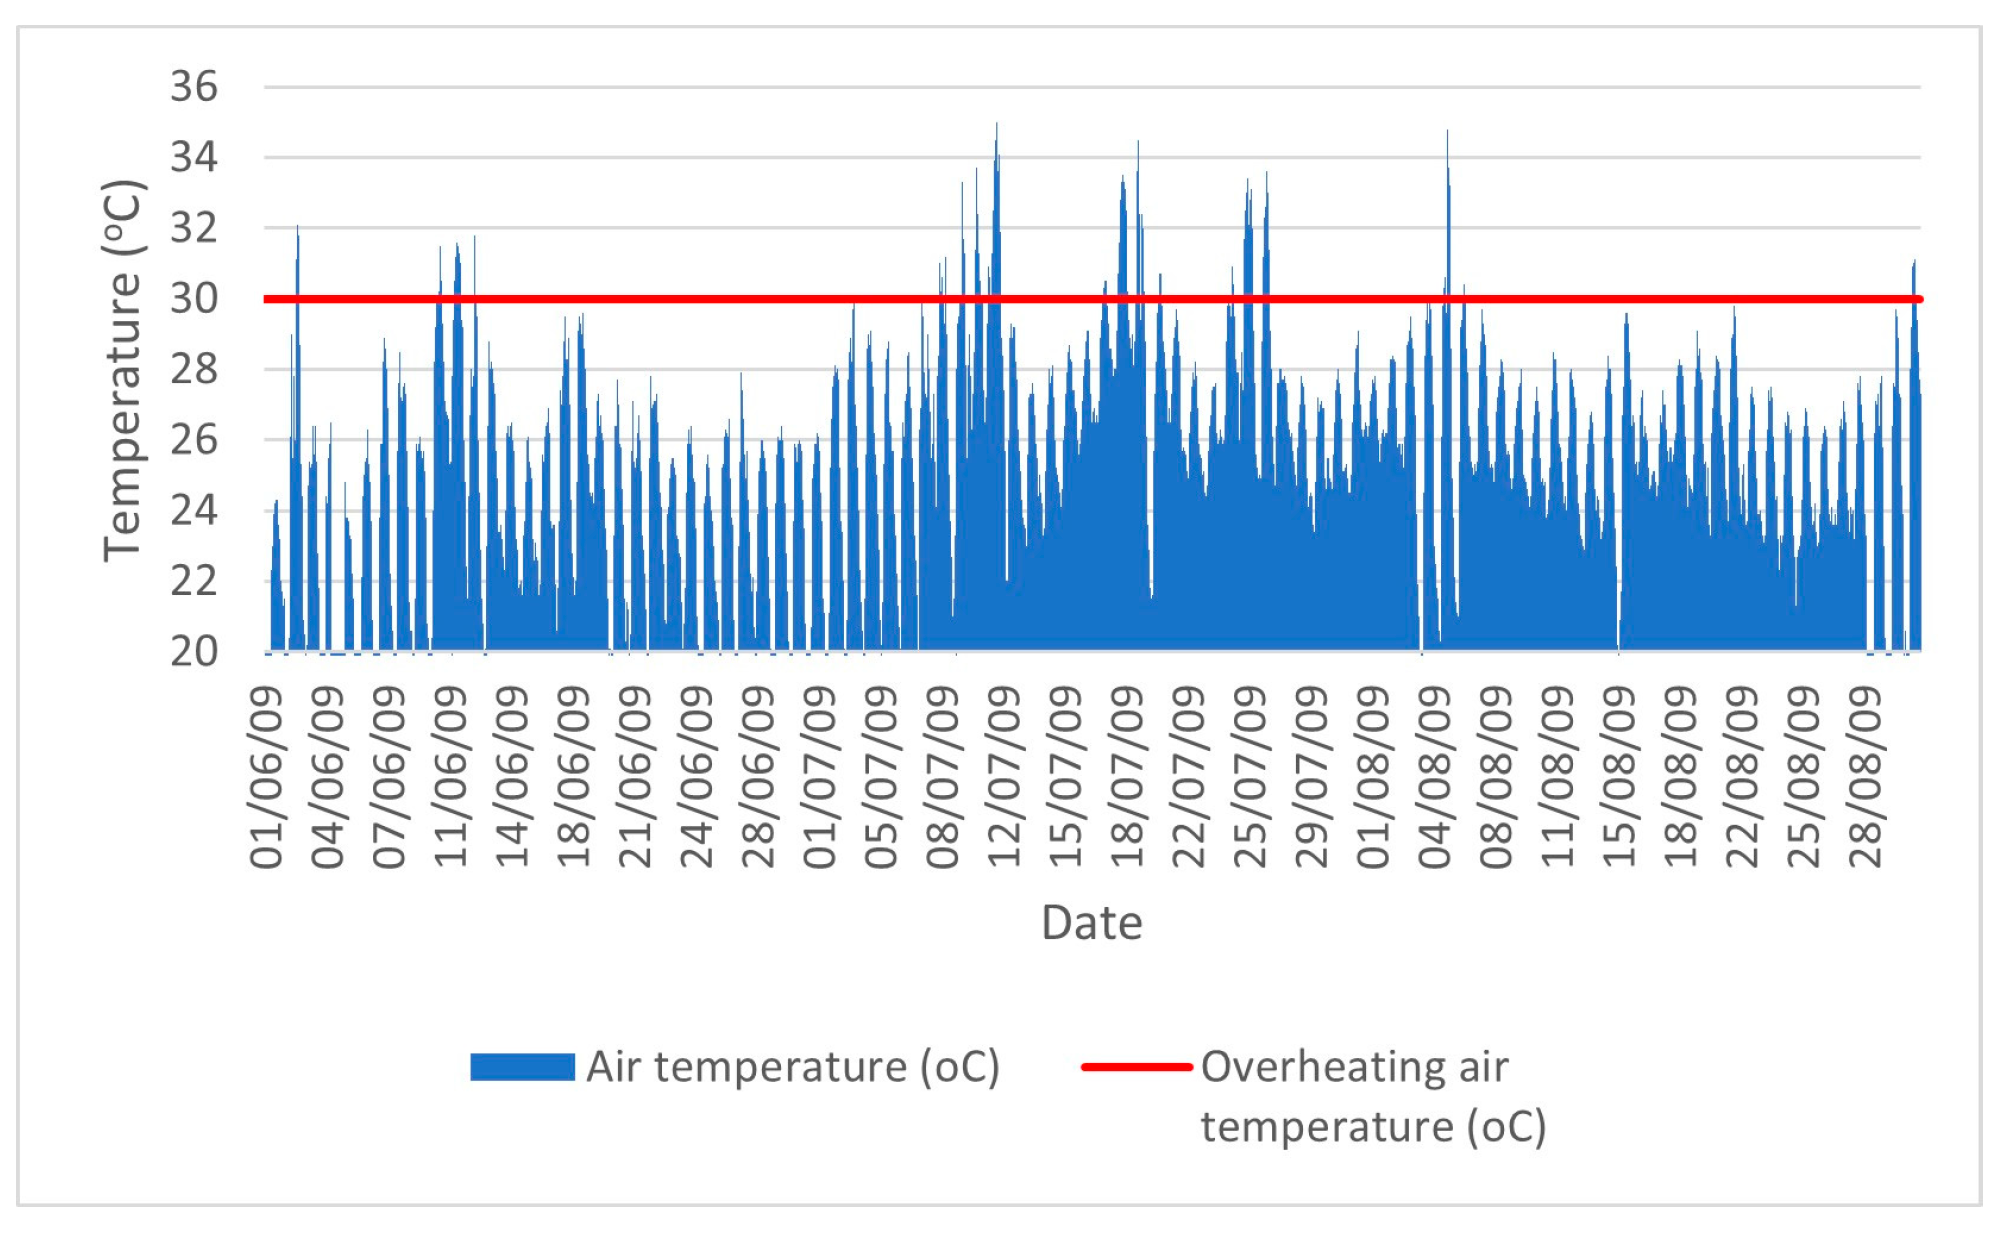
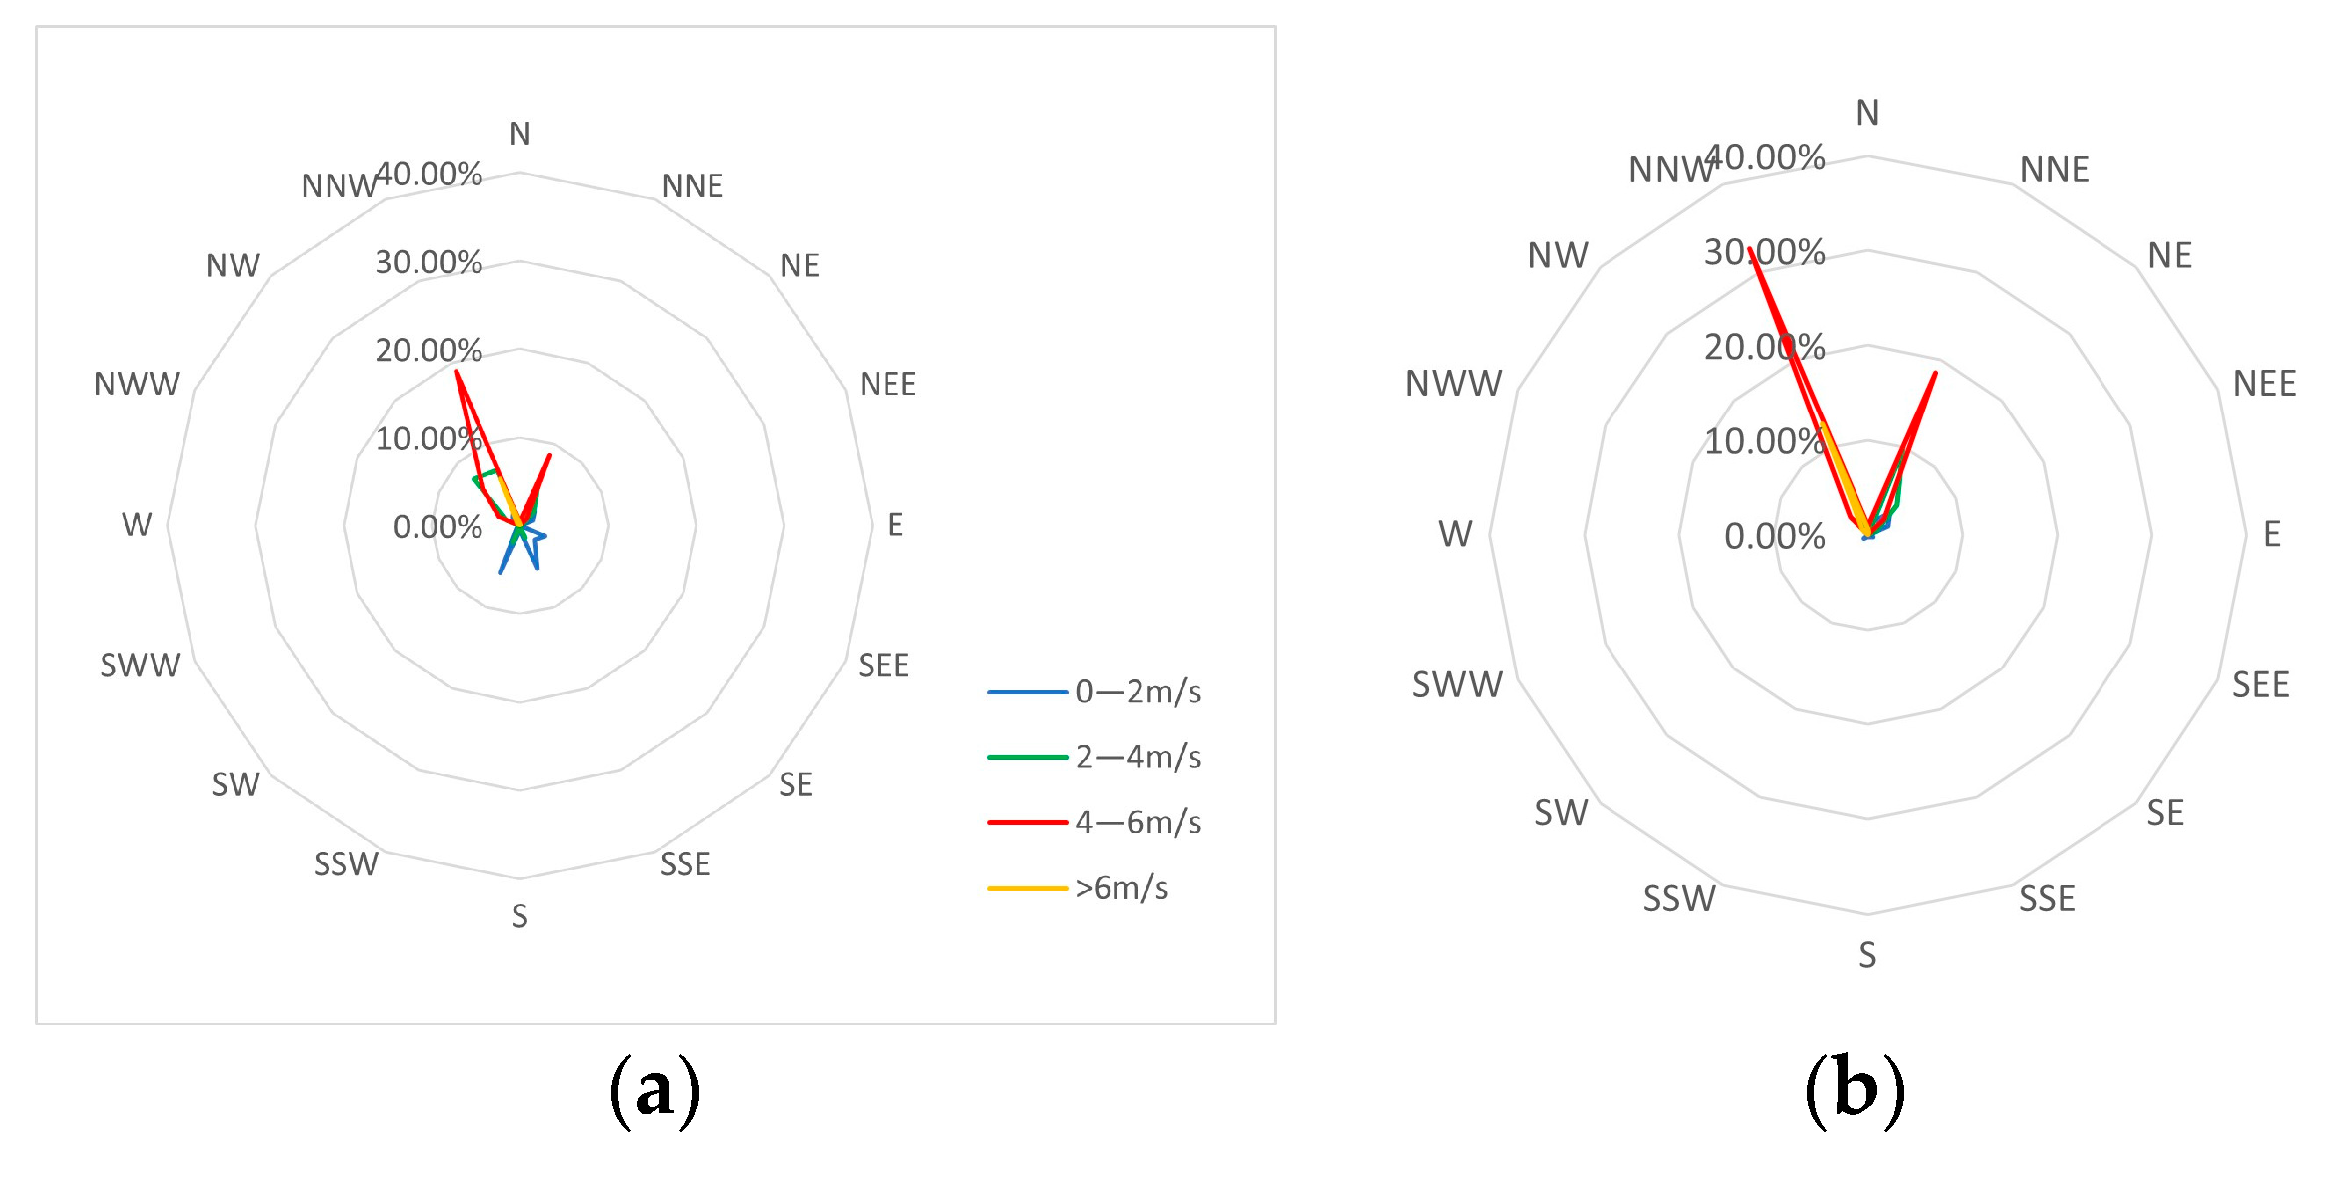
- Extraction of representative climatic conditions of the area in focus;
- Development of the CFD model and KPIs solved;
- Empirical validation approach;
- Evaluation of the given urban bioclimatic upgrade.
2. Materials and Methods
2.1. Study Area
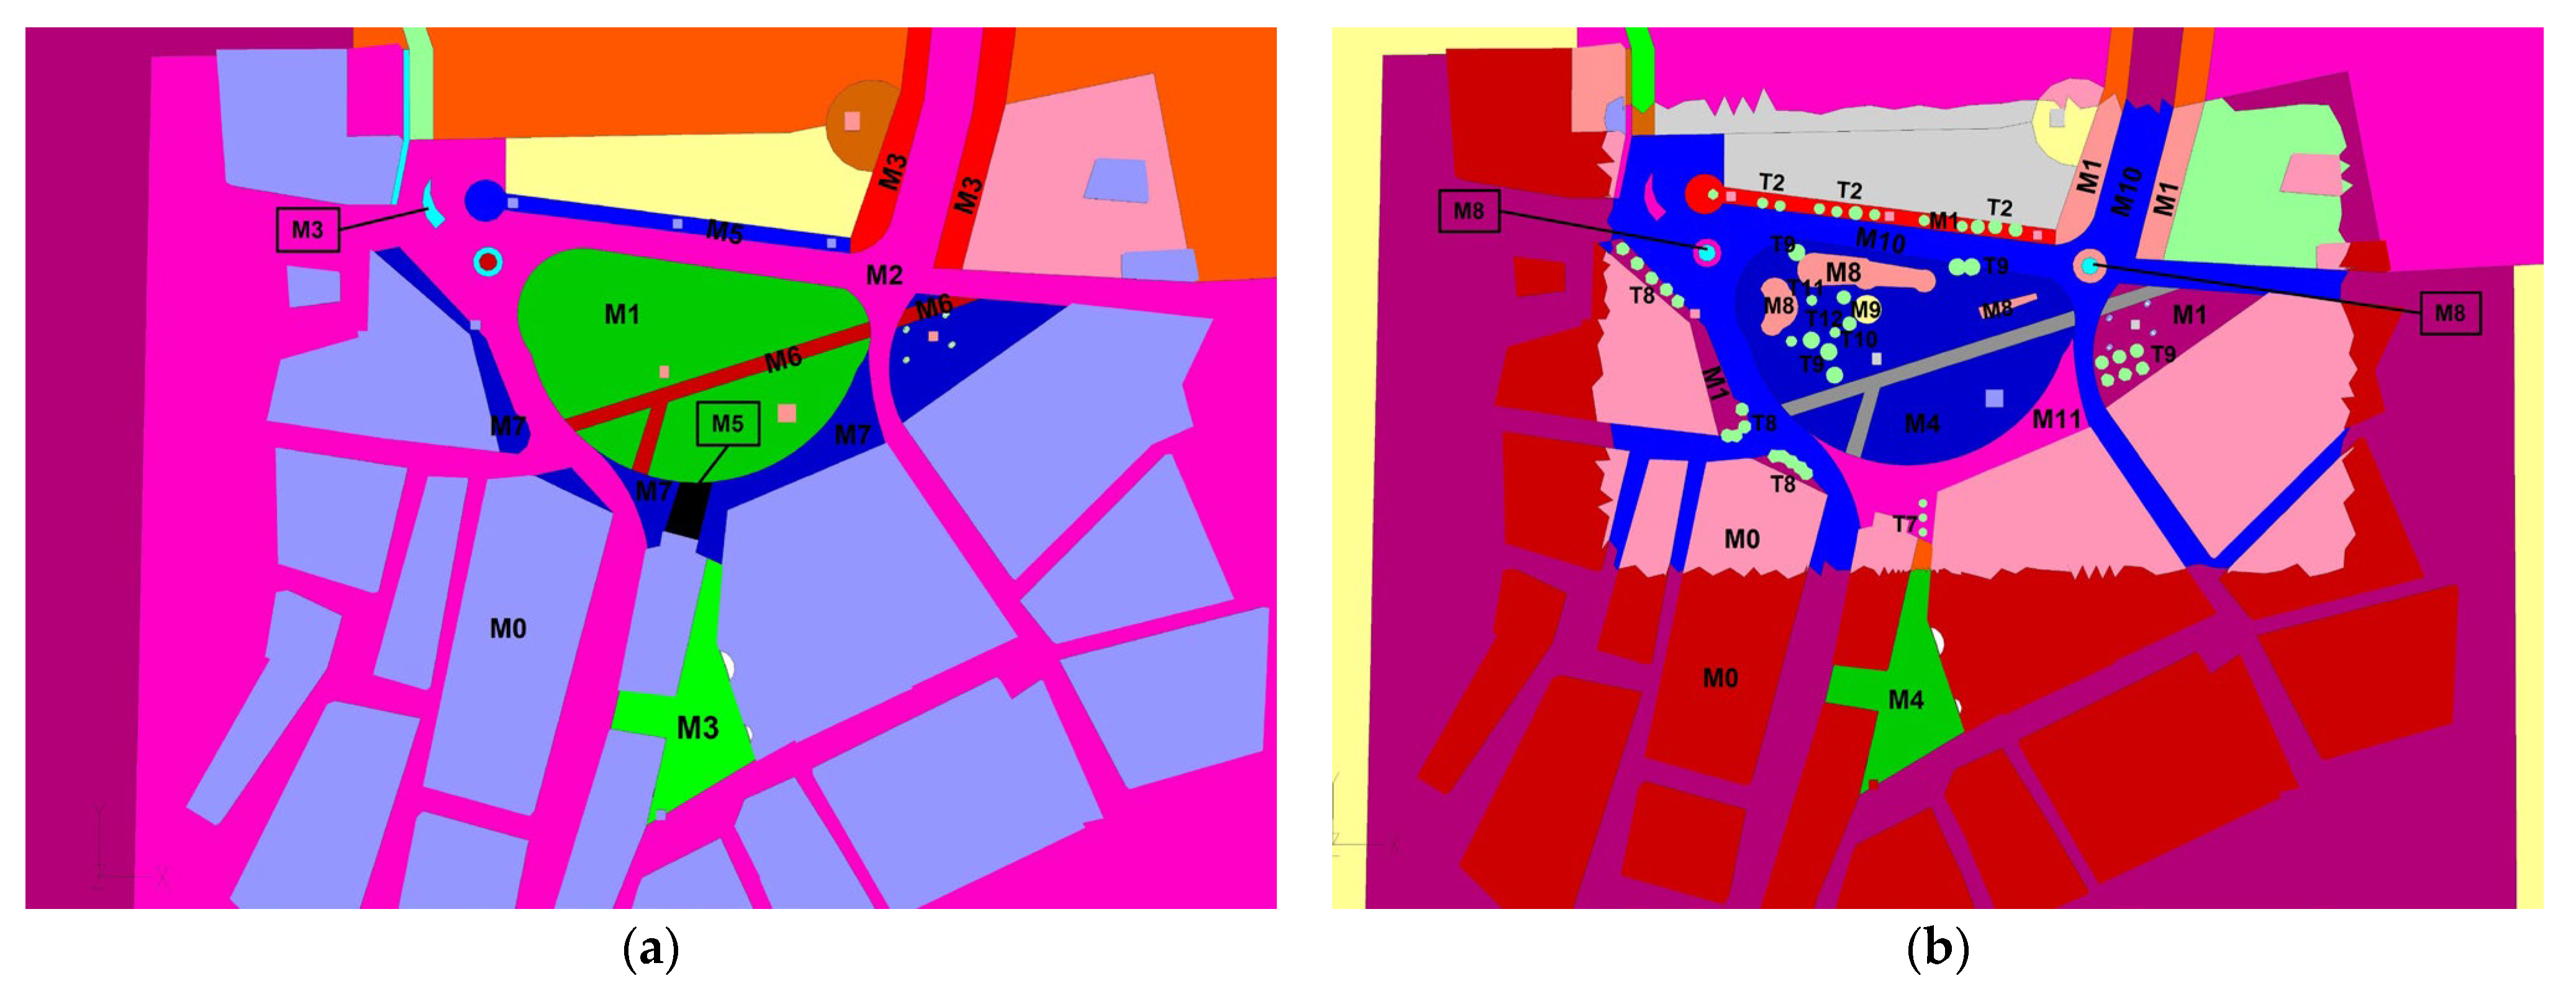
- Liberty Square: The ground material is mainly white marble with low portions of porphyry slabs. Plantation includes mainly sycamore, a few palm trees and eucalyptus, at the south, west, and at both the north and central parts of the square, respectively. There is no water surface and limited soil and grass surfaces exist. Perimetric traffic roads are covered with conventional asphalt.
- Daskalogianni Square: The ground cover constitutes mainly conventional concrete slabs. Extensive plantation with sycamore and eucalyptus provides enough shading in summer; however, due to their evergreen nature, the provided shading in winter is considered redundant.
- Liberty Square perimetric pavements: The west pedestrian roads extending from the south-west part of the square to the Astoria hotel are mainly covered with tufa paver, except the small segment in front of the Administration building of the Region of Crete, which is covered with dark grey marble. The surfaces in front of the Museum, the median divider, and the junction at the north side of the square, as well as the ones on either side of the Dimokratias Avenue, are all covered with conventional concrete slabs. The paver at the east side of the Anemogianni Str. is of grey marble.
2.2. The Given Renovation Plan
- Liberty Square: (a) Artificial materials: Replacement of the current white marble by a travertine marble, (b) Green and blue materials: Addition of new grass beds and bushes, installation of a fountain and new trees in some solar exposed segments.
- Daskalogianni Square: (a) Artificial materials: Replacement of the current cover material with travertine marble, (b) Green interventions: Extension of the tree array (Τ7: Brachychiton) existing at the south side of the Region Administration building towards the east façade of the building.
- Peripheral traffic and pedestrian roads: (a) Artificial materials: The conventional asphalt around the Liberty Square is replaced by reflective (cool) asphalt. The pedestrian road from Averof Av. to Dikaiosinis Str. is reconstructed using reflective (cool) paver of beige colour. The rest of the pedestrian roads, i.e., the south pedestrian segment of the conjunction between Dimokratias Av. and Averof Av., in between Dikaiosinis Str. and in front of the Astoria hotel, in front of the Museum, the paver at the east of Anemogianni Str. and in either side of Dimokratias Av., are now covered with white marble (for cost-efficiency purposes, the idea is that the marble pieces now existing in the Liberty Square will be re-used), (b) Green interventions: Planting new redbud trees at the east pedestrian road of Anemogianni Str., installation of a new traffic junction with a grass bed in between Dimokratias and Averof Avenues, planting a new array of jacaranda at the pedestrian segment from the south part to Averof Av., plantation of acer trees in front of the Astoria hotel.
2.3. Climatic Conditions
2.4. The Numerical Model Applied and KPIs Solved
- Incompressible flow of a Newtonian fluid;
- Neutral atmospheric conditions;
- Richards–Hoxey assumptions for the Atmospheric Boundary Layer (ABL) (incident wind) [42];
- Traffic and other anthropogenic heat sources are neglected, and only the effects of construction materials and physical elements are considered.
2.4.1. Computational Spatial Discretization and Method of Solution
2.4.2. Incident Solar Irradiance
2.4.3. Boundary Conditions and Special Sources
Far-Field Boundaries
- Inlet: The exponential law for velocity and turbulence components (kinetic energy of turbulence and its dissipation rate) is applied [4]. The ABL height is assumed to be a height of 300 m, while as a reference height, the 10 m from the ground is used where the available mean velocity for each hour of the typical summer day (refer to Figure 4) is imposed. A north wind orientation is imposed following the findings in Section 2.2. The terrain roughness is set to the typical value of 0.2 [44]. According to the assumption of neutral atmospheric conditions, a constant inlet temperature is imposed (for each hour of the day), while for the water mass fraction in the air mixture, it is again treated as constant, being derived from a well-known equation reported in Ref. [4] as a function of the given Relative Humidity (RH) from climatic data.
- Lateral and top far-field boundaries: They are handled as free-slip boundaries, i.e., zero normal velocity component and zero normal spatial gradient of all other variables are imposed.
- Outflow: Horizontal homogeneity is retained for all the variables and forcing no reverse flow, i.e., a Neumann condition is imposed for the transferred quantity , (, where is the velocity direction vector and is the boundary surface definition normal vector).
Wall Boundaries and Special Sources
- Water surfaces: The evaporation rate is calculated according to Penman’s method [45], involving the computation of the water evaporation rate. The evaporation boundary condition is applied on water surfaces in the CFD model towards the computation of the different evaporation fluxes for the different climate parameter combinations (velocity, temperature and relative humidity) with respect to the hours of the day. The radiative heat flux is calculated as the algebraic sum of the entering shortwave radiation, the reflective shortwave radiation and the longwave radiation. The special mathematical expressions are provided in ref. [4].
- Plantation surfaces: The evaporation rate is calculated using Penman’s model with modified expressions for the psychrometric coefficient and the velocity function appropriate for plantation surfaces according to ref. [46].
- Tree surfaces: The evapotranspiration effects are captured by means of solving the net heat balance within the leaf-ambient interface based on the Jones model [47], assuming a solar absorption coefficient of 0.6, leaf orientation fixed at 30°, and a leaf emissivity of 0.96. The evaporation rate involved in the aforementioned heat balance is calculated as a function of the water-vapor density in both the ambient rate and on leaf surface, as computed by means of simple polynomial equations with respect to the inlet air temperature [47], as well as of the leaf-resistance components, i.e., the leaf intercellular air space resistance fixed at the typical value of 25 s/m, the stomatal resistance and the cuticular resistance (being 2.500 s/m). The boundary layer thickness on the leaf surface is calculated in correlation with the leaf shape parameter taken as equal to 4.0, and finally, the leaf-surface convective heat-transfer coefficient is derived via the simple ratio of air’s thermal conductivity (fixed at 0.0259 W/(mK)) and the boundary layer thickness.
Key Performance Indicators
- The standard Predicted Mean Vote (PMV).
- The Standard Effective Temperature (SET) [48], taking into account humidity effects in warm environments. The SET is defined as the operative temperature of an imaginary isothermal environment of 50% RH and almost stagnant air (<0.12 m/s) in which a relaxed subject would experience the same net heat balance, skin wittedness and mean skin temperature as in the actual environment.
- The Predicted Percentage Dissatisfied (PPD).
2.5. Empirical Validation Approach
- Implementation of a survey for climate parameter monitoring and a questionnaire for recording the thermal sensations of visitors from 10:00 to 16:00.
- Physical parameter monitoring: A portable weather station and additional equipment were used at various locations in the square, and at approximately 2 m from the ground, for the recording of climatic parameters such as the air temperature, air velocity, relative humidity and incident solar irradiance. Recordings were obtained in a five-minute time step, and the data used for the assessments were those collected every 15 min (approximate duration of the interview). The recorded climatic data in the square are presented in their averaged fashions both spatially (square area) and temporally (within the survey time period from 10:00 to 16:00).
- Thermal sensation recording: This was implemented mainly through the extensive interviews with pedestrians at various points throughout the square, including their general preferences, instant tolerance of the climatic conditions, i.e., temperature, sun and humidity at the time of the interview, as well as voting on thermal comfort sensation. The answers are then translated into the thermal comfort percentage and the general evaluation of the thermal conditions in the square.
3. Results
3.1. Microclimate Assessment of the Study Area
3.1.1. Empirical Validation Results
- PPD: It is an own interpretation of the available data from the reference study [39] as follows: Since the PPD stands for the percentage of subjects feeling discomfort, it is fair to assume that its actual value is that provided by answers from subjects to the explicit question regarding their thermal sensation. Indeed, in the reference study, an explicit question to the interviewees was imposed, i.e., to grade their heat perception by selecting from among the options “too little”, “not enough”, “OK”, “enough”, “too much”. Then, the study presented the percentages of the corresponding responses during the measurement period. Hence, herein the sum of the responses other than “OK” from the reference study is taken as the reference value for the PPD to compare the CFD-computed one.
- PMV: The reference study reports 4.78 to be derived from the processing of the subjects’ answers as regards thermal comfort on a scale from 1 (cold sensation) to 5 (warm sensation). To ensure the correspondence of the current computations with the recordings from the reference study, the latter’s data are adjusted on a scale from −2 (cold sensation) to +2 (warm sensation), which is adopted in the CFD code herein (in accordance to the theoretical PMV scale). Considering the linear correlation between the two scales, it can be easily concluded that the given PMV value corresponds to 1.78, with reference to the theoretical scale of −2 to +2.
3.1.2. Microclimate Assessment of the Urban Area in Focus
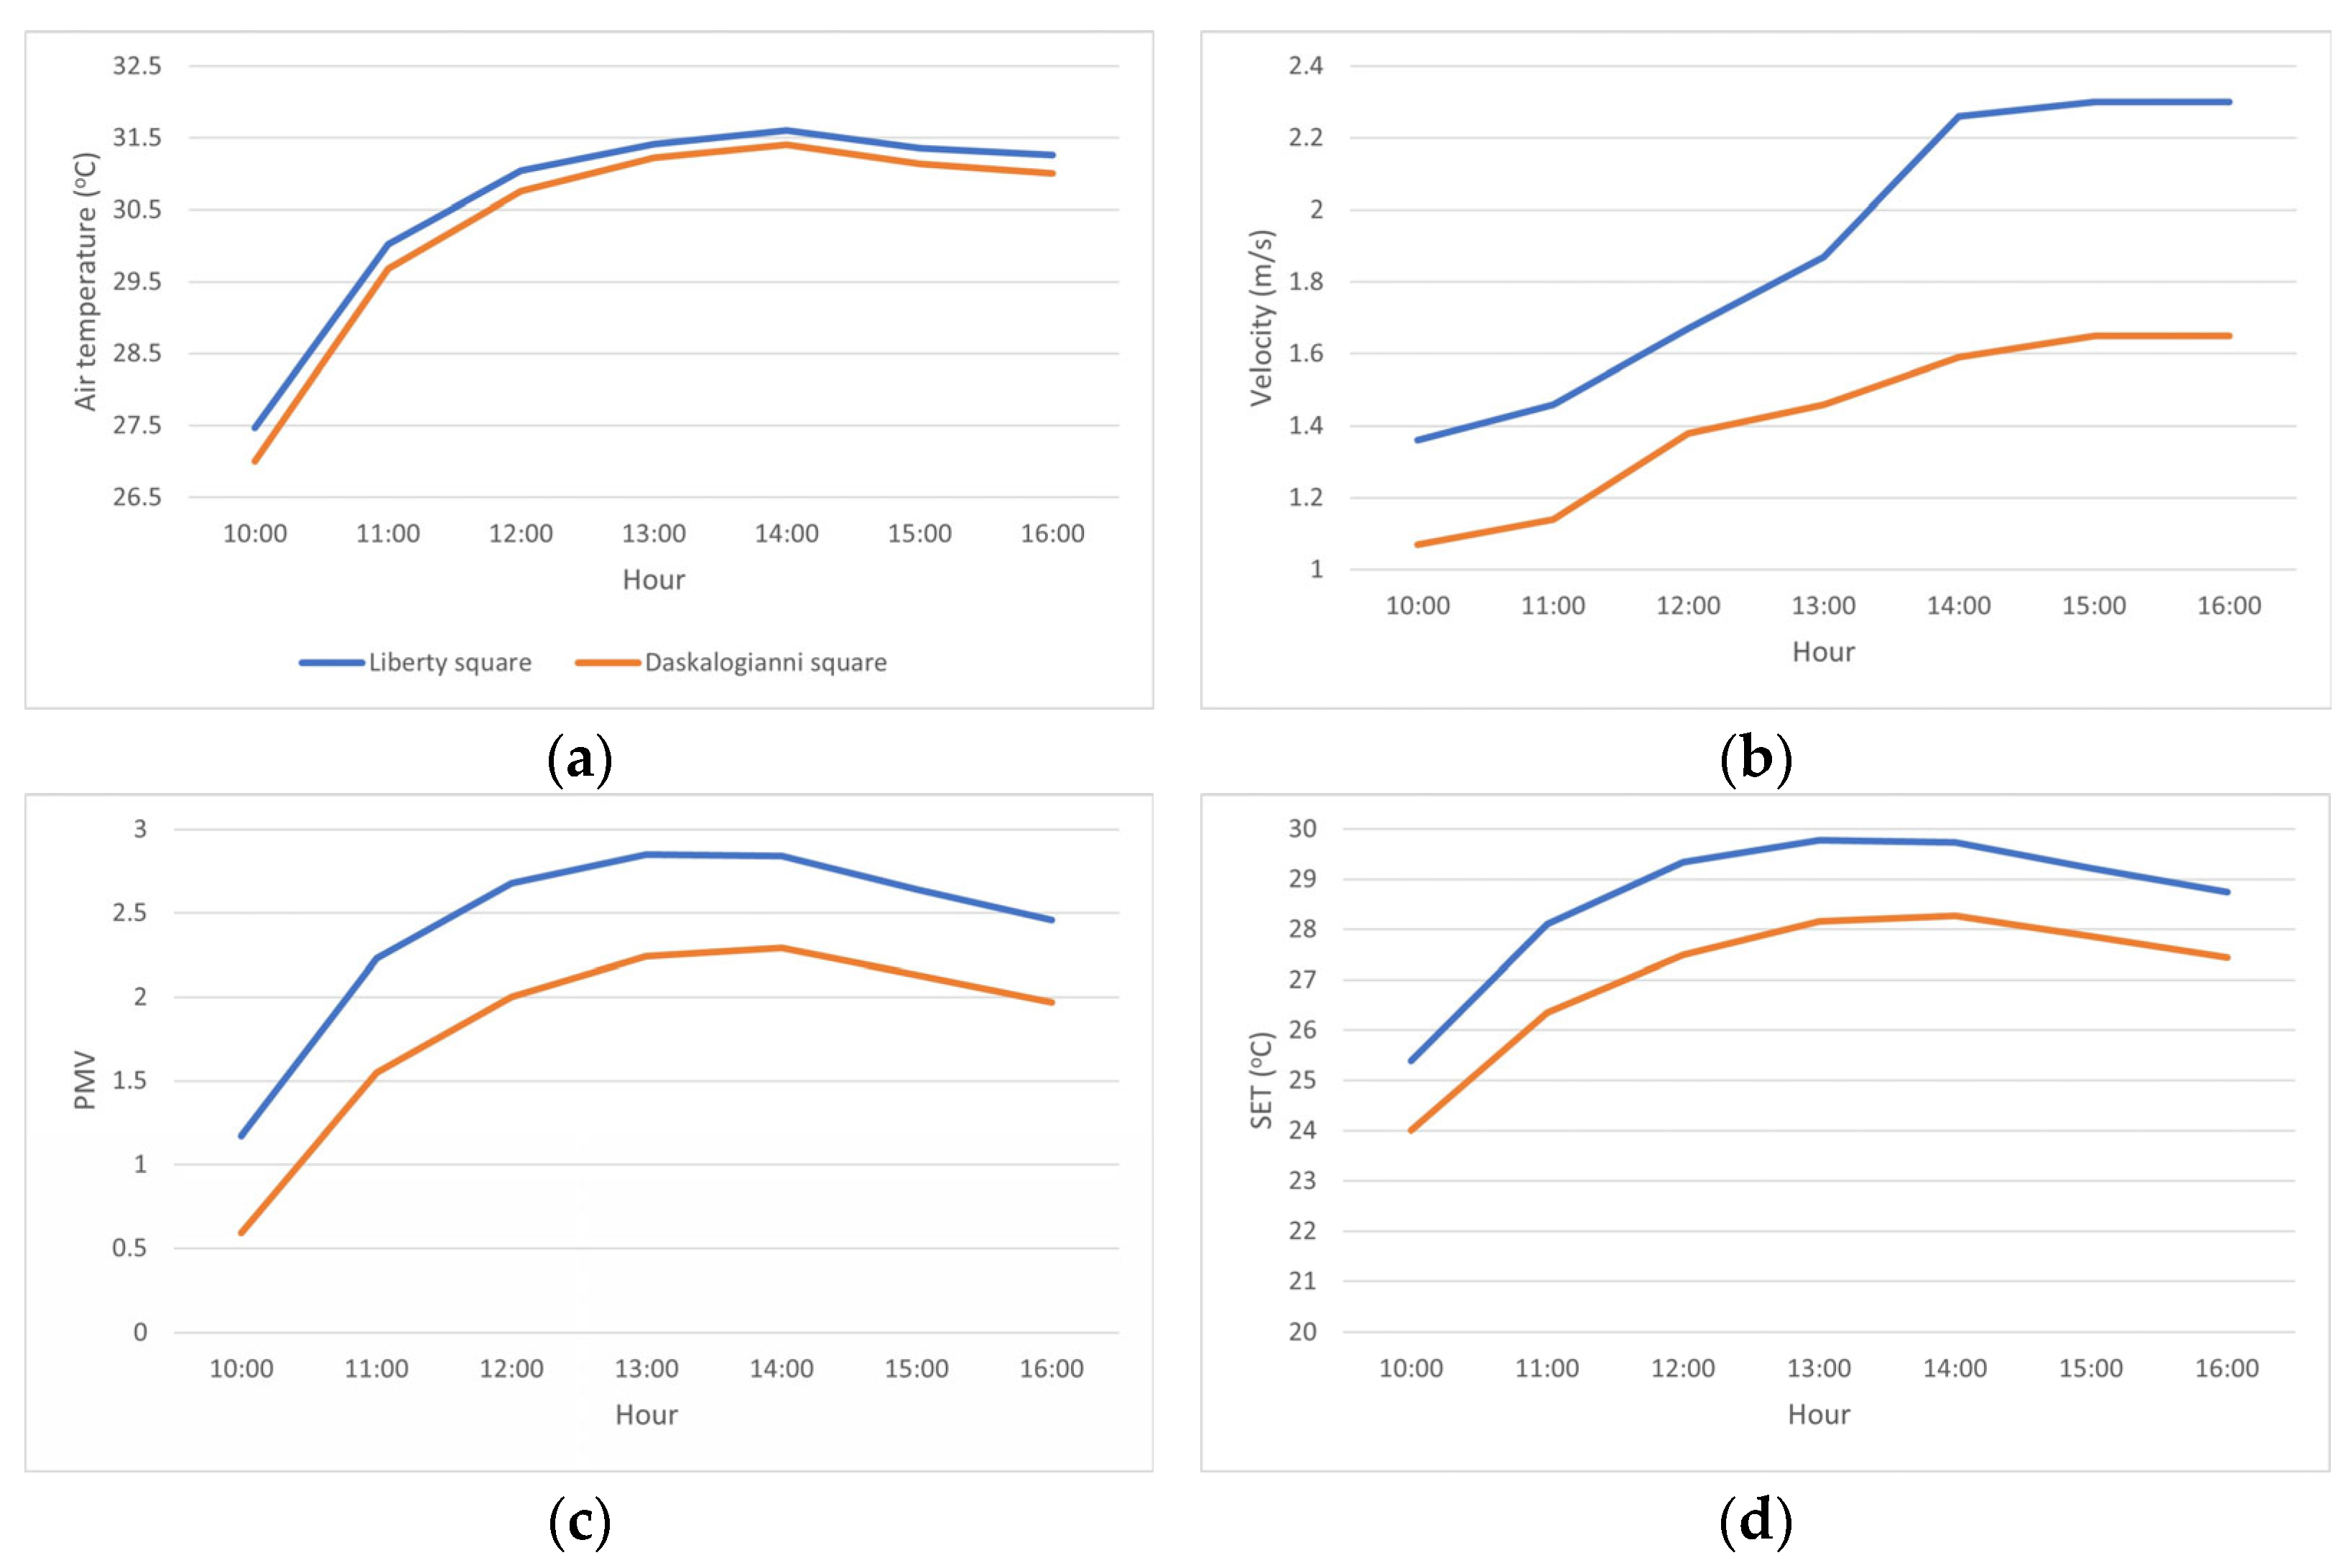
- Due to the high level of shading achieved in both the Liberty Square and the Daskalogianni Square, mainly as a result of the existing plantation with dense-foliage trees as well as due to the extensive use of white marble, which is a naturally reflective material, both squares present high resistance to heat stresses. Particularly, in the internal area of the Liberty Square, the mean air temperature ranges from 27 °C to 29 °C within the period from 11:00 to 13:00, which is practically the same as the temperature of the incoming wind. Due to the higher extent of plantation in Daskalogianni Square, the mean air temperature is even lower, ranging from 26 °C to 28 °C within the same period.
- The highest heat stresses occur mainly in the traffic and the pedestrian roads surrounding the Liberty Square, which was expected due to the lack of shading and the use of more solar-absorptive and emitting materials. The CFD results indicate that, locally at those segments, the air temperature may increase to up to 33.5 °C, i.e., 3–4 °C more than the air temperature in the internal area of the square at 13:00. The observation is also verified by the surface temperature distribution, i.e., in the perimetric segments its mean value is approximately 10 degrees higher than that in the internal area of the square.
- The modelled TCIs clearly show that extreme discomfort occurs in the perimetric roads of the Liberty Square; notably, at 13:00, the PMV, PPD and SET area-weighted averages are 3, 90% and 32 °C, respectively. At the same time, the respective indices in both the internal area of the Liberty Square and the Daskalogianni Square are approx. 2.4, 68% and 28 °C.
- As far as the wind speed is concerned, the results show that, in most segments in both squares, the velocity is retained to relatively low levels, ranging, for example, at 15:00, when the highest incoming wind speed occurs, from 1 m/s to 4 m/s. Only in small areas where wind accelerations occur as a result of the Venturi effect [32] in narrow street canyons, i.e., at the north-east side of the Liberty Square and at some level in the west of Daskalogianni Square, the air velocity may reach locally 6 m/s, which implies possible hazardous incidents or drought discomfort; however, only for a very low portion of the urban area studied.
3.2. Evaluation of the Given Renovation Plan
- At least no increase in heat stress in terms of the surface and air temperature;
- Improve thermal comfort conditions;
- Retain wind speeds below 6 m/s;
- Ensure limited penalties in winter.
- The highest heat stress in terms of the air and surface temperature occurs within the period from 13:00 to 14:00;
- The suggested renovation achieves a reduction in the mean surface temperature throughout the urban area of 12 °C during the time period from 13:00 to 14:00 of the highest heat stress;
- The maximum reduction in the mean air temperature reaches 0.46 °C at 14:00;
- The wind speed is retained well below 6 m/s in the majority of the urban area; improvements, however, are required for wind protection in the vulnerable regions, especially at the east side of the Liberty Square;
- Summer thermal comfort is improved by around 21% or 5% based on PMV or the SET, respectively.
4. Discussion
- Replacement of the new suggested trees in the Liberty Square with other deciduous ones, since in the current suggestion most new trees are evergreen. This would allow for higher amounts of solar irradiance in the square, elevating the thermal-comfort conditions of pedestrians in winter.
- Artificial windbreaks are required on the paver at the east side of Anemogianni Street.
- Since the intervention focuses also on tackling slipperiness, the white marble surfaces suggested on the south and north pavements of Liberty Square could be replaced by reflective concrete-based pavers (such as the ones envisaged in front of the Administration of Region of Crete). Indeed, previous investigations have demonstrated that the use of materials with high reflectivity to solar radiation and high spectral emissivity (the so-called cool materials) increases the urban albedo and stands for a promising strategy to combat the UHI towards the improvement of the urban environment [18,52] and the reduction of energy consumption for cooling purposes [53].
- Conduct a thorough CFD grid-independency survey (see, for example, Ref. [41]) in order to identify the optimal mesh, i.e., the one where if increased in size, the solution remains the same;
- Run the CFD model for different turbulence models and explore the performance in comparison with the available experimental data;
- Perform an additional sensitivity analysis regarding the incident wind direction, considering that south-oriented winds are of particular interest on the island of Crete;
- Finally, from a design point of view, additional renovation scenarios should be tested using the suggested CFD model towards determining the most efficient one in terms of bioclimatic performance, taking into account the previously bulleted recommendations.
5. Conclusions
- CFD simulations of the existing situation reveal that the squares located in the studied urban area provide effective resistance to urban overheating, and vulnerable areas are identified mainly in the surrounding grid of traffic and pedestrian roads.
- The suggested renovation plan is acceptable, considering that it achieves a reduction in the surface area in vulnerable surrounding spaces of around 10 °C, a reduction in the peak mean summer air temperature throughout the study area of around 0.5 °C, and an improvement of thermal comfort in the noon hours of at least 15% (based on PMV), while no thermal-sensation or heating penalties occur in winter.
- Based on local vulnerabilities detected by the CFD model, additional interventions are recommended for further bioclimatic design improvements, such as the replacement of some suggested evergreen trees with deciduous ones for better thermal comfort conditions in winter, the identification of specific segments where cool materials may replace the suggested white marbles, and the installation of wind breaks in segments of expected high wind speeds. Additional research for future work includes improvement of the CFD model, mainly in terms of more reliable spatial discretization, sensitivity analysis of the wind speed and direction, and application of the model for additional design recommendations for developing more integrated UHI mitigation plans.
Author Contributions
Funding
Institutional Review Board Statement
Informed Consent Statement
Data Availability Statement
Conflicts of Interest
References
- Romanello, M.; McGushin, A.; Di Napoli, C.; Drummond, P.; Hughes, N.; Jamart, L.; Kennard, H.; Lampard, P.; Solano Rodriguez, B.; Arnell, N.; et al. The 2021 report of the Lancet Countdown on health and climate change: Code red for a healthy future. Lancet 2021, 398, 1619–1662. [Google Scholar] [CrossRef] [PubMed]
- UN. World Cities Report 2022—Envisaging the Future of Cities; UN—United Nations: New York, NY, USA, 2022; ISBN 9789211328943. [Google Scholar]
- Santamouris, M. Recent Progress on Urban Overheating and Heat Island Research. Integrated Assessment of the Energy, Environmental, Vulnerability and Health Impact Synergies with the Global Climate Change. Energy Build. 2020, 207, 109482. [Google Scholar] [CrossRef]
- Stavrakakis, G.M.; Tzanaki, E.; Genetzaki, V.I.; Anagnostakis, G.; Galetakis, G.; Grigorakis, E. A computational methodology for effective bioclimatic-design applications in the urban environment. Sustain. Soc. 2012, 4, 41–57. [Google Scholar] [CrossRef]
- Fitria, R.; Kim, D.; Baik, J.; Choi, M. Impact of biophysical mechanisms on urban heat island associated with climate variation and urban morphology. Sci. Rep. 2019, 9, 19503. [Google Scholar] [CrossRef]
- Li, Y.; Schubert, S.; Kropp, J.P.; Rybski, D. On the influence of density and morphology on the Urban Heat Island intensity. Nat. Commun. 2020, 11, 2647. [Google Scholar] [CrossRef]
- Manoli, G.; Fatichi, S.; Schlapfer, M.; Yu, K.; Crowther, T.W.; Meili, N.; Burlando, P.; Katul, G.G.; Bou-Zeid, E. Magnitude of urban heat islands largely explained by climate and population. Nature 2019, 573, 55–60. [Google Scholar] [CrossRef]
- Santamouris, M.; Cartalis, C.; Synnefa, A.; Kolokotsa, D. On the impact of urban heat island and global warming on the power demand and electricity consumption of buildings—A review. Energy Build. 2015, 98, 119–124. [Google Scholar] [CrossRef]
- Su, M.A.; Ngarambe, J.; Santamouris, M.; Yun, G.Y. Empirical evidence on the impact of urban overheating on building cooling and heating energy consumption. iScience 2021, 24, 102495. [Google Scholar] [CrossRef]
- Kolokotsa, D.; Santamouris, M. Review of the indoor environmental quality and energy consumption studies for low income households in Europe. Sci. Total Environ. 2015, 536, 316–330. [Google Scholar] [CrossRef]
- Berger, T.; Chundeli, F.A.; Pandey, R.U.; Jain, M.; Tarafdar, A.K.; Ramamurthy, A. Low-income residents’ strategies to cope with urban heat. Land Use Policy 2022, 119, 106192. [Google Scholar] [CrossRef]
- Schinasi, L.H.; Benmarhnia, T.; Roos, A.J.D. Modification of the association between high ambient temperature and health by urban microclimate indicators: A systematic review and metaanalysis. Environ. Res. 2018, 161, 168–180. [Google Scholar] [CrossRef]
- Akbari, H.; Davis, S.; Dorsano, S.; Huang, J.; Winert, S. Cooling Our Communities—A Guidebook on Tree Planting and White Coloured Surfacing; US Environmental Protection Agency: Office of Policy Analysis, Climate Change Division: Washington, DC, USA, 1992; ISBN 016036034x. [Google Scholar]
- Fintikakis, N.; Gaitani, N.; Santamouris, M.; Assimakopoulos, M.; Assimakopoulos, D.N.; Fintikaki, M.; Albanis, G.; Papadimitriou, K.; Chryssochoides, E.; Katopodi, K.; et al. Bioclimatic design of open public spaces in the historic centre of Tirana, Albania. Sustain. Cities Soc. 2011, 1, 54–62. [Google Scholar] [CrossRef]
- Santamouris, M.; Yun, G.Y. Recent development and research priorities on cool and super cool materials to mitigate urban heat island. Renew. Energy 2020, 161, 792–807. [Google Scholar] [CrossRef]
- Stavrakakis, G.M.; Katsaprakakis, D.A.; Damasiotis, M. Basic Principles, Most Common Computational Tools, and Capabilities for Building Energy and Urban Microclimate Simulations. Energies 2021, 14, 6707. [Google Scholar] [CrossRef]
- Stavrakakis, G.M.; Stamou, A.I.; Markatos, N.C. Evaluation of thermal comfort in indoor environments using Computational Fluid Dynamics (CFD). In Indoor Work and Living Environments: Health, Safety and Performance; Harris, R.G., Moore, D.P., Eds.; Nova Science Publishers Inc.: Hauppauge, NY, USA, 2009; pp. 97–166. ISBN 9781617285219. [Google Scholar]
- Chatterjee, S.; Khan, A.; Dinda, A.; Mithun, S.; Khatun, R.; Akbari, H.; Kusaka, H.; Mitra, C.; Bhatti, S.S.; Doan, Q.V.; et al. Simulating micro-scale thermal interactions in different building environments for mitigating urban heat islands. Sci. Total Environ. 2019, 663, 610–631. [Google Scholar] [CrossRef] [PubMed]
- Zheng, Y.; Keeffe, G.; Mariotti, J. Nature-Based Solutions for Cooling in High-Density Neighbourhoods in Shenzhen: A Case Study of Baishizhou. Sustainability 2023, 15, 5509. [Google Scholar] [CrossRef]
- Zhang, J.; Hu, D. Research of practical heat mitigation strategies in a residential district of Beijing, North China. Urban Clim. 2022, 46, 101314. [Google Scholar] [CrossRef]
- Ciacci, C.; Banti, N.; Di Naso, V.; Montechiaro, R.; Bazzocchi, F. Experimentation of Mitigation Strategies to Contrast the Urban Heat Island Effect: A Case Study of an Industrial District in Italy to Implement Environmental Codes. Atmosphere 2022, 13, 1808. [Google Scholar] [CrossRef]
- Giorio, M.; Paparella, R. Climate Mitigation Strategies: The Use of Cool Pavements. Sustainability 2023, 15, 7641. [Google Scholar] [CrossRef]
- Han, Q.; Nan, X.; Wang, H.; Hu, Y.; Bao, Z.; Yan, H. Optimizing the Surrounding Building Configuration to Improve the Cooling Ability of Urban Parks on Surrounding Neighborhoods. Atmosphere 2023, 14, 914. [Google Scholar] [CrossRef]
- Bedra, K.B.; Zheng, B.; Li, J.; Luo, X. A Parametric-Simulation Method to Study the Interconnections between Urban-Street-Morphology Indicators and Their Effects on Pedestrian Thermal Comfort in Tropical Summer. Sustainability 2023, 15, 8902. [Google Scholar] [CrossRef]
- Sinsel, T.; Simon, H.; Broadbent, A.M.; Bruse, M.; Heusinger, J. Modeling the outdoor cooling impact of highly radiative “super cool” materials applied on roofs. Urban Clim. 2021, 38, 100898. [Google Scholar] [CrossRef]
- Alves, F.M.; Gonçalves, A.; del Caz-Enjuto, M.R. The Use of Envi-Met for the Assessment of Nature-Based Solutions’ Potential Benefits in Industrial Parks—A Case Study of Argales Industrial Park (Valladolid, Spain). Infrastructures 2022, 7, 85. [Google Scholar] [CrossRef]
- Wang, M.; Song, H.; Zhu, W.; Wang, Y. The Cooling Effects of Landscape Configurations of Green–Blue Spaces in Urban Waterfront Community. Atmosphere 2023, 14, 833. [Google Scholar] [CrossRef]
- Brozovsky, J.; Radivojevic, J.; Simonsen, A. Assessing the impact of urban microclimate on building energy demand by coupling CFD and building performance simulation. J. Build. Eng. 2022, 55, 104681. [Google Scholar] [CrossRef]
- Palusci, O.; Monti, P.; Cecere, C.; Montazeri, H.; Blocken, B. Impact of morphological parameters on urban ventilation in compact cities: The case of the Tuscolano-Don Bosco district in Rome. Sci. Total Environ. 2022, 807, 150490. [Google Scholar] [CrossRef]
- Zheng, X.; Montazeri, H.; Blocken, B. Large-eddy simulation of pollutant dispersion in generic urban street canyons: Guidelines for domain size. J. Wind Eng. Ind. Aerodyn. 2021, 211, 104527. [Google Scholar] [CrossRef]
- Zheng, X.; Montazeri, H.; Blocken, B. Impact of building façade geometrical details on pollutant dispersion in street canyons. Build. Environ. 2022, 212, 108746. [Google Scholar] [CrossRef]
- Stavrakakis, G.M.; Zervas, P.L.; Sarimveis, H.; Markatos, N.C. Development of a computational tool to quantify architectural-design effects on thermal comfort in naturally ventilated rural houses. Build. Environ. 2010, 45, 65–80. [Google Scholar] [CrossRef]
- Nazarian, N.; Kleissl, J. CFD simulation of an idealized urban environment: Thermal effects of geometrical characteristics and surface materials. Urban Clim. 2015, 12, 141–159. [Google Scholar] [CrossRef]
- Nazarian, N.; Fan, J.; Sin, T.; Norford, L.; Kleissl, J. Predicting outdoor thermal comfort in urban environments: A 3D numerical model for standard effective temperature. Urban Clim. 2017, 20, 251–267. [Google Scholar] [CrossRef]
- Gaber, N.; Ibrahim, A.B.; Rashad, A.; Wahba, E.; El-Sayad, Z.; Bakr, A.F. Improving pedestrian micro-climate in urban canyons: City Center of Alexandria, Egypt. Urban Clim. 2020, 34, 100670. [Google Scholar] [CrossRef]
- Ghani, S.; Mahgoub, A.O.; Bakochristou, F.; ElBialy, E.A. Assessment of thermal comfort indices in an open air-conditioned stadium in hot and arid environment. J. Build. Eng. 2021, 40, 102378. [Google Scholar] [CrossRef]
- Li, Z.; Zhang, H.; Juan, Y.-H.; Lee, Y.-T.; Wen, C.-Y.; Yang, A.-S. Effects of urban tree planting on thermal comfort and air quality in the street canyon in a subtropical climate. Sustain. Cities Soc. 2023, 91, 104334. [Google Scholar] [CrossRef]
- Liu, Z.; Cheng, W.; Jim, C.Y.; Morakinyo, T.E.; Shi, Y.; Ng, E. Heat mitigation benefits of urban green and blue infrastructures: A systematic review of modeling techniques, validation and scenario simulation in ENVI-met V4. Build. Environ. 2021, 200, 107939. [Google Scholar] [CrossRef]
- Tsitoura, M.; Tsoutsos, T.; Daras, T. Evaluation of comfort conditions in urban open spaces. Application in the island of Crete. Energy Convers. Manag. 2014, 86, 250–258. [Google Scholar] [CrossRef]
- Katsaprakakis, D.A.; Dakanali, I.; Zidianakis, G.; Yiannakoudakis, Y.; Psarras, N.; Kanouras, S. Potential on Energy Performance Upgrade of National Stadiums: A Case Study for the Pancretan Stadium, Crete, Greece. Appl. Sci. 2019, 9, 1544. [Google Scholar] [CrossRef]
- Stavrakakis, G.M.; Koukou, M.K.; Vrachopoulos, M.G.; Markatos, N.C. Natural cross-ventilation in buildings: Building-scale experiments, numerical simulation and thermal comfort evaluation. Energy Build. 2008, 40, 1666–1681. [Google Scholar] [CrossRef]
- Richards, P.J.; Hoxey, R.P. Appropriate boundary conditions for computational wind engineering models using the k-ε turbulence model. J. Wind Eng. Ind. Aerodyn. 1993, 46–47, 145–153. [Google Scholar] [CrossRef]
- Stavrakakis, G.M.; Tomazinakis, N.; Markatos, N. Modified “closure” constants of the Standard k–ε turbulence model for the prediction of wind-induced natural ventilation. Build. Serv. Eng. Res. Technol. 2011, 33, 241–261. [Google Scholar] [CrossRef]
- Cook, N.J. The Deavis and Harris ABL model applied to heterogeneous terrain. J. Wind Eng. Ind. Aerodyn. 1997, 66, 197–214. [Google Scholar] [CrossRef]
- Penman, H.L. Natural evaporation from open water, bare soil and grass. Proc. R. Soc. Lond. Ser. A 1948, 194, 120–145. [Google Scholar]
- Monteith, J.L. Evaporation and environment. Symp. Soc. Exp. Biol. 1965, 19, 205–224. [Google Scholar] [PubMed]
- Jones, H.G. Plants and Microclimate—A Quantitative Approach to Environmental Plant Physiology, 2nd ed.; Cambridge University Press: Cambridge, UK, 1992. [Google Scholar]
- De Dear, R.; Spagnolo, J. Thermal comfort in outdoor and semi-outdoor environments. In Environmental Ergonomics—The Ergonomics of Human Comfort, Health and Performance in the Thermal Environment; Tochihara, Y., Ohnaka, T., Eds.; Elsevier Ltd.: Amsterdam, The Netherlands, 2005; pp. 269–276. [Google Scholar]
- ASHRAE Standard-55. Thermal Environmental Conditions for Human Occupancy. American Society of Heating, Refrigerating and Air Conditioning Engineers, Inc.: Atlanta, GA, USA, 2010.
- Katsaprakakis, D.A.; Zidianakis, G.; Yiannakoudakis, Y.; Manioudakis, E.; Dakanali, I.; Kanouras, S. Working on Buildings’ Energy Performance Upgrade in Mediterranean Climate. Energies 2020, 13, 2159. [Google Scholar] [CrossRef]
- Fanger, P.O.; Toftum, J. Extension of the PMV model to non-air-conditioned buildings in warm climates. Energy Build. 2002, 34, 533–536. [Google Scholar] [CrossRef]
- Santamouris, M.; Synnefa, A.; Karlessi, T. Using advanced cool materials in the urban built environment to mitigate heat islands and improve thermal comfort conditions. Sol. Energy 2011, 85, 3085–3102. [Google Scholar] [CrossRef]
- Stavrakakis, G.M.; Androutsopoulos, A.V.; Vyörykkä, J. Experimental and numerical assessment of cool-roof impact on thermal and energy performance of a school building in Greece. Energy Build. 2016, 130, 64–84. [Google Scholar] [CrossRef]
- Lin, H.; Xiao, Y.; Musso, F.; Lu, Y. Green Façade Effects on Thermal Environment in Transitional Space: Field Measurement Studies and Computational Fluid Dynamics Simulations. Sustainability 2019, 11, 5691. [Google Scholar] [CrossRef]


| Symbol | Name | Nature (Evergreen (E)/Deciduous (D)) | Height (m) | Foliage Shape | Foliage Diameter (m) |
|---|---|---|---|---|---|
| T1 | Eucalyptus | E | 12 | Spherical | 10 |
| T2 | Redbud | D | 6 | Spherical | 5 |
| T3 | Mulberry | D | 6 | Spherical | 5 |
| T4 | Olive | E | 9 | Spherical | 7 |
| T5 | Palm tree | E | 15 | Spherical | 4 |
| T6 | Sycamore | E | 10 | Spherical | 8 |
| T7 | Brachychiton | D | 7 | Conical | 3 |
| T8 | Acer | D | 7 | Spherical | 6 |
| T9 | Jacaranda | D | 7 | Spherical | 6 |
| T10 | Lagunaria | E | 6 | Spherical | 5 |
| T11 | Pistacia | Ε | 4 | Spherical | 3 |
| T12 | Plum | D | 5 | Spherical | 4 |
| Symbol | Name | Reflectivity | Emissivity |
|---|---|---|---|
| M0 | Buildings | 0.3 | 0.8 |
| M1 | White marble | 0.54 | 0.95 |
| M2 | Conventional asphalt | 0.06 | 0.95 |
| M3 | Concrete slab | 0.3 | 0.9 |
| M4 | Travertine marble | 0.44 | 0.95 |
| M5 | Marble (dark grey) | 0.16 | 0.95 |
| M6 | Porphyry slab | 0.3 | 0.9 |
| M7 | Tufa paver | 0.35 | 0.9 |
| M8 | Grass | 0.2 | 0.68 |
| M9 | Water | 0.05 | 0.95 |
| M10 | Cool grey asphalt | 0.37 | 0.89 |
| M11 | Cool beige paver | 0.65 | 0.89 |
| KPI | Hour: 11:00 | Hour: 13:00 | Hour: 15:00 |
|---|---|---|---|
| Solar flux density, G (W/m2) |  |  |  |
| Surface temperature, Tsurf (K) | 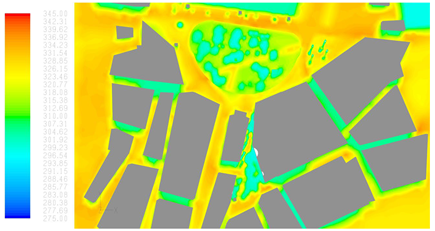 | 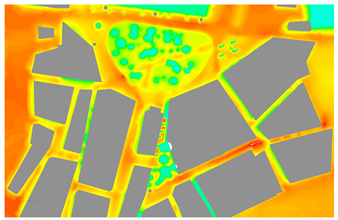 | 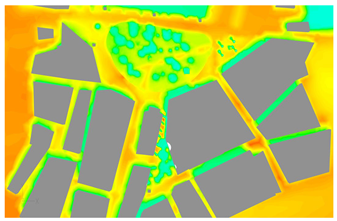 |
| Air temperature, Tair (°C) | 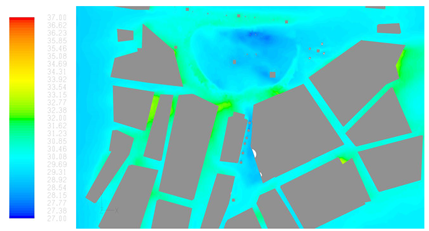 | 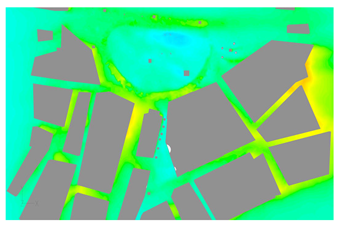 |  |
| Relative humidity, RH (%) | 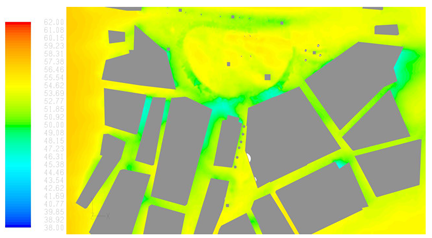 | 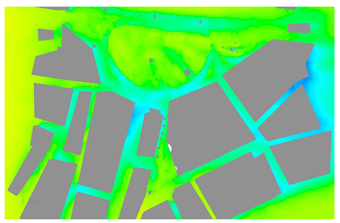 | 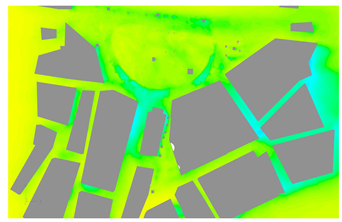 |
| Wind speed, WS (m/s) |  | 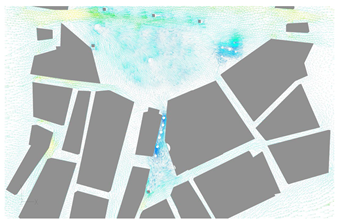 | 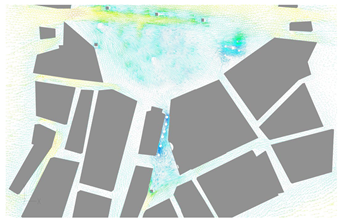 |
| Predicted Mean Vote, PMV (-) |  | 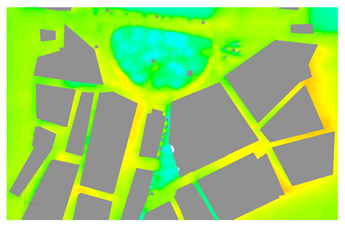 | 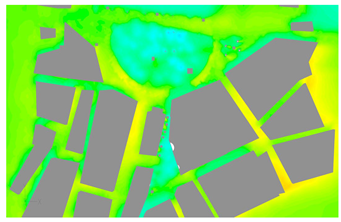 |
| Standard Effective Temperature, SET (°C) |  | 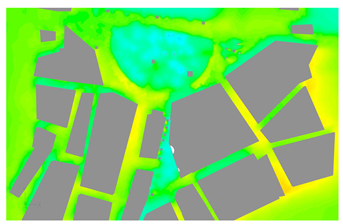 | 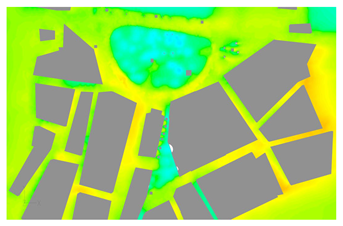 |
| Predicted Percentage Dissatisfied, PPD (%) | 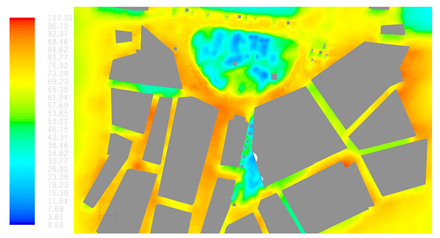 | 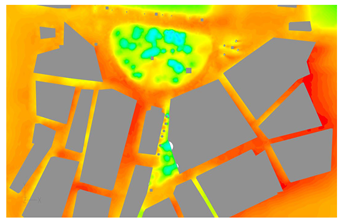 | 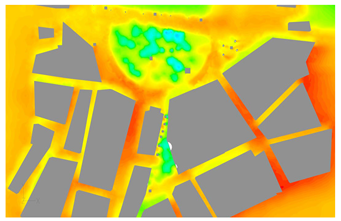 |
| Area-Weighted KPI | Hour | Hourly Average | Reference Study [39] | ||||||
|---|---|---|---|---|---|---|---|---|---|
| 10:00 | 11:00 | 12:00 | 13:00 | 14:00 | 15:00 | 16:00 | |||
| Air temperature (°C) | 27.47 | 30.02 | 31.04 | 31.41 | 31.50 | 31.36 | 31.26 | 30.58 | 31.19 1 |
| Wind speed (m/s) | 1.36 | 1.46 | 1.67 | 1.87 | 2.26 | 2.87 | 2.25 | 1.96 | 1.15 1 |
| RH (%) | 58.24 | 52.67 | 50.16 | 50.02 | 50.43 | 51.49 | 52.24 | 52.18 | 46.21 1 |
| Solar flux density (W/m2) | 712.45 | 935.12 | 1098 | 1188.4 | 1174.42 | 1067 | 892.5 | 1009.70 | 976.93 1 |
| PMV | 1.17 | 2.23 | 2.68 | 2.85 | 2.84 | 2.64 | 2.46 | 2.41 | 1.78 2 |
| SET (°C) | 25.39 | 28.11 | 29.34 | 29.78 | 29.74 | 29.22 | 28.74 | 28.62 | 37.34 1 |
| PPD (%) | 31.32 | 68.74 | 81.00 | 84.43 | 84.35 | 80.08 | 75.80 | 72 | 77.80 2 |
| KPI | Existing Situation | Suggested Situation |
|---|---|---|
| Surface temperature, Tsurf (K) | 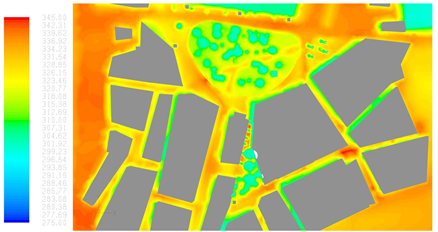 | 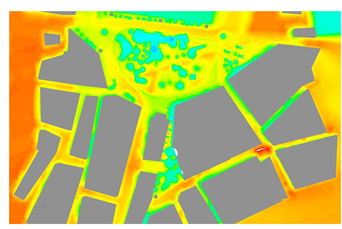 |
| Air temperature, Tair (°C) | 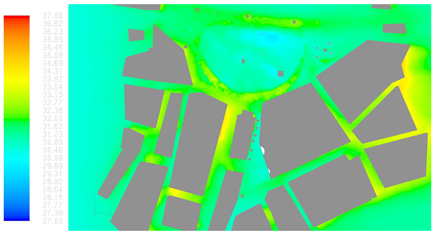 | 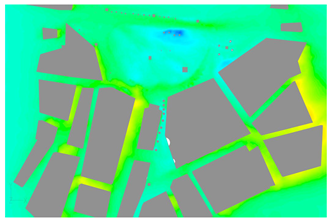 |
| Relative humidity, RH (%) |  |  |
| Wind speed, WS (m/s) |  | 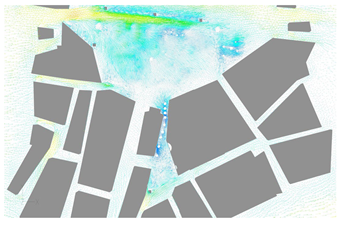 |
| Predicted Mean Vote, PMV (-) | 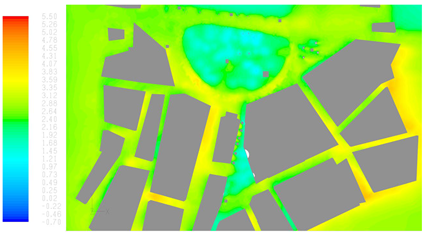 | 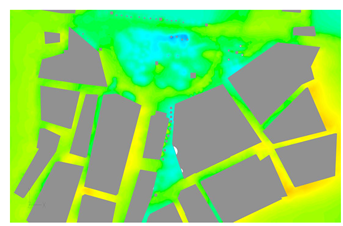 |
| Standard Effective Temperature, SET (°C) | 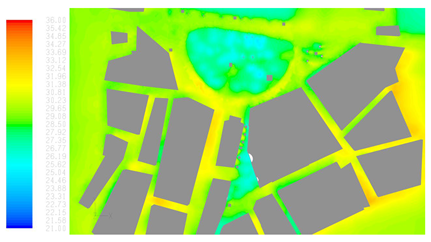 | 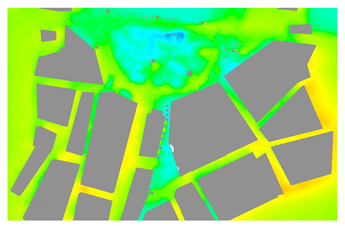 |
| Predicted Percentage Dissatisfied, PPD (%) |  | 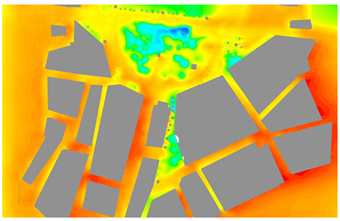 |
| KPI | Hour | ||||||
|---|---|---|---|---|---|---|---|
| 10:00 | 11:00 | 12:00 | 13:00 | 14:00 | 15:00 | 16:00 | |
| Air temperature | |||||||
| Existing situation (°C) | 27.46 | 30.01 | 31.04 | 31.41 | 31.50 | 31.35 | 31.26 |
| Suggested situation (°C) | 26.99 | 29.6 | 30.68 | 31.05 | 31.04 | 31.02 | 30.91 |
| Difference (°C) | 0.47 | 0.41 | 0.36 | 0.36 | 0.46 | 0.33 | 0.35 |
| Difference (%) | 1.71% | 1.37% | 1.16% | 1.15% | 1.43% | 1.05% | 1.12% |
| Surface temperature | |||||||
| Existing situation (K) | 316.85 | 322.39 | 328.19 | 330.44 | 329.61 | 326.56 | 322.64 |
| Suggested situation (K) | 309.19 | 314.56 | 317.44 | 318.43 | 317.58 | 315.45 | 312.7 |
| Difference (K) | 7.66 | 7.83 | 10.75 | 12.01 | 12.03 | 11.11 | 9.94 |
| Difference (%) | 2.42% | 2.43% | 3.28% | 3.63% | 3.65% | 3.40% | 3.08% |
| Wind speed | |||||||
| Existing situation (m/s) | 1.29 | 1.39 | 1.61 | 1.77 | 2.11 | 2.15 | 2.11 |
| Suggested situation (m/s) | 1.37 | 1.48 | 1.73 | 2 | 2.3 | 2.48 | 2.52 |
| Difference | −0.08 | −0.09 | −0.12 | −0.23 | −0.19 | −0.33 | −0.41 |
| Difference (%) | −6.20% | −6.47% | −7.45% | −12.99% | −9.00% | −15.35% | −19.43% |
| PMV | |||||||
| Existing situation | 1.15 | 2.21 | 2.67 | 2.84 | 2.82 | 2.62 | 2.45 |
| Suggested situation | 0.72 | 1.68 | 2.09 | 2.22 | 2.22 | 2.08 | 1.94 |
| Difference | 0.43 | 0.53 | 0.58 | 0.62 | 0.6 | 0.54 | 0.51 |
| Difference (%) | 37.39% | 23.98% | 21.72% | 21.83% | 21.28% | 20.61% | 20.82% |
| SET | |||||||
| Existing situation (°C) | 25.36 | 28 | 29.3 | 29.75 | 29.71 | 29.19 | 28.71 |
| Suggested situation (°C) | 24.33 | 26.69 | 27.75 | 28.1 | 28.11 | 27.7 | 27.34 |
| Difference | 1.03 | 1.31 | 1.55 | 1.65 | 1.6 | 1.49 | 1.37 |
| Difference (%) | 4.06% | 4.68% | 5.29% | 5.55% | 5.39% | 5.10% | 4.77% |
| KPI | Existing Situation | Suggested Situation |
|---|---|---|
| Air temperature, Tair (°C) | 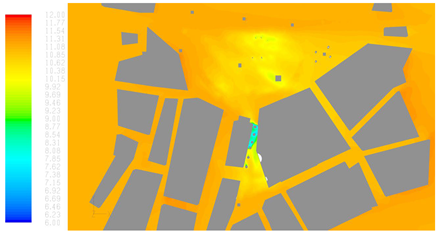 | 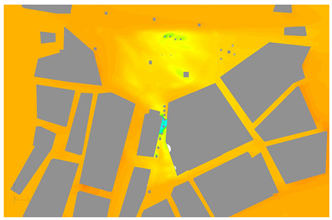 |
| Area-weighted average: 10.69 | Area-weighted average: 10.62 | |
| Wind speed, WS (m/s) | 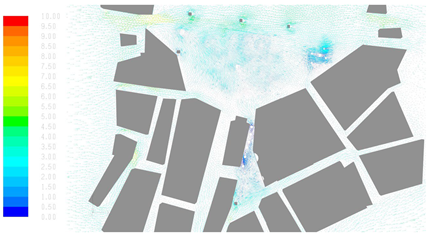 | 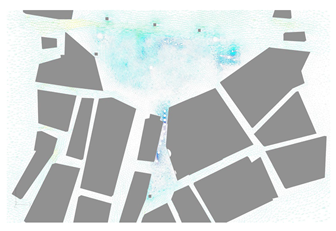 |
| Area-weighted average: 1.38 | Area-weighted average: 1.53 | |
| Predicted Mean Vote, PMV (-) | 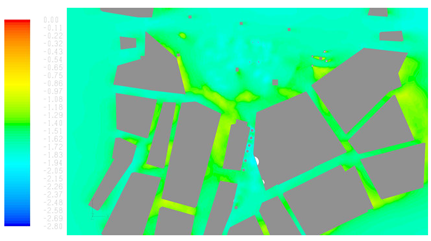 | 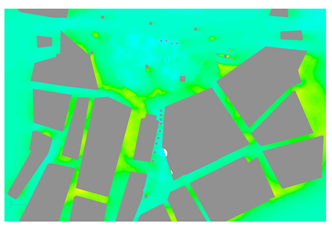 |
| Area-weighted average: −1.62 | Area-weighted average: −1.65 | |
| Standard Effective Temperature, SET (°C) |  | 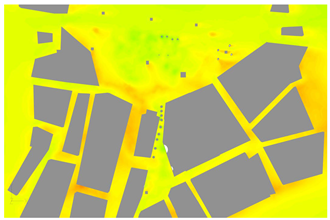 |
| Area-weighted average: 14.08 | Area-weighted average: 14.03 |
Disclaimer/Publisher’s Note: The statements, opinions and data contained in all publications are solely those of the individual author(s) and contributor(s) and not of MDPI and/or the editor(s). MDPI and/or the editor(s) disclaim responsibility for any injury to people or property resulting from any ideas, methods, instructions or products referred to in the content. |
© 2023 by the authors. Licensee MDPI, Basel, Switzerland. This article is an open access article distributed under the terms and conditions of the Creative Commons Attribution (CC BY) license (https://creativecommons.org/licenses/by/4.0/).
Share and Cite
Stavrakakis, G.M.; Katsaprakakis, D.A.; Braimakis, K. A Computational Fluid Dynamics Modelling Approach for the Numerical Verification of the Bioclimatic Design of a Public Urban Area in Greece. Sustainability 2023, 15, 11642. https://doi.org/10.3390/su151511642
Stavrakakis GM, Katsaprakakis DA, Braimakis K. A Computational Fluid Dynamics Modelling Approach for the Numerical Verification of the Bioclimatic Design of a Public Urban Area in Greece. Sustainability. 2023; 15(15):11642. https://doi.org/10.3390/su151511642
Chicago/Turabian StyleStavrakakis, George M., Dimitris A. Katsaprakakis, and Konstantinos Braimakis. 2023. "A Computational Fluid Dynamics Modelling Approach for the Numerical Verification of the Bioclimatic Design of a Public Urban Area in Greece" Sustainability 15, no. 15: 11642. https://doi.org/10.3390/su151511642
APA StyleStavrakakis, G. M., Katsaprakakis, D. A., & Braimakis, K. (2023). A Computational Fluid Dynamics Modelling Approach for the Numerical Verification of the Bioclimatic Design of a Public Urban Area in Greece. Sustainability, 15(15), 11642. https://doi.org/10.3390/su151511642


