Article

A Computational Fluid Dynamics Modelling Approach for the Numerical Verification of the Bioclimatic Design of a Public Urban Area in Greece

by
George M. Stavrakakis
1,2,*,
Dimitris A. Katsaprakakis
1 and
Konstantinos Braimakis
3
1
Power Plant Synthesis Laboratory, Department of Mechanical Engineering, Hellenic Mediterranean University, 71410 Heraklion, Greece
2
Energy and Environmental Research Office, 20 Agamemnonos Str., 71409 Heraklion, Greece
3
Laboratory of Refrigeration, Air Conditioning & Solar Energy, Thermal Engineering Section, School of Mechanical Engineering, National Technical University of Athens, 9 Heroon Polytechniou Str., 15780 Zografou, Greece
*
Author to whom correspondence should be addressed.
Sustainability 2023, 15(15), 11642; https://doi.org/10.3390/su151511642
Submission received: 21 June 2023 / Revised: 14 July 2023 / Accepted: 25 July 2023 / Published: 27 July 2023

Abstract

:
Recent recordings of urban overheating reveal a dramatic increase in cities’ population exposure to heatwaves. Heatwaves’ implications are escalated in urban environments due to the intensification of the Urban Heat Island (UHI) effect. To combat the overheating and UHI adverse effects, novel urban rehabilitation actions are needed based on reliable predictions of appropriate Key Performance Indicators (KPIs) (such as pedestrian-level air temperature and thermal comfort) for alternative design scenarios. The objective of the current study is to present the application of a previously developed Computational Fluid Dynamics (CFD) model for the calculation of urban microclimatic conditions for the assessment of the UHI and thermal-comfort conditions in a central urban area in the city of Heraklion in Crete, Greece. Empirical validation of the model is performed through comparisons with monitored microclimate data (i.e., air temperature, relative humidity, wind speed) and actual sensation vote recordings found in another research study. In compliance with the latter, the validation campaign is conducted for a typical hot summer day in July 2009 from 10:00 to 16:00. The model is then used to assess the UHI effects for both the existing urban configuration and a given suggested environmental upgrade of the space. Simulations of the existing situation reveal that the squares located in the studied area already stand for efficient resistances to urban overheating, and heat vulnerabilities are detected mainly in non-shaded traffic and pedestrian roads perimetric to the squares. Based on the CFD simulations, the suggested environmental upgrading plan exhibits a reduction in the peak mean air temperature of 0.46 °C, and thermal comfort is improved by at least 5% (based on SET) throughout the studied area in summer. At the same time, simulations of winter conditions suggest that there are limited potential pedestrian thermal-sensation and building heating penalties under the considered renovation scenario.

1. Introduction

Urban overheating is undoubtedly one of the most crucial implications of climate change all over the world. Over the decade up to the year 2020, the vulnerable population older than the age of 65 and younger than the age of 1 experienced a mean annual increase in exposure to heatwaves of around 2.9 and 0.6 billion person-days, respectively, compared to the reference period of 1986–2005 [1]. At the same time, urbanization worldwide continuously rises, and the population living in cities is expected to increase from 56% that it is today to 68% in 2050 [2]. These figures imply that urban overheating will affect more people in the near future, taking also into account the increased intensity of the Urban Heat Island (UHI) phenomenon in cities. The UHI is well documented in more than 400 cities worldwide, and according to several research experimental surveys, its intensity exceeds 4 °C and 10 °C in terms of the average and of the peak air temperature, respectively [3]. The phenomenon is caused mainly by the high heat stresses within the urban canopy due to the use of construction materials with poor thermo-physical and optical properties (e.g., high thermal transmittance, high solar absorptivity and emissivity), trapped heat which is emitted by construction materials due to low sky view factors, limited convective heat displacement due to the dense cityscape, in combination with a lack of heat sinks such as water surfaces and vegetation, as well as by anthropogenic heat sources such as vehicles, air-conditioning units, etc. [4,5,6,7].
The synergetic impacts of rapidly increased heatwaves and urban overheating are referred mainly to energy performance as well as to socio-economic issues. Regarding the energy performance of buildings, it has been found that, on average, the UHI is responsible for an additional peak electricity demand and cooling energy penalty—normalized per temperature unit degree change—of around 21 W per person and 0.7 kWh per city sq. m., respectively [8]. This poses a serious threat regarding both environmental (energy-induced emissions) and economic (energy cost) welfare in cities, especially in view of scientific predictions for the next 30–40 years, which admit that the cooling energy demand will seriously exceed the corresponding heating demand [3]. Through the statistical analysis of 7-year duration recordings of microclimatic conditions and of available building energy consumption data in Seoul, Su et al. [9] concluded that an increase in the UHI intensity of 0.5 K corresponds to an increase in the monthly cooling energy consumption in the range of 0.89–1.84 kWh/m2. From a socio-economic point of view, urban overheating also enhances energy poverty. Indeed, the low-income population living in older—usually thermally unprotected—buildings in city centres often cannot cope with the high energy cost associated with the increased cooling demand to satisfy indoor thermal comfort conditions [10,11]. In addition, past research has provided evidence of the interrelation between urban overheating and the risk of heat-related mortality (HRM) [3]. A systematic meta-analysis of previous studies provided in Ref. [12] concluded that population living in warmer neighbourhoods within cities has almost a 6% higher risk of mortality compared to those living in cooler urban districts.
Scientific evidence of the rapid exposure to heatwaves and of the socio-economic impacts of the UHI calls for the emergence of actions to enhance climate-change resilience and improve adaptation in cities. From a technical point of view, there are several solutions to mitigate the UHI intensities in city centres in the framework of urban planning and renovation activities. The use of reflective construction materials, the increase in vegetation and the use of heat sinks, in principle, have been strongly recommended towards the bioclimatic upgrade of cityscapes with high heat stresses [13,14]. Recent research advances have shown tremendous progress in innovative materials that can be used to effectively cool cities, such as supercool materials for building and urban surface applications. An extensive review of various highly efficient materials, their properties and proof-of-concept techniques is provided in Ref. [15].
Along with progress in technological and nature-based solutions for urban renovation applications, their rational use and implementation in the urban environment is of equal importance from the practitioners’ point of view, i.e., architects and engineers. Recent trends and requirements regarding the planning of climate-change mitigation and adaptation strategies at the city level dictate that simulation techniques concerning the urban microclimate should no longer be considered “for research purposes only” and should move to the practitioner level at the early design stages [16]. In the latter, numerous available computational methods and tools are reviewed that can be used by the designer for impact-assessment purposes, providing quantification of the impacts reflected by alternative renovation scenarios. Among others, the microscale computational fluid dynamics (microscale CFD) method is highlighted as the most promising one in terms of the geometry resolution and the fact that it solves for all the conservation equations; however, this comes at the cost of higher computational time compared to other simulation methods [16,17].
In the scientific literature, there are a vast number of studies that employ CFD tools for studying urban microclimate mitigation; some of them are reported in Ref. [16]. Based on its advantage of containing special urban physical models (e.g., evaporation from water surfaces, evapotranspiration from vegetation, basic turbulence modelling and thermal comfort indices) relieving the user of own-defined functions and codes, the ENVI-met software has been extensively used in urban planning studies, mainly for exploring the impacts of alternative design scenarios [18,19,20,21,22], urban configurations and morphologies [23,24] and novel artificial materials such as supercool materials [25] or nature-based solutions [19,26,27]. On the other hand, taking into account its flexibility in coupling with zonal models for assessing urban microclimate effects on building energy performance [16,28], but especially due to its numerous alternatives regarding grid meshing in complex geometries and turbulence modelling [16], the Ansys FLUENT software has gained popularity in advanced urban planning studies. For example, Palusci et al. [29] conducted an extensive study of the impact of crucial urban morphological parameters and provided useful correlations with the mean air velocity at the pedestrian level and at a 10 m altitude. Moreover, several studies are found focusing on research into street canyons to explore pollutants’ dispersion impacts on urban air quality [30,31] using FLUENT. Concerning microclimate simulations with a special focus on the assessment of the UHI implications and thermal comfort, Stavrakakis et al. [4] developed a holistic urban microclimate model within the FLUENT CFD package, taking into account special effects such as evaporation from water surfaces and evapotranspiration from trees, including incident solar irradiance, towards the suggestion of the best bioclimatic upgrade for an urban area in Greece. Their model integrated a user-defined sub-model for the calculation of the PMV index and its modifications for non-air-conditioned spaces, as presented in an earlier study for naturally ventilated buildings [32]. Nazarian and Kleissl [33] explored the impact of various design parameters (urban aspect ratio, albedo, wind speed and direction) on the ground surface temperatures in the FLUENT simulation environment, which was later-on enhanced with the incorporation of the so-called OTC3D model for the calculation of the Standard Effective Temperature (SET) for urban thermal comfort assessments [34]. Recently, a comprehensive study incorporating a customized field function for PMV calculation was also presented in Ref. [35], providing a spatial distribution of thermal comfort for assessing alternative mitigation measures. Moreover, Ghani et al. [36] also developed a holistic outdoor thermal comfort model capturing additional thermal comfort indices, such as the SET, and provided validation of the predictions in comparison with actual sensation votes obtained via a questionnaire survey for the case of an open air-conditioned stadium.
As revealed previously, the assessment of the urban microclimate in simulation environments has flourished during the last decade as it stands as a powerful tool to better understand the impact of alternative mitigation strategies. Past research shows that concerning the CFD approach, the ENVI-met and the Ansys FLUENT computational tools are widely used; however, the latter is applied mainly for wind engineering practices, air quality and thermal fields, and not often for direct production of the spatial distribution of advanced thermal comfort indices such as the PMV, SET, etc. From the point of view of special urban physics modelling, it has been reported that few studies exist using Ansys FLUENT specifically for capturing the effects of urban green and blue infrastructures [37,38]. On the other hand, limited research exists regarding the validation of the FLUENT-based simulated thermal sensation in comparison with actual sensation votes in real-scale cases. The objective of the present work is to utilize a holistic urban microclimate CFD model previously developed in the FLUENT software, which incorporates user-defined functions for well-known thermal comfort indices, for the evaluation of the UHI and thermal comfort conditions in an urban area in Heraklion, Crete, Greece. Empirical validation of the model is performed through comparing the computed results against climate data and actual thermal sensation votes obtained in another study [39] for the same urban area. The model is then used to check and verify the bioclimatic character of a given urban renovation plan focusing not only on climate issues but also on other challenges ranging from simple maintenance to mitigating surface glare and slipperiness. The technical methodology is unfolded as follows:
  • Presentation of the study area considered;
  • Extraction of representative climatic conditions of the area in focus;
  • Development of the CFD model and KPIs solved;
  • Empirical validation approach;
  • Evaluation of the given urban bioclimatic upgrade.
It is found that the model presents good agreement with the recorded data in the summer period. The modelling approach is general and replicable for any urban space, considering that universal physical models are included in the simulation technique. The key delivery of the present study is a CFD modelling methodology for urban planning practices and informed decision making, particularly in the framework of drafting documented climate-change adaptation master plans and policy-related measures.

2. Materials and Methods

2.1. Study Area

The urban area in focus is presented in Figure 1 (Lat.: 35.33779°; Long.: 25.13641°) (with the north direction oriented to the left-hand side), along with key names of buildings, streets and symbols for trees, which are explained in the nomenclature of Table 1. In Figure 1, the study area is presented by means of a depiction of its location on the north shore of the city of Heraklion (in relation to the suburban weather station from which climatic data are received) and of the concerned urban district. The area is located in the historic centre of Heraklion city on the island of Crete, Greece. It consists of 2 squares connected and surrounded by both traffic and pedestrian roads. The area is highly visited all year long, while especially during summer months it gathers many tourists walking by for site-seeing as well as for visiting the nearby archaeological museum. The Liberty Square is occasionally used for several events, such as musical concerts, public speeches, local-products exhibitions, etc. It is a common meeting point and is considered a place of walk and revitalization. The study area indeed faces high environmental stresses since it exists within the dense cityscape subjected to high traffic of both private and public-use vehicles. The environmental upgrade of the considered area is a top priority of the municipal authority to tackle the aforementioned challenges. The land cover is around 4.5 hectares while the altitude from sea level is approximately 30 m, and it is constituted by the subregions and key characteristics below:
  • Liberty Square: The ground material is mainly white marble with low portions of porphyry slabs. Plantation includes mainly sycamore, a few palm trees and eucalyptus, at the south, west, and at both the north and central parts of the square, respectively. There is no water surface and limited soil and grass surfaces exist. Perimetric traffic roads are covered with conventional asphalt.
  • Daskalogianni Square: The ground cover constitutes mainly conventional concrete slabs. Extensive plantation with sycamore and eucalyptus provides enough shading in summer; however, due to their evergreen nature, the provided shading in winter is considered redundant.
  • Liberty Square perimetric pavements: The west pedestrian roads extending from the south-west part of the square to the Astoria hotel are mainly covered with tufa paver, except the small segment in front of the Administration building of the Region of Crete, which is covered with dark grey marble. The surfaces in front of the Museum, the median divider, and the junction at the north side of the square, as well as the ones on either side of the Dimokratias Avenue, are all covered with conventional concrete slabs. The paver at the east side of the Anemogianni Str. is of grey marble.

2.2. The Given Renovation Plan

Despite the ground’s relatively high reflectivity, which indeed contributes to less heat fluxes, according to the municipal authority, citizens complain about glare and slipperiness, especially in the Liberty Square. Therefore, efforts from the side of the municipal body are focused on the development of the most appropriate renovation plan which will mitigate the aforementioned symptoms, at least without compromising the local microclimate and pedestrians’ thermal comfort. A given renovation plan is provided to the research team precisely to examine the expected microclimate impacts in the area, with a special focus on the UHI implications. The following most important interventions are included in the given renovation plan:
  • Liberty Square: (a) Artificial materials: Replacement of the current white marble by a travertine marble, (b) Green and blue materials: Addition of new grass beds and bushes, installation of a fountain and new trees in some solar exposed segments.
  • Daskalogianni Square: (a) Artificial materials: Replacement of the current cover material with travertine marble, (b) Green interventions: Extension of the tree array (Τ7: Brachychiton) existing at the south side of the Region Administration building towards the east façade of the building.
  • Peripheral traffic and pedestrian roads: (a) Artificial materials: The conventional asphalt around the Liberty Square is replaced by reflective (cool) asphalt. The pedestrian road from Averof Av. to Dikaiosinis Str. is reconstructed using reflective (cool) paver of beige colour. The rest of the pedestrian roads, i.e., the south pedestrian segment of the conjunction between Dimokratias Av. and Averof Av., in between Dikaiosinis Str. and in front of the Astoria hotel, in front of the Museum, the paver at the east of Anemogianni Str. and in either side of Dimokratias Av., are now covered with white marble (for cost-efficiency purposes, the idea is that the marble pieces now existing in the Liberty Square will be re-used), (b) Green interventions: Planting new redbud trees at the east pedestrian road of Anemogianni Str., installation of a new traffic junction with a grass bed in between Dimokratias and Averof Avenues, planting a new array of jacaranda at the pedestrian segment from the south part to Averof Av., plantation of acer trees in front of the Astoria hotel.
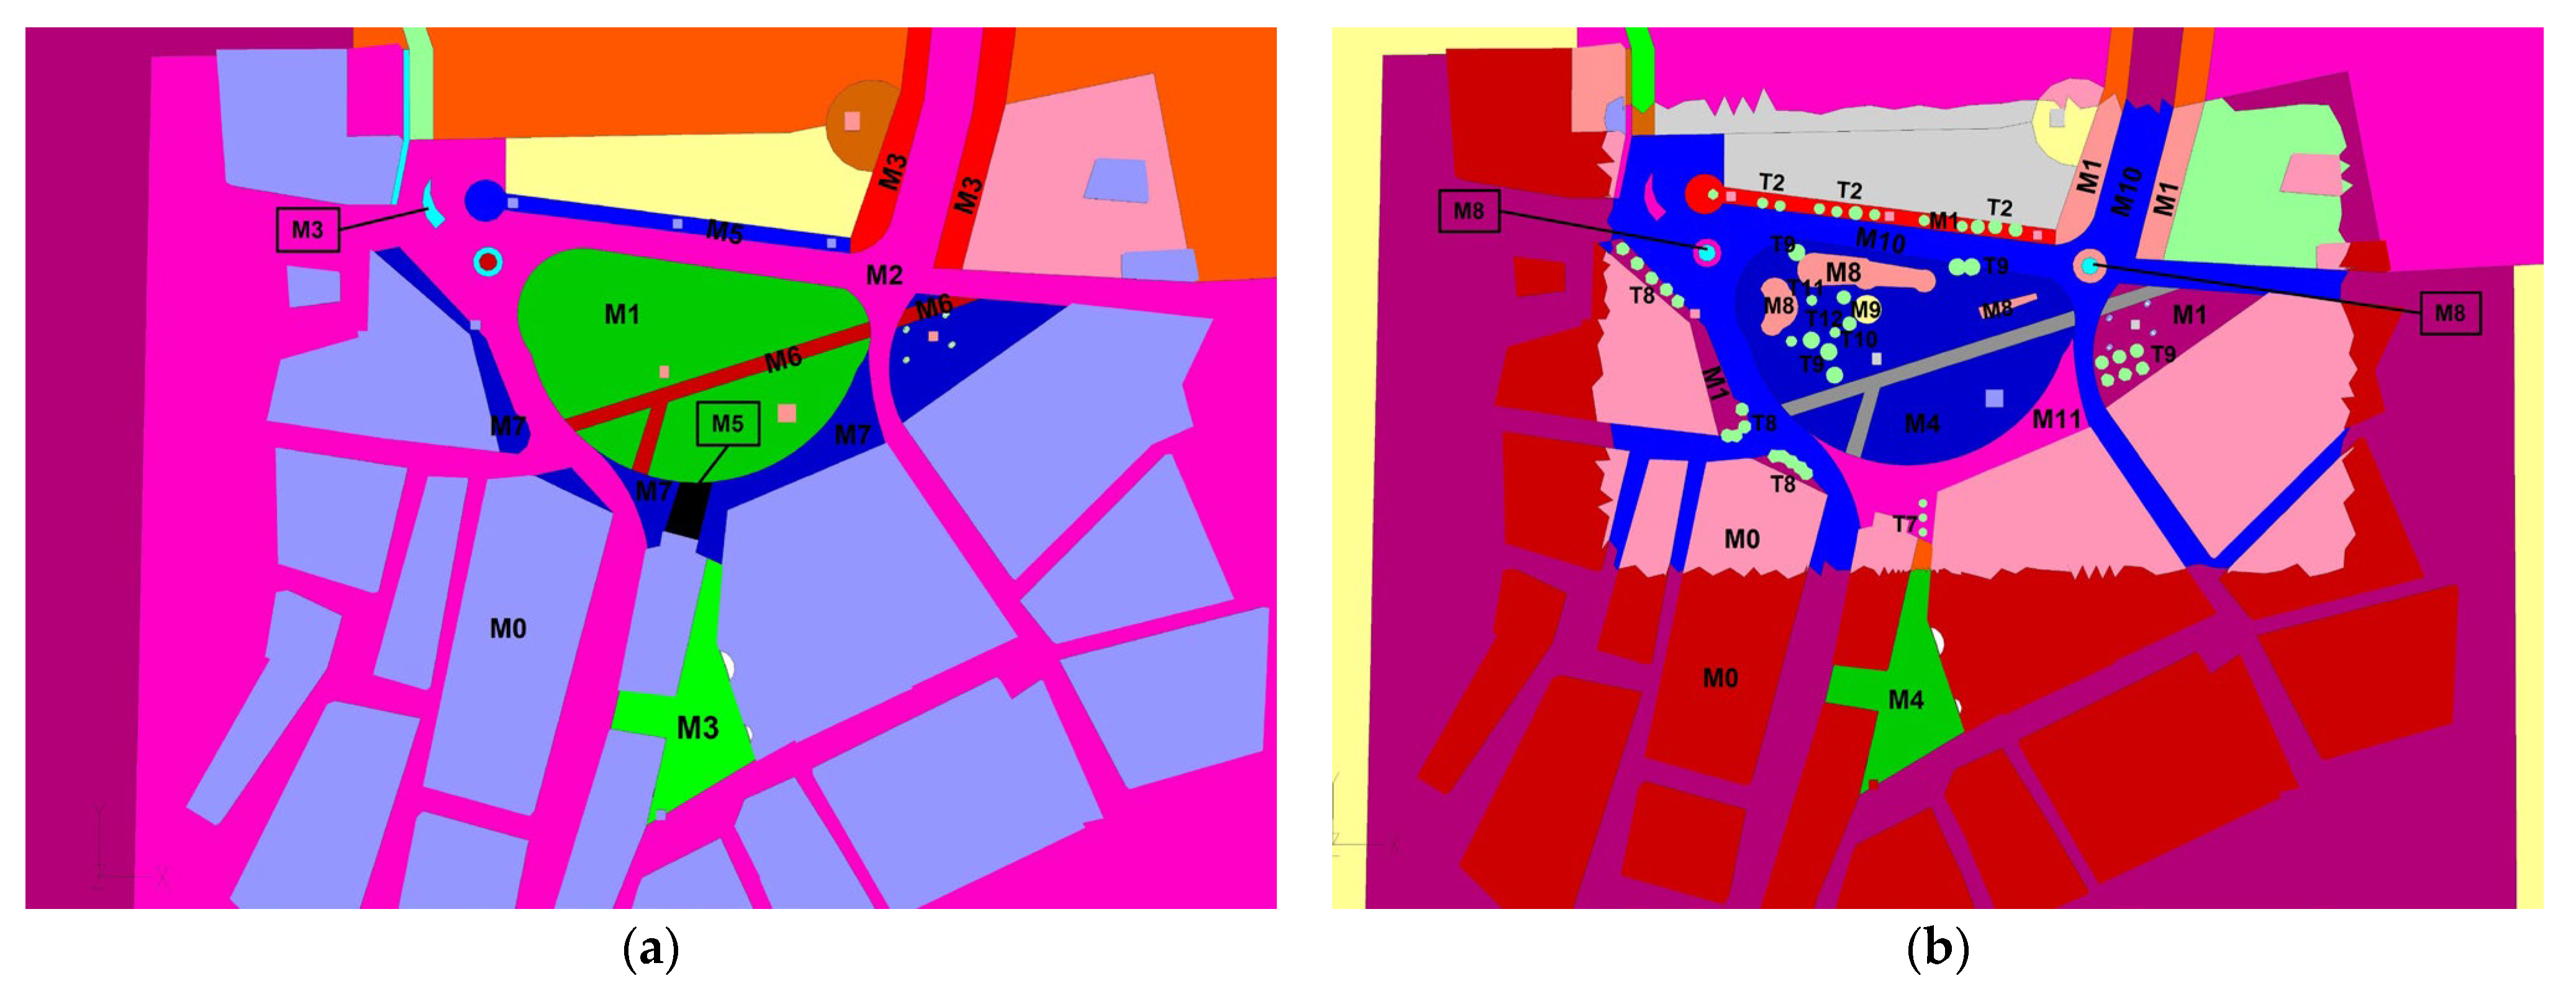
The design characteristics of the existing situation and the renovation scenario are presented in Figure 2 (concerning plantation, only new trees are presented as the existing ones are being presented in Figure 1). The nomenclature of the figure regarding trees and materials accompanied with their properties is presented in Table 1 and in Table 2, respectively (tabulated materials’ optical properties are found in Ref. [4]).

2.3. Climatic Conditions

Heraklion belongs to the CSa climatic zone as per the Köppen climate classification. Summers are warm to hot and dry with clear skies. Due to the almost dominantly blowing north–northwest winds, summer temperatures rarely exceed 32 °C while relative humidity remains below 75%. On the other hand, winters are mild, presenting moderate precipitation with temperatures rarely being lower than 5 °C and often higher than 15 °C. Τhe incident solar radiation on the horizontal plane often exceeds 1000 W/m2 during summer [40].
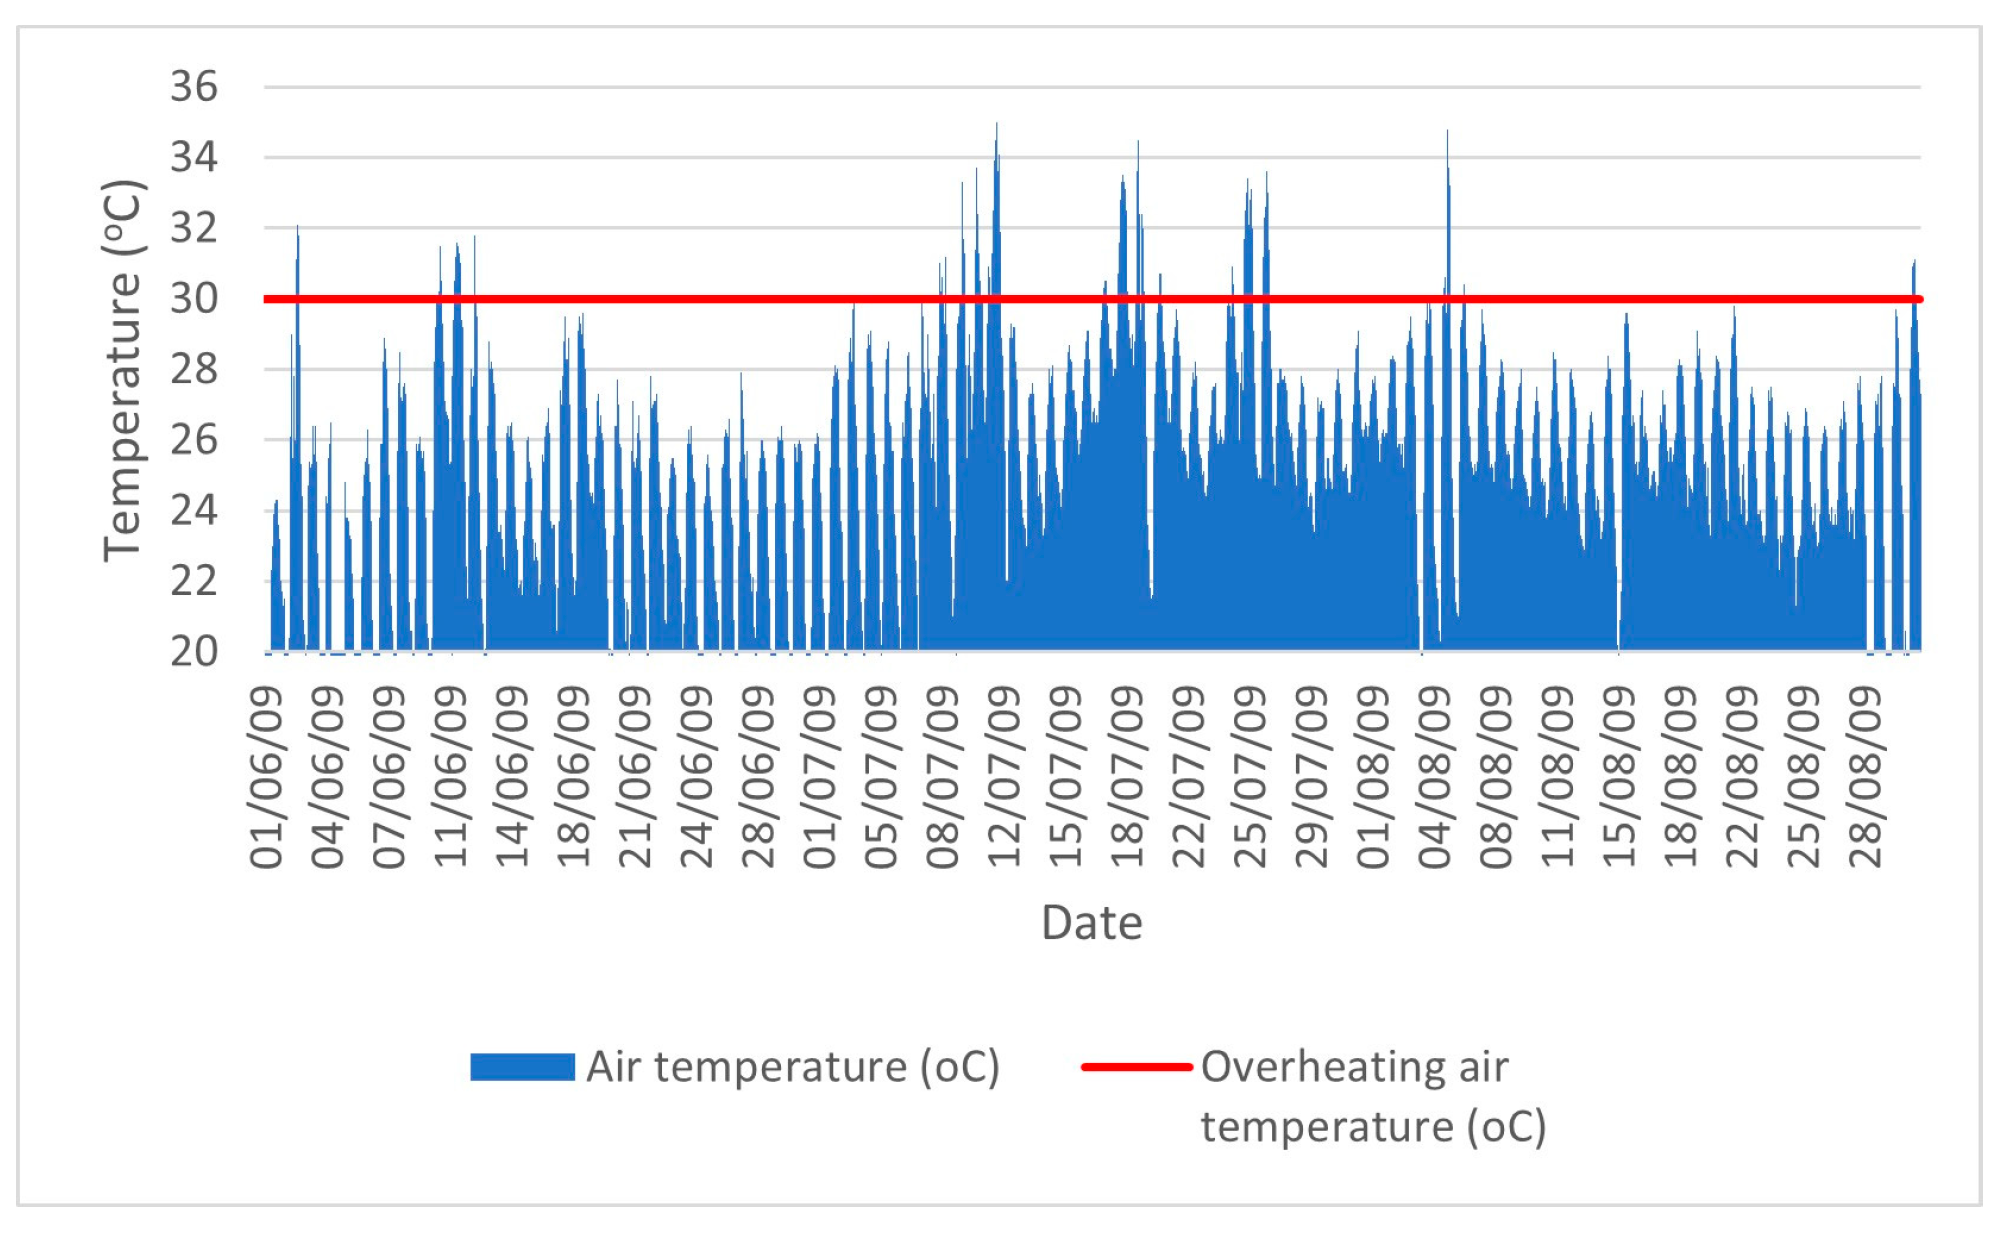
For the purposes of the current study, climatic data are extracted from the weather station located on the rooftop of the city hall building of the municipality of Malevizi (as in a previous study [4]), which is adjacent to the municipality of Heraklion on the west side. The location of the selected weather station in relation to the studied urban area is presented in Figure 1. Despite its relatively far distance from the urban area of interest (around 6.5 km), it is installed at a similar altitude as the studied area (30 m) and is 1.5 km far from the sea front, while the ground morphology is smooth with a low slope (below 4% in average in the north direction, according to the Google Earth slope-profile function) and coarse built environment. Therefore, it is fairly assumed that for the incident wind properties, at least with respect to the north winds (which are dominant in Crete), the recorded climatic data are representative of the study area. Considering the fact that the results obtained herein are validated in comparison with available recordings of physical and thermal-comfort parameters conducted in another research study that took place in 2009 [39], the available climatic data for that year are further elaborated towards the extraction of the typical hot summer day. First of all, the available hourly time series of the air temperature during summer months are processed in terms of calculating the occurrence frequency of recordings that exceed an overheating threshold of 30 °C. The hourly recordings against the overheating threshold are presented in Figure 3. It becomes obvious that July represents the hottest month since it shows more hours of overheating; notably, the obtained overheating hours’ frequency equals 1.6%, 23% and 6% in June, July and August, respectively. The uttermost and mean values of the climate parameters in the time period from 10:00 to 18:00 (wherein the highest temperatures are observed) for July are provided in Figure 4.
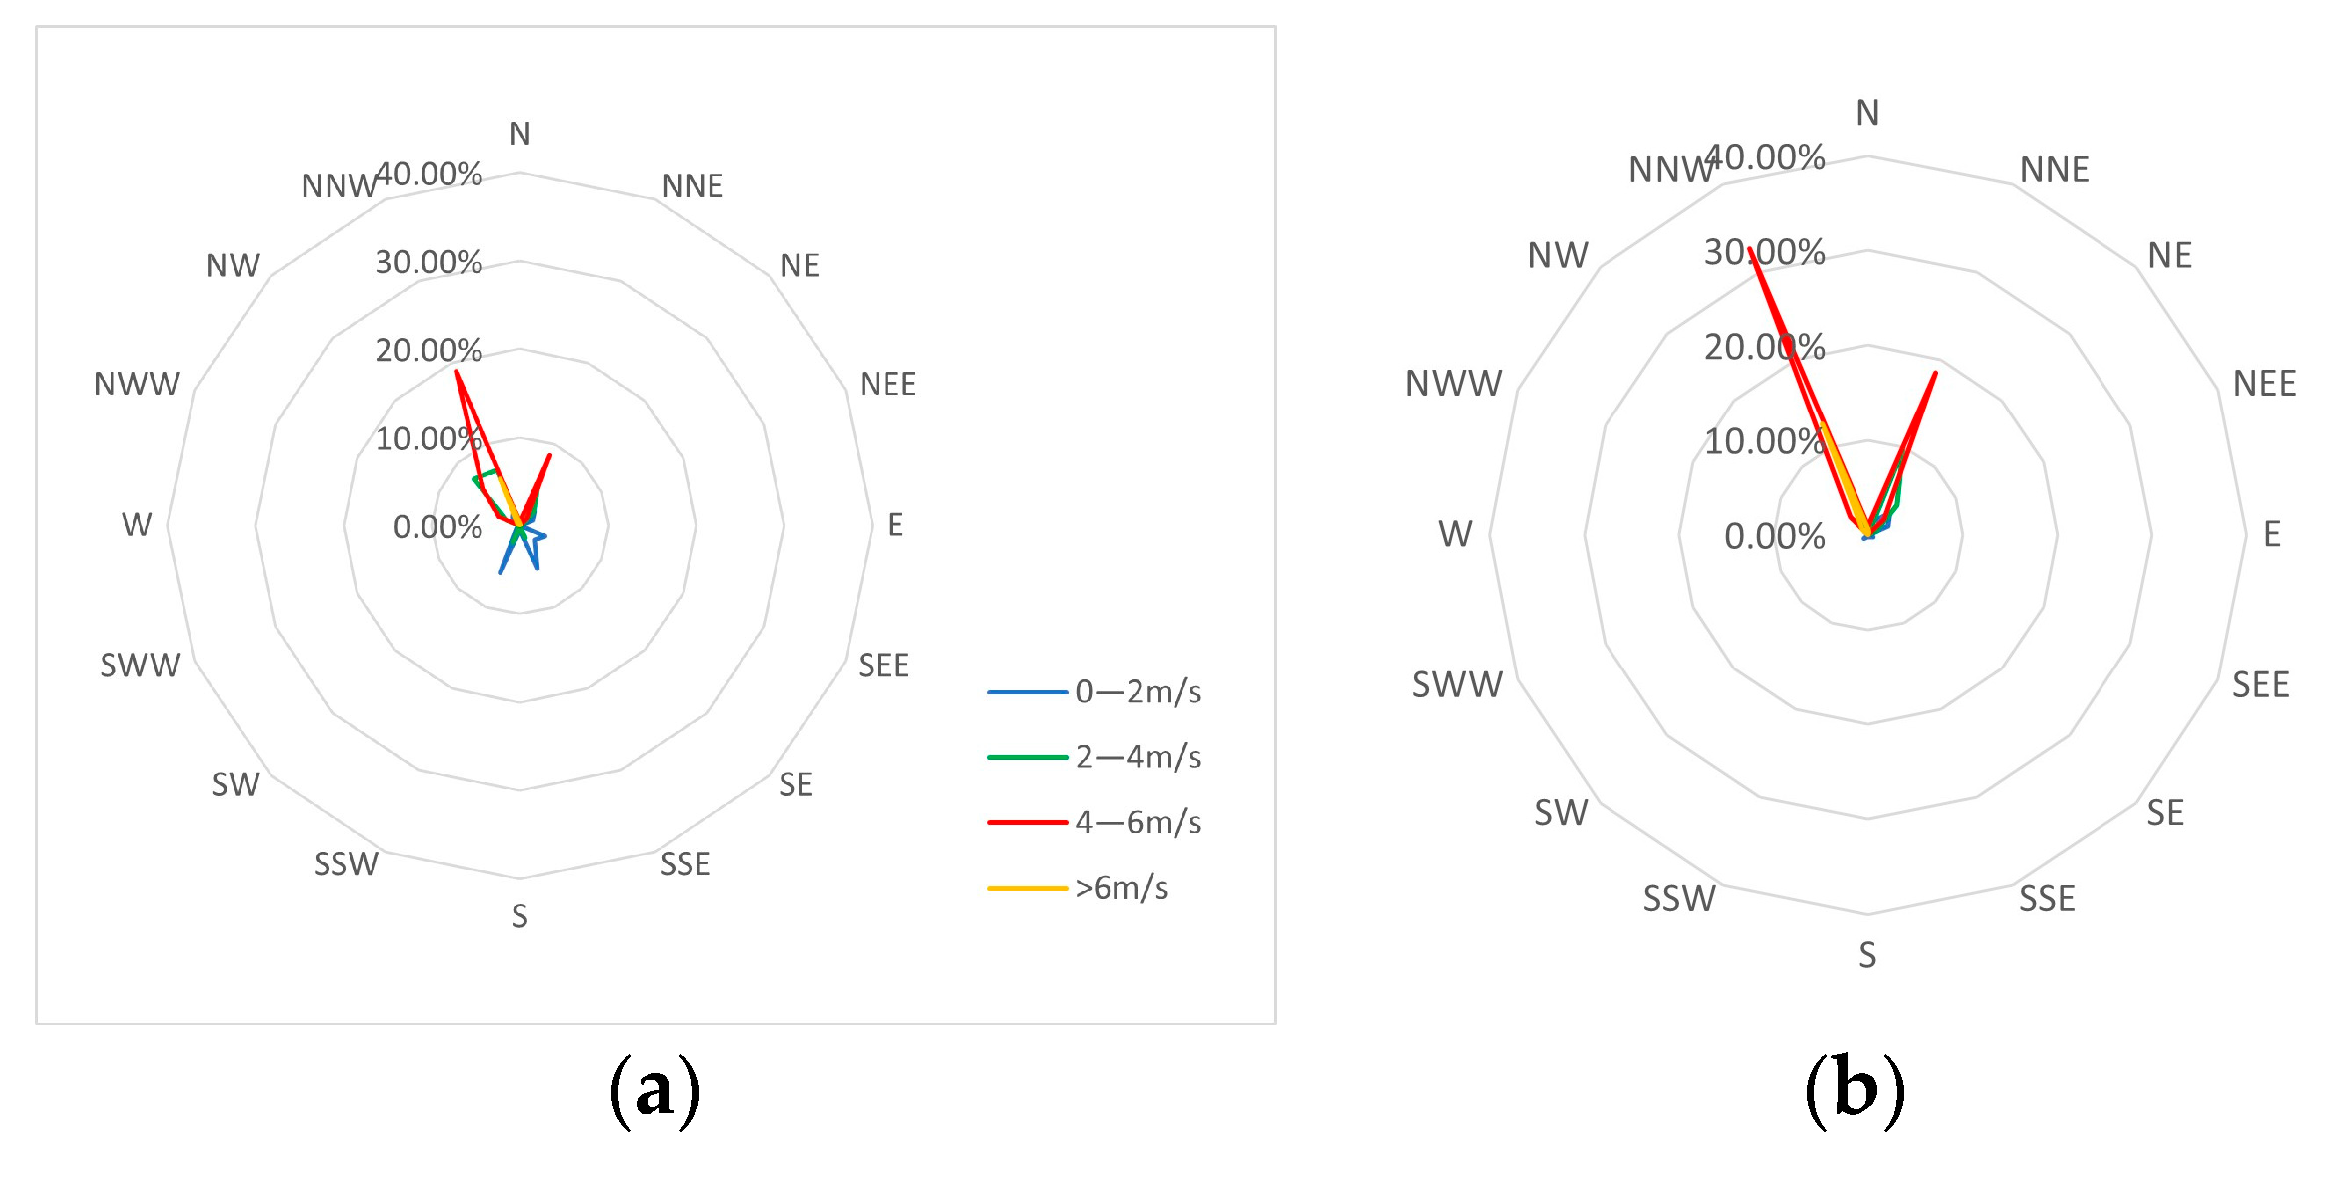
It is seen that during the noon summer hours, an exposure to mild overheating (around 30 °C) is observed based on the average temperature values. However, the maximum temperature recordings advocate that extreme heat may occur of up to 35 °C. Relative humidity ranges to acceptable levels (just above 55%), although values more than 75% may occur in extreme situations, which, of course, in combination with high temperatures, contributes to high levels of thermal dissatisfaction. On the other hand, regarding the incident wind speeds, the averaged values suggest that they remain below the maximum acceptable threshold of 6 m/s for urban spaces [4]. Assuming an NNE (0°–30° from the north direction) and NNW (330°–360° from the north direction) direction as the north direction, its dominance is verified in terms of the highest occurrence frequency of recordings within the adopted thresholds. The occurrence frequencies of the various wind speeds and direction intervals are presented in Figure 5 for July 2009 in a wind-rose fashion. It is clearly observed that the north wind directions stand for 50% and 79% of the recordings during all hours and within the time period from 10:00 to 20:00, respectively.

2.4. The Numerical Model Applied and KPIs Solved

Numerical modelling refers to the employment of a previously developed CFD model for urban microclimate assessment purposes. The model employs the standard finite-volume method for the discretization of the conservation equations for the three-dimensional airflow provided by the general-purpose CFD package Ansys FLUENT v.17.1. The model is described in detail in Ref. [4], and it has been validated against real-scale experimental measurements in Ref. [41]. The assumptions made for the physical problem are:
  • Incompressible flow of a Newtonian fluid;
  • Neutral atmospheric conditions;
  • Richards–Hoxey assumptions for the Atmospheric Boundary Layer (ABL) (incident wind) [42];
  • The fluid is treated as a mixture of dry air and water vapor, and the diffusion coefficients and the physical properties are taken from previous investigations [17,32,41];
  • Traffic and other anthropogenic heat sources are neglected, and only the effects of construction materials and physical elements are considered.
Concerning the turbulence effects, the modified Standard k-ε model is used as developed and validated by Stavrakakis et al. [43], which, at least regarding the wind-driven ABL airflow, provides better accuracy compared to the Standard k-ε. The model is also properly modified to account for buoyancy effects based on the valid Boussinesq assumption for relatively low temperature differences [17].

2.4.1. Computational Spatial Discretization and Method of Solution

The domain is discretized using a non-uniform unstructured grid, which is denser near solid surfaces to capture near-wall turbulence effects as well as the valid application of wall functions [17]. The mesh developed contains 262,978 and 349,324 control volumes (tetrahedral cells) for the existing and the suggested situation of the focused on urban area, respectively. The corresponding grids obtained are presented in Figure 6. The first-order upwind discretization scheme and the SIMPLE solution algorithm are used, while the following residual thresholds are set for full convergence: 10−4, for pressure, velocity and turbulence components; and 10−7 for enthalpy and chemical species. Simulations are performed on a Windows i7 PC with 1.8 GHz CPU and 4 GB RAM. The solution time is approximately 2.5 h and 3 h for the existing and the suggested case, respectively, for each hour of the typical hot summer day presented in Figure 4.

2.4.2. Incident Solar Irradiance

The incident solar irradiance on solid surfaces is computed using the so-called solar ray tracing model provided by the CFD software Ansys FLUENT v.17.1. The amount of solar load is calculated based on the imposed optical and thermo-physical properties for materials, i.e., the albedo and thermal transmissivity for semi-transparent surfaces. The sub-model employs the Solar Position and Intensity Code (Solpos) developed in the American National Renewable Energy Laboratory (NREL) (http://rredc.nrel.gov/solar/codesandalgorithms/solpos/ (accessed on 20 June 2023)). The numerical outcome refers to the distribution of the solar load on solid surfaces for each hour from sunrise to sunset, as based on the solar-beam direction with respect to the date and the geographical coordinates imposed. The model allows for setting a cloudiness factor as well, which is set to 1, implying a prevailing clear sky in the summer period.

2.4.3. Boundary Conditions and Special Sources

Far-Field Boundaries

The far-field boundaries (considering the dominant north wind directions) refer to the north inlet, south outflow, and the lateral and top far-field frontiers of the computational domain. They are treated as follows:
  • Inlet: The exponential law for velocity and turbulence components (kinetic energy of turbulence and its dissipation rate) is applied [4]. The ABL height is assumed to be a height of 300 m, while as a reference height, the 10 m from the ground is used where the available mean velocity for each hour of the typical summer day (refer to Figure 4) is imposed. A north wind orientation is imposed following the findings in Section 2.2. The terrain roughness is set to the typical value of 0.2 [44]. According to the assumption of neutral atmospheric conditions, a constant inlet temperature is imposed (for each hour of the day), while for the water mass fraction in the air mixture, it is again treated as constant, being derived from a well-known equation reported in Ref. [4] as a function of the given Relative Humidity (RH) from climatic data.
  • Lateral and top far-field boundaries: They are handled as free-slip boundaries, i.e., zero normal velocity component and zero normal spatial gradient of all other variables are imposed.
  • Outflow: Horizontal homogeneity is retained for all the variables and forcing no reverse flow, i.e., a Neumann condition is imposed for the transferred quantity φ , φ χ j j = 0 ( j j / / n , where j j is the velocity direction vector and n is the boundary surface definition normal vector).

Wall Boundaries and Special Sources

The airflow near walls is simulated using the well-known equilibrium wall functions for bridging the viscous and the inertial sublayer, thus ensuring the interconnection of all the variables stored in wall-neighbouring grid nodes with their corresponding ones imposed on wall surfaces. In addition, walls are treated as heat and water-vapor sources (or as sinks), accounting for special physical effects such as evaporation and evapotranspiration. The convective and radiative heat fluxes are obtained based on the thermal and optical properties of ground and building materials. Water surfaces stand for heat sinks and water-vapor sources through evaporation. Similarly, vegetation and plant surfaces represent water-vapor sources due to evapotranspiration, while they absorb solar radiation and convective heat in their shaded parts. For the manipulation of special sources to account for the aforementioned phenomena, the sub-models used are presented in detail in a previous publication [4]; therefore, only a brief description is provided below:
  • Water surfaces: The evaporation rate is calculated according to Penman’s method [45], involving the computation of the water evaporation rate. The evaporation boundary condition is applied on water surfaces in the CFD model towards the computation of the different evaporation fluxes for the different climate parameter combinations (velocity, temperature and relative humidity) with respect to the hours of the day. The radiative heat flux is calculated as the algebraic sum of the entering shortwave radiation, the reflective shortwave radiation and the longwave radiation. The special mathematical expressions are provided in ref. [4].
  • Plantation surfaces: The evaporation rate is calculated using Penman’s model with modified expressions for the psychrometric coefficient and the velocity function appropriate for plantation surfaces according to ref. [46].
  • Tree surfaces: The evapotranspiration effects are captured by means of solving the net heat balance within the leaf-ambient interface based on the Jones model [47], assuming a solar absorption coefficient of 0.6, leaf orientation fixed at 30°, and a leaf emissivity of 0.96. The evaporation rate involved in the aforementioned heat balance is calculated as a function of the water-vapor density in both the ambient rate and on leaf surface, as computed by means of simple polynomial equations with respect to the inlet air temperature [47], as well as of the leaf-resistance components, i.e., the leaf intercellular air space resistance fixed at the typical value of 25 s/m, the stomatal resistance and the cuticular resistance (being 2.500 s/m). The boundary layer thickness on the leaf surface is calculated in correlation with the leaf shape parameter taken as equal to 4.0, and finally, the leaf-surface convective heat-transfer coefficient is derived via the simple ratio of air’s thermal conductivity (fixed at 0.0259 W/(mK)) and the boundary layer thickness.

Key Performance Indicators

As mentioned earlier, the present model serves for urban microclimate assessments, especially regarding the expected heat stresses and thermal comfort conditions. Apart from solving and providing distributions for the traditional physical parameters, such as the air temperature, wind speed, relative humidity, etc., a special user-defined sub-model is interpreted in the CFD model to directly provide patterns of appropriate thermal comfort indicators (TCI). The sub-model and TCIs are described in detail in a previous publication [32]. The following TCIs are calculated (in each control volume of the CFD model):
  • The standard Predicted Mean Vote (PMV).
  • The Standard Effective Temperature (SET) [48], taking into account humidity effects in warm environments. The SET is defined as the operative temperature of an imaginary isothermal environment of 50% RH and almost stagnant air (<0.12 m/s) in which a relaxed subject would experience the same net heat balance, skin wittedness and mean skin temperature as in the actual environment.
  • The Predicted Percentage Dissatisfied (PPD).
Regarding personal parameters, a typical metabolic rate of 100 W/m2 is adopted for the walking around activity, while for clothing insulation, 0.5 clo and 1.3 clo are adopted for summer and winter conditions, respectively [49].

2.5. Empirical Validation Approach

In the present work, the integrated CFD model is empirically validated using the findings of another study focusing on both the monitoring of local climatic parameters as well as actual thermal sensation votes (ASV) [39]. In the latter study, Tsitoura et al. studied the microclimate and thermal-comfort conditions in the Liberty Square on a typical hot summer day in July 2009. In brief, they performed the following activities:
  • Implementation of a survey for climate parameter monitoring and a questionnaire for recording the thermal sensations of visitors from 10:00 to 16:00.
  • Physical parameter monitoring: A portable weather station and additional equipment were used at various locations in the square, and at approximately 2 m from the ground, for the recording of climatic parameters such as the air temperature, air velocity, relative humidity and incident solar irradiance. Recordings were obtained in a five-minute time step, and the data used for the assessments were those collected every 15 min (approximate duration of the interview). The recorded climatic data in the square are presented in their averaged fashions both spatially (square area) and temporally (within the survey time period from 10:00 to 16:00).
  • Thermal sensation recording: This was implemented mainly through the extensive interviews with pedestrians at various points throughout the square, including their general preferences, instant tolerance of the climatic conditions, i.e., temperature, sun and humidity at the time of the interview, as well as voting on thermal comfort sensation. The answers are then translated into the thermal comfort percentage and the general evaluation of the thermal conditions in the square.
In the present work, the empirical validation is performed through comparisons between the CFD model results and the monitored data found in the above-mentioned previous study. Considering the fact that the latter presents spatially and temporally averaged indicators, the respective simulated indicators are extracted as area-weighted average values throughout the square from the CFD model. The average values are computed at the pedestrian level height of 2 m from the ground.

3. Results

This section presents the results obtained by applying the simulation model. Initially, the outcomes of the empirical validation approach are presented, followed by the evaluation of the microclimate conditions of the wider urban area, including both the Liberty Square and the Daskalogianni Square. Finally, the given urban renovation plan provided by the municipality of Heraklion is evaluated in terms of thermal condition impacts in relation to the existing situation obtained using the CFD model.

3.1. Microclimate Assessment of the Study Area

3.1.1. Empirical Validation Results

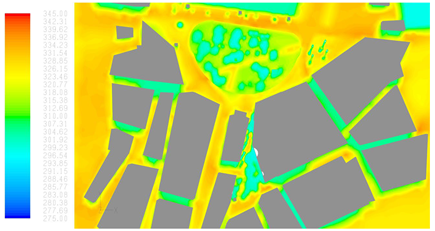
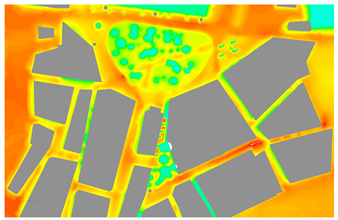
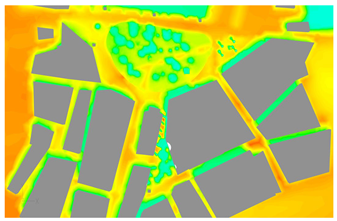
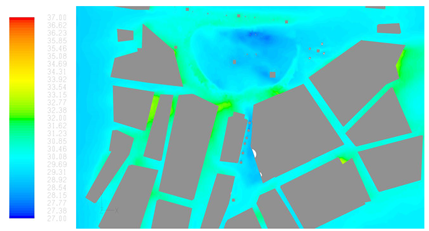
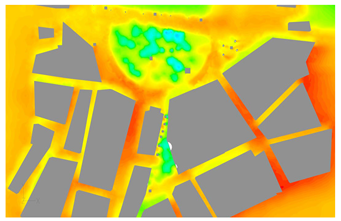
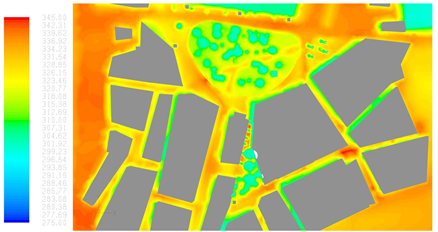
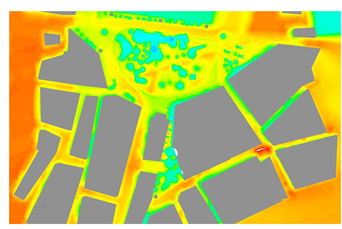
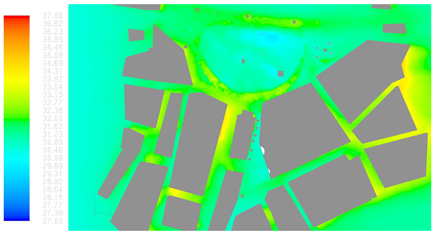
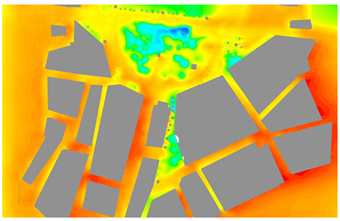
The integrated CFD model is initially executed for the typical hot day in July on an hourly basis within the time period from 10:00 to 16:00, wherein the highest heat stresses are expected [4]. The produced patterns of climatic parameters and TCIs are presented in Table 3 indicatively for the hot summer hours of 11:00, 13:00 and 15:00. Focusing on the Liberty Square, it is observed that the exposure to the highest heat stress takes place in the period around 13.00 (highest local air and surface temperature). The benefits of shading provided by plantation becomes very obvious through the inspection of the surface temperatures as well as the thermal comfort indices (TCIs). In the shaded areas, the PMV, PPD and SET always receive their lowest values, which means better thermal comfort compared to the rest areas with no or limited plantation. Following the time propagation of the temperature, thermal discomfort receives its peak in the period around 13.00.
The results for the existing situation are validated empirically through comparisons with subjective (thermal comfort) and climatic parameters monitored in the Liberty Square in the period from 10:00 to 16:00 in a previous study [39]. To meet the distributed recording of the TCI and climatic parameters to a broad extent in the square as performed in the reference research study, the CFD-obtained KPIs are manipulated towards the extraction of their area-weighted average fashions at 2 m from the ground, taking into account all the involved surfaces of the square. More specifically, the areas adopted to obtain the spatial mean values include the internal area of the square as well as the peripheral segments, i.e., the surfaces M1, M2, M5, M6 and M7 depicted in Figure 2 and determined in Table 2. The hourly values of the area-weighted averages of the KPIs, their hourly based averages and the corresponding values from the reference study are tabulated in Table 4. As indicated in the table, two indices are extracted after own processing of the available data from the reference study, particularly:
  • PPD: It is an own interpretation of the available data from the reference study [39] as follows: Since the PPD stands for the percentage of subjects feeling discomfort, it is fair to assume that its actual value is that provided by answers from subjects to the explicit question regarding their thermal sensation. Indeed, in the reference study, an explicit question to the interviewees was imposed, i.e., to grade their heat perception by selecting from among the options “too little”, “not enough”, “OK”, “enough”, “too much”. Then, the study presented the percentages of the corresponding responses during the measurement period. Hence, herein the sum of the responses other than “OK” from the reference study is taken as the reference value for the PPD to compare the CFD-computed one.
  • PMV: The reference study reports 4.78 to be derived from the processing of the subjects’ answers as regards thermal comfort on a scale from 1 (cold sensation) to 5 (warm sensation). To ensure the correspondence of the current computations with the recordings from the reference study, the latter’s data are adjusted on a scale from −2 (cold sensation) to +2 (warm sensation), which is adopted in the CFD code herein (in accordance to the theoretical PMV scale). Considering the linear correlation between the two scales, it can be easily concluded that the given PMV value corresponds to 1.78, with reference to the theoretical scale of −2 to +2.
In general, it may be concluded that the model presents an acceptable agreement with the monitored field data, at least for practical engineering purposes. A remarkable agreement is achieved concerning the mean air temperature, solar flux density and relative humidity, i.e., the respective divergence between the model and the reference data is 2%, 3.3% and 12.9%. The same is not true for the wind speed, for which the model diverges by 70%, although at least within the same magnitude order as the recorded data. It should be mentioned that velocity measurements in real-scale cases possess a high degree of uncertainty, considering the possibility of sudden peak wind speeds that may be stored at the instant of recording and, in general, the turbulent nature of the flow. As reported in the reference study [39], a storage time step of 5 min is set at the sensors, which is quite high in capturing the transient nature of airflow, thus obtaining a mean value that might differ from the actual one that would have been obtained in a lower and, in fact, more reliable time step. As far as the TCIs are concerned, the modelled PMV and PPD indices present a divergence of 35.4% and only 7.1%, respectively, compared to the reference data. Despite the relatively high difference in the PMV, both the one obtained by the model and the one provided by available data are around 2, which means that the model captures well the expected sensation of most subjects in the square being at least “warm”, as admitted by the actual sensation votes from the reference study. Finally, the difference between the currently simulated and reference SET is around 23%. Similarly to the PMV, despite the relatively high difference between the model and the available data, they both suggest at least a warm sensation in the square.

3.1.2. Microclimate Assessment of the Urban Area in Focus

In a next step, and considering the acceptable accuracy of the microclimate simulations conducted herein, the local microclimate is evaluated throughout the urban area in focus, i.e., Liberty Square and the perimetric roads and the Daskalogianni Square, from a closer inspection of the results presented in Table 3. The following observations emerged:
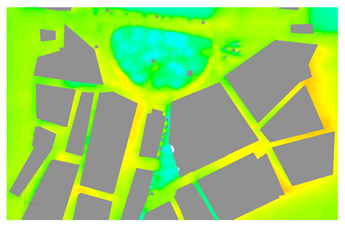
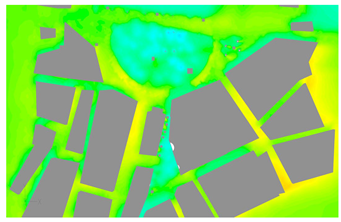
  • Due to the high level of shading achieved in both the Liberty Square and the Daskalogianni Square, mainly as a result of the existing plantation with dense-foliage trees as well as due to the extensive use of white marble, which is a naturally reflective material, both squares present high resistance to heat stresses. Particularly, in the internal area of the Liberty Square, the mean air temperature ranges from 27 °C to 29 °C within the period from 11:00 to 13:00, which is practically the same as the temperature of the incoming wind. Due to the higher extent of plantation in Daskalogianni Square, the mean air temperature is even lower, ranging from 26 °C to 28 °C within the same period.
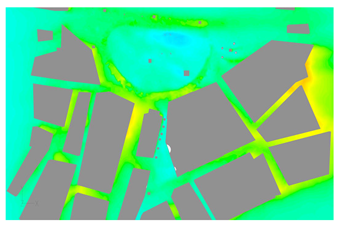
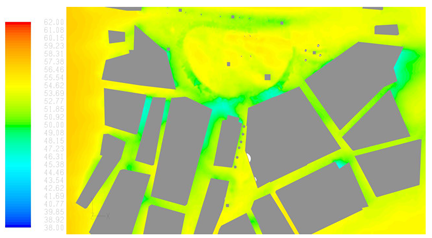
  • The highest heat stresses occur mainly in the traffic and the pedestrian roads surrounding the Liberty Square, which was expected due to the lack of shading and the use of more solar-absorptive and emitting materials. The CFD results indicate that, locally at those segments, the air temperature may increase to up to 33.5 °C, i.e., 3–4 °C more than the air temperature in the internal area of the square at 13:00. The observation is also verified by the surface temperature distribution, i.e., in the perimetric segments its mean value is approximately 10 degrees higher than that in the internal area of the square.
  • The modelled TCIs clearly show that extreme discomfort occurs in the perimetric roads of the Liberty Square; notably, at 13:00, the PMV, PPD and SET area-weighted averages are 3, 90% and 32 °C, respectively. At the same time, the respective indices in both the internal area of the Liberty Square and the Daskalogianni Square are approx. 2.4, 68% and 28 °C.
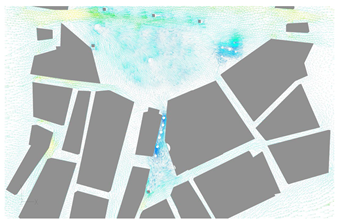
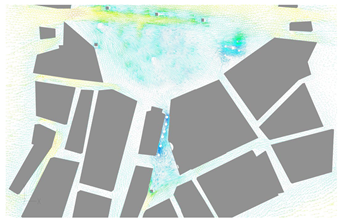
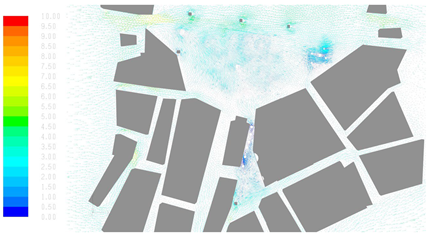
  • As far as the wind speed is concerned, the results show that, in most segments in both squares, the velocity is retained to relatively low levels, ranging, for example, at 15:00, when the highest incoming wind speed occurs, from 1 m/s to 4 m/s. Only in small areas where wind accelerations occur as a result of the Venturi effect [32] in narrow street canyons, i.e., at the north-east side of the Liberty Square and at some level in the west of Daskalogianni Square, the air velocity may reach locally 6 m/s, which implies possible hazardous incidents or drought discomfort; however, only for a very low portion of the urban area studied.
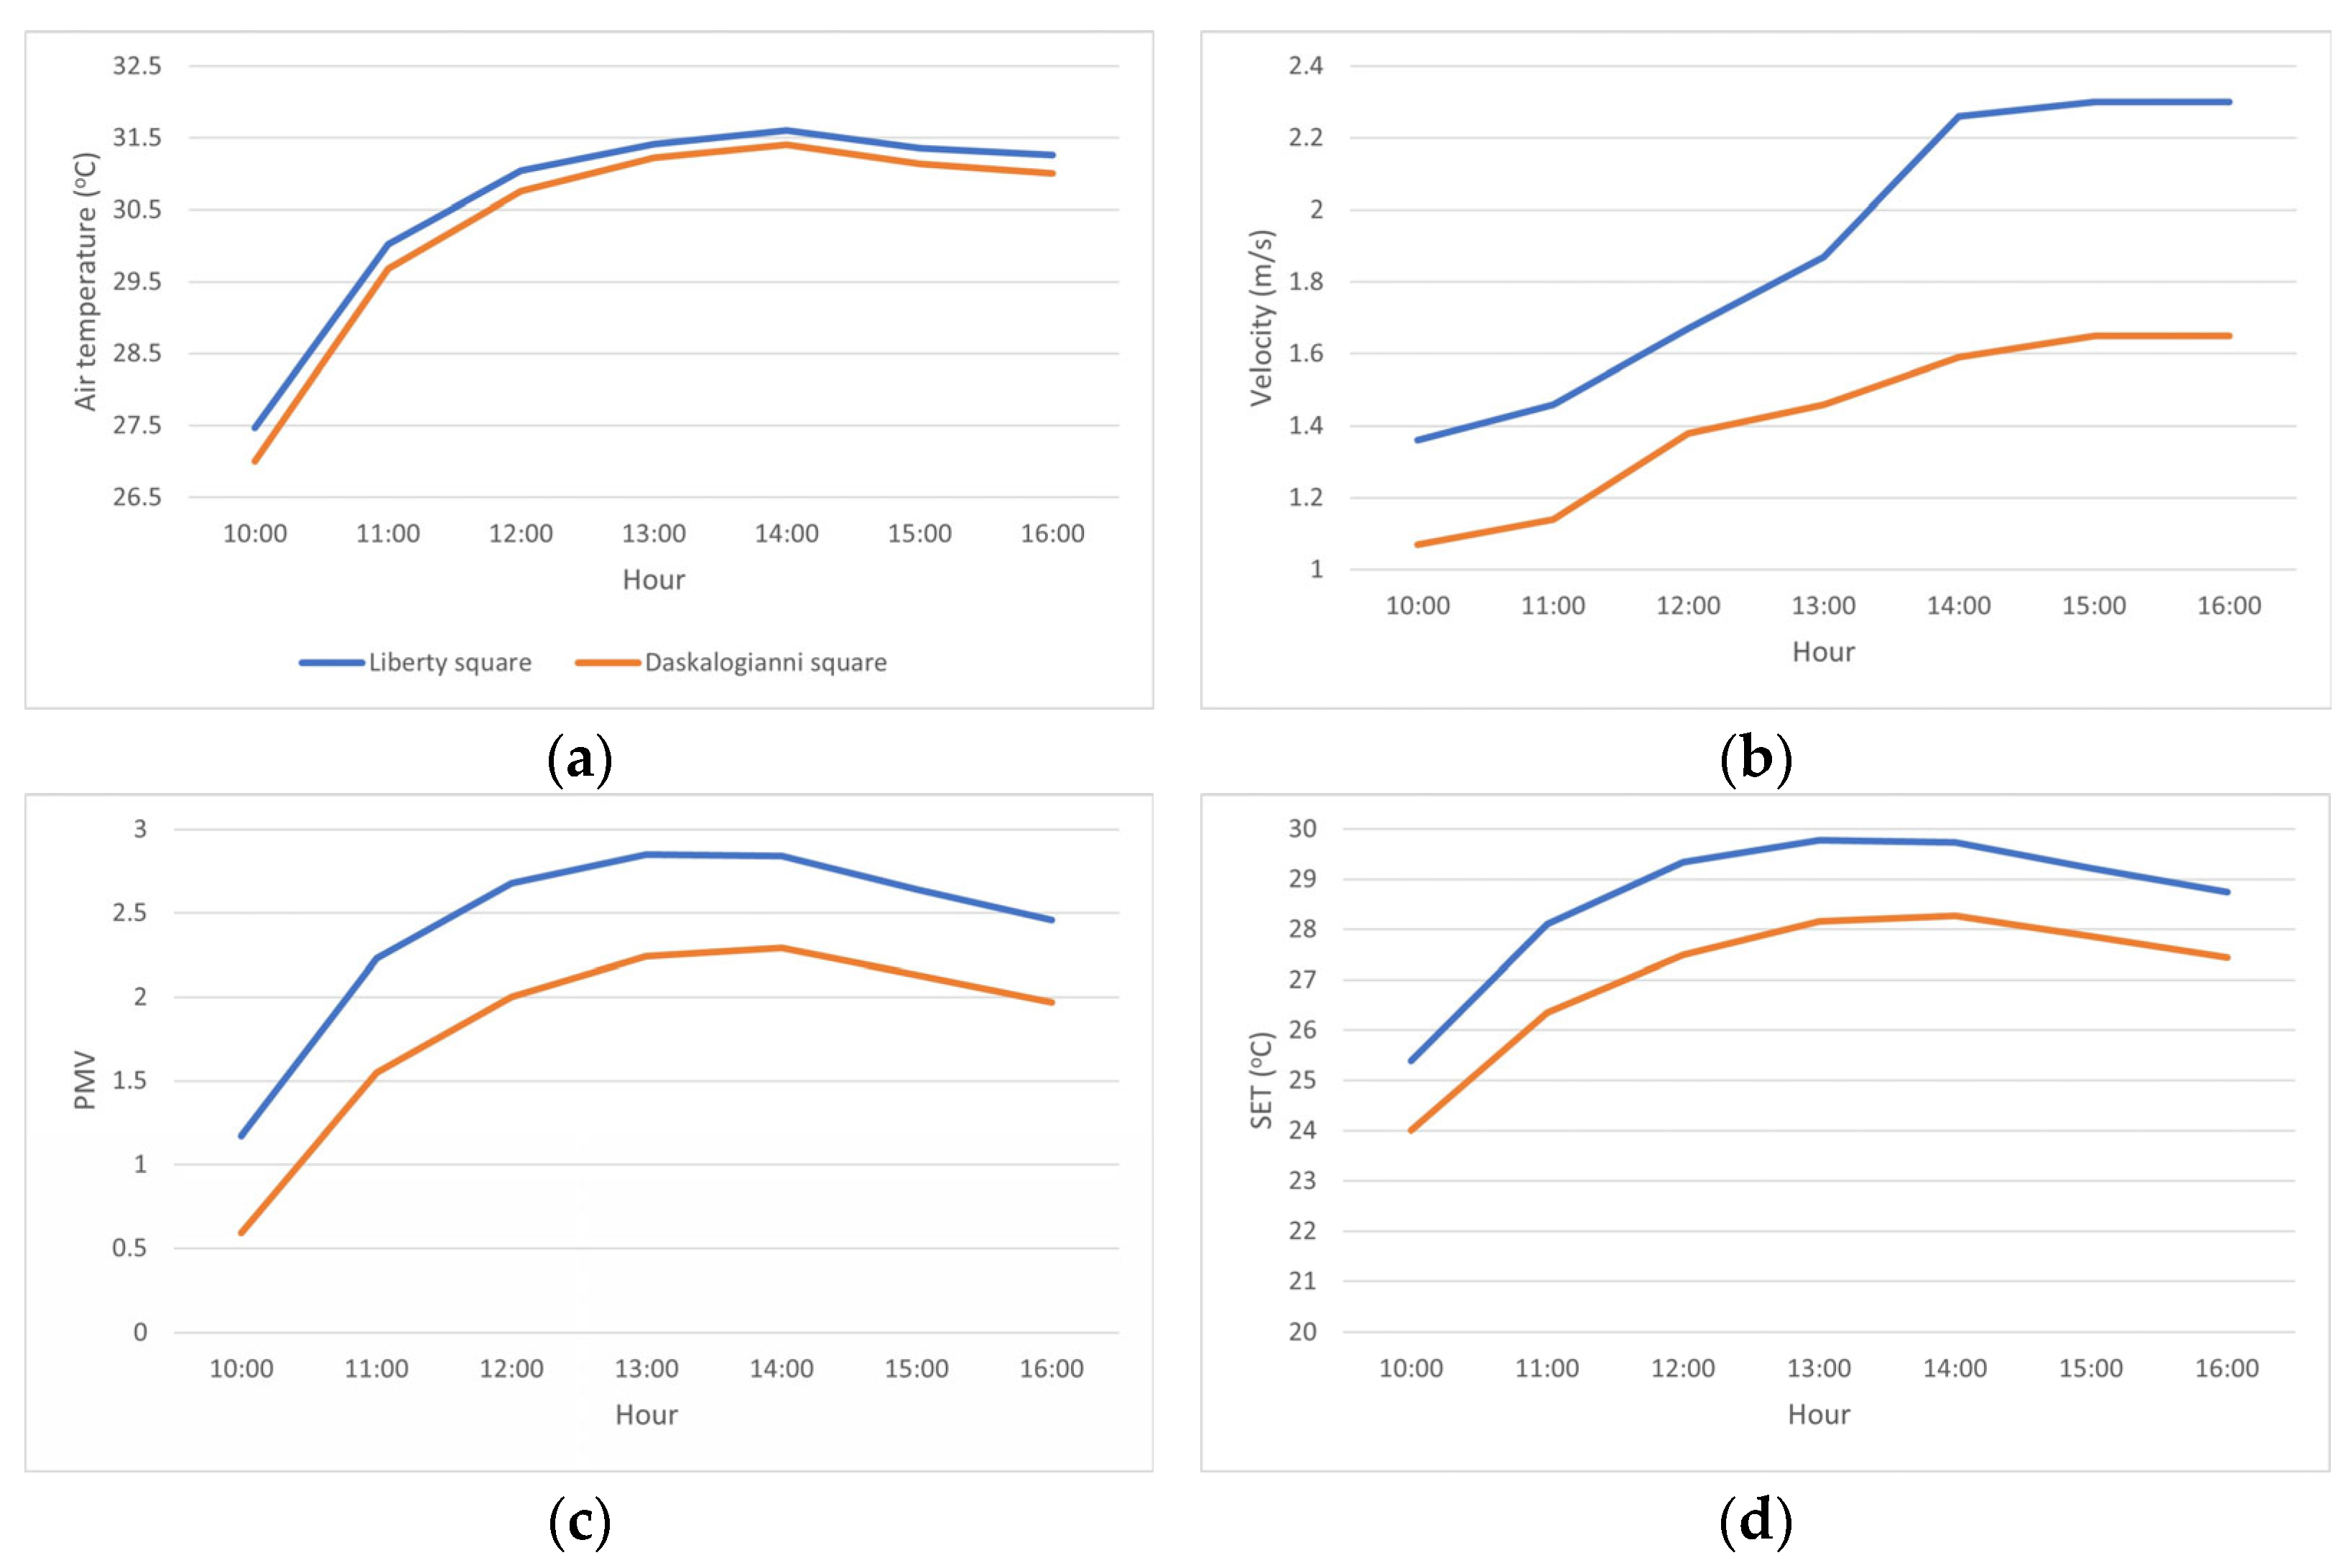
Focusing on the relative thermal performance between the two squares, the area-weighted averages of the representative KPIs at 1.8 m from the ground are illustrated in Figure 7. Contrary to the above bulleted points, this time the perimetric roads of the Liberty Square are included in the calculation of the KPIs’ weighted average in order to take into account the effects of the parcels exposed to high heat stresses. It is seen that the mean air temperature is practically the same between the two squares, with the maximum convergence appearing in the noon hours. Despite the very similar air temperature, the two squares present more significant differences in thermal comfort sensations. While for most of the examined period the PMV in both squares exceeds the thermal comfort limit, i.e., PMV = 1, in Daskalogianni Square the PMV is lower than the Liberty Square at all times, which means that better thermal conditions take place in the former. A similar observation is obtained via the SET index, which again suggests more tolerable thermal conditions in relation to the Liberty Square and its perimetric roads.
The following conclusions are drawn: (a) Both squares exhibit relatively low heat stress in relation to the rest of the urban area; (b) the most heat-vulnerable areas, i.e., the ones with the highest heat stress, are the perimetric roads of the Liberty Square; (c) the extensive land cover with white marble, due to its relatively high reflectivity, compensates for the high radiation fluxes occurring in non-shaded segments in the internal area of the Liberty Square; (d) in the internal area of both squares, the calculated TCIs indicate a slightly warm to warm sensation prevailing; (e) air droughts are limited only to the east and west part of the Liberty Square and Daskalogianni Square, respectively; and (f) local UHI intensity is considered low since, as demonstrated by the simulations, both squares contribute to the reversal of high temperatures developed in the surrounding urban fabric.

3.2. Evaluation of the Given Renovation Plan

Based on the findings of the previous assessment of the existing situation, the evaluation of the given renovation plan is focused on checking first of all that at least the urban squares retain resistance to potential increased UHI intensity, especially at incidences of urban overheating. The following evaluation criteria are adopted:
  • At least no increase in heat stress in terms of the surface and air temperature;
  • Improve thermal comfort conditions;
  • Retain wind speeds below 6 m/s;
  • Ensure limited penalties in winter.
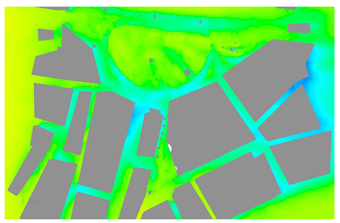
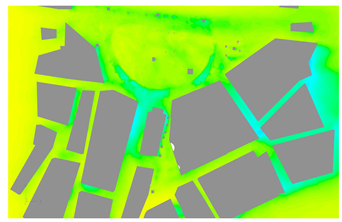
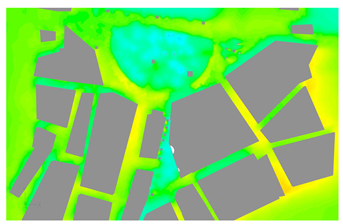
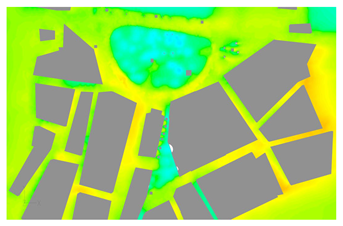
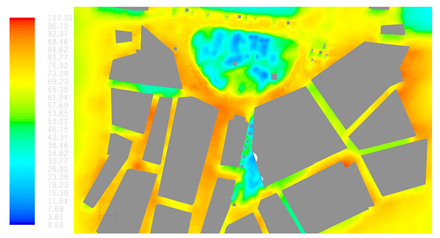
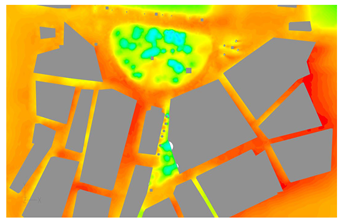
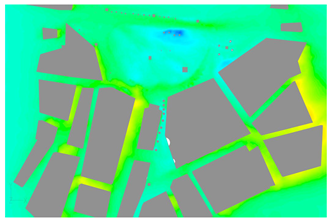
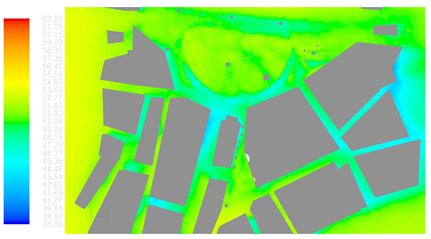
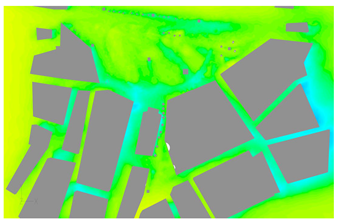
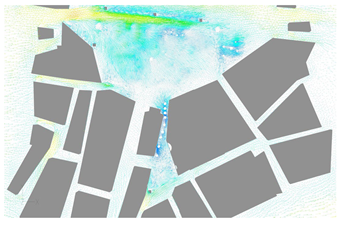
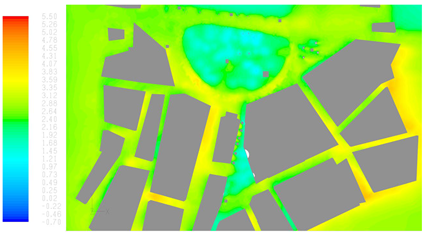
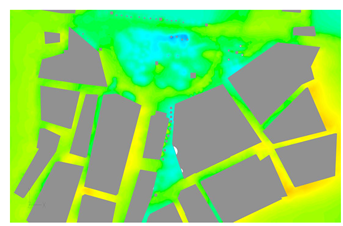
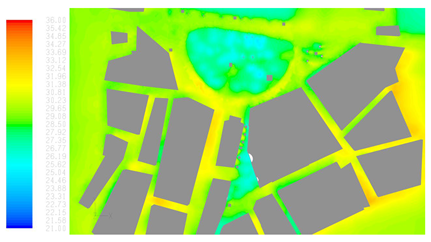
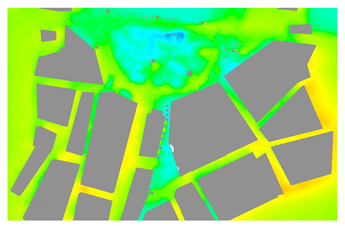
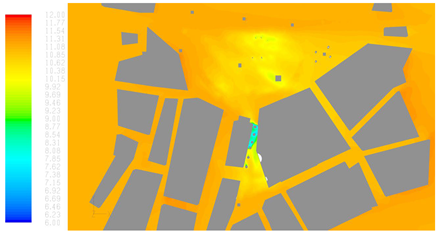
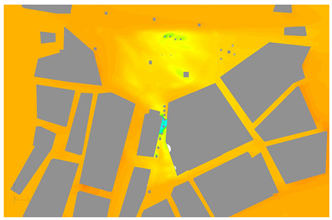
The simulated results of the KPIs’ distributions at 1.8 m from the ground (except the surface temperature, which is depicted on solid fronts) at 14:00, when the highest heat stress is expected, in the existing and in the suggested situation are presented in Table 5. First of all, it is seen that the surface temperature is reduced by around 10 degrees in the perimetric roads of the Liberty Square. This is mainly the result of applying materials with higher reflectivity in relation to the existing land cover, i.e., white marble on the pavement at the south side of the square, reflective asphalt on all the traffic roads of the urban area and reflective paver in front of the Administration building of the Region of Crete. The surface temperature in non-shaded areas in the square is slightly increased by approx. 5 degrees in relation to the existing situation due to the slightly lower reflectivity of the suggested travertine marble compared to the existing white one. However, the additional shading provided by the new trees, as well as the additional heat sinks that emerged by the suggested fountain and (assumed to be well-irrigated) grass beds at the north/north-west parts of the square, significantly increases the extent of the acceptable surface temperature (i.e., 25–27 °C). The benefits of using more heat sinks and shading from trees are clearly shown in the air temperature distribution figures, where the establishment of a practically uniform temperature field at around 30.5 °C is achieved internally in the Liberty Square contrary to the existing case, where hotspots of more than 31 °C persist in various locations. Similarly, the air temperature field in the Daskalogianni Square becomes more uniform in relation to the existing situation and, in fact, is held to around 30.5 °C as in the Liberty Square. It is also clear that the shaded parts of Daskalogianni remain unaffected by the replacement of the concrete slab with the travertine marble despite the increasing albedo reflectivity precisely due to the shading provided by the existing trees preventing the ground material from absorbing high amounts of heat and activating its reflecting property. However, the use of the “cooler” travertine marble demonstrates benefits in the west non-shaded part of the square, where the air temperature is now reduced in relation to the existing situation. Finally, the surrounding grid of traffic and pedestrian roads present lower air temperature by more than 1 °C as a result of exploiting cool materials. The relative humidity remains practically the same as in the existing situation at around 50% in both squares. As regards the wind speed, again its pattern is not affected by the suggested design, which means that the same possible vulnerable areas as in the existing case are recognized, i.e., the Anemogianni Str. and its east pedestrian road and to a small extent at the west of Daskalogianni Square. Following the trends of the previously described physical parameter patterns, the TCI distributions demonstrate that the areas with better thermal-comfort conditions increase mainly within the Liberty Square as well as at its surrounding roads.
The spatial mean values of the KPIs throughout the study area (Daskalogianni Square, Liberty Square and its perimetric roads) for the time period from 10:00 to 16:00 on the typical hot summer day are presented in Table 6. The following key observations may be reported, which verify the design goals set initially in this section for the summer period:
  • The highest heat stress in terms of the air and surface temperature occurs within the period from 13:00 to 14:00;
  • The suggested renovation achieves a reduction in the mean surface temperature throughout the urban area of 12 °C during the time period from 13:00 to 14:00 of the highest heat stress;
  • The maximum reduction in the mean air temperature reaches 0.46 °C at 14:00;
  • The wind speed is retained well below 6 m/s in the majority of the urban area; improvements, however, are required for wind protection in the vulnerable regions, especially at the east side of the Liberty Square;
  • Summer thermal comfort is improved by around 21% or 5% based on PMV or the SET, respectively.
An advantage of the numerical approach is that it allows for checking the possible penalties that may emanate from the suggested design during winter. The CFD model is employed in winter conditions and, again, an examination of the results between the existing and the suggested situation is conducted. Regarding the incoming wind’s properties used at the north inlet far-field boundary, they are extracted from the weather station for a typical winter day in February 2009. Focusing on the CFD model, a typical 0.5 cloudiness factor is assumed and imposed in the solar ray tracing sub-model. The deciduous trees, grass and fountain are disabled in order to represent leaf loss, limited irrigation and inactive fountain in winter, respectively. As for the personal parameters, 100 W/m2 and 1.3 clo are set in the TCI model for the metabolic rate and clothing insulation, respectively. The results at 14:00 are presented in Table 7 in terms of both the spatial distribution and area-weighted averages at 1.8 m from the ground. The results indicate that the suggested renovation scenario practically does not affect the local microclimate in relation to the existing situation. Both the air temperature and the TCIs are almost equal between the two situations, providing evidence that the suggested renovation plan would cause no thermal-comfort deterioration in the focused on urban area and no heating penalties in the surrounding buildings under the same incoming wind properties for both the studied situations.

4. Discussion

The current study presents a holistic CFD approach for the numerical verification of the urban bioclimatic design in warm summer conditions. A microscale CFD model already developed in a previous research [4] is used for the numerical microclimate simulations, which employs a well-known commercial software that has been widely applied for airflows within urban canopies. The CFD model used integrates user-defined functions for producing the spatial distributions of advanced thermal comfort indicators [37]. In this study, the modelling approach is demonstrated for a study area in the city centre of Heraklion in Crete, Greece, both for the existing situation and for a given renovation plan. The model is empirically validated in comparison with monitored climatic and thermal-comfort indicators obtained in another research study [39]. The model is general and applicable for at least the European Mediterranean, considering the common prevailing climate characteristics among regions, i.e., in winter the most frequent minimum temperatures being above 5 °C while the normal peak daily temperature during summer ranging around 30 °C [50].
Focusing on the results of the validation campaign (refer to Table 4), regarding the mean air temperature and relative humidity, a remarkable agreement is achieved between the numerical and reference data. Referring to the mean wind speed, a quite large difference takes place which, however, is not always the result of modelling errors but also of the challenging task of recording velocity magnitude in real-scale problems. Indeed, since the velocity vector in atmospheric flows often presents high temporal changes [30], according to the turbulence intensity, a considerably small recording time step, ideally at the scale of a millisecond, would be adequate to capture the airflow. On the other hand, the reference study [39] exploited herein reports a storage time interval of 5 min, which means that intermediate perturbations of lower time scales are not recorded, hence providing only an empirical, although informative for practical design purposes, recording of the velocity magnitude. Taking the previous argument into account, it may be fairly suggested that, at least in practice, the present calculations of the velocity field are reliable, considering also the fact that both the CFD and the available data exhibit a mean value of velocity ranging in the same integer interval, i.e., 1–2 m/s. Regarding the thermal comfort conditions, the PPD presents again a very good agreement (a difference of around 7.1%) between the numerical and the reference data. On the contrary, the PMV exhibits a quite large difference, being around 35%; nonetheless, both the numerical and reference data advocate the same thermal sensation interpreted as “warm sensation” in the PMV scale [49]. Alternatively, if the extended PMV for the non-air-conditioned spaces of Fanger and Toftum [51] is adopted, which modifies the sensation according to the subject’s habitat, then a better accuracy is obtained. Specifically, using an expectancy factor of 0.7 for Greece [51], then the calculated mean PMV is revised from 2.41 to 1.69, which significantly reduces the difference between the numerical and reference data to the value of 5.2%. Finally, the SET temperature shows quite a high difference when comparing the numerical result with the reference data; however, it should be pointed out that, while herein the new SET model [48] is used, in the reference study it is not clear which SET version was used. Nevertheless, both findings indicate warm conditions in the Liberty Square in summer. In general, it is very encouraging that both the current numerical approach and the previous monitoring survey of the reference study present similar microclimate performance of the Liberty Square, providing confidence in exploring alternative renovation scenarios.
On the basis of scientific terminology that the UHI intensity is defined as the temperature difference between the cityscape and a rural or suburban environment [9], microclimate assessment of the selected urban area is performed by means of assessing the air temperature patterns in relation to the air temperature recorded in the selected weather station, which, in fact, is installed in a neighbouring suburban area with a coarse built environment. The simulation results presented in Table 3 demonstrate that both the urban squares studied possess a remarkable resistance to local overheating (being developed in the urban area) as the air temperature is almost reverted to the level of the incoming wind’s temperature. This means that, although the current calculations (and previous monitoring campaign [39]) reveal warm sensations in summer, both urban areas have limited UHI intensities. The same is not true for the surrounding grid of traffic and pedestrian roads, wherein overheating is observed mainly due to the lack of plantation, heat sinks and the use of materials with low albedo. Considering the evaluation of the given renovation plan, through employing the CFD approach, it was found (see Table 5 and Table 6) that the proposed plan not only retains low UHI intensities within the urban squares but also reduces heat stresses in the perimetric roads. Indicatively, the temporally maximum mean surface temperature is reduced by around 10 °C at the exposed perimetric roads due to the use of more reflective materials, similar to the findings of the assessment of cool materials’ impacts in Greece [4], Italy [22] and Albania [14]. The slight increase in the surface temperature in some non-shaded parcels of the Liberty Square due to the less-reflective travertine marble is compensated for by the new green and blue measures, i.e., more trees, grass beds (well irrigated) and a big fountain. Regarding the air temperature, its area-weighted mean value throughout the study urban area is reduced by around 0.5 °C and thermal comfort is improved by at least 15% (based on the PMV) at noon on a typical hot summer day. As far as the potential penalties in winter are concerned, the CFD simulations for a typical day in February show that the local microclimate conditions remain practically the same, i.e., no temperature reduction occurs in the suggested case, which means that the latter causes no heating penalties in the buildings in the area. In parallel, practically no change in the thermal comfort conditions is observed in the suggested case.
A few recommendations for possible improvements to the suggested design, based on the numerical simulations, include the following:
  • Replacement of the new suggested trees in the Liberty Square with other deciduous ones, since in the current suggestion most new trees are evergreen. This would allow for higher amounts of solar irradiance in the square, elevating the thermal-comfort conditions of pedestrians in winter.
  • Artificial windbreaks are required on the paver at the east side of Anemogianni Street.
  • Since the intervention focuses also on tackling slipperiness, the white marble surfaces suggested on the south and north pavements of Liberty Square could be replaced by reflective concrete-based pavers (such as the ones envisaged in front of the Administration of Region of Crete). Indeed, previous investigations have demonstrated that the use of materials with high reflectivity to solar radiation and high spectral emissivity (the so-called cool materials) increases the urban albedo and stands for a promising strategy to combat the UHI towards the improvement of the urban environment [18,52] and the reduction of energy consumption for cooling purposes [53].
Focusing on the limitations of the research, they refer mainly to the construction and the assumptions of the numerical CFD model. More specifically, the spatial discretization with relatively coarse unstructured grids (in order, however, to ensure solution convergence in a realistic time under the available CPU resources) means that the grid is not ideally refined near walls, especially under the upwind discretization scheme employed. Consequently, the numerical diffusion [17] borne by the grid construction causes errors in the predictions from a strictly theoretical point of view. However, the results produced are considered acceptable for practical engineering purposes as, at least, they are verified through the empirical validation but also considering the successful use of the model in a previous study of a similar nature [4]. Regarding the turbulence modelling, the RANS model used herein is not as accurate as more detailed methods, such as the Large Eddy Simulation (LES) [30]; however, it is still acceptable and valid in practical engineering studies [16]. In an attempt to improve the prediction accuracy, a modified k-ε model is used which revises the Prandtl closure constants and exhibits considerably better accuracy compared to the standard k-ε model for an ABL flow in a wind-tunnel case [43]. An additional limitation is the flow orientation adopted for the incident wind, which is fixed in the north direction at all times. Considering that there is still an occurrence of a non-negligible amount of wind orientations other than the north one (around 30% according to the data available herein), microclimate simulations under additional alternative wind directions would provide a more thorough view of the urban climate performance and increase the fidelity of the renovation scenarios. This would be particularly useful because the island of Crete suffers from strong south winds; hence, it would be useful to evaluate local conditions under south-prevailing winds. Last but not least, local climate uncertainties such as the possible highly unsteady airflow are not captured in the current study due to the lack of related information provided by the reference study used for model validation [39]. Nevertheless, the procedure followed for the empirical validation based on the hourly simulation results and temporal averaging is still considered acceptable according to previous research regarding the validation of CFD models for atmospheric urban airflows in real-scale problems [18,54].
The above limitations formulate the following directions for future work:
  • Conduct a thorough CFD grid-independency survey (see, for example, Ref. [41]) in order to identify the optimal mesh, i.e., the one where if increased in size, the solution remains the same;
  • Run the CFD model for different turbulence models and explore the performance in comparison with the available experimental data;
  • Perform an additional sensitivity analysis regarding the incident wind direction, considering that south-oriented winds are of particular interest on the island of Crete;
  • Finally, from a design point of view, additional renovation scenarios should be tested using the suggested CFD model towards determining the most efficient one in terms of bioclimatic performance, taking into account the previously bulleted recommendations.

5. Conclusions

The objective of the current study was to demonstrate the application of a CFD modelling approach for the numerical verification of the urban bioclimatic design in terms of tackling the UHI effect. A previously developed CFD model was used which provides the spatial distribution of the airflow properties and thermal comfort indicators, i.e., the PMV and the SET. The model was initially validated in comparison with available recordings of the microclimate and thermal-comfort parameters found in another research study, and it presented acceptable agreement with the monitored data.
The CFD modelling approach was successfully implemented for the presented case study in the city centre of Heraklion in Crete, Greece, providing a reliable assessment of the local urban overheating and UHI effects. The approach demonstrated technical usefulness as it allowed for thorough assessments of the local microclimate as a result of the produced spatial distributions of important indicators such as the air temperature, surface temperature and thermal comfort indicators. Based on these informative distributions, the most vulnerable segments may be identified. The model was finally used to evaluate a given renovation plan from the municipal authority, which was focused not only on UHI mitigation but also on other challenges (glare, slipperiness), and the purpose was to verify that the suggested plan at least does not deteriorate the local microclimate in relation to the existing situation. Concerning the case studied, the following conclusions are drawn:
  • CFD simulations of the existing situation reveal that the squares located in the studied urban area provide effective resistance to urban overheating, and vulnerable areas are identified mainly in the surrounding grid of traffic and pedestrian roads.
  • The suggested renovation plan is acceptable, considering that it achieves a reduction in the surface area in vulnerable surrounding spaces of around 10 °C, a reduction in the peak mean summer air temperature throughout the study area of around 0.5 °C, and an improvement of thermal comfort in the noon hours of at least 15% (based on PMV), while no thermal-sensation or heating penalties occur in winter.
  • Based on local vulnerabilities detected by the CFD model, additional interventions are recommended for further bioclimatic design improvements, such as the replacement of some suggested evergreen trees with deciduous ones for better thermal comfort conditions in winter, the identification of specific segments where cool materials may replace the suggested white marbles, and the installation of wind breaks in segments of expected high wind speeds. Additional research for future work includes improvement of the CFD model, mainly in terms of more reliable spatial discretization, sensitivity analysis of the wind speed and direction, and application of the model for additional design recommendations for developing more integrated UHI mitigation plans.
The suggested approach is general and applicable to any urban space, at least for the European Mediterranean climate. The methodology stands for an adequate technical tool for urban planning practices and informed decision making, particularly in the framework of drafting well-documented climate-change adaptation master plans and policy measures.

Author Contributions

Conceptualization, G.M.S. and D.A.K.; methodology, G.M.S.; software, K.B.; validation, G.M.S., D.A.K. and K.B.; formal analysis, G.M.S.; investigation, G.M.S.; resources, K.B.; data curation, G.M.S.; writing—original draft preparation, G.M.S.; writing—review and editing, D.A.K.; visualization, G.M.S.; supervision, D.A.K.; project administration, G.M.S.; funding acquisition, G.M.S. All authors have read and agreed to the published version of the manuscript.

Funding

This research received no external funding.

Institutional Review Board Statement

Not applicable.

Informed Consent Statement

Not applicable.

Data Availability Statement

The data presented in this study are available on request from the corresponding author.

Conflicts of Interest

The authors declare no conflict of interest.

References

  1. Romanello, M.; McGushin, A.; Di Napoli, C.; Drummond, P.; Hughes, N.; Jamart, L.; Kennard, H.; Lampard, P.; Solano Rodriguez, B.; Arnell, N.; et al. The 2021 report of the Lancet Countdown on health and climate change: Code red for a healthy future. Lancet 2021, 398, 1619–1662. [Google Scholar] [CrossRef] [PubMed]
  2. UN. World Cities Report 2022—Envisaging the Future of Cities; UN—United Nations: New York, NY, USA, 2022; ISBN 9789211328943. [Google Scholar]
  3. Santamouris, M. Recent Progress on Urban Overheating and Heat Island Research. Integrated Assessment of the Energy, Environmental, Vulnerability and Health Impact Synergies with the Global Climate Change. Energy Build. 2020, 207, 109482. [Google Scholar] [CrossRef]
  4. Stavrakakis, G.M.; Tzanaki, E.; Genetzaki, V.I.; Anagnostakis, G.; Galetakis, G.; Grigorakis, E. A computational methodology for effective bioclimatic-design applications in the urban environment. Sustain. Soc. 2012, 4, 41–57. [Google Scholar] [CrossRef] [Green Version]
  5. Fitria, R.; Kim, D.; Baik, J.; Choi, M. Impact of biophysical mechanisms on urban heat island associated with climate variation and urban morphology. Sci. Rep. 2019, 9, 19503. [Google Scholar] [CrossRef] [Green Version]
  6. Li, Y.; Schubert, S.; Kropp, J.P.; Rybski, D. On the influence of density and morphology on the Urban Heat Island intensity. Nat. Commun. 2020, 11, 2647. [Google Scholar] [CrossRef]
  7. Manoli, G.; Fatichi, S.; Schlapfer, M.; Yu, K.; Crowther, T.W.; Meili, N.; Burlando, P.; Katul, G.G.; Bou-Zeid, E. Magnitude of urban heat islands largely explained by climate and population. Nature 2019, 573, 55–60. [Google Scholar] [CrossRef]
  8. Santamouris, M.; Cartalis, C.; Synnefa, A.; Kolokotsa, D. On the impact of urban heat island and global warming on the power demand and electricity consumption of buildings—A review. Energy Build. 2015, 98, 119–124. [Google Scholar] [CrossRef]
  9. Su, M.A.; Ngarambe, J.; Santamouris, M.; Yun, G.Y. Empirical evidence on the impact of urban overheating on building cooling and heating energy consumption. iScience 2021, 24, 102495. [Google Scholar] [CrossRef]
  10. Kolokotsa, D.; Santamouris, M. Review of the indoor environmental quality and energy consumption studies for low income households in Europe. Sci. Total Environ. 2015, 536, 316–330. [Google Scholar] [CrossRef]
  11. Berger, T.; Chundeli, F.A.; Pandey, R.U.; Jain, M.; Tarafdar, A.K.; Ramamurthy, A. Low-income residents’ strategies to cope with urban heat. Land Use Policy 2022, 119, 106192. [Google Scholar] [CrossRef]
  12. Schinasi, L.H.; Benmarhnia, T.; Roos, A.J.D. Modification of the association between high ambient temperature and health by urban microclimate indicators: A systematic review and metaanalysis. Environ. Res. 2018, 161, 168–180. [Google Scholar] [CrossRef]
  13. Akbari, H.; Davis, S.; Dorsano, S.; Huang, J.; Winert, S. Cooling Our Communities—A Guidebook on Tree Planting and White Coloured Surfacing; US Environmental Protection Agency: Office of Policy Analysis, Climate Change Division: Washington, DC, USA, 1992; ISBN 016036034x. [Google Scholar]
  14. Fintikakis, N.; Gaitani, N.; Santamouris, M.; Assimakopoulos, M.; Assimakopoulos, D.N.; Fintikaki, M.; Albanis, G.; Papadimitriou, K.; Chryssochoides, E.; Katopodi, K.; et al. Bioclimatic design of open public spaces in the historic centre of Tirana, Albania. Sustain. Cities Soc. 2011, 1, 54–62. [Google Scholar] [CrossRef]
  15. Santamouris, M.; Yun, G.Y. Recent development and research priorities on cool and super cool materials to mitigate urban heat island. Renew. Energy 2020, 161, 792–807. [Google Scholar] [CrossRef]
  16. Stavrakakis, G.M.; Katsaprakakis, D.A.; Damasiotis, M. Basic Principles, Most Common Computational Tools, and Capabilities for Building Energy and Urban Microclimate Simulations. Energies 2021, 14, 6707. [Google Scholar] [CrossRef]
  17. Stavrakakis, G.M.; Stamou, A.I.; Markatos, N.C. Evaluation of thermal comfort in indoor environments using Computational Fluid Dynamics (CFD). In Indoor Work and Living Environments: Health, Safety and Performance; Harris, R.G., Moore, D.P., Eds.; Nova Science Publishers Inc.: Hauppauge, NY, USA, 2009; pp. 97–166. ISBN 9781617285219. [Google Scholar]
  18. Chatterjee, S.; Khan, A.; Dinda, A.; Mithun, S.; Khatun, R.; Akbari, H.; Kusaka, H.; Mitra, C.; Bhatti, S.S.; Doan, Q.V.; et al. Simulating micro-scale thermal interactions in different building environments for mitigating urban heat islands. Sci. Total Environ. 2019, 663, 610–631. [Google Scholar] [CrossRef] [PubMed]
  19. Zheng, Y.; Keeffe, G.; Mariotti, J. Nature-Based Solutions for Cooling in High-Density Neighbourhoods in Shenzhen: A Case Study of Baishizhou. Sustainability 2023, 15, 5509. [Google Scholar] [CrossRef]
  20. Zhang, J.; Hu, D. Research of practical heat mitigation strategies in a residential district of Beijing, North China. Urban Clim. 2022, 46, 101314. [Google Scholar] [CrossRef]
  21. Ciacci, C.; Banti, N.; Di Naso, V.; Montechiaro, R.; Bazzocchi, F. Experimentation of Mitigation Strategies to Contrast the Urban Heat Island Effect: A Case Study of an Industrial District in Italy to Implement Environmental Codes. Atmosphere 2022, 13, 1808. [Google Scholar] [CrossRef]
  22. Giorio, M.; Paparella, R. Climate Mitigation Strategies: The Use of Cool Pavements. Sustainability 2023, 15, 7641. [Google Scholar] [CrossRef]
  23. Han, Q.; Nan, X.; Wang, H.; Hu, Y.; Bao, Z.; Yan, H. Optimizing the Surrounding Building Configuration to Improve the Cooling Ability of Urban Parks on Surrounding Neighborhoods. Atmosphere 2023, 14, 914. [Google Scholar] [CrossRef]
  24. Bedra, K.B.; Zheng, B.; Li, J.; Luo, X. A Parametric-Simulation Method to Study the Interconnections between Urban-Street-Morphology Indicators and Their Effects on Pedestrian Thermal Comfort in Tropical Summer. Sustainability 2023, 15, 8902. [Google Scholar] [CrossRef]
  25. Sinsel, T.; Simon, H.; Broadbent, A.M.; Bruse, M.; Heusinger, J. Modeling the outdoor cooling impact of highly radiative “super cool” materials applied on roofs. Urban Clim. 2021, 38, 100898. [Google Scholar] [CrossRef]
  26. Alves, F.M.; Gonçalves, A.; del Caz-Enjuto, M.R. The Use of Envi-Met for the Assessment of Nature-Based Solutions’ Potential Benefits in Industrial Parks—A Case Study of Argales Industrial Park (Valladolid, Spain). Infrastructures 2022, 7, 85. [Google Scholar] [CrossRef]
  27. Wang, M.; Song, H.; Zhu, W.; Wang, Y. The Cooling Effects of Landscape Configurations of Green–Blue Spaces in Urban Waterfront Community. Atmosphere 2023, 14, 833. [Google Scholar] [CrossRef]
  28. Brozovsky, J.; Radivojevic, J.; Simonsen, A. Assessing the impact of urban microclimate on building energy demand by coupling CFD and building performance simulation. J. Build. Eng. 2022, 55, 104681. [Google Scholar] [CrossRef]
  29. Palusci, O.; Monti, P.; Cecere, C.; Montazeri, H.; Blocken, B. Impact of morphological parameters on urban ventilation in compact cities: The case of the Tuscolano-Don Bosco district in Rome. Sci. Total Environ. 2022, 807, 150490. [Google Scholar] [CrossRef]
  30. Zheng, X.; Montazeri, H.; Blocken, B. Large-eddy simulation of pollutant dispersion in generic urban street canyons: Guidelines for domain size. J. Wind Eng. Ind. Aerodyn. 2021, 211, 104527. [Google Scholar] [CrossRef]
  31. Zheng, X.; Montazeri, H.; Blocken, B. Impact of building façade geometrical details on pollutant dispersion in street canyons. Build. Environ. 2022, 212, 108746. [Google Scholar] [CrossRef]
  32. Stavrakakis, G.M.; Zervas, P.L.; Sarimveis, H.; Markatos, N.C. Development of a computational tool to quantify architectural-design effects on thermal comfort in naturally ventilated rural houses. Build. Environ. 2010, 45, 65–80. [Google Scholar] [CrossRef]
  33. Nazarian, N.; Kleissl, J. CFD simulation of an idealized urban environment: Thermal effects of geometrical characteristics and surface materials. Urban Clim. 2015, 12, 141–159. [Google Scholar] [CrossRef]
  34. Nazarian, N.; Fan, J.; Sin, T.; Norford, L.; Kleissl, J. Predicting outdoor thermal comfort in urban environments: A 3D numerical model for standard effective temperature. Urban Clim. 2017, 20, 251–267. [Google Scholar] [CrossRef]
  35. Gaber, N.; Ibrahim, A.B.; Rashad, A.; Wahba, E.; El-Sayad, Z.; Bakr, A.F. Improving pedestrian micro-climate in urban canyons: City Center of Alexandria, Egypt. Urban Clim. 2020, 34, 100670. [Google Scholar] [CrossRef]
  36. Ghani, S.; Mahgoub, A.O.; Bakochristou, F.; ElBialy, E.A. Assessment of thermal comfort indices in an open air-conditioned stadium in hot and arid environment. J. Build. Eng. 2021, 40, 102378. [Google Scholar] [CrossRef]
  37. Li, Z.; Zhang, H.; Juan, Y.-H.; Lee, Y.-T.; Wen, C.-Y.; Yang, A.-S. Effects of urban tree planting on thermal comfort and air quality in the street canyon in a subtropical climate. Sustain. Cities Soc. 2023, 91, 104334. [Google Scholar] [CrossRef]
  38. Liu, Z.; Cheng, W.; Jim, C.Y.; Morakinyo, T.E.; Shi, Y.; Ng, E. Heat mitigation benefits of urban green and blue infrastructures: A systematic review of modeling techniques, validation and scenario simulation in ENVI-met V4. Build. Environ. 2021, 200, 107939. [Google Scholar] [CrossRef]
  39. Tsitoura, M.; Tsoutsos, T.; Daras, T. Evaluation of comfort conditions in urban open spaces. Application in the island of Crete. Energy Convers. Manag. 2014, 86, 250–258. [Google Scholar] [CrossRef]
  40. Katsaprakakis, D.A.; Dakanali, I.; Zidianakis, G.; Yiannakoudakis, Y.; Psarras, N.; Kanouras, S. Potential on Energy Performance Upgrade of National Stadiums: A Case Study for the Pancretan Stadium, Crete, Greece. Appl. Sci. 2019, 9, 1544. [Google Scholar] [CrossRef] [Green Version]
  41. Stavrakakis, G.M.; Koukou, M.K.; Vrachopoulos, M.G.; Markatos, N.C. Natural cross-ventilation in buildings: Building-scale experiments, numerical simulation and thermal comfort evaluation. Energy Build. 2008, 40, 1666–1681. [Google Scholar] [CrossRef]
  42. Richards, P.J.; Hoxey, R.P. Appropriate boundary conditions for computational wind engineering models using the k-ε turbulence model. J. Wind Eng. Ind. Aerodyn. 1993, 46–47, 145–153. [Google Scholar] [CrossRef]
  43. Stavrakakis, G.M.; Tomazinakis, N.; Markatos, N. Modified “closure” constants of the Standard k–ε turbulence model for the prediction of wind-induced natural ventilation. Build. Serv. Eng. Res. Technol. 2011, 33, 241–261. [Google Scholar] [CrossRef]
  44. Cook, N.J. The Deavis and Harris ABL model applied to heterogeneous terrain. J. Wind Eng. Ind. Aerodyn. 1997, 66, 197–214. [Google Scholar] [CrossRef]
  45. Penman, H.L. Natural evaporation from open water, bare soil and grass. Proc. R. Soc. Lond. Ser. A 1948, 194, 120–145. [Google Scholar]
  46. Monteith, J.L. Evaporation and environment. Symp. Soc. Exp. Biol. 1965, 19, 205–224. [Google Scholar] [PubMed]
  47. Jones, H.G. Plants and Microclimate—A Quantitative Approach to Environmental Plant Physiology, 2nd ed.; Cambridge University Press: Cambridge, UK, 1992. [Google Scholar]
  48. De Dear, R.; Spagnolo, J. Thermal comfort in outdoor and semi-outdoor environments. In Environmental Ergonomics—The Ergonomics of Human Comfort, Health and Performance in the Thermal Environment; Tochihara, Y., Ohnaka, T., Eds.; Elsevier Ltd.: Amsterdam, The Netherlands, 2005; pp. 269–276. [Google Scholar]
  49. ASHRAE Standard-55. Thermal Environmental Conditions for Human Occupancy. American Society of Heating, Refrigerating and Air Conditioning Engineers, Inc.: Atlanta, GA, USA, 2010.
  50. Katsaprakakis, D.A.; Zidianakis, G.; Yiannakoudakis, Y.; Manioudakis, E.; Dakanali, I.; Kanouras, S. Working on Buildings’ Energy Performance Upgrade in Mediterranean Climate. Energies 2020, 13, 2159. [Google Scholar] [CrossRef]
  51. Fanger, P.O.; Toftum, J. Extension of the PMV model to non-air-conditioned buildings in warm climates. Energy Build. 2002, 34, 533–536. [Google Scholar] [CrossRef]
  52. Santamouris, M.; Synnefa, A.; Karlessi, T. Using advanced cool materials in the urban built environment to mitigate heat islands and improve thermal comfort conditions. Sol. Energy 2011, 85, 3085–3102. [Google Scholar] [CrossRef]
  53. Stavrakakis, G.M.; Androutsopoulos, A.V.; Vyörykkä, J. Experimental and numerical assessment of cool-roof impact on thermal and energy performance of a school building in Greece. Energy Build. 2016, 130, 64–84. [Google Scholar] [CrossRef]
  54. Lin, H.; Xiao, Y.; Musso, F.; Lu, Y. Green Façade Effects on Thermal Environment in Transitional Space: Field Measurement Studies and Computational Fluid Dynamics Simulations. Sustainability 2019, 11, 5691. [Google Scholar] [CrossRef] [Green Version]
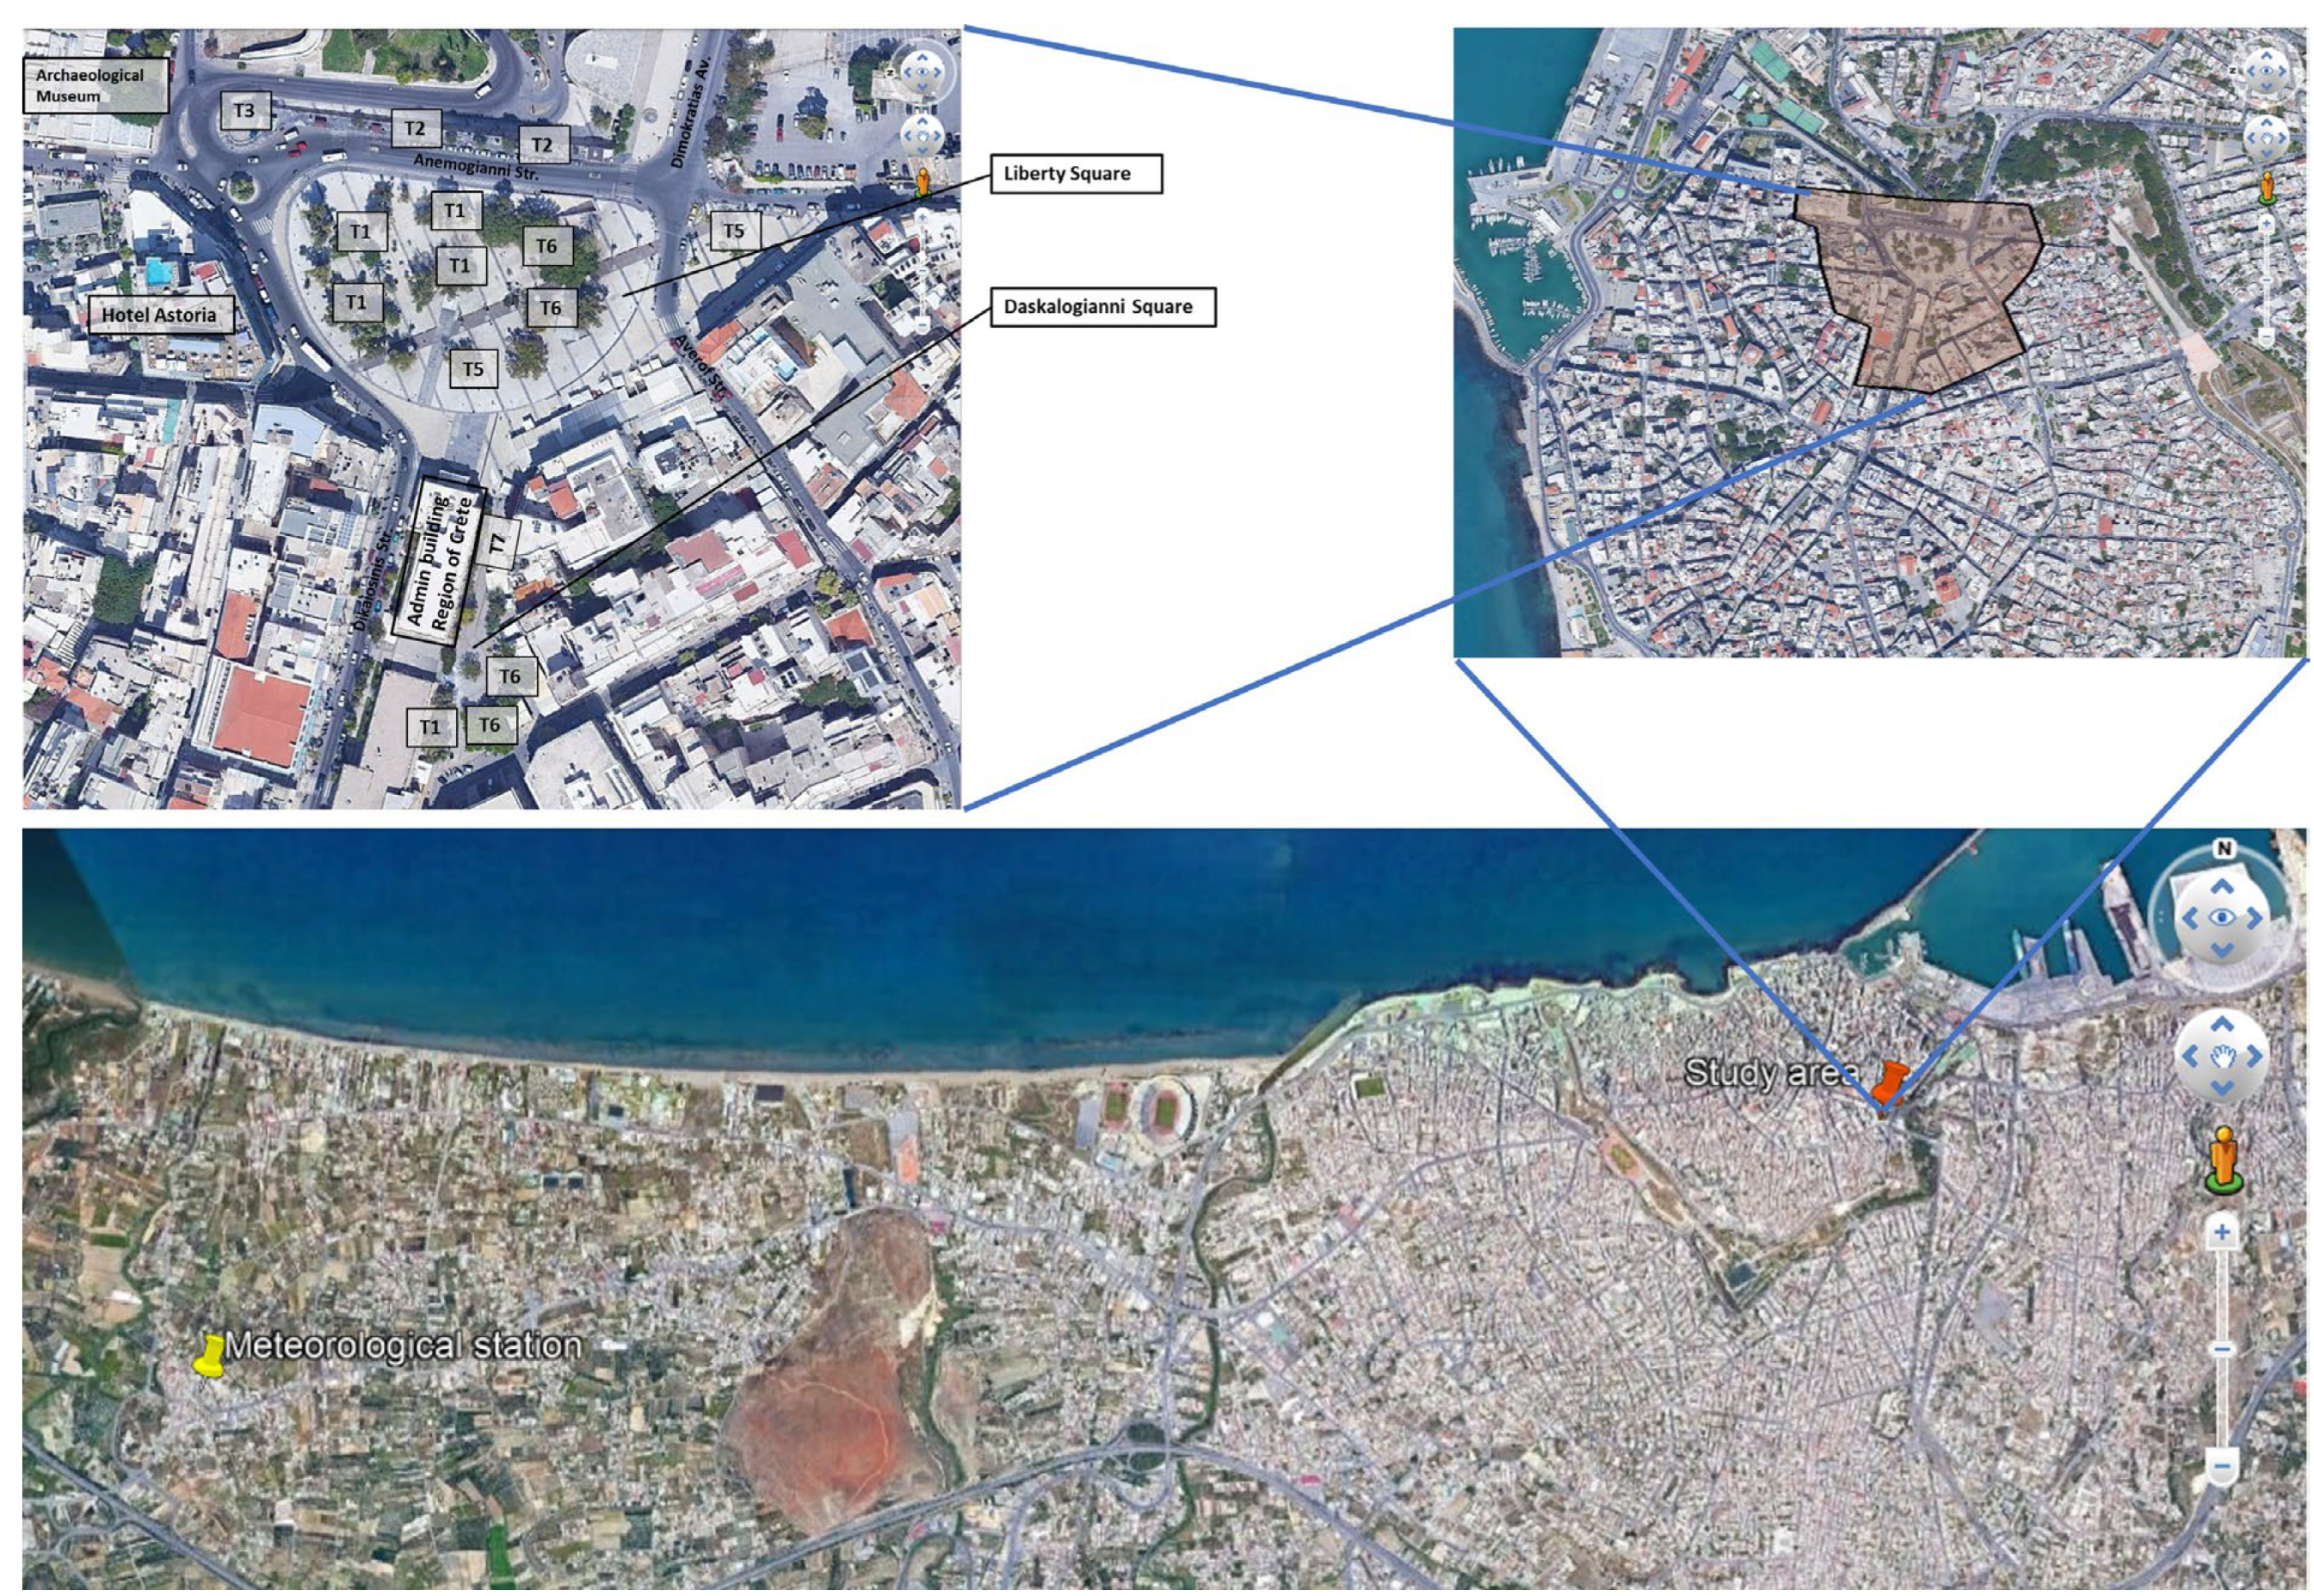
Figure 1. Study urban area (screenshots from Google Earth) in terms of its location in relation to the suburban weather station, of the district in which it is situated and zoom-in of the urban squares.
Sustainability 15 11642 g001
Figure 2. Urban area configuration in the: (a) existing situation; and (b) suggested situation (renovation scenario).
Sustainability 15 11642 g002
Figure 3. Air temperature hourly recordings against the overheating threshold during summer months of the year 2009.
Sustainability 15 11642 g003
Figure 4. Mean and uttermost values for: (a) temperature; (b) wind speed; and (c) relative humidity.
Sustainability 15 11642 g004
Figure 5. Wind rose in terms of the wind speed and direction occurrence frequency within: (a) all recording hours in July 2009; and (b) recording hours from 10:00 to 20:00 in July 2009.
Sustainability 15 11642 g005
Figure 6. Urban area grid meshing for the: (a) existing situation; and (b) suggested situation.
Sustainability 15 11642 g006
Figure 7. Time evolution from 10:00 to 16:00, on a typical hot summer day in the two squares, at 1.8 m from the ground, of the area-weighted average of: (a) air temperature; (b) wind speed; (c) PMV; and (d) SET.
Sustainability 15 11642 g007
Table 1. Nomenclature of plantation depicted in Figure 1 and Figure 2.
SymbolNameNature
(Evergreen (E)/Deciduous (D))
Height (m)Foliage ShapeFoliage Diameter (m)
T1EucalyptusE12Spherical10
T2RedbudD6Spherical5
T3MulberryD6Spherical5
T4OliveE9Spherical7
T5Palm treeE15Spherical4
T6SycamoreE10Spherical8
T7BrachychitonD7Conical3
T8AcerD7Spherical6
T9JacarandaD7Spherical6
T10LagunariaE6Spherical5
T11PistaciaΕ4Spherical3
T12PlumD5Spherical4
Table 2. Nomenclature of materials depicted in Figure 2.
SymbolNameReflectivityEmissivity
M0Buildings0.30.8
M1White marble0.540.95
M2Conventional asphalt0.060.95
M3Concrete slab0.30.9
M4Travertine marble0.440.95
M5Marble (dark grey)0.160.95
M6Porphyry slab0.30.9
M7Tufa paver0.350.9
M8Grass0.20.68
M9Water0.050.95
M10Cool grey asphalt0.370.89
M11Cool beige paver0.650.89
Table 3. Results of the local climatic parameters and TCIs for the typical hot summer day in the existing situation.
KPIHour: 11:00Hour: 13:00Hour: 15:00
Solar flux density, G (W/m2)Sustainability 15 11642 i001Sustainability 15 11642 i002Sustainability 15 11642 i003
Surface temperature, Tsurf (K)Sustainability 15 11642 i004Sustainability 15 11642 i005Sustainability 15 11642 i006
Air temperature, Tair (°C)Sustainability 15 11642 i007Sustainability 15 11642 i008Sustainability 15 11642 i009
Relative humidity, RH (%)Sustainability 15 11642 i010Sustainability 15 11642 i011Sustainability 15 11642 i012
Wind speed, WS (m/s)Sustainability 15 11642 i013Sustainability 15 11642 i014Sustainability 15 11642 i015
Predicted Mean Vote, PMV (-)Sustainability 15 11642 i016Sustainability 15 11642 i017Sustainability 15 11642 i018
Standard Effective Temperature, SET (°C)Sustainability 15 11642 i019Sustainability 15 11642 i020Sustainability 15 11642 i021
Predicted Percentage Dissatisfied, PPD (%)Sustainability 15 11642 i022Sustainability 15 11642 i023Sustainability 15 11642 i024
Table 4. Comparisons between the simulated KPIs and data from the reference study.
Area-Weighted KPIHourHourly AverageReference Study [39]
10:0011:0012:0013:0014:0015:0016:00
Air temperature (°C)27.4730.0231.0431.4131.5031.3631.2630.5831.19 1
Wind speed (m/s)1.361.461.671.872.262.872.251.961.15 1
RH (%)58.2452.6750.1650.0250.4351.4952.2452.1846.21 1
Solar flux density (W/m2)712.45935.1210981188.41174.421067892.51009.70976.93 1
PMV1.172.232.682.852.842.642.462.411.78 2
SET (°C)25.3928.1129.3429.7829.7429.2228.7428.6237.34 1
PPD (%)31.3268.7481.0084.4384.3580.0875.807277.80 2
1 Directly provided by the reference study. 2 Derived after own processing of the available data.
Table 5. KPI distributions at 14:00 on the typical hot summer day in the existing and the suggested situation.
KPIExisting SituationSuggested Situation
Surface temperature, Tsurf (K)Sustainability 15 11642 i025Sustainability 15 11642 i026
Air temperature, Tair (°C)Sustainability 15 11642 i027Sustainability 15 11642 i028
Relative humidity, RH (%)Sustainability 15 11642 i029Sustainability 15 11642 i030
Wind speed, WS (m/s)Sustainability 15 11642 i031Sustainability 15 11642 i032
Predicted Mean Vote, PMV (-)Sustainability 15 11642 i033Sustainability 15 11642 i034
Standard Effective Temperature, SET (°C)Sustainability 15 11642 i035Sustainability 15 11642 i036
Predicted Percentage Dissatisfied, PPD (%)Sustainability 15 11642 i037Sustainability 15 11642 i038
Table 6. KPI area-weighted mean values throughout the urban area on the typical hot summer day for the existing and the suggested situation.
KPIHour
10:0011:0012:0013:0014:0015:0016:00
Air temperature
Existing situation (°C)27.4630.0131.0431.4131.5031.3531.26
Suggested situation (°C)26.9929.630.6831.0531.0431.0230.91
Difference (°C)0.470.410.360.360.460.330.35
Difference (%)1.71%1.37%1.16%1.15%1.43%1.05%1.12%
Surface temperature
Existing situation (K)316.85322.39328.19330.44329.61326.56322.64
Suggested situation (K)309.19314.56317.44318.43317.58315.45312.7
Difference (K)7.667.8310.7512.0112.0311.119.94
Difference (%)2.42%2.43%3.28%3.63%3.65%3.40%3.08%
Wind speed
Existing situation (m/s)1.291.391.611.772.112.152.11
Suggested situation (m/s)1.371.481.7322.32.482.52
Difference−0.08−0.09−0.12−0.23−0.19−0.33−0.41
Difference (%)−6.20%−6.47%−7.45%−12.99%−9.00%−15.35%−19.43%
PMV
Existing situation1.152.212.672.842.822.622.45
Suggested situation0.721.682.092.222.222.081.94
Difference0.430.530.580.620.60.540.51
Difference (%)37.39%23.98%21.72%21.83%21.28%20.61%20.82%
SET
Existing situation (°C)25.362829.329.7529.7129.1928.71
Suggested situation (°C)24.3326.6927.7528.128.1127.727.34
Difference1.031.311.551.651.61.491.37
Difference (%)4.06%4.68%5.29%5.55%5.39%5.10%4.77%
Table 7. KPI distributions and area-weighted average at 14:00 of a typical winter day in the existing and the suggested situation.
KPIExisting SituationSuggested Situation
Air temperature, Tair (°C)Sustainability 15 11642 i039Sustainability 15 11642 i040
Area-weighted average: 10.69Area-weighted average: 10.62
Wind speed, WS (m/s)Sustainability 15 11642 i041Sustainability 15 11642 i042
Area-weighted average: 1.38Area-weighted average: 1.53
Predicted Mean Vote, PMV (-)Sustainability 15 11642 i043Sustainability 15 11642 i044
Area-weighted average: −1.62Area-weighted average: −1.65
Standard Effective Temperature, SET (°C)Sustainability 15 11642 i045Sustainability 15 11642 i046
Area-weighted average: 14.08Area-weighted average: 14.03
Disclaimer/Publisher’s Note: The statements, opinions and data contained in all publications are solely those of the individual author(s) and contributor(s) and not of MDPI and/or the editor(s). MDPI and/or the editor(s) disclaim responsibility for any injury to people or property resulting from any ideas, methods, instructions or products referred to in the content.