Article

How Does the Digital Economy Affect Green Development?—Evidence from 284 Cities in China

School of Economics and Management, Northwest University, Xi’an 710127, China
*
Author to whom correspondence should be addressed.
Sustainability 2023, 15(15), 11596; https://doi.org/10.3390/su151511596
Submission received: 18 May 2023 / Revised: 20 July 2023 / Accepted: 24 July 2023 / Published: 27 July 2023
(This article belongs to the Section Economic and Business Aspects of Sustainability)

Abstract

:
The expansion of the digital economy has resulted in extensive changes to production factors, production methods, and lifestyles, making it a key factor in green development. In a unified framework, this paper examines the impact of China’s digital economy on green development and the transmission mechanisms of the digital economy. Based on a theoretical analysis of the green attributes and transmission mechanisms of the digital economy, the relationship is empirically examined using the fixed effects model, the instrumental variables method, the quantile regression model, and the mediating effects model with China-specific data from 2011 to 2019. The results indicate that the digital economy has a significant positive impact on green development, and that this impact grows as GTFP (Green Total Factor Productivity) increases. The digital economy has a lasting impact. According to the analysis of heterogeneity, the impact of the digital economy varies significantly between regions, and this disparity exists in both small and large cities. The “digital gap” between high- and low-level cities exacerbates the disparity in the digital economy’s effects. The mechanism analysis reveals that industrial structure rationalization and environmental improvement are the primary means by which the digital economy’s effects are transmitted. Currently, the “innovation-to-application” conversion efficiency is low, and the “demand expansion effect” is greater than the “efficiency enhancement effect”, which impedes the transmission path of green technology innovation and energy use efficiency. The research findings serve as a guide for promoting the development of Digital China and accelerating the green transformation.

1. Introduction

After 1978, an average annual growth rate of 9.6% became the defining characteristic of the Chinese economy, indicating a high growth rate and an exceptionally long period of time that has produced remarkable accomplishments. Nevertheless, many regions have prioritized development over the environment. The problem of ecological pollution and damage is escalating, and the sustainability of development is a controversial topic [1]. China has undertaken several significant initiatives to achieve a complete green transformation. China incorporated the construction of an ecological civilization into its national strategic objectives in 2012, alongside economic, political, cultural, and social construction; emphasized the need to promote development with green, circular, and low-carbon attributes in 2013; and proposed a new development concept incorporating green development in 2015. China established a clear and comprehensive “timetable” and “roadmap” for achieving green development in 2017 [2]. China is the world’s largest energy consumer and second-largest economy. The ability of China to implement a green development strategy and achieve sustainable development is essential for maintaining global sustainability. The green development strategies and instruments of China serve as an important benchmark for other nations.
The new digital technology revolution has accelerated China’s green economic transformation. China’s digital economy (DE) has grown rapidly from RMB 9.5 trillion in 2011 to RMB 45.5 trillion in 2021, according to the China Digital Economy Development White Paper (2022). As shown in Figure 1, the growth rate is first in the world, and the total size is second. It is evident that the digital economy has continued to fuel China’s economic growth over the years. The impact of the digital economy on China’s approach to inclusive growth has been remarkable. Comparing 2021 with 2012, cumulative energy consumption per unit of GDP decreased by 26.4%, and coal’s share of total energy consumption decreased by 12.2%. Green transformation aids in energy conservation and pollution reduction. China has entered a period of exceptional development. The development of a digital economy in Chinese cities is aimed at achieving a win-win situation for both economic development and environmental protection.
Multiple scholars’ research supports the notion that the digital economy contributes to green development. At the 15th G20 Leaders’ Summit, Chinese President Xi Jinping [3] suggested that technological innovation and digital transformation should drive the digital economy to generate new development momentum. Heymann et al. [4] discuss the effects of artificial intelligence and robotics on human work and life in the era of the digital economy. Karpovich et al. [5] state that in the era of Industry 4.0, the implementation of digital development strategies is crucial for achieving green economic growth. Ren et al. [6] assert that the conglomeration of the digital economy actively contributes to inclusive green development. The digital economy has spurred the rapid development of new business models, new technologies, and new applications, which drive the growth of green production and empower emerging industries [7]. Consequently, can the digital economy in Chinese cities contribute to sustainable development? What is its mode of operation? Does heterogeneity exist in the effect of the digital economy across cities? Are the effects of the digital economy short-term or long-term? These questions require further clarification. This paper will examine the above questions based on municipal-level data from 2011 to 2019 for 284 cities in China. This paper utilizes basis regression, quantile analysis, persistence analysis, heterogeneity analysis, and transmission mechanism analysis to investigate the relationship between the digital economy and green development.
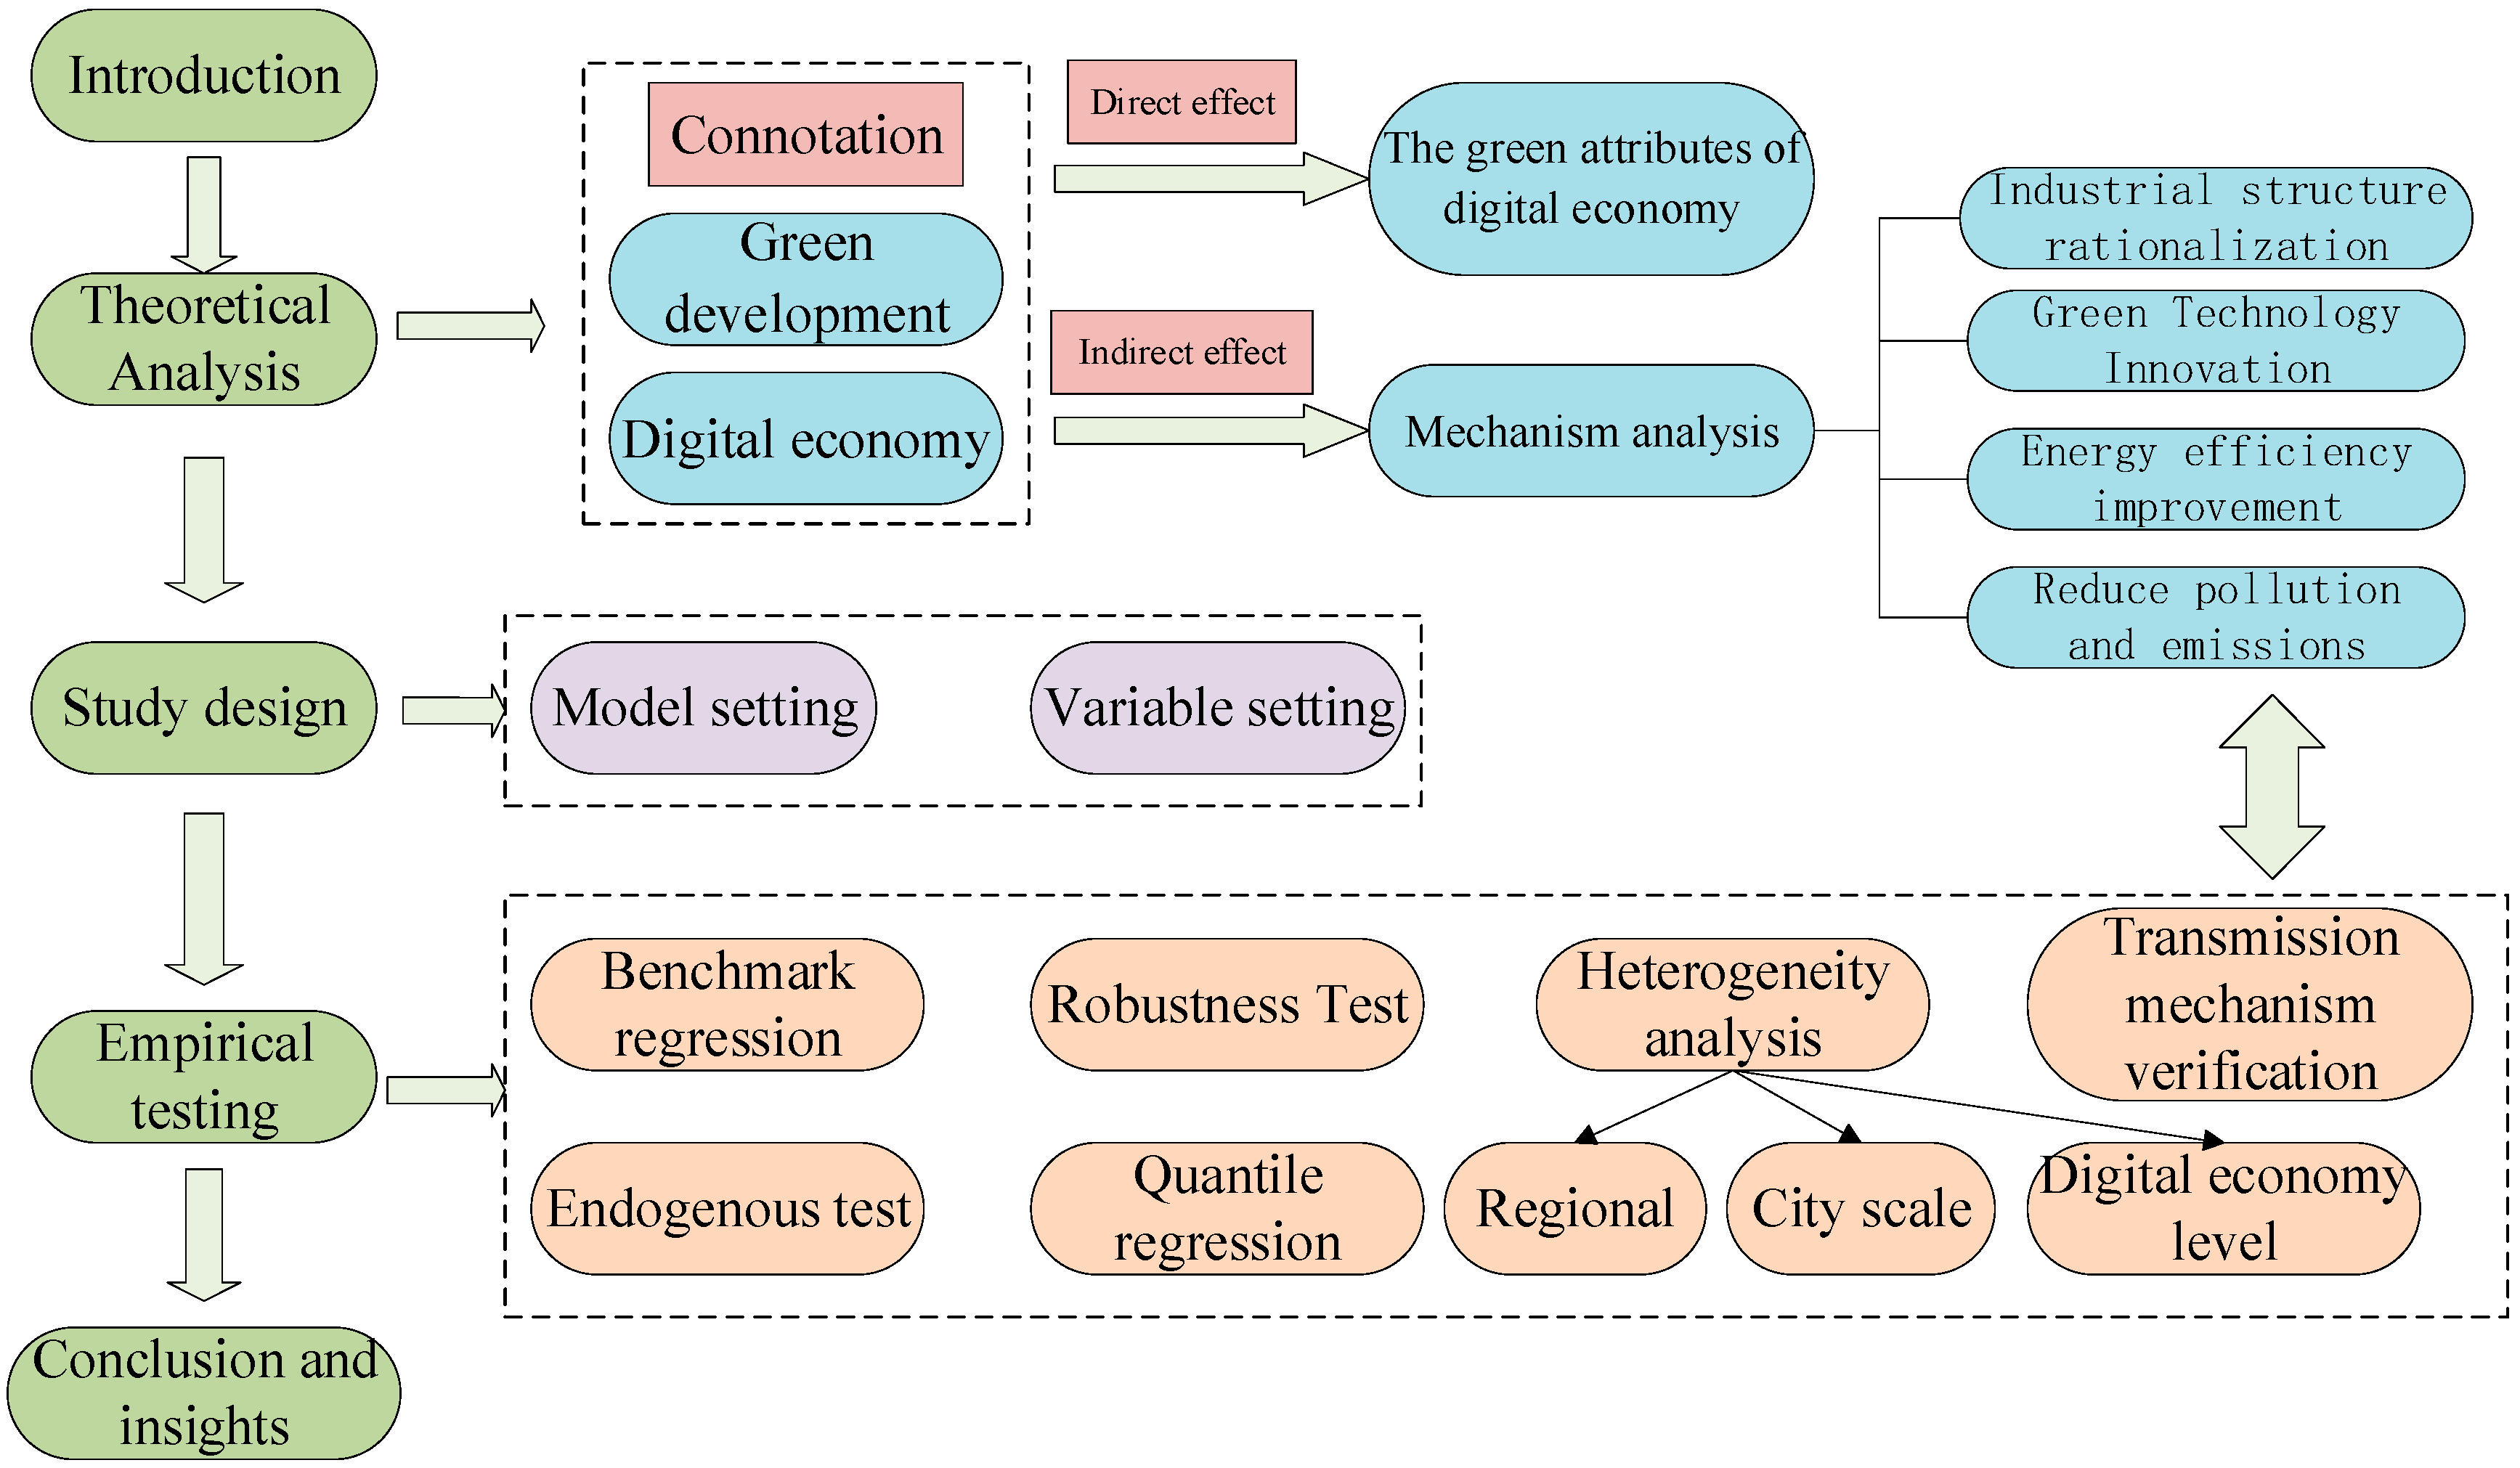
The study’s contributions are summarized below. First, we theorize the green attributes of the digital economy from the point of view of direct impact. Then, from the point of view of indirect impact, we look into how the digital economy drives green development, which adds to the relevant theoretical literature. Second, the current literature lacks a discussion of the influence of the DE on the varying degrees and durations of GTFP. On the basis of quantile regression models, we examine the differences in digital economy effects across cities with different GTFP. In addition, we examine the long-term viability of the digital economy’s impact using a lagged effects analysis. Third, in order to investigate the causes of DE differentiation effects, we analyze the effects of the DE from multiple perspectives, including geographic location, city size, and digital economy level. The clear cause analysis offers a more trustworthy policy reference for achieving the green effect. We empirically test the transmission mechanism of the DE on GTFP from the perspectives of industrial structure, green technology innovation, energy use efficiency, and environmental pollution in order to investigate the potential drivers of green development. The effects of the digital economy and the realization of green development are perceived with greater clarity. The rest of the study is presented in Figure 2 below. Section 2 reviews the literature on green development and the digital economy and theoretically analyzes the transmission mechanisms from both direct and indirect perspectives. Section 3 describes the model design and the selection of variable data for calculations. Section 4 presents the empirical results and discusses endogeneity. Section 5 conducts robustness tests. Section 6 analyzes heterogeneity. Section 7 examines the transmission mechanism. Finally, Section 8 provides conclusions and insights (see Figure 2).

2. Theoretical Mechanism Analysis

2.1. The Connotation of Green Development

Different organizations have different definitions of green development, but in essence, they all aim to achieve a development that is balanced regarding resources, the environment, and economic activities. ESCAP [8] defines green growth as sustainable economic growth that considers the environment. According to the OECD [9], green development can be defined as natural assets that satisfy the resource and environmental needs of human society while also fostering economic growth. According to the World Bank [10], green development is the achievement of efficient, clean, and resilient production processes without impeding economic growth. As the global community’s concern for environmental protection and green production methods grows, the breadth and depth of academic research on green development theories have expanded. While exploring the measures of green development level [11,12], scholars have also analyzed the influencing factors of green development from different perspectives, such as economic aggregation [13]; urbanization [14]; scientific research and innovation [15]; human capital [16]; financial development [17]; and industrial structure [18].

2.2. The Connotation and Green Attributes of the Digital Economy

As digital technologies continue to permeate all facets of the economy and society, the digital economy has become increasingly rich in connotation and content [19,20], and accounting and measurement methods have become increasingly sophisticated [21,22]. “The digital economy refers to a broad range of economic activities, including the use of digitized knowledge and information as the essential factor of production, modern information networks as the essential activity space, and the effective use of ICT as a key driver for efficiency-enhancing and economic structural optimization” [3].
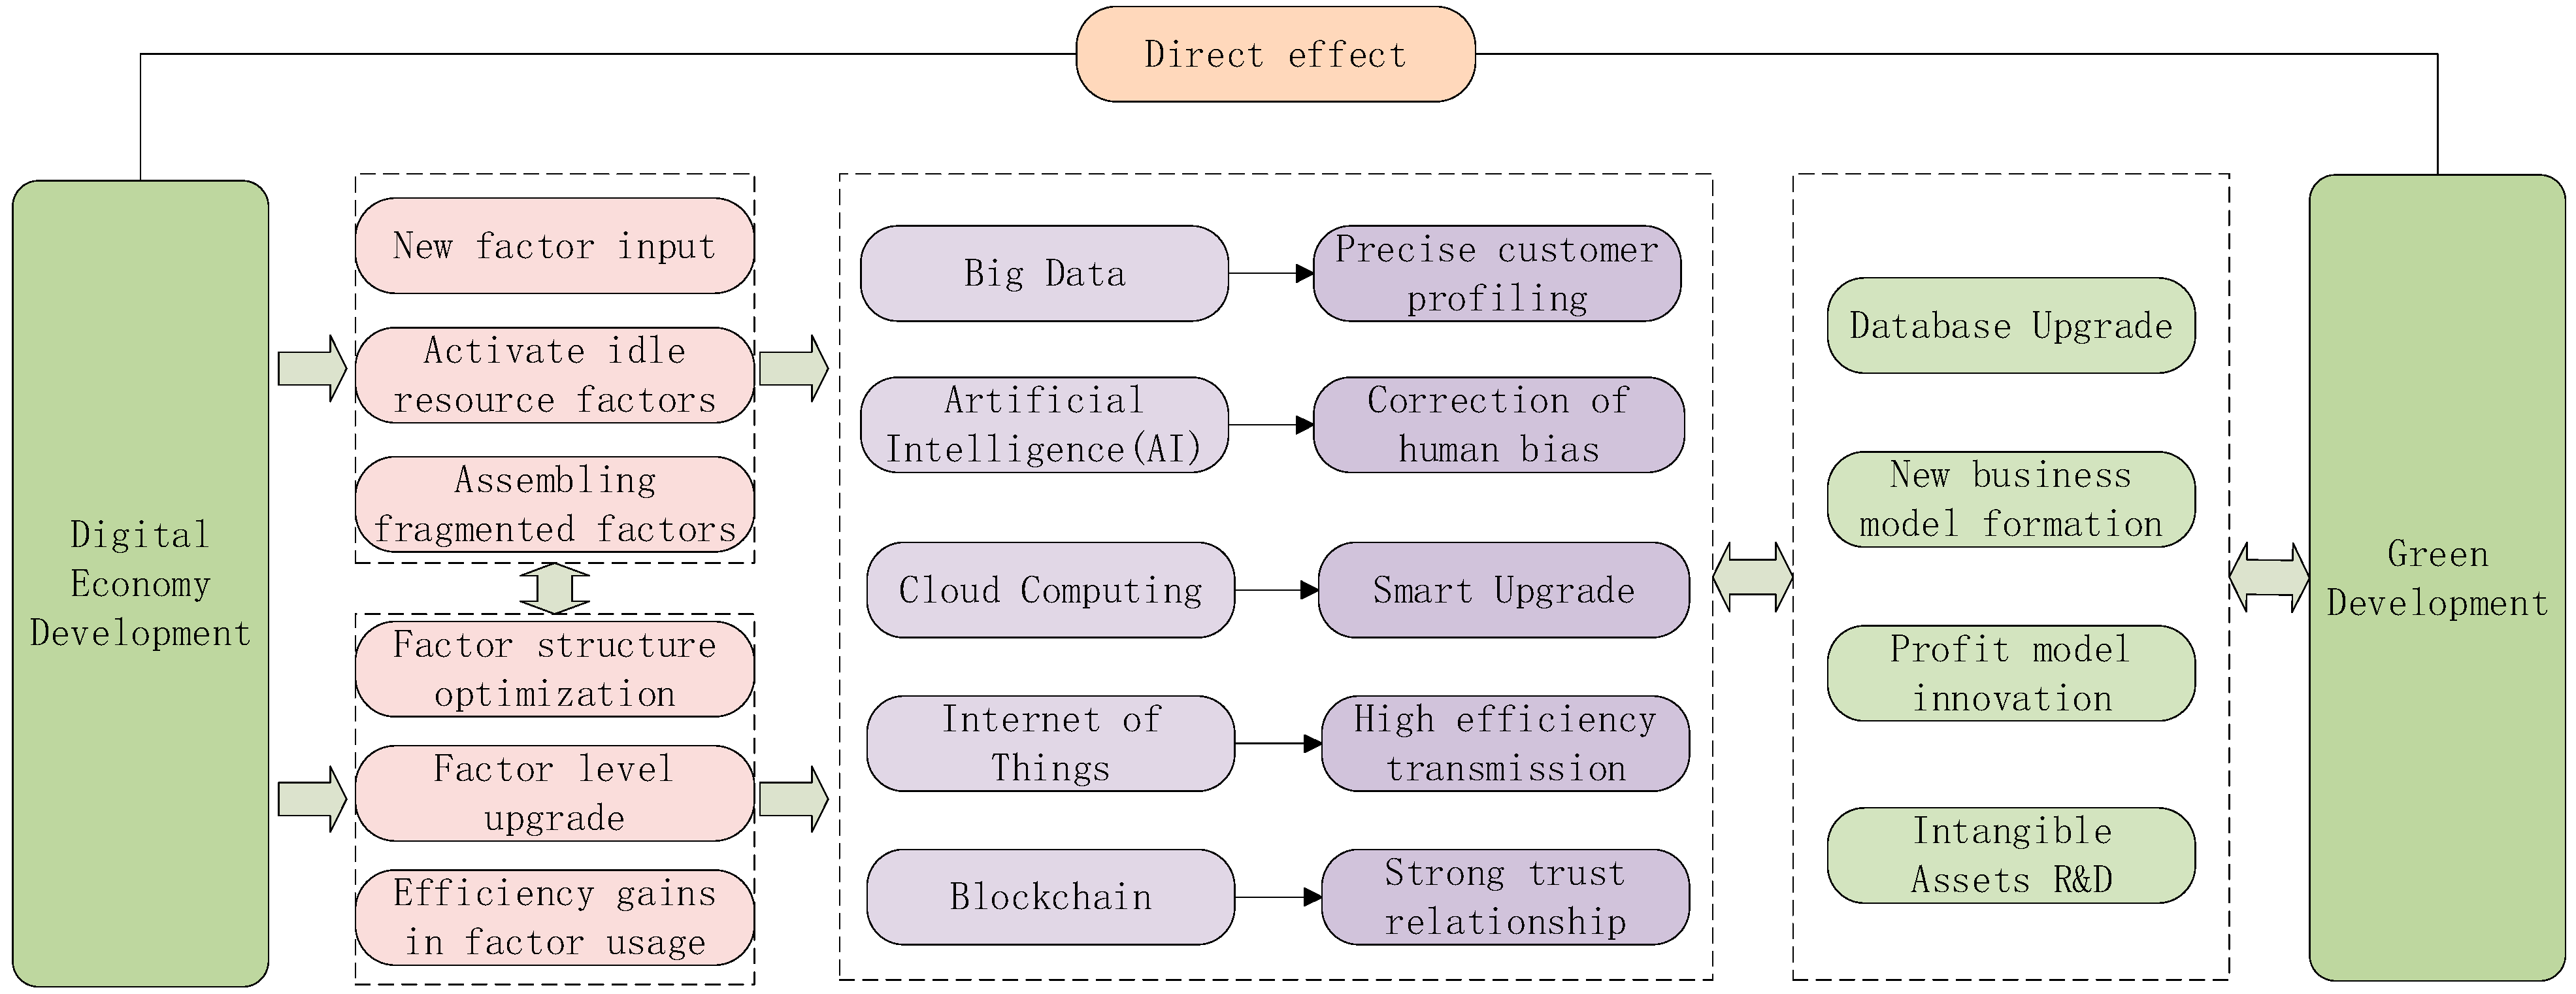
China has a new opportunity to achieve green development due to the high tech, high growth, and high cleanliness of the digital economy [23]. Figure 3 depicts the resolution of the green attributes of the digital economy. First, big data that breaks through the supply constraint becomes a new production factor and strengthens the foundation for green development. Big data is highly integrated with conventional production factors, thereby accelerating factor reorganization and enhancing factor utilization effectiveness. Goldfarb and Tucker [24] and Schwanholz and Leipold [25] state that big data is highly integrated with digital technology, making it easy to search and transmit information, track, and verify transactions, and significantly reduce economic costs. Secondly, as the foundation of the digital economy, digital industrialization and industrial digitization provide more room for green development. At the industrial level, digital industrialization is the expansion of digital transactions, digital content, information and communication, and other new business transactions [26]. Industrial digitization is the combination of industry and digital technology that creates new industries and new modes to promote the green transformation of traditional industries [27]. Thirdly, the widespread application of information technology alters the nature of work and daily life, creating an ingrained digital ecosystem [28]. The green potential of the digital economy makes production and life more energy-efficient, resulting in resource savings, lower carbon emissions, and improved environmental quality to support green and sustainable development [29,30].

2.3. Mechanism Analysis

Based on digital economy theory and green development theory, the driving mechanisms of digital economy-driven green development are explored in depth, as shown in Figure 4.
The digital economy accelerates the rationalization of industrial structures and becomes an intelligent engine for achieving green growth. Industrial structure rationalization looks at how well different industries are growing and working together. This is done by measuring the difference in labor productivity between the three biggest industries [31]. The smaller the disparity in labor productivity between industries, the more rational the industrial structure. The digital economy has a significant impact on the Chinese industrial system due to its strong penetration, broad coverage, and high innovation [2]. First is the introduction of new digital technologies to the market. The popularization and application of artificial intelligence, cloud computing, and mobile Internet have aided the growth and industrial transformation of the new industries represented by digital industries [32]. Second, the integration of digital technology and traditional industries fosters a great deal of innovation, and traditional industries gradually realize digital transformation and enhance the operational efficiency of the entire industrial chain [33,34]. Third, the development of digital industrialization and industrial digitization eliminates the time and space constraints of factor flow and product transactions, improves production and service efficiency, and accelerates the industrial structure rationalization process [35]. The evolution of the industrial structure in tandem with intelligent digital technology improves resource allocation efficiency, reduces dependence on traditional factors, and propels the green transformation of the economy. Digital wisdom service applications eliminate information and market barriers, thereby accelerating the information transfer and factor flow in the four major links of product production, distribution, exchange, and consumption, thereby enhancing the economic operation’s efficiency. Digital platforms connect multiple industrial chains; fully integrate and utilize diverse resource elements; reduce transaction, information acquisition, learning, and technology dissemination costs; and enhance resource allocation effectiveness.
The popularity of digital technology has significantly increased the capacity for green innovation and has become the driving force behind green development. The expansion of digital-economy-related industries has facilitated the popularization and perfection of new digital infrastructure, accelerated innovation iteration and technology spillover, and facilitated the development of green technology [36,37]. Digital factors’ economies of scale and low marginal costs, for example, reduce the cost of innovation and stimulate its development. In addition, digital technology facilitates communication and collaboration among multiple innovation agents, accelerates the rate of reinvention, and enhances the dissemination and application of innovation outcomes [38]. Green innovations rich in new ideas and technologies lead to high-efficiency production patterns, realize efficient use of resources and effective pollution reduction, and propel the green transformation of economic development [39]. Recent innovation in green technology has yielded new products, processes, and services that have effectively increased resource utilization efficiency, reduced ecological and environmental damage, and bolstered China’s green development.
The digital economy provides opportunities to improve energy consumption patterns and is essential to the development of a green economy. According to Newell et al. [40], the nature of continuous improvement in energy efficiency stems from technological advancements and technological spillovers. The growth of the digital economy has affected both the supply and demand sides of the energy consumption sector technologically [41]. Supply-wise, the application of new digital technologies has increased the efficiency of technology level utilization and shortened the renewable energy R&D cycle. The proportion of clean energy in the total energy supply is growing, and the structure of energy consumption is becoming greener. The growth of clean energy contributes to the transformation of the energy consumption structure [42,43]. Demand-wise, the intelligent services of information networks make paperless offices, online education, and online medical care a reality and facilitate their gradual spread. Human activities and communication that are dematerialized directly reduce energy consumption and material demand. The energy consumption suppression effect and energy clean-up effect generated by the development of the digital economy alleviate the problem of energy resource scarcity and promote the green development of cities [23].
The digital economy drives the structural transformation to reduce environmental pollution and achieve green and sustainable development. Combining advanced technical support with strict environmental regulations and governance is a two-pronged strategy to speed up the improvement and refinement of business production processes and reduce environmental pollution [44]. For starters, the digital economy encourages the radical transformation of industrial production techniques, utilizing emerging digital technologies to achieve standardization and precise control of production resource elements. The rapid transmission and processing of data can accelerate the production scheduling response, reduce the control interval, and achieve quality and efficiency improvement, energy conservation, and pollution reduction [45]. In addition, new digital technologies are rapidly overcoming obstacles to environmental quality regulation. Utilizing cloud computing and remote sensing technology, government agencies can monitor pollution emissions, water quality, and air quality in real time [46,47]. Accurate and efficient environmental monitoring facilitates the formulation of precise environmental policies and greatly improves the ecological and environmental governance of the government.

3. Study Design

3.1. Model Setting

Based on the preceding relevant theoretical discussions, a benchmark regression model is developed to determine if the digital economy promotes urban green development. The base regression model is configured as follows:
Y i t = α 0 + α 1 X i t + j = 1 n λ j Z i t + δ i + γ t + ε i t
In Equation (1), the subscripts i, t reflect the values of the variables for city i in year t; Zit denotes the set of control variables; δi represents area-fixed effects; γt represents time-fixed effects; and εit represents a random disturbance term.
The baseline regression only considers the mean effect. Does the digital economy produce the same results in cities with varying degrees of green growth? To answer this question, this study further develops the analysis using quantile regression models [48]. The quantile regression model is shown in Equation (2).
Q τ ( Y i t ) = χ 0 ( τ ) + χ 1 ( τ ) X i t + j = 1 n λ j Z i t + δ i + γ t + μ i t
Here, χ ( τ ) represents the coefficient at the τ quantile, and μit represents the random interference term. Other variables have the same meaning as in Equation (1).
To learn more about how the digital economy affects the green development of cities, a model of mediating effect is used to test indicators of industrial structure rationalization, green technology innovation, energy use efficiency, and environmental pollution. The structure of the model is as follows:
M i t = β 0 + β 1 X i t + j = 1 n λ j Z i t + δ i + γ t + ν i t
Y i t = α 0 + α 1 X i t + α 2 M i t + j = 1 n λ j Z i t + δ i + γ t + ω i t
Here, Mit represents the mediation variable, and νit and ωit represent the random interference term of Equations (3) and (4), respectively. Other variables have the same meaning as in Equation (1).

3.2. Variable Setting

3.2.1. The Explained Variable

In this study, the green development level of cities is measured by the green total factor productivity index (GTFP). Following the measure of Li and Chen [49], based on the super-efficient Slack Based Measure (SBM) model, the global Malmquist–Luenberger index (GML) is used to measure the GTFP of Chinese cities.
First, a super-efficient SBM model including non-desired outputs is constructed, drawing on Li and Shi [50]. It is assumed that urban production activities are derived by inputting multiple factors of production to obtain various desired and undesired outputs. Then the input–output model corresponds to n inputs, m1 desired outputs, and m2 undesired outputs. The set of production possibilities containing non-desired outputs is constructed based on the environmental technology framework, and the optimal production technology frontier is set by each city as a decision unit each year. The set of environmental technologies to measure the efficiency of the green economy is shown in Equation (5).
P P S = { ( A ¯ , B ¯ , C ¯ ) A ¯ j = 1 j 0 L λ j a j , B ¯ j = 1 j 0 L λ j b j , C ¯ j = 1 j 0 L λ j c j , L e λ μ , λ j 0 }
In Equation (5), A denotes the n-dimensional input vector, B denotes the m1-dimensional desired output vector, and C denotes the m2-dimensional non-desired output vector. A = ( a 1 , a 2 , , a L ) R + n , B = ( b 1 , b 2 , , b L ) R + m 1 , and C = ( c 1 , c 2 , , c L ) R + m 2 . A and B meet the strong disposability condition, and C meets the weak disposability condition. In this paper, the vector s n R + n is used to indicate too many inputs, vector s m 2 R + m 2 to indicate too many non-desired outputs, and vector s m 1 R + m 1 to indicate insufficient desired outputs. Then, the super-efficient SBM model is constructed as follows:
ρ = min λ , a ¯ , b ¯ , c ¯ i = 1 n a i ¯ a i o 1 m 1 + m 2 ( r = 1 m 1 b r ¯ b r o + k = 1 m 2 c k ¯ c k o )   s . t . A ¯ j = 1 j 0 L λ j a j , B ¯ j = 1 j 0 L λ j b j , C ¯ j = 1 j 0 L λ j c j A ¯ a 0 , B ¯ b 0 , C ¯ c 0 B ¯ 0 , C ¯ 0 , L e λ μ , λ j 0 a i ¯ = a i o + s n ( i = 1 , , n ) b r ¯ = b r o s m 1 ( r = 1 , , m 1 ) c k ¯ = c k o + s m 2 ( k = 1 , , m 2 )
In Equation (6), a i o , b r o , and c k o denote the original values of the evaluated unit, while a i ¯ , b r ¯ and c k ¯ are the corresponding target values.
Based on the concept of Donghyun Oh [51], the global Malmquist–Luenberger (GML) index is constructed to measure GTFP to improve the model’s rationality and accuracy. The conventional ML index may have issues with linear programming non-solution and non-transmissibility, whereas the GML index ameliorates these issues. In addition to measuring the distance between desired output and the frontier of maximizing positive efficiency, the GML index can also measure the distance between non-desired output and the frontier of minimizing negative efficiency, which is entirely consistent with the new concept of green development. The GML index is defined by the formula shown below.
G M L t , t + 1 = 1 + S V G ( a t , b t , c t ; g ) 1 + S V G ( a t + 1 , b t + 1 , c t + 1 ; g )
S V G ( a , b , c ) = max { β | ( b + β b , c β c ) P G ( a ) }
Equation (8) represents the full directional distance function of the global production possibility set. a, b, and c represent the input vector, the desired output vector, and the undesired output vector, respectively. g is the direction vector.
The GML index can be decomposed as one product of technical efficiency change (EFFCH) and technical progress change (TECH). It is given by the following formula.
G M L t , t + 1 = E F F C H t , t + 1 × TECH t , t + 1
E F F C H t , t + 1 = 1 + S V t ( a t , b t , c t ; g ) 1 + S V t + 1 ( a t + 1 , b t + 1 , c t + 1 ; g )
TECH t , t + 1 = 1 + S V G ( a t , b t , c t ; g ) 1 + S V t ( a t , b t , c t ; g ) × 1 + S V t + 1 ( a t + 1 , b t + 1 , c t + 1 ; g ) 1 + S V G ( a t + 1 , b t + 1 , c t + 1 ; g )
Input–output analysis methods were used to measure the GML index. As input indicators, the primary input factors in economic activities were utilized. In this study, four indicators were chosen as input variables for each city: the number of employees, capital stock, total energy consumption, and built-up area. By selecting the city’s real GDP, the desired output index was determined. Real GDP was calculated by adjusting nominal GDP to 2006 as the base year. The undesirable outputs of economic activity were environmental pollutants. Three indicators of industrial wastewater, soot, and sulfur dioxide emissions were selected as non-desired output variables [52].
Based on the above measurement principles and indicator data, this study used MaxDEA 7 Ultra software to measure the GTFP of 284 cities in China from 2011–2019.

3.2.2. The Core Explanatory Variable

Refer to the digital economy (DE) indicators and measures published by the China Academy of Information and Communication Research [53] and Tencent Research Institute [54]. Moreover, we compare the digital economy measurement index system developed by Xu and Zhang [55] and Wang et al. [56] with China’s actual development. Considering the connotation and attributes of the DE, as well as the availability and comparability of data. This study develops an evaluation index system consisting of thirteen sub-indicators from four dimensions: digital infrastructure, digital scientific research support, digital industry development, and digital financial development. Table 1 demonstrates that all the system’s indicators are positive.
In this study, each indicator is assigned a weight using the entropy method of the objective assignment method. The value of each indicator after the standardization process and the final weights are linearly weighted and summed to obtain the digital economy development level index. The specific calculation steps are as follows:
Step 1: Standardization of indicators. The scale and order of magnitude of the above indicators differ significantly. Prior to ensuring the cross-sectional comparability and utility of the indicators, it is necessary to standardize the data. Since all the indicators are positive, the following processing formula applies:
Z i j = a i j min { a i j } max { a i j } min { a i j } , i = 1 , , n , j = 1 , , k
In Equation (12), Z i j is the standardized value of indicator j of city i; a i j is the corresponding original value.
Step 2: For each indicator, objective weights are determined.
Calculate the weight of indicators.
φ i j = z i j 1 n Z i j , i = 1 , , n , j = 1 , , k
Calculate the information entropy of the indicator.
e j = 1 ln n 1 n φ i j ln φ i j , j = 1 , , k
Calculate the information entropy redundancy.
d j = 1 e j , j = 1 , , k
Calculation of indicator weights.
w j = d j 1 k d j , j = 1 , , k
Step 3: Calculate the digital economy development level index.
D E i = j = 1 k w j Z i j , i = 1 , , n , j = 1 , , k

3.2.3. Mechanism Variables

(1) Industrial structure rationalization level (ISR). Learning from Zhu et al. [18], the logarithm of the inverse of the Thayer index is used to measure industrial structural rationalization. The smaller the Thiel index is, the stronger the coordination among industries and the more reasonable the industrial structure is. Therefore, the larger the ISR, the higher the industrial structure rationalization level.
T L = ( Y i Y ) ln ( Y i L i / Y L )
I S R = ln ( 1 T L )
Here, TL denotes the Theil index. Y denotes gross product. L is total employment. Yi is value added in industry sector i. Li is the number of people employed in industry sector i.
(2) Green technology innovation (Invention). The logarithm of green invention patent applications in cities indicates the green technology innovation level [57]. The larger the Invention, the higher the green technology innovation level.
(3) Electricity consumption (ELE). The logarithm of urban electricity consumption per unit of GDP indicates energy use efficiency. The lower the electricity consumption, the more efficient the energy use.
(4) Environmental pollution (Pollution). Drawing on the extensive practice of established literature [58], the environmental pollution index is obtained from a comprehensive measure of industrial sulfur dioxide, wastewater, and soot emission indicators.

3.2.4. Control Variables

(1) Economic development level (Pgdp). The faster a city’s economic growth, the more favorable it is to attract resources, capital, and talent and to have a stronger foundation for the realization of green development. In this study, the GDP per capita of each city is used as an indicator of economic development level, and logarithmic treatment is applied [14].
(2) Living standard of the residents (Liv). The higher the residents’ standard of living, the greater their pursuit of eco-friendly, healthy, and convenient lifestyles. GTFP will be directly impacted by residents’ efforts to conserve energy and decrease emissions. In this study, the logarithm of residents’ year-end financial institution deposit balances is used to determine their standard of living.
(3) Degree of government fiscal intervention (Gov). By adjusting fiscal spending and tax policies, the government intervenes in the market economy. These intervention measures can create a general environment for the development of green transformation and direct businesses to change the direction of technological advancement, which is conducive to achieving green development. In this study, the ratio of budgeted revenues to expenditures is used to evaluate municipal fiscal decentralization, which represents the extent of government fiscal intervention [2].
(4) Regional tax base size (Rtax). The larger the amount of VAT payable, the more capable enterprises are to realize green transformation and upgrading. To determine the size of the regional tax base, the current year’s VAT payable by industrial enterprises above city scale is used in this study. Using the extreme value method, Rtax is normalized to prevent pseudo-regression.
(5) Population size (Popul). Population density is strongly associated with resource consumption, economic growth, and pollution emissions in urban areas. Consequently, population changes will also have some effect on GTFP. In this paper, the urban population is measured using the logarithm of the total year-end population.
(6) Infrastructure (Inf). Urban road infrastructure enhancements can aid in reducing transportation times, traffic congestion, and transportation costs. This has a positive effect on GTFP. In this study, the logarithm of urban road area is chosen as the measure of infrastructure [12].

3.3. Data Description

This paper selects panel data of 284 prefecture-level and above cities in China from 2011–2019 as the research object, removes the samples with serious missing indicator data, and collates 2556 samples from 284 cities. Among them, the data on mechanism variables, data on control variables, and data on relevant indicators for measuring GTFP and the DE are mainly obtained from the China City Statistical Yearbook, China Environment Statistical Yearbook, China City Construction Statistical Yearbook, and China Regional Economic Statistical Yearbook. Data on the coverage breadth, usage depth, and digitization level of digital inclusive finance were obtained from Guo et al. [59]. Data on the number of urban invention patent applications were collected and collated through the database of the State Intellectual Property Office of China (SIPO) website. A small amount of missing data were supplemented using linear interpolation. Table 2 displays the descriptive statistics of the variables used in the empirical analysis.

4. Empirical Results and Discussion

4.1. Distribution Dynamics of the Digital Economy

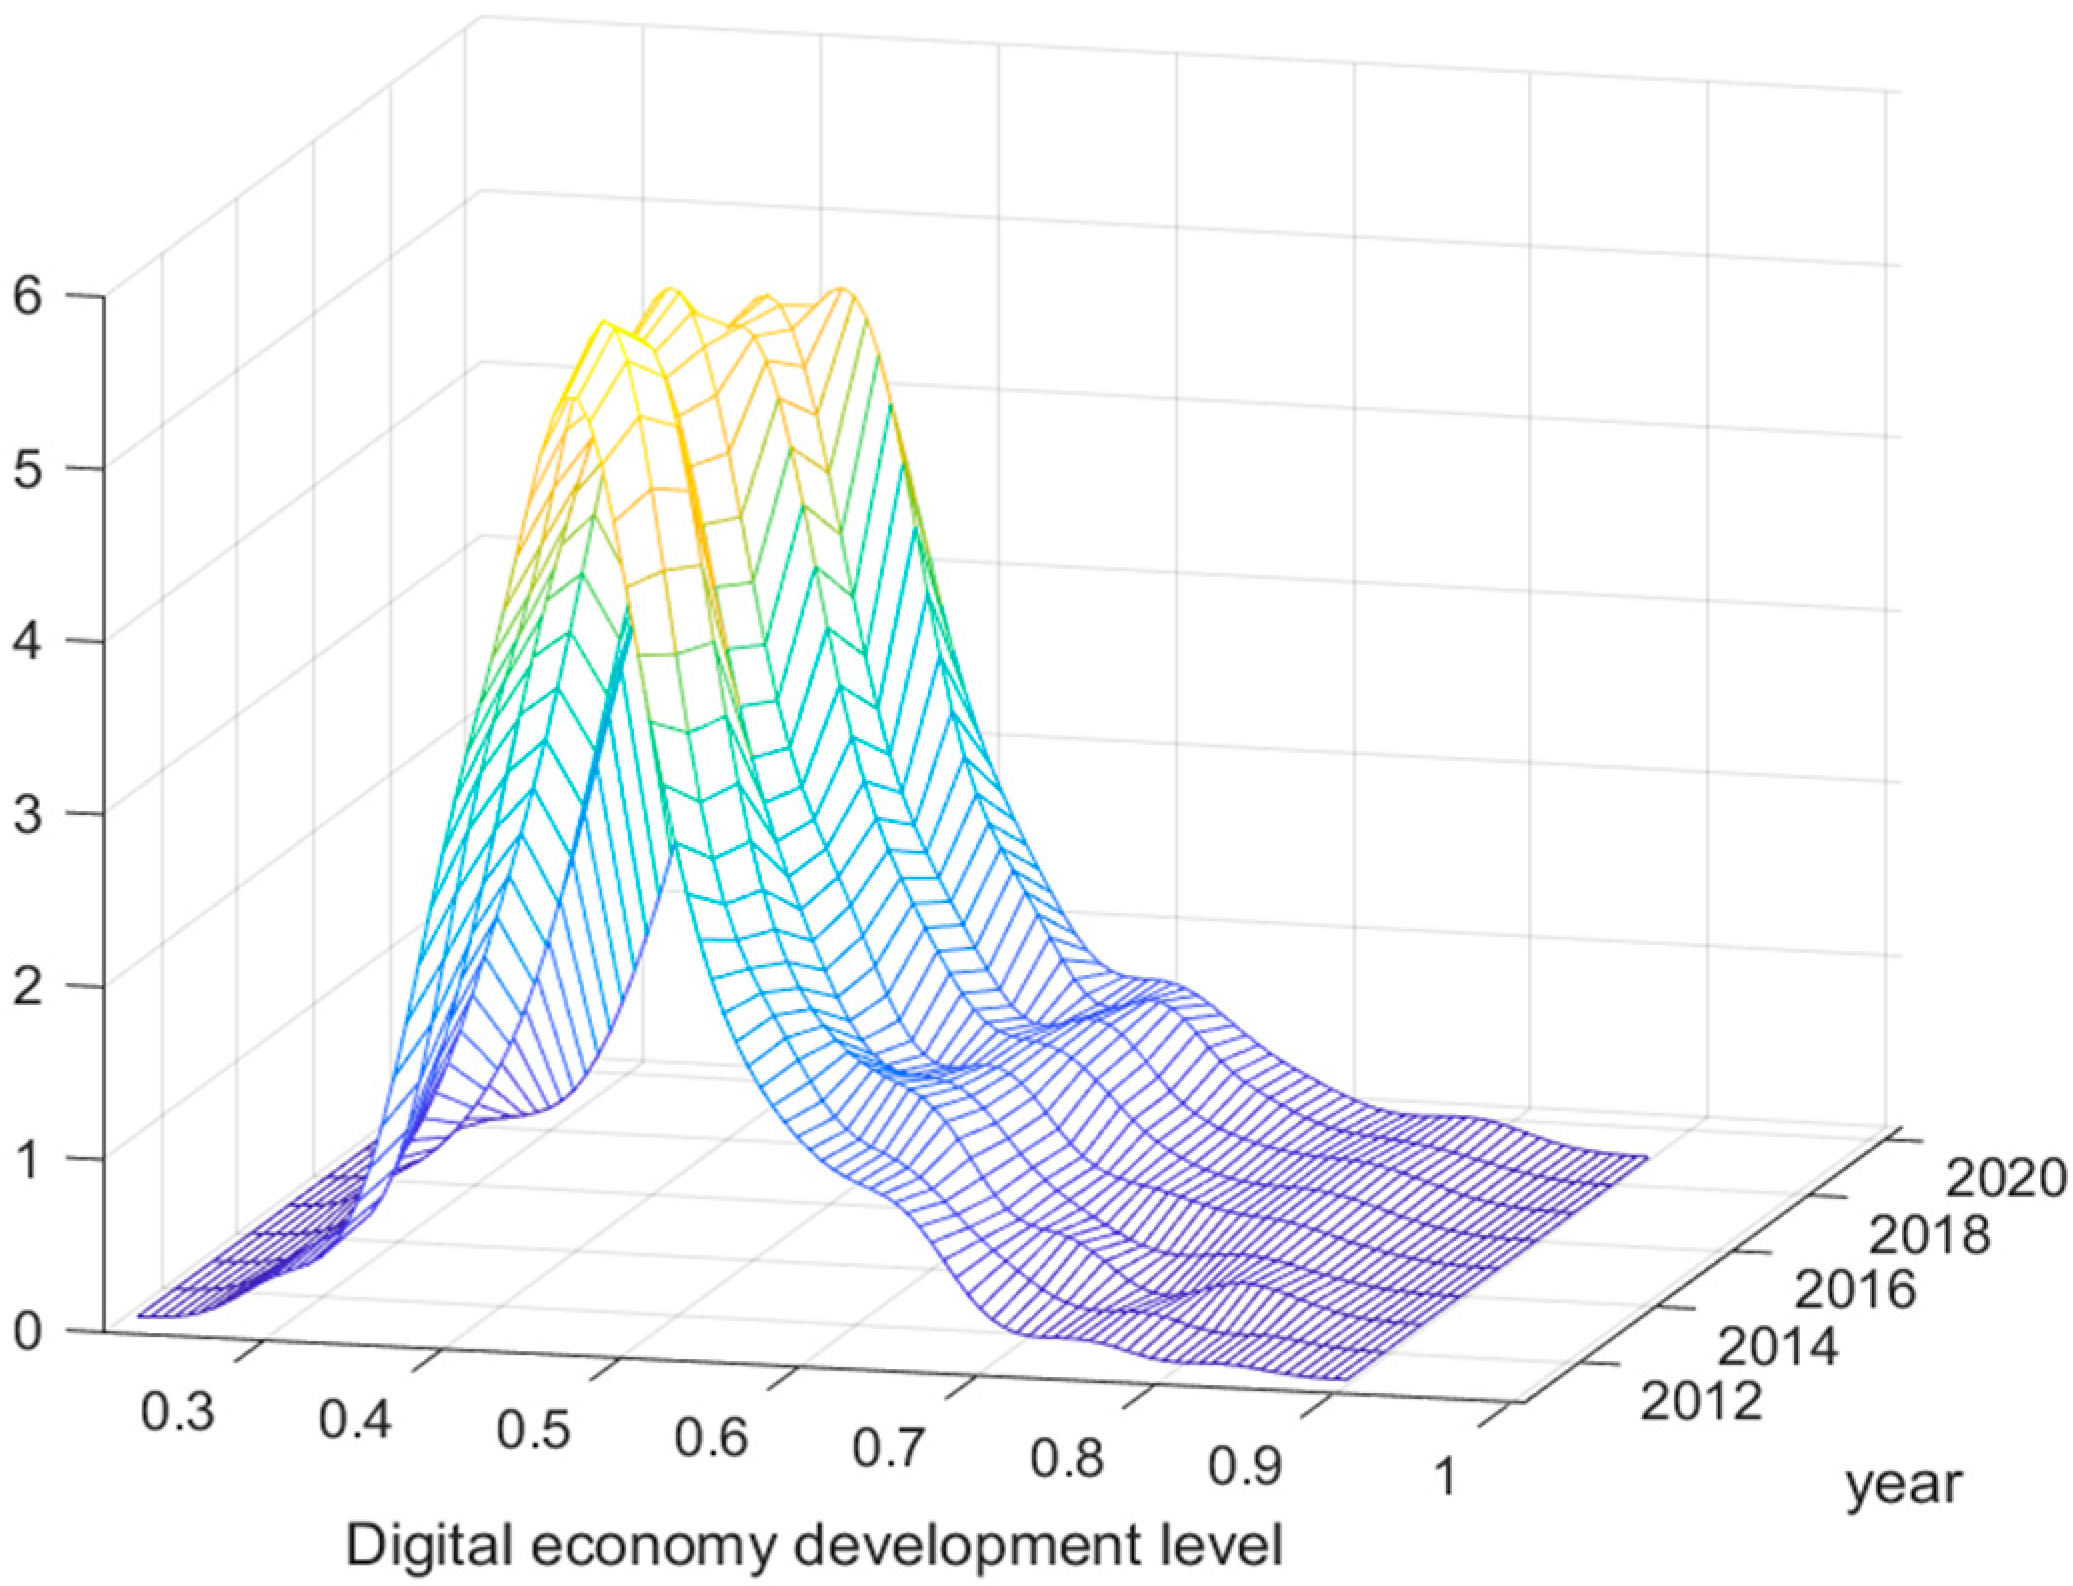
This section employs a nonparametric kernel density estimation method to analyze China’s digital economy’s dynamic evolution pattern. Figure 5 illustrates a three-dimensional dynamic kernel density map of the digital economy in 284 cities created with MATLAB 2021 software to visualize the development dynamics, distribution evolution, and extension trend of the digital economy during the sample period.
As the year progresses, the distribution curve shifts to the right from its initial position. It indicates that the overall growth of China’s digital economy continues to trend upward. In terms of distribution extension, the distribution curve clearly displays a right-trailing characteristic. It demonstrates that the DE in certain cities is significantly higher than the national average. For instance, Beijing, Shanghai, Shenzhen, and other cities began developing their digital economies early and quickly, placing them ahead of the majority of Chinese cities. From the height of the distribution, the size of the central peak of the curve exhibits a fluctuating upward trend, while the width of the curve exhibits a general trend of narrowing. This suggests that the degree of DE dispersion is decreasing, the gap between cities is gradually closing, and the “digital divide” phenomenon has been alleviated. Consequently, the DE in Chinese cities exhibits a dynamic evolution characterized by a continuous rise in the overall level and a gradual narrowing of the gap between cities.

4.2. Benchmark Model

This study investigates whether the digital economy can contribute to the sustainable growth of cities. In addition to the previously mentioned influencing factors, such as the control variables, the characteristic variables of each region can also affect the GTFP. And, unlike the random-effects model, the fixed-effects model can compensate for the resulting omitted variables. The Hausman test was used to determine whether to use a model with fixed or random effects. The Hausman test cardinality was 82.79, with a concomitant probability of 0.0000. Therefore, a model with fixed effects was chosen for the subsequent analysis.
Table 3 shows the results of the benchmark regression. In particular, columns (1) and (2) verify the effect of the DE on GTFP without specifying region or year. The results demonstrate, at a significance level of 1%, that the DE can increase GTFP regardless of the presence of control variables. Panel data are susceptible to the autocorrelation of nuisance terms in the time dimension and regional dimension, which leads to estimation errors and robust standard errors. Therefore, the time and location effects must be managed. In addition, it considers that the implementation of economic development and environmental protection policies, among others, may result in common shocks for cities within a region in a given year. A “region-year” fixed effect is added, following the method of Liu and Kong [60]. Column (3) reports the results of using two-way fixation without adding control variables. Column (4) adds control variables and fixes the year. Column (5) fixes the region and year in both directions. Column (6) reports the estimation results with region, year, and “region-year” fixed. The regression results of the DE on GTFP are all significantly positive, indicating that the DE can enhance GTFP to a certain extent. As shown in model (6), each unit increase in the DE promotes 0.151 units of GTFP growth. It validates the theory that the digital economy can drive urban green development.

4.3. Endogeneity Test

In this study, the issue of endogeneity cannot be ignored. On the one hand, GTFP and the DE are comprehensive indices that cover a wide range of indicators, which may cause endogeneity issues due to measurement errors. In addition, it is difficult for the selected control variables, such as economic development level, population size, and infrastructure, to account for GTFP’s whole impact. And the unaccounted-for variables are included in the error term, which may be affected by the issue of omitted variables. The improvement in GTFP, on the other hand, benefits from the DE, while the green technological progress represented by GTFP may also drive the DE. Therefore, a reverse causal relationship may exist between the two. Consideration is given to the possibility of omitted variables and reciprocal causality problems in the model. This study tries to mitigate the potential endogeneity effects through the instrumental variables approach.
The instrumental variables of the DE were constructed along the lines of Nunn and Qian [61] and Huang et al. [62]. The number of telephones per 10,000 people in each city in 1984 is used to construct an interaction term with the number of national Internet users in the previous year to obtain an IV (Tel) in panel form that matches this study. On the one hand, the DE relies on the traditional electronic communication industry, and the past telecommunication infrastructure of cities, such as telephone line access and fiber-optic broadband penetration, affects the subsequent application of digital information technology in terms of technology level and usage habits. On the other hand, fixed-line telephones are being gradually replaced by cell phones, which have a diminishing impact on economic development and have no direct effect on the present-day GTFP. Therefore, Tel satisfies the relevance and exogeneity requirements of IV.
This section adopts the 2SLS model. Columns (1) and (2) in Table 4 show the results of the first and second-stage regressions, respectively. From column (1), the instrumental variable Tel is significantly and positively correlated with the DE, satisfying the correlation hypothesis. Column (2) shows that after accounting for endogeneity, the DE still contributes significantly to the improvement of GTFP, and the outcomes are effective at the 1% significance level. Meanwhile, the Kleibergen–Paap rk LM statistic in the instrumental variable unidentifiable test was 22.47 with a p-value of 0.000, significantly rejecting the original hypothesis. The Kleibergen–Paap rk Wald F statistic is 131.509, which is higher than the thresholds at the 10% level of the Stock–Yogo weak identification test. This indicates that the choice of IV1 is reasonable.
This study uses the quantity of post offices at the 1993 year-end in each city and the national revenue of information transmission, software, and information technology services in the previous year as the cross-multiplier term, which constitutes an instrumental variable for the DE. Post and telecommunications infrastructure can impact Internet IT usage and information infrastructure construction, which is thus closely related to the DE. Historically, areas with a high density of post office outlets tend to have a faster-growing digital economy, meeting the correlation condition. And the post office numbers in 1993 in each city do not directly affect the present-day GTFP, satisfying the exogeneity condition. Post passes the Kleibergen–Paap rk LM test and the Kleibergen–Paap rk Wald F test, showing that the choice of IV2 is reasonable. Columns (3) and (4) show the first and second-stage regression results, respectively. And the model regression coefficients are significantly positive, verifying the reliability of the baseline regression results.

5. Robustness Test

5.1. Quantile Regression Results and Analysis

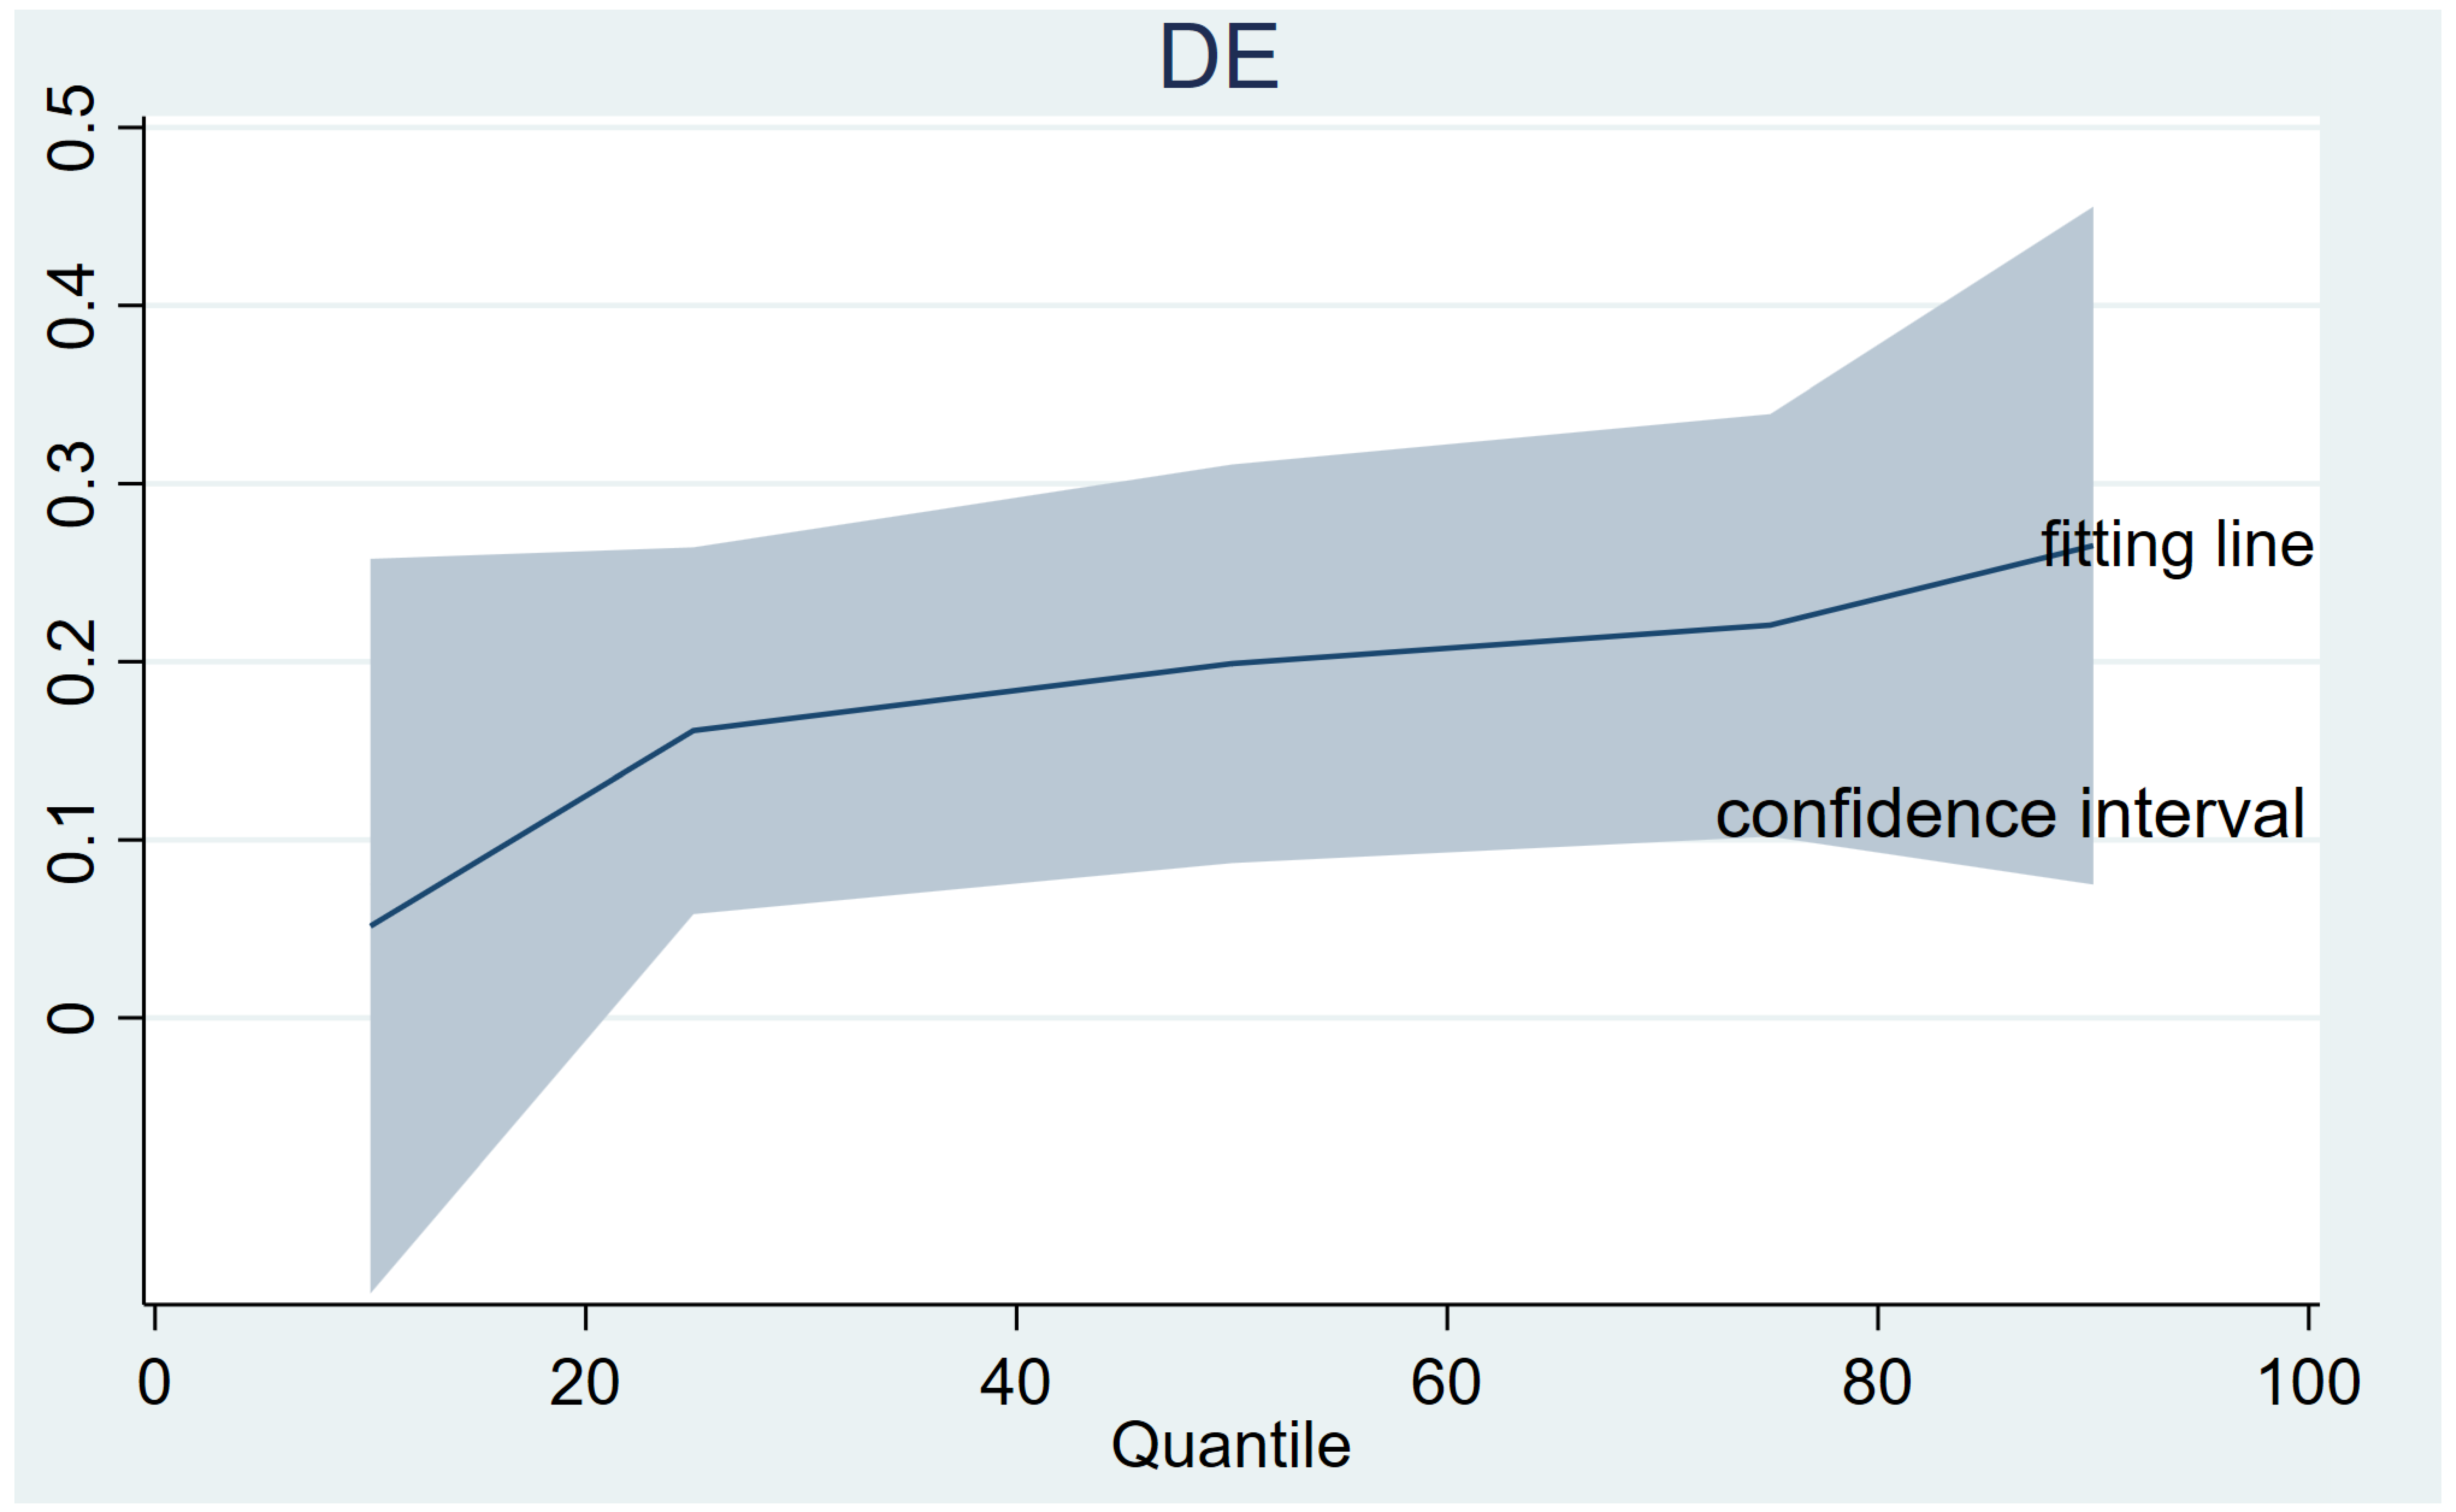
The benchmark regression explored the conditional expectation of the DE on GTFP. However, the effect of the DE on the range of variation and conditional distribution of GTFP is still unknown to us. Therefore, this study uses quantile regression methods to further discuss the relationship between the DE and GTFP at different quantiles. Five representative quantiles of 10%, 25%, 50%, 75%, and 90% were selected to perform the regression to avoid the effect of extreme values. The results are shown in Table 5. At the 10, 25, 50, 75, and 90 quantiles of GTFP, the impact coefficients of the DE are 0.052, 0.161, 0.199, 0.221, and 0.265, respectively, showing a clear upward trend. The coefficients of all quantiles are significant at the 1% level, except for the 10th quantile.
Observing the quantile regression results in Figure 6, we can draw two conclusions. First, the DE has a significant promotion effect on GTFP from an overall perspective, which further verifies the robustness of the above findings. Second, there is a difference in the contribution of the DE to GTFP; the higher the GTFP of cities, the more vital the positive contribution played by the DE. Analyzing the reasons, first, cities with higher GTFP have industries that are mostly high-tech and service industries. The higher the level of the industry, the less dependent it is on resources. The digital economy can quickly integrate deeply with industries, amplify digital dividends, and smooth the way to drive the city’s GTFP enhancement. Second, cities with a higher GTFP tend to invest more in green innovation. This results in a higher capacity for green technology innovation, which enables them to respond quickly to the changes brought about by digitalization in productive life. The digital economy is better able to bring out the green development effect.

5.2. Long-Term Impact Analysis

This study considers that the improvement of GTFP is not only influenced by the DE in the current year but may also be influenced by the continuous effect generated by the DE in the previous year or the past years. To measure the long-term net impact of the DE on GTFP, this study regresses the lagged one, two, three, and four periods of the DE on GTFP. The control variables are added to the model while fixing the region, year, and “region-year”. The results are shown in columns (1) to (5) of Table 6.
The regression results for lagged one, two, and three are all significant, at least at the 5% level, while the regression results for lagged four are not significant. It indicates that both current and past periods of the DE have had a significant positive effect on GTFP. The regression coefficients of the DE, L.DE, L2.DE, and L3.DE on GTFP are 0.151, 0.185, 0.179, and 0.157, respectively. The coefficients of the lagged periods decrease as the number of lagged periods increases, and they are all greater than those of the current period. This indicates that the long-term effect of the DE on GTFP is greater than the short-term effect. However, the long-term effect gradually diminishes with the passage of time. This also validates the theoretical mechanism of the above to some extent. That is, the DE indirectly influences the GTFP through mediating factors, so some time is needed for the partial effect to be realized.

5.3. Excluding the Impact of Municipalities

In China, municipalities are provincial administrative units. In comparison to other cities in the same region, municipalities and sub-provincial cities excel in economic, political, talent, and research strengths. Consequently, the DE and GTFP of municipalities differ significantly from those of prefecture-level cities. This study refers to Chen and Chen [63] and excludes municipalities and sub-provincial cities, retaining only the sample of prefecture-level cities for regression tests. This increases the comparability of the samples and the reliability of the regression findings. The results are reported in column (6) of Table 6. Excluding the sample of municipalities and sub-provincial cities, the regression coefficient of the DE on GTFP is 0.129 and significant at the 5% level, confirming the conclusion that the DE contributes significantly to GTFP and demonstrating the robustness of the regression results.

6. Heterogeneity Analysis

6.1. Regional Heterogeneity

There are objectively distinct regional differences between Chinese regions due to geographical, economic, and historical factors, among others. Geographic location was used to divide the sample into eastern, northeastern, central, and western regions, and fixed-effects regression analysis was conducted separately for each region. The outcomes are detailed in Table 7. While the estimated DE coefficients remain positive for each region, estimates for the Northeast and Central are no longer statistically significant. They continue to be effective at 5% for the East and West. This is likely due to the lagging economic structure of the Northeast and Central areas, which has led to a contribution offset by the DE. In the primary industries, smart digital technologies have a low penetration rate. Difficulties in the greening of heavy industry industries. The impact of the DE will be diminished if the industrial structure is dominated by primary and heavy industries.
The regression result for the East is 0.184, which is larger than that for the West at 0.111. This indicates that the lifting effect of DE release is significantly greater in the East than in the West. There are two possible reasons for this. First, the eastern region has a better economic foundation and a well-developed digital infrastructure, and the DE scale is larger and relatively more mature. This further amplifies the positive externalities of the DE, leading to its more significant effect on the enhancement of GTFP. Second, the scarcity of digital industries and weak digital infrastructure in the west lead to the DE lagging behind the east. The lagging DE further weakens the boost to GTFP. The above analysis indicates that the impact of the digital economy on green development in China is indeed characterized by regional heterogeneity.

6.2. City Scale Heterogeneity

The magnitude of a city reflects its population, economy, and scientific and technological concentration. We categorize sample cities with urban populations exceeding one million in 2019 as large cities and those with urban populations below one million as small cities. Table 8’s columns (1) and (2) present the results, which indicate that the DE contributes significantly to GTFP in large cities but has no significant effect in small cities. In other words, the effect of the DE on GTFP varies across cities of varying sizes.
Large cities have the first-mover advantage of digital economy development, which can promote green development more steadily than in small cities. There are two possible explanations. First, cities of various sizes have different perspectives on the digital economy and green development strategies. Large cities are more attuned to and responsive to emerging development strategies, which are more conducive to the integration of new industry development and the rapid spillover effects of digital economy growth. Second, large cities have scale advantages, a solid development base, and greater resource allocation efficiency. Large cities are able to rapidly absorb and apply new knowledge and technology to urban development, thereby accelerating the green transformation.

6.3. Digital Economy Level Heterogeneity

As shown in Figure 2, there are significant differences in the DE among Chinese cities. The sample cities were classified as low-level or high-level cities, using whether the DE exceeded the mean value in 2019 as the classification condition. Columns (3) and (4) of Table 8 report the regression results. The results show that there is a positive contribution from high-level cities to GTFP, but the effect of low-level cities is not significant. That is, the effect of the DE on GTFP is heterogeneous among cities with different digital economy levels. The “digital gap” exacerbates the differentiation of the effects of the digital economy.
The digital economy has failed to significantly contribute to the sustainable growth of low-level cities. There are two possible explanations. Low-level cities typically have a nascent digital economy and poorly constructed digital infrastructure. The degree of integration between digitalization and traditional industries is inadequate, preventing the digital economy from realizing its benefits. Second, it is difficult for low-level cities to take advantage of digital technology. Digitalization has had a weak impact on the structural transformation of the economy, the improvement of production efficiency, and the reduction of emissions, and has failed to significantly promote urban green development.

7. Transmission Mechanism Verification

Based on the analysis of theoretical mechanisms in the last section, this section tries to make a single framework for the study that includes the digital economy, industrial structure rationalization, green technological innovation, energy use efficiency, environmental pollution, and GTFP. Drawing on the approach of Wang [64], the mechanism of the DE’s action on GTFP was probed using a mediator model. The results are summarized in Table 9 and Table 10.
The DE can act indirectly on GTFP through industrial structure rationalization. The results are summarized in columns (2) and (3) of Table 9. The coefficient of the DE is 4.097 and significant at the 1% level, suggesting that the DE effectively promotes the ISR. Column (3) tests the effects of the ISR and the DE on GTFP. The ISR has a significant positive effect on GTFP. And the coefficient of the DE is smaller than the total effect of the DE on GTFP. According to the theory of intermediary effects, the ISR is known to exhibit partial intermediary effects when the DE affects GTFP. This is consistent with the theoretical analysis of this study.
The DE is unable to act indirectly on GTFP through the green technology innovation effect. The results are summarized in columns (4) and (5) of Table 9. The coefficient of the DE is 2.11 and significant at the 10% level, which illustrates that the DE is conducive to green technology innovation. Column (5) tests the effect of Invention and the DE on GTFP. The coefficient of Invention is not significant, but the coefficient of the DE is 0.219 and significant. It is known that the mediating effect of Invention is not valid, which is inconsistent with the conclusions of the theoretical analysis. The possible reason is that it takes some time for new inventions and technologies to be applied to a productive life [65]. Additionally, it requires time for the positive promotion effect of the DE on green technology innovation to transform into the driving force of GTFP. The impact of green technology innovation has not yet been realized at this time. Therefore, we should expedite the dissemination and application of new knowledge and technology and transform patented technology into actual productivity. The effect on the green development of the city can be realized when the green patented technology can effectively improve production efficiency and facilitate the lives of the residents [66].
Energy use efficiency fails to transmit the enhanced effect of the DE to green development. The results are summarized in Table 9, columns (6) and (7). The regression coefficient of the DE is −0.983 and significant at the 10% level. This illustrates that the DE can effectively reduce energy consumption by changing people’s production and lifestyle, thus significantly improving the efficiency of energy factor utilization. Column (7) tests the impact of ELE and the DE on GTFP. The effect of ELE is not significant, but the coefficient of the DE is still significantly positive. The mediating effect of energy use efficiency does not hold, which is inconsistent with the theoretical analysis. The possible reason is that the economic expansion resulting from the DE has increased the demand for energy consumption. At the same time, the new businesses and digital information devices generated by the DE also generate colossal energy consumption. Although the development of the digital economy reduced electricity consumption per unit of GDP, it also led to an increase in total electricity demand. When the energy-saving effect that the DE produces is less than the energy consumption effect, the DE cannot affect GTFP through the mediating factor of energy use efficiency.
The transmission mechanism of environmental pollution is established, and the test results are summarized in Table 10. Column (1) tests the effect of the DE on the combined level of environmental pollution. The coefficient of the DE is −0.139 and significant at the 1% level. The DE effectively reduces pollution. Column (2) tests the impact of Pollution and the DE on GTFP. The coefficient for Pollution is −0.326, and the coefficient for the DE is 0.171. Based on the criterion of mediating effect, it is believed that the DE does contribute to green development by reducing environmental pollution. The conclusions of the theoretical analysis are verified.
This study introduces industrial SO2, wastewater, and smoke emissions into the mediating effect model separately for testing. The results are summarized in columns (3) to (8) of Table 10. Among them, columns (3), (5), and (7) show the first-stage regression results, and the coefficients of the DE are significantly negative. It illustrates that promoting the DE can effectively reduce SO2, wastewater, and smoke emissions. Columns (4), (6), and (8) show the second-stage regression results, where the coefficients of SO2, wastewater, and smoke emissions are significantly negative. It indicates that the DE can promote GTFP by reducing industrial SO2, wastewater, and smoke emissions.
Therefore, it is reasonable to assert that the DE accelerates the spread of emerging technologies such as the industrial Internet and big data analytics and facilitates the intensive transformation of industrial production methods. The DE achieves quality and efficiency improvement, energy savings, pollution reduction, and environmental improvement via direct and indirect effects [67] and increases GTFP via multiple channels.

8. Conclusions and Insights

In this paper, using panel fixed effects analysis, quantile regression analysis, mediating effects analysis, and heterogeneity analysis, the effects of the digital economy on green development are investigated in depth, and the following conclusions are drawn:
First, in general, the DE significantly improves the GTFP [33]. However, the lifting effect of the DE varies considerably between sublocations. Cities with a higher GTFP experienced a greater uplift from the DE. At the same time, the DE has a long-term continuous effect on the GTFP. The DE has a positive impact on the GTFP both in the current year and in future years.
Second, the effect of the DE on GTFP is heterogeneous [2]. The positive effects of the DE are most pronounced in the East, where digital infrastructure is well-established, and are significantly diminished in the West. For regions in the process of economic structural transformation, such as the central and northeastern regions, the impact of the DE on GTFP is negligible. Based on the analysis of city size diversity, the effect of the DE on GTFP is realized more effectively in larger cities. Based on the analysis of level heterogeneity in the digital economy, the greater the city’s DE, the greater its contribution to GTFP.
Third, the transmission mechanism test makes it clear that some of the effects of the DE are felt through industrial structure rationalization and less pollution in the environment. Ren et al. [6] provide evidence in support of this conclusion. Although the DE has a significant impact on industrial structure, green technology innovation, energy use efficiency, and ecological pollution, green technology innovation and energy use efficiency fail to transmit the promotion effect of the DE to green development.
From the above research findings, the following three insights can be presented in this paper:
First, based on the conclusion that the digital economy can significantly boost GTFP and that its boosting effect is heterogeneous, we believe that Chinese cities should scientifically deploy the digital economy and green development strategies: enhance digital infrastructure by accelerating the construction of new facilities such as 5G communication, large data centers, cloud platforms, and artificial intelligence, for example. In addition, it promotes the integration and innovative application of digital technology with energy and the environment, and it gives birth to new green-development-related technologies and industries, increasing the impact of the digital economy as a prime mover. In the meantime, it is essential to recognize regional and urban differences in the digital economy and green development. Each province and municipality should develop the digital economy based on their unique circumstances and implement policies for differentiated growth. To avoid blind expansion and disorderly growth, the digital economy should be promoted scientifically and prudently. We should pay special attention to the needs of small and low-level cities for green development and increase policy support to help them promote green development.
Second, based on the conclusion that the digital economy can promote green development through the rationalization of industrial structure, we believe that Chinese cities should continue accelerating the integration and application of new digital technologies to bring into play the empowering effect of the digital economy on green development. We should, for example, expedite the integration of big data and traditional industries, and promote the networked, intelligent, and digital transformation of conventional industries and stimulate their potential for green development. In addition, we should increase support for the core industries of the digital economy and expedite the development of new kinetic energy for green development, and utilize digital technology, products, and services to increase the efficiency of resource utilization and reduce pollution emissions.
Finally, based on the conclusion that the transmission effect of green technology innovation and energy use efficiency is blocked, we believe that Chinese cities should stimulate the potential of green technology innovation in enhancing GTFP and maximizing the advantages of the digital economy. For one thing, while actively innovating, we should also focus on the popularization and application of new green technologies and transform the technologies into actual productivity. For another, we should use digital technology to accelerate the transformation of the energy industry: promote the exploitation and large-scale use of clean energy, optimize the allocation of energy resources, and enhance energy efficiency; deeply explore the advantages of green technology innovation in energy and resource saving; and implement the low-carbon transformation of production and life.
The following limitations exist in this research: First, due to the limited amount of data available, this paper only chooses Chinese urban panel data from 2011 to 2019 to conduct the test. The conclusions of the analysis are relatively limited. Second, the theoretical analysis of the transmission effects of the digital economy in this paper may not be adequate. In future research, scholars can combine the use of firm-level microdata with the green development effects of the digital economy, which are systematically explored at the micro and macro levels. Spatial econometric models can also be applied to measure the spatial spillover effects of the digital economy. It can be further explored whether the digital economy will have an impact on the green development of neighboring cities. Scholars can also further study the relationship between the digital economy, technological innovation, and green development.

Author Contributions

P.Z.: Conceptualization; Data curation; Methodology; Software; Writing—original draft. J.G.: Supervision; Formal analysis; Project administration; Visualization. Y.W.: Investigation; Validation; Writing—review & editing. All authors have read and agreed to the published version of the manuscript.

Funding

This research received no external funding.

Institutional Review Board Statement

Not applicable.

Informed Consent Statement

Not applicable.

Data Availability Statement

Data will be made available on request.

Conflicts of Interest

The authors declare no conflict of interest.

References

  1. Adams, B. Green Development: Environment and Sustainability in a Developing World; Routledge: Oxfordshire, UK, 2019. [Google Scholar] [CrossRef]
  2. Liu, Y.; Yang, Y.; Li, H.; Zhong, K. Digital Economy Development, Industrial Structure Upgrading and Green Total Factor Productivity: Empirical Evidence from China’s Cities. Int. J. Environ. Res. Public Health 2022, 19, 2414. [Google Scholar] [CrossRef]
  3. G20 Digital Economy Development and Cooperation Initiative. 2016. Available online: http://www.g20chn.org/English/Documents/Current/201609/P020160908736971932404.pdf (accessed on 27 June 2022).
  4. Heymann, E.; Koerner, K.; Schattenberg, M. Digital Economics: How AI and Robotics Are Changing Our Work and Our Lives. Deutsche Bank Research. 2018. ISSN: 1612-0272/ISSN (Online): 1612-0280. Available online: https://www.dbresearch.com (accessed on 14 May 2018).
  5. Karpovich, O.G.; Diakonova, O.S.; Pozharskaya, E.L.; Grigorenko, V.V. Digital Growth Points of the Region’s Green Economy in Industry 4.0: Finance and Security Issues; Industry 4.0 Palgrave Macmillan, Cham: London, UK, 2021; pp. 161–168. [Google Scholar] [CrossRef]
  6. Ren, S.; Li, L.; Han, Y.; Hao, Y.; Wu, H. The emerging driving force of inclusive green growth: Does digital economy agglomeration work? Bus. Strategy Environ. 2022, 31, 1656–1678. [Google Scholar]
  7. Chatti, W.; Majeed, M.T. Information communication technology (ICT), smart urbanization, and environmental quality: Evidence from a panel of developing and developed economies. J. Clean. Prod. 2022, 366, 132925. [Google Scholar] [CrossRef]
  8. ESCAP. The State of the Environment in Asia and the Pacific. 2005. Available online: https://www.unescap.org/sites/default/d8files/knowledge-products/SOE2005fullmainpub%20%281%29.pdf (accessed on 5 September 2022).
  9. OECD. Towards Green Growth: Monitoring Progress. 2011. Available online: https://millenniumindicators.un.org/unsd/envAccounting/ceea/meetings/UNCEEA-6-11.pdf (accessed on 10 October 2022).
  10. World Bank. Inclusive Green Growth: The Pathway to Sustainable Development, Washington; World Bank Publications: Washington, DC, USA, 2012. [Google Scholar]
  11. Albagoury, S. Inclusive Green Growth in Africa: Ethiopia Case Study; University Library of Munich: Munich, Germany, 2016; Available online: https://mpra.ub.uni-muenchen.de/id/eprint/74364 (accessed on 10 October 2016).
  12. Chen, L.; Zhang, X.; He, F.; Yuan, R. Regional green development level and its spatial relationship under the constraints of haze in China. J. Clean. Prod. 2018, 210, 376–387. [Google Scholar] [CrossRef]
  13. Yuan, J.-H.; Kang, J.-G.; Zhao, C.-H.; Hu, Z.-G. Energy consumption and economic growth: Evidence from China at both aggregated and disaggregated levels. Energy Econ. 2008, 30, 3077–3094. [Google Scholar] [CrossRef]
  14. Shang, Y.; Liu, S. Spatial-Temporal Coupling Coordination Relationship between Urbanization and Green Development in the Coastal Cities of China. Sustainability 2021, 13, 5339. [Google Scholar] [CrossRef]
  15. Tolliver, C.; Fujii, H.; Keeley, A.R.; Managi, S. Green Innovation and Finance in Asia. Asian Econ. Policy Rev. 2020, 16, 67–87. [Google Scholar] [CrossRef]
  16. Ma, Y.; Chen, S.-C.; Ruangkanjanases, A. Understanding the Antecedents and Consequences of Green Human Capital. SAGE Open 2021, 11, 2158244020988867. [Google Scholar] [CrossRef]
  17. Cao, S.; Nie, L.; Sun, H.; Sun, W.; Taghizadeh-Hesary, F. Digital finance, green technological innovation and energy-environmental performance: Evidence from China’s regional economies. J. Clean. Prod. 2021, 327, 129458. [Google Scholar] [CrossRef]
  18. Zhu, B.; Zhang, M.; Zhou, Y.; Wang, P.; Sheng, J.; He, K.; Wei, Y.-M.; Xie, R. Exploring the effect of industrial structure adjustment on interprovincial green development efficiency in China: A novel integrated approach. Energy Policy 2019, 134, 110946. [Google Scholar] [CrossRef]
  19. Kim, B.; Barua, A.; Whinston, A.B. Virtual field experiments for a digital economy: A new research methodology for exploring an information economy. Decis. Support Syst. 2002, 32, 215–231. [Google Scholar] [CrossRef]
  20. Turcan, V.; Gribincea, A.; Birca, I. Digital economy-a premise for economic development in the 20th century. Econ. Si Soci-Ologie Rev. Teor. Stiintifica 2014, 2, 109–115. Available online: https://www.elibrary.ru/item.asp?id=24502923 (accessed on 8 April 2014).
  21. Bukht, R.; Heeks, R. Defining, conceptualising and measuring the digital economy. Dev. Inform. Work. Pap. 2017, 13, 143–172. [Google Scholar] [CrossRef] [Green Version]
  22. Milosevic, N.; Dobrota, M.; Barjaktarovic-Rakocevic, S. Digital economy in Europe: Evaluation of countries’ performances. Bornik Rad. Ekon. Fak. Rij. 2018, 36, 861–880. [Google Scholar] [CrossRef]
  23. Chen, P. Is the digital economy driving clean energy development? -New evidence from 276 cities in China. J. Clean. Prod. 2022, 372, 133783. [Google Scholar] [CrossRef]
  24. Goldfarb, A.; Tucker, C. Digital Economics. J. Econ. Lit. 2019, 57, 3–43. [Google Scholar] [CrossRef] [Green Version]
  25. Schwanholz, J.; Leipold, S. Sharing for a circular economy?—An analysis of digital sharing platforms’ principles and business models. J. Clean. Prod. 2020, 269, 122327. [Google Scholar] [CrossRef]
  26. Li, H.J.; Li, Y. Understanding the new shape of the economy: A microeconomic perspective. China’s Ind. Econ. Ics 2020, 12, 159–177. (In Chinese) [Google Scholar] [CrossRef]
  27. Yuan, B.; Xiang, Q. Environmental regulation, industrial innovation and green development of Chinese manufacturing: Based on an extended CDM model. J. Clean. Prod. 2018, 176, 895–908. [Google Scholar] [CrossRef]
  28. Hasan, H.; Kazlauskas, A. Digital ecosystems: ICT’s contribution to addressing climate change. In Proceedings of the 2009 3rd IEEE International Conference on Digital Ecosystems and Technologies, Istanbul, Turkey, 1–3 June 2009; pp. 157–162. [Google Scholar] [CrossRef] [Green Version]
  29. Pauliuk, S.; Koslowski, M.; Madhu, K.; Schulte, S.; Kilchert, S. Co-design of digital transformation and sustainable development strategies—What socio-metabolic and industrial ecology research can contribute. J. Clean. Prod. 2022, 343, 130997. [Google Scholar] [CrossRef]
  30. Ulucak, R.; Danish; Khan, S.U. Does information and communication technology affect CO2 mitigation under the pathway of sustainable development during the mode of globalization? Sustain. Dev. 2020, 28, 857–867. [Google Scholar] [CrossRef]
  31. Gu, R.; Li, C.; Li, D.; Yang, Y.; Gu, S. The Impact of Rationalization and Upgrading of Industrial Structure on Carbon Emissions in the Beijing-Tianjin-Hebei Urban Agglomeration. Int. J. Environ. Res. Public Health 2022, 19, 7997. [Google Scholar] [CrossRef] [PubMed]
  32. Güler, M.; Büyüközkan, G. Analysis of Digital Transformation Strategies with an Integrated Fuzzy AHP-Axiomatic Design Methodology. IFAC-PapersOnLine 2019, 52, 1186–1191. [Google Scholar] [CrossRef]
  33. Deng, H.; Bai, G.; Shen, Z.; Xia, L. Digital economy and its spatial effect on green productivity gains in manufacturing: Evidence from China. J. Clean. Prod. 2022, 378, 134539. [Google Scholar] [CrossRef]
  34. Li, G.; Liao, F. Input digitalization and green total factor productivity under the constraint of carbon emissions. J. Clean. Prod. 2022, 377, 134403. [Google Scholar] [CrossRef]
  35. Wang, K.; Wu, M.; Sun, Y.; Shi, X.; Sun, A.; Zhang, P. Resource abundance, industrial structure, and regional carbon emissions efficiency in China. Resour. Policy 2019, 60, 203–214. [Google Scholar] [CrossRef]
  36. Jin, P.; Peng, C.; Song, M. Macroeconomic uncertainty, high-level innovation, and urban green development performance in China. China Econ. Rev. 2019, 55, 1–18. [Google Scholar] [CrossRef]
  37. Miller, P. Digital Futures †an Agenda for a Sustainable Digital Economy. Corp. Environ. Strat. 2001, 8, 275–280. [Google Scholar] [CrossRef]
  38. Yin, S.; Yu, Y. An adoption-implementation framework of digital green knowledge to improve the performance of digital green innovation practices for industry 5.0. J. Clean. Prod. 2022, 363, 132608. [Google Scholar] [CrossRef]
  39. Feng, S.; Chong, Y.; Yu, H.; Ye, X.; Li, G. Digital financial development and ecological footprint: Evidence from green-biased technology innovation and environmental inclusion. J. Clean. Prod. 2022, 380, 135069. [Google Scholar] [CrossRef]
  40. Newell, R.G.; Jaffe, A.B.; Stavins, R.N. The Induced Innovation Hypothesis and Energy-Saving Technological Change. Q. J. Econ. 1999, 114, 941–975. [Google Scholar] [CrossRef]
  41. Junior, J.A.G.; Busso, C.M.; Gobbo, S.C.O.; Carreão, H. Making the links among environmental protection, process safety, and industry 4.0. Process. Saf. Environ. Prot. 2018, 117, 372–382. [Google Scholar] [CrossRef] [Green Version]
  42. Alam, M.; Murad, W. The impacts of economic growth, trade openness and technological progress on renewable energy use in organization for economic co-operation and development countries. Renew. Energy 2019, 145, 382–390. [Google Scholar] [CrossRef]
  43. Li, C.; Chen, Y.; Shang, Y. A review of industrial big data for decision making in intelligent manufacturing. Eng. Sci. Technol. Int. J. 2021, 29, 101021. [Google Scholar] [CrossRef]
  44. Li, Z.; Wang, J. The Dynamic Impact of Digital Economy on Carbon Emission Reduction: Evidence City-level Empirical Data in China. J. Clean. Prod. 2022, 351, 131570. [Google Scholar] [CrossRef]
  45. Li, Y.; Yang, X.; Ran, Q.; Wu, H.; Irfan, M.; Ahmad, M. Energy structure, digital economy, and carbon emissions: Evidence from China. Environ. Sci. Pollut. Res. 2021, 28, 64606–64629. [Google Scholar] [CrossRef]
  46. Hampton, S.E.; Strasser, C.A.; Tewksbury, J.J.; Gram, W.K.; Budden, A.E.; Batcheller, A.L.; Duke, C.S.; Porter, J.H. Big data and the future of ecology. Front. Ecol. Environ. 2013, 11, 156–162. [Google Scholar] [CrossRef] [PubMed] [Green Version]
  47. Shin, D.-H.; Choi, M.J. Ecological views of big data: Perspectives and issues. Telemat. Inform. 2015, 32, 311–320. [Google Scholar] [CrossRef]
  48. Koenker, R.; Bassett, G. Regression Quantiles. Econom. J. Econom. Soc. 1978, 46, 33. [Google Scholar] [CrossRef]
  49. Li, Y.; Chen, Y. Development of an SBM-ML model for the measurement of green total factor productivity: The case of pearl river delta urban agglomeration. Renew. Sustain. Energy Rev. 2021, 145, 111131. [Google Scholar] [CrossRef]
  50. Li, H.; Shi, J.-F. Energy efficiency analysis on Chinese industrial sectors: An improved Super-SBM model with undesirable outputs. J. Clean. Prod. 2014, 65, 97–107. [Google Scholar] [CrossRef]
  51. Oh, D.-H. A global Malmquist-Luenberger productivity index. J. Prod. Anal. 2010, 34, 183–197. [Google Scholar] [CrossRef]
  52. Song, M.; Du, J.; Tan, K.H. Impact of fiscal decentralization on green total factor productivity. Int. J. Prod. Econ. 2018, 205, 359–367. [Google Scholar] [CrossRef]
  53. China Academy of Information and Communication Research. China Digital Economy Development Report. 2022. Available online: http://www.caict.ac.cn/kxyj/qwfb/bps/202207/P020220729609949023295.pdf (accessed on 5 October 2022).
  54. Tencent Research Institute. China “Internet+” Digital Economy Index. 2018. Available online: https://www.tisi.org/5025 (accessed on 17 August 2022).
  55. Xu, X.C.; Zhang, M.H. Research on the scale measurement of China’s digital economy—Based on the perspective of interna-tional comparison. China’s Ind. Econ. 2020, 5, 23–41. (In Chinese) [Google Scholar] [CrossRef]
  56. Wang, J.; Zhu, J.; Luo, X. Measuring the level of development and evolution of China’s digital economy. J. Quant. Tive Technol. Econ. 2021, 38, 26–42. (In Chinese) [Google Scholar] [CrossRef]
  57. Xu, J.; Cui, J.B. Low carbon city and enterprise green technology innovation. China’s Ind. Econ. 2020, 12, 178–196. (In Chinese) [Google Scholar] [CrossRef]
  58. Liang, W.; Yang, M. Urbanization, economic growth and environmental pollution: Evidence from China. Sustain. Comput. Informatics Syst. 2019, 21, 1–9. [Google Scholar] [CrossRef]
  59. Guo, F.; Wang, J.Y.; Wang, F.; Kong, T.; Cheng, Z.Y. Measuring China’s digital financial inclusion: Index compilation and spatial characteristics. China Econ. Q. 2020, 19, 1401–1418. (In Chinese) [Google Scholar] [CrossRef]
  60. Liu, X.Z.; Kong, F.X. Study on the Impact of Digital Economy Development on Green Transformation of Cities in Yangtze River Economic Zone: A Perspective of “Three Life” Space. Contemp. Econ. Manag. 2021, 43, 64–74. (In Chinese) [Google Scholar] [CrossRef]
  61. Nunn, N.; Qian, N. US Food Aid and Civil Conflict. Am. Econ. Rev. 2014, 104, 1630–1666. [Google Scholar] [CrossRef] [Green Version]
  62. Huang, Q.H.; Yu, Y.Z.; Zhang, S.L. Internet development and productivity growth in manufacturing industry: Internal mecha-nism and China experiences. China’s Ind. Econ. 2019, 35, 5–23. (In Chinese) [Google Scholar]
  63. Chen, S.Y.; Chen, D.K. Air pollution, government regulations and high-quality economic development. Econ. Res. J. 2018, 53, 20–34. Available online: http://jtp.cnki.net/Bilingual/detail/html/jjyj201802003?view=2 (accessed on 18 May 2018).
  64. Wang, H. Research on the Role and Mechanism of Digital Finance in Improving the Performance of Industrial Green Innovation. Geofluids 2022, 2022, 13. [Google Scholar] [CrossRef]
  65. Tamasiga, P.; Onyeaka, H.; Ouassou, E.H. Unlocking the Green Economy in African Countries: An Integrated Framework of FinTech as an Enabler of the Transition to Sustainability. Energies 2022, 15, 8658. [Google Scholar] [CrossRef]
  66. Zhou, G.; Zhu, J.; Luo, S. The impact of fintech innovation on green growth in China: Mediating effect of green finance. Ecol. Econ. 2022, 193, 107308. [Google Scholar] [CrossRef]
  67. Li, G.H.; Zhou, X.L. Can Promoting the Digital Economy Improve Environmental Pollution in China: A Quasi-natural 424 Experiment Based on the ‘Broadband China’ Strategy. Macroeconomics 2021, 7, 146–160. [Google Scholar] [CrossRef]
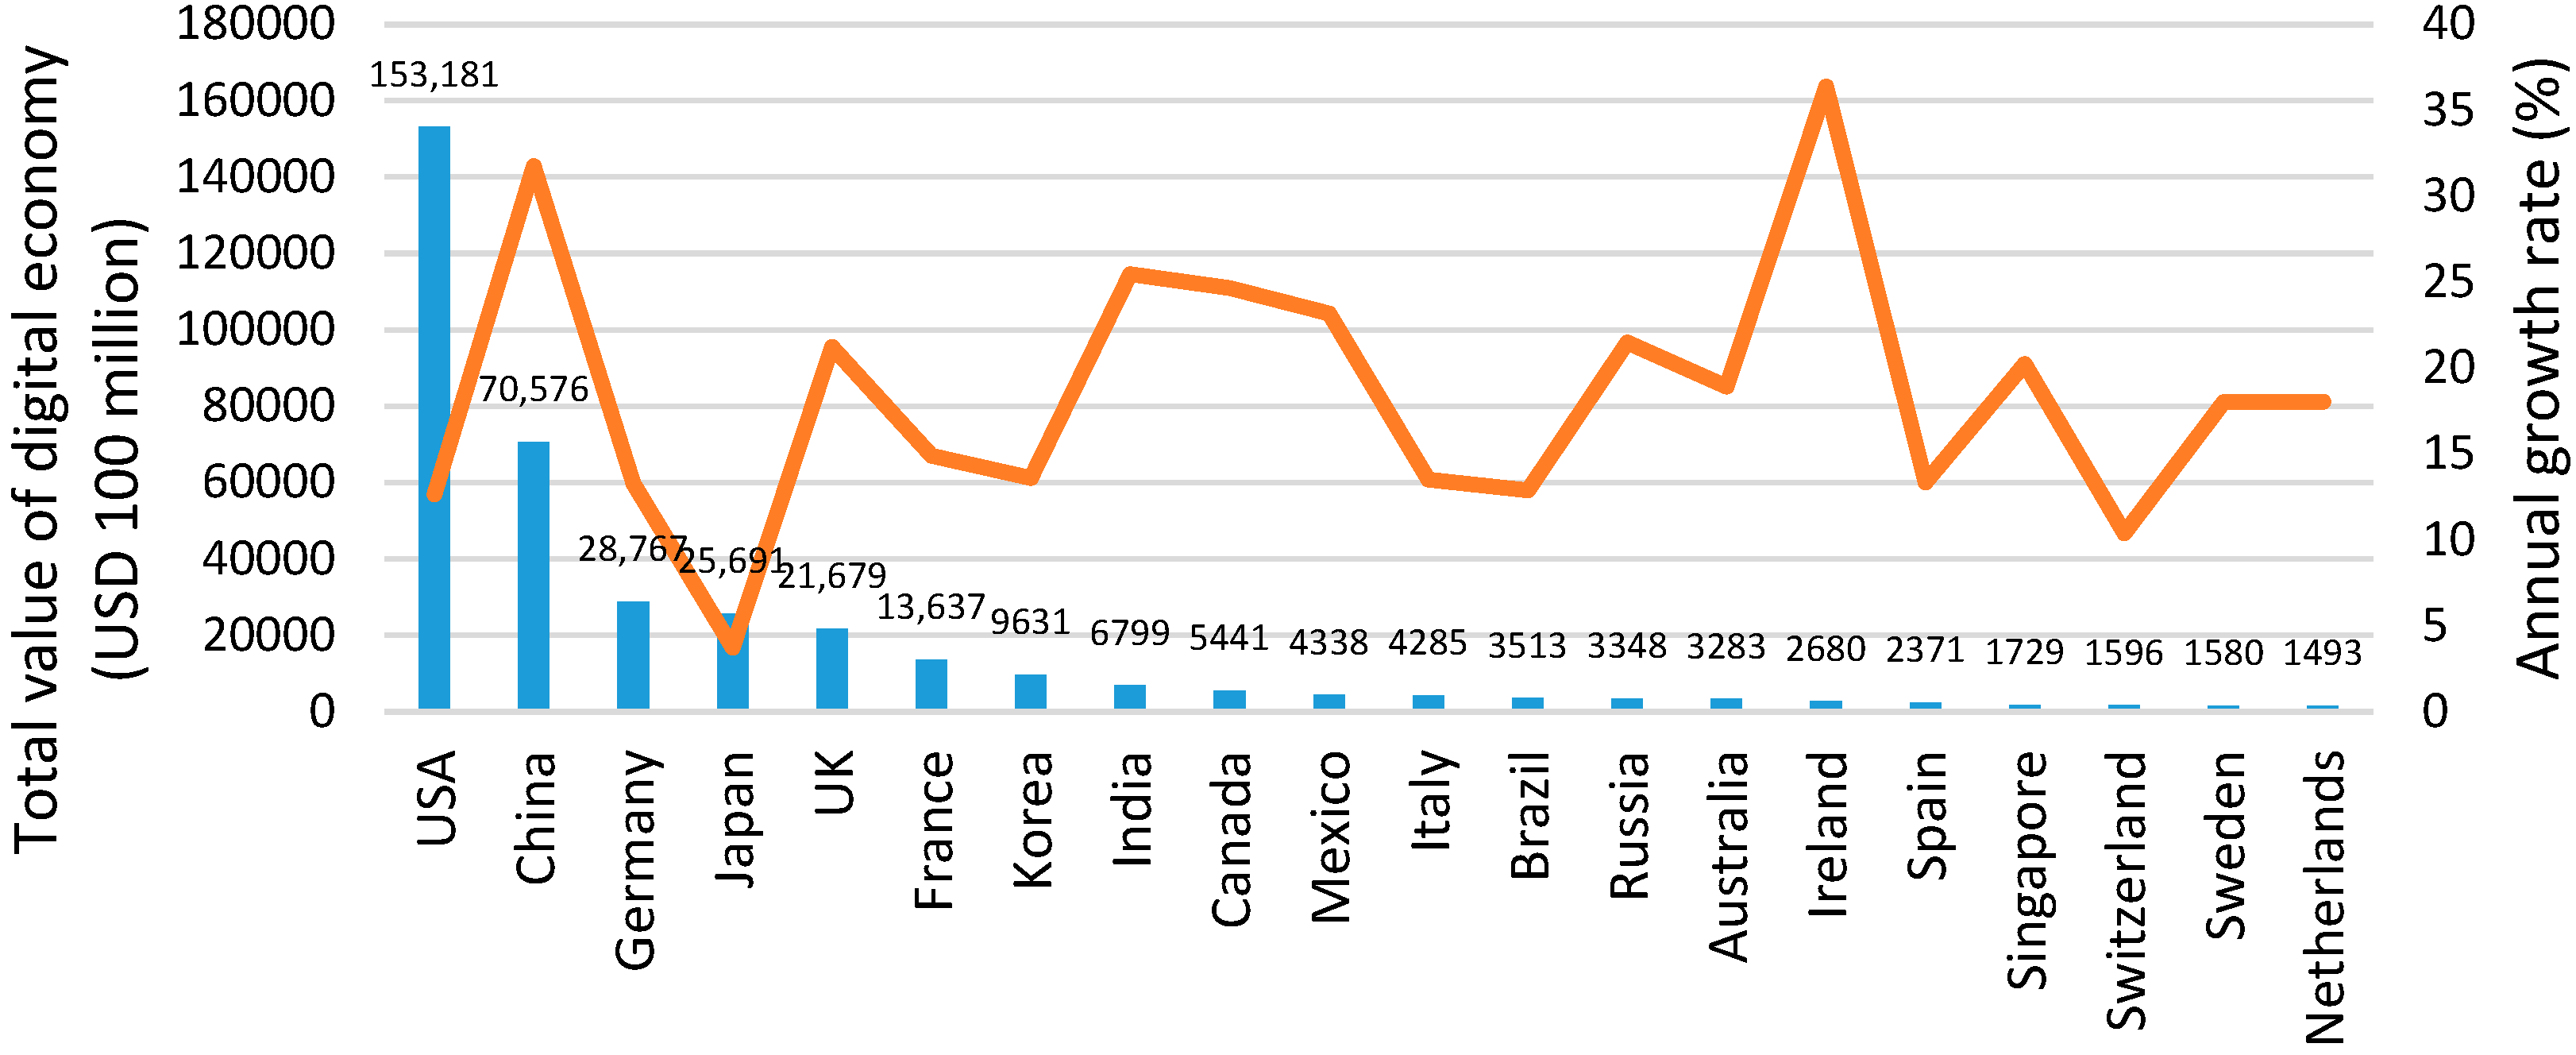
Figure 1. Digital economy size and growth rate by major countries in 2021.
Sustainability 15 11596 g001
Figure 2. Research framework.
Sustainability 15 11596 g002
Figure 3. The green attributes of the digital economy.
Sustainability 15 11596 g003
Figure 4. Mechanism analysis of the digital economy on green development.
Sustainability 15 11596 g004
Figure 5. 3D Kernel Density Map.
Sustainability 15 11596 g005
Figure 6. Quantile regression.
Sustainability 15 11596 g006
Table 1. Digital Economy Development Level Indicator System.
Target LevelCriterion LevelIndex LevelUnitIndicator Attribute
Digital economy development levelDigital Infrastructure DevelopmentNumber of international Internet users per 100 peopleHousehold/
100 people
Positive
Number of mobile phone subscribers per 100 peopleDepartment/
100 people
Positive
Digital Scientific Research SupportProportion of scientific expenditure in financial budget expenditure%Positive
Proportion of education expenditure in financial budget expenditure%Positive
Number of college studentsper 10,000 peoplePositive
Digital Industry DevelopmentTotal telecom business108 yuanPositive
Proportion of employees in information transmission, computer services, and software industries in urban employment%Positive
Proportion of employees in scientific research, technical services, and geological exploration in urban employment%Positive
Total postal business per capitayuan/personPositive
Number of employees in transportation, storage, post, and telecommunications industry104Positive
Digital Financial DevelopmentCoverage breadth—electronic account coverage__Positive
Usage depth—payments, money funds, credit, insurance, investment, credit business__Positive
Digitization level—mobile, creditworthy, and convenient financial services__Positive
Table 2. Descriptive statistics of variables.
VariableSymbolNMeanSDMinMax
Green developmentGTFP25561.00570.05660.50121.8724
Digital economyDE25560.05920.05800.00930.6721
Industrial structure rationalization levelISR25561.66211.0670−0.54348.8298
Green technology
innovation
Invention25564.87951.8040010.8765
Electricity consumptionElE25566.71330.60745.079911.2003
Environmental pollutionPollution25560.03630.03800.00020.5858
SO2SO2255610.03221.19790.693113.1832
WastewaterWater25568.17201.11711.945911.4773
SmokeSmoke25569.69411.15974.025415.4582
Economic development levelPgdp255611.01460.66338.987013.1851
Living standard of the residentsLiv25567.01761.23554.469912.0098
Degree of government fiscal interventionGov25561.35651.22700.045530.1087
Regional tax base sizeRtax25560.10710.122001
Population sizePopul25564.68140.79062.71477.8156
InfrastructureInf25567.10830.96822.734410.0061
Table 3. Benchmark regression analysis.
(1)(2)(3)(4)(5)(6)
VariablesGTFPGTFPGTFPGTFPGTFPGTFP
DE0.239 ***0.209 ***0.183 ***0.197 ***0.217 ***0.151 ***
(0.02)(0.03)(0.03)(0.05)(0.07)(0.04)
Pgdp 0.008 ** 0.010 ***0.016 ***0.014 ***
(0.00) (0.00)(0.00)(0.00)
Liv 0.000 −0.008 **−0.010 ***−0.009 ***
(0.00) (0.00)(0.00)(0.00)
Inf −0.005 * −0.004 **−0.007 ***−0.005 **
(0.00) (0.00)(0.00)(0.00)
Popul 0.005 0.011***0.016***0.013***
(0.00) (0.00)(0.00)(0.00)
Gov −0.002 ** −0.001−0.001−0.001 **
(0.00) (0.00)(0.00)(0.00)
Rtax −0.010 0.019−0.0050.024 *
(0.01) (0.01)(0.01)(0.01)
_cons0.992 ***0.923 ***0.995 ***0.920 ***0.866 ***0.884 ***
(0.00)(0.03)(0.00)(0.03)(0.03)(0.03)
Region FENoNoYesNoYesYes
Year FENoNoYesYesYesYes
Region × YearNoNoNoNoNoYes
N255625562556255625562511
R-squared0.0600.0660.1650.1540.1730.305
F-statistic163.04425.72248.70215.65015.06218.499
Note: Standard errors in parentheses; * p < 0.1, ** p < 0.05, *** p < 0.01.
Table 4. Endogenous test.
IV1: TelIV2: Post
(1)(2)(3)(4)
VariablesDEGTFPDEGTFP
DE 2.412 *** 1.353 ***
(0.37) (0.29)
IV10.022 ***
(0.00)
IV2 0.023 ***
(0.00)
Control variablesYesYesYesYes
City FEYesYesYesYes
Year FEYesYesYesYes
Kleibergen–Paap rk LM statistic 22.470
[0.000]
28.121
[0.000]
Kleibergen–Paap rk Wald F statistic 131.509
{16.38}
155.767
{16.38}
Cragg–Donald Wald F statistic 165.114
{16.38}
225.912
{16.38}
F-statistic 17.811 17.785
N1998199822232223
Note: Standard errors in parentheses; *** p < 0.001; () values are clustering robust standard errors; [] values are p-values; {} values are critical values at the 10% level of the Stock–Yogo weak identification test.
Table 5. Quantile regression analysis.
(1)(2)(3)(4)(5)
QuantileQ10Q25Q50Q75Q90
DE0.0520.161 ***0.199 ***0.221 ***0.265 ***
(0.11)(0.05)(0.06)(0.06)(0.10)
Control variablesYesYesYesYesYes
Region FEYesYesYesYesYes
Year FEYesYesYesYesYes
N25562556255625562556
R-squared0.1270.1140.1290.1780.212
Note: Because quantile regressions cannot report robust standard errors, this study uses self-sampling 500 times to correct for ordinary standard errors, with self-sampling standard errors in parentheses; *** p < 0.01.
Table 6. Long-term impact analysis.
(1)(2)(3)(4)(5)(6)
VariablesGTFPGTFPGTFPGTFPGTFPNon-Key
DE0.151 *** 0.129 **
(0.04) (0.06)
L.DE 0.185 ***
(0.04)
L2.DE 0.179 ***
(0.05)
L3.DE 0.157 **
(0.07)
L4.DE 0.094
(0.09)
_cons0.884 ***0.906 ***0.875 ***0.852 ***0.828 ***0.898 ***
(0.03)(0.03)(0.04)(0.04)(0.04)(0.02)
Control variablesYesYesYesYesYesYes
Region FEYesYesYesYesYesYes
Year FEYesYesYesYesYesYes
Region × YearYesYesYesYesYesYes
N251122321953167413952376
R-squared0.3050.2970.3150.3100.3290.284
F-statistic18.49920.95917.52516.77211.4807.513
Note: Standard errors in parentheses; ** p < 0.05, *** p < 0.01.
Table 7. Regional heterogeneity analysis.
EastNortheastCentralWest
Variables(1)(2)(3)(4)(5)(6)(7)(8)
DE0.194 ***0.184 **0.414 ***0.3250.160 ***0.1260.062 ***0.111 **
(0.03)(0.08)(0.09)(0.23)(0.03)(0.09)(0.02)(0.05)
_cons0.993 ***0.816 ***0.992 ***0.889 ***0.995 ***0.867 ***0.998 ***0.978 ***
(0.00)(0.12)(0.00)(0.07)(0.00)(0.04)(0.00)(0.03)
Control variablesNoYesNoYesNoYesNoYes
Region FEYesYesYesYesYesYesYesYes
Year FEYesYesYesYesYesYesYesYes
Region × YearYesYesYesYesYesYesYesYes
N747747306306720720738738
R-squared0.2730.2940.3500.3640.3320.3410.2660.274
Note: Standard errors in parentheses; ** p < 0.05, *** p < 0.01.
Table 8. Heterogeneity analysis of city scale and digital economy level.
(1)(2)(3)(4)
VariablesSmall CityBig CityLow-LevelHigh-Level
DE0.2010.150 ***0.1350.226 **
(0.21)(0.05)(0.18)(0.10)
_cons0.909 ***0.838 ***0.897 ***0.872 ***
(0.03)(0.05)(0.02)(0.12)
Control variablesYesYesYesYes
Region FEYesYesYesYes
Year FEYesYesYesYes
Region × YearYesYesYesYes
N107113861953459
R-squared0.3440.3730.3030.428
Note: Standard errors in parentheses; ** p < 0.05, *** p < 0.01.
Table 9. Transmission mechanism of industrial structure, green technology innovation, and energy consumption.
(1)(2)(3)(4)(5)(6)(7)
VariablesGTFPISRGTFPInventionGTFPElEGTFP
DE0.217 ***4.097 ***0.142 ***2.110 *0.219 ***−0.983 *0.198 ***
(0.07)(1.17)(0.04)(1.09)(0.07)(0.58)(0.05)
ISR 0.002*
(0.00)
Invention −0.001
(0.00)
ElE 0.001
(0.00)
_cons0.866 ***−4.561 ***0.894 ***−4.855 ***0.860 ***10.456 ***0.914 ***
(0.03)(1.57)(0.03)(0.98)(0.03)(0.67)(0.03)
Control variablesYesYesYesYesYesYesYes
Region FEYesYesYesYesYesYesYes
Year FEYesYesYesYesYesYesYes
N2556255625562556255625562556
R-squared0.1730.5960.3060.8860.1730.1340.154
Note: Standard errors in parentheses; * p < 0.1, *** p < 0.01.
Table 10. Transmission mechanism of environmental pollution.
(1)(2)(3)(4)(5)(6)(7)(8)
VariablesPollutionGTFPSO2GTFPWaterGTFPSmokeGTFP
DE−0.139 ***0.171 **−7.570 ***0.174 ***−2.152 *0.206 ***−6.202 ***0.180 **
(0.05)(0.07)(1.32)(0.07)(1.25)(0.07)(1.91)(0.07)
Pollution −0.326 ***
(0.05)
SO2 −0.006 ***
(0.00)
Water −0.005 ***
(0.00)
Smoke −0.006 ***
(0.00)
_cons−0.100 ***0.834 ***5.187 ***0.895 ***2.769 **0.880 ***4.675 ***0.894 ***
(0.03)(0.03)(1.13)(0.03)(1.07)(0.03)(1.23)(0.03)
Control variablesYesYesYesYesYesYesYesYes
Region FEYesYesYesYesYesYesYesYes
Year FEYesYesYesYesYesYesYesYes
N25562556255625562556255625562556
R-squared0.5120.1960.6270.1780.6130.1770.4630.181
Note: Standard errors in parentheses; * p < 0.1, ** p < 0.05, *** p < 0.01.
Disclaimer/Publisher’s Note: The statements, opinions and data contained in all publications are solely those of the individual author(s) and contributor(s) and not of MDPI and/or the editor(s). MDPI and/or the editor(s) disclaim responsibility for any injury to people or property resulting from any ideas, methods, instructions or products referred to in the content.