Article

Statistical Design of Eco-Friendly Mortar Mixtures Containing Scheelite Tailings and Quartzite Sand: Evaluation of Resistance to Alkali-Aggregate Reaction

by
Thainara de Lima Arruda
1,
Fabiana Pereira da Costa
1,
Rebeca Cavalcante Diniz
2,
Alisson Mendes Rodrigues
3,*,
Romualdo Rodrigues Menezes
1,4 and
Gelmires de Araújo Neves
1,4
1
Programa de Pós-Graduação em Ciência e Engenharia de Materiais (PPG—CEMat), Universidade Federal de Campina Grande (UFCG), Av. Aprígio Veloso-882, Campina Grande 58429-900, PB, Brazil
2
Unidade Acadêmica de Engenharia Civil, Centro de Ciência e Tecnologia, Universidade Federal de Campina Grande, Av. Aprígio Veloso-882, Bodocongó, Campina Grande 58429-900, PB, Brazil
3
Programa de Pós-Graduação em Ciência de Materiais (PPGCIMA), Faculdade UnB Planaltina, Universidade de Brasília (UNB), Brasília 70904-910, DF, Brazil
4
Laboratório de Tecnologia de Materiais (LTM), Unidade Acadêmica de Materiais, Universidade Federal de Campina Grande (UFCG), Av. Aprígio Veloso-882, Bodocongó, Campina Grande 58429-900, PB, Brazil
*
Author to whom correspondence should be addressed.
Sustainability 2023, 15(15), 11544; https://doi.org/10.3390/su151511544
Submission received: 27 June 2023 / Revised: 21 July 2023 / Accepted: 25 July 2023 / Published: 26 July 2023
(This article belongs to the Section Sustainable Materials)

Abstract

:
This study focuses on addressing the challenge of society’s consumer demands through sustainable production processes, as outlined by Sustainable Development Goal 12 established by the United Nations. In this context, this study aims to assess the durability of eco-friendly mortars with mineral waste as alternative raw materials, considering the alkali-aggregate reaction (AAR). For this purpose, scheelite tailing (ST) was used to partially replace Portland cement (PC), and quartzite sand (QS) was used to fully replace conventional sand. The ST was ground and sieved (<75 μm), and part of it was used in its natural form, while the other part was calcined (1000 °C for 1 h). A mixture experimental design was created to select the compositions with the best mechanical performance. All the mortar mixtures were produced with a cementitious material to QS ratio of 1:3. Three mortar compositions (0% ST, 30% natural ST, and 30% calcined ST) were selected to study the resistance to the AAR. Linear expansion measurements, compressive strength tests, X-ray diffraction, thermogravimetric analysis, and scanning electron microscopy were conducted to evaluate the phases formed and the mechanical behavior of the mortars in relation to the AAR. The expansion results demonstrated that QS does not exhibit deleterious potential. Regarding the use of ST, the results indicated that it is possible to partially replace PC with calcined ST without significantly compromising the mechanical performance and durability of the mortars. However, the use of non-calcined ST is not recommended, as it presents deleterious effects on the mechanical properties of the mortars. This study highlights a new sustainable mortar alternative for use in construction without future degradation of its properties.

1. Introduction

In the past 30 years, the concept of sustainable development has gained global recognition, with a comprehensive definition referring to practices that allow the current population to meet their basic needs without compromising future generations [1]. However, the production of Portland cement (PC), which plays a crucial role in mortars and concretes, is not environmentally sustainable because it emits a significant amount of carbon dioxide (approximately 7% of global emissions), one of the main greenhouse gases [2,3,4]. Furthermore, cement production requires large quantities of natural raw materials such as limestone and clay. The extraction of these resources can lead to the depletion of non-renewable resources, soil degradation, and damage to local ecosystems [5].
Considering this scenario, research on cleaner production processes and using alternative materials to replace conventional ones becomes increasingly important to minimize the environmental impacts generated by the construction industry [6,7]. Furthermore, such research also contributes to the implementation of Sustainable Development Goal number 12 (SDG 12) of the 2030 Agenda established by the United Nations (UN), which aims to promote sustainable patterns of production and consumption [8]. In the context of this pursuit for sustainability, the exploration of mineral resources offers an opportunity to transform large volumes of improperly disposed of solid waste into alternative raw materials in the production of sustainable construction materials [9,10].
Currently, numerous studies are being conducted to investigate the feasibility of incorporating industrial and mineral waste into cementitious matrices, such as concretes and mortars, with the aim of promoting sustainability in the construction sector. Some of these studies report promising results regarding the partial replacement of cement in mortars and concretes with copper tailings [11], marble and granite waste [12,13,14], kaolin waste [15], perlite waste [16], and agricultural waste [17,18,19]. Overall, these studies have demonstrated that it is feasible to replace natural resources with industrial and mineral waste in the production of cementitious materials, reducing environmental impacts associated with the excessive exploitation of natural resources and the disposal of large volumes of waste.
In the northeastern region of Brazil, specifically in the states of Paraíba, Rio Grande do Norte, Ceará, and Pernambuco, there is a significant potential for non-metallic minerals, with emphasis on scheelite (CaWO4) and quartzite (SiO2) deposits. The waste generated from scheelite extraction is abundant in these areas but is often improperly disposed of, leading to environmental impacts [10]. In this context, the chemical composition and availability of scheelite tailings (STs) make it attractive as an alternative raw material to produce sustainable mortars and concretes [20]. Medeiros et al. [21] used STs as a total substitute for natural sand in mortar compositions for coating. The researchers found that the tailings exhibited similar chemical and physical characteristics to natural sand, indicating their potential for substitution. Additionally, the mortars containing ST demonstrated satisfactory mechanical results. In another study [20], the durability of eco-efficient concretes produced with partial substitutions of CP by porcelain polishing waste (0, 5, 10, 15, 20, 25, and 30%) and sand by ST (81%) was evaluated. The authors found that the production of eco-efficient concrete resulted in improvements in properties compared to the reference concrete, while promoting sustainability by reducing CP and sand consumption by 15% and 81%, respectively.
However, most studies have focused on using ST to produce ceramic masses [10,22] or in the partial or total replacement of conventional aggregates [20,21,23]. Partial substitution of CP with ST was little explored in previous studies. The existing studies [24,25] have used ST with chemical compositions containing approximately 50% SiO2 and 13% Al2O3 and Fe2O3. However, ST from the Brejuí mine, considered the largest scheelite mine in South America [9], has a distinct chemical composition, being rich in CaO, with approximately 40–48% CaO, 16–22% SiO2, and 7–10% Al2O3. These differences in chemical composition highlight the importance of specifically studying ST rich in CaO as a partial substitute for CP in the development of mortars and concretes. Furthermore, there is also a scarcity of studies involving the use of quartzite tailings for the development of alternative mortars, as well as understanding the behavior of these eco-friendly mortars in the face of the alkali-aggregate reaction (AAR).
The evaluation of the durability of mortars produced with waste materials is of utmost importance to ensure their acceptance in the consumer market, as it is essential for these mortars to exhibit satisfactory properties that remain throughout their service life [6]. Thus, this study aims to provide an environmentally conscious and technically viable alternative for the disposal of scheelite and quartzite extraction tailings by using them in alternative mortars for construction applications. To achieve this objective, partial replacement of PC with ST and total replacement of conventional sand with quartzite sand were performed. Additionally, a durability study was conducted to understand the phenomena related to using these waste materials as alternative raw materials, focusing on the analysis of the AAR.

2. Materials and Methods

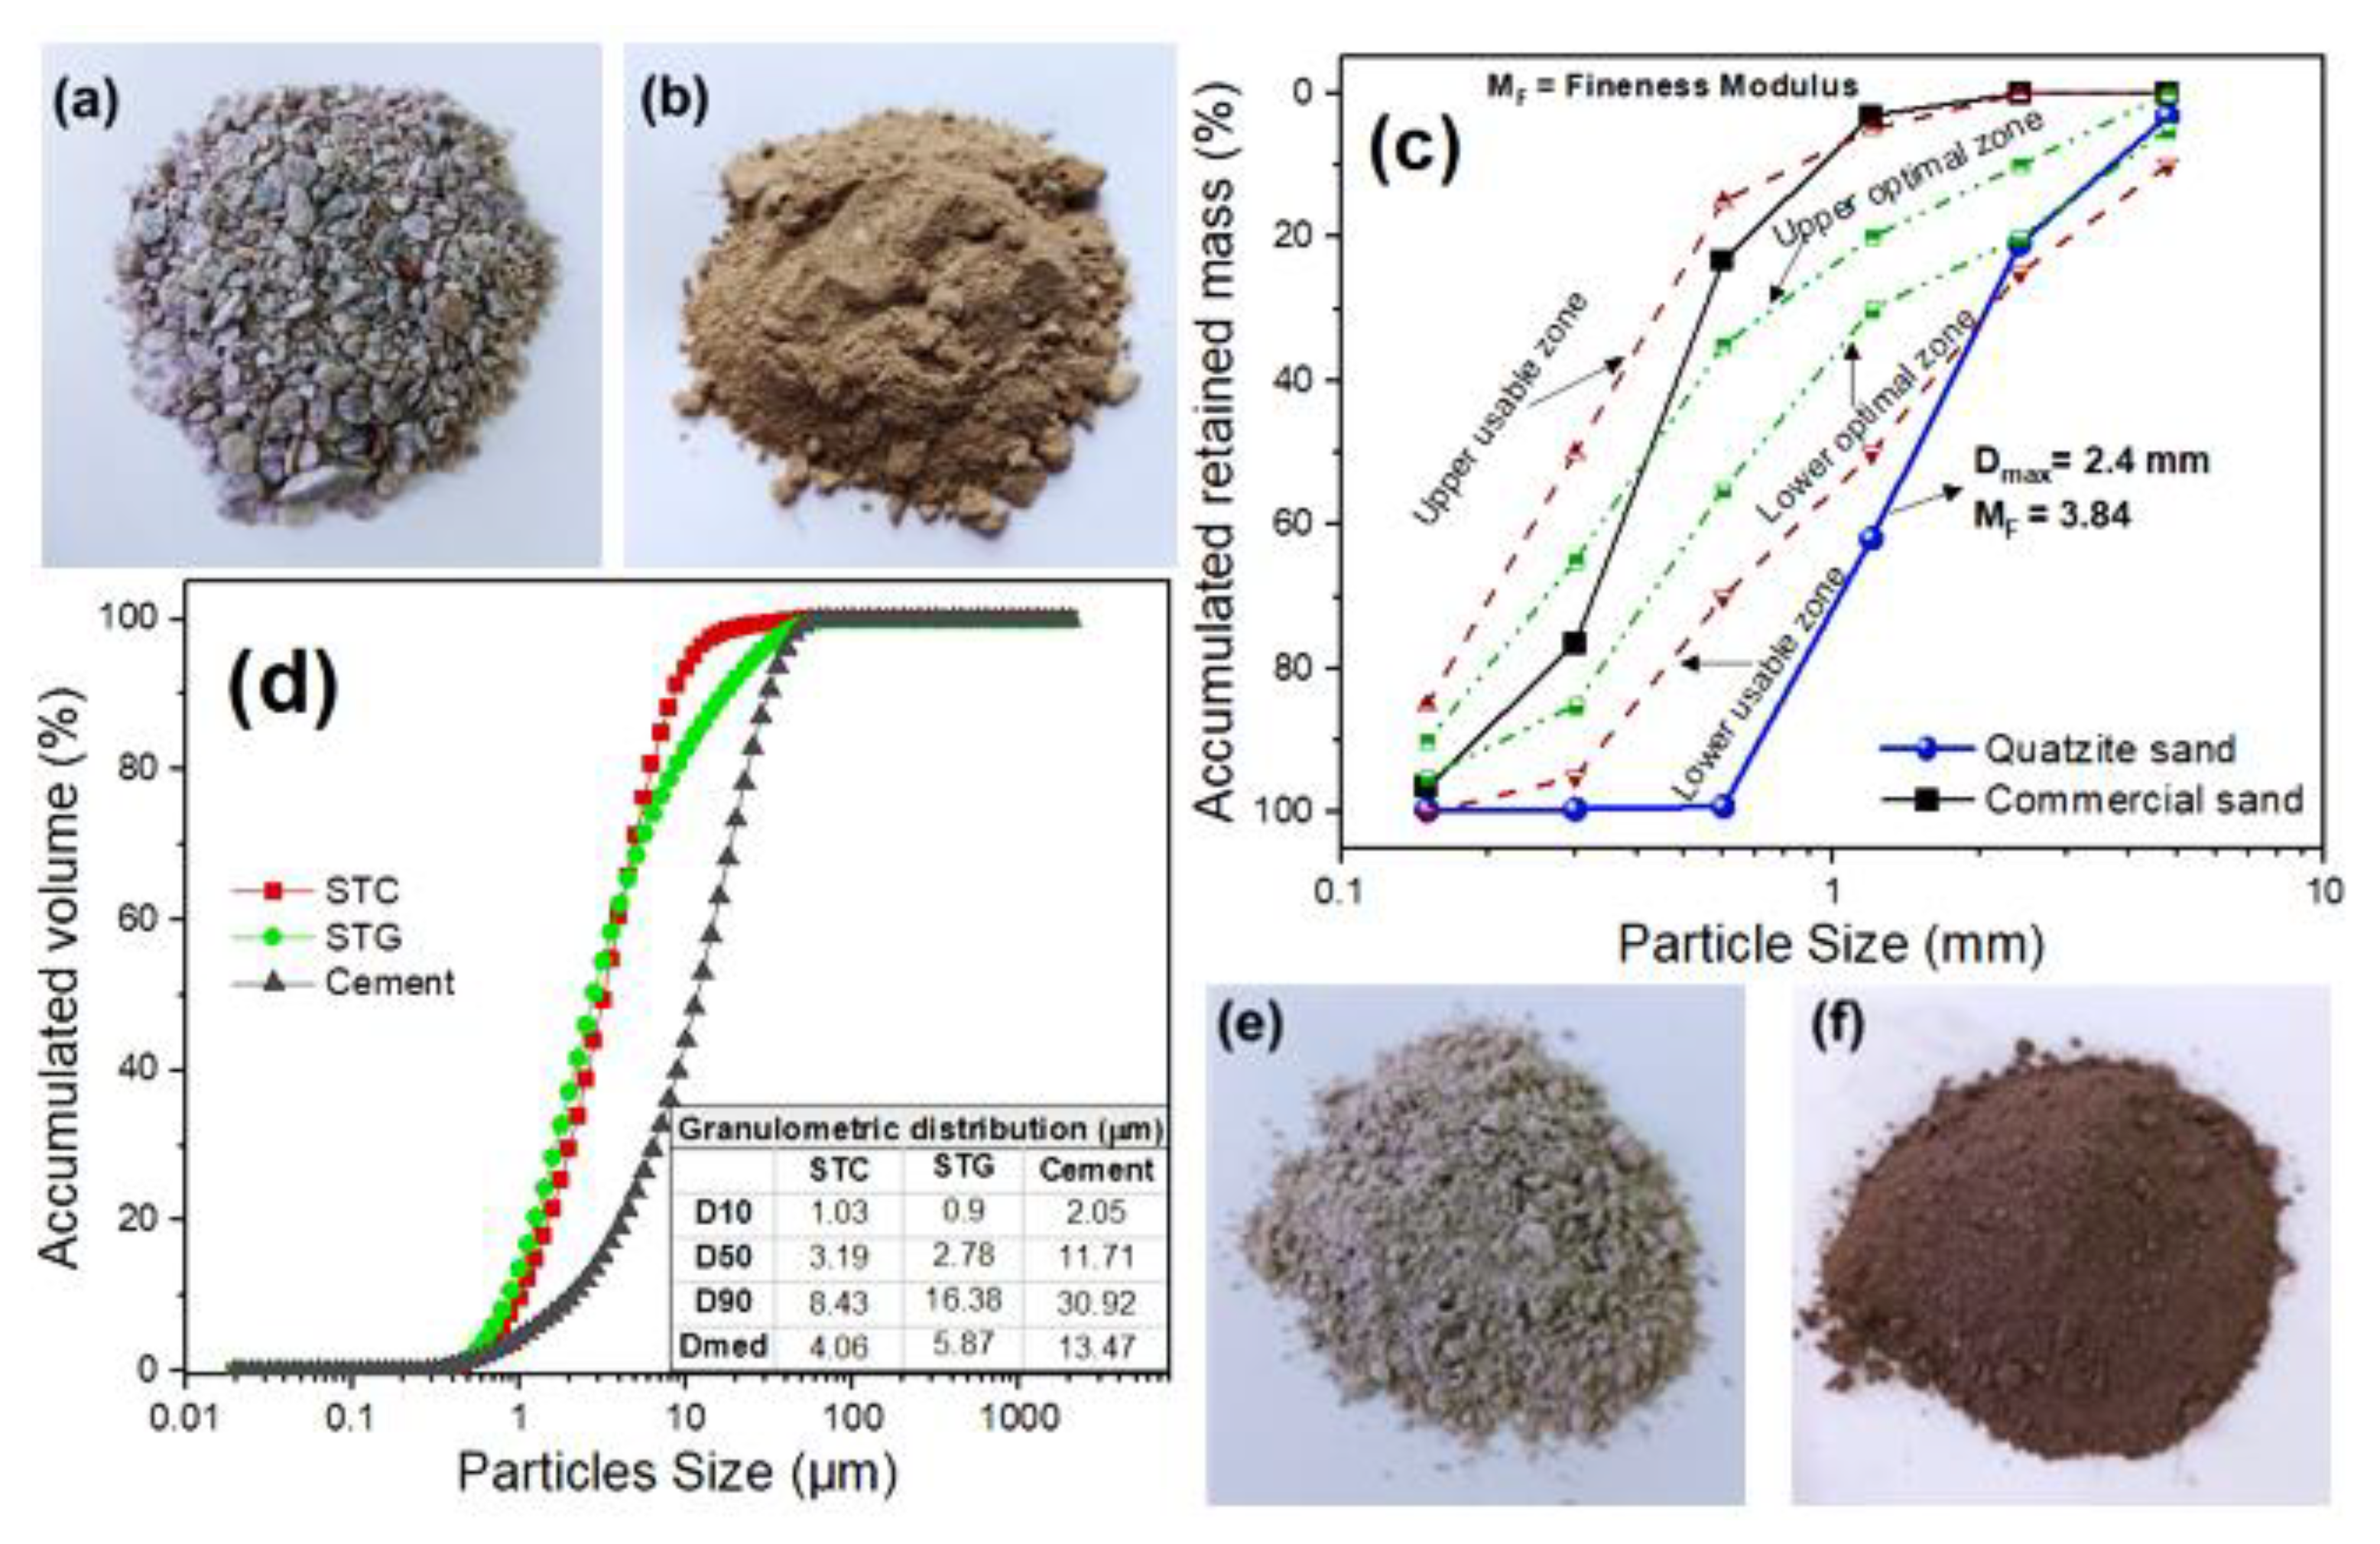
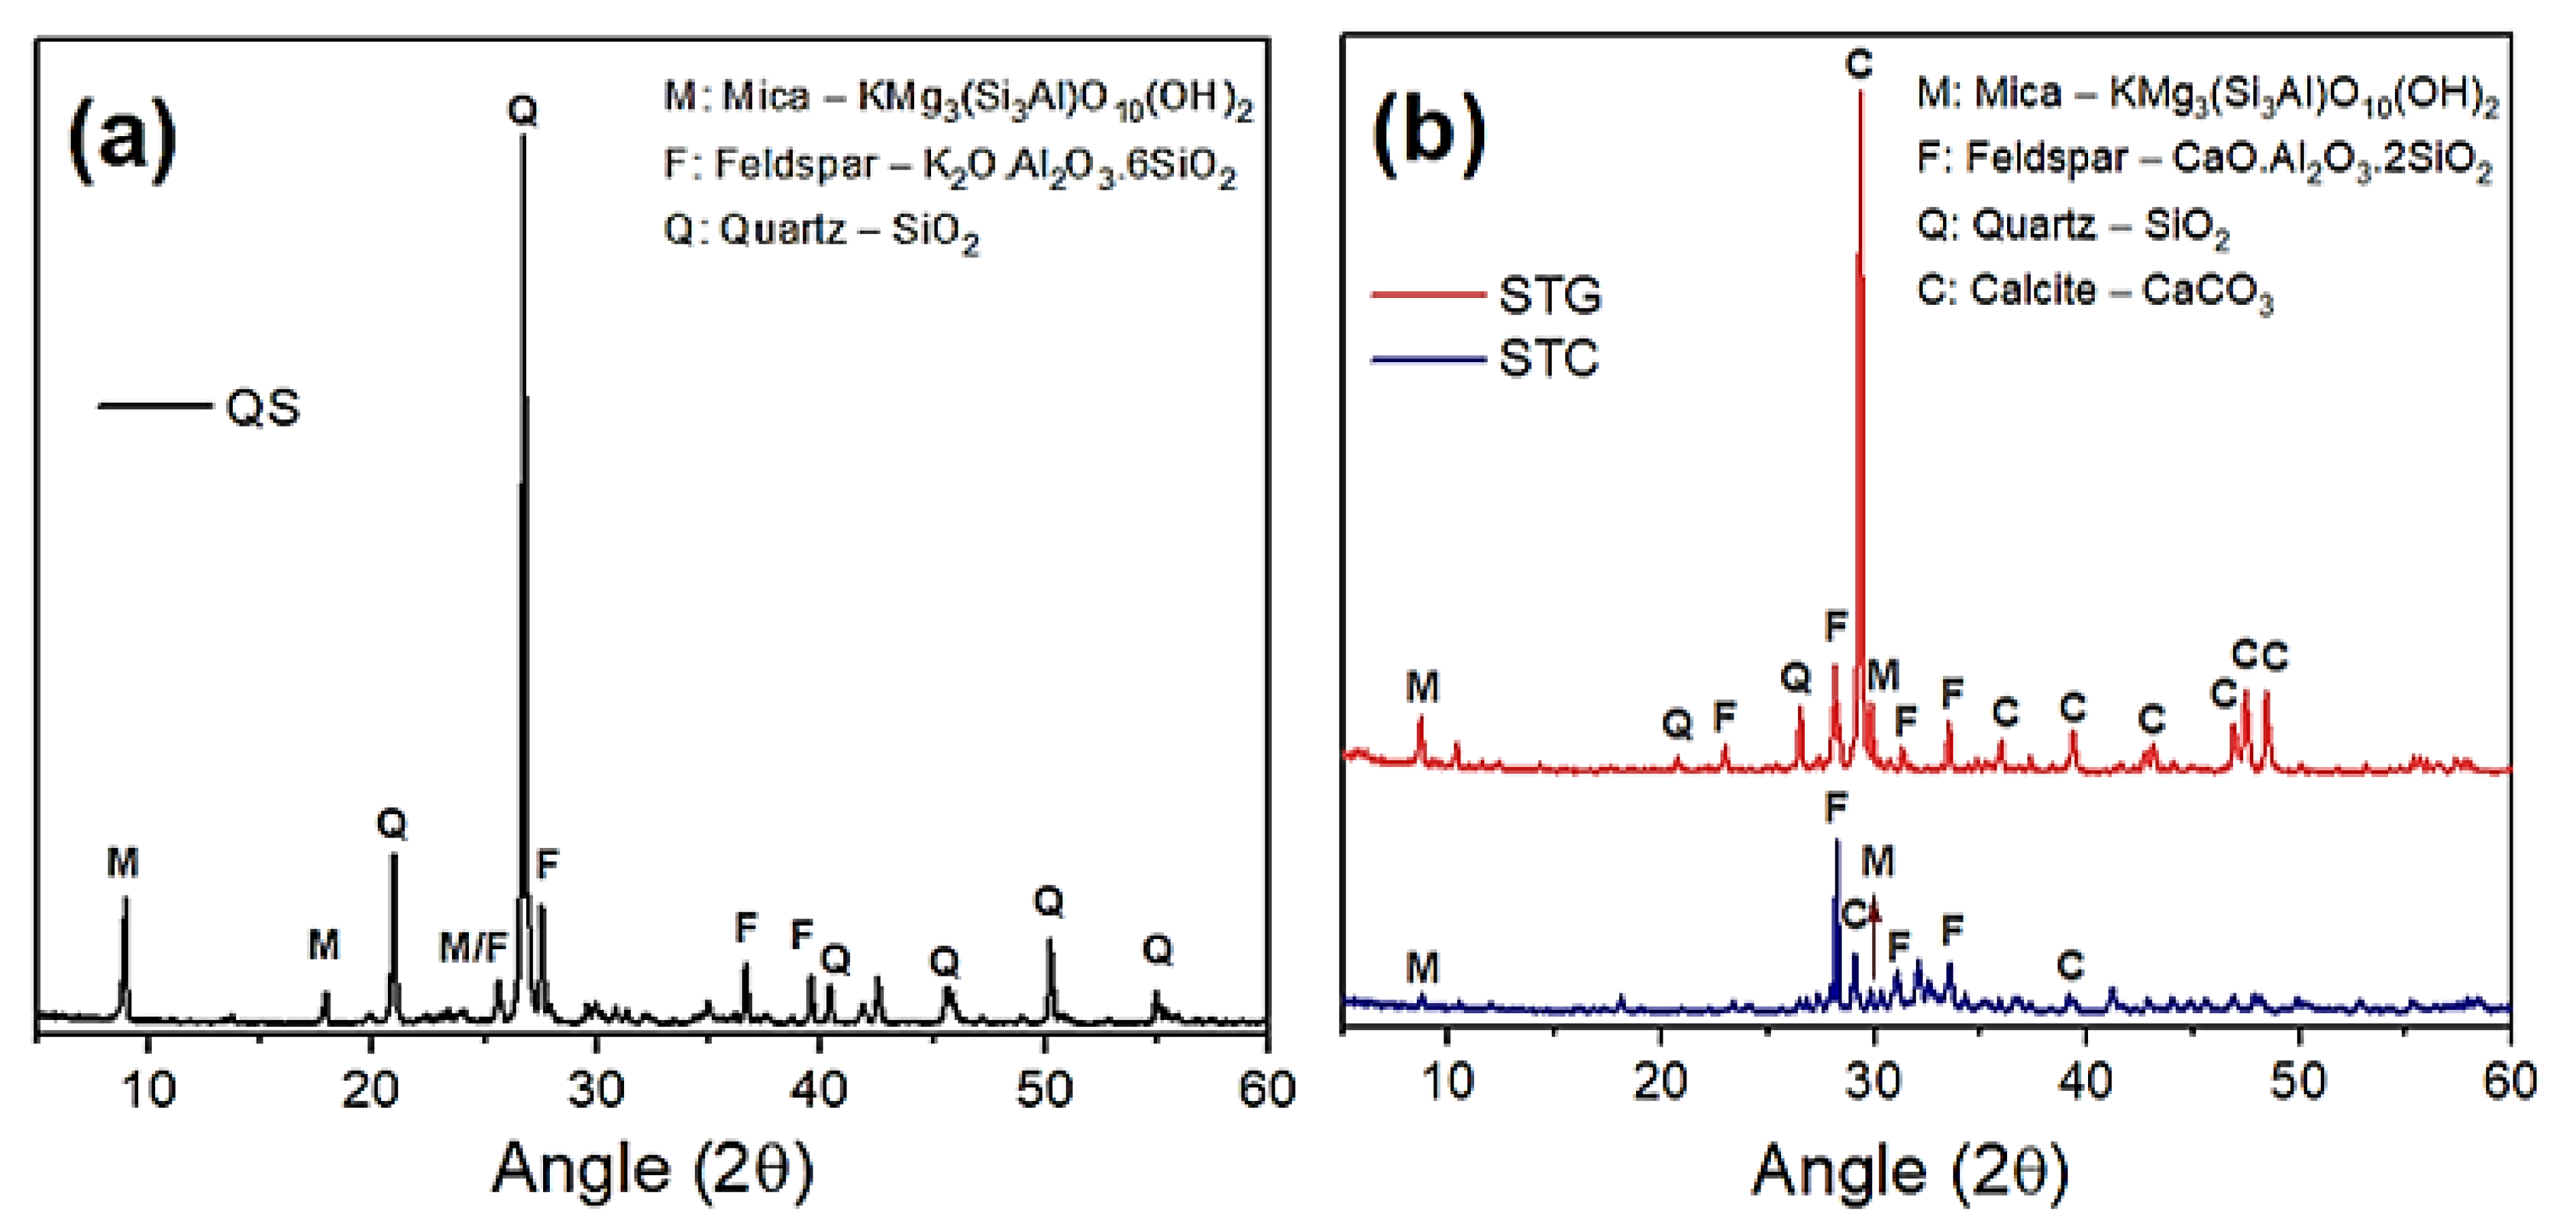
2.1. Raw Materials and Their Characterizations

The eco-friendly mortars were produced using high-initial-strength Portland cement (PC) CPV-ARI MAX, following the requirements of ASTM C150 [26], quartzite sand (QS) (Figure 1a) as a total replacement for natural sand (NS), and scheelite tailings (STs) (Figure 1b) as a partial substitute for PC. The QS was used as a fine aggregate (<4.8 mm), as shown in Figure 1c, and it was obtained from a company in Várzea City, Paraíba state, Brazil. The ST was obtained from a tungsten mining company located in Currais Novos, Rio Grande do Norte state, Brazil. Sodium hydroxide (NaOH 97% PA, Synth) was used in the alkali-aggregate reaction (AAR) resistance test.
After collection, the ST was ground in a roller mill for 2 h and sieved (<75 μm) to obtain a particle size similar to PC (see Figure 1d). Finally, part of the ground tailing was used in its natural form (Figure 1e), and the other part was calcined at 1000 °C in a muffle furnace for 1 h, with a heating rate of 5 °C·min−1 (Figure 1f), to evaluate the effect of calcination on the properties. The as-received and ground scheelite tailings were denoted STG, and the as-received, ground, and calcined tailings were designated STC. Figure 1a–f show images of QS, STG, and STC, along with their respective particle size distribution curves obtained by sieving method (sieves with openings of 4.8 mm, 2.4 mm, 1.2 mm, 0.6 mm, 0.3 mm, and 0.15 mm) for QS and by laser diffraction (Malvern, Mastersizer 2000 model, Malvern, United Kingdom) for STG and STC. Table 1 shows the chemical compositions of PC, QS, and ST (STG and STC) obtained by X-ray fluorescence (XRF) (Shimadzu, EDX 720, Kyoto, Japan). In contrast, Figure 2 shows the mineralogical composition of PC, QS, and ST (STG and STC) obtained by X-ray diffraction (XRD) (Shimadzu, XRD6000, Kyoto, Japan). The chemical compositions of ST (STG and STC) suggest that these materials do not have the potential to be used as pozzolanic material since SiO2 + Al2O3 + Fe2O3 is less than 70%, ASTM C618 [27].

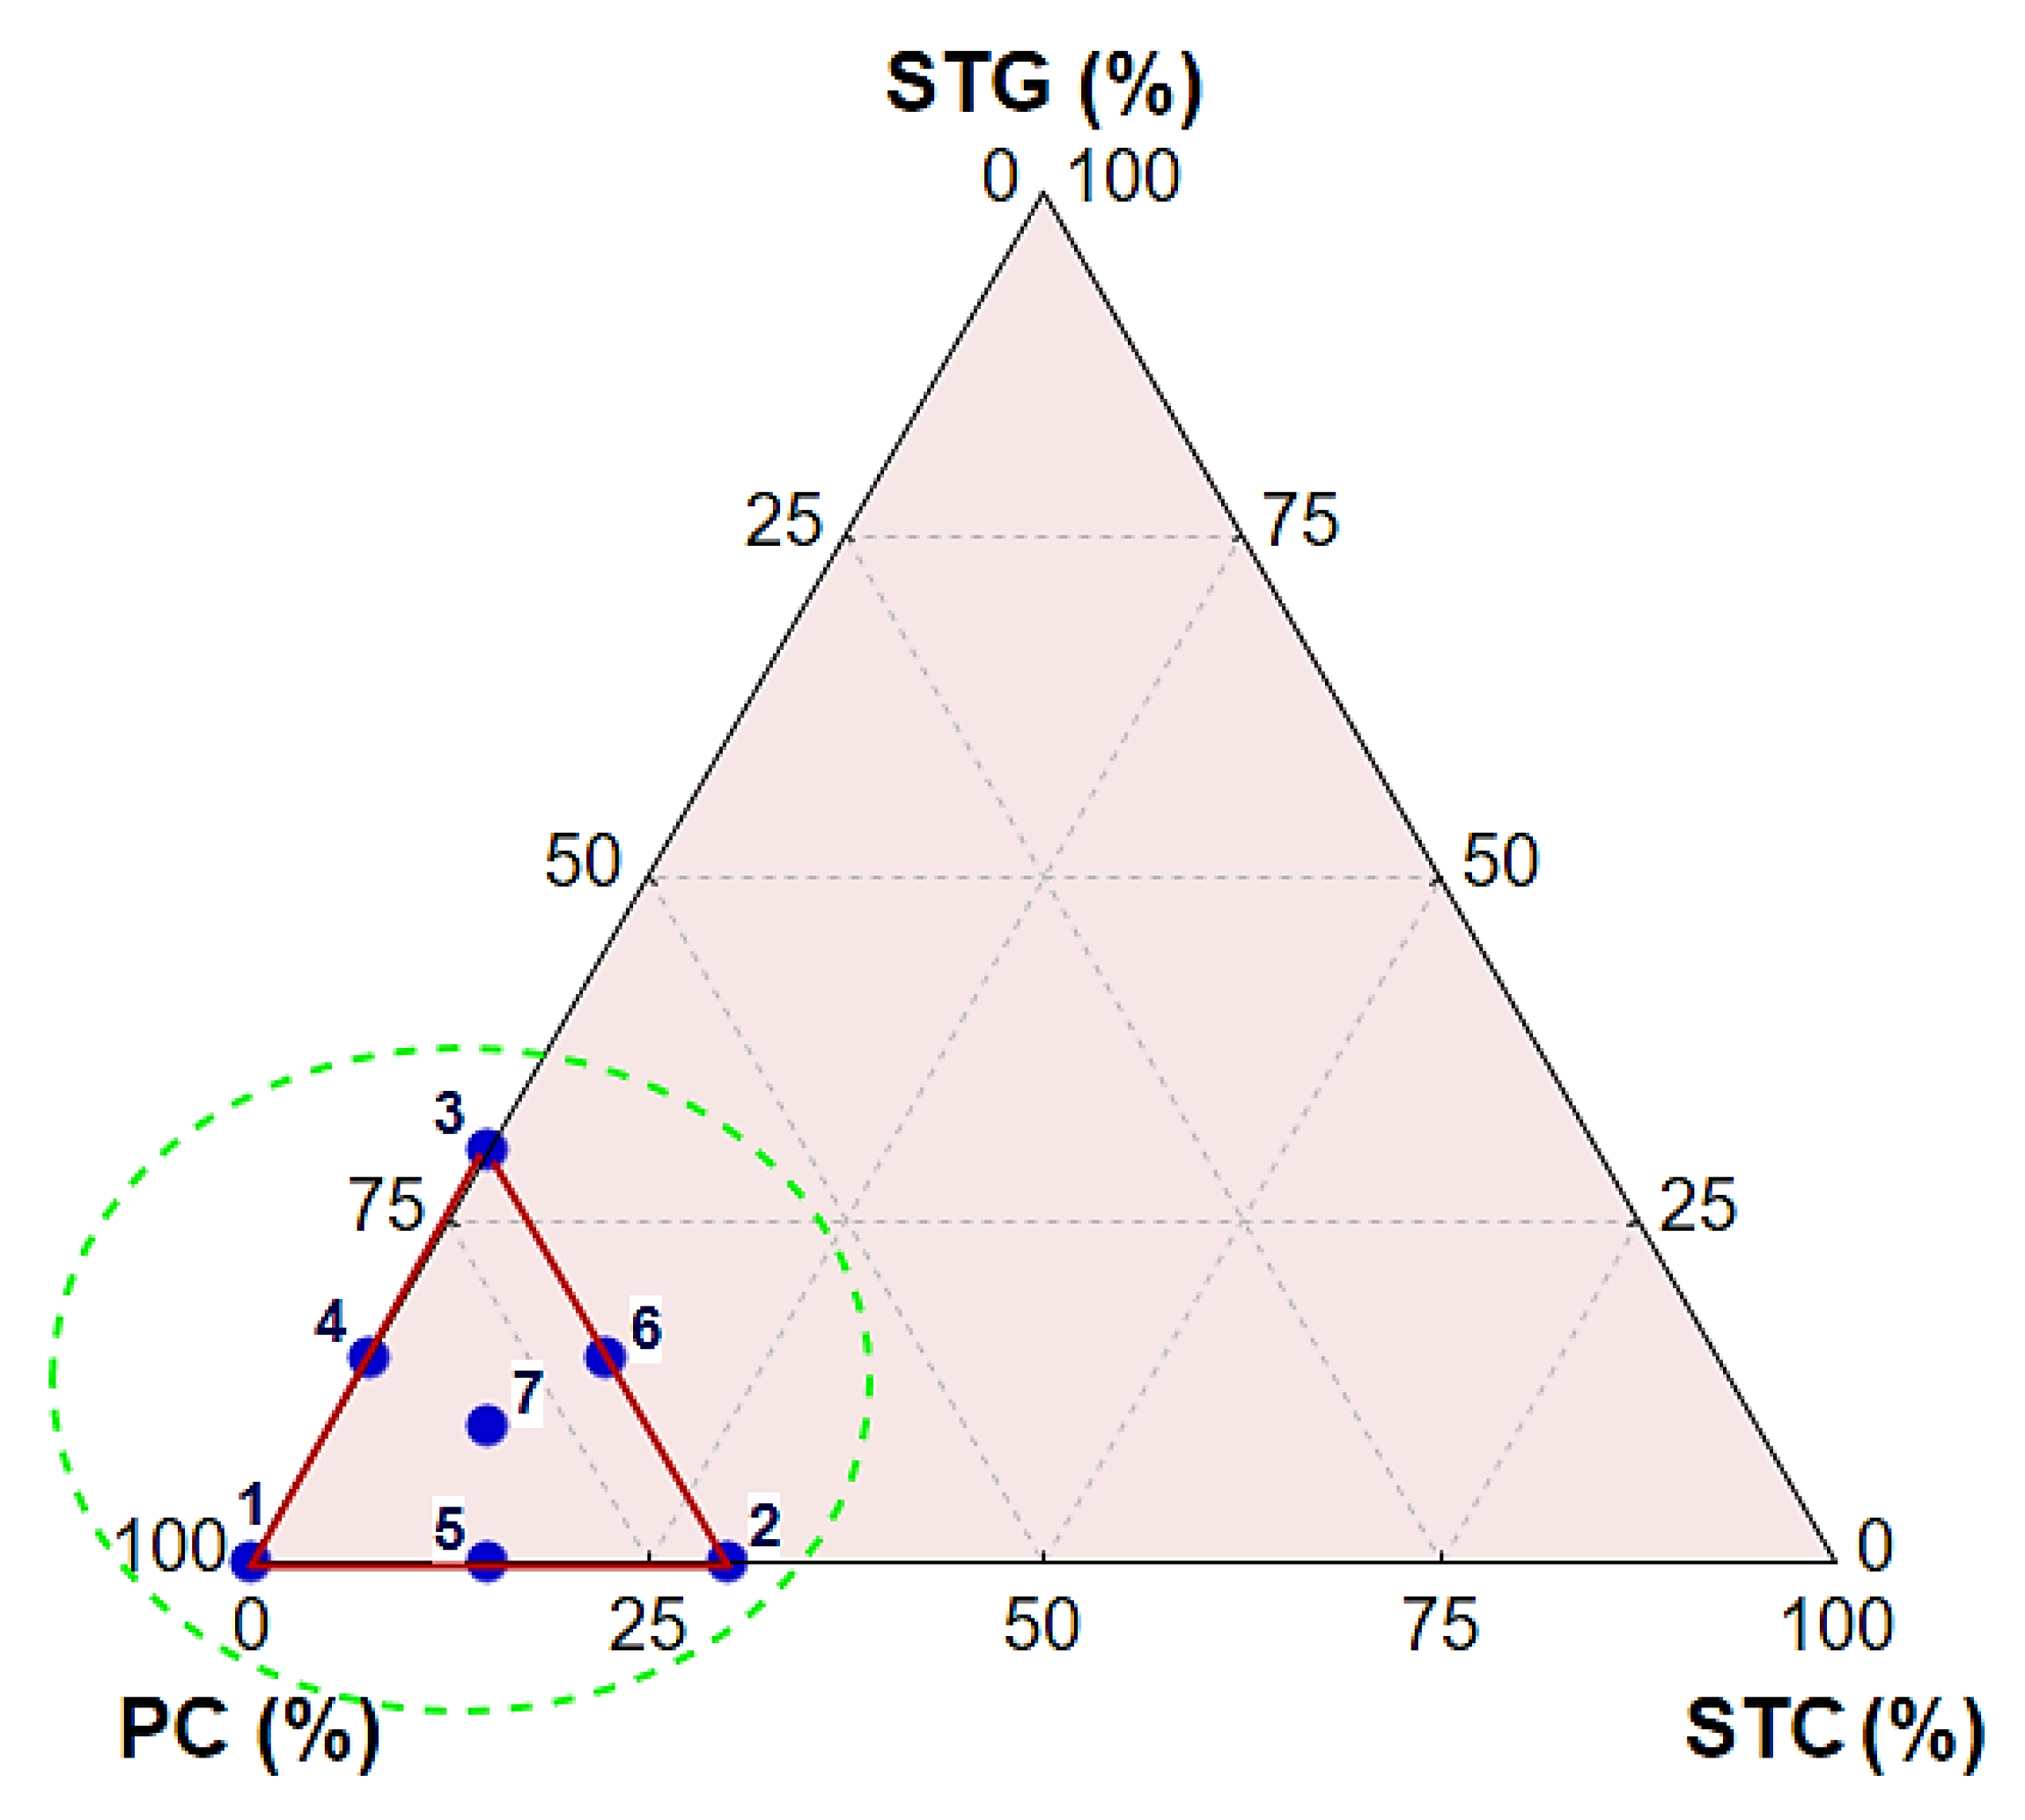
2.2. Experimental Design, Mortar Production, and Curing

A statistical design of mixture experiments, {3,2} centroid simplex-lattice design augmented with a central point, was used to define the compositions and amounts of PC, STG, and STC to be used as matrix/binder materials in the development of the mortars. The maximum substitution content of PC was fixed at 30% for both tailings. Figure 3 illustrates the graphical representation of the composition triangle estimated by the experimental design for mortars. The triangle of interest is highlighted in red within the green circle. The experimental design consisted of seven experimental compositions (Table 2), represented by points 1, 2, 3, 4, 5, 6, and 7 in Figure 3. Two replicas were performed for each point, resulting in 21 experimental runs. Compressive strength (CS) and water absorption (WA) were the response variables evaluated to determine the optimal percentage of CP replacement with ST. For each experimental run, the CS and WA results correspond to the average of three specimens. The experimental matrix and statistical data analysis were conducted using Statistic 14 software (TIBCO Software Inc., Palo Alto, USA) [28].
It is important to emphasize that the evaluation of mechanical behavior is a crucial stage, as the mechanical strength of a material is closely related to its future application. This evaluation can be conducted on a small scale, using test specimens, or in a more complex way, like that of the authors Li et al. [29] and Zhang et al. [30] who evaluated the failure and damage characteristics in different rock masses using analytical models.
All formulations used QS as a total replacement for natural sand. The mortar mixtures were produced with a cementitious material to QS ratio (PC + STG: QS, PC + STC: QS) of 1:3. A reference mortar was prepared using natural sand (MR). The water-to-cement (w/c) ratio was adjusted until the consistency index of the mixtures reached 260 ± 10 mm, as recommended by ASTM C1437 standard [31]. The mortar mixtures were homogenized in a planetary mechanical mixer for 5 min. Cylindrical specimens with dimensions of 50 mm × 100 mm (diameter × height) were molded for CS tests, while prismatic specimens (25 mm × 25 mm × 285 mm) were produced for alkali-aggregate reaction (AAR) resistance tests. The samples were demolded after 48 h and cured in a moist chamber (100% humidity) for 28 days. WA and CS tests were conducted on the developed mortars.
The WA of the mortars was determined according to ASTM C642 standard [32]. To perform the test, the specimens were dried in an oven at 105 ± 5 °C for 72 h to determine the dry mass. Subsequently, the samples were immersed in water for 72 h to determine their wet and saturated mass. The WA was determined by calculating the difference between the wet mass and the initial dry mass of the specimens and expressed as a percentage relative to the initial dry mass. This test is important to assess the porosity of the mortars and their water absorption capacity, which can directly affect their strength and durability. The CS was determined on cylindrical specimens (50 mm × 100 mm), following ASTM C39/C39M [33]. The results represented the average of three specimens and were determined using a universal mechanical testing machine (SHIMADZU, AG-IS 100KN) with a loading rate of 0.25 ± 0.05 MPa/s.

2.3. Resistance to Alkali-Aggregate Reaction

To evaluate the alkali-aggregate reaction (AAR) resistance, linear expansion measurements were carried out on mortar bars, following ASTM C1260 standard [34]. After curing in a moist chamber (100% relative humidity), the samples were immersed in a 1N NaOH solution and kept at 80 ± 2 °C for 28 days. Linear expansion measurements were taken at equal intervals of 0, 1, 7, 14, and 28 days. The linear expansion results represented the average of three specimens.
To evaluate the evolution of mechanical behavior, the best mortar compositions were exposed to water and 1N NaOH solution for 28 and 56 days and subsequently tested for compressive strength. One-way ANOVA (analysis of variance) was used to determine if there were significant differences among the groups (i.e., mortars with and without ST immersed in water and 1N NaOH solution for 28 and 56 days), followed by Tukey’s multiple comparison tests at a significance level of 5%, which were conducted to determine which mortar samples differed significantly from the others. All statistical analyses were performed using Statistica 14 software [28].
The samples were also analyzed by X-ray diffraction (XRD) using a Shimadzu XRD6000 instrument, with Kα-Cu radiation (40 kV/30 mA) and a step size of 0.02°. Thermogravimetric analysis (TGA) was performed using a Shimadzu TA–60H instrument, with a heating rate of 10 °C·min−1 in an air atmosphere. Scanning electron microscopy (SEM) was conducted using a VEGA3 TESCAN instrument. Cross-sectional sections (10 mm × 10 mm) were obtained for SEM analysis. A thin film (~50 nm) of gold was deposited on the cross-section of the mortar bars for 4 min at a current of 10 mA using a SANYU SC–701 device. Figure 4 presents a flowchart summarizing the steps of the methodology used in this study.

3. Results and Discussions

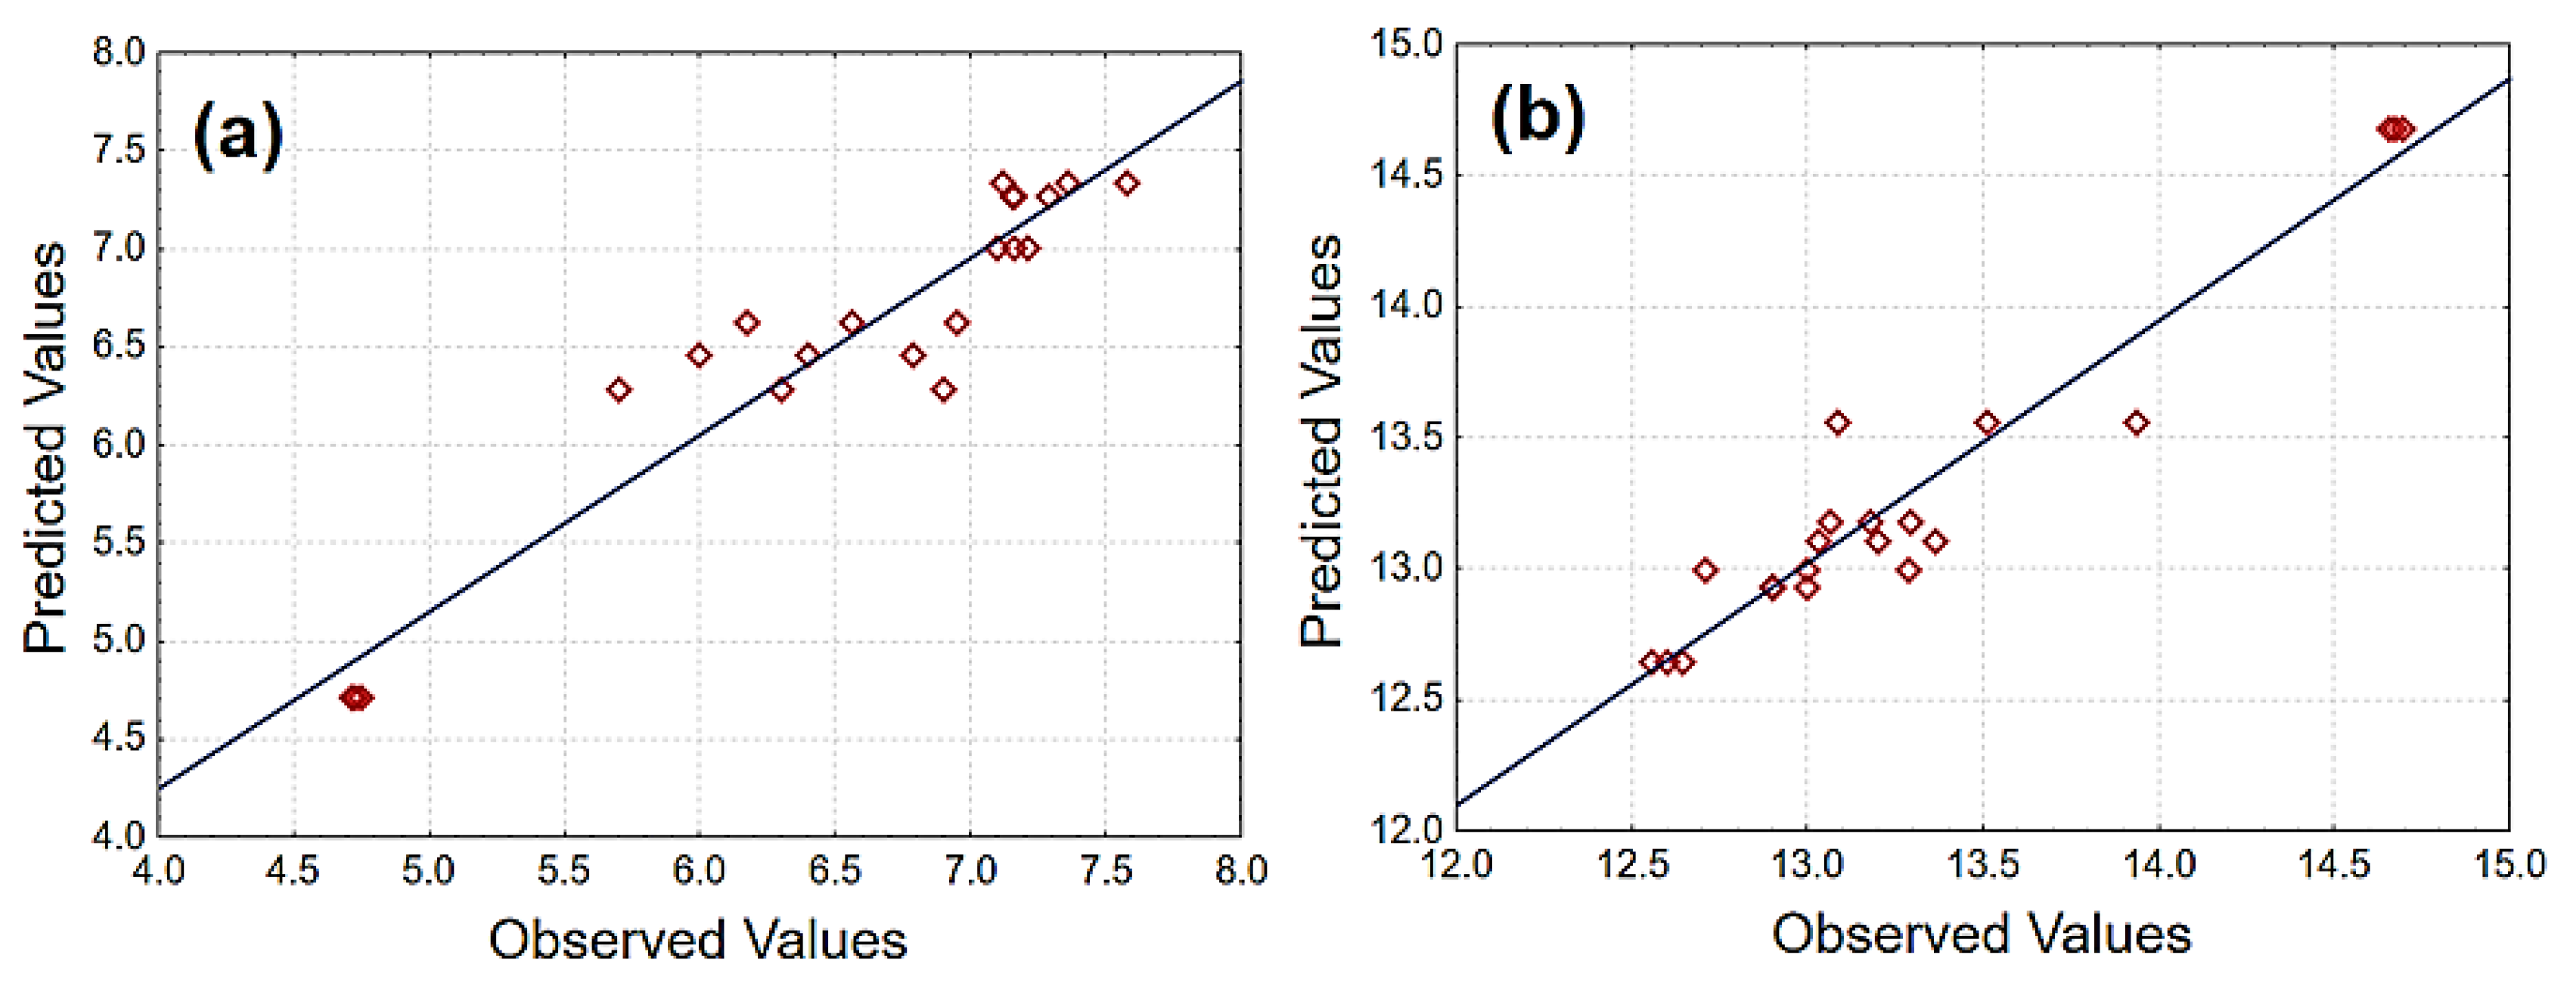
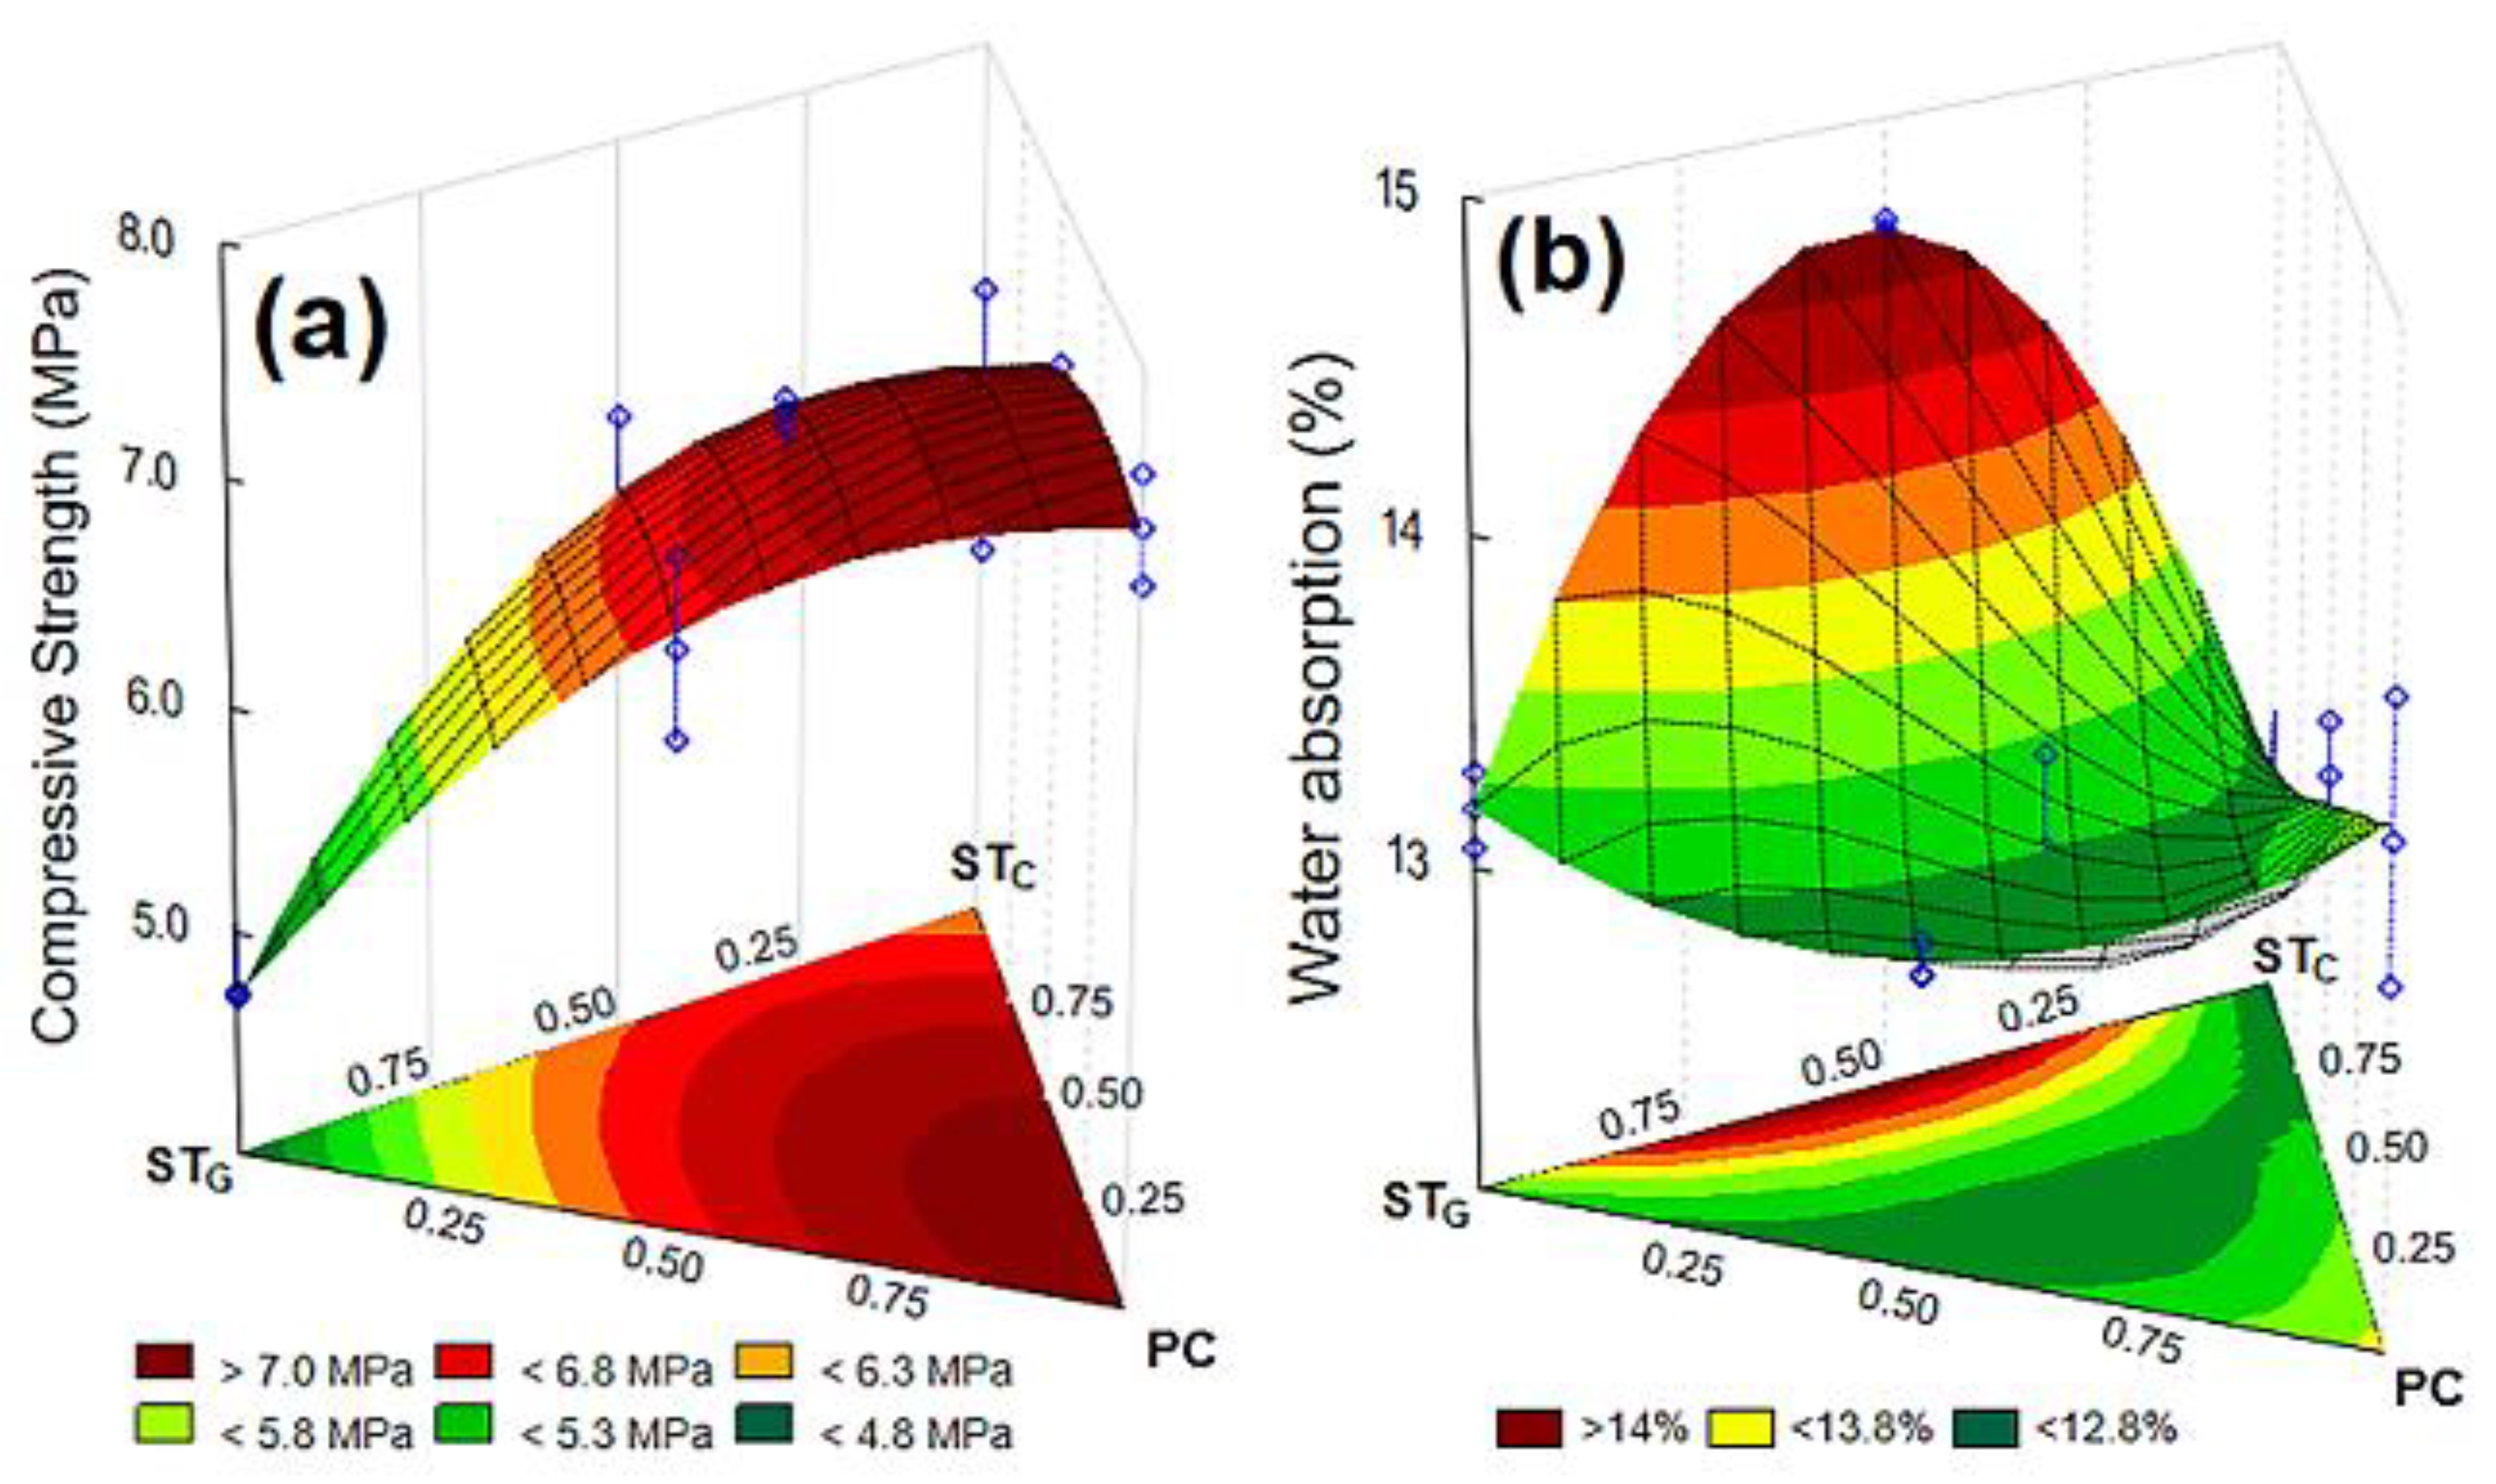
3.1. Experimental Design Results

Table 3 summarizes the CS and WA values for each composition defined in the experimental design. In general, it can be observed that composition 2 (30% STC) exhibited the highest values of CS. Based on these data, statistical analysis was performed on the results. Table 4 presents the main statistical parameters obtained from the analysis of variance (95% confidence level) of the experimental design conducted to determine the compositions of mortars containing STG and STC as partial replacements for PC. Linear, quadratic, and special cubic regression models were fitted to the experimental data for statistical analysis. The significance and predictive capability of the models can be evaluated through the F-test (Fcal). For a model to be significant and predictive, the calculated F-value (Fcal) should be at least four to six times greater than the tabulated F-value (Ftab) in the Fisher–Snedecor distribution [35].
For the analysis of CS, the quadratic model showed the highest values of Fcal/Ftab (6.46), R2 (90.17%), and R2Adj (86.90%), making it the most suitable for predicting CS results. While for WA, the special cubic model showed the best results (Fcal/Ftab = 5.41, R2 = 92.85%, and R2Adj = 89.79%). Figure 5a,b show the correlation between the observed and predicted values for CS (Figure 5a) and WA (Figure 5b). It can be observed that the models are suitable for describing the mechanical behavior and WA of the mortars containing STG and STC as partial replacements for PC. Equation (1) represents the quadratic model obtained from the regression analysis for CS, while Equation (2) represents the cubic model obtained for the WA of the mortars.
In Equation (1), it was observed that all components (PC, STC, and STG) and their interaction (CP × STC, CP × STG, and STC × STG) are statistically significant (pvalue < 0.05, with 95% confidence) and exhibit coefficients greater than zero, indicating that they all contribute to increasing the CS values. This behavior suggests that the replacement of PC with STG or STC did not, by itself, reduce the CS values of the mortars. Thus, any observed decrease is due to PC being the component with the highest contribution coefficient (7.337) to CS. In Equation (2), the CP × STC interaction was not statistically significant (i.e., pvalue (0.3498) > 0.05). Therefore, this interaction was disregarded during model adjustment. Furthermore, it was observed that the interactions between the PC and the ST (PC × STG and CP × STC × STG) had coefficients lower than zero, indicating that these interactions favor the WA value reduction.
The response surfaces obtained from the proposed models for CS and WA are illustrated in Figure 6a,b. In Figure 6a, it can be observed that regions with higher STC content exhibited higher CS results compared to regions with higher STG content, indicating that the calcination of ST favored the mechanical behavior of the mortars. However, within the studied range (maximum substitution of 30% of PC with ST), all mortar compositions showed CS values above the minimum limit of 2.4 MPa established by the ASTM C270 standard [36]. Figure 6b indicates that the highest WA values are in regions with higher STG content. It is known that WA is directly related to the porosity of the material, so it is likely that the incorporation of STG increased the porosity of the mortars.
C o m p r e s s i v e   s t r e n g t h   MPa = 7.337 × P C + 6.284 × S T C + 4.714 × S T G + 1.822 × P C × S T C + 2.402 × PC × S T G + 3.855 × S T C × S T G + 0.105
W a t e r   a b s o r p t i o n   % = { 0.136 × P C + 0.126 × S T C + 0.132 × S T G 0.017 × P C × S T G + 0.071 × S T C × S T G 0.194 × PC × S T C × S T G } × 100
Based on the results of the experimental design, three mortar compositions named M0 (0% ST), M30SG (30% STG), and M30SC (30% STC) were selected to study the resistance to the AAR. M30SG and M30SC were chosen because they allowed for the highest amount of PC substitution with ST, while M0 was selected for comparison purposes.

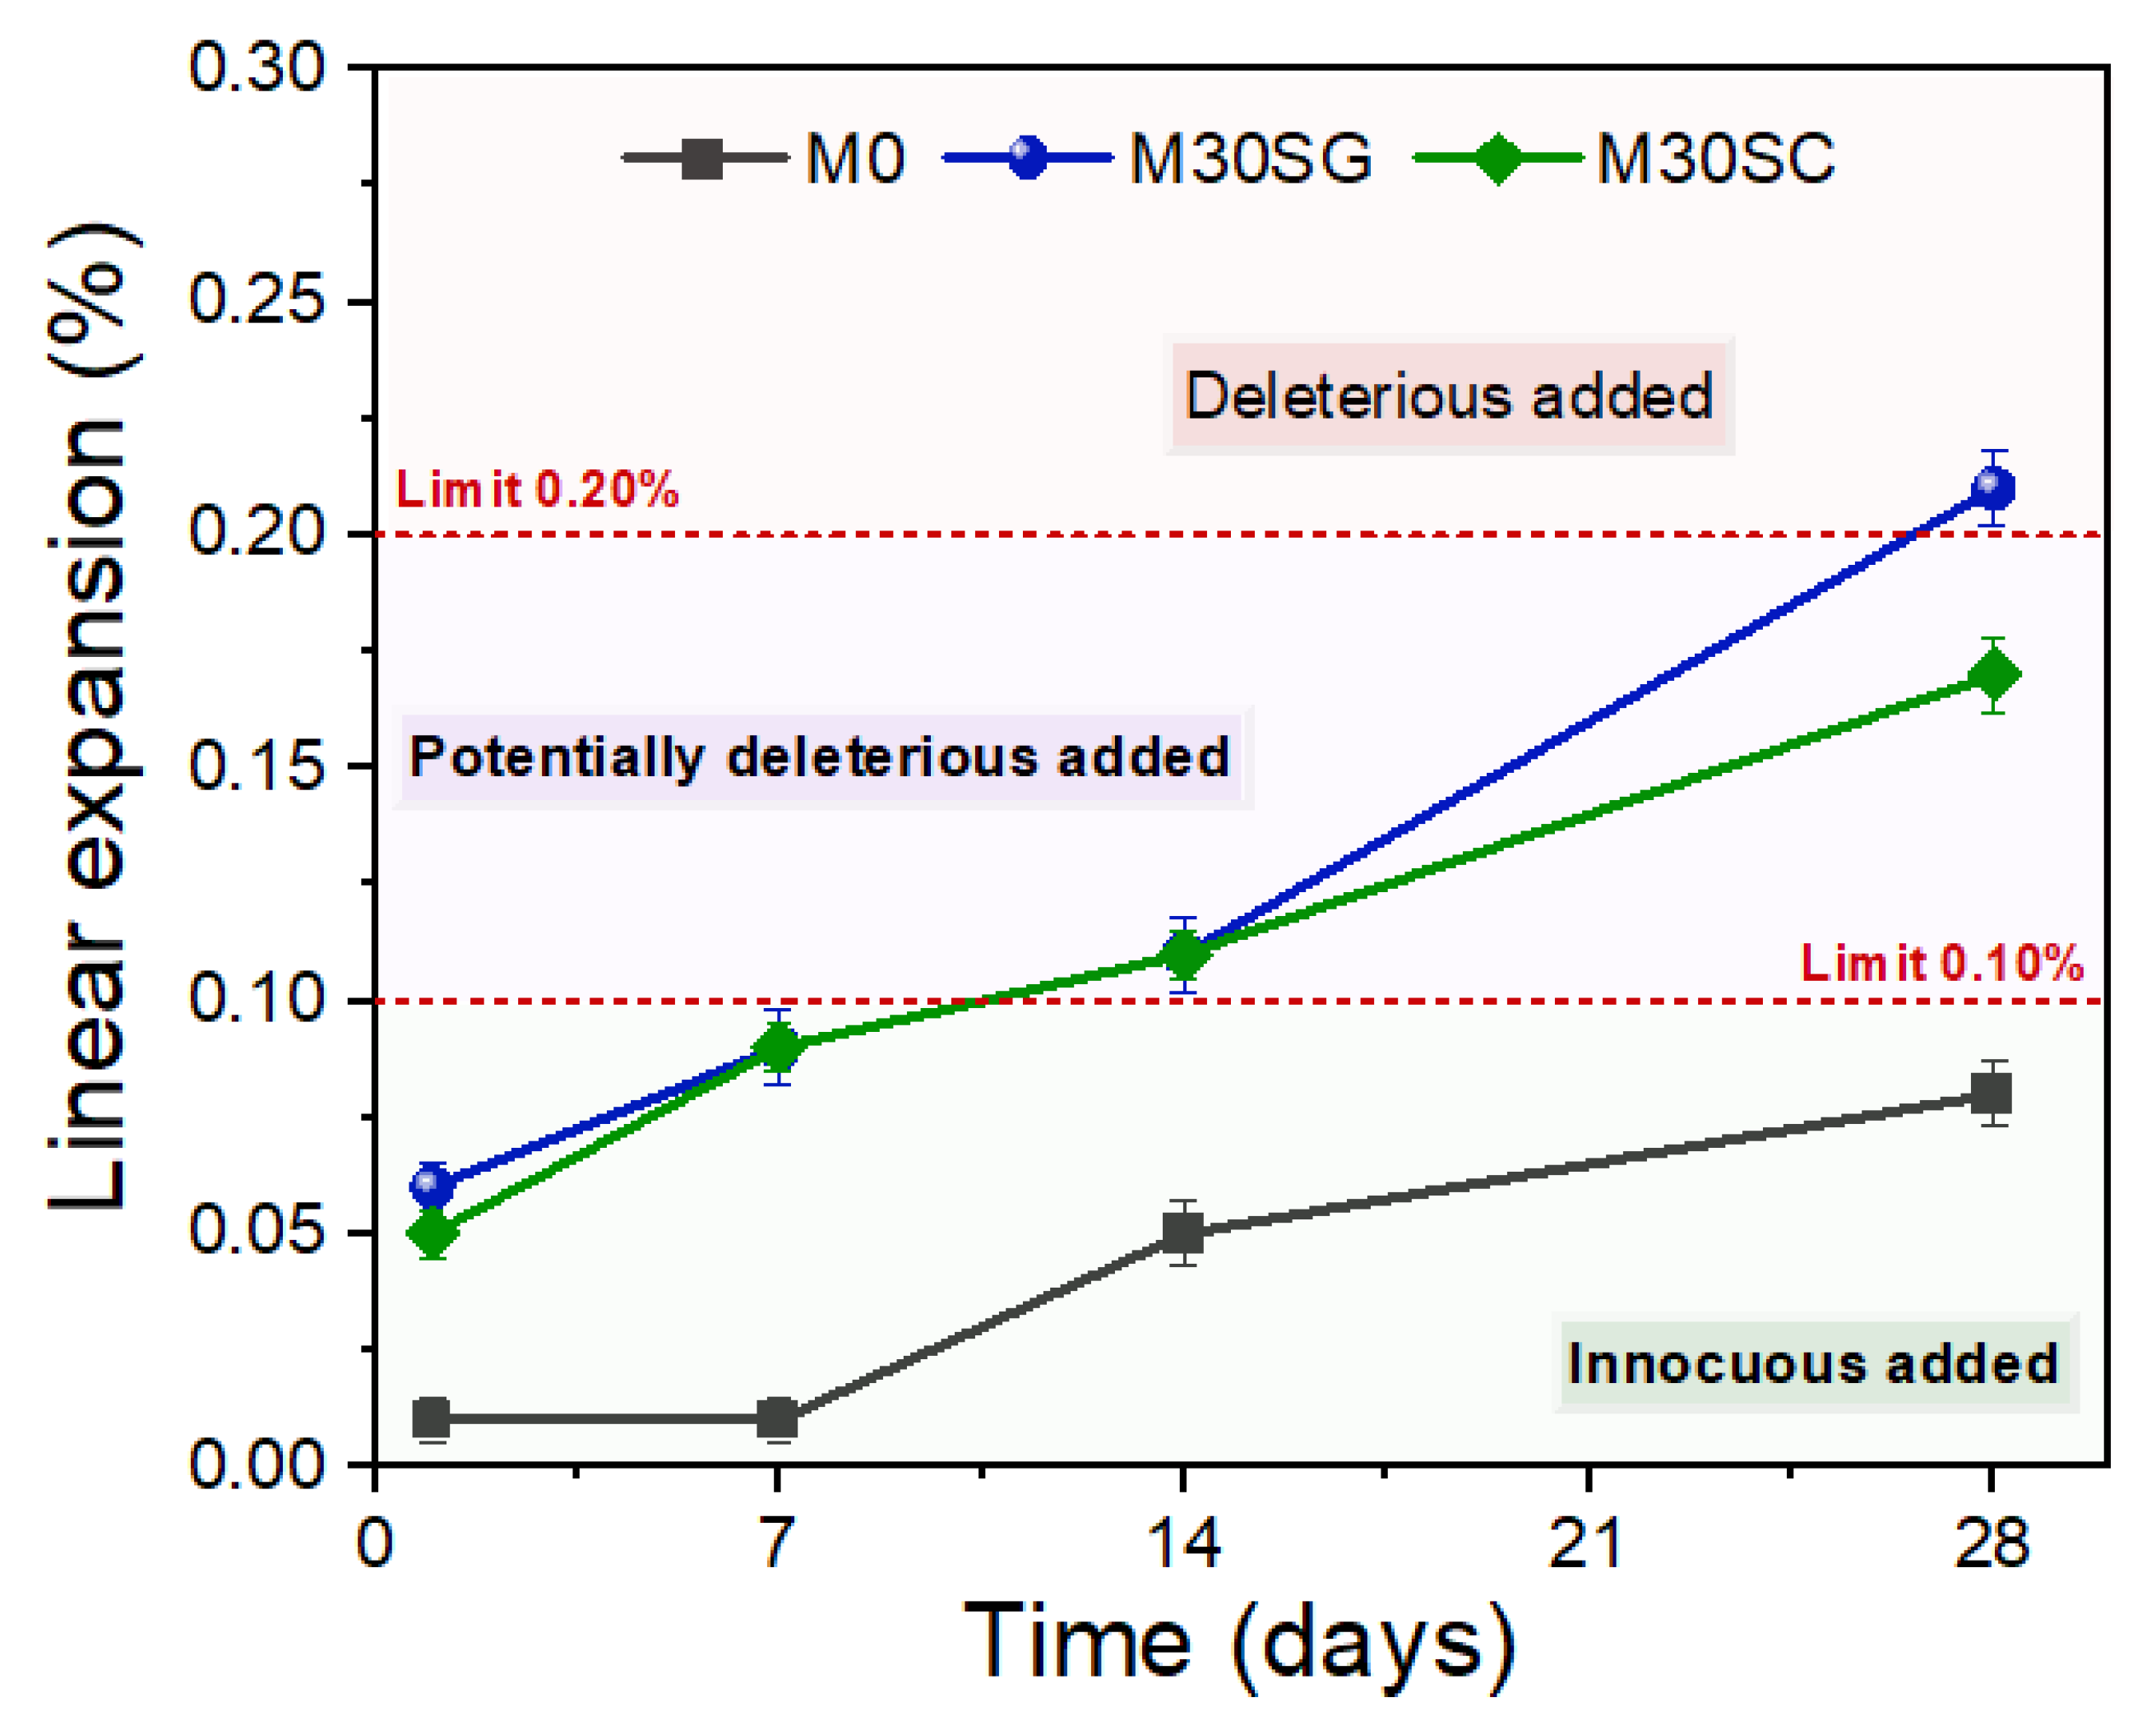
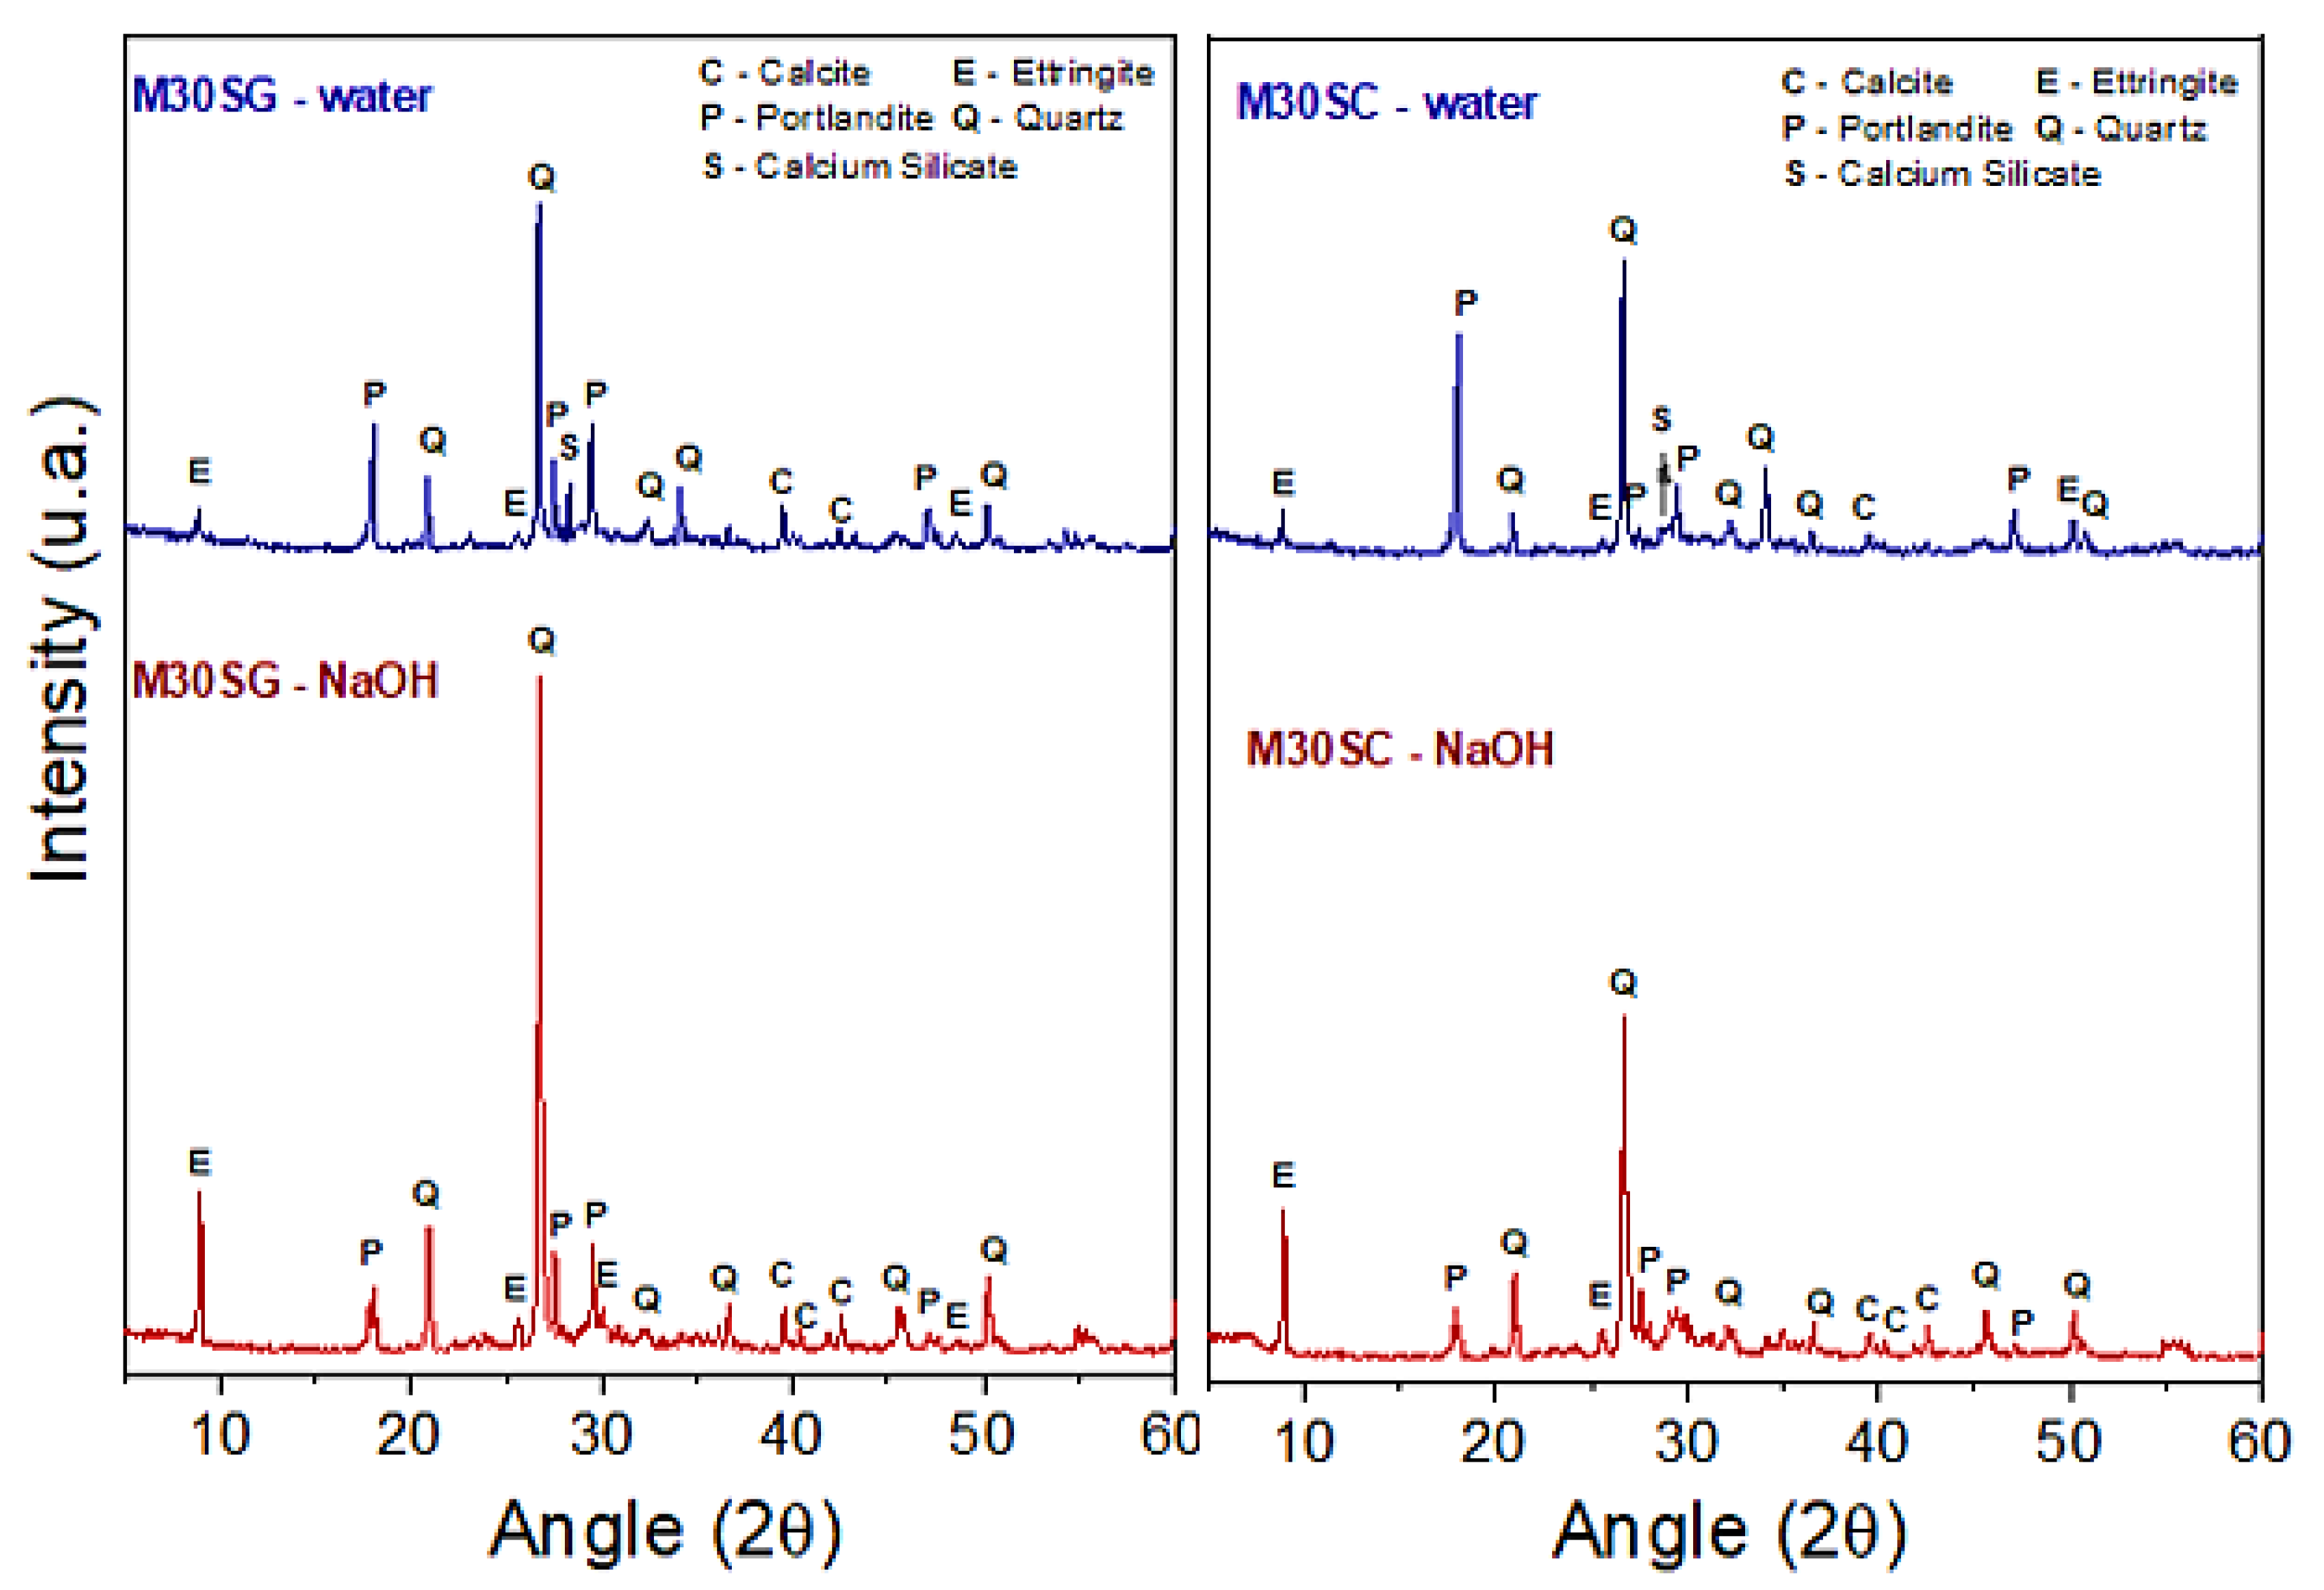
3.2. Resistance to Alkali-Aggregate Reaction

Figure 7 shows the linear expansion values measured from the M0, M30SG, and M30SC samples immersed in a 1N NaOH solution for 28 days. The expansion values for the M0 mortar (without ST) were below the limits specified in the ASTM C1260 [34] standard, which sets a maximum expansion value of 0.10% at 14 days and 0.20% at 28 days. This indicates that the QS does not exhibit deleterious potential. These results are in line with the chemical composition (Table 1) and mineralogy (Figure 2a) of QS, which indicates that the present silica is predominantly in the form of non-reactive silica, quartz, and mica materials. On the other hand, the potassium present in QS is associated with the mica structure, which imparts a low-reactivity alkaline character [37]. For the M30SG and M30SC samples, it was observed that the use of calcined ST allows for the production of materials with deleterious potential but within the acceptable range (<0.20%) established by the ASTM C1260 [34]. However, the material in its non-calcined form presents a value within the range considered deleterious by the ASTM, indicating that its use in mortar formulation should be avoided.
The MR, M0, M30SG, and M30SC samples were exposed to a 1N NaOH solution for 28 and 56 days to assess the evolution of mechanical behavior, and their compressive strength was determined. Figure 8 presents the CS values of the mortars after immersion in distilled water and the 1N NaOH solution for 28 days (Figure 8a) and 56 days (Figure 8b). Different letters indicate significant differences in CS values at a confidence level of 95%. The ascending order of the letters indicates the order of CS values, from highest to lowest. For the samples immersed in water, the CS values of M0 are statistically equal to those of MR (p = 0.5244 at 28 days and p = 0.6234 at 56 days), indicating that the substitution of commercial sand with QS did not cause significant changes in the mechanical behavior. When immersed in the 1N NaOH solution, the CS values of M0 were higher than those of MR (82.7% higher than MR at 28 days (p = 0.0003) and 46.5% at 56 days (p = 0.0103)). The partial replacement of PC with 30% STG resulted in a significant reduction in the CS values. Compared to the control group (M0), which does not contain tailings, the CS values decreased by 36.2% at 28 days (p = 0.0211) and 33.7% at 56 days (p = 0.0013). When immersed in the 1N NaOH solution, the reduction in CS values was even more significant (54.7% at 28 days (p = 0.0283) and 37.2% at 56 days (p = 0.0083)). On the other hand, the CS values of M30SC were statistically equal to those of M0 at a 95% confidence level (p = 0.9111 at 56 days in water and p = 0.0924 and p = 0.0670 at 28 and 56 days in the 1N NaOH solution). This result indicates that substituting PC with STC by up to 30% will not significantly affect the mechanical behavior of the mortars. In other words, this result suggests that STC is a sustainable and economically viable partial substitute for PC.
An increase in CS between the ages of 28 and 56 days was observed for the MR mortars (50.4% in water (p = 0.0274) and 94.6% in the 1N NaOH solution (p = 0.0008)), M0 mortars (52.7% in water (p = 0.0046) and 55.3% in the 1N NaOH solution (p = 0.0127)), and M30SG mortar immersed in the 1N NaOH solution (47.1%, (p = 0.0245)). This behavior was expected and can be attributed to the formation of calcium silicate hydrate (C–S–H) during the mortar curing process, contributing to the increase in mechanical strength. C–S–H has a three-dimensional gel structure that fills the empty spaces between the particles in the mortar, forming a cohesive and resistant structure. Over the curing time, C–S–H continues to develop, increasing its density and improving the mechanical properties of the mortar [7,38]. On the other hand, the M30SG mortar immersed in water and the M30SC mortar did not show a significant increase in CS values between the ages of 28 and 56 days (p = 0.4714). This suggests that all the relevant reactions for gaining mechanical strength occurred during the first 28 days.
An increase in CS values was observed for the M0 mortar (39.6%, (p = 0.0188)) and M30SG mortar (93.8%, (p = 0.0030)) after exposure to the 1N NaOH solution for 56 days. On the other hand, the other samples did not show significant differences in CS values (MR p = 0.3702 and M30SC p = 0.0508). This behavior indicates that the mortars containing tailings (QS, M30SG, and M30SC) developed in this study were not susceptible to the aggression of the alkaline solution, which is consistent with the results obtained in the expansion test (Figure 7). This behavior suggests that M0, M30SG, and M30SC were able to withstand the negative effects of the 1N NaOH solution, which is a positive aspect in terms of the durability and performance of these materials in chemically aggressive environments.
On the other hand, it is noted that M30SC showed higher CS values compared to M30SG (p = 0.0011 and p = 0.0005 at 28 and 56 days in water and p = 0.0036 and p = 0.0126 at 28 and 56 days in the 1N NaOH solution). This difference can be attributed to the higher content of CaO (57.3%) present in the ST after calcination (CaCO3 → CaO + CO2). Previous studies [39,40,41] have shown that CaO can accelerate hydration reactions due to increased alkalinity caused by the reaction between CaO and water to generate Ca(OH)2. Consequently, increased alkalinity accelerates the dissolution of Ca2+, Al3+, and Si4+ ions present in calcium-, aluminum-, and silicon-rich phases, resulting in the formation of hydration products such as C–S–H, which plays a crucial role in pore filling and strength gain. In fact, M30SC exhibited lower porosity (17.7%) and higher density (2.19 g·cm−3) compared to M30SG (18.9% and 2.11 g·cm−3) (Table 5).
Figure 9a,b show the differences in the microstructure of the mortars. In Figure 9a, representing M30SG, a higher presence of pores can be observed compared to M30SC in Figure 9b. This behavior is associated with the better packing provided by the calcined tailings, as indicated by the mortar density results (Table 5). In fact, it can be observed that M30SC had the highest density value among all the evaluated samples. This effect can be attributed to the smaller particle sizes exhibited by the ST after calcination (D90 = 8.43 µm) compared to the natural tailings (D90 = 16.38 µm). It is known that smaller particles provide a pore-filling effect, promoting better particle packing [42,43].
Still, in Figure 9a, it is possible to observe the presence of elongated crystals in the form of needles, which can be associated with the ettringite phase. Ettringite is known to appear as clusters of elongated crystals that can group together, forming bundles or compact clusters. These crystals generate internal stresses and cracks around the aggregates, creating points susceptible to crack propagation. As a result, the material weakens [35,44]. On the other hand, in Figure 9b, representing M30SC, the presence of pores is less evident, the structure is more compact, and there is no presence of elongated crystals characteristic of ettringite. Therefore, M30SC exhibits a structure less prone to crack formation compared to M30SG. It is important to highlight that in the SEM images, the characteristic alkali-aggregate reaction gel was not observed in the pores or cracks, which is consistent with the results of the expansion test (Figure 7), demonstrating expansion values within the acceptable limit (<0.20%).
The XRD results of the mortars immersed in distilled water and the 1N NaOH solution for 56 days (Figure 10) confirm the presence of the ettringite phase (Ca6Al2(SO4)3(OH)12·26H2O), in addition to quartz (SiO2) and portlandite (Ca(OH)2), which are predominant phases. It is also possible to observe the presence of calcite (CaCO3) and calcium silicate (Ca2SiO4) in smaller quantities. The peaks corresponding to the ettringite and quartz phases show an intensification with the exposure of the mortars to the 1N NaOH solution. This intensification is more pronounced in M30SG. It is worth noting that the quartz present in the mortars comes from the aggregate (QS), while portlandite is formed during the hydration process of PC. Ettringite probably formed during the hydration of PC, as QS, STG, and STC do not contain sulfides in their composition (see Figure 2a,b). There is also a reduction in the intensity of the peaks corresponding to portlandite with exposure to the 1N NaOH solution, indicating that the hydrate has been consumed. This reduction can be attributed to the chemical interactions between the alkaline solution and portlandite. These interactions can lead to the formation of more stable compounds, such as C–S–H, which is one of the main contributors to the mechanical strength development of the mortars [38].
Figure 11 shows the TGA curves of the samples after immersion in water and after immersion in the 1N NaOH solution for a period of 56 days. It can be observed that MS30G and M30SC immersed in water exhibit more intense mass loss stages compared to those immersed in the solution. The most significant mass loss stages are observed in the following temperature ranges: 26 °C–385 °C, 385 °C–500 °C, and 500 °C–800 °C. These mass loss stages occur due to the dehydration or decomposition of the phases present in the mortars. The mass loss in the first region, between 26 °C and 385 °C, corresponds to the evaporation of free water as well as the decomposition of the C–S–H, ettringite (AFt), and AFm phases present [45]. In the temperature range between 385 °C and 500 °C, dehydroxylation of portlandite occurs, which decomposes into calcium oxide and releases water (Ca(OH)2 → CaO + H2O). The mass loss observed in this region is related to the removal of water released during the dehydroxylation of portlandite. In the range of 500 °C to 800 °C, decarbonation of calcite takes place, decomposing into calcium oxide and carbon dioxide (CaCO3 → CaO + CO2). The mass loss measured in this temperature range is associated with the release of CO2 during decarbonation [35].
Based on the TGA/DTGA results, the quantification of the main phases present in the mortars up to 1000 °C was performed, and the results are presented in Table 6. The percentages of the portlandite and calcite phases were calculated according to Equations (3) and (4). Regarding the C–S–H, ettringite, and AFm phases, it was not possible to calculate their individual percentages due to the overlapping decomposition peaks, as well as the simultaneous removal of free water during the decomposition process. Therefore, the percentages presented in Table 5 for these compounds correspond to the gross decomposition, i.e., the overall weight loss in the first region (between 26 °C and 385 °C).
% Ca OH 2 = MMCa OH 2 MMH 2 O × % H 2 O = 74.09 18.02 × % H 2 O = 4.11 × % H 2 O
% CaCO 3 = MMCaCO 3 MMCO 2 × % CO 2 = 100.09 44.01 × % CO 2 = 2.27 × % CO 2
In these equations, MMCa OH 2 , MMCaCO 3 , MMH 2 O , and MMCO 2 represent, respectively, the molar masses of portlandite, calcite, water, and carbon dioxide; % H 2 O and % CO 2 are the calculated mass losses [46].
Overall, a reduction in mass loss can be observed in the temperature range corresponding to the formation of C–S–H (26 °C–385 °C) with the partial substitution of PC by STG and STC. This behavior indicates that using 30% STG and STC as partial replacements for PC reduced the formation of C–S–H, which plays an important role in the mechanical strength gain of mortars. The reduction in C–S–H formation was more pronounced in M30SG (reduction of 44.9% and 116.3% compared to M0 when immersed in water and the 1N NaOH solution, respectively) than in M30SC (reduction of 13.6% and 43.1%). This difference justifies the lower CS values presented by M30SG. It is important to note that the mass loss values related to the C–S–H formation region are combined with ettringite and AFm compounds. Therefore, although M30SC showed a reduction in the mass loss in this temperature range (26 °C–385 °C), there was no reduction in the CS values compared to M0, indicating that many of the compounds formed in this region are C–S–H. In the CaCO3 decomposition range, a 152% increase in its content was observed in M30SG compared to M0 when immersed in water. However, when exposed to the 1N NaOH solution, there was a 30.7% reduction in this content. This increase in CaCO3 content suggests that M30SG is more susceptible to the carbonation phenomenon.
In general, it can be observed that the substitution of PC by STC did not cause significant changes in the mechanical behavior compared to the M0 sample (without tailings). This indicates that the STC can partially replace the PC without significantly compromising the mechanical performance of the mortars. On the other hand, the non-calcined ST should be used cautiously, as it reduced the CS values.

4. Conclusions

The results demonstrated that it is possible to replace natural sand with quartzite sand without altering the mechanical behavior and the evolution of the mechanical properties of the developed mortars. The results of the experimental design demonstrated that the quadratic (R2 = 90.17%) and special cubic (R2 = 92.85%) models, proposed to predict the mechanical behavior and water absorption of the mortars, were effective in explaining the observed variations and showed good predictive capability. Overall, substituting 30% of Portland cement with calcined scheelite tailings did not significantly compromise the long-term mechanical performance of the mortars. However, using non-calcined scheelite tailings is not recommended as it showed detrimental effects on the mechanical properties of the produced mortars. Compared to the control group, which did not contain tailings, the compressive strength values decreased by 36.2% at 28 days and by 33.7% at 56 days. Furthermore, it was found that the mortars with scheelite tailings exhibited good resistance to the detrimental effects of the 1N NaOH solution, indicating satisfactory durability in chemically aggressive environments. These results highlight the feasibility of using mineral tailings as alternative raw materials in mortars without compromising their mechanical and durability properties, thus promoting sustainability in the construction industry.

Author Contributions

Conceptualization, T.d.L.A., R.R.M. and G.d.A.N.; methodology, T.d.L.A. and R.C.D.; software, F.P.d.C.; validation, formal analysis, and investigation, T.d.L.A., R.C.D. and A.M.R.; resources, R.R.M. and G.d.A.N.; data curation and writing—original draft preparation, T.d.L.A. and F.P.d.C.; writing—review and editing, F.P.d.C., R.R.M., A.M.R. and G.d.A.N.; visualization, R.C.D. and A.M.R.; supervision, project administration, and funding acquisition, R.R.M. and G.d.A.N. All authors have read and agreed to the published version of the manuscript.

Funding

This research was funded by Coordenação de Aperfeiçoamento de Pessoal de Nível Superior (CAPES), grant numbers 88887.814293/2023-00 and 88887.597478/2021-00, as well as Conselho Nacional de Desenvolvimento Científico e Tecnológico (grant number 313616/2020-5) and Fundação de Apoio à Pesquisa do Estado da Paraíba (grant number 48332.712.29500.30082021).

Institutional Review Board Statement

Not applicable.

Informed Consent Statement

Not applicable.

Data Availability Statement

The data presented in this study are contained within the article.

Acknowledgments

The authors would like to thank the support provided by the Laboratory of Materials Technology (LTM), where it was possible to carry out the experiments of this work.

Conflicts of Interest

The authors declare no conflict of interest.

References

  1. Henderson, K.; Loreau, M. A Model of Sustainable Development Goals: Challenges and Opportunities in Promoting Human Well-Being and Environmental Sustainability. Ecol. Model. 2023, 475, 110164. [Google Scholar] [CrossRef]
  2. Izumi, Y.; Iizuka, A.; Ho, H.J. Calculation of Greenhouse Gas Emissions for a Carbon Recycling System Using Mineral Carbon Capture and Utilization Technology in the Cement Industry. J. Clean. Prod. 2021, 312, 127618. [Google Scholar] [CrossRef]
  3. Proaño, L.; Sarmiento, A.T.; Figueredo, M.; Cobo, M. Techno-Economic Evaluation of Indirect Carbonation for CO2 Emissions Capture in Cement Industry: A System Dynamics Approach. J. Clean. Prod. 2020, 263, 121457. [Google Scholar] [CrossRef]
  4. Henry, C.S.; Lynam, J.G. Embodied Energy of Rice Husk Ash for Sustainable Cement Production. Case Stud. Chem. Environ. Eng. 2020, 2, 100004. [Google Scholar] [CrossRef]
  5. Mohamad, N.; Muthusamy, K.; Embong, R.; Kusbiantoro, A.; Hashim, M.H. Environmental Impact of Cement Production and Solutions: A Review. Mater. Today Proc. 2022, 48, 741–746. [Google Scholar] [CrossRef]
  6. de Oliveira Neto, R.E.; de Melo Cartaxo, J.; Rodrigues, A.M.; de Araújo Neves, G.; Menezes, R.R.; da Costa, F.P.; Barros, S.V.A. Durability Behavior of Mortars Containing Perlite Tailings: Alkali–Silicate Reaction Viewpoint. Sustainability 2021, 13, 9203. [Google Scholar] [CrossRef]
  7. Rodrigues, A.M.; Costa, F.P.D.; Beltrão, S.L.D.; Fernandes, J.V.; Menezes, R.R.; Neves, G.D.A. Development of Eco-Friendly Mortars Produced with Kaolin Processing Waste: Durability Behavior Viewpoint. Sustainability 2021, 13, 11395. [Google Scholar] [CrossRef]
  8. Haines, A.; Amann, M.; Borgford-Parnell, N.; Leonard, S.; Kuylenstierna, J.; Shindell, D. Short-Lived Climate Pollutant Mitigation and the Sustainable Development Goals. Nat. Clim. Chang. 2017, 7, 863–869. [Google Scholar] [CrossRef]
  9. Almeida, E.P.; Carreiro, M.E.A.; Rodrigues, A.M.; Ferreira, H.S.; Santana, L.N.L.; Menezes, R.R.; Neves, G.A. A New Eco-Friendly Mass Formulation Based on Industrial Mining Residues for the Manufacture of Ceramic Tiles. Ceram. Int. 2021, 47, 11340–11348. [Google Scholar] [CrossRef]
  10. Fernandes, J.V.; Guedes, D.G.; da Costa, F.P.; Rodrigues, A.M.; Neves, G.D.A.; Menezes, R.R.; Santana, L.N.D.L. Sustainable Ceramic Materials Manufactured from Ceramic Formulations Containing Quartzite and Scheelite Tailings. Sustainability 2020, 12, 9417. [Google Scholar] [CrossRef]
  11. Kara, İ.B. Characterization of Copper Tailings in Murgul Copper Plant, Turkey, and Its Utilization Potential in Cement Mortar with Nano-and Micro-Silica. Environ. Sci. Pollut. Res. 2022, 29, 36938–36950. [Google Scholar] [CrossRef]
  12. Campos, H.F.; Klein, N.S.; Filho, J.M.; Bianchini, M. Low-Cement High-Strength Concrete with Partial Replacement of Portland Cement with Stone Powder and Silica Fume Designed by Particle Packing Optimization. J. Clean. Prod. 2020, 261, 121228. [Google Scholar] [CrossRef]
  13. Lezzerini, M.; Luti, L.; Aquino, A.; Gallello, G.; Pagnotta, S. Effect of Marble Waste Powder as a Binder Replacement on the Mechanical Resistance of Cement Mortars. Appl. Sci. 2022, 12, 4481. [Google Scholar] [CrossRef]
  14. Song, W.; Wang, Q.; Qu, L.; Li, X.; Xu, S. Study of Water Absorption and Corrosion Resistance of the Mortar with Waste Marble Powder. Constr. Build. Mater. 2022, 345, 128235. [Google Scholar] [CrossRef]
  15. Rashad, A.M. An Overview of Pumice Stone as a Cementitious Material—The Best Manual for Civil Engineer. Silicon 2021, 13, 551–572. [Google Scholar] [CrossRef]
  16. Ramezanianpour, A.A.; Motahari, S.M.; Vosoughi, P.; Pilvar, A.; Isapour, S.; Moodi, F. Effects of Calcined Perlite Powder as a SCM on the Strength and Permeability of Concrete. Constr. Build. Mater. 2014, 66, 222–228. [Google Scholar] [CrossRef]
  17. Mello, L.C.D.A.; Marcos, A.S.; De Sá, M.V.V.A.; De Souza, N.S.L.; De Farias, E.C. Effect of High Temperatures on Self-Compacting Concrete with High Levels of Sugarcane Bagasse Ash and Metakaolin. Constr. Build. Mater. 2020, 248, 118715. [Google Scholar] [CrossRef]
  18. Tavares, J.C.; Lucena, L.F.L.; Henriques, G.F.; Ferreira, R.L.S.; Marcos, A.S. Use of Banana Leaf Ash as Partial Replacement of Portland Cement in Eco-Friendly Concretes. Constr. Build. Mater. 2022, 346, 128467. [Google Scholar] [CrossRef]
  19. Nassar, R.U.D.; Singh, N.; Varsha, S.; Sai, A.R.; Sufyan-Ud-Din, M. Strength, Electrical Resistivity and Sulfate Attack Resistance of Blended Mortars Produced with Agriculture Waste Ashes. Case Stud. Constr. Mater. 2022, 16, e00944. [Google Scholar] [CrossRef]
  20. Medeiros, A.G.; Gurgel, M.T.; da Silva, W.G.; de Oliveira, M.P.; Ferreira, R.L.S.; de Lima, F.J.N. Evaluation of the Mechanical and Durability Properties of Eco-Efficient Concretes Produced with Porcelain Polishing and Scheelite Wastes. Constr. Build. Mater. 2021, 296, 123719. [Google Scholar] [CrossRef]
  21. Medeiros, B.A.; Neves, G.A.; Barbosa, N.P.; Menezes, R.R.; Ferreira, H.C. Mechanical Properties of Mortar Produced with the Replacement of Natural Sand by Scheelite Residue. Ceramic 2019, 65, 443–451. [Google Scholar] [CrossRef]
  22. Figueirêdo, J.M.R.D.; Costa, F.P.D.; Fernandes, J.V.; Rodrigues, A.M.; Neves, G.D.A.; Menezes, R.R.; Santana, L.N.D.L. Development of Scheelite Tailings-Based Ceramic Formulations with the Potential to Manufacture Porcelain Tiles, Semi-Stoneware and Stoneware. Materials 2020, 13, 5122. [Google Scholar] [CrossRef]
  23. de Souza, R.S. Mortar Produced with Scheelite Residue and Cassava Wastewater. In Use of Cassava Wastewater and Scheelite Residues in Ceramic Formulations; Acchar, W., da Silva, V.M., Eds.; Springer International Publishing: Cham, Switzerland, 2021; pp. 53–83. ISBN 978-3-030-58782-6. [Google Scholar]
  24. Choi, Y.W.; Kim, Y.J.; Choi, O.; Lee, K.M.; Lachemi, M. Utilization of Tailings from Tungsten Mine Waste as a Substitution Material for Cement. Constr. Build. Mater. 2009, 23, 2481–2486. [Google Scholar] [CrossRef]
  25. Kim, Y.J.; Kim, Y.J.; Choi, Y.W. An Experimental Research on Self-Consolidating Concrete Using Tungsten Mine Tailings. KSCE J. Civ. Eng. 2016, 20, 1404–1410. [Google Scholar] [CrossRef]
  26. ASTM C150/C150M-20; Standard Specification for Portland Cement. ASTM International: West Conshohocken, PA, USA, 2020.
  27. ASTM C618-22; Standard Specification for Coal Fly Ash and Raw or Calcined Natural Pozzolan for Use in Concrete. ASTM International: West Conshohocken, PA, USA, 2022.
  28. Data Science Workbench; TIBCO Software Inc.: Palo Alto, CA, USA, 2020.
  29. Li, Z.; Liu, J.; Liu, H.; Zhao, H.; Xu, R.; Gurkalo, F. Stress Distribution in Direct Shear Loading and Its Implication for Engineering Failure Analysis. Int. J. Appl. Mech. 2023, 15, 1–24. [Google Scholar] [CrossRef]
  30. Zhang, Z.; Li, Z.; Xu, G.; Gao, X.; Liu, Q.; Li, Z.; Liu, J. Lateral Abutment Pressure Distribution and Evolution in Wide Pillars under the First Mining Effect. Int. J. Min. Sci. Technol. 2023, 33, 309–322. [Google Scholar] [CrossRef]
  31. ASTM C1437-20; Standard Test Method for Flow of Hydraulic Cement Mortar. ASTM International: West Conshohocken, PA, USA, 2020. [CrossRef]
  32. ASTM C642-21; Standard Test Method for Density, Absorption, and Voids in Hardened Concrete. ASTM International: West Conshohocken, PA, USA, 2021. [CrossRef]
  33. ASTM C39/C39M-21; Standard Test Method for Compressive Strength of Cylindrical Concrete Specimens. ASTM International: West Conshohocken, PA, USA, 2021. [CrossRef]
  34. ASTM C1260-21; Standard Test Method for Potential Alkaline Reactivity of Aggregates (Mortar-Bar Method). ASTM International: West Conshohocken, PA, USA, 2021. [CrossRef]
  35. de Oliveira Neto, R.E.; Cartaxo, J.D.M.; Rodrigues, A.M.; Barros, S.V.A.; da Costa, F.P.; Neves, G.D.A.; Menezes, R.R. New Sustainable Mortar Compositions Containing Perlite Waste. Clean Technol. Environ. Policy 2022, 24, 1403–1415. [Google Scholar] [CrossRef]
  36. ASTM C270−19a; Standard Specification for Mortar for Unit Masonry. ASTM International: West Conshohocken, PA, USA, 2019; pp. 1–14.
  37. Barros, S.V.A.; Marciano, J.E.A.; Ferreira, H.C.; Menezes, R.R.; Neves, G.D.A. Addition of Quartzite Residues on Mortars: Analysis of the Alkali Aggregate Reaction and the Mechanical Behavior. Constr. Build. Mater. 2016, 118, 344–351. [Google Scholar] [CrossRef]
  38. Fu, C.; Guo, R.; Lin, Z.; Xia, H.; Yang, Y.; Ma, Q. Effect of Nanosilica and Silica Fume on the Mechanical Properties and Microstructure of Lightweight Engineered Cementitious Composites. Constr. Build. Mater. 2021, 298, 123788. [Google Scholar] [CrossRef]
  39. Lin, Y.; Xu, D.; Ji, W.; Zhao, X. Experiment on the Properties of Soda Residue-Activated Ground Granulated Blast Furnace Slag Mortars with Different Activators. Materials 2022, 15, 3578. [Google Scholar] [CrossRef]
  40. Burciaga-Díaz, O.; Betancourt-Castillo, I.E.; Montes-Escobedo, M.E.; Escalante-García, J.I. One-Part Pastes and Mortars of CaO-Na2CO3 Activated Blast Furnace Slag: Microstructural Evolution, Cost and CO2 Emissions. Constr. Build. Mater. 2023, 368, 130431. [Google Scholar] [CrossRef]
  41. Gu, K.; Jin, F.; Al-Tabbaa, A.; Shi, B. Activation of Ground Granulated Blast Furnace Slag by Using Calcined Dolomite. Constr. Build. Mater. 2014, 68, 252–258. [Google Scholar] [CrossRef] [Green Version]
  42. Dobiszewska, M.; Bagcal, O.; Beycioğlu, A.; Goulias, D.; Köksal, F.; Niedostatkiewicz, M.; Ürünveren, H. Influence of Rock Dust Additives as Fine Aggregate Replacement on Properties of Cement Composites—A Review. Materials 2022, 15, 2947. [Google Scholar] [CrossRef] [PubMed]
  43. Rezende, V.; Cristina, L.; Costa, B.; Pereira, F.; Cesar, A.; De Carvalho, F.; Andre, R. Performance of Low-Energy Steel Slag Powders as Supplementary Cementitious Materials. Constr. Build. Mater. 2023, 392, 131888. [Google Scholar] [CrossRef]
  44. Yang, R.; Zhang, M.; Li, Z.; He, F. Microstructural Insight into the Deterioration Mechanism of the Mortar Subject to the Combined Action of External Sulfate Attack and Cyclic Wetting–Drying. Constr. Build. Mater. 2022, 317, 125484. [Google Scholar] [CrossRef]
  45. Song, H.; Jeong, Y.; Bae, S.; Jun, Y.; Yoon, S.; Oh, J.E. A Study of Thermal Decomposition of Phases in Cementitious Systems Using HT-XRD and TG. Constr. Build. Mater. 2018, 169, 648–661. [Google Scholar] [CrossRef]
  46. Shi, Z.; Geiker, M.R.; Lothenbach, B.; De Weerdt, K.; Garzon, S.F.; Enemark-Rasmussen, K.; Skibsted, J. Friedel ’ s Salt pro Fi Les from Thermogravimetric Analysis and Thermodynamic Modelling of Portland Cement-Based Mortars Exposed to Sodium Chloride Solution. Cem. Concr. Compos. J. 2017, 78, 73–83. [Google Scholar] [CrossRef]
Figure 1. Images of QS (a) and ST as received (b), including the particle size distribution curves of QS (c) and STG and STC compared to PC (d). (e,f) show ST images after grinding and after calcination at 1000 °C.
Sustainability 15 11544 g001
Figure 2. XRD patterns of (a) QS, (b) STG, and STC.
Sustainability 15 11544 g002
Figure 3. Composition triangle estimated by the experimental design with the seven defined compositions of the components PC, STG, and STC.
Sustainability 15 11544 g003
Figure 4. Flowchart with the steps of the methodology used in this study.
Sustainability 15 11544 g004
Figure 5. Observed versus predictive values at a significance level of 5% obtained from the quadratic regression model for CS (a) and the special cubic regression model for WA (b).
Sustainability 15 11544 g005
Figure 6. Response surface plots for compressive strength (a) and water absorption (b).
Sustainability 15 11544 g006
Figure 7. Linear expansions measured from the samples immersed in 1N NaOH solution for 28 days.
Sustainability 15 11544 g007
Figure 8. Compressive strength of mortars after the 28-day (a) and 56-day (b) curing in the 1N NaOH solution and distilled water. Different letters show significant differences (p < 0.05, Tukey test).
Sustainability 15 11544 g008
Figure 9. SEM images of MS30G (a) and MS30C (b) after immersion in 1N NaOH solution for 56 days.
Sustainability 15 11544 g009
Figure 10. XRD patterns of M30SG and M30SC samples immersed in distilled water and 1N NaOH solution for 56 days.
Sustainability 15 11544 g010
Figure 11. TGA and DTGA curves of M0, MS30G, and M30SC immersed in distilled water and 1N NaOH solution for 56 days.
Sustainability 15 11544 g011
Table 1. Chemical composition of QS, PC, STG, and STC obtained by XRF.
Raw MaterialsOxides (%)
SiO2Al2O3Fe2O3CaOK2OMgOSO3MnOOthers* LOI
QS66.417.23.01.57.71.80.30.10.61.4
PC15.04.03.166.91.51.24.80.33.2
STG16.46.15.048.11.03.40.10.30.619.0
STC20.36.36.157.30.34.21.50.41.02.6
* LOI—Loss on ignition measured after drying at 110 °C and firing at 1000 °C.
Table 2. Compositions obtained from experimental design for constrained mixtures with three factors (PC, STG, and STC).
Components (%)Compositions
1234567
PC100707085857080
STC03000151510
STG00301501510
Table 3. Compressive strength (CS) and water absorption (WA) values measured from the mortar compositions with different component proportions (PC, STC, and STG).
CompositionsComponents (%)CS Values * (MPa)WA Values * (%)
PCSTCSTG123123
1100006.567.418.2513.113.913.5
2703008.8910.399.4612.612.612.6
3700303.564.485.0713.313.113.2
4850156.956.176.5612.913.012.9
5851507.297.167.1513.413.013.2
67015156.796.006.4014.714.714.7
78010107.217.107.1612.713.313.0
* Each CS and WA value corresponds to the average of three samples.
Table 4. Statistical parameters (Ftest, Fcal/Ftab, Pvalue, R2, and R2ajust) calculated from different regression models (linear, quadratic, and special cubic) for the CS and WA.
Regression ModelsFtestFcal/FtabPvalue* R2 (%)** R2ajust (%)
CSLinear10.132.850.0000270.2666.95
Quadratic21.266.460.0006790.1786.90
Special Cubic1.020.220.3291590.8486.92
WALinear0.320.090.733673.380.01
Quadratic19.335.880.0000280.1473.53
Special Cubic24.885.410.0001292.8589.79
* R2: determination coefficient; ** R2ajust: adjusted determination coefficient.
Table 5. Density and porosity values of mortars MR, M0, M30SG, and M30SC. Different letters show significant differences (p < 0.05, Tukey test).
MRM0M30SGM30SC
Density (g·cm−3)2.05 ± 0.01 c1.95 ± 0.01 d2.11 ± 0.01 b2.19 ± 0.01 a
Porosity (%)17.2 ± 0.4 b11.5 ± 0.6 c18.9 ± 0.5 a17.7 ± 0.3 b
Table 6. Percentage estimation of the hydrated products present in the mortars investigated in this study, immersed in distilled water and 1N NaOH solution for 56 days.
ConditionMortarWeight Loss (%)Estimated Amount (%)
Total Free Water, C-S-H, AFt, and AFm *Ca(OH)2CaCO3
WaterM017.510.014.46.1
MS30G17.96.910.715.4
M30SC17.08.815.67.0
1N NaOH solutionM017.19.311.19.8
MS30G9.34.34.57.5
M30SC10.76.57.04.8
* The percentages correspond to the gross decomposition without applying any multiplication factor since the combined water loss occurred due to the decomposition of distinct phases.
Disclaimer/Publisher’s Note: The statements, opinions and data contained in all publications are solely those of the individual author(s) and contributor(s) and not of MDPI and/or the editor(s). MDPI and/or the editor(s) disclaim responsibility for any injury to people or property resulting from any ideas, methods, instructions or products referred to in the content.

