Article

Dynamic Evaluation of Ecological Environment Quality in Coastal Cities from the Perspective of Water Quality: The Case of Fuzhou City

School of Geographical Sciences, School of Carbon Neutrality Future Technology, Fujian Normal University, Fuzhou 350117, China
*
Author to whom correspondence should be addressed.
Sustainability 2023, 15(15), 11537; https://doi.org/10.3390/su151511537
Submission received: 26 June 2023 / Revised: 21 July 2023 / Accepted: 24 July 2023 / Published: 26 July 2023
(This article belongs to the Section Environmental Sustainability and Applications)

Abstract

:
Urbanization has led to enormous pressure on the urban ecological environment, especially in coastal cities. It is important to evaluate the ecological quality of coastal cities. We compared the remote sensing-based ecological index (RSEI) and the water benefit-based ecological index (WBEI) indices of Fuzhou City, and selected the WBEI to assess the changes in the quality of the ecological environment in Fuzhou City from 2000 to 2020 and analyzed the relevant changes in land intensity. The results show that (1) the Fuzhou WBEI outperforms the RSEI in the evaluation of ecological quality in the study area, since the WBEI takes into account water efficiency and can more accurately represent the ecological environment of coastal cities; (2) during 2000–2020, the overall trend of ecological quality in Fuzhou is better, with nonsignificant decreasing areas in the western and northern mountainous areas and a significant increasing trend in the southeast coast; and (3) different land use types influence the urban ecological environment quality, with forests and man-made surfaces having a good correlation with the WBEI. The increase in forests contributes to the improvement of urban ecological environment quality, and the conversion of high-intensity arable land and construction land decreases urban ecological environment quality. This study can provide a basic reference for the assessment of ecological environment quality in Fuzhou City and provide experience for the ecological environment assessment of coastal cities.

Graphical Abstract

1. Introduction

Urbanization, driven by rapid population growth and economic development, has transformed the global landscape and resulted in the proliferation of ecological environment risk [1,2,3,4,5]. The process of urbanization alters natural landscapes [6,7,8], leads to the loss of biodiversity [9,10,11], increases pollution levels [12,13], and disrupts ecosystem services [14,15,16]. As a result, the quality of the urban ecological environment is becoming increasingly recognized as a critical factor for sustainable urban development. To address these challenges, it is crucial to assess the impact of urbanization on urban ecological environment quality and develop strategies that promote sustainability.
Due to their geographical advantages, coastal cities have more rapid economic and construction development and high and rapid urbanization rates and levels [17,18,19]. Its urban land use structures [20,21,22], ecosystems [23,24,25], and landscapes [26,27,28] tend to change rapidly in a relatively short period of time, making it more important to continuously assess ecological landscape risks in coastal cities. Remote sensing technology offers a comprehensive framework to evaluate and monitor the various dimensions of the urban ecological environment, taking into account factors such as air and water quality, green infrastructure, biodiversity conservation, and sustainable resource management [29,30,31].
In recent years, researchers have employed remote sensing techniques to investigate various aspects of urban ecological environment quality. By quantifying and visualizing these ecological indicators, remote sensing contributes to a better understanding of the complex dynamics between urbanization and the environment. Diverse remote sensing products, such as the normalized difference vegetation index (NDVI), land surface temperature (LST), and impervious surface, can reflect the ecological environment characteristics from different levels, and the assessment of the whole urban ecosystem requires the integration of multisource ecological remote sensing data. Given the complexity and diversity of ecosystem structures, Xu et al. integrated multisource ecological environment factors and proposed a remote sensing ecological index (RSEI) to comprehensively reflect the quality of the ecological environment [32]. The advantage of this index is that the data are easy to obtain and can be collected by remote sensing technology, which is widely used to assess the ecological quality of cities. [33,34,35]. The RSEI is obtained by principal component analysis of four indicators: greenness, dryness, heat, and humidity; however, this renders the model results open to influence by the eigenvectors and has some limitations for different study areas [36,37]. For example, Bai et al. [38] introduced salinity and desertification indices to reflect the ecological quality of arid areas. Shi et al. selected 18 indices for the optimization of regional ecological quality [39]. Other scholars have used contrast- and information entropy-based algorithms to obtain evaluations [40,41]. Jiao et al. considered the water benefits in the city and used the entropy weighting method to develop the evaluation index WBEI for the quality of the urban ecological environment by using the measured data as well as the wave comparison [42].
Fuzhou is the capital city of Fujian Province in China. It is located in the southeastern part of the country along the eastern coast. Fuzhou City, similar to many rapidly urbanizing areas, is experiencing significant changes in its ecological environment due to urbanization. As the city expands and its infrastructure develops, it becomes essential to assess the impact of urbanization on the ecological environment to ensure sustainable and balanced growth. Therefore, this paper compares the RSEI and WBEI indices, selects the optimized WBEI, and analyzes the trend of ecological environment changes in Fuzhou City from 2000 to 2020 using the Sen-MK method. It is also combined with land use intensity analysis to explore the changes in urban land use structure and the impact on ecological environment quality in the process of urbanization. The findings of this study will provide valuable insights for urban planners and policy makers, enabling them to make informed decisions and implement targeted interventions to improve ecological sustainability.

2. Materials and Methods
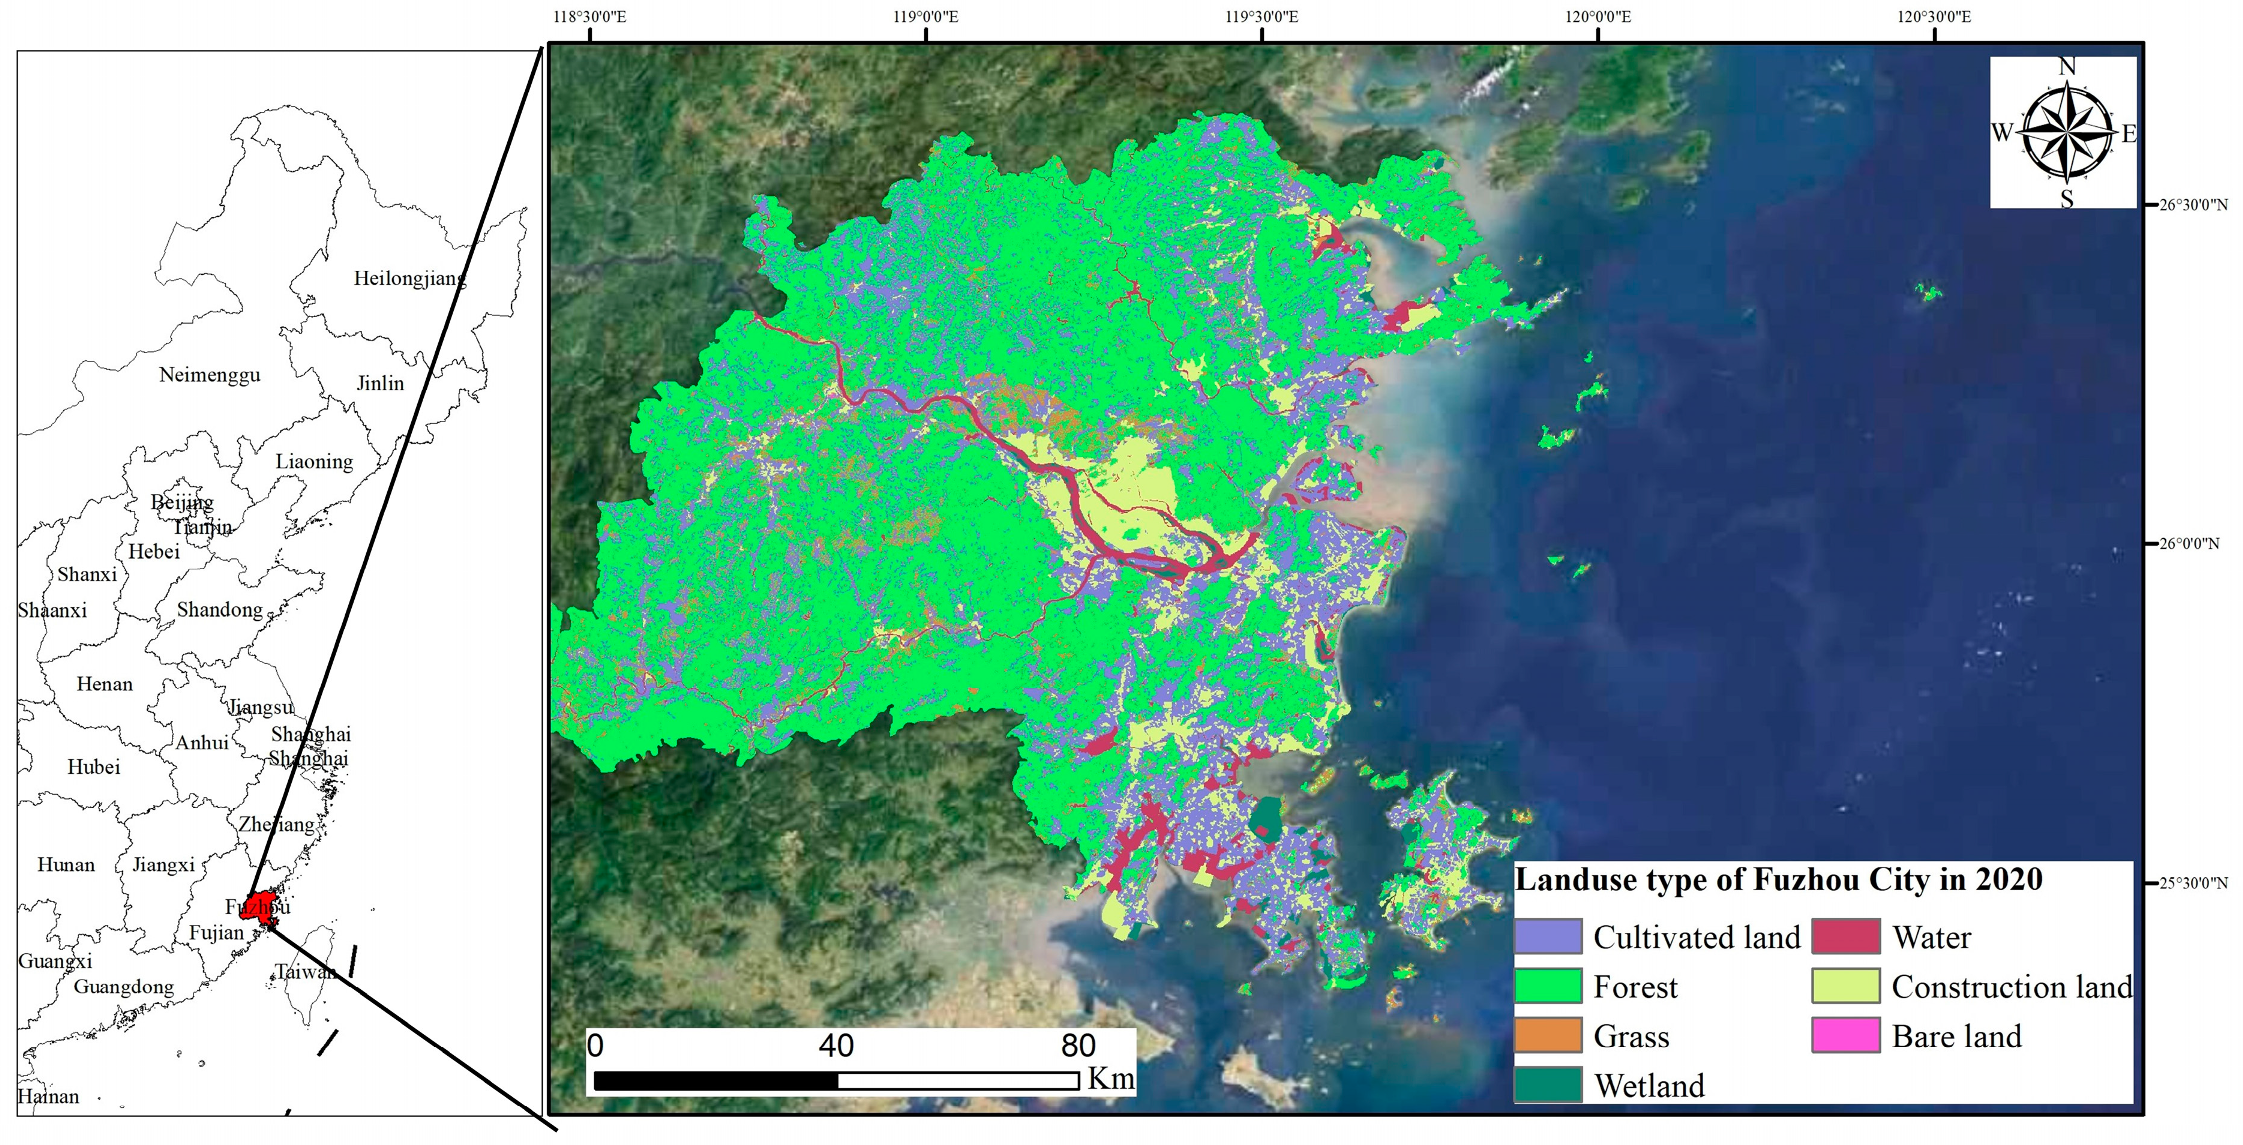
2.1. Research Area

Fuzhou City is located on the southeast coast of China, in the eastern part of Fujian Province (see Figure 1). It is located between 25°15′ and 26°39′ N and 118°08′ and 120°31′ E, and the urban area is primarily located in the center of the estuarine basin in the lower reaches of the Min River. Fuzhou City is located in the overland subtropical–to–south subtropical area and belongs to the oceanic monsoon climate, with a mild climate year-round. At the beginning of the reform and opening up, Fuzhou was listed as one of the 14 coastal port cities opened to the outside world. Since the 1990s, Fuzhou has experienced rapid economic development, urbanization and industrial processes have accelerated significantly, and urban land use structure and ecosystem problems have become prominent. The built-up area of Fuzhou City is mainly developed around the Min River, so the assessment of the urban water environment needs to be strengthened when evaluating the quality of the urban ecological environment.

2.2. Data

2.2.1. Satellite Data

The Landsat series of satellites is a collaborative project between NASA and the U.S. Geological Survey (USGS), and they provide continuous Earth observation data. Landsat 5 and Landsat 8 provide data in the visible to infrared bands, which can be used for multilevel monitoring of urban environments. One of the bands in the blue band (0.45–0.52 μm) range is used for observations of water bodies and vegetation edges. The green wave (0.52–0.60 μm) range is particularly useful for vegetation and farmland monitoring. The band in the red wave (0.63–0.69 μm) range is important for vegetation, soil, and urban area observations. The band in the near-infrared wave (0.76–0.90 μm) range is important for vegetation health status and land use studies. The mid-infrared wave (1.55–1.75 μm) range is used to monitor the characteristics of clouds and water bodies. Shortwave infrared (2.29–12.15 μm) is used for applications such as land temperature and water content detection. In this paper, Landsat 5 and 8 satellite data from June to September 2000–2020 were used with a spatial resolution of 30 m and resampled to 500 m. Based on the Google Earth engine platform, we selected Landsat satellite data from June to September 2020 with less than 30% cloud cover for calculation.

2.2.2. Land Use Data

Global Land 30 m is a high-resolution surface dataset with global coverage developed by the National Bureau of Surveying, Mapping, and Geoinformation of China, providing detailed surface coverage information at a spatial resolution of 30 m. The dataset covers global land areas, including continents, islands, and coastal areas, and provides a detailed classification of surface features, such as vegetation, water bodies, buildings, roads, and farmlands, providing a valuable resource for surface observation and analysis on a global scale. In this paper, the Global Land 2000, 2010, and 2020 land use coverage data are selected and cropped to the Fuzhou City region.

2.3. Methods

2.3.1. Construction of the WBEI

The RSEI is widely used to evaluate the ecological environment quality of cities. It is based on satellite data and utilizes principal component analysis to quickly evaluate the ecological environment quality of cities from three dimensions: greenness, humidity, and dryness. The relevant calculation formula can be found in references [32,43].
The water benefit-based ecological index (WBEI) was proposed by Jiao [42], which is a good indicator of the ecological environment of coastal cities by considering the ecological environment of cities as well as water efficiency. The WBEI was selected from water ecological factors (SPWI, NDLI), heat index (LST), and land cover index (RVI, NDSI) and calculated by using the entropy weight method.
(1)
Water ecological factors
Air humidity, as an important factor of urban ecology, has an impact on air quality, the heat island effect, vegetation growth, water management, and human health. Latent heat intensity can be used as an indicator of urban air humidity, and NDLI can reflect the latent heat intensity in cities:
NDLI = ρ g r e e n ρ r e d ρ g r e e n + ρ r e d + ρ s w i r 1
where ρ g r e e n , ρ r e d , and ρ s w i r 1 are the green, red, and shortwave infrared bands, respectively.
SPWI reflects the difference in water content. This index is obtained by sampling different land cover types, such as urban reservoirs, construction land, and grassland, and analyzing the spectral differences of different cover types [42]. Since the sample selected by Jiao is located in the maritime cities of eastern China, we believe that the index is also applicable to this study:
S P W I = ρ n i r ρ S w i r 2 + ρ b l u e ρ n i r + ρ S w i r 2 + ρ b l u e
where ρ n i r , ρ s w i r , and ρ b l u e are the near infrared, shortwave infrared, and blue bands, respectively.
There is a close relationship between surface temperature and urban ecology, and changes in surface temperature can have multiple effects on urban ecology. High surface temperatures can lead to urban browning and reduced biodiversity.
L S T = B ( T ) = [ L λ L τ ( 1 ε ) L ] τ ε
T = K 2 λ ln ( 1 + K 1 λ 5 L S )
where ε is the surface emissivity; 𝑇 is the real surface temperature (K); 𝐵(𝑇) is the brightness of blackbody thermal radiation; τ is the transmittance of the atmosphere in the thermal infrared band; and 𝐿 and 𝐿 are the brightness of upwards and downwards atmospheric radiation, respectively.
(2)
Landcover index
The NDVI is a commonly used vegetation index to assess the growth vigor of vegetation and urban environment quality [44,45,46]. It provides quantitative information on vegetation cover and health based on the difference in reflectance between the visible and near-infrared bands.
N D V I = ρ n i r ρ r e d ρ n i r + ρ r e d
where ρ r e d and ρ n i r are the red and shortwave infrared bands, respectively.
There is a strong link between bare soil and urban ecology. Bare soils are susceptible to erosion, leading to soil erosion and water management problems. In addition, the lack of vegetation cover on bare soil leads to reduced biodiversity and impaired ecosystem function. The high albedo and low evaporation rate of bare soil surfaces increase surface temperatures, exacerbate the urban heat island effect, and negatively affect human health. The NDSI is a good indicator of urban bare soil and is sensitive to it [47]:
N D S I = ρ n i r ρ s w i r 1 ρ n i r + ρ s w i r 1
where ρ n i r and ρ s w i r are the near-infrared and shortwave infrared bands, respectively.
(3)
Entropy method
The advantage of the entropy weighting method is that it can consider the uncertainty and importance of the criteria to reasonably determine their weight. By calculating the information entropy of the criterion, the entropy weight method can quantify the degree of uncertainty of the criterion, which makes the weight assignment more scientific and objective [48,49]. Compared with other commonly used weight determination methods, the entropy weight method can better cope with the uncertainty of weights and improve the reliability and rationality of the results [50,51].
The first step is to calculate the indicator weights; for each indicator, its information entropy is calculated. Information entropy is used to measure the dispersion of indicator data, and the higher the dispersion is, the higher the information entropy. The following formula can be used to calculate the information entropy.
e j =   1   ln × i = 1 n f i j ln f
f i j = x i j i = 1 n x i j
where 𝑒j is the entropy value of the jth evaluation indicator and fij is the weight corresponding to the jth indicator of the ith pixel.
Second, we calculate the entropy weight (wj) of the jth evaluation indicator using the following formula [52]:
w j = 1 e j m i = 1 M e i i ,      j = 1 , 2 , 3 , , m
W E B I = w 1 × N NDLI + w 2 × N N D V I + w 3 × N SPWI    w 4 × N LST w 5 × N NDSI
Based on the equal interval breakpoint method, the WBEI is classified according to the 0.2 interval for the urban ecological quality of Fuzhou City (see Table 1):

2.3.2. Sen-MK Slope Analysis

Sen’s slope (Sen-Mk slope) is a statistical method used to estimate the trend or rate of change in a dataset over time. It is a nonparametric method that is robust against outliers and does not assume any specific distribution for the data [53,54].
The Sen trend is calculated by the formula:
β = M edian ( x j x i / j i ) ,   j > i
where i is the sequence number from 2000 to 2020, and xi indicates the maximum WBEI value in year i. β is the trend term of WBEI, and WBEI increases when β > 0 and decreases when the opposite is true.
Using the Mann–Kendall nonparametric test, for the time series T, the statistic Z of the Mann–Kendall method is calculated as follows:
Z = { S 1 V A R ( S ) , S > 0 0 , S = 0 S + 1 V A R ( S ) , S < 0
V A R ( S ) = ( n ( n 1 ) ( 2 n + 5 ) i = 1 m t i ( t i 1 ) ( 2 t i + 5 ) ) / 18
S = i = 1 n 1 j = i + 1 n sgn ( x j x i )
sgn ( x i x j ) = { + 1 ,   x j x i > 0 0 ,    x j x i = 0 1 ,   x j x i > 0
where n is the number of data, m is the number of recurring datasets in the series, and ti is the number of recurring data in the ith recurring dataset. xi is the WBEI value in the ith year, sgn denotes the step function, and Z is the statistic. Under the 95% confidence level test, the threshold value of Z is 1.96. Table 2 show the definition of the Sen-MK trend for the WEBI.

2.3.3. Land Use Dynamics Analysis

Land use dynamics analysis is a method used to assess and evaluate the transfer or level of land use within a specific area or region. In the land use dynamics analysis, a single land use dynamic analysis (SLC) provides a visual representation of the dynamics of each land type as a ratio of the total area of a land type converted to other land types at the end of a period to the total area of that land type at the beginning of the period [55]. Integrated land use dynamics analysis (ILU), therefore, is the ratio of the total decrease (or total increase) of each class in the region up to two times the total area of the regional land class, measuring the overall dynamic degree of change in regional land use/cover [56].
The SLC is calculated as follows:
K = U i U j U i × 1 T × 100 %
where K is the annual change in the dynamic attitude of a land class at a given time period. Uj denotes the area of land class j at the end of that time period, Ui denotes the area of land class i at the beginning of that time period, and T is the study period, generally in years (a).
M = [ i = 1 n Δ U i j 2 i = 1 n U i ] × 1 T × 100 %
where M is the integrated LUCC dynamic attitude, ∆Uij is the absolute value of the area of land converted from category i to noncategory i during the study period, Ui is the area of land in category i at the beginning of the study period, and T is the study period, generally in years.

3. Results

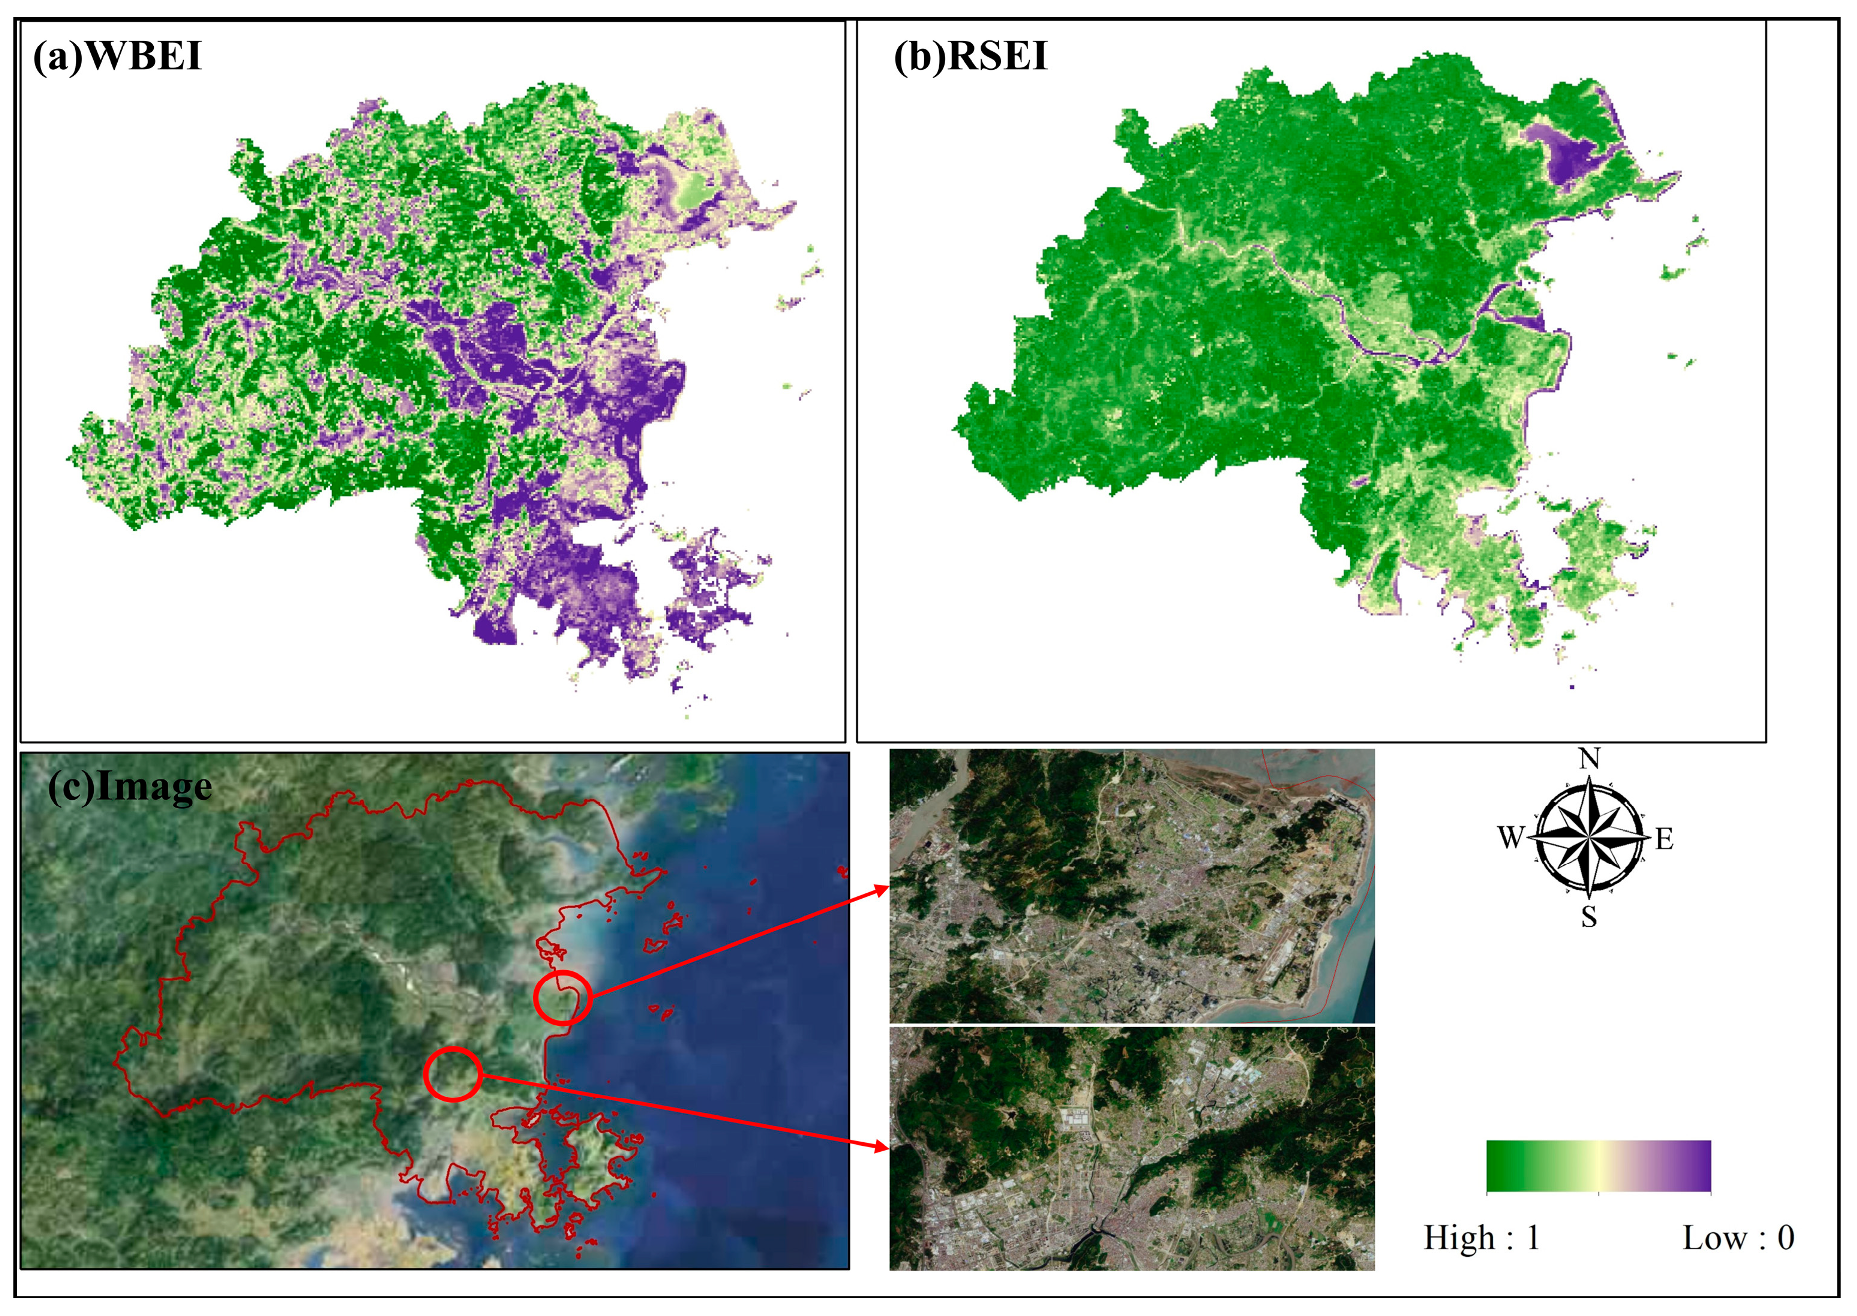
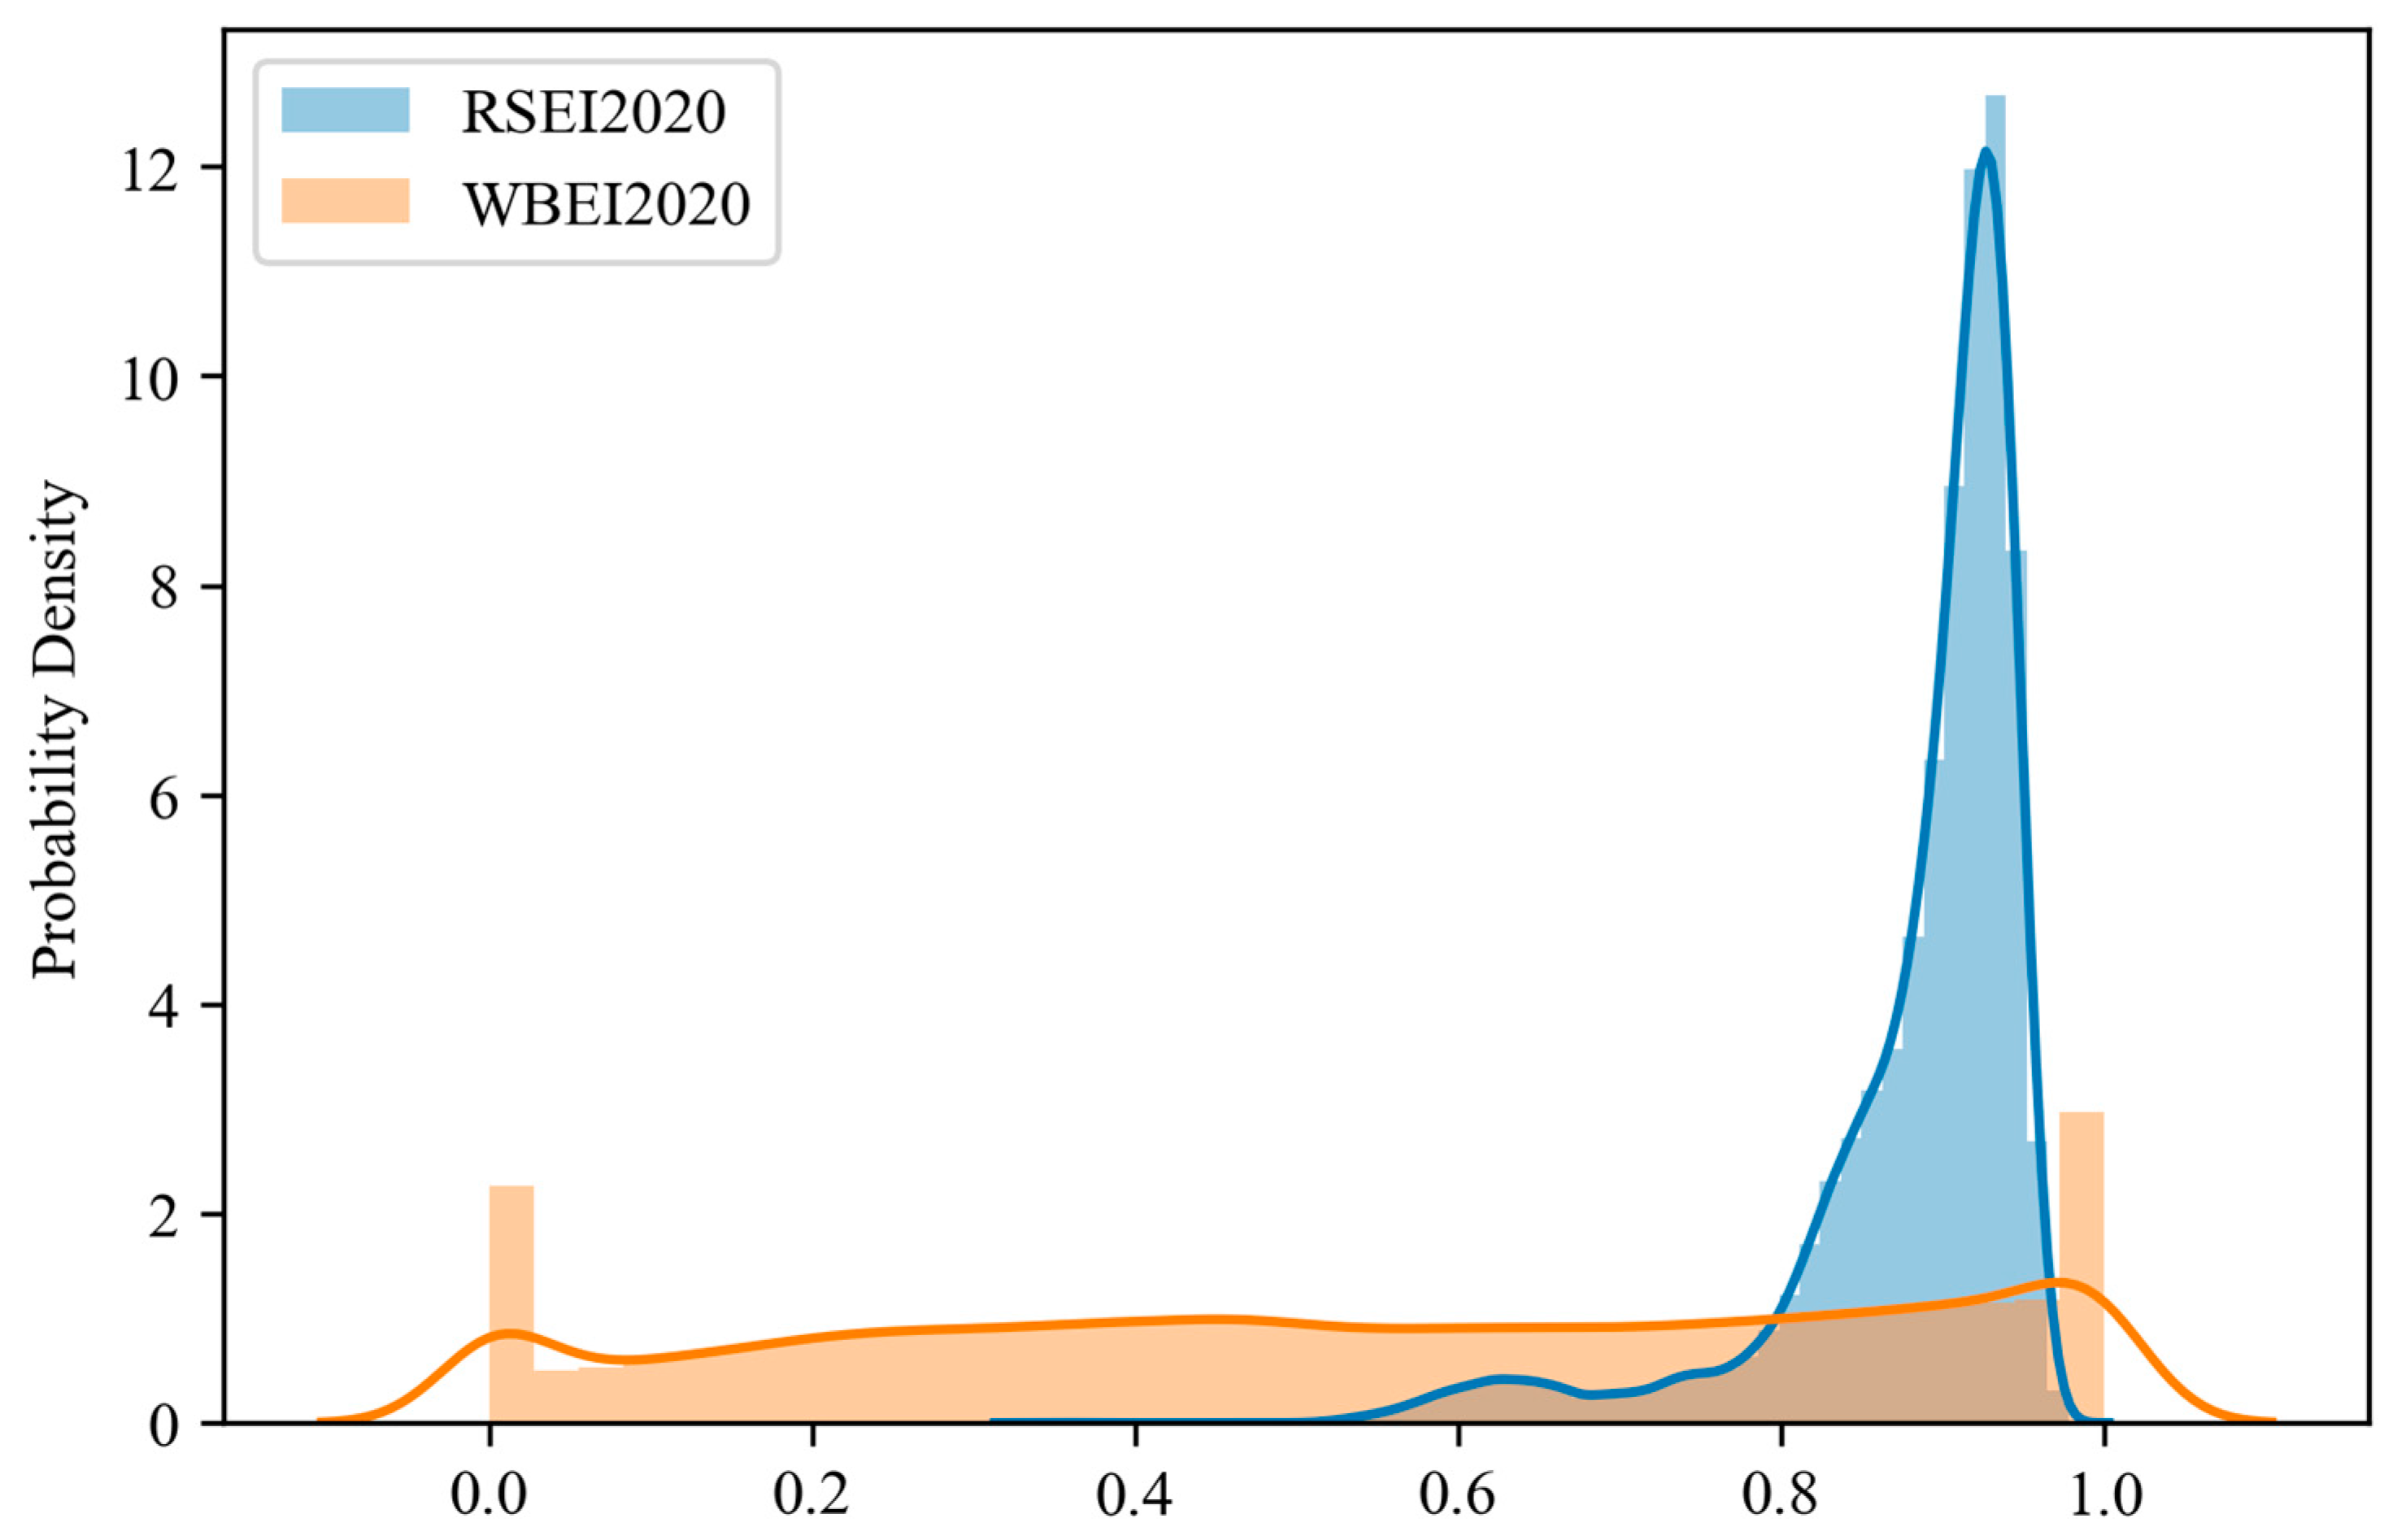
3.1. Comparison of WBEI and RSEI

The WBEI model and the RSEI model were combined to assess and compare the ecological and environmental quality of Fuzhou City in 2020. As shown in Figure 2 and Figure 3, the areas with higher WBEI indices in Fuzhou in 2020 are mainly distributed in the west and north, with lower WBEI in the central basin as well as in the port part of the southeast coast, and the difference between the southeast coastal part and the other regions is obvious. The RSEI values in Fuzhou in 2020 are generally above 0.5, with lower RSEI values distributed only in the location of the Min River and in the southeast coastal fringe, and the city’s RSEI values are generally high. The WBEI better reflects the impact of urban built-up areas on the quality of the ecological environment, especially in the central Min River basin and the southeastern coastal areas of Fuzhou, where the RSEI is overestimated compared to the WBEI in areas with water around the city. The WBEI has better granular information in terms of detail, for example, in the upper reaches of the Min River basin in central Fuzhou and in the west, where urban and human disturbances are evident.
Figure 3 represents the distribution of RSEI2020 and WBEI values, where the solid lines and bars indicate the probability density analysis of the data, blue indicates the RSEI, and orange indicates the WBEI. The mean value of RSEI is 0.86 with a standard deviation of 0.17, while the mean value of WBEI is 0.53 with a standard deviation of 0.32. RSEI is mainly concentrated in the high value range of 0.8–0.9, and the smaller standard deviation indicates that the variability of its values in the dataset is relatively small and close to the mean, which also makes Fuzhou’s RSEI less discriminatory in terms of urban ecology. The larger standard deviation of the WBEI, on the other hand, means that its values have more variability in the dataset and are more different relative to the mean, so the WBEI can better distinguish and describe the differences between ecological environment quality.
The spatial distribution of the difference between the WBEI and the RSEI can be seen in Figure 4, where the solid lines and bars indicate the probability density analysis of the data. The range of WBEI/RSEI values is between [0, 1.5], with a mean value of 0.61 and a root mean square of 0.33, which is a wide distribution of values. The ratio is mainly concentrated in the interval of [0.3, 1], accounting for 87% of the total area. The values in the interval (1, 1.25) account for 12% of the total. This suggests that the WBEI values are lower than the RSEI values overall and that the high value areas are very limited, with less than 1% of the values being 50% higher than RSEI. The generally high values of RSEI make it possible that there is some overestimation of some areas. In terms of the spatial distribution of the ratio, the WBEI is significantly lower than the RSEI on both sides of the Min River and in the southeastern coastal areas of Fuzhou, while in the mountainous areas to the west and northeast, the WBEI is higher than the RSEI, but the higher part is very limited, basically not exceeding 25% of the RSEI. It shows that in Fuzhou City, the WBEI can identify the difference in the ecological environment between urban and mountainous areas and can analyze and express the quality of the urban ecological environment more obviously. Figure 5 shows the field observation results of the Minjiang River region in the WBEI/RSEI results. It can be seen that on both sides of the Minjiang River, there are mostly built-up areas, and the ecological environment quality is significantly lower than that of the Minjiang River. According to the satellite image in Figure 4 and Figure 5, the WBEI can better reflect the spatial pattern of ecological environment quality in Fuzhou.

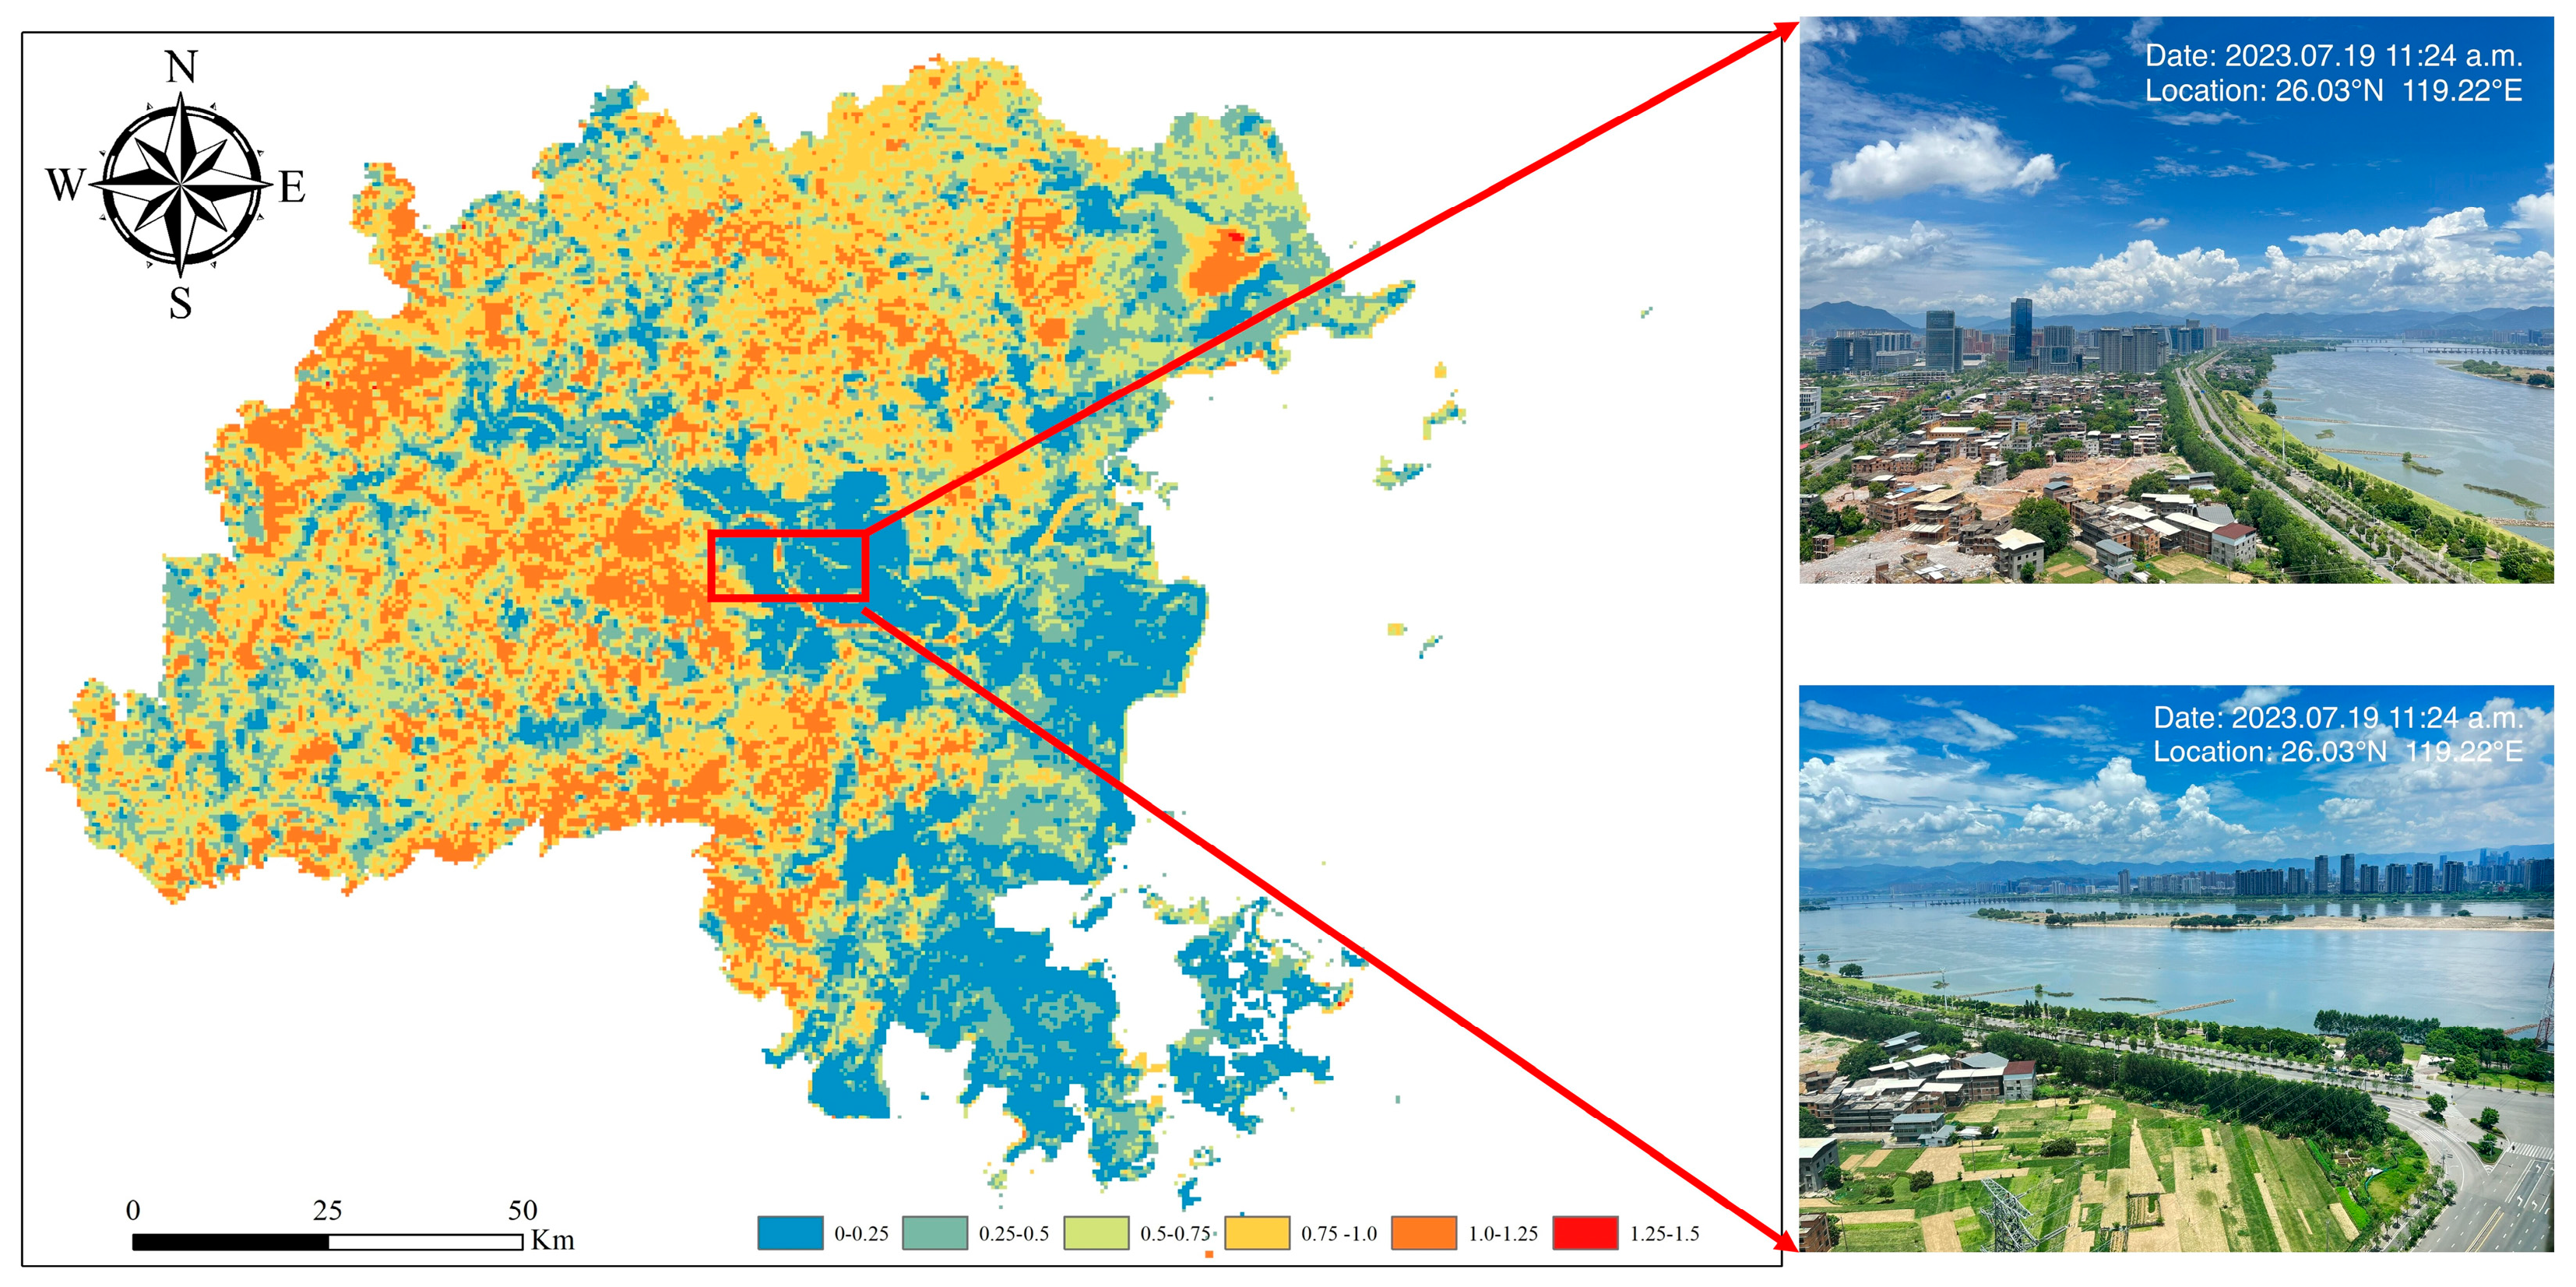
3.2. Spatial and Temporal Characteristics and Trends of WBEI

The WBEI values for Fuzhou were calculated for the 2000–2020 period in conjunction with the WBEI model. Figure 6 shows the changes in the weighting of each indicator between 2000 and 2020. The weight of the SPWI decreases year by year among the water ecology indicators, while the weight of the NDLI remains largely unchanged. Overall, the weight of water ecology indicators decreases year by year, which indicates that the quality of the water environment in Fuzhou City fluctuated greatly during the period of 2000–2020. In terms of heat indicators, the weight of the LST has been increasing, indicating that the urban surface temperature has changed significantly over the last 10 years; the weight of NDVI in the land cover indicator has increased and then decreased, while the weight of NDSI in the bare soil indicator has decreased and then increased, reflecting the response of urban surface cover to urban development over the last 10 years.
Figure 7 shows the spatial distribution of the WBEI in Fuzhou in 2000, 2010, and 2020, according to the equal interval method. In 2000, the ecological environment quality in the southeast coastal region of Fuzhou was mostly at the lowest level, and in the central city of Fuzhou, the ecological environment quality was also at this level. The quality of the ecological environment in the mountainous areas in the northeast was better. In 2010, there was a low level in the southeast coastal area of Fuzhou, which shows that the quality of the ecological environment in this area has begun to improve to some extent. The degradation of the ecological quality in the northeastern part of Fuzhou between 2000 and 2010 was more obvious, but in 2020, the ecological environment in the southeastern coastal part of Fuzhou began to improve with the emergence of a larger low-level area of fragmented patches, while the ecological quality in the northeastern and western suburban areas of Fuzhou continued to improve compared to 2010. The quality of the ecological environment in the northeastern and western suburbs of Fuzhou was better than that in 2010. However, it can be seen that the ecological quality of the central area has not improved significantly.
Different eco-environmental quality classes in Fuzhou were counted in 2000, 2010, and 2020. Figure 8 shows the percentage of the area of different eco-environmental quality levels in Fuzhou. In 2000, the moderate level accounted for the highest percentage, that is, 25% of the total area, while the lowest level and low level accounted for 20.2% and 23%, respectively. In 2010, low levels accounted for 32.6% of the total area. In 2020, the ecological quality of Fuzhou shows a significant improvement, with the highest level accounting for 26.7% of the area, and the rest of the ecological quality levels accounting for a similar proportion. The ecological environment quality of Fuzhou City improved significantly during 2000–2020.
According to the analysis of the trend changes in WBEI in Fuzhou City using the Sen-MK trend analysis method, the results of the study show that the overall ecological and environmental quality of Fuzhou City remained stable during the period of 2000–2020 (see Figure 9). In the spatial distribution pattern of Fuzhou, the trend of significant decrease (S-decrease) did not occur, indicating that the overall ecological and environmental conditions in Fuzhou did not have a significant deterioration trend. The proportion of areas with a nonsignificant decrease (NS-decrease) is 40.64% (see Figure 10), mainly distributed in the mountain cluster in the northern part of Fuzhou. These areas have maintained relatively good ecological quality, probably influenced by factors such as geographical conditions and nature reserves. In the main urban areas of Fuzhou and in the scattered areas of the eastern coastal cities, the percentage of areas where the trend has remained largely unchanged is 10.76%. These areas have maintained a relatively stable ecological state, probably through environmental management and protection measures, in the course of economic development and urbanization. The distribution of areas with a significant increase (S-increase) is more fragmented, occupying 11.56% of the overall area of Fuzhou. These areas may have been affected by factors such as urbanization, economic development, and increased human activity, resulting in a significant increase in ecological quality. Overall, the ecological and environmental quality of Fuzhou City remained stable during the period of 2000–2020, with some areas showing some degree of improvement in ecological and environmental quality.

3.3. Relationship between Land Use Change and WBEI

The spatial distribution of land use/cover types in Fuzhou was obtained by visualizing the land use/cover classification data of GlobeLand30 and calculating the area of cultivated land, forest, grass, wetland, water, artificial surface, and bare land in Fuzhou. The results are shown in Figure 11 and Table 3. From 2000 to 2020, the forest was the most widely distributed region in Fuzhou, mainly in the western and northern parts of the city. Cultivated land is mainly located close to water sources, such as the southeast coastal region and around the Minjiang River basin. The change in the artificial surface shows that the urban development process in Fuzhou is clearly observable from the main urban area in the central part of the city to the surrounding areas, while the areas near the southeast traffic roads and the coastal cities are gradually developing (e.g., the construction of the Pingtan Comprehensive Test Zone and the laying of the railway).
From the land use transfer matrix for the period of 2000–2010 (Table 3), the forest was distributed over an area of 3507.56 km2, accounting for 3.9% of the city. The conversion of cultivated land to artificial surface is the most significant, at 86.85 km2, far exceeding other types of land. This indicates that the new area of artificial surface during the urbanization process mainly occurred in the area of cultivated land in 2000. The increase in forest and grassland comes from the interconversion of forest and grassland, in addition to the other major contributor, cultivated land. In general, the overall area of each category in Fuzhou did not change significantly between 2000 and 2010, but there was a large interconversion between them.
From the land use transfer matrix for 2010–2020 (Table 4), the area and share of forest in 2022 is still the largest, at 7547.43 km2, accounting for 58.21% of the city’s area. The artificial surface area changes significantly, from 608.51 km2 to 1024.70 km2, which is an increase of 66.7%, with a rapid increase in man-made surface area and significant urbanization. The new area of the artificial surface mainly appeared in the cultivated land area in 2010, accounting for 50% of the net increase. The area of forest transferred to artificial surfaces is double that of the previous period. During 2010–2020, the urbanization process of Fuzhou City became significantly faster; in this decade, the urbanization process in Fuzhou became significantly more rapid, and the trend of conversion of cultivated land areas to artificial land became significantly stronger.
By calculating the SLC and ILC for the years 2000–2010 and 2010–2020, the conversion rate and relative rapidity of each category in Fuzhou can be quantified at different time periods (Figure 12). Bare land was in a state of decline during 2000–2020, and the rate of conversion was twice as fast in 2010–2020 as in the previous 10 years. The SLC of the artificial surface motive is the largest (6.8%/a) and has increased rapidly in the last 20 years. Water is relatively stable in the first 10 years but shows an increasing trend in the second 10 years. Wetland has a decreasing trend in the first 10 years but at a smaller and more stable rate. There is a large degree of interconversion between grass and forest, with grass showing a decreasing trend and forest increasing and then decreasing. Cultivated land has been declining over the last 20 years, especially between 2010 and 2020, when the area declined more rapidly. From the ILC, the integrated dynamic attitude in Fuzhou gradually increases from 2000 to 2020, but the increase is very slow, indicating that land use change in Fuzhou basically remains stable. There are differences in the magnitude of land use changes in various categories, with the artificial surface increasing at a significant rate and forests and grasslands showing turbulent changes and an overall increasing trend.
The mean WBEI values for different land types over time were extracted and combined with the land transfer matrix and land use to analyze the relationship between different land types and WBEI (Figure 13). Forest and grass both have higher WBEI values than other land types, and artificial surface has the lowest WBEI value. This is consistent with the logic that forest ecosystems are valued higher than artificial surfaces. During the period of 2000–2020, the WBEI of cultivated land decreased slowly in general, while the area of cultivated land has been on a decreasing trend, which indicates that there is a certain decreasing trend in the ecological quality of cultivated land. The WBEI of forest and grassland increased and then decreased, which is consistent with the change trend of the SLC of forest, which indicates that the WBEI of the forest, bare land, and water has a slowly increasing trend, which indicates that the ecological environment quality of the region is gradually improving. The wetland area first increases and then decreases, with a rapid decreasing trend from 2010 to 2020, which is more consistent with the SLC of the wetlands WBEI. The WBEI of the artificial surface has always been at a low level, and the area of urbanized areas such as built-up areas is increasing rapidly every year, showing a more obvious negative correlation with the WBEI of the area. This shows that the level of urbanization has a negative impact on the quality of the urban environment. Artificial surface, an important indicator of urbanization, is negatively correlated with WBEI, reflecting the pressure of urbanization on the quality of the urban ecosystem.

4. Discussion

In this study, we compared the effectiveness of the RSEI and the WBEI in reflecting the ecological quality of Fuzhou, with the WBEI being able to more clearly reflect the differences between urban areas and other surrounding areas. In built-up areas, the WBEI values are lower than the RSEI values. In mountainous areas, the WBEI values are higher than the RSEI values, but in the case of the RSEI, the RSEI does not perform as well as the WBEI for built-up areas and mountainous areas, but it can still be used for certain areas. The WBEI is mainly used for the evaluation of ecological environment quality in coastal urban areas, which is more relevant but also limited in its application.
In addition, there are some null values in the WBEI due to cloud limitations in the selection of images. There are some banding problems with Landsat 5, but they do not affect the overall conversion and trend.
The urbanization process in Fuzhou City from 2000 to 2020 is evident, and the SLC of WBEI man-made surfaces is significantly higher than that of other land types, with a faster decline in the mean value of the WBEI for the region. The trend of the SLC and the WBEI shows that there is a clear correlation between the area of forest and man-made ground and the WBEI. However, this is still very rough and needs further fieldwork and verification.
Overall, this study was able to show the spatial distribution and differences of ecological environmental quality in coastal cities better than the traditional RSEI using the WBEI model. However, the limitation of this index is that it is only applicable to the identification of ecological environmental quality in coastal cities, because its spectral samples are collected in the field in the coastal areas, and it is not as high as the RSEI which exists in terms of universality. When constructing the regional ecological environmental quality model, the inclusion of rainfall or air quality products (e.g., PM2.5, etc.) can also be considered in order to provide more targeted urban ecological environmental monitoring results, with more information for cities with high rainfall and air quality that need to be controlled.

5. Conclusions

This paper analyzes and assesses the ecological and environmental quality of Fuzhou City over the past 20 years using Landsat satellite imagery, the basic WBEI, and the Sen-MK trend analysis model from 2000 to 2020. The changes in different land types and their relationship with the WBEI were also analyzed by combining the global land 30 m data products of the study area from 2000 to 2020 using the land transfer matrix, the single land use dynamic attitude index and the integrated land use dynamic attitude index. The results of the study indicate the following:
(1)
Fuzhou City is a coastal city in southeast China, and the WBEI takes into account the ecological benefits of water and is a more accurate reflection of the differences in ecological patterns in the city than the RSEI. In terms of value distribution, the RSEI is more concentrated in Fuzhou as a whole, while the WBEI values are more evenly distributed, better reflecting the quality of the ecological environment within the city. Spatially, the WBEI is lower than the RSEI in urban built-up areas; in mountainous areas, the WBEI is higher than the RSEI.
(2)
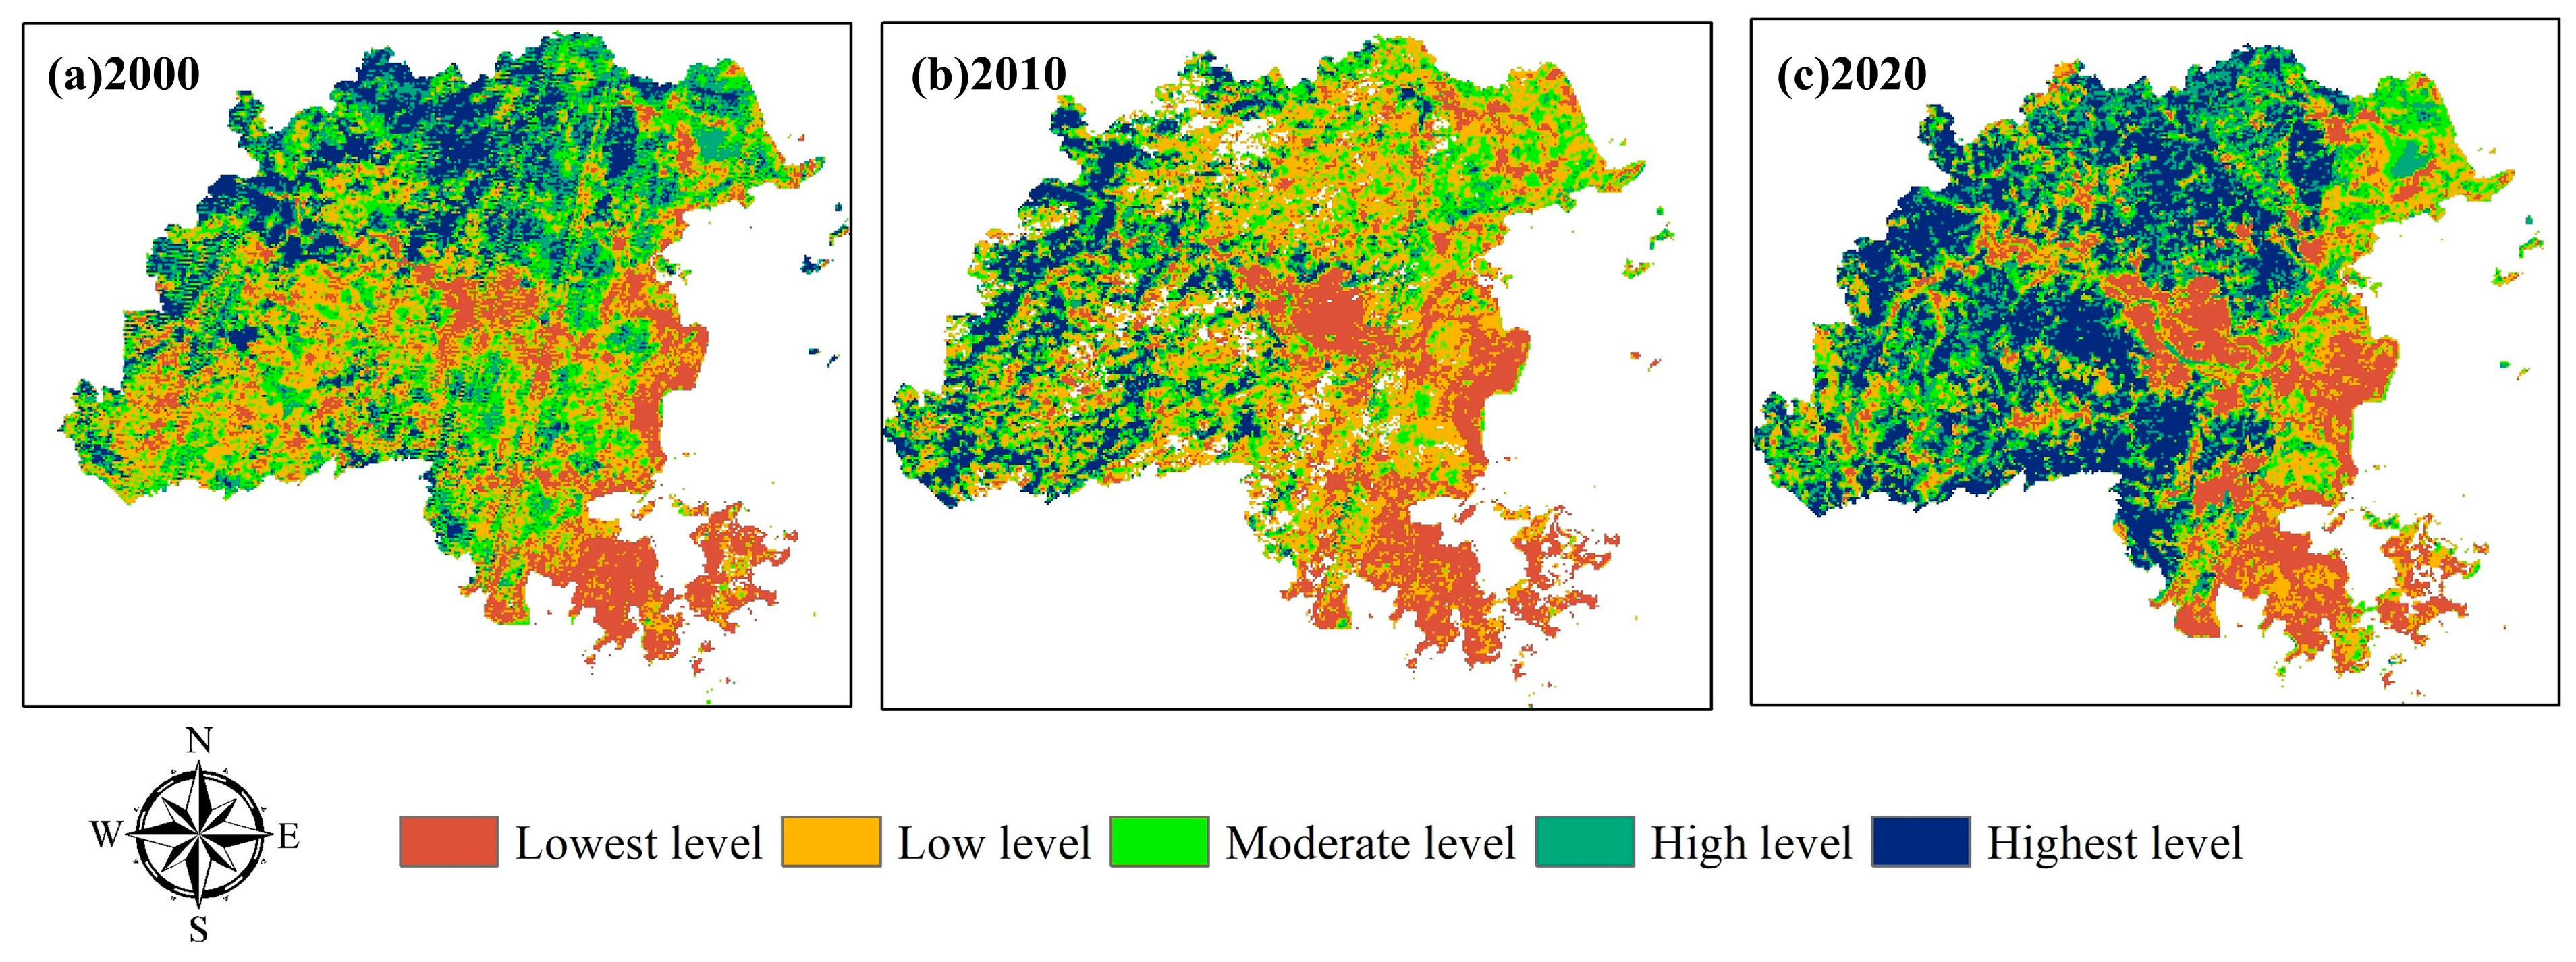
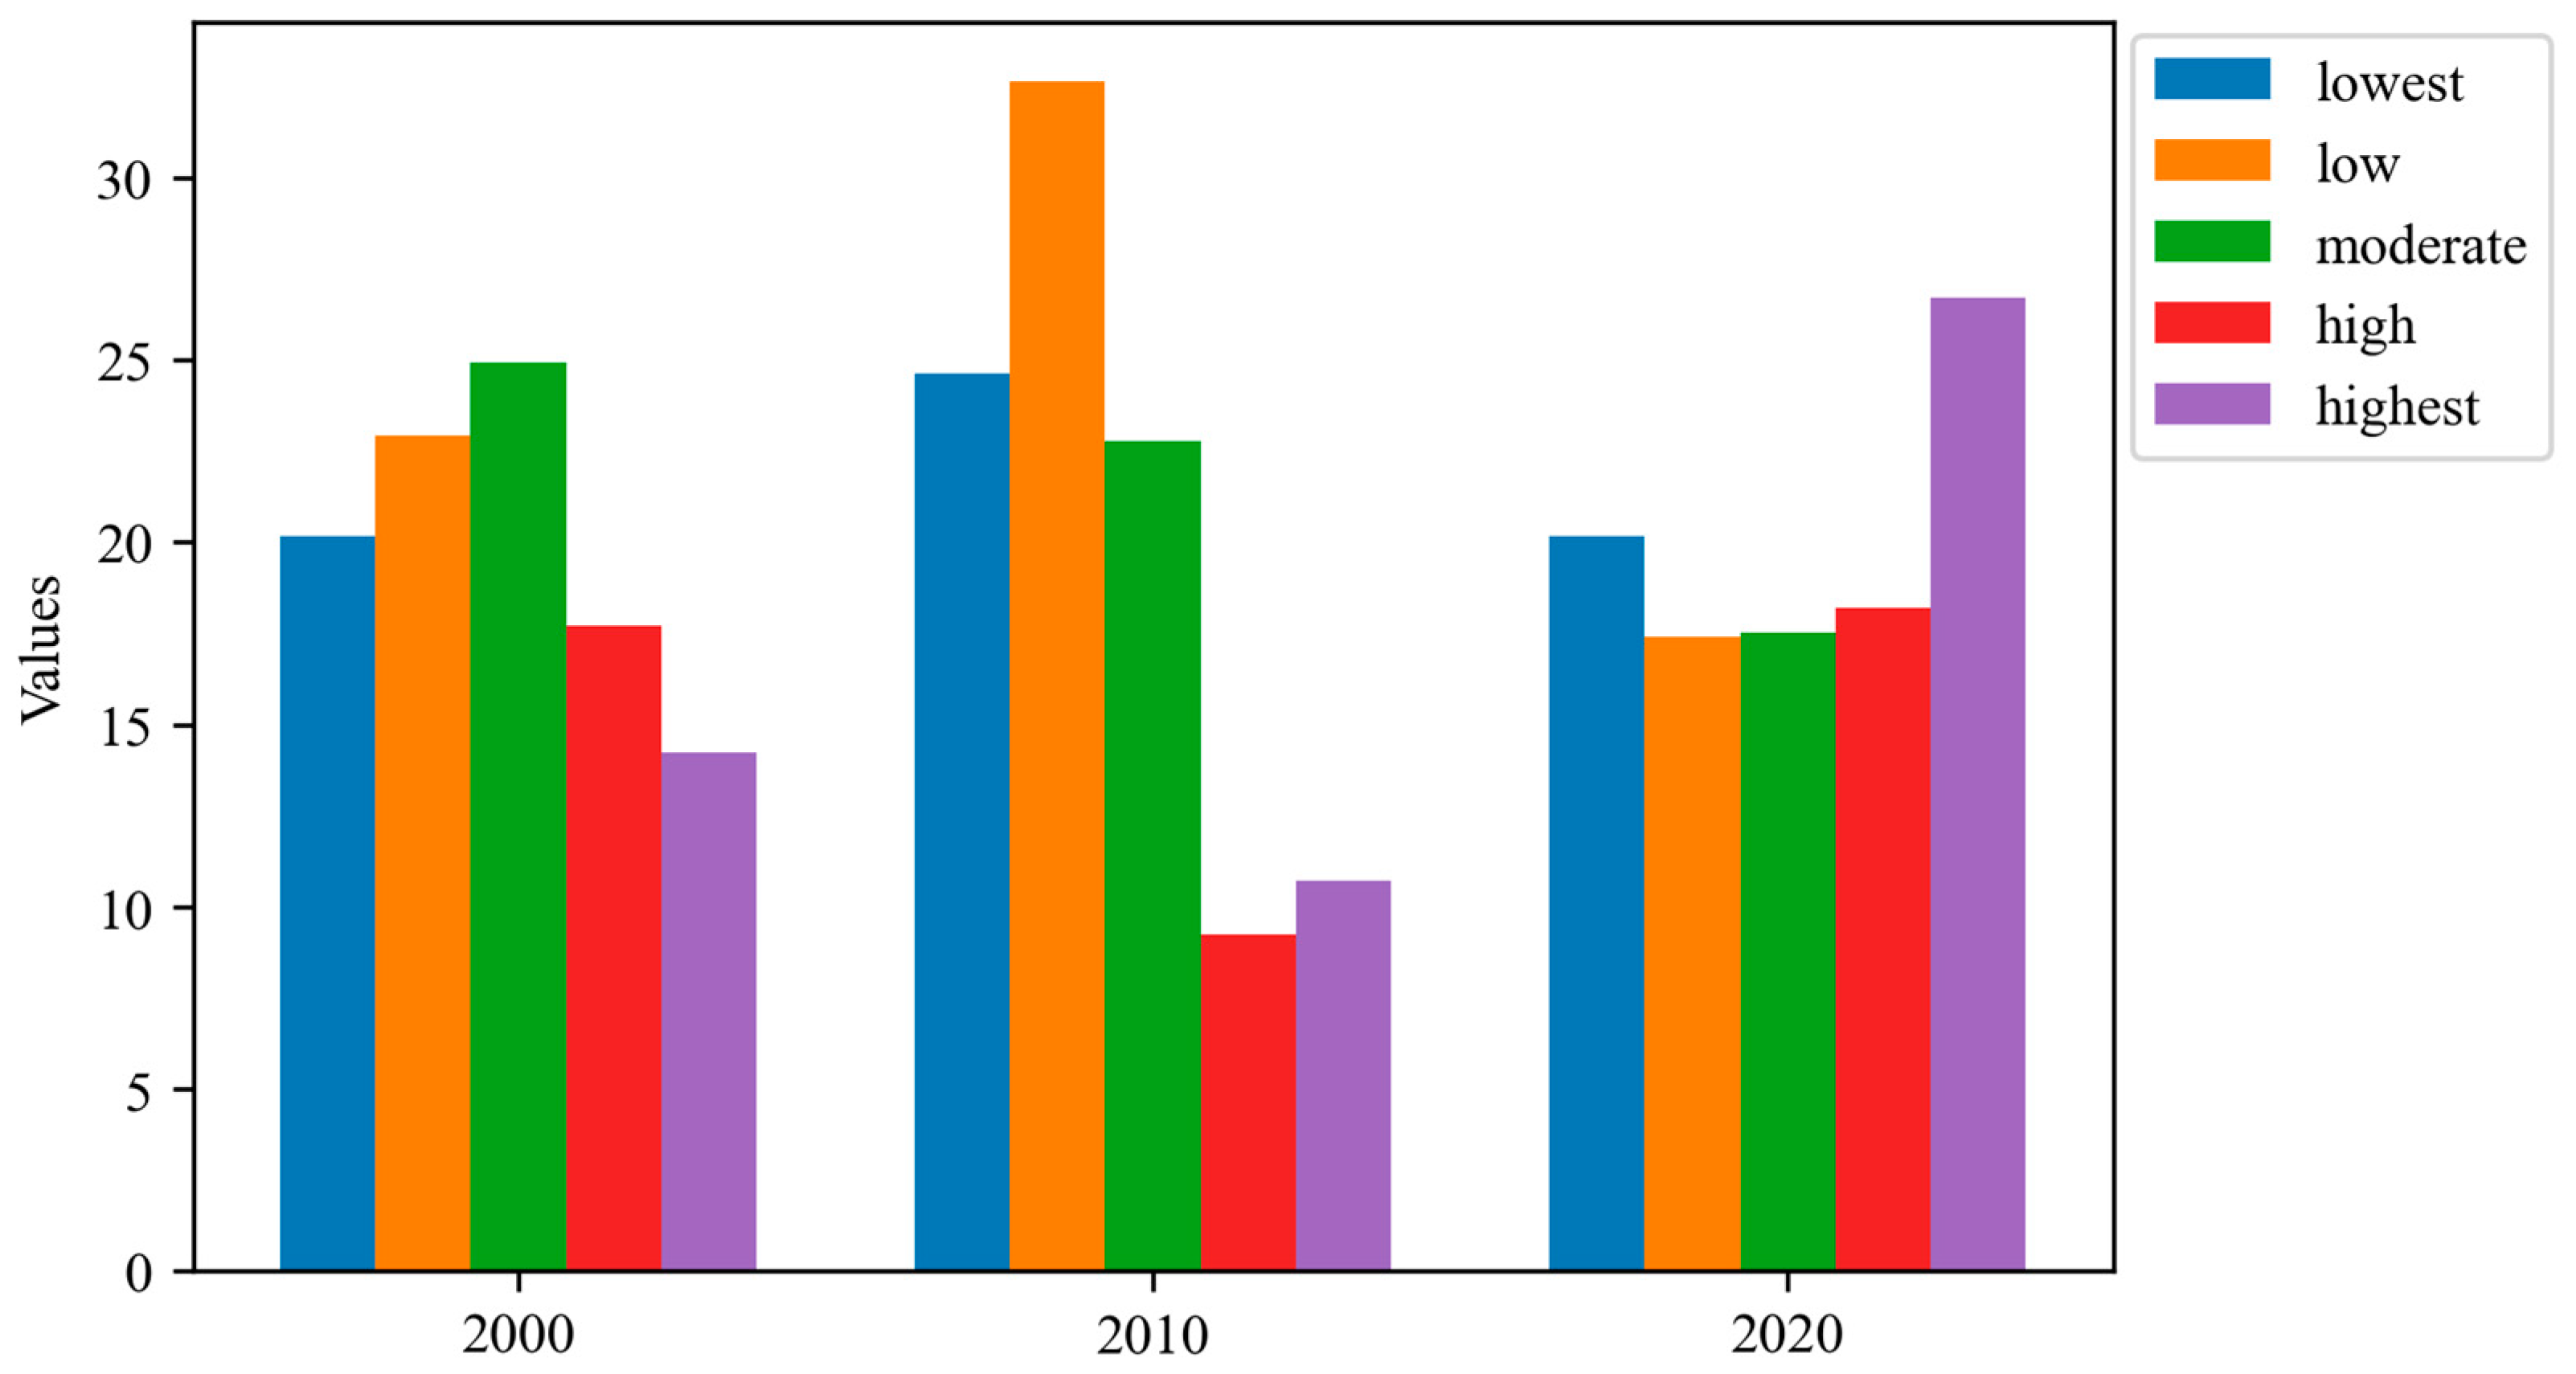
The trends in ecological and environmental quality in Fuzhou over the past 20 years were analyzed using the Sen-MK trend analysis method. In general, the ecological environment quality of Fuzhou City as a whole is improving, with the area of improving trend accounting for 7.96% more than the area of degradation trend. In terms of spatial distribution, there is a declining trend in ecological and environmental quality in the mountainous areas in the northeast, but it is not obvious. In the south, there are scattered areas where the quality of the ecological environment has increased significantly.
(3)
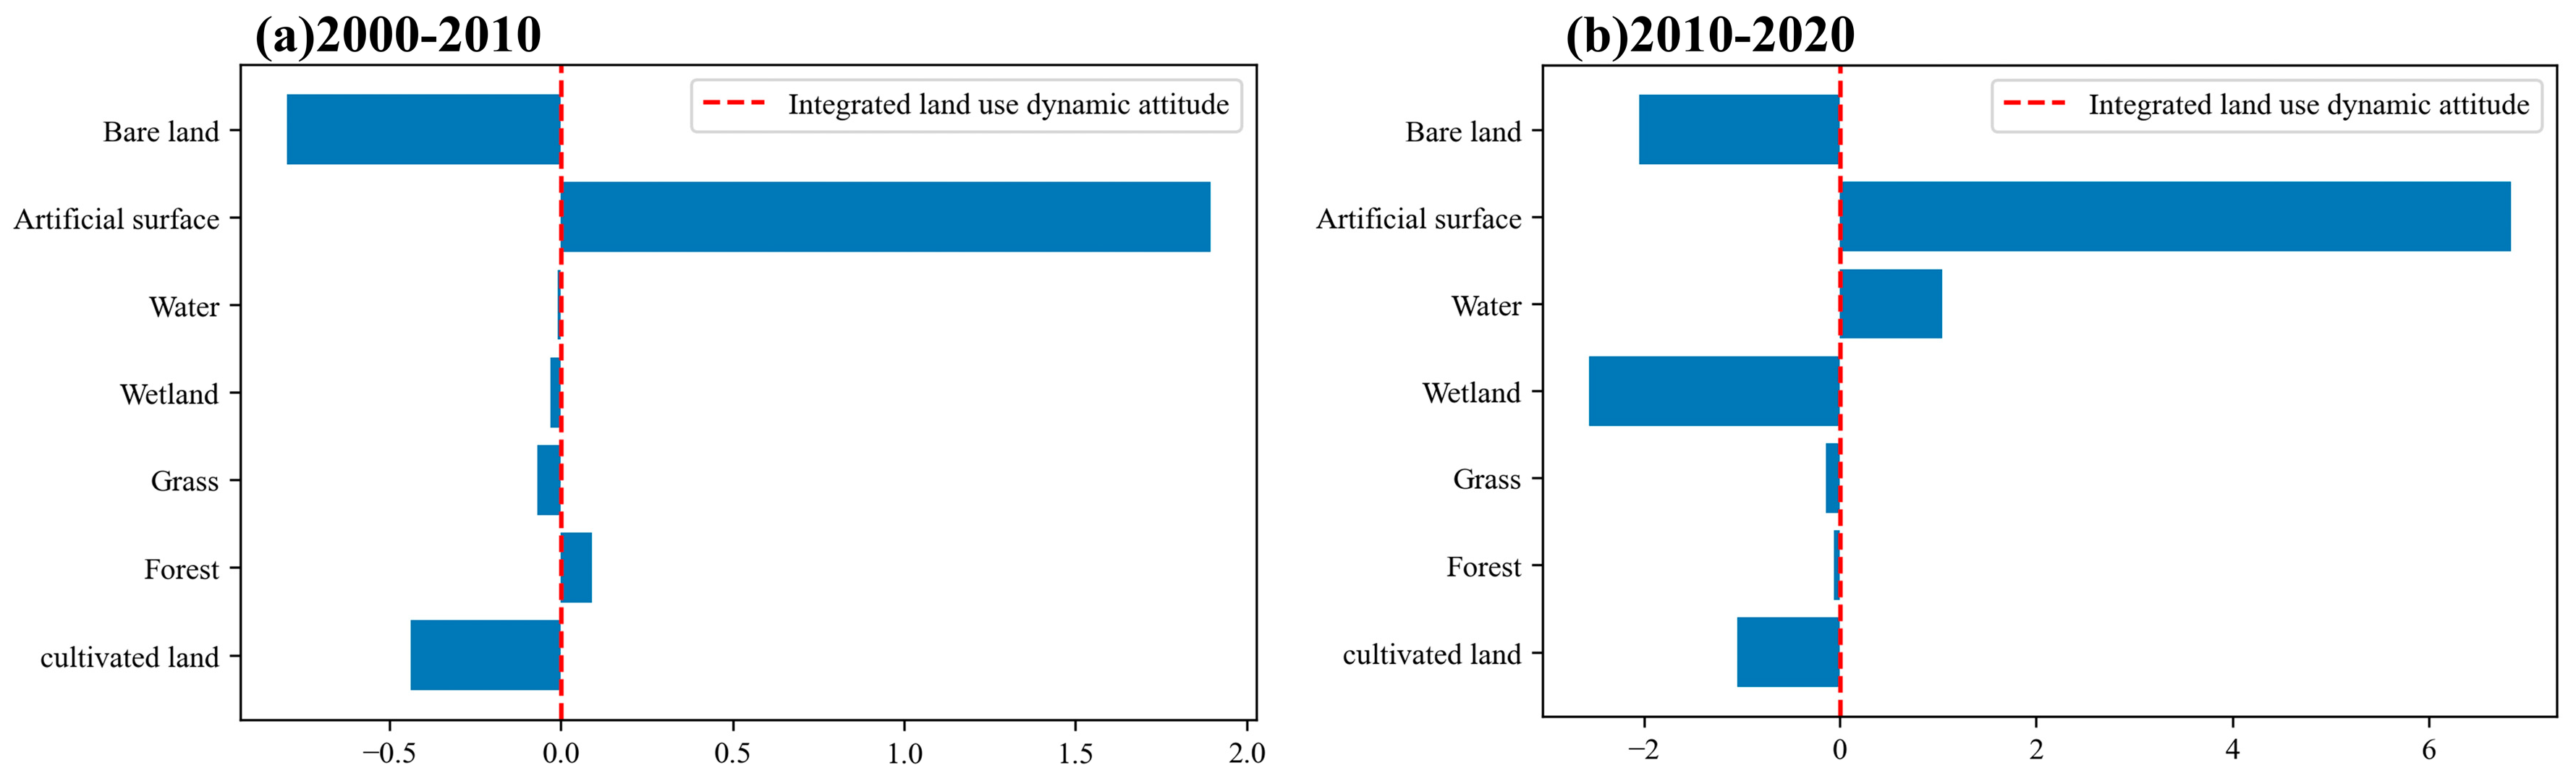
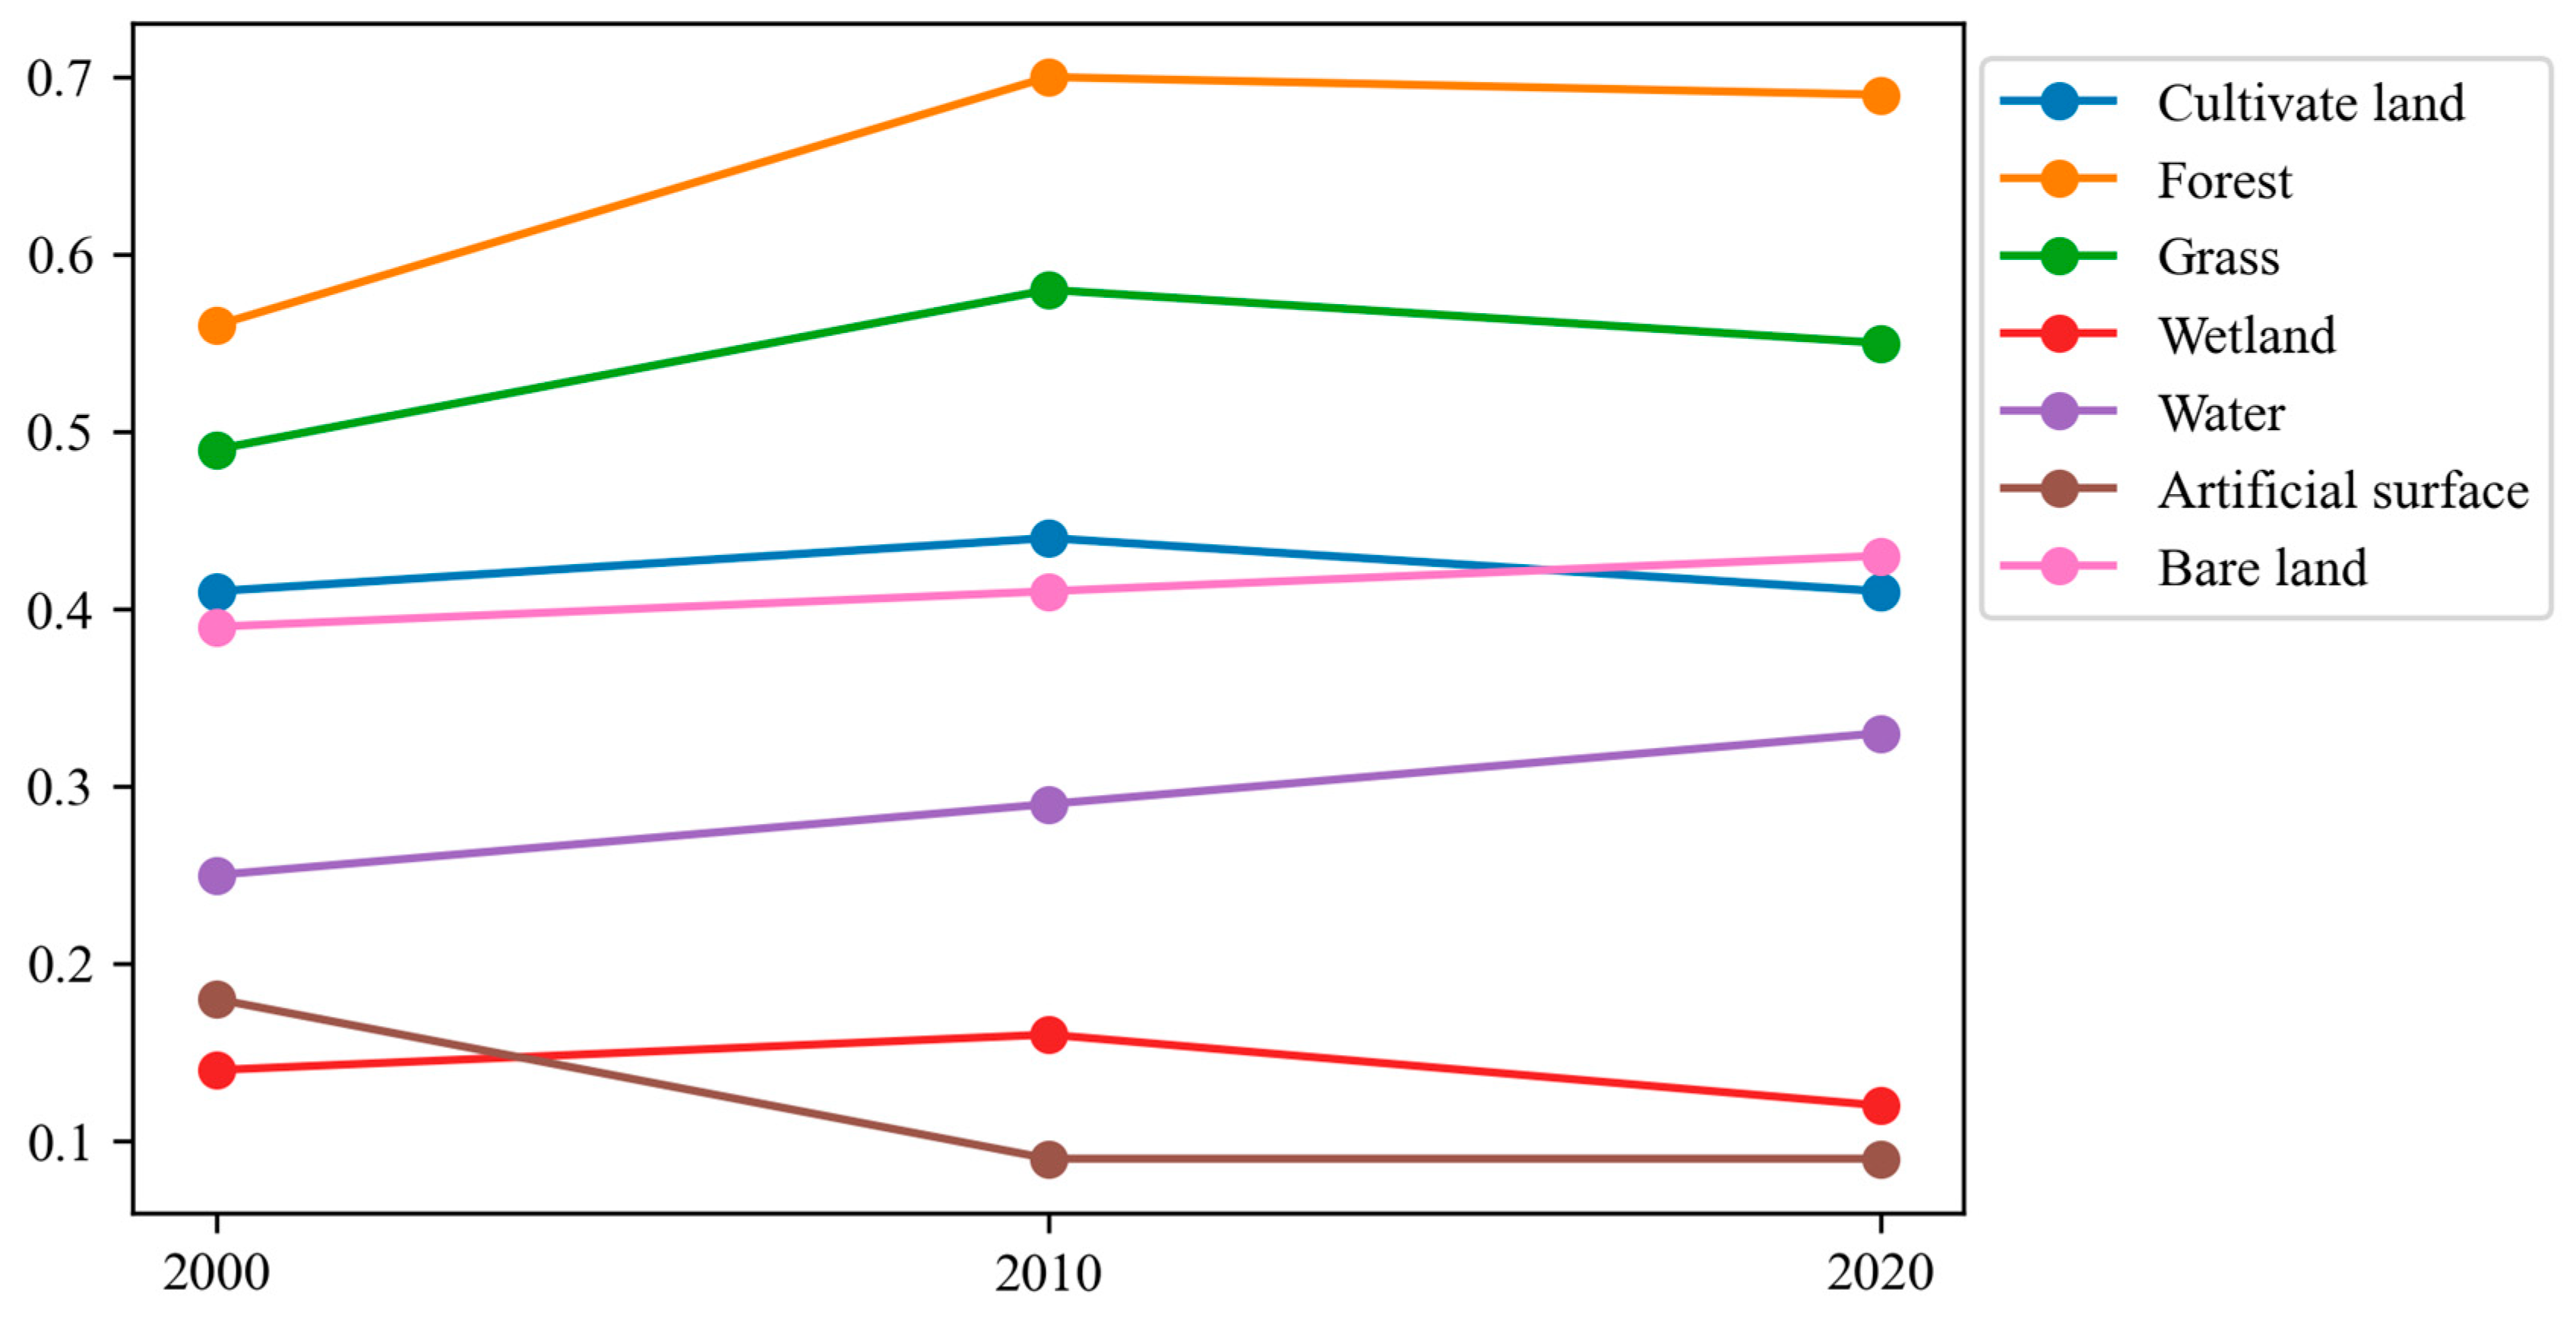
All types of land in Fuzhou City underwent some transfer from 2000 to 2020. The surface area of man-made land is increasing and growing faster than other land types, mainly from the transfer of cultivated land and forest. Forests show a trend of decreasing and then increasing, mainly to grass and cultivated land. Combining the SLCs, ILCs, and WBEIs of different land categories, forests are an important positive factor in improving Fuzhou City, and the high-intensity increase in artificial surfaces will lead to a decrease in ecological environment quality.

Author Contributions

Writing—original draft preparation, X.L.; writing—review and editing, X.L. and H.J.; visualization, X.L. All authors have read and agreed to the published version of the manuscript.

Funding

This research was funded by the Natural Science Foundation of Fujian Province of China (No. 2022J01621) and the Socially useful program of Fujian Province (No. 2021R1002006).

Institutional Review Board Statement

Not applicable.

Informed Consent Statement

Not applicable.

Data Availability Statement

The datasets generated and analyzed during the current study are available from the corresponding author on reasonable request.

Conflicts of Interest

The authors declare no conflict of interest.

References

  1. Alberti, M.; Booth, D.; Hill, K.; Coburn, B.; Avolio, C.; Coe, S.; Spirandelli, D. The Impact of Urban Patterns on Aquatic Ecosystems: An Empirical Analysis in Puget Lowland Sub-Basins. Landsc. Urban Plan. 2007, 80, 345–361. [Google Scholar] [CrossRef]
  2. Guo, L.; Liu, R.; Men, C.; Wang, Q.; Miao, Y.; Zhang, Y. Quantifying and Simulating Landscape Composition and Pattern Impacts on Land Surface Temperature: A Decadal Study of the Rapidly Urbanizing City of Beijing, China. Sci. Total Environ. 2019, 654, 430–440. [Google Scholar] [CrossRef]
  3. Hou, Y.; Ding, W.; Liu, C.; Li, K.; Cui, H.; Liu, B.; Chen, W. Influences of Impervious Surfaces on Ecological Risks and Controlling Strategies in Rapidly Urbanizing Regions. Sci. Total Environ. 2022, 825, 153823. [Google Scholar] [CrossRef]
  4. Lu, S.; Lin, C.; Lei, K.; Wang, B.; Xin, M.; Gu, X.; Cao, Y.; Liu, X.; Ouyang, W.; He, M. Occurrence, Spatiotemporal Variation, and Ecological Risk of Antibiotics in the Water of the Semi-Enclosed Urbanized Jiaozhou Bay in Eastern China. Water Res. 2020, 184, 116187. [Google Scholar] [CrossRef] [PubMed]
  5. Bai, J.; Guo, K.; Liu, M.; Jiang, T. Spatial Variability, Evolution, and Agglomeration of Eco-Environmental Risks in the Yangtze River Economic Belt, China. Ecol. Indic. 2023, 152, 110375. [Google Scholar] [CrossRef]
  6. Gao, M.; Chen, B.; Xu, Y.; Li, D. Heterogeneous Impacts of Global Land Urbanization on Land-Use Structure from Economic and Technological Perspectives. Ecol. Indic. 2023, 147, 109955. [Google Scholar] [CrossRef]
  7. Yu, G.; Liu, T.; Wang, Q.; Li, T.; Li, X.; Song, G.; Feng, Y. Impact of Land Use/Land Cover Change on Ecological Quality during Urbanization in the Lower Yellow River Basin: A Case Study of Jinan City. Remote Sens. 2022, 14, 6273. [Google Scholar] [CrossRef]
  8. He, W.; Li, X.; Yang, J.; Ni, H.; Sang, X. How Land Use Functions Evolve in the Process of Rapid Urbanization: Evidence from Jiangsu Province, China. J. Clean. Prod. 2022, 380, 134877. [Google Scholar] [CrossRef]
  9. Perez Lopez, I.; Martin, D.J. Rethinking Estuary Urbanism—Preparing Australian Estuary Cities for Changes to Come in the Climate and Biodiversity Emergency. Sustainability 2023, 15, 962. [Google Scholar] [CrossRef]
  10. Miroshnyk, N.V.; Likhanov, A.F.; Grabovska, T.O.; Teslenko, I.K.; Roubík, H. Green Infrastructure and Relationship with Urbanization—Importance and Necessity of Integrated Governance. Land Use Policy 2022, 114, 105941. [Google Scholar] [CrossRef]
  11. Callaghan, C.T.; Liu, G.; Mitchell, B.A.; Poore, A.G.B.; Rowley, J.J.L. Urbanization Negatively Impacts Frog Diversity at Continental, Regional, and Local Scales. Basic Appl. Ecol. 2021, 54, 64–74. [Google Scholar] [CrossRef]
  12. Yang, C.; Wang, W.; Liang, Z.; Wang, Y.; Chen, R.; Liang, C.; Wang, F.; Li, P.; Ma, L.; Wei, F.; et al. Regional Urbanicity Levels Modify the Association between Ambient Air Pollution and Prevalence of Obesity: A Nationwide Cross-Sectional Survey. Environ. Pollut. 2023, 320, 121079. [Google Scholar] [CrossRef] [PubMed]
  13. He, Q.; Wang, Y.; Qiu, Q.; Su, Y.; Wang, Y.; Wei, H.; Li, J. Joint Effects of Air PM2.5 and Socioeconomic Dimensions on Posted Emotions of Urban Green Space Visitors in Cities Experiencing Population Urbanization: A Pilot Study on 50 Cities of East China. Sci. Total Environ. 2023, 861, 160607. [Google Scholar] [CrossRef] [PubMed]
  14. Liu, R.; Dong, X.; Wang, X.; Zhang, P.; Liu, M.; Zhang, Y. Relationship and Driving Factors between Urbanization and Natural Ecosystem Health in China. Ecol. Indic. 2023, 147, 109972. [Google Scholar] [CrossRef]
  15. Na, L.; Zhao, Y.; Guo, L. Coupling Coordination Analysis of Ecosystem Services and Urbanization in Inner Mongolia, China. Land 2022, 11, 1870. [Google Scholar] [CrossRef]
  16. Wang, H.; Wang, L.; Yang, Q.; Fu, X.; Guo, M.; Zhang, S.; Wu, D.; Zhu, Y.; Wu, G. Interaction between Ecosystem Service Supply and Urbanization in Northern China. Ecol. Indic. 2023, 147, 109923. [Google Scholar] [CrossRef]
  17. Shang, Y.; Liu, S. Spatial-Temporal Coupling Coordination Relationship between Urbanization and Green Development in the Coastal Cities of China. Sustainability 2021, 13, 5339. [Google Scholar] [CrossRef]
  18. Park, H.; Paterson, R.; Zigmund, S.; Shin, H.; Jang, Y.; Jung, J. The Effect of Coastal City Development on Flood Damage in South Korea. Sustainability 2020, 12, 1854. [Google Scholar] [CrossRef] [Green Version]
  19. Shan, Q. The Influence of Trade Agglomeration on Technology Diffusion in Coastal Cities in Different Time and Space. J. Coast. Res. 2020, 103, 543–547. [Google Scholar] [CrossRef]
  20. Sun, R.; Wu, Z.; Chen, B.; Yang, C.; Qi, D.; Lan, G.; Fraedrich, K. Effects of Land-Use Change on Eco-Environmental Quality in Hainan Island, China. Ecol. Indic. 2020, 109, 105777. [Google Scholar] [CrossRef]
  21. Ye, Y.; Wang, Y.; Liao, J.; Chen, J.; Zou, Y.; Liu, Y.; Feng, C. Spatiotemporal Pattern Analysis of Land Use Functions in Contiguous Coastal Cities Based on Long-Term Time Series Remote Sensing Data: A Case Study of Bohai Sea Region, China. Remote Sens. 2022, 14, 3518. [Google Scholar] [CrossRef]
  22. Zhang, W.; Chang, W.J.; Zhu, Z.C.; Hui, Z. Landscape Ecological Risk Assessment of Chinese Coastal Cities Based on Land Use Change. Appl. Geogr. 2020, 117, 102174. [Google Scholar] [CrossRef]
  23. Xu, C.; Jiang, W.; Huang, Q.; Wang, Y. Ecosystem Services Response to Rural-Urban Transitions in Coastal and Island Cities: A Comparison between Shenzhen and Hong Kong, China. J. Clean. Prod. 2020, 260, 121033. [Google Scholar] [CrossRef]
  24. Baró, F.; Gómez-Baggethun, E.; Haase, D. Ecosystem Service Bundles along the Urban-Rural Gradient: Insights for Landscape Planning and Management. Ecosyst. Serv. 2017, 24, 147–159. [Google Scholar] [CrossRef] [Green Version]
  25. Yan, Z.; You, N.; Wang, L.; Lan, C. Assessing the Impact of Road Network on Urban Landscape Ecological Risk Based on Corridor Cutting Degree Model in Fuzhou, China. Sustainability 2023, 15, 1724. [Google Scholar] [CrossRef]
  26. Munizaga, J.; García, M.; Ureta, F.; Novoa, V.; Rojas, O.; Rojas, C. Mapping Coastal Wetlands Using Satellite Imagery and Machine Learning in a Highly Urbanized Landscape. Sustainability 2022, 14, 5700. [Google Scholar] [CrossRef]
  27. Zhang, G. Landscape Design of Adaptable Gardens to Flood Disasters in Coastal Cities. Fresenius Environ. Bull. 2022, 31, 5955–5960. [Google Scholar]
  28. Yılmaz, M.; Terzi, F. Quantitative Spatial Assessment of the Impact of Urban Growth on the Landscape Network of Türkiye’s Coastal Cities. Environ. Monit Assess 2023, 195, 466. [Google Scholar] [CrossRef]
  29. Zhu, Z.; Zhou, Y.; Seto, K.C.; Stokes, E.C.; Deng, C.; Pickett, S.T.A.; Taubenböck, H. Understanding an Urbanizing Planet: Strategic Directions for Remote Sensing. Remote Sens. Environ. 2019, 228, 164–182. [Google Scholar] [CrossRef]
  30. Du, P.; Liu, P.; Xia, J.; Feng, L.; Liu, S.; Tan, K.; Cheng, L. Remote Sensing Image Interpretation for Urban Environment Analysis: Methods, System and Examples. Remote Sens. 2014, 6, 9458–9474. [Google Scholar] [CrossRef] [Green Version]
  31. Duan, C.; Zheng, X.; Jin, L.; Chen, Y.; Li, R.; Yang, Y. Study on the Remote Sensing Spectral Method for Disaster Loss Inversion in Urban Flood Areas. Water 2022, 14, 2165. [Google Scholar] [CrossRef]
  32. Xu, H.; Wang, Y.; Guan, H.; Shi, T.; Hu, X. Detecting Ecological Changes with a Remote Sensing Based Ecological Index (RSEI) Produced Time Series and Change Vector Analysis. Remote Sens. 2019, 11, 2345. [Google Scholar] [CrossRef] [Green Version]
  33. Sun, C.; Li, J.; Liu, Y.; Cao, L.; Zheng, J.; Yang, Z.; Ye, J.; Li, Y. Ecological Quality Assessment and Monitoring Using a Time-Series Remote Sensing-Based Ecological Index (Ts-RSEI). GISci. Remote Sens. 2022, 59, 1793–1816. [Google Scholar] [CrossRef]
  34. Chen, Z.; Chen, R.; Guo, Q.; Hu, Y. Spatiotemporal Change of Urban Ecologic Environment Quality Based on RSEI—Taking Meizhou City, China as an Example. Sustainability 2022, 14, 13424. [Google Scholar] [CrossRef]
  35. Wen, X.; Ming, Y.; Gao, Y.; Hu, X. Dynamic Monitoring and Analysis of Ecological Quality of Pingtan Comprehensive Experimental Zone, a New Type of Sea Island City, Based on RSEI. Sustainability 2020, 12, 21. [Google Scholar] [CrossRef] [Green Version]
  36. Zhang, Y.; Jiang, F. Developing a Remote Sensing-Based Ecological Index Based on Improved Biophysical Features. J. Appl. Rem. Sens. 2021, 16, 012008. [Google Scholar] [CrossRef]
  37. Yang, W.; Zhou, Y.; Li, C. Assessment of Ecological Environment Quality in Rare Earth Mining Areas Based on Improved RSEI. Sustainability 2023, 15, 2964. [Google Scholar] [CrossRef]
  38. Bai, Z.; Han, L.; Liu, H.; Jiang, X.; Li, L. Spatiotemporal Change and Driving Factors of Ecological Status in Inner Mongolia Based on the Modified Remote Sensing Ecological Index. Environ. Sci. Pollut. Res. 2023, 30, 52593–52608. [Google Scholar] [CrossRef]
  39. Shi, F.; Yang, B.; Li, M. An Improved Framework for Assessing the Impact of Different Urban Development Strategies on Land Cover and Ecological Quality Changes -A Case Study from Nanjing Jiangbei New Area, China. Ecol. Indic. 2023, 147, 109998. [Google Scholar] [CrossRef]
  40. Liao, W. Temporal and Spatial Variations of Eco-Environment in Association of Southeast Asian Nations from 2000 to 2021 Based on Information Granulation. J. Clean Prod. 2022, 373, 133890. [Google Scholar] [CrossRef]
  41. Yang, X.; Meng, F.; Fu, P.; Zhang, J.; Liu, Y. Instability of Remote Sensing Ecological Index and Its Optimisation for Time Frequency and Scale. Ecol. Inform. 2022, 72, 101870. [Google Scholar] [CrossRef]
  42. Jiao, Z.; Sun, G.; Zhang, A.; Jia, X.; Huang, H.; Yao, Y. Water Benefit-Based Ecological Index for Urban Ecological Environment Quality Assessments. IEEE J. Sel. Top. Appl. Earth Obs. Remote Sens. 2021, 14, 7557–7569. [Google Scholar] [CrossRef]
  43. Hu, X.; Xu, H. A New Remote Sensing Index for Assessing the Spatial Heterogeneity in Urban Ecological Quality: A Case from Fuzhou City, China. Ecol. Indic. 2018, 89, 11–21. [Google Scholar] [CrossRef]
  44. Przezdziecki, K.; Zawadzki, J. Impact of the Variability of Vegetation, Soil Moisture, and Building Density between City Districts on Land Surface Temperature, Warsaw, Poland. Sustainability 2023, 15, 1274. [Google Scholar] [CrossRef]
  45. Sarif, M.O.; Gupta, R.D.; Murayama, Y. Assessing Local Climate Change by Spatiotemporal Seasonal LST and Six Land Indices, and Their Interrelationships with SUHI and Hot-Spot Dynamics: A Case Study of Prayagraj City, India (1987–2018). Remote Sens. 2023, 15, 179. [Google Scholar] [CrossRef]
  46. Seletkovic, A.; Kicic, M.; Ancic, M.; Kolic, J.; Pernar, R. The Urban Heat Island Analysis for the City of Zagreb in the Period 2013-2022 Utilizing Landsat 8 Satellite Imagery. Sustainability 2023, 15, 3963. [Google Scholar] [CrossRef]
  47. Liang, L.; Di, L.; Zhang, L.; Deng, M.; Qin, Z.; Zhao, S.; Lin, H. Estimation of Crop LAI Using Hyperspectral Vegetation Indices and a Hybrid Inversion Method. Remote Sens. Environ. 2015, 165, 123–134. [Google Scholar] [CrossRef]
  48. Li, J. Evaluation Method of Ecological Vulnerability of Scenic Spots Based on Entropy Weight TOPSIS Model. Int. J. Environ. Technol. Manag. 2023, 26, 14–26. [Google Scholar] [CrossRef]
  49. Guo, Y.; Ma, X.; Zhu, Y.; Chen, D.; Zhang, H. Research on Driving Factors of Forest Ecological Security: Evidence from 12 Provincial Administrative Regions in Western China. Sustainability 2023, 15, 5505. [Google Scholar] [CrossRef]
  50. Chen, C.; Zhang, H. Evaluation of Green Development Level of Mianyang Agriculture, Based on the Entropy Weight Method. Sustainability 2023, 15, 7589. [Google Scholar] [CrossRef]
  51. Sun, K.; He, W.; Shen, Y.; Yan, T.; Liu, C.; Yang, Z.; Han, J.; Xie, W. Ecological Security Evaluation and Early Warning in the Water Source Area of the Middle Route of South-to-North Water Diversion Project. Sci. Total Environ. 2023, 868, 161561. [Google Scholar] [CrossRef]
  52. Gao, P.; Wang, X.; Wang, H.; Cheng, C. Viewpoint: A Correction to the Entropy Weight Coefficient Method by Shen et al. for Accessing Urban Sustainability [Cities 42 (2015) 186–194]. Cities 2020, 103, 102742. [Google Scholar] [CrossRef]
  53. Qi, J.; Zhang, Y.; Zhang, J.; Wu, C.; Chen, Y.; Cheng, Z. Study on the Restoration of Ecological Environments in Mining Area Based on GIS Technology. Sustainability 2023, 15, 6128. [Google Scholar] [CrossRef]
  54. Zhang, L.; Fang, C.; Zhao, R.; Zhu, C.; Guan, J. Spatial-Temporal Evolution and Driving Force Analysis of Eco-Quality in Urban Agglomerations in China. Sci. Total Environ. 2023, 866, 161465. [Google Scholar] [CrossRef] [PubMed]
  55. Chen, Q.; Mao, Y.; Morrison, A.M. The Influence of Land Use Evolution on the Visitor Economy in Wuhan from the Perspective of Ecological Service Value. Land 2022, 11, 1. [Google Scholar] [CrossRef]
  56. Long, H.; Qu, Y. Land Use Transitions and Land Management: A Mutual Feedback Perspective. Land Use Policy 2018, 74, 111–120. [Google Scholar] [CrossRef]
Figure 1. Location of the study area.
Sustainability 15 11537 g001
Figure 2. Comparison between WBEI and RSEI. (a) Spatial distribution of WBEI in Fuzhou City in 2020; (b) Spatial distribution of RSBI in Fuzhou in 2020; (c) Satellite image of Fuzhou City.
Sustainability 15 11537 g002
Figure 3. Distribution of RSEI2020 and WBEI2020 values.
Sustainability 15 11537 g003
Figure 4. The distribution of the difference between the WBEI and the RSEI. (a) The spatial distribution of the difference; (b) The value distribution of the difference.
Sustainability 15 11537 g004
Figure 5. Field observation; comparison results between the WBEI and the RSEI.
Sustainability 15 11537 g005
Figure 6. The weight of the WBEI’s indicators.
Sustainability 15 11537 g006
Figure 7. Spatial distribution of ecological and environmental quality in Fuzhou City, 2000–2020.
Sustainability 15 11537 g007
Figure 8. Percentage of different eco-environmental quality classes in Fuzhou.
Sustainability 15 11537 g008
Figure 9. Characteristics of trend changes in Fuzhou from 2000 to 2020.
Sustainability 15 11537 g009
Figure 10. Percentage of different eco-environmental quality classes in Fuzhou.
Sustainability 15 11537 g010
Figure 11. Land use cover change in Fuzhou City, 2000–2020.
Sustainability 15 11537 g011
Figure 12. Single land use dynamics and comprehensive use dynamics in Fuzhou City, 2000–2020. (a) Intensity of land-use change in Fuzhou, 2000–2010; (b) Intensity of land-use change in Fuzhou, 2010–2020.
Sustainability 15 11537 g012
Figure 13. WBEI values for different land types.
Sustainability 15 11537 g013
Table 1. WBEI trend levels.
Delineated IntervalsEcological Quality Levels
[0, 0.2)Lowest level
[0.2, 0.4)Low level
[0.4, 0.6)Moderate level
[0.6, 0.8)High level
[0.8, 1.0)Highest level
Table 2. The definition of the Sen-MK trend.
Sen-MK TrendSen > 0Sen < 0
|Z| > 1.96Significant increase (S-increase)Significant decrease (S-decrease)
|Z| < 1.96Not significant increase (NS-increase)Not significant decrease (NS-decrease)
Table 3. Land use transfer matrix 2000–2010.
2010Cultivated LandForestGrassWetlandWaterArtificial SurfaceBare LandTotal
2000
Cultivated land3113.33242.0542.802.3317.5886.852.623507.56
Forest145.327049.36223.640.808.2733.5018.497479.37
Grass40.12227.64551.630.421.856.907.86836.41
Wetland2.730.770.42129.747.070.820.13141.68
Water18.367.281.967.56378.552.791.50417.99
Artificial surface30.314.812.030.242.31471.280.58511.55
Bare land4.0616.148.170.162.036.3334.3971.27
Total3354.227548.03830.65141.25417.65608.4665.5712,965.84
Table 4. Land use transfer matrix 2010–2020.
2020Cultivated LandForestGrassWetlandWaterArtificial SurfaceBare LandTotal
2010
Cultivated land2682.68224.4955.026.0870.80310.004.563353.63
Forest201.076947.56290.732.0427.4961.8316.707547.43
Grass53.06281.68456.200.506.2224.108.38830.13
Wetland2.986.152.0879.7832.0918.760.22142.07
Water17.6211.102.9816.52315.5352.631.47417.85
Artificial surface41.635.732.760.495.24551.720.94608.51
Bare land2.9124.268.440.254.065.7519.7565.41
Total3001.957500.96818.20105.66461.441024.7952.0212,965.03
Disclaimer/Publisher’s Note: The statements, opinions and data contained in all publications are solely those of the individual author(s) and contributor(s) and not of MDPI and/or the editor(s). MDPI and/or the editor(s) disclaim responsibility for any injury to people or property resulting from any ideas, methods, instructions or products referred to in the content.

