
Variations of Extreme Temperature Event Indices in Six Temperature Zones in China from 1961 to 2020


Abstract
:1. Introduction
2. Data and Methods
2.1. Data
2.2. Regionalization Method
2.3. Evaluation Methods
2.3.1. Extreme Temperature Event Indices
2.3.2. Change Rate and Percentage
3. Results
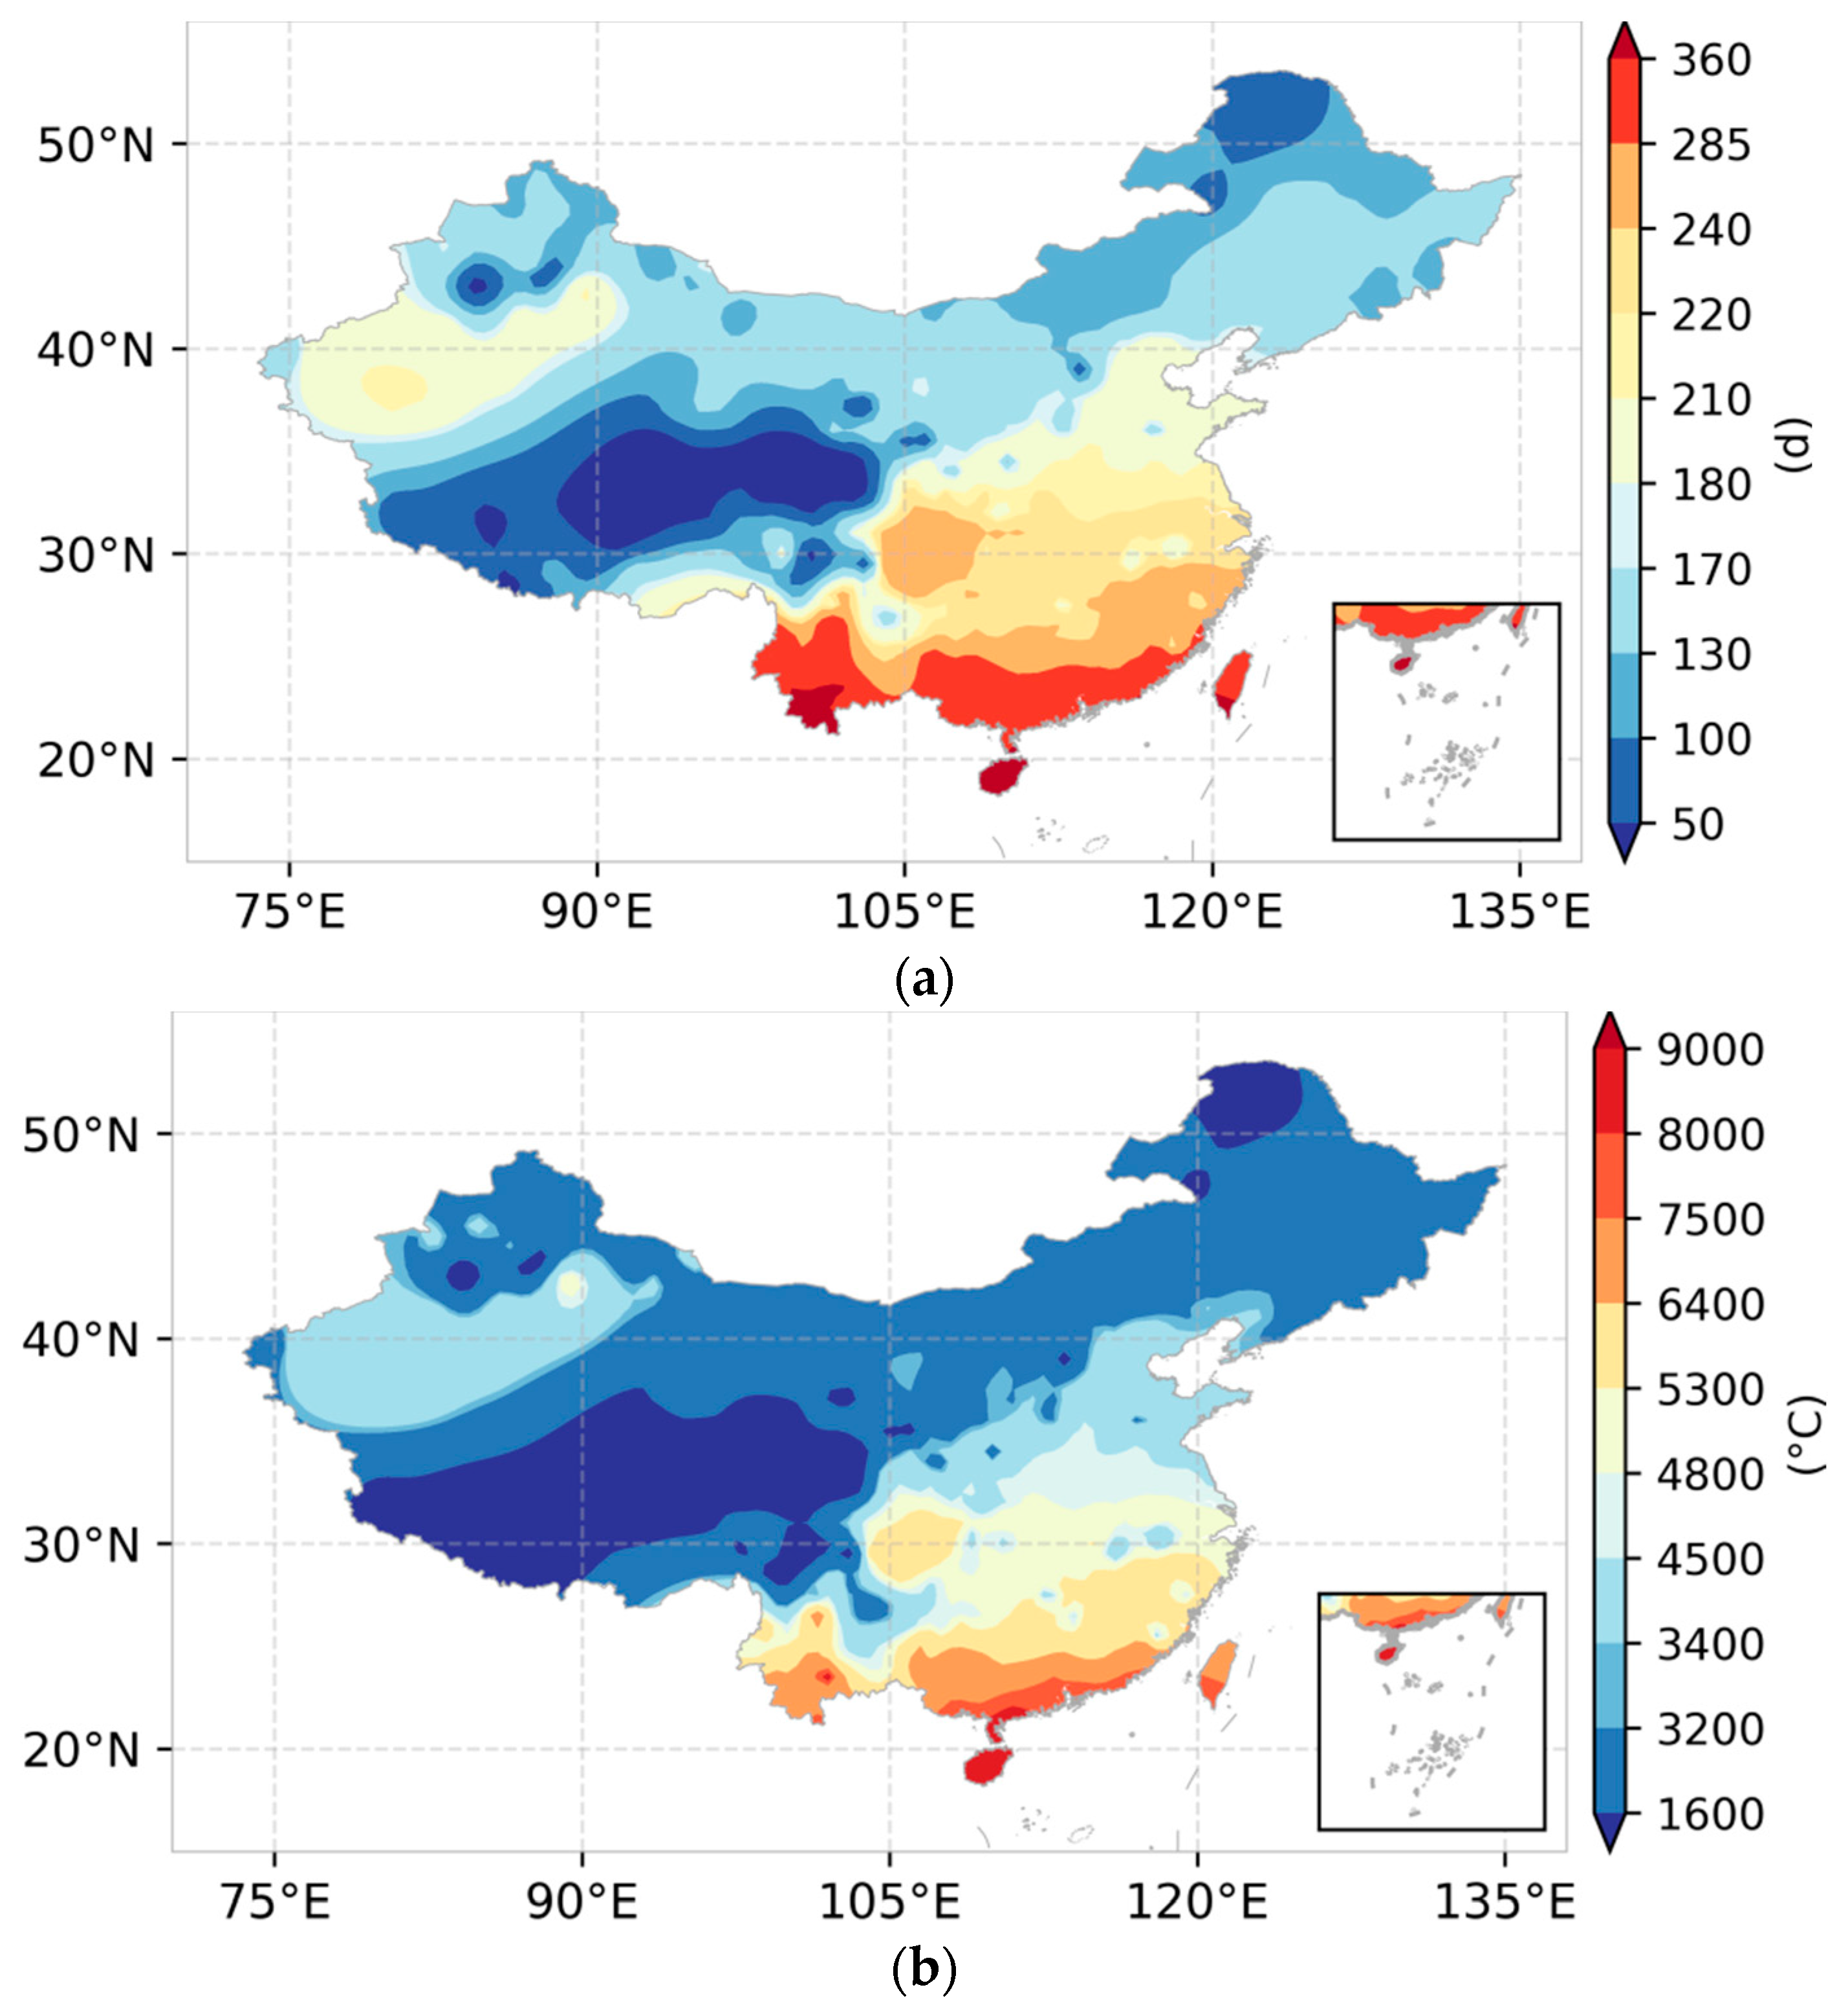
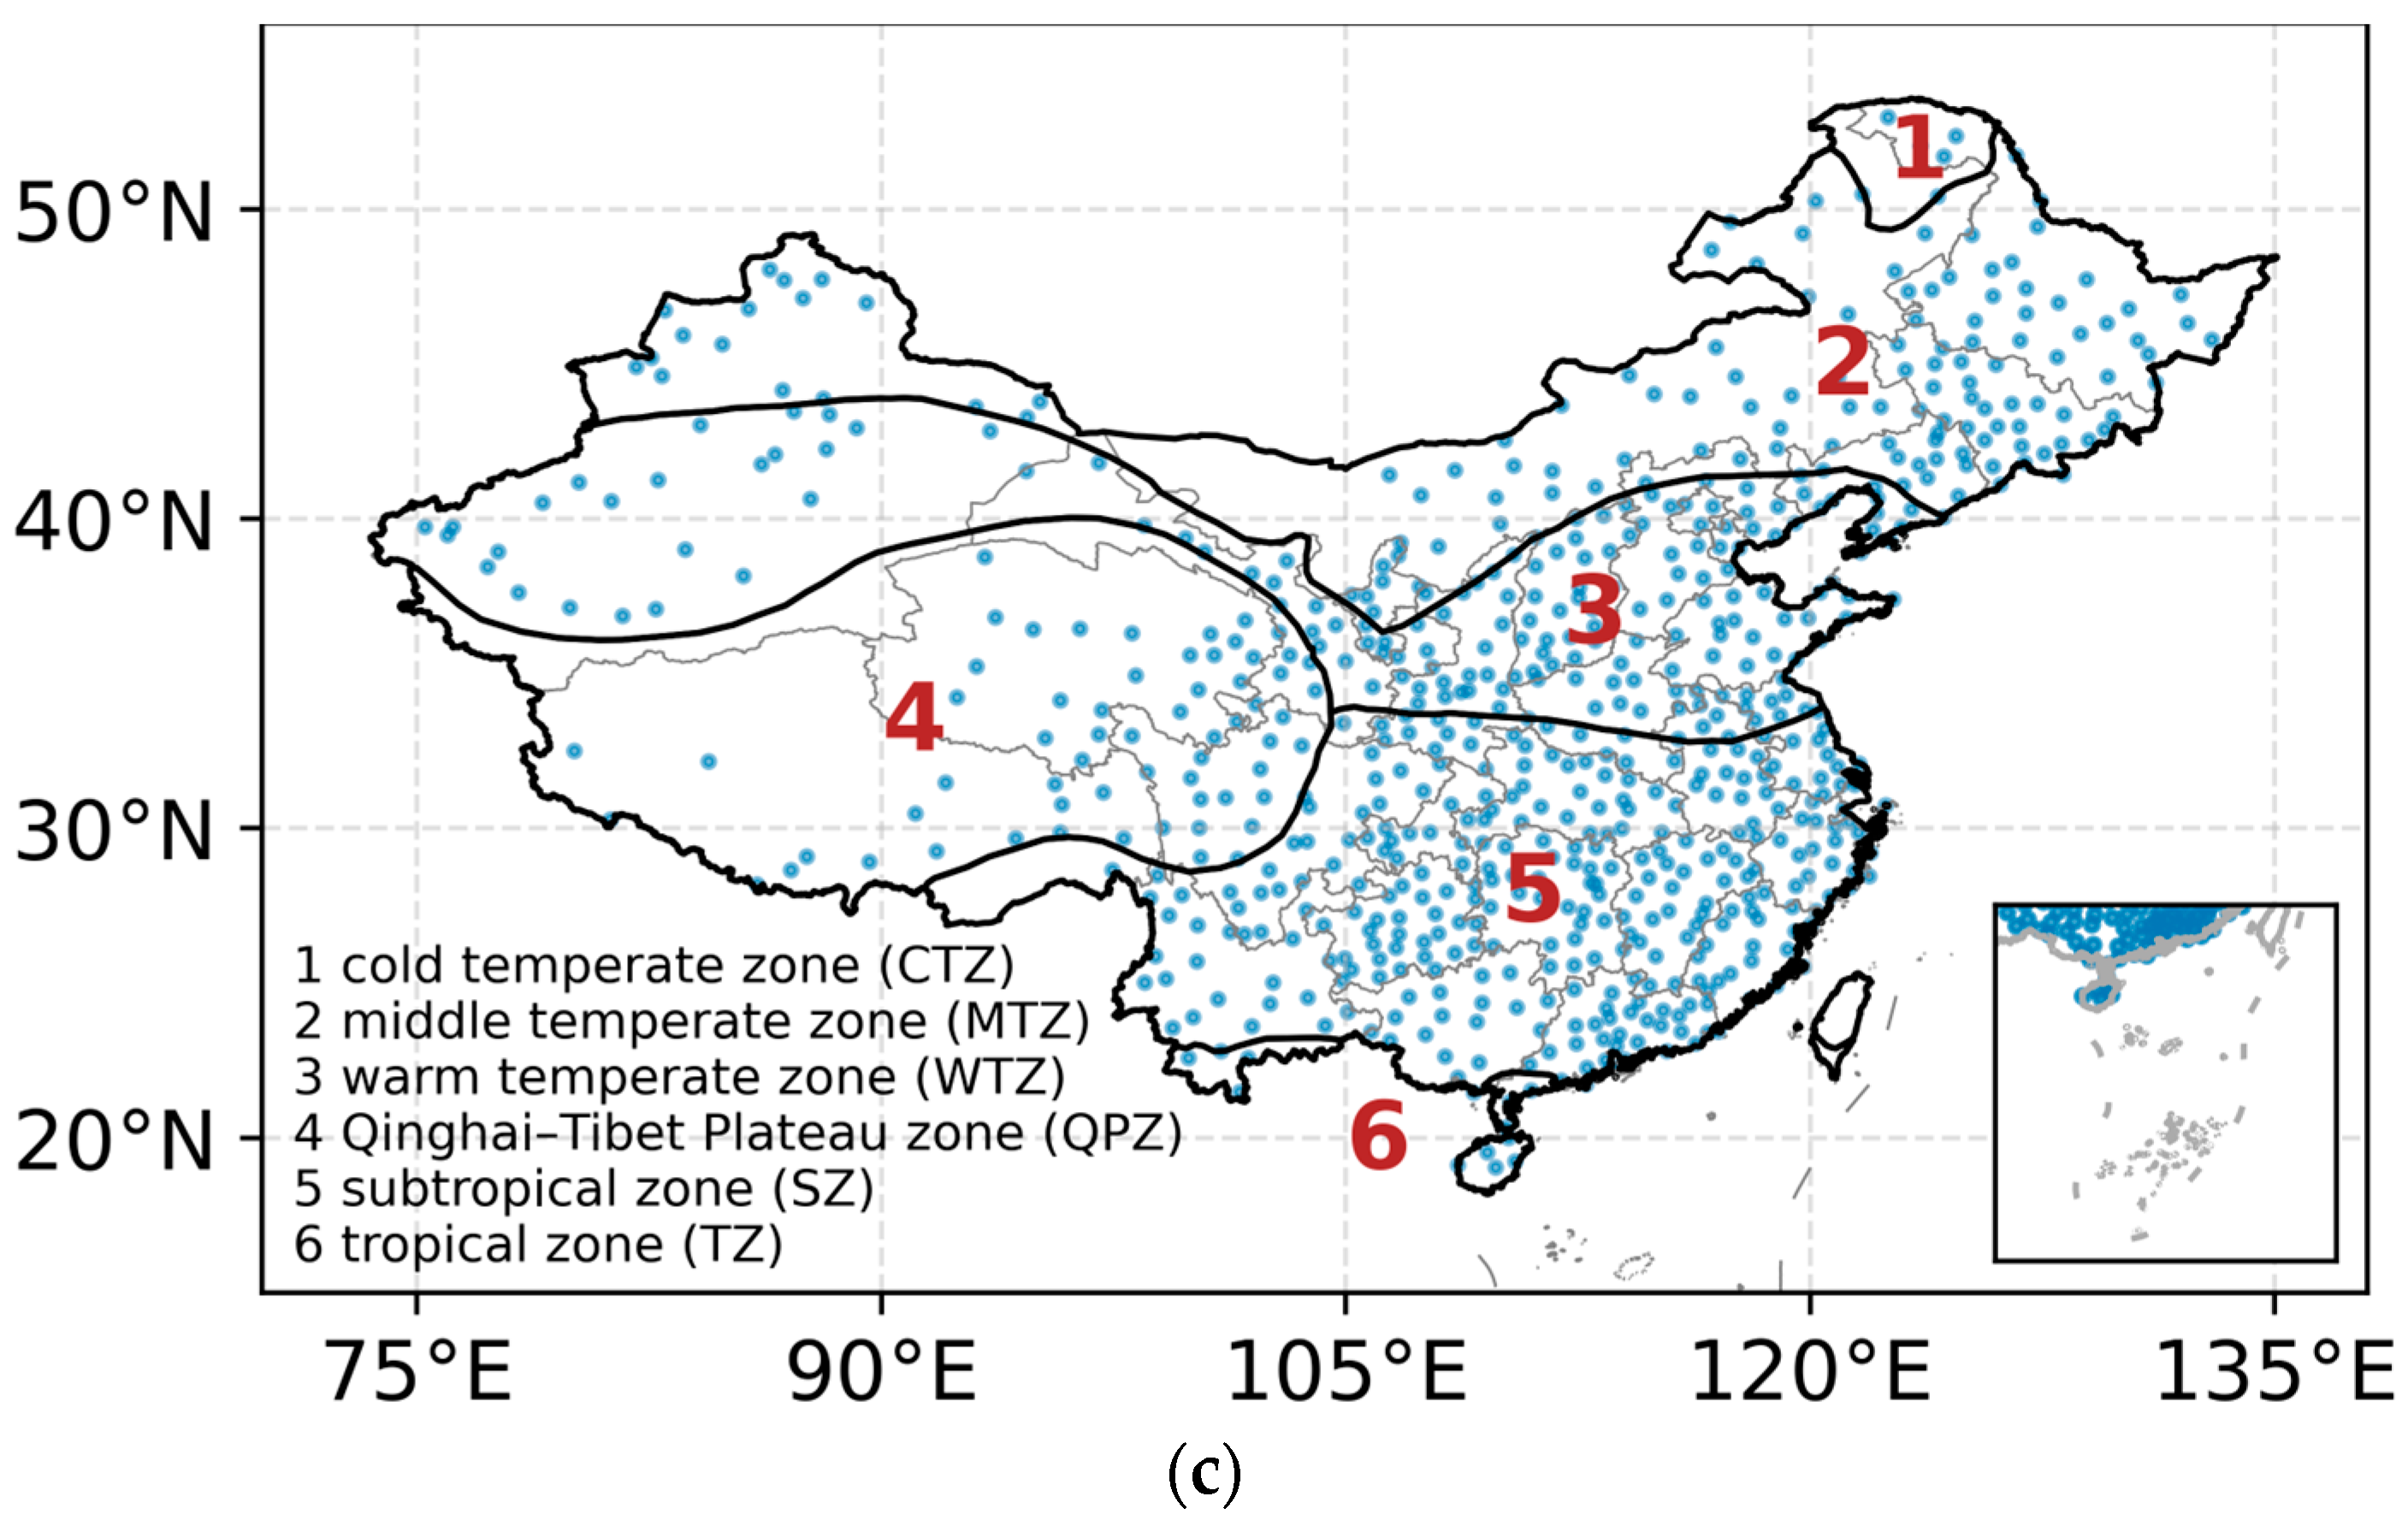
3.1. Temperature Regionalization
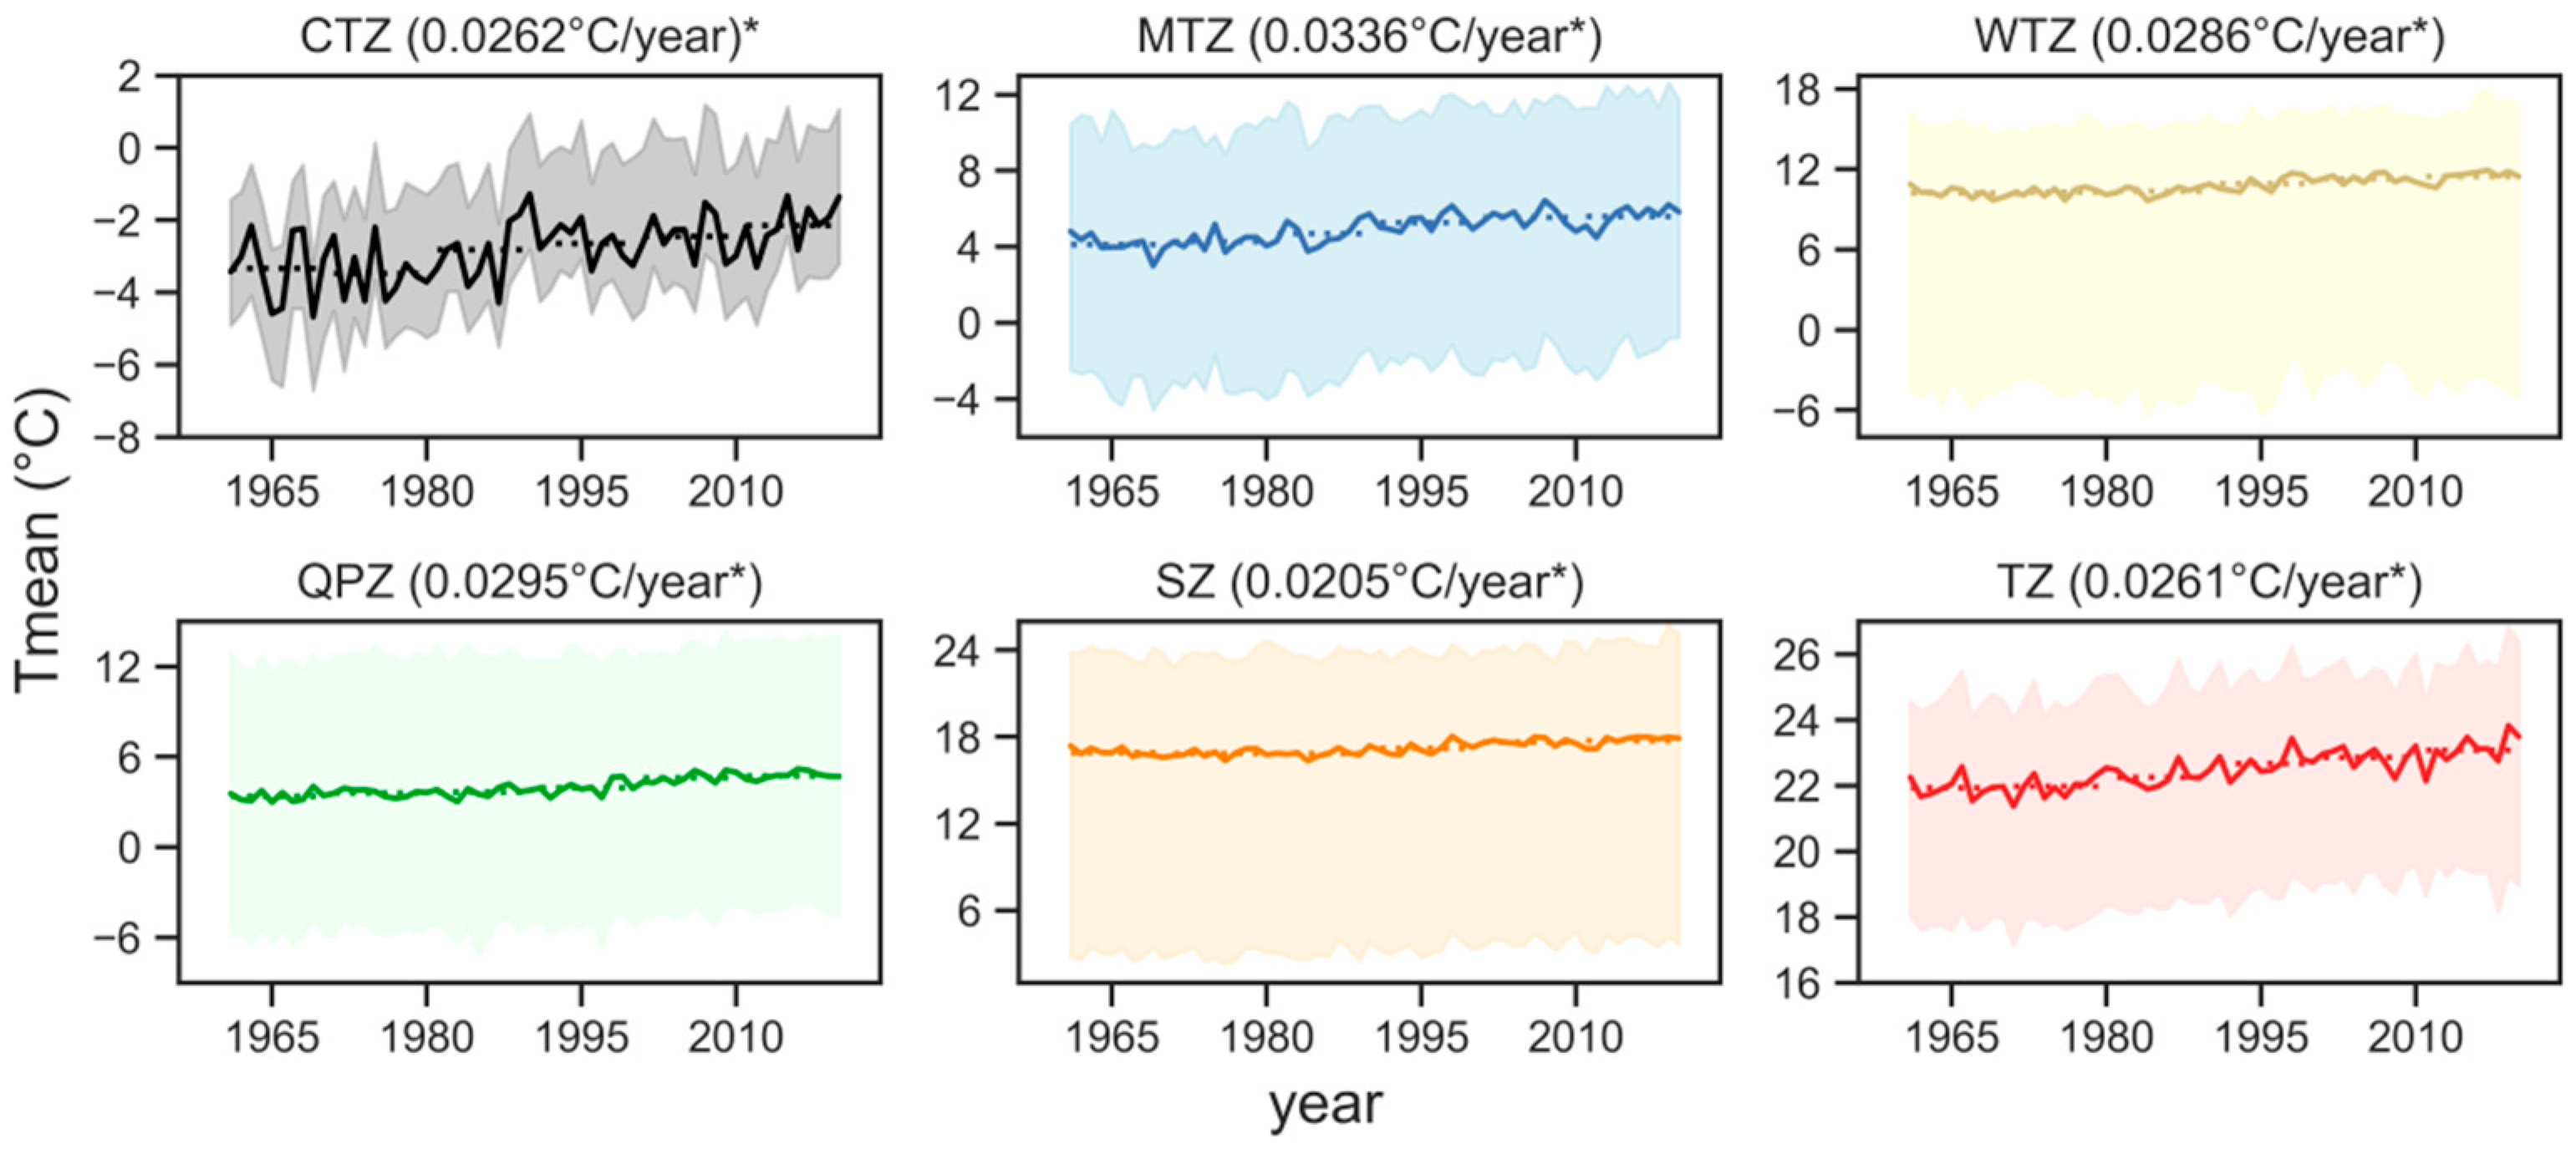
3.2. Evaluation of Mean Temperature (TM)
3.3. Evaluation of Extreme Temperature Events
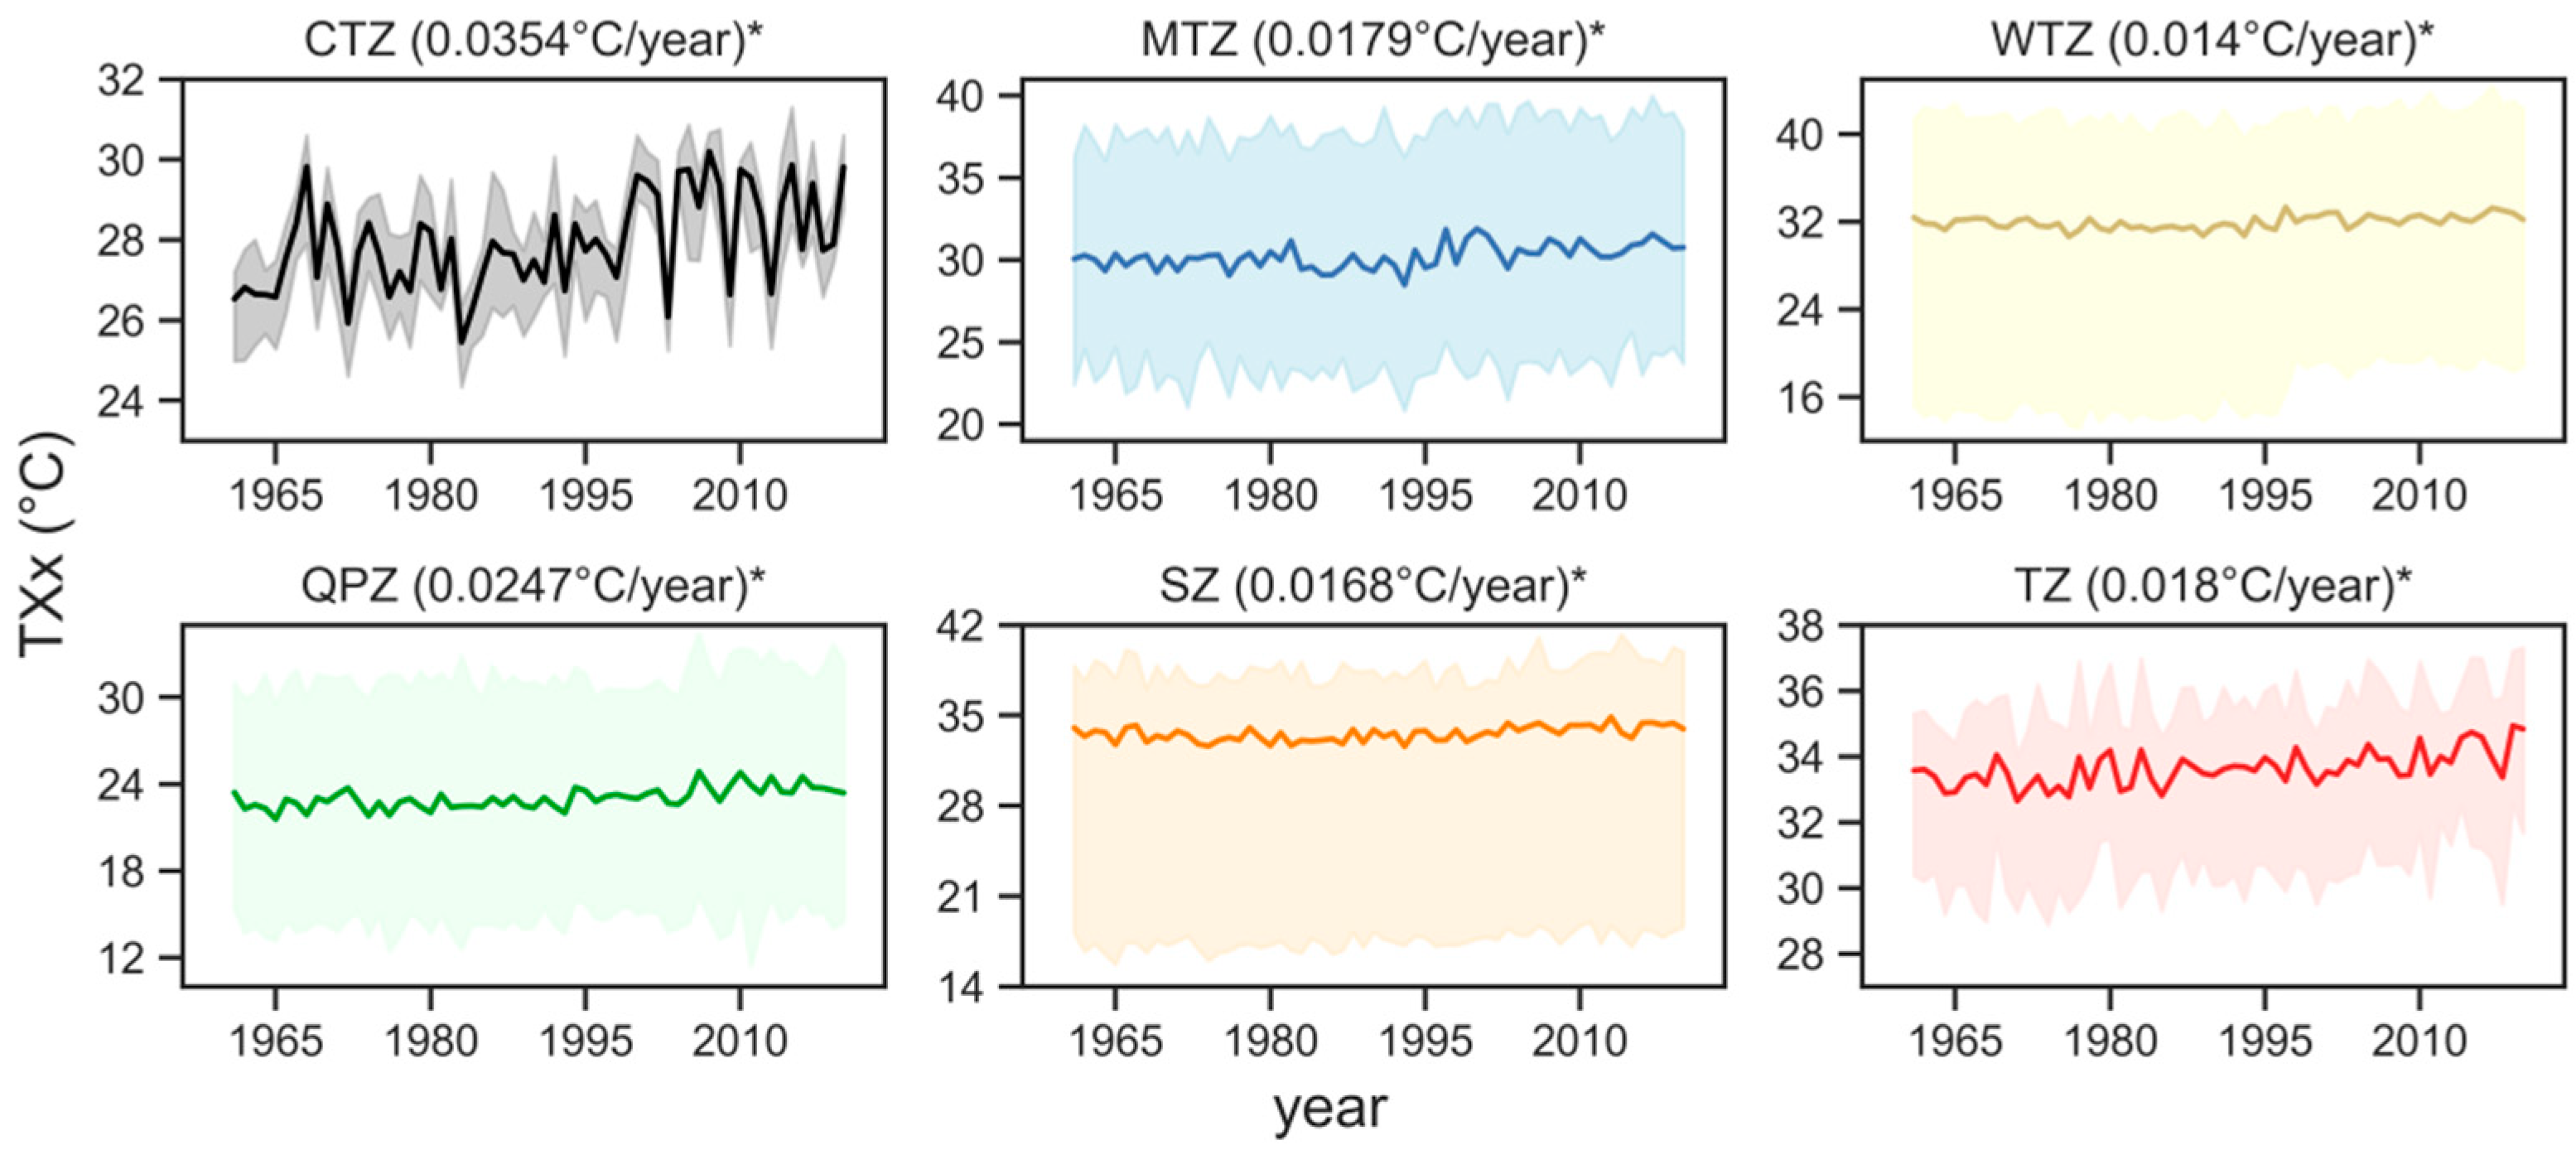
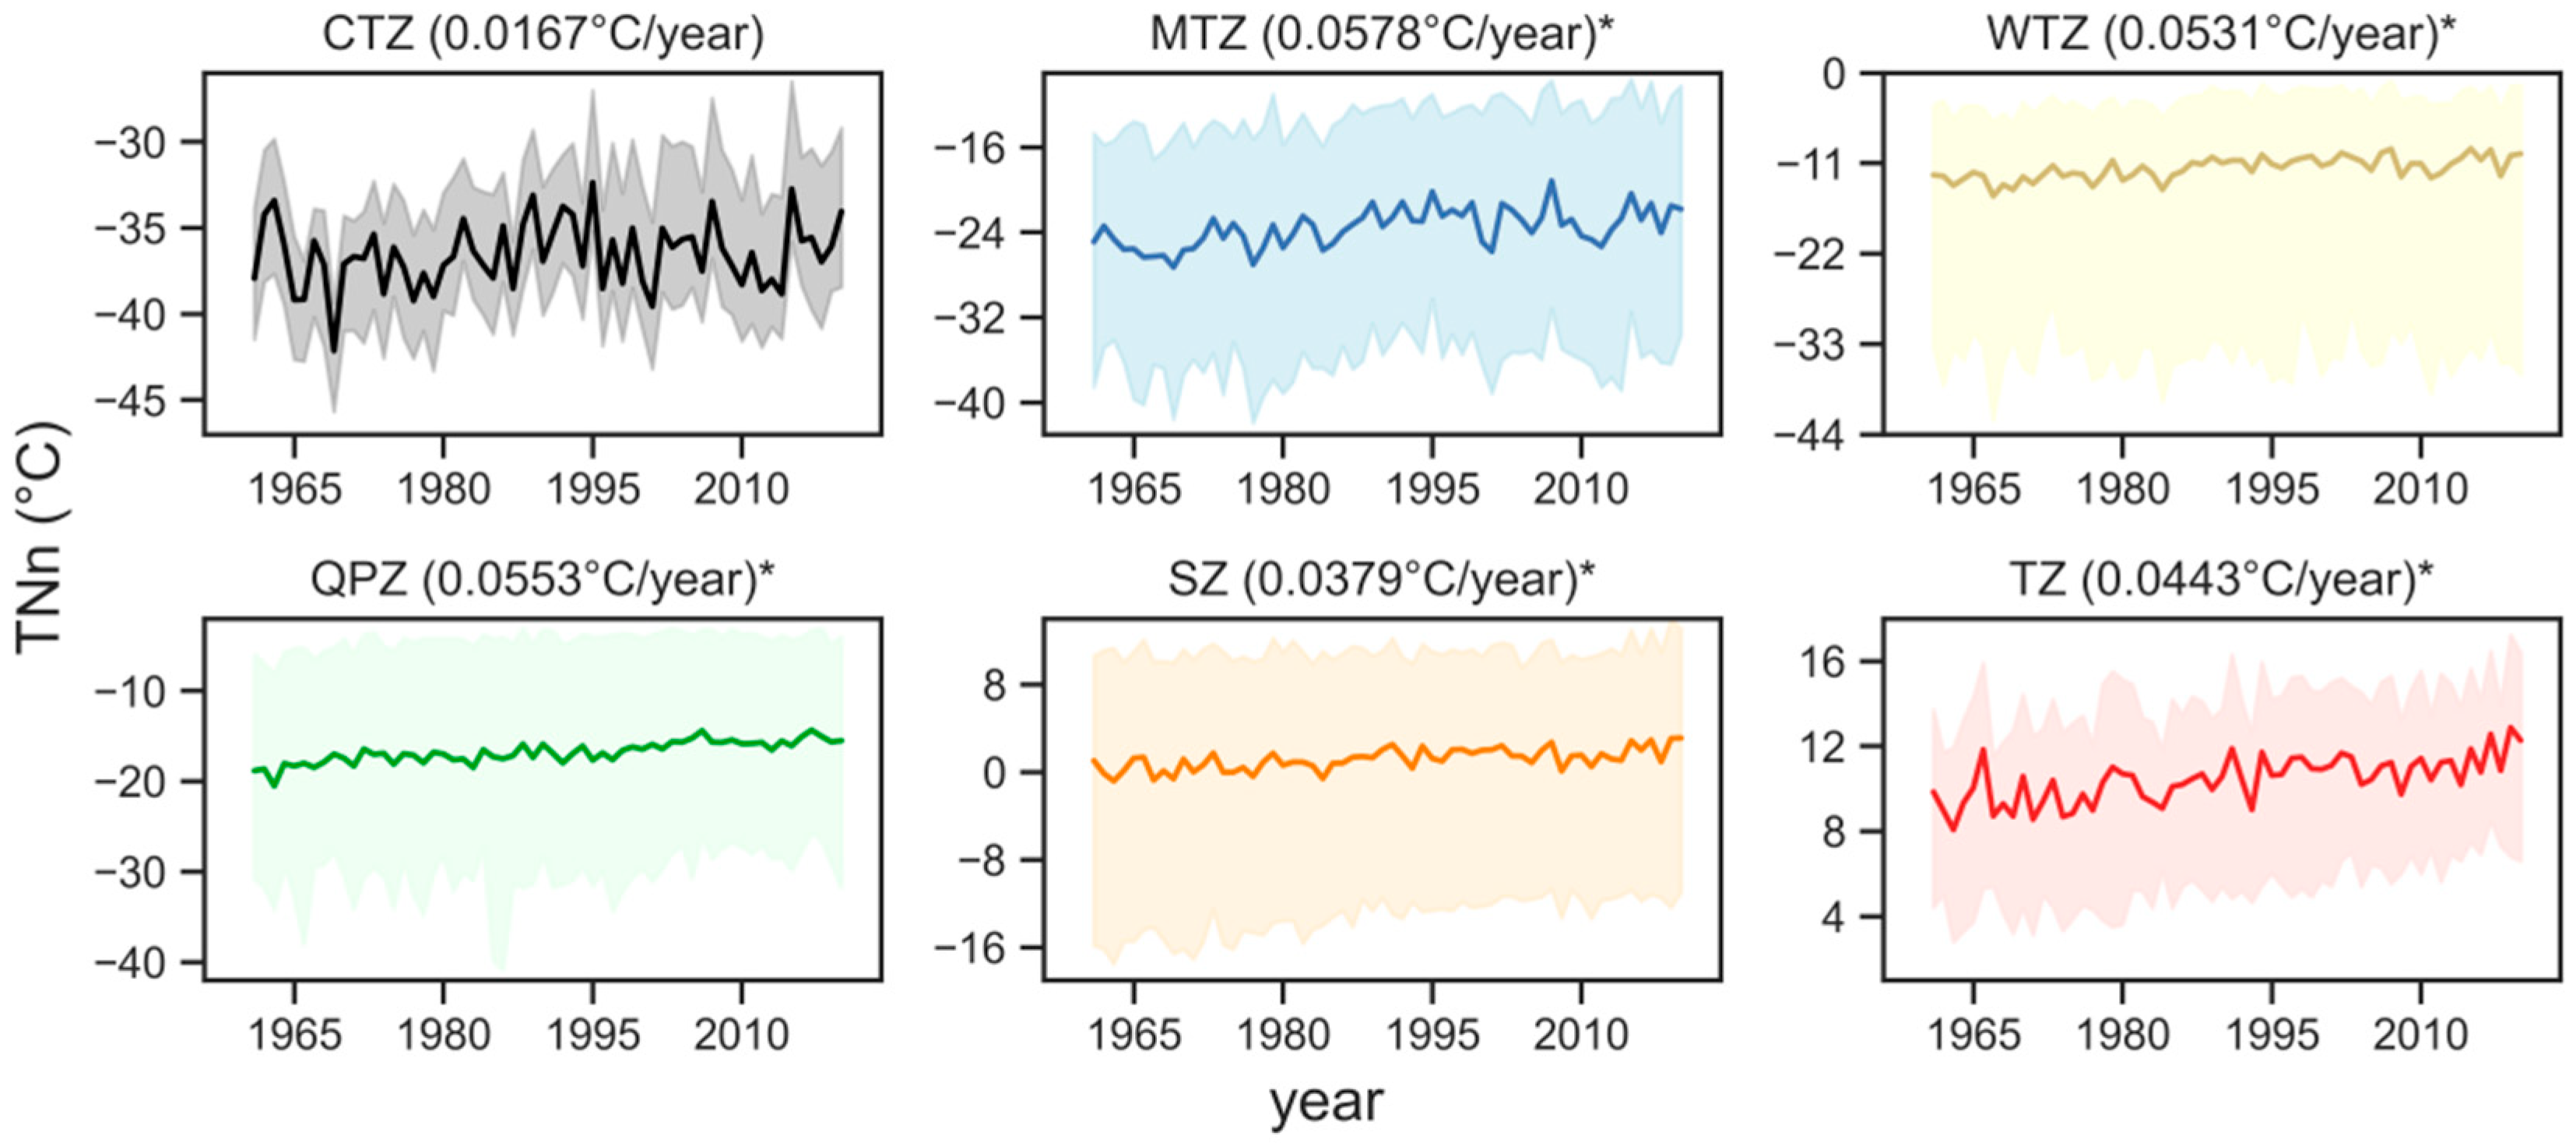
3.3.1. Magnitude of Extreme Temperature Events
Extreme Maximum Temperature (TXx)
Extreme Minimum Temperature (TNn)
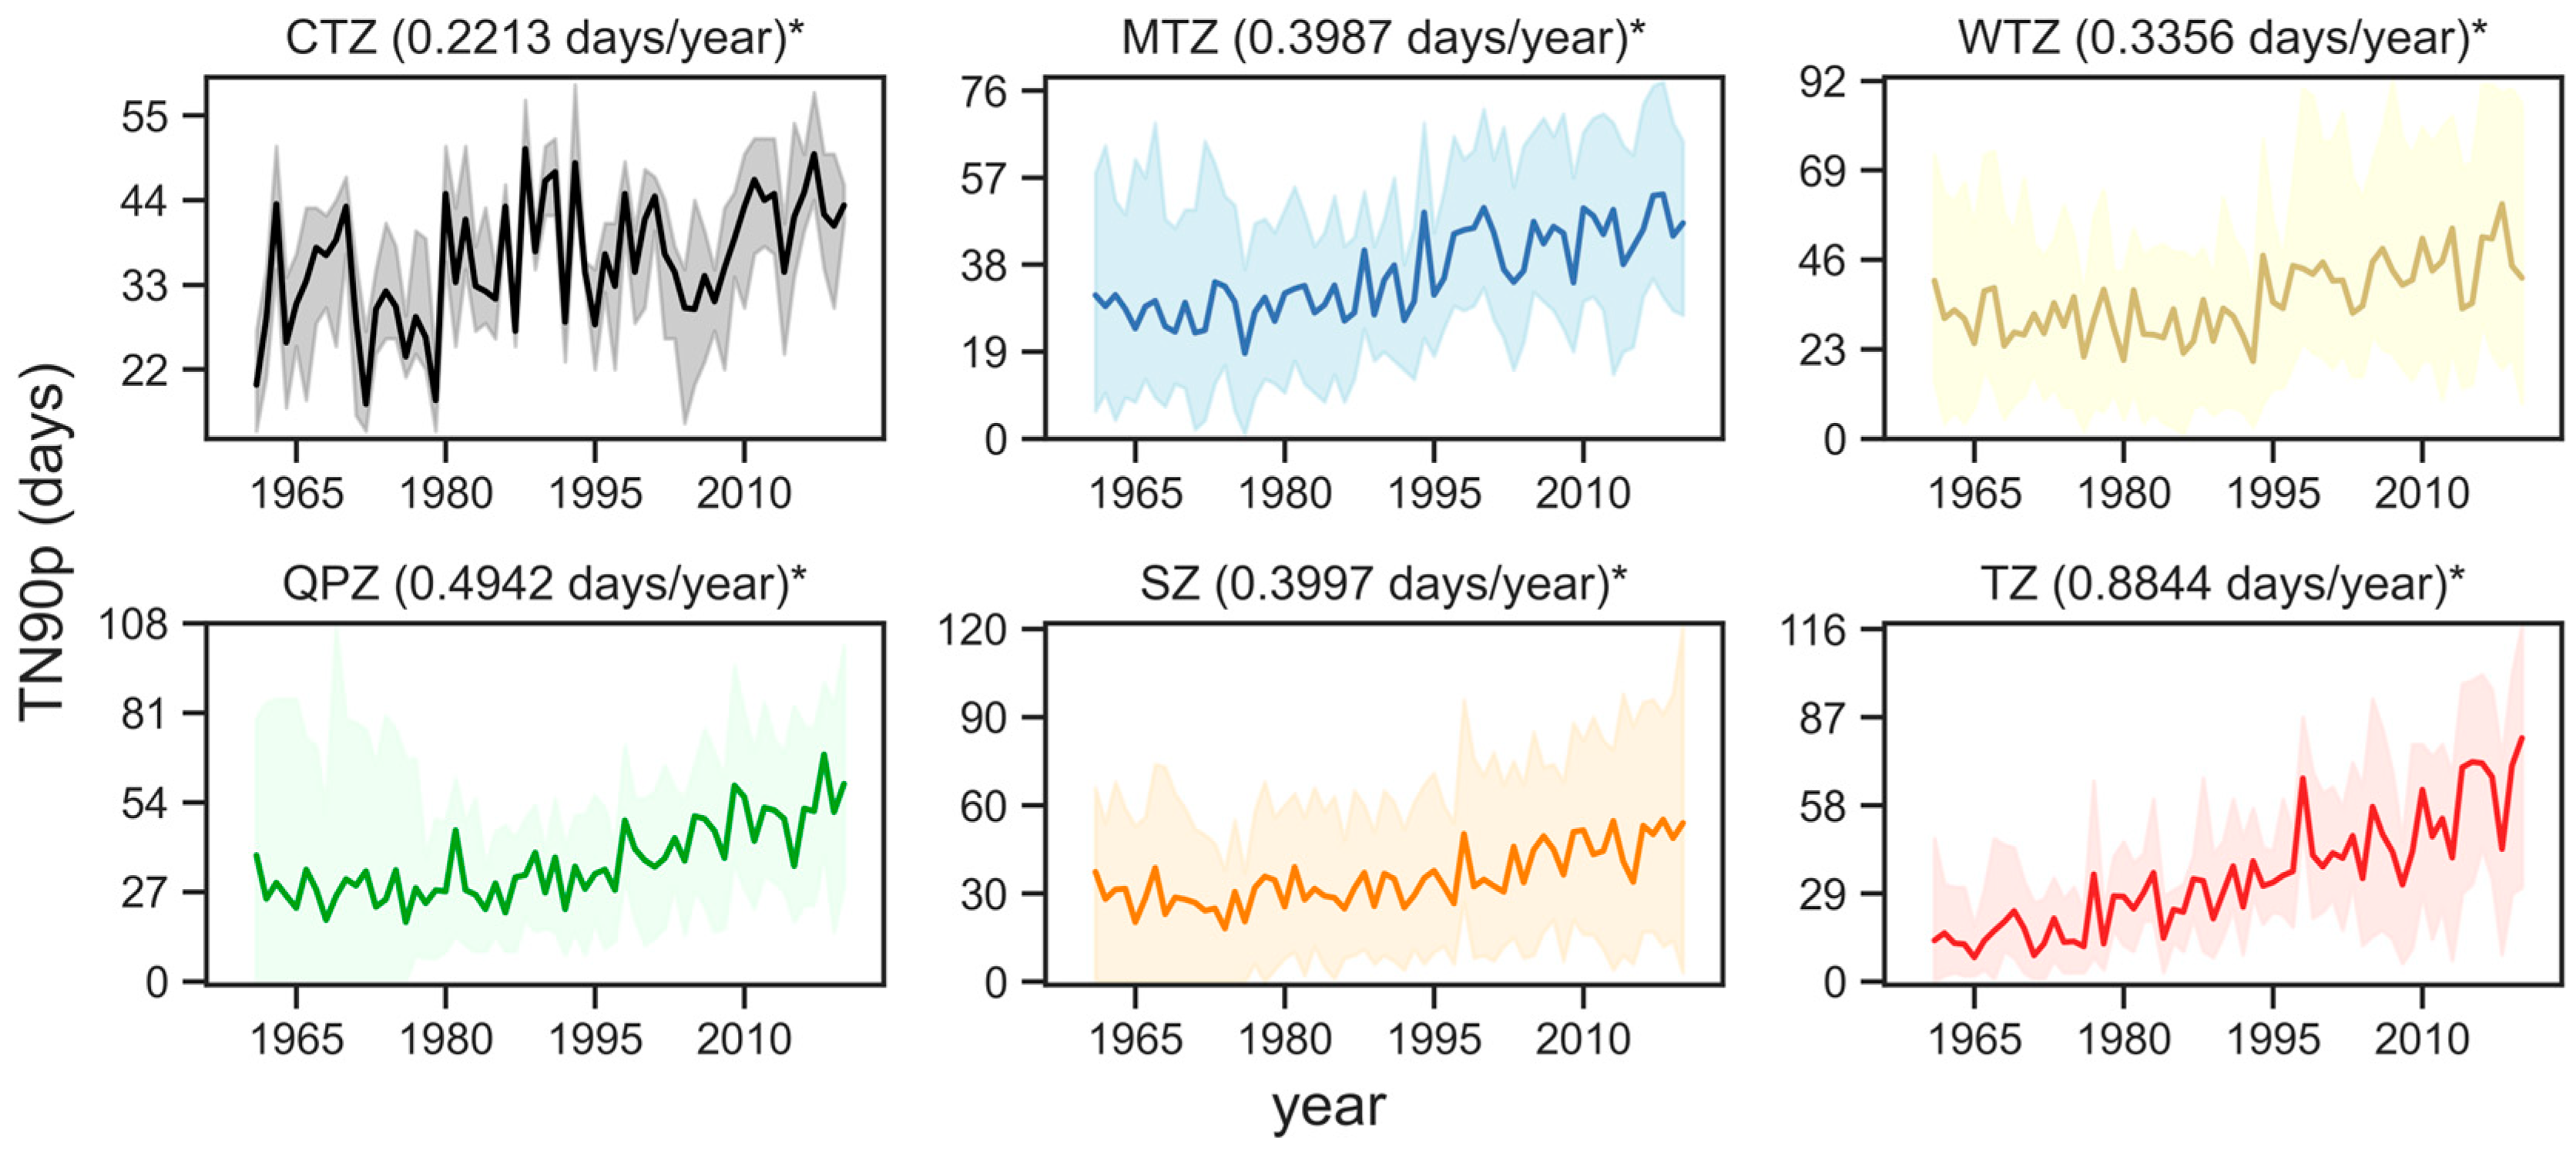
3.3.2. Frequency of Extreme Temperature Events
Warm Days (TX90p)
Warm Nights (TN90p)
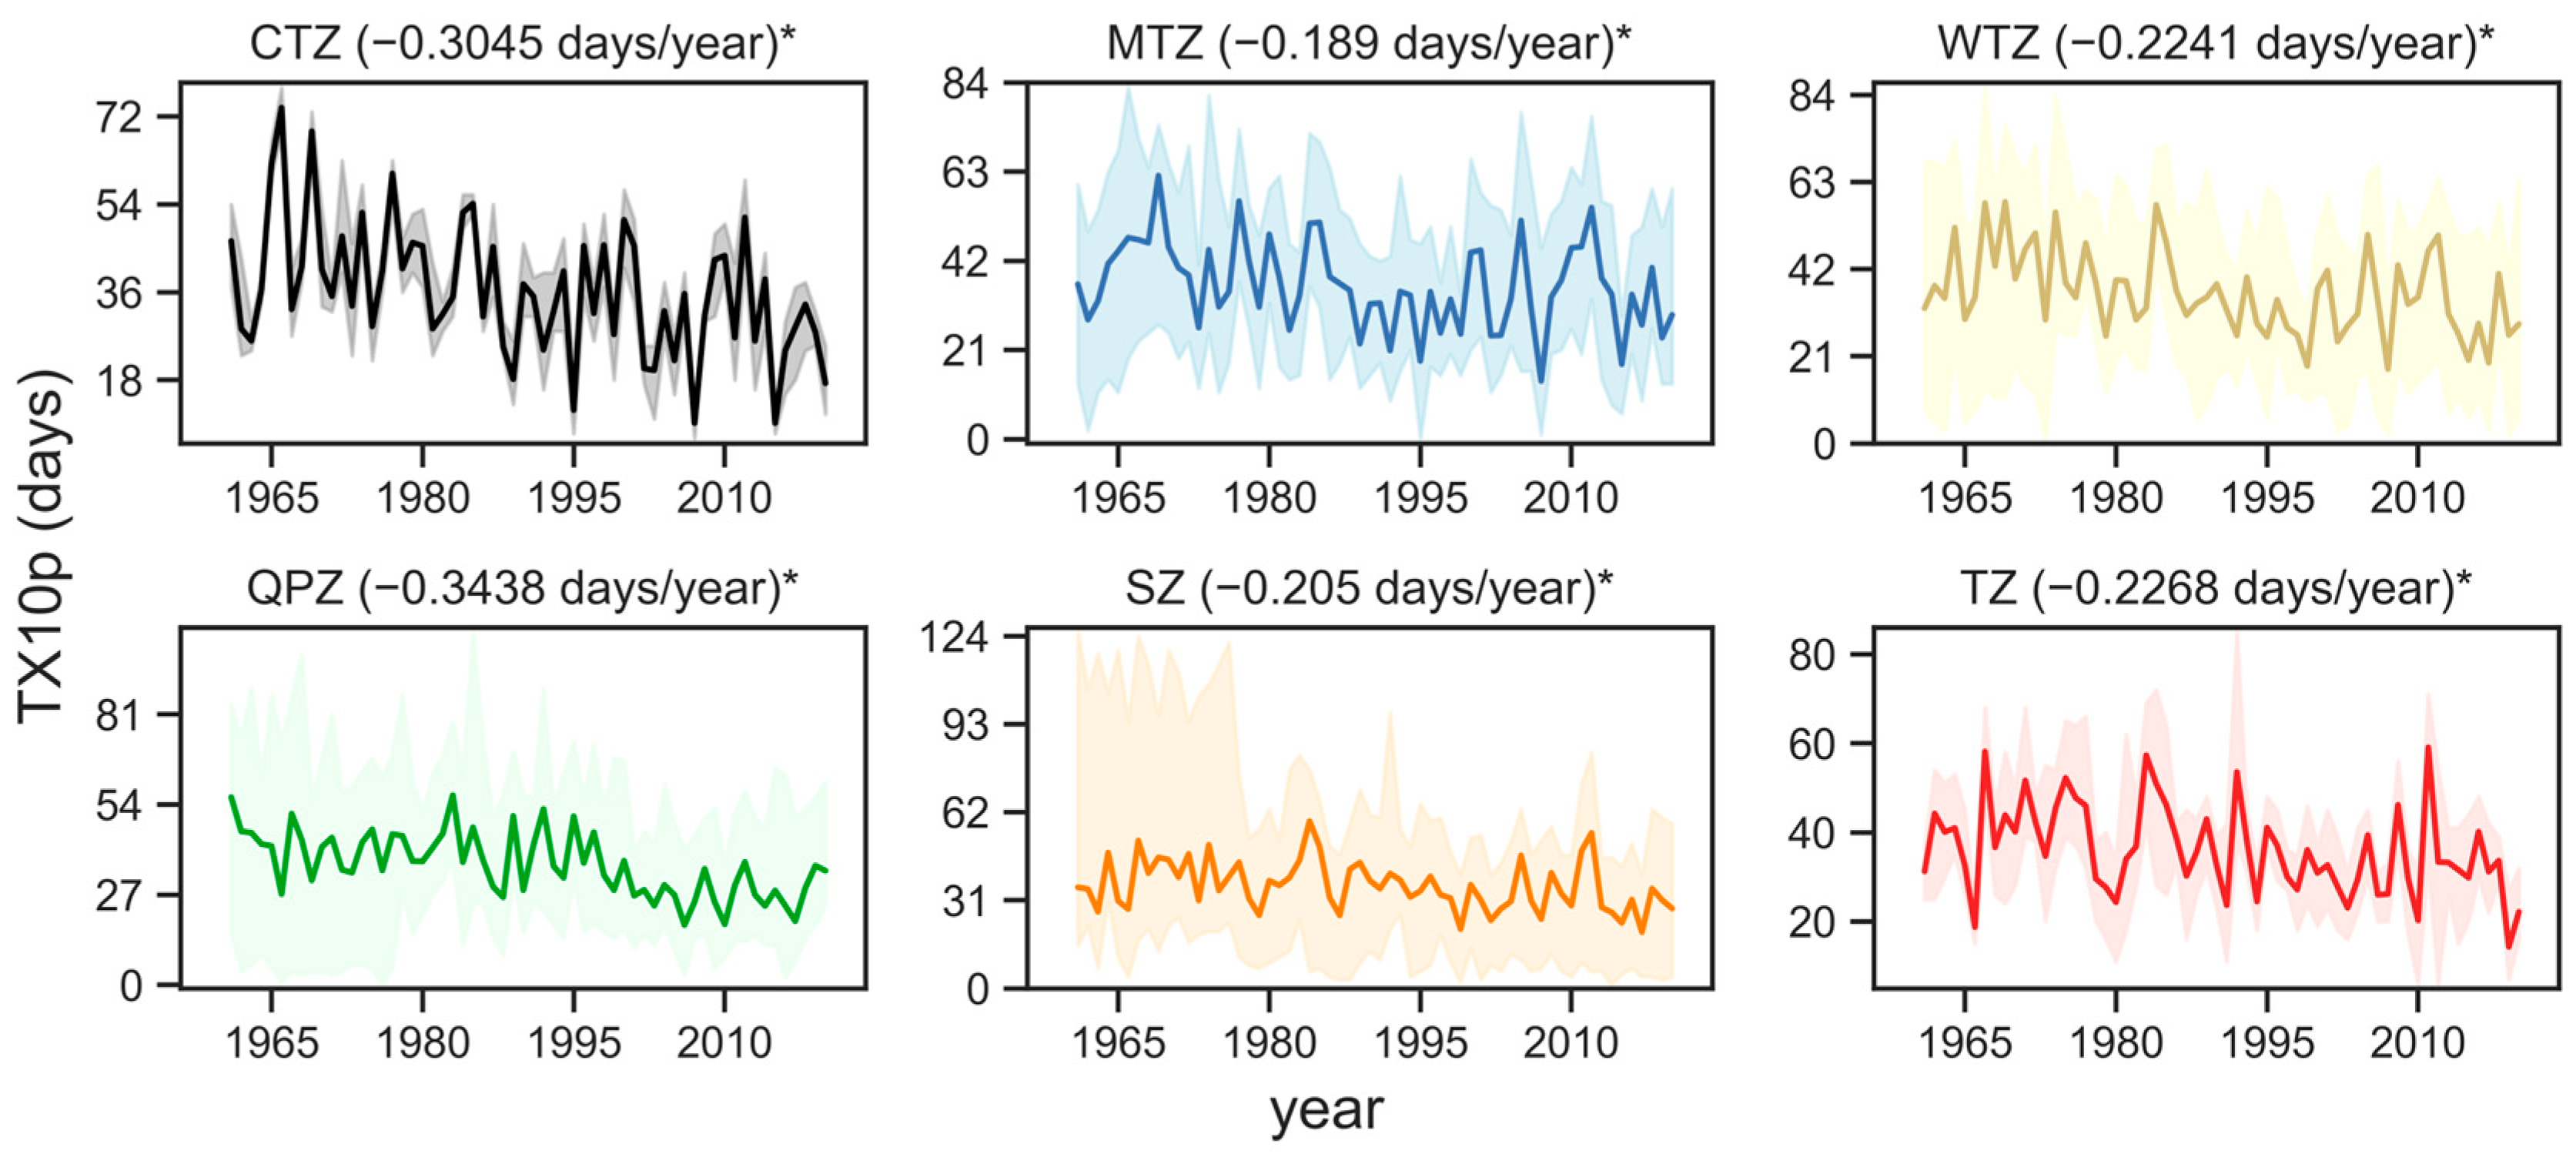
Cold Days (TX10p)
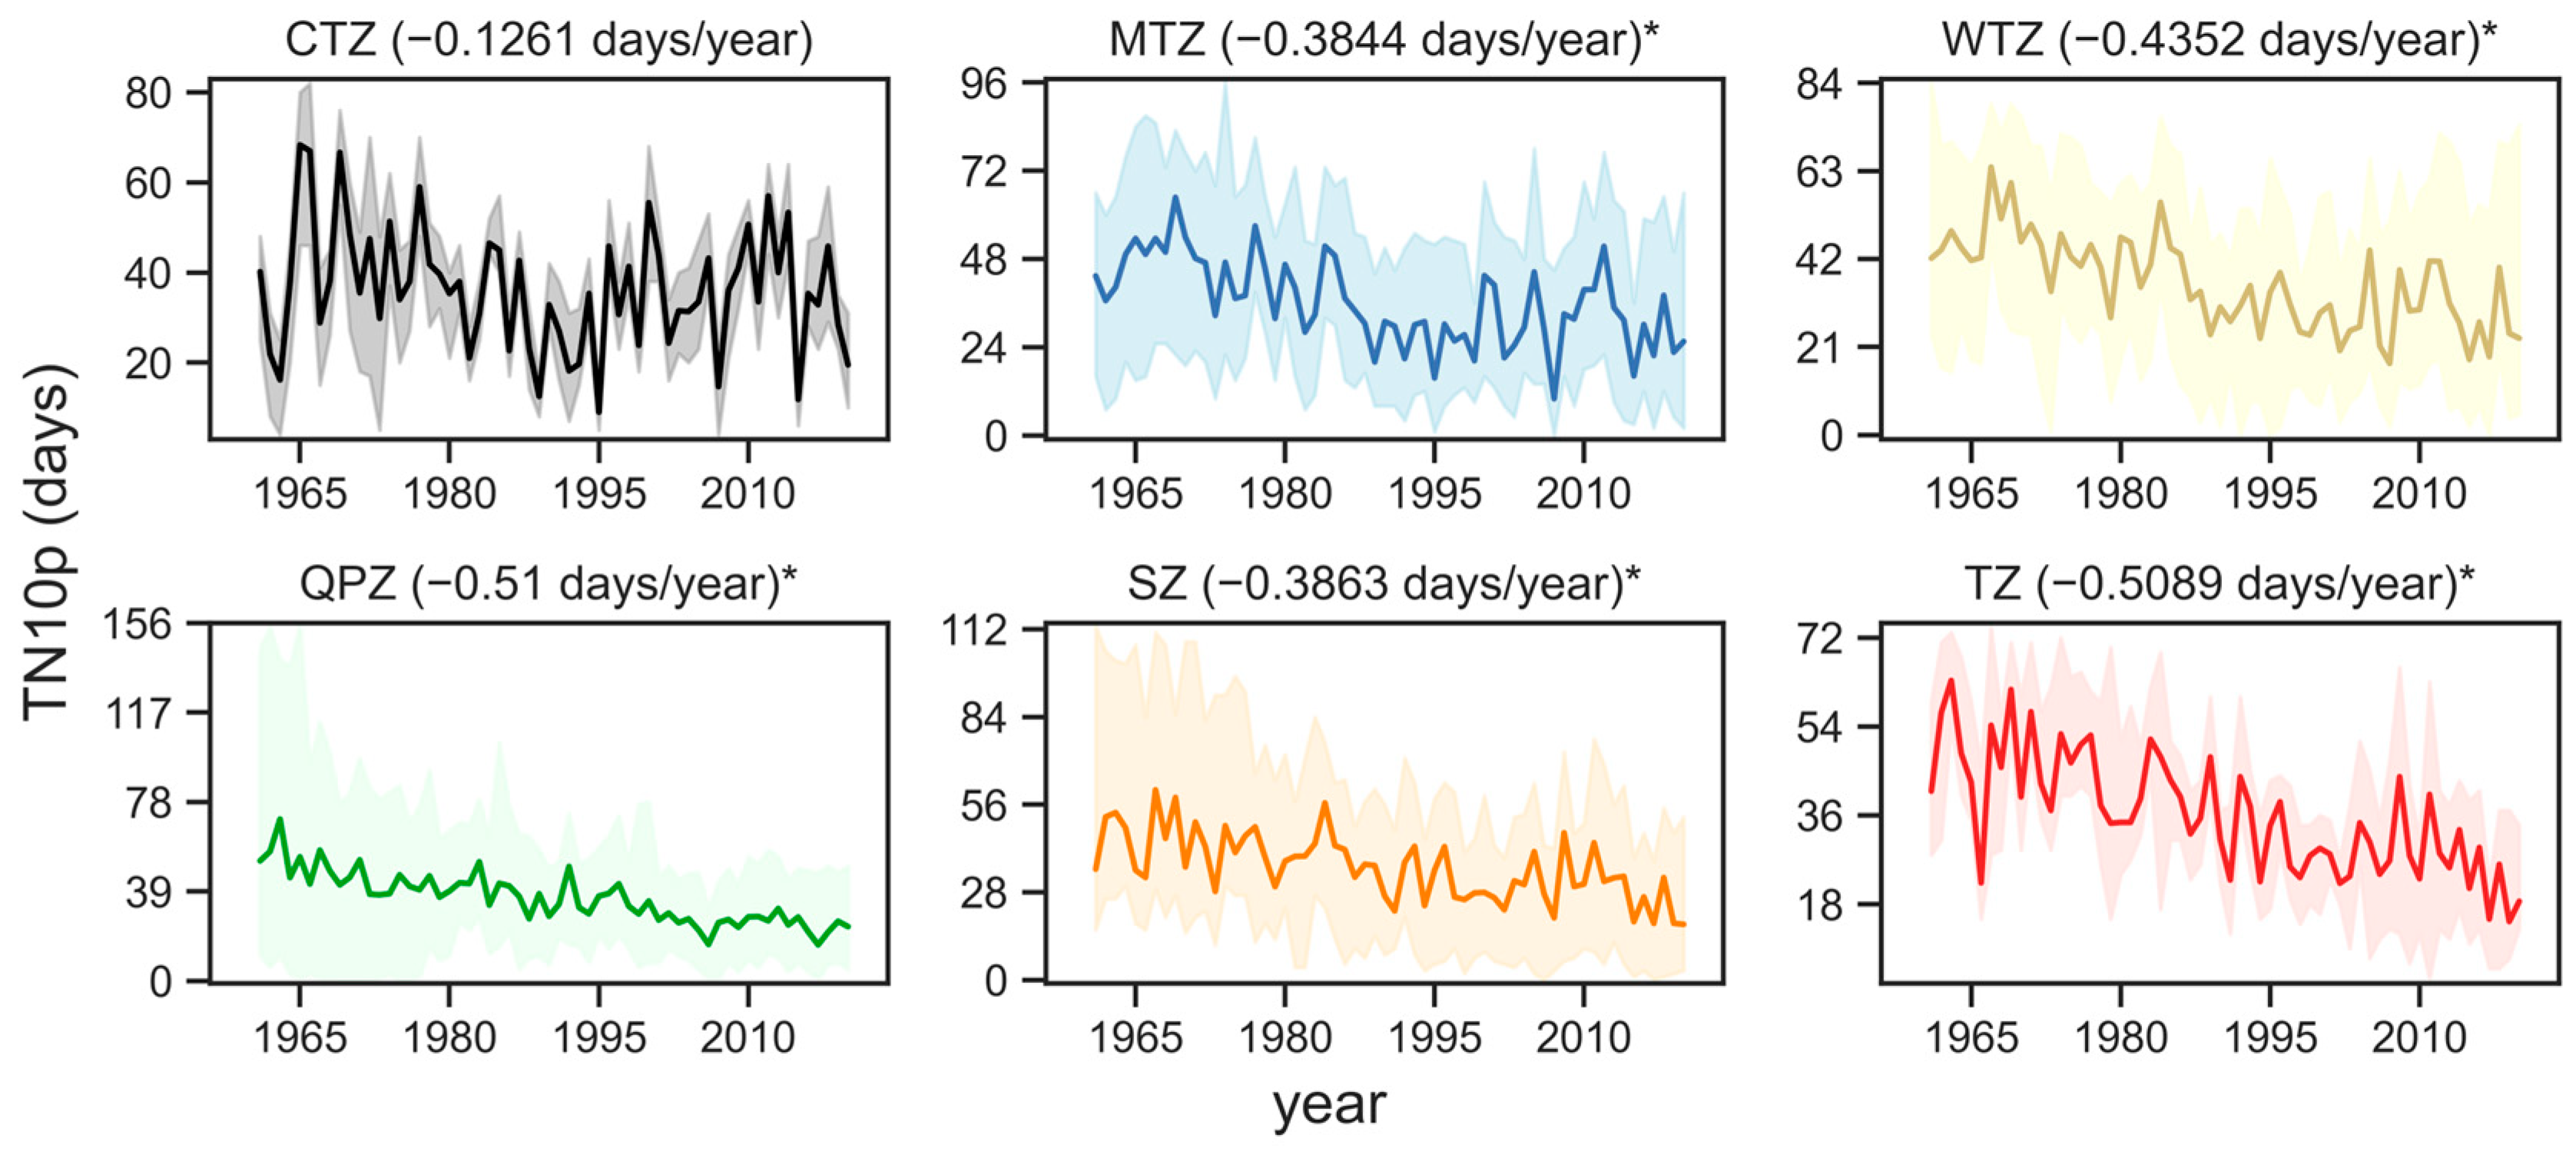
Cold Nights (TN10p)
3.3.3. Duration of Extreme Temperature Events
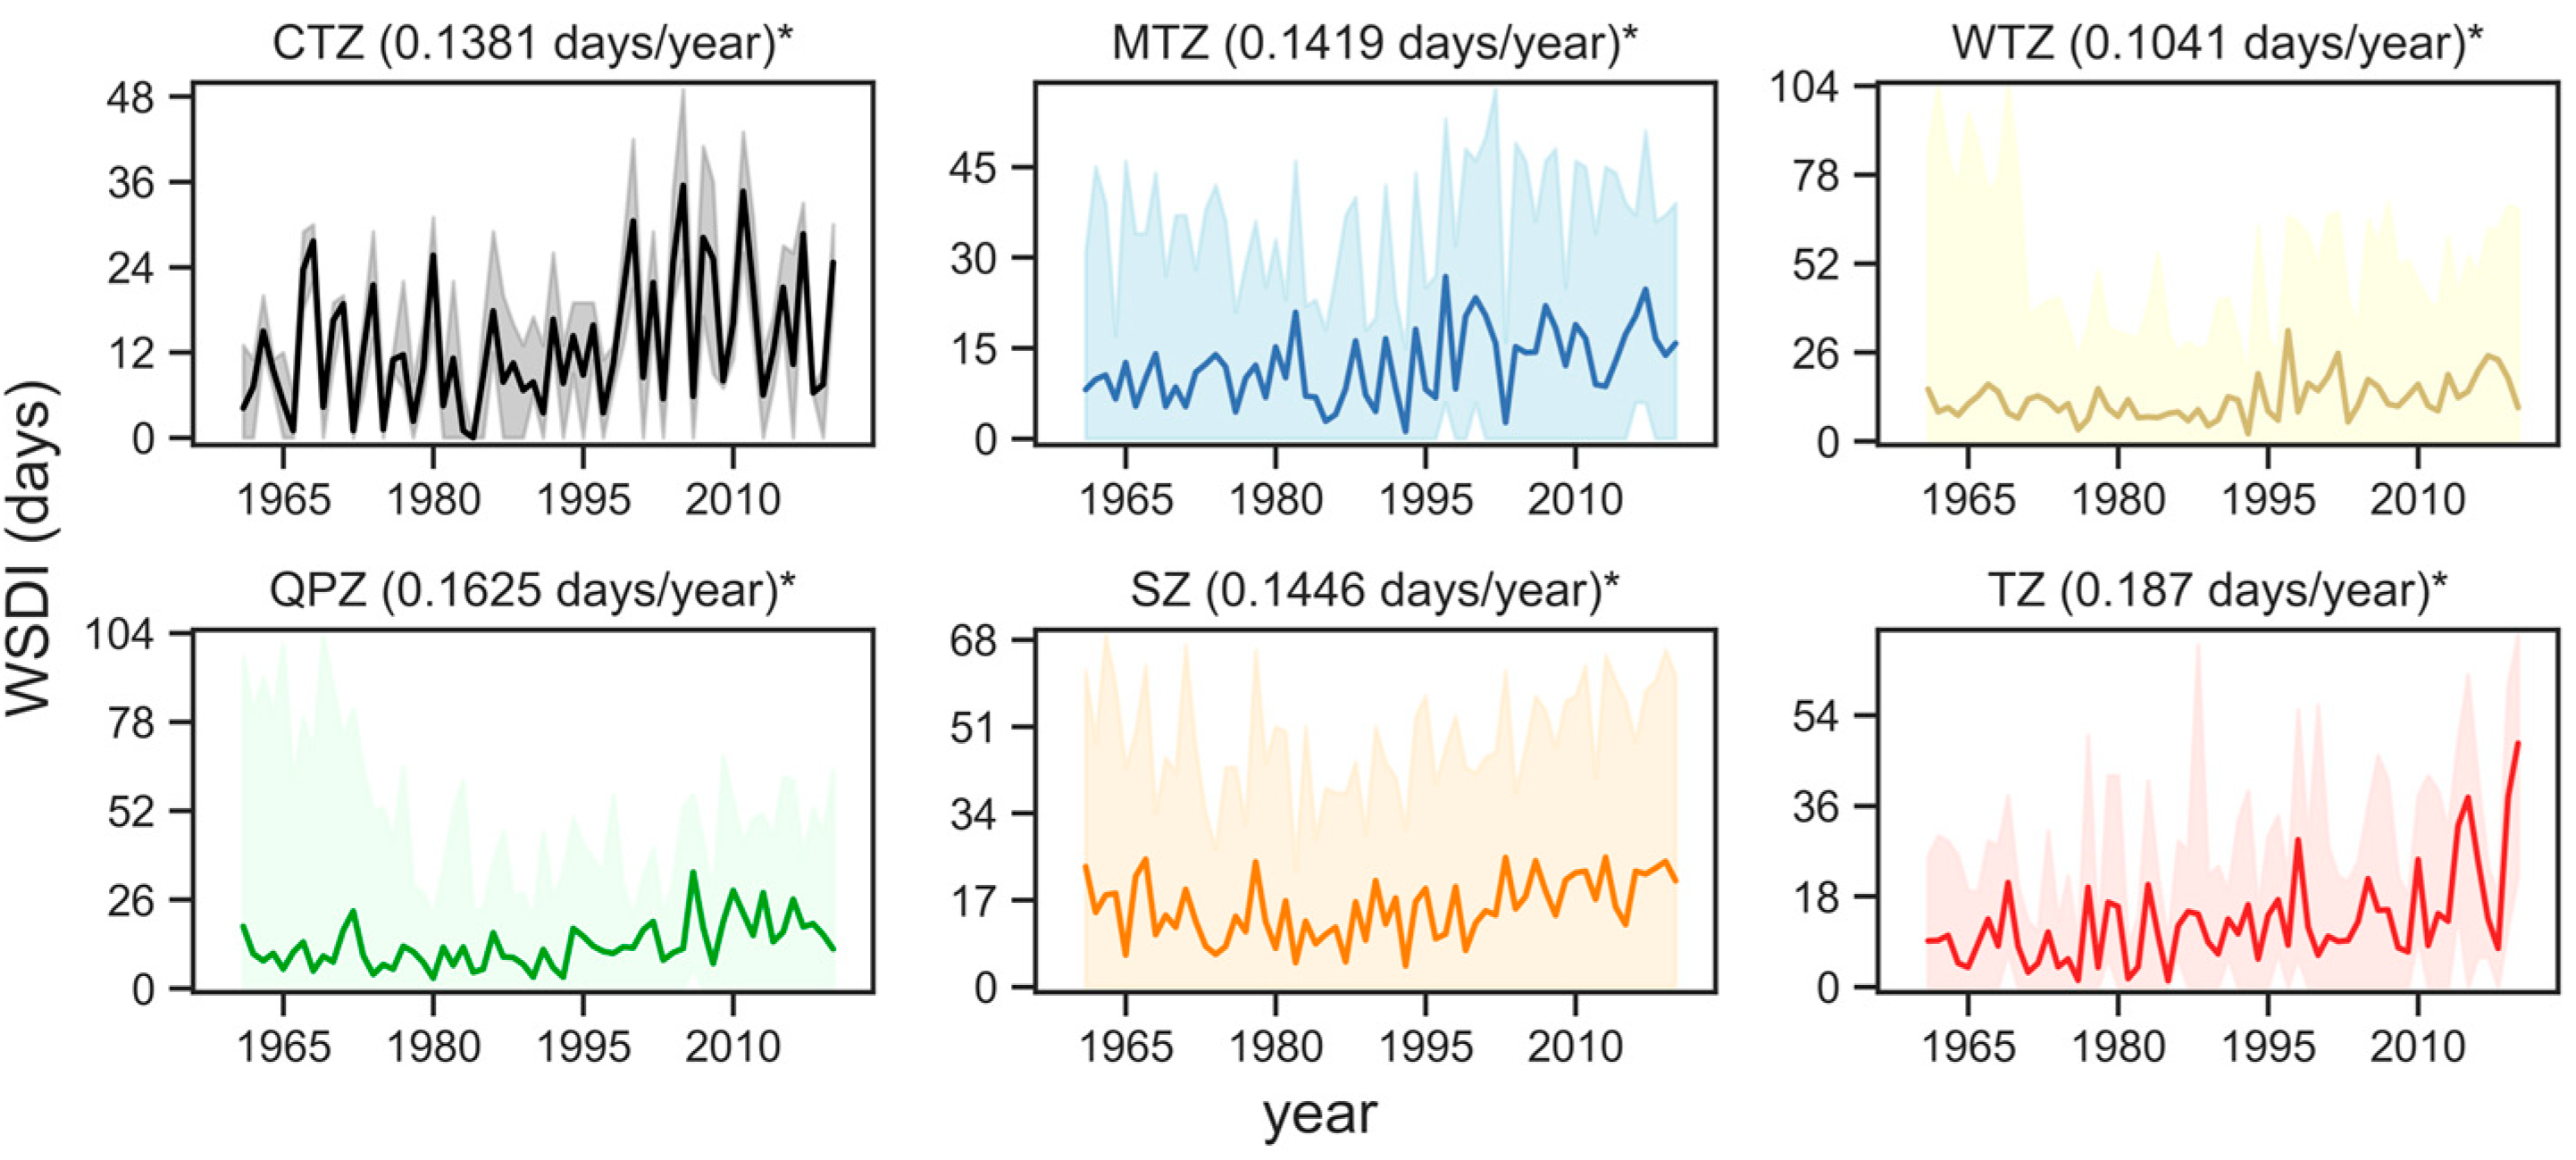
Warm Spell Duration Index (WSDI)
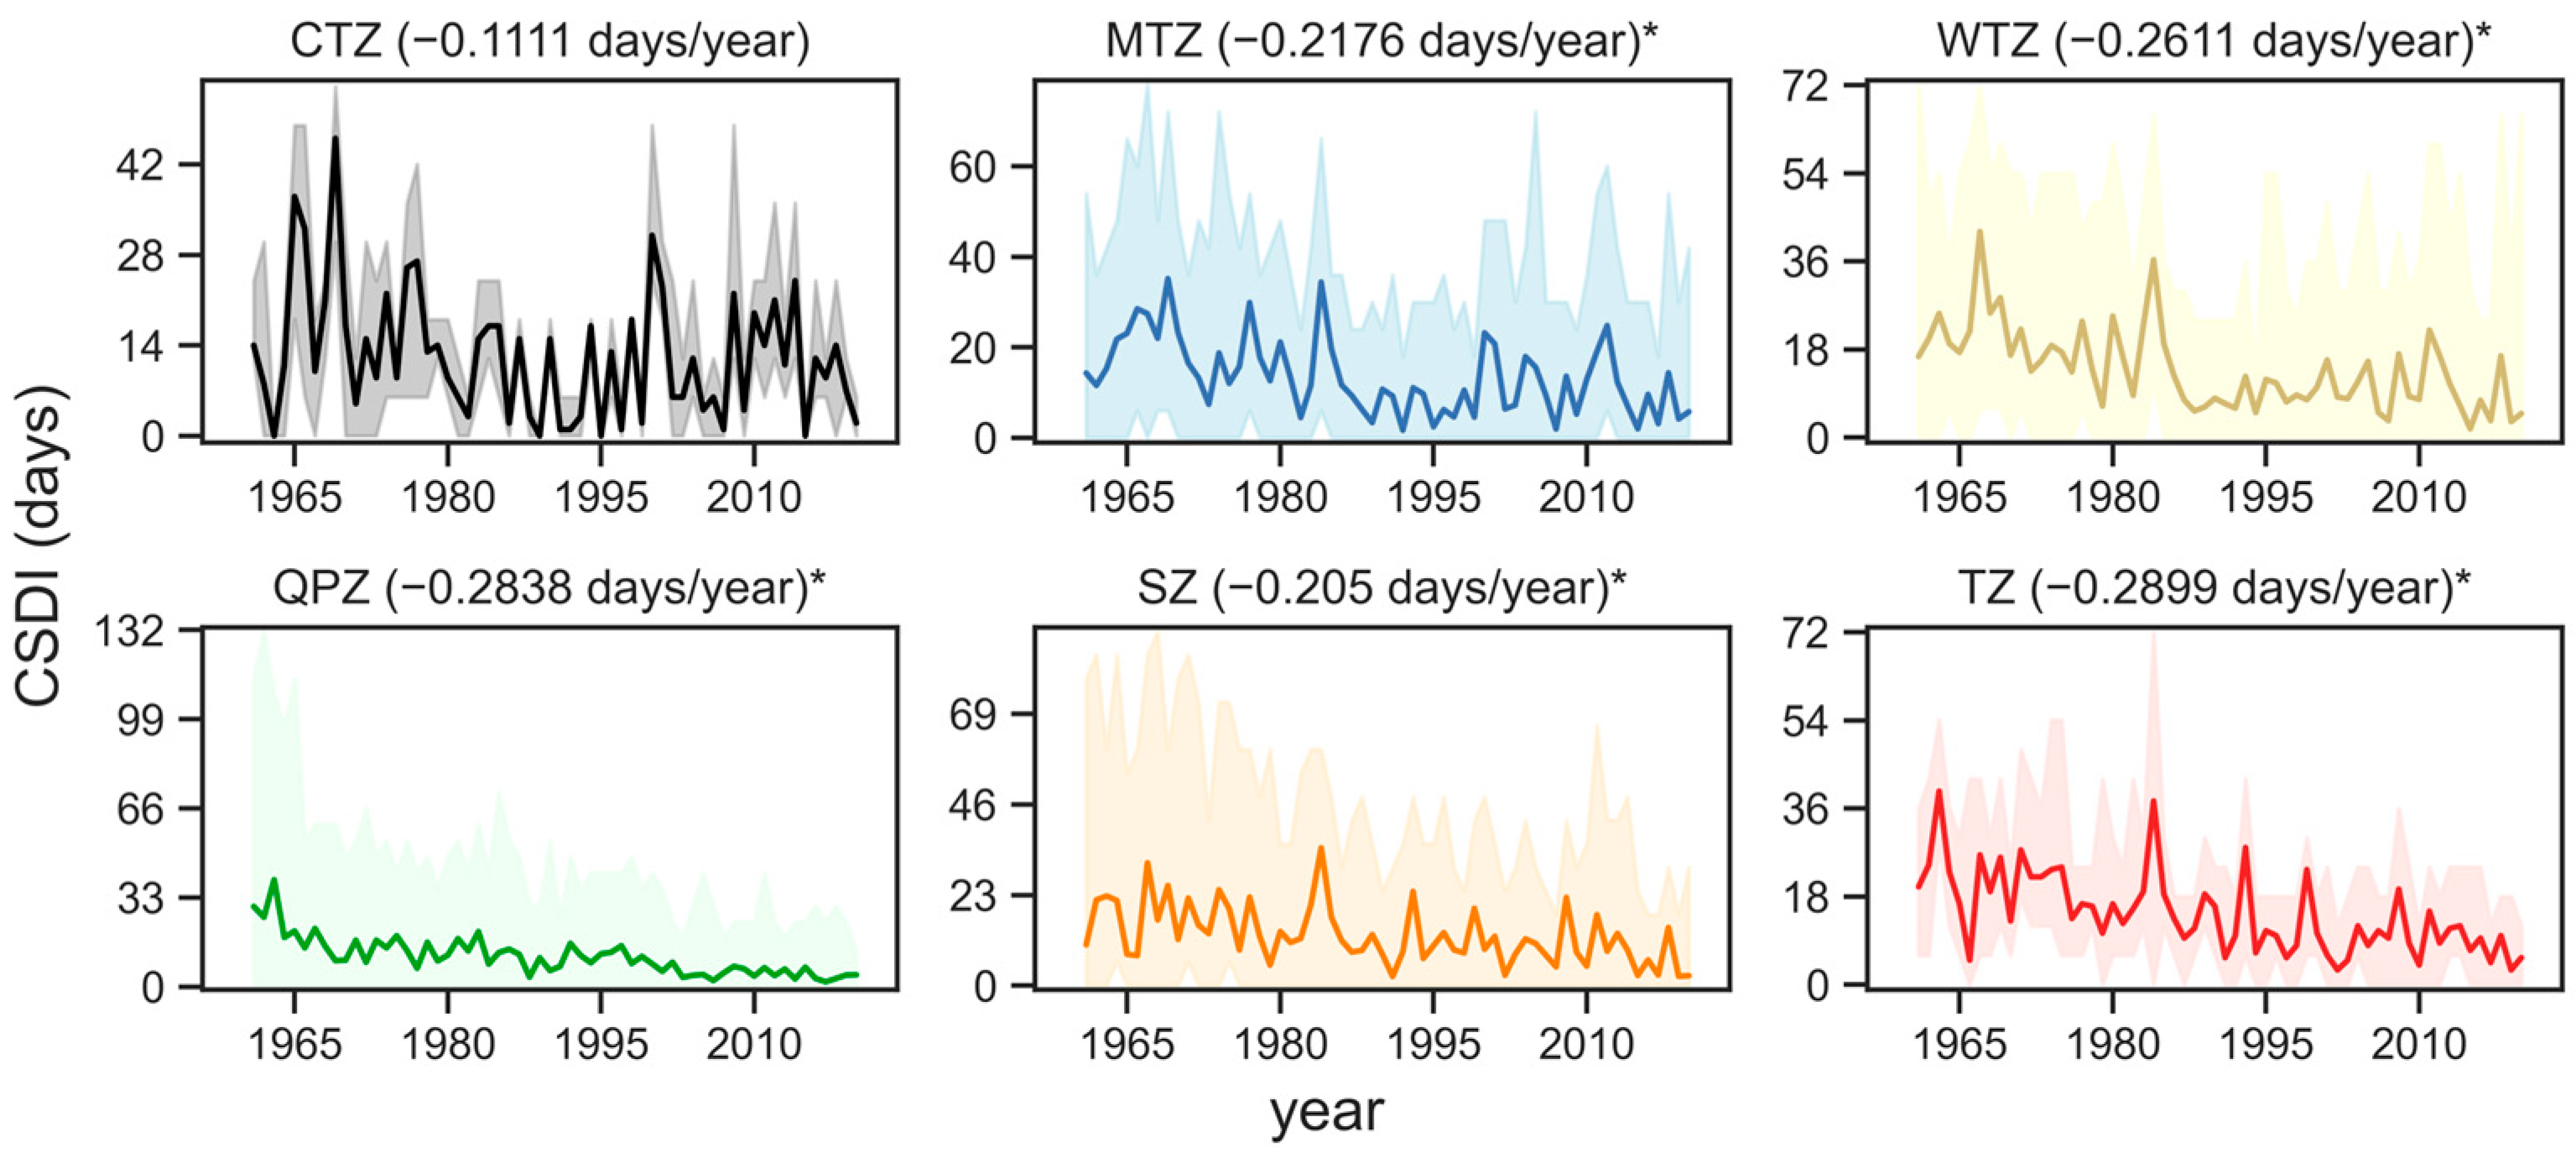
Cold Spell Duration Index (CSDI)
4. Discussion and Conclusions
Author Contributions
Funding
Institutional Review Board Statement
Informed Consent Statement
Data Availability Statement
Acknowledgments
Conflicts of Interest
Appendix A
References
- Karl, T.R.; Jones, P.D.; Knight, R.W. A New Perspective on Recent Global Warming: Asymmetric Trends of Daily Maximum and Minimum Temperature. Bull. Am. Meteor. Soc. 1993, 74, 1007–1024. [Google Scholar] [CrossRef]
- Easterling, D.R.; Horton, B. Maximum and Minimum Temperature Trends for the Globe. Science 1997, 277, 364–367. [Google Scholar] [CrossRef] [Green Version]
- Kosaka, Y.; Xie, S.P. Recent global-warming hiatus tied to equatorial Pacific surface cooling. Nature 2003, 501, 403. [Google Scholar] [CrossRef] [PubMed] [Green Version]
- IPCC. Climate Change 2021—The Physical Science Basic. Chem. Int. 2021, 43, 22–23. [Google Scholar] [CrossRef]
- Diffenbaugh, N.S.; Scherer, M. Observational and model evidence of global emergence of permanent, unprecedented heat in the 20th and 21st centuries. Clim. Chang. 2011, 107, 615–624. [Google Scholar] [CrossRef] [PubMed] [Green Version]
- Lau, N.C.; Nath, M.J. A model study of heat waves over North America: Meteorological aspects and projections for the twenty-first century. J. Clim. 2012, 25, 4761–4784. [Google Scholar] [CrossRef]
- Lewis, S.C.; Karoly, D.J. Anthropogenic contributions to Australia’s record summer temperatures of 2013. Geophys. Res. Lett. 2013, 40, 3705–3709. [Google Scholar] [CrossRef] [Green Version]
- Kalnay, E.; Cai, M. Impact of urbanization and land-use change on climate. Nature 2003, 423, 528. [Google Scholar] [CrossRef]
- Hu, Y.; Dong, W.; He, Y. Impact of land surface forcings on mean and extreme temperature in eastern China. J. Geophys. Res. 2010, 115, D19117. [Google Scholar] [CrossRef] [Green Version]
- Liu, X.; Tang, Q.; Zhang, X.; Sun, S. Projected Changes in Extreme High Temperature and Heat Stress in China. J. Meteor. Res. 2018, 32, 351–366. [Google Scholar] [CrossRef]
- Habeeb, D.; Vargo, J.; Stone, B. Rising heat wave trends in large US cities. Nat. Hazards 2015, 76, 1651–1665. [Google Scholar] [CrossRef]
- Perkins, S.E.; Alexander, L.V.; Nairn, J.R. Increasing frequency, intensity and duration of observed global heatwaves and warm spells. Geophys. Res. Lett. 2012, 39, 20714. [Google Scholar] [CrossRef]
- Zhai, P.; Pan, X. Trends in temperature extremes during 1951–1999 in China. Geophys. Res. Lett. 2003, 30, 1913. [Google Scholar] [CrossRef]
- Zhou, Y.; Ren, G. Change in extreme temperature event frequency over mainland China, 1961−2008. Clim. Res. 2011, 50, 125–139. [Google Scholar] [CrossRef] [Green Version]
- Kong, F. The change of extreme cold and warm events in China from 1961 to 2018 and their spatial differences. Water Resour. Hydropower Eng. 2020, 5, 34–44. [Google Scholar] [CrossRef]
- Zhan, M.J.; Li, X.C.; Sun, H.M.; Zhai, J.; Jiang, T.; Wang, Y.J. Changes in Extreme Maximum Temperature Events and Population Exposure in China under Global Warming Scenarios of 1.5 and 2.0°C: Analysis Using the Regional Climate Model COSMO-CLM. J. Meteor. Res. 2018, 32, 99–112. [Google Scholar] [CrossRef]
- Karl, T.R.; Easterling, D.R. Climate extremes: Selected review and future research directions. Clim. Chang. 1999, 42, 309–325. [Google Scholar] [CrossRef]
- Upperman, C.; Parker, J.; Jiang, C.; He, X.; Murtugudde, R.; Sapkota, A. Frequency of extreme heat event as a surrogate exposure metric for examining the human health effects of climate change. PLoS ONE 2015, 10, e0144202. [Google Scholar] [CrossRef]
- Li, Z.; Yan, Z.W. Homogenized Daily Mean/Maximum/Minimum Temperature Series for China from 1960–2008. Atmos. Ocean. Sci. Lett. 2009, 2, 237–243. [Google Scholar] [CrossRef]
- Wang, A.H.; Fu, J.J. Changes in Daily Climate Extremes of Observed Temperature and Precipitation in China. Atmos. Ocean. Sci. Lett. 2013, 05, 89–96. [Google Scholar] [CrossRef]
- Li, Y.; Ding, Y.H.; Li, W.J. Observed trends in various aspects of compound heat waves across China from 1961 to 2015. J. Meteor. Res. 2017, 31, 455–467. [Google Scholar] [CrossRef]
- Hu, J.F.; Zhan, M.J.; Zhan, L.F.; Xin, J.J. Spatiotemporal Variation and Circulation Characteristics of Extreme Maximum Temperature Events in East China (1961–2020). Atmosphere 2022, 13, 609. [Google Scholar] [CrossRef]
- Yuan, Y.F.; Liao, Z.; Zhou, B.Q. Unprecedented hot extremes observed in city clusters in China during summer 2022. J. Meteor. Res. 2023, 37, 141–148. [Google Scholar] [CrossRef]
- Jiang, D.; Zhi, L.I. Temporal and Spatial Characteristics of Extreme Temperature Events over Shandong Province during 1961–2008. Sci. Geo. Sin. 2011, 31, 1118–1124. [Google Scholar] [CrossRef]
- Ding, Z.Y.; Wang, Y.Y.; Lu, R.J. An analysis of changes in temperature extremes in the three river headwaters region of the tibetan plateau during 1961–2016. Atmos. Res. 2018, 209, 103–114. [Google Scholar] [CrossRef]
- Chen, M.R. A preliminary study on climate regionalization in China. Sci. Geogr. Sin. 1990, 10, 308–315. [Google Scholar]
- Zheng, J.Y.; Yin, Y.H.; Li, B.Y. A New Scheme for Climate Regionalization in China. Acta Geogr. Sin. 2010, 65, 3–12. [Google Scholar]
- Zheng, J.Y.; Bian, J.J.; Ge, Q.S.; Hao, Z.X.; Yin, H.Y.; Liao, Y.M. The climate regionalization in China for 1981–2010. Chin. Sci. Bull. 2013, 58, 3088–3099. [Google Scholar] [CrossRef] [Green Version]
- Bian, J.J.; Hao, Z.X.; Zheng, J.Y.; Ge, Q.S.; Yin, Y.H. The shift on boundary of climate regionalization in China from 1951 to 2010. Geogr. Res. 2013, 32, 1179–1187. [Google Scholar]
- Chen, X.J. A new approach to the climate division of China. Acta Meteorol. Sin. 1982, 40, 35–47. [Google Scholar]
- Peterson, T.C. Report on the Activities of the Working Group on Climate Change Detection and Related Rapporteurs; WMO: Geneve, Switzerland, 2001; 143p. [Google Scholar]
- Peterson, T.C.; Manton, M.J. Monitoring changes in climate extremes: A tale of international collaboration. Bull. Am. Meteorol. Soc. 2008, 89, 1266–1271. [Google Scholar] [CrossRef]
- Theil, H. A rank invariant method of linear and polynomial regression analysis I, II, III. Proc. Kon. Ned. Akad. Wetensch. Ser. A 1950, 53, 386–392. [Google Scholar]
- Serfling, R.J. Generalized L-, M-, and R-Statistics. Ann. Stat. 1984, 12, 76–86. [Google Scholar] [CrossRef]
- Zhao, M.F.; Zhao, T.; Yan, L.D. Temporal and spatial characteristics of extreme temperature events over the Three-river Source Region in different climate states during 1961–2020. Acta Ecol. Sin. 2022, 42, 5616–5629. [Google Scholar] [CrossRef]


| Temperature Zone Name | Main Index: Number of Days When the Daily Average Temperature Is Stable ≥10 °C | Reference Index: Accumulated Temperature When the Daily Average Temperature Is Stable ≥10 °C |
|---|---|---|
| cold temperate zone (CTZ) | <100 | <1600 |
| middle temperate zone (MTZ) | 100~170 | 1600~3200/3400 |
| warm temperate zone (WTZ) | 170~220 | 3200/3400~4500/4800 |
| Qinghai–Tibet Plateau zone (QPZ) | \ | \ |
| subtropical zone (SZ) | 220~360 | 4500/4800~8000 |
| tropical zone (TZ) | >360 | >8000 |
| Index | Name | Definition | Units |
|---|---|---|---|
| TXx | Extreme maximum temperature | Annual 95th percentile of maximum temperature (TX) | °C |
| TNn | Extreme maximum temperature | Annual 5th percentile of minimum temperature (TN) | °C |
| TX10p | Cold days | Days when TX < 10th percentile | Day |
| TN10p | Cold nights | Days when TN < 10th percentile | Day |
| TX90p | Warm days | Days when TX > 90th percentile | Day |
| TN90p | Warm nights | Days when TN > 90th percentile | Day |
| CSDI | Cold spell duration index | Annual count of days with at least 6 consecutivedays when TN < 10th percentile | Day |
| WSDI | Warm spell duration index | Annual count of days with at least 6 consecutivedays when TX > 90th percentile | Day |
| Temperature Zone Name | Area Code | Number of Stations |
|---|---|---|
| cold temperate zone (CTZ) | 1 | 6 |
| middle temperate zone (MTZ) | 2 | 135 |
| warm temperate zone (WTZ) | 3 | 175 |
| Qinghai–Tibet Plateau zone (QPZ) | 4 | 62 |
| subtropical zone (SZ) | 5 | 309 |
| tropical zone (TZ) | 6 | 12 |
Disclaimer/Publisher’s Note: The statements, opinions and data contained in all publications are solely those of the individual author(s) and contributor(s) and not of MDPI and/or the editor(s). MDPI and/or the editor(s) disclaim responsibility for any injury to people or property resulting from any ideas, methods, instructions or products referred to in the content. |
© 2023 by the authors. Licensee MDPI, Basel, Switzerland. This article is an open access article distributed under the terms and conditions of the Creative Commons Attribution (CC BY) license (https://creativecommons.org/licenses/by/4.0/).
Share and Cite
Xin, J.; Zhan, M.; Xu, B.; Li, H.; Zhan, L. Variations of Extreme Temperature Event Indices in Six Temperature Zones in China from 1961 to 2020. Sustainability 2023, 15, 11536. https://doi.org/10.3390/su151511536
Xin J, Zhan M, Xu B, Li H, Zhan L. Variations of Extreme Temperature Event Indices in Six Temperature Zones in China from 1961 to 2020. Sustainability. 2023; 15(15):11536. https://doi.org/10.3390/su151511536
Chicago/Turabian StyleXin, Jiajie, Mingjin Zhan, Bin Xu, Haijun Li, and Longfei Zhan. 2023. "Variations of Extreme Temperature Event Indices in Six Temperature Zones in China from 1961 to 2020" Sustainability 15, no. 15: 11536. https://doi.org/10.3390/su151511536
APA StyleXin, J., Zhan, M., Xu, B., Li, H., & Zhan, L. (2023). Variations of Extreme Temperature Event Indices in Six Temperature Zones in China from 1961 to 2020. Sustainability, 15(15), 11536. https://doi.org/10.3390/su151511536