Deforestation and Its Effect on Surface Albedo and Weather Patterns
Abstract
1. Introduction
2. Materials and Methods
2.1. Study Area
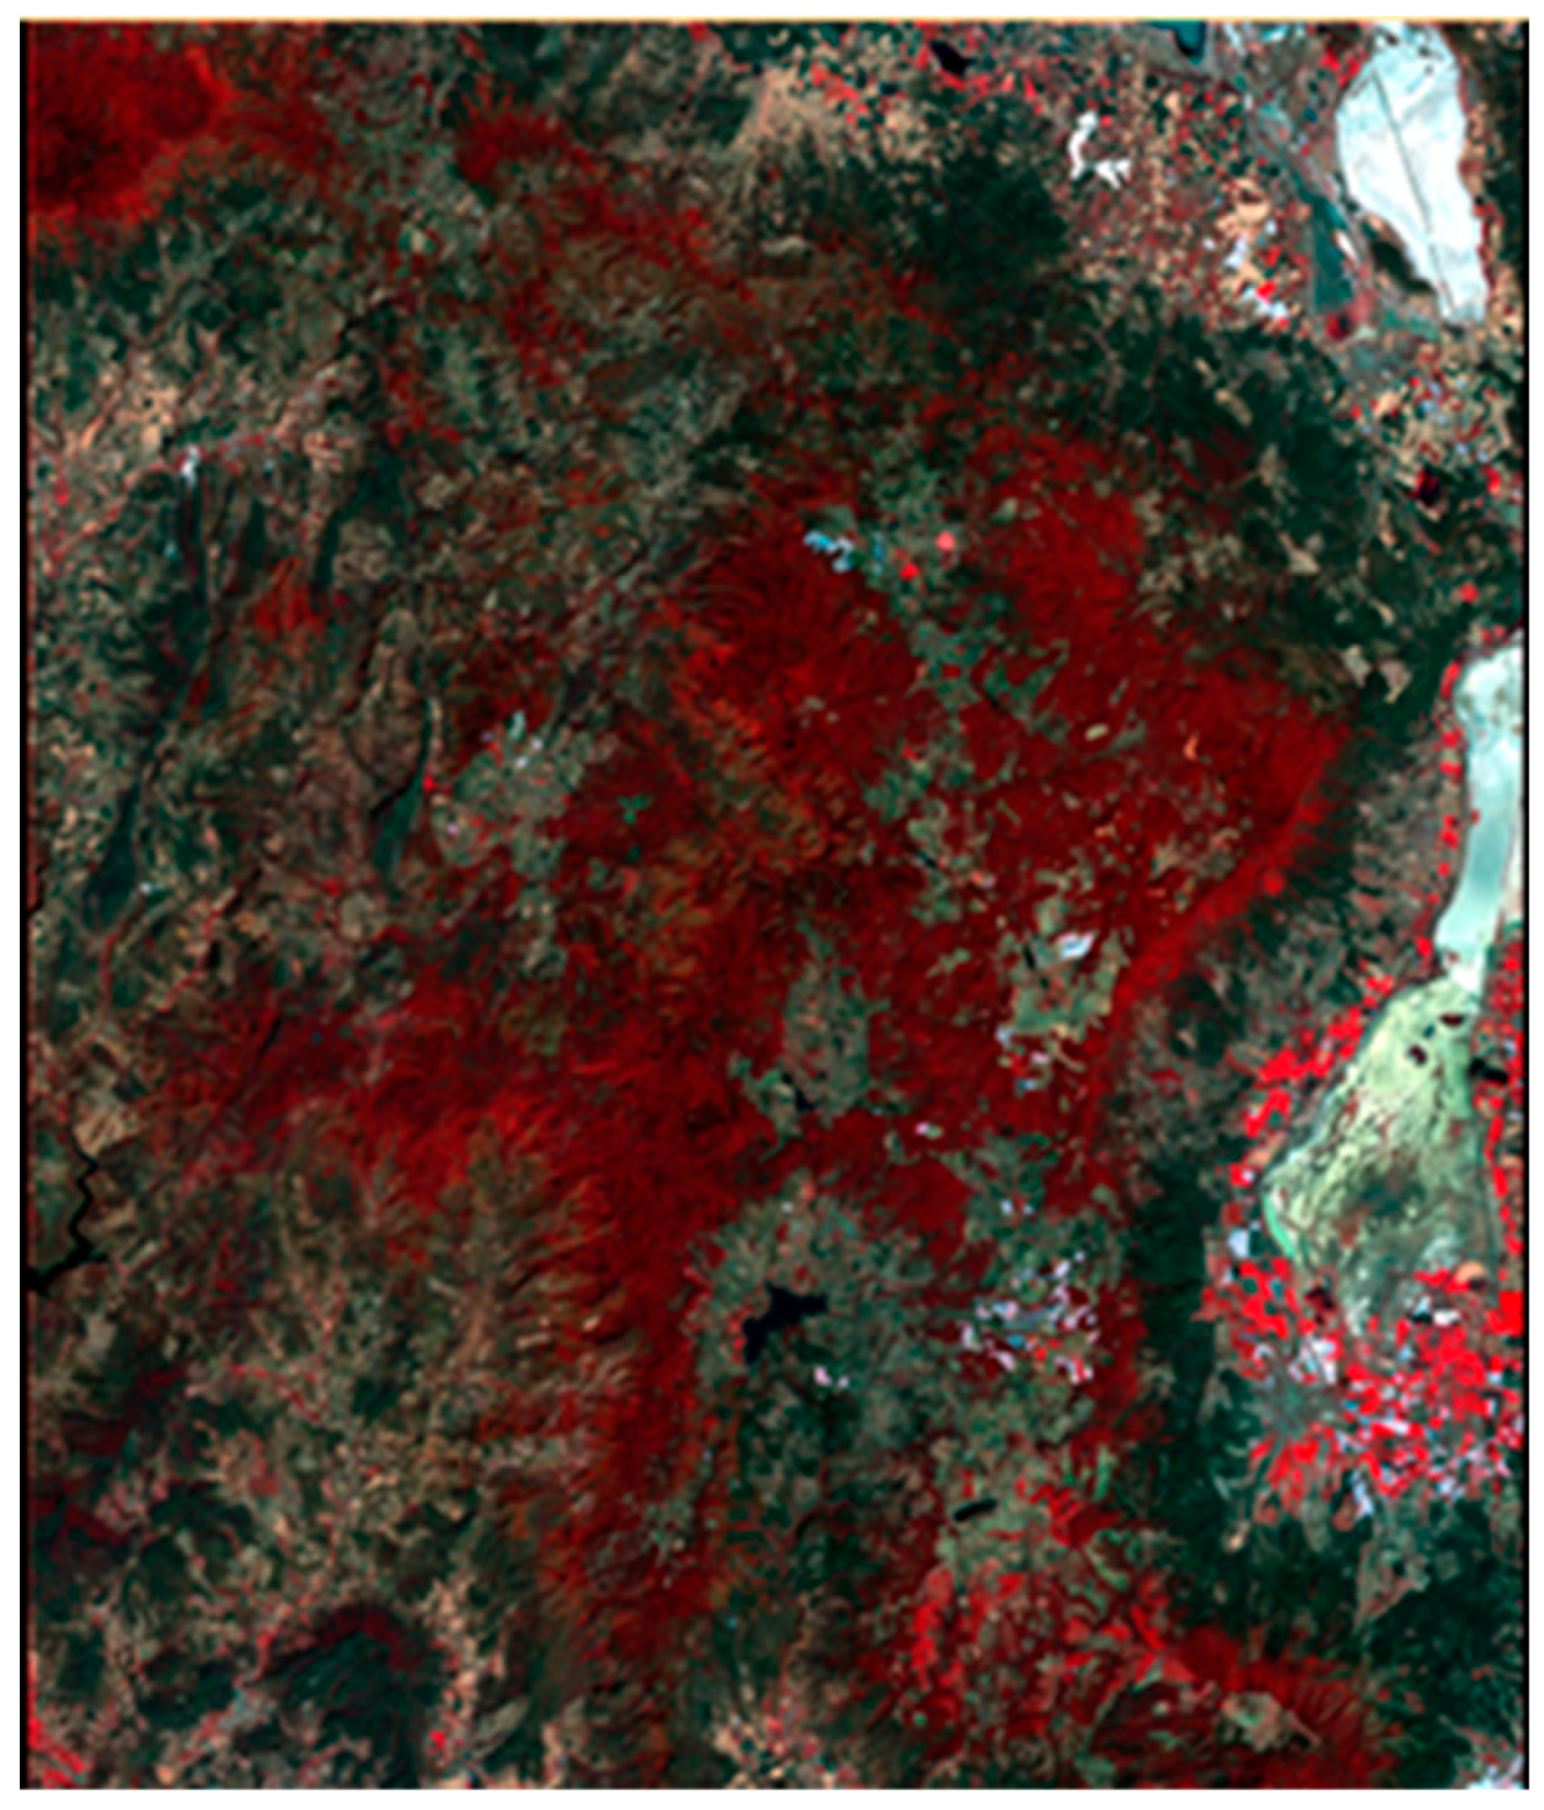
2.2. Supplies
2.3. Preliminary Images Process
2.3.1. Topographic Correction
- Lh = reflectance of a horizontal surface;
- LT = reflectance from an inclined surface;
- COS Z = cosine of the solar zenith angle;
- COS i = cosine of incident local angle;
- m = linear regression gradient: LT-COS i;
- b = linear regression interception: LT-COS i.
2.3.2. Atmospheric Correction with Solar Angle
- = Spectral radiance TOA;
- = Band—specific multiplicative rescaling factor;
- = Band—specific additive rescaling factor;
- = Quantified and calibrated standard product pixel values (DN);
- are the specific calibration data for each band available in the image metadata;
- = Reflectance TOA;
- = Local solar zanital angle; ;
- = Sun elevation angle; information contained in the image metadata. *
- * refers to the sun elevation angle from the center of the scene in degrees.
2.4. Albedo Calculation
- αBLUE, αGREEN, αRED, αNIR, and y αSWIR2 are the reflectance data corresponding to bands 2, 3, 4, 5, and 7, respectively.
2.5. Relationship between Albedo Changes and Variation of Climatic Variables
2.6. Statistical Analysis
3. Results
3.1. Representativeness of Land Covers in the Study Area
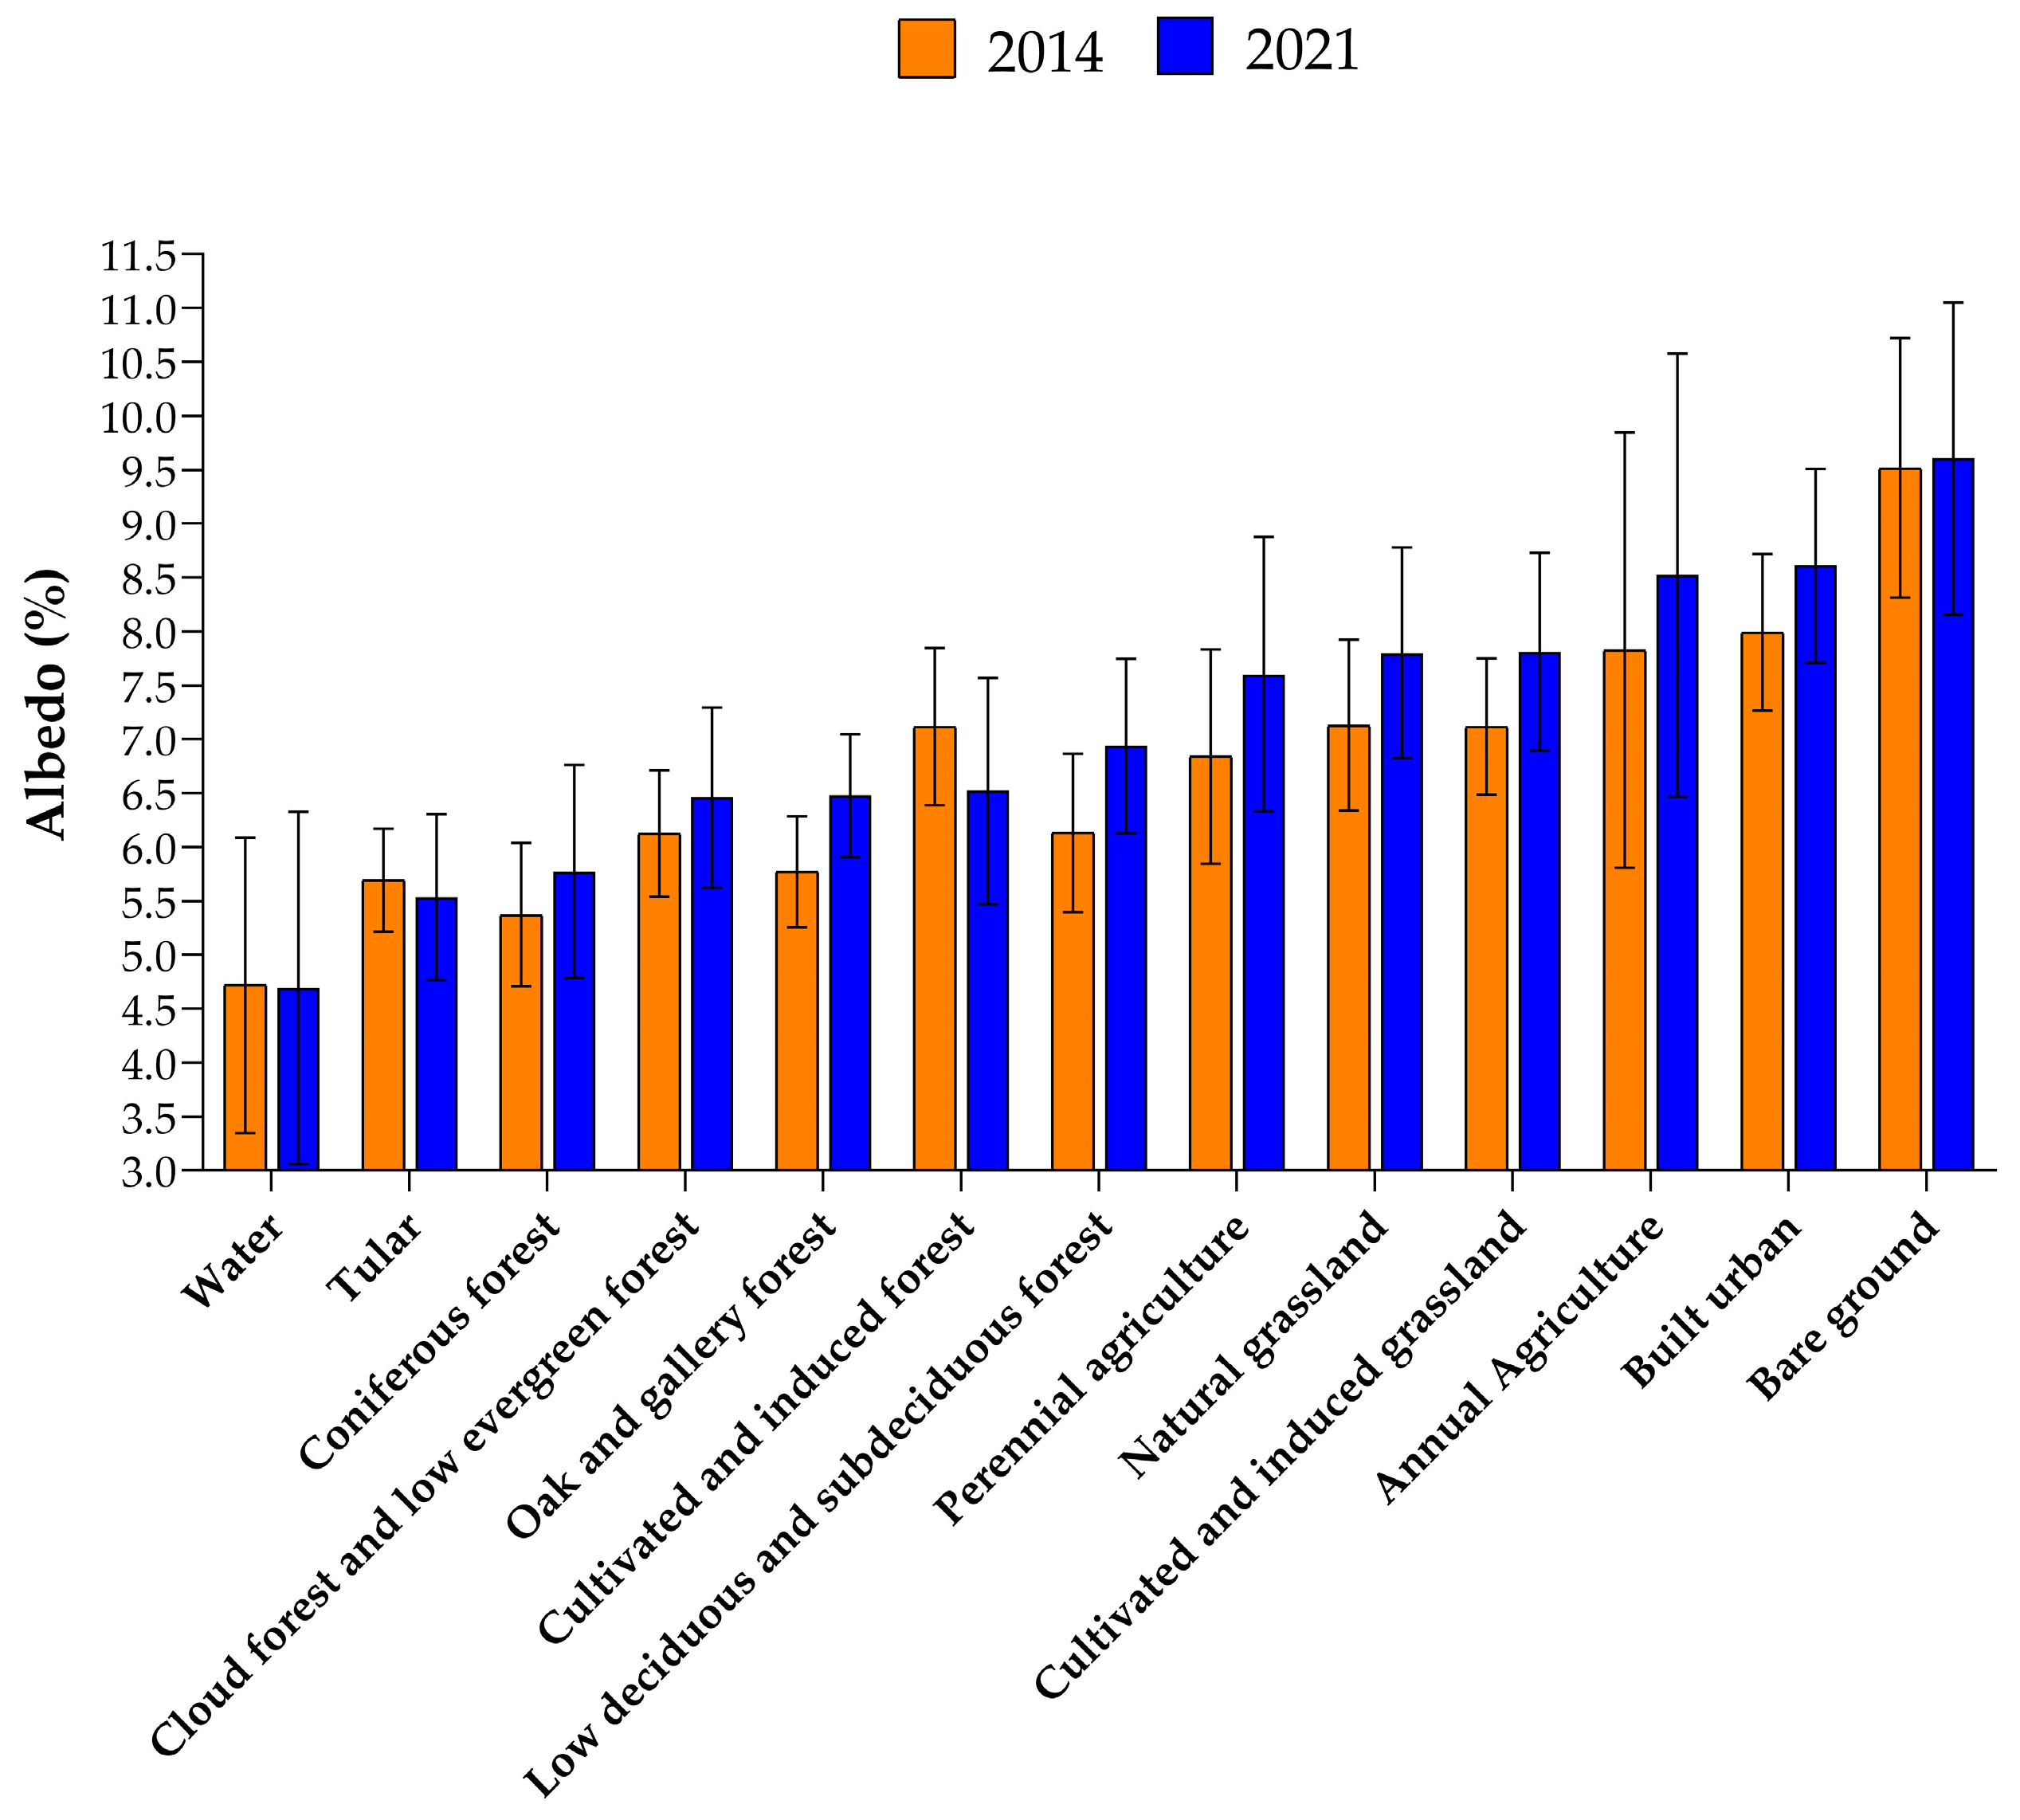
3.2. Albedo Values for Types of Land Cover
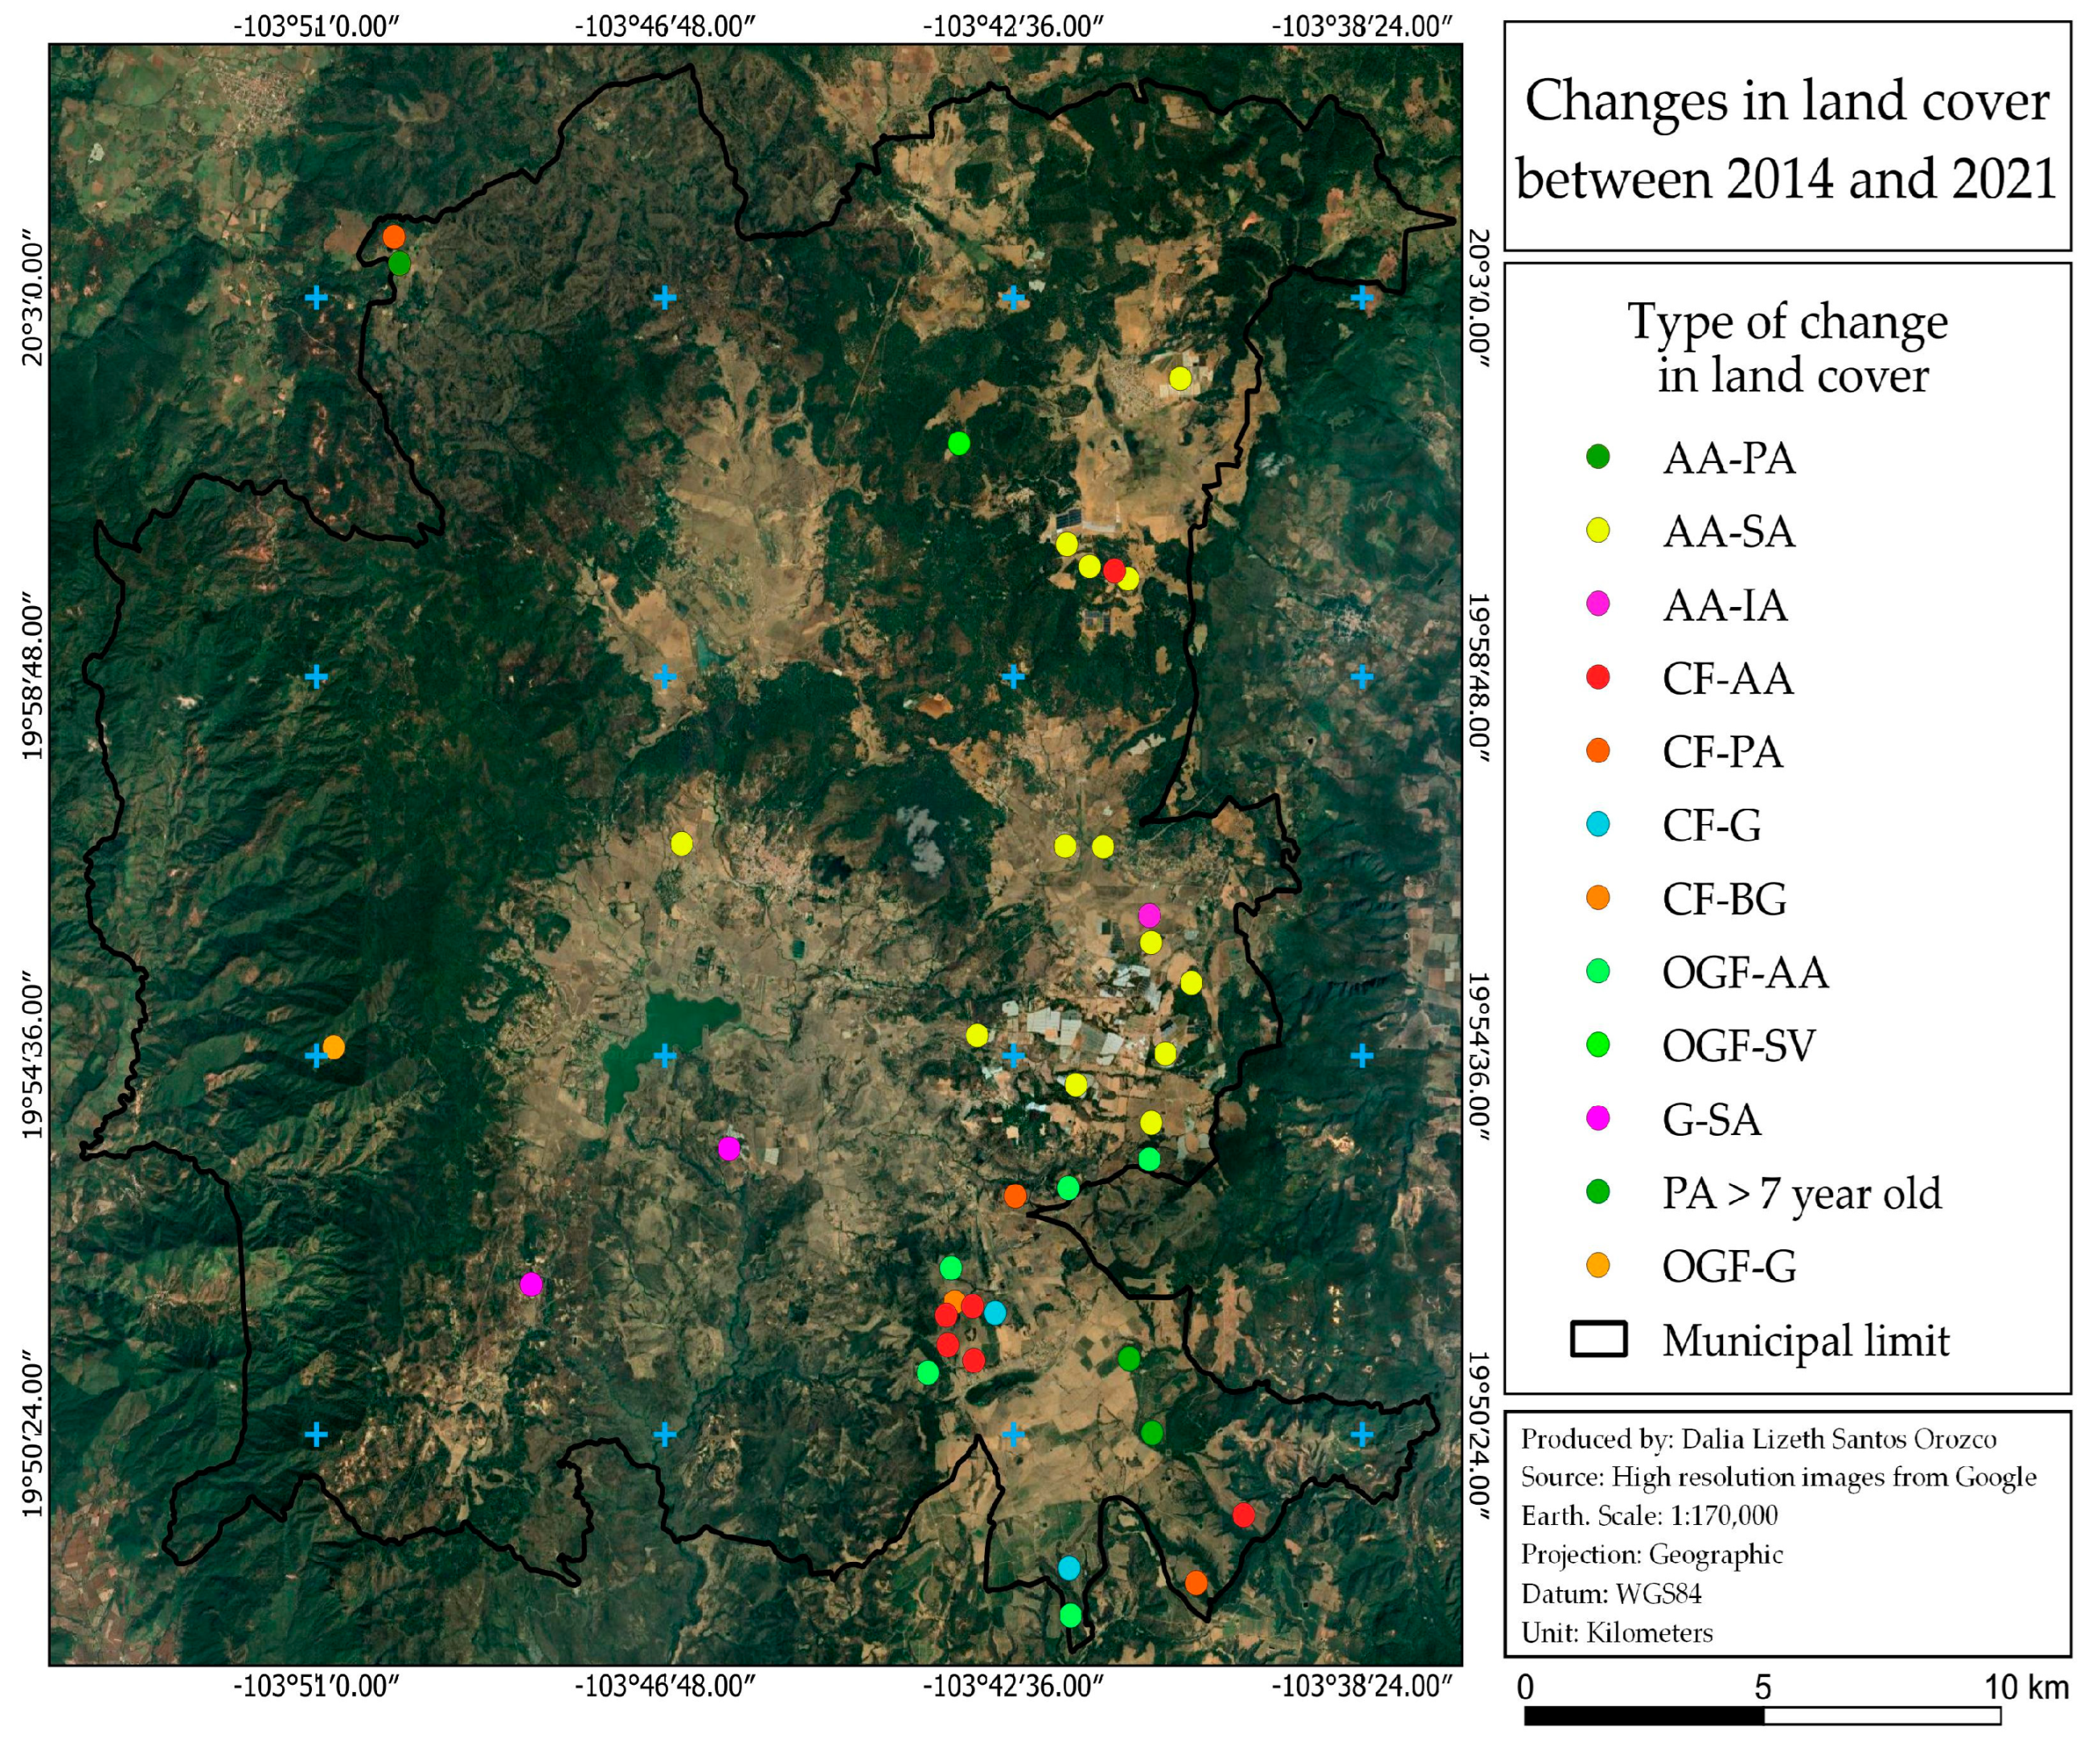
3.3. Land Cover Changes between 2014 and 2021 and Their Impact on Albedo Value
3.4. Relationship between Albedo Change and Climate Variables
4. Discussion
5. Conclusions
Author Contributions
Funding
Institutional Review Board Statement
Informed Consent Statement
Data Availability Statement
Conflicts of Interest
References
- Li, Y.; Liu, Y.; Bohrer, G.; Cai, Y.; Wilson, A.; Hu, T.; Zhao, K. Impacts of forest loss on local climate across the conterminous United States: Evidence from satellite time-series observations. Sci. Total Environ. 2022, 802, 149651. [Google Scholar] [CrossRef]
- FAO. FRA 2020 Remote Sensing Survey; FAO Forestry Paper No. 186; FAO: Rome, Italy, 2022. [CrossRef]
- Guo, T.; He, T.; Liang, S.; Roujean, J.-L.; Zhou, Y.; Huang, X. Multi-decadal analysis of high-resolution albedo changes induced by urbanization over contrasted Chinese cities based on Landsat data. Remote Sens. Environ. 2022, 269, 112832. [Google Scholar] [CrossRef]
- Vatani, L.; Hosseini, S.M.; Raeini, S.M.; Alavi, S.J.; Shamsi, S.S.; Zohd Ghodsi, M.J. Effect of tree species on albedo in Iranian temperate forests: Comparing conifers and broadleaf trees in two seasons. J. Sol. Energy Res. 2019, 4, 188–199. [Google Scholar] [CrossRef]
- Conte, L.; Renner, M.; Brando, P.; Oliveira dos Santos, C.; Silvério, D.; Kolle, O.; Kleidon, A. Effects of tropical deforestation on surface energy balance partitioning in southeastern Amazonia estimated from maximum convective power. Geophys. Res. Lett. 2019, 46, 4396–4403. [Google Scholar] [CrossRef]
- Gash, J.H.C.; Shuttleworth, W.J. Tropical Deforestation: Albedo and the Surface-Energy Balance. In Tropical Forests and Climate; Myers, N., Ed.; Springer: Dordrecht, The Netherlands, 1991. [Google Scholar] [CrossRef]
- Davin, E.L.; Noblet-Ducoudré, N. Climatic Impact of Global-Scale Deforestation: Radiative versus Non-radiative Processes. J. Clim. 2010, 23, 97–112. [Google Scholar] [CrossRef]
- Cuxart, J.; Boone, A. Evapotranspiration over Land from a Boundary-Layer Meteorology Perspective. Bound.-Layer Meteorol. 2020, 177, 427–459. [Google Scholar] [CrossRef]
- Scott, C.E.; Monks, S.A.; Spracklen, D.V. Impact on short-lived climate forcers increases projected warming due to deforestation. Nat. Commun. 2018, 9, 157. [Google Scholar] [CrossRef]
- Zhang, Q.; Barnes, M.; Benson, M.; Burakowski, E.; Oishi, A.C.; Ouimette, A.; Novick, A. Reforestation and surface cooling in temperate zones: Mechanisms and implications. Glob. Chang. Biol. 2020, 26, 3384–3401. [Google Scholar] [CrossRef]
- Jhajharia, D.; Singh, P. Trends in temperature, diurnal temperature range and sunshine duration in Northeast India. Int. J. Climatol. 2011, 31, 1353–1367. [Google Scholar] [CrossRef]
- Sun, X.; Ren, G.; You, Q.; Ren, Y.; Xu, W.; Xue, X.; Zhan, Y.; Zhang, S.; Zhang, P. Global diurnal temperature range (DTR) changes since 1901. Clim. Dyn. 2018, 52, 3343–3356. [Google Scholar] [CrossRef]
- Hu, Y.; Hou, M.; Zhao, C.; Zhen, X.; Yao, L.; Xu, Y. Human-induced changes of surface albedo in Northern China from 1992–2012. Int. J. Appl. Earth Obs. Geoinf. 2019, 79, 184–191. [Google Scholar] [CrossRef]
- Lindvall, J.; Svensson, G. The diurnal temperature range in the CMIP5 models. Clim. Dyn. 2014, 44, 405–421. [Google Scholar] [CrossRef]
- Jackson, L.S.; Forster, P.M. An empirical study of geographic and seasonal variations in the diurnal temperature range. J. Clim. 2010, 23, 3205–3221. [Google Scholar] [CrossRef]
- González, A.; Pérez, R.; Moreno, F.; Ramírez, G.; Rosales, S.; Cano, A.; Torres, M. Variabilidad de la temperatura local en bosques de coníferas por efectos de la deforestación. Rev. Mex. Cienc. For. 2015, 6, 22–39. Available online: https://www.scielo.org.mx/pdf/remcf/v6n31/v6n31a3.pdf (accessed on 23 May 2023).
- Gobierno del Estado de Jalisco, Información Municipal, Municipio de Tapalpa. Available online: https://www.jalisco.gob.mx/es/jalisco/municipios/tapalpa (accessed on 12 October 2021).
- Ruiz, C.J.A.; Contreras, R.S.H.; García, R.G.E.; Villavicencio, G.R. Climas de Jalisco según el sistema Köppen-García con ajuste por vegetación potencial. Rev. Mex. Cienc. Agrícolas 2021, 12, 805–821. [Google Scholar] [CrossRef]
- Ruiz, C.J.A.; Flores, L.H.E.; Regalado, R.J.R.; Ramírez, O.G. Estadísticas Climáticas Normales del Estado de Jalisco. Libro Técnico Núm; INIFAP-CIRPAC-Campo Experimental Centro Altos de Jalisco: Tepatitlán de Morelos, Jalisco, Mexico, 2012; pp. 276–277+350. Available online: https://www.researchgate.net/profile/Gabriela-Ojeda/publication/363085199_Estadisticas_Climaticas_Normales_del_Estado_de_Jalisco/links/630d813bacd814437fe8ee50/Estadisticas-Climaticas-Normales-del-Estado-de-Jalisco.pdf (accessed on 23 May 2023).
- Traversa, G.; Fugazza, D.; Senese, A.; Frezzotti, M. Landsat 8 OLI Broadband Albedo Validation in Antarctica and Greenland. Remote Sens. 2021, 13, 799. [Google Scholar] [CrossRef]
- Instituto Nacional de Estadística y Geográfica. Conjunto de Datos Vectoriales de la Carta Topográfica Escala 1:250,000 por Entidad Federativa de Jalisco. Available online: https://www.inegi.org.mx/app/biblioteca/ficha.html?upc=889463770350 (accessed on 12 December 2021).
- Instituto Nacional de Estadística y Geografía. Continuo de Elevaciones Mexicano (CEM). Available online: https://www.inegi.org.mx/app/geo2/elevacionesmex/ (accessed on 12 December 2021).
- Comisión Nacional Forestal. Sistema de Monitoreo Satelital Forestal (SAMOF). Mapas de Cobertura de Suelo. Available online: https://idefor.cnf.gob.mx/mviewer/samof (accessed on 12 December 2021).
- Rodríguez, M.V.M. ESSENGER. Sistema de Base de Datos Meteorológicos. X Congreso Nacional Sobre Conservación y Utilización de los Recursos zoogenéticos. XXII Simposio Iberoamericano y X Congreso Nacional CONBIAND. Benemérita Universidad Autónoma de Puebla, Puebla de Zaragoza, México. Noviembre. RPDA INIFAP-03-2021-120109052200-01. 2021. Available online: https://clima.inifap.gob.mx/lnmysr/DatosIndirectos/NEssenger (accessed on 23 May 2023).
- Camargo-Roa, E.; Pacheco, C.; López, R. Evaluación de métodos de corrección atmosférica y sombreado topográfico en imagen Landsat 8 OLI sobre un área montañosa semiárida. UD Y La Geomat. 2021, 16, 23–39. [Google Scholar]
- Riaño, D.; Chuvieco, E.; Salas, J.; Aguado, I. Assessment of different topographic corrections in Landsat-TM data for mapping vegetation types. IEEE Trans. Geosci. Remote Sens. 2003, 41, 1056–1061. [Google Scholar] [CrossRef]
- Oliveria, T.; Rangel, T.; Amori, L.; Carlos, D.; Souza, J. Surface albedo in different land-use and cover types in Amazon forest region. Rev. Ambiente Água 2018, 13, 1. [Google Scholar] [CrossRef]
- Kim, K.; Lee, K. An Implementation of OTB Extension to Produce TOA and TOC Reflectance of LANDSAT-8 OLI Images and Its Product Verification Using RadCalNet RVUS Data. Korean J. Remote Sens. 2021, 37, 449–461. [Google Scholar] [CrossRef]
- Liang, S. Narrowband to broadband conversions of land surface albedo I: Algorithms. Remote Sens. Environ. 2001, 76, 213–238. [Google Scholar] [CrossRef]
- Stone, D.; Weaver, A. Factors contributing to diurnal temperature range trends in twentieth and twenty-first century simulations of the CCCma coupled model. Clim. Dyn. 2003, 20, 435–445. [Google Scholar] [CrossRef]
- Davy, R.; Esau, I.; Chernokulsky, A.; Outten, S.; Zilitinkevich, S. Diurnal asymmetry to the observed global warming. Int. J. Climatol. 2017, 37, 79–93. [Google Scholar] [CrossRef]
- Mendes, H.; Dos Santos, A.; Lopes, S.; Polizel, L.; Silva, F.; Aravena, R. Comportamiento térmico de diferentes superficies urbanas durante un día cálido de verano. Rev. Geográfica Valparaíso 2019, 1, 2–8. [Google Scholar] [CrossRef]
- Sánchez-Quiroga, L. Estimación e Imputación de Datos Faltantes Mediante Métodos de Interpolación Espacial para Precipitación Mensual Acumulada en el Departamento de Antioquia Durante el Periodo 2014–2018; Universidad Santo Tomás: Bogotá, Colombia, 2020; Available online: http://hdl.handle.net/11634/22341 (accessed on 23 May 2023).
- LaMorte, W.W. Evaluating Association between Two Continuous Variables; Boston University School of Public Health: Boston, MA, USA, 2021; Available online: https://sphweb.bumc.bu.edu/otlt/MPH-Modules/PH717-QuantCore/PH717-Module9-Correlation-Regression/PH717-Module9-Correlation-Regression4.html (accessed on 23 May 2023).
- Jiao, T.; Williams, A.; Ghimire, B. Global climate forcing from albedo change caused by large-scale deforestation and reforestation: Quantification and attribution of geographic variation. Clim. Chang. 2017, 142, 463–476. [Google Scholar] [CrossRef]
- Macías, A.; Sevilla, Y. Naturaleza vulnerada: Cuatro décadas de agricultura industrializada de frutas y hortalizas en el sur de Jalisco, México (1980–2020). EntreDiversidades Rev. Cienc. Soc. Humanidades 2021, 8, 64–91. [Google Scholar] [CrossRef]
- Housni, F.; Cervantes, G.; Lares-Michel, M.; Juárez, H.; Carmona, C.; Nava, M. Land-use Change and Its Impact on Production and Consumption of Strawberry in Tapalpa, Jalisco, Mexico. J. Food Secur. 2017, 5, 58–65. [Google Scholar] [CrossRef]
- He, T.; Wang, D.; Qu, Y. 5.06—Land Surface Albedo. In Comprehensive Remote Sensing; Liang, S., Ed.; Elsevier: Amsterdam, The Netherlands, 2018; pp. 140–162. [Google Scholar] [CrossRef]
- Zhao, F.; Lan, X.; Li, W.; Zhu, W.; Li, T. Influence of Land Use Change on the Surface Albedo and Climate Change in the Qinling-Daba Mountains. Sustainability 2021, 13, 10153. [Google Scholar] [CrossRef]
- Wolff, N.H.; Masuda, Y.J.; Meijaard, E.; Wells, J.A.; Game, E.T. Impacts of tropical deforestation on local temperature and human well-being perceptions. Glob. Environ. Change 2018, 52, 181–189. [Google Scholar] [CrossRef]
- Xu, X.; Zhang, X.; Riley, W.J.; Xue, Y.; Nobre, C.A.; Lovejoy, T.E.; Jia, G. Deforestation triggering an irreversible transition in Amazon hydrological cycle. Environ. Res. Lett. 2022, 17, 034037. [Google Scholar] [CrossRef]
- Byrne, M.P.; O’Gorman, P.A. Understanding decreases in land relative humidity with global warming: Conceptual model and GCM simulations. J. Clim. 2016, 29, 9045–9061. [Google Scholar] [CrossRef]
- Medina, G.G.; Ruiz, C.J.A.; Martínez, P.R. Los Climas de México: Una Estratificación Ambiental Basada en el Componente Climático; Libro Técnico Num. 1; Conexión Gráfica: Guadalajara, Jalisco, Mexico, 1998; 103p. [Google Scholar]
- Zhang, X.; Jiao, Z.; Zhao, C.; Qu, Y.; Liu, Q.; Zhang, H.; Tong, Y.; Wang, C.; Li, S.; Guo, J. Review of Land Surface Albedo: Variance Characteristics, Climate Effect and Management Strategy. Remote Sens. 2022, 14, 1382. [Google Scholar] [CrossRef]
- Law, B.; Hudiburg, T.; Berner, L.; Kent, J.; Buotte, P.; Harmon, M. Land use strategies to mitigate climate change in carbon dense temperate forests. Proc. Natl. Acad. Sci. USA 2018, 115, 3663–3668. [Google Scholar] [CrossRef]
- Sieber, P.; Ericsson, N.; Hammar, T.; Hansson, A. Albedo impacts of current agricultural land use: Crop-specific albedo from MODIS data and inclusion in LCA of crop production. Sci. Total Environ. 2022, 835, 155455. [Google Scholar] [CrossRef]
- Maina, F.; Kumar, S.; Gangodagamage, C. Irrigation and warming drive the decreases in surface albedo over High Mountain Asia. Sci Rep. 2022, 12, 16163. [Google Scholar] [CrossRef]
- Zhang, C.; Ge, Q.; Dong, J.; Zhang, X.; Li, Y.; Han, S. Characterizing spatial, diurnal, and seasonal patterns of agricultural irrigation expansion-induced cooling in Northwest China from 2000 to 2020. Agric. For. Meteorol. 2023, 330, 109304. [Google Scholar] [CrossRef]
- Englehart, J.; Douglas, V. Changing behavior in the diurnal range of surface air temperatures over Mexico. Geophys. Res. Lett. 2005, 32, L01701. [Google Scholar] [CrossRef]
- Wang, G.; Dillon, E. Recent geographic convergence in diurnal and annual temperature cycling flattens global thermal profiles. Nat. Clim. Chang. 2014, 4, 988–992. [Google Scholar] [CrossRef]
- Briga, M.; Verhulst, S. Large diurnal temperature range increases bird sensitivity to climate change. Sci. Rep. 2015, 5, 16600. [Google Scholar] [CrossRef]
- Vose, S.; Easterling, R.; Gleason, B. Maximum and minimum temperature trends for the globe: An update through. Geophys. Res. Lett. 2004, 32, 0094–8276. [Google Scholar] [CrossRef]
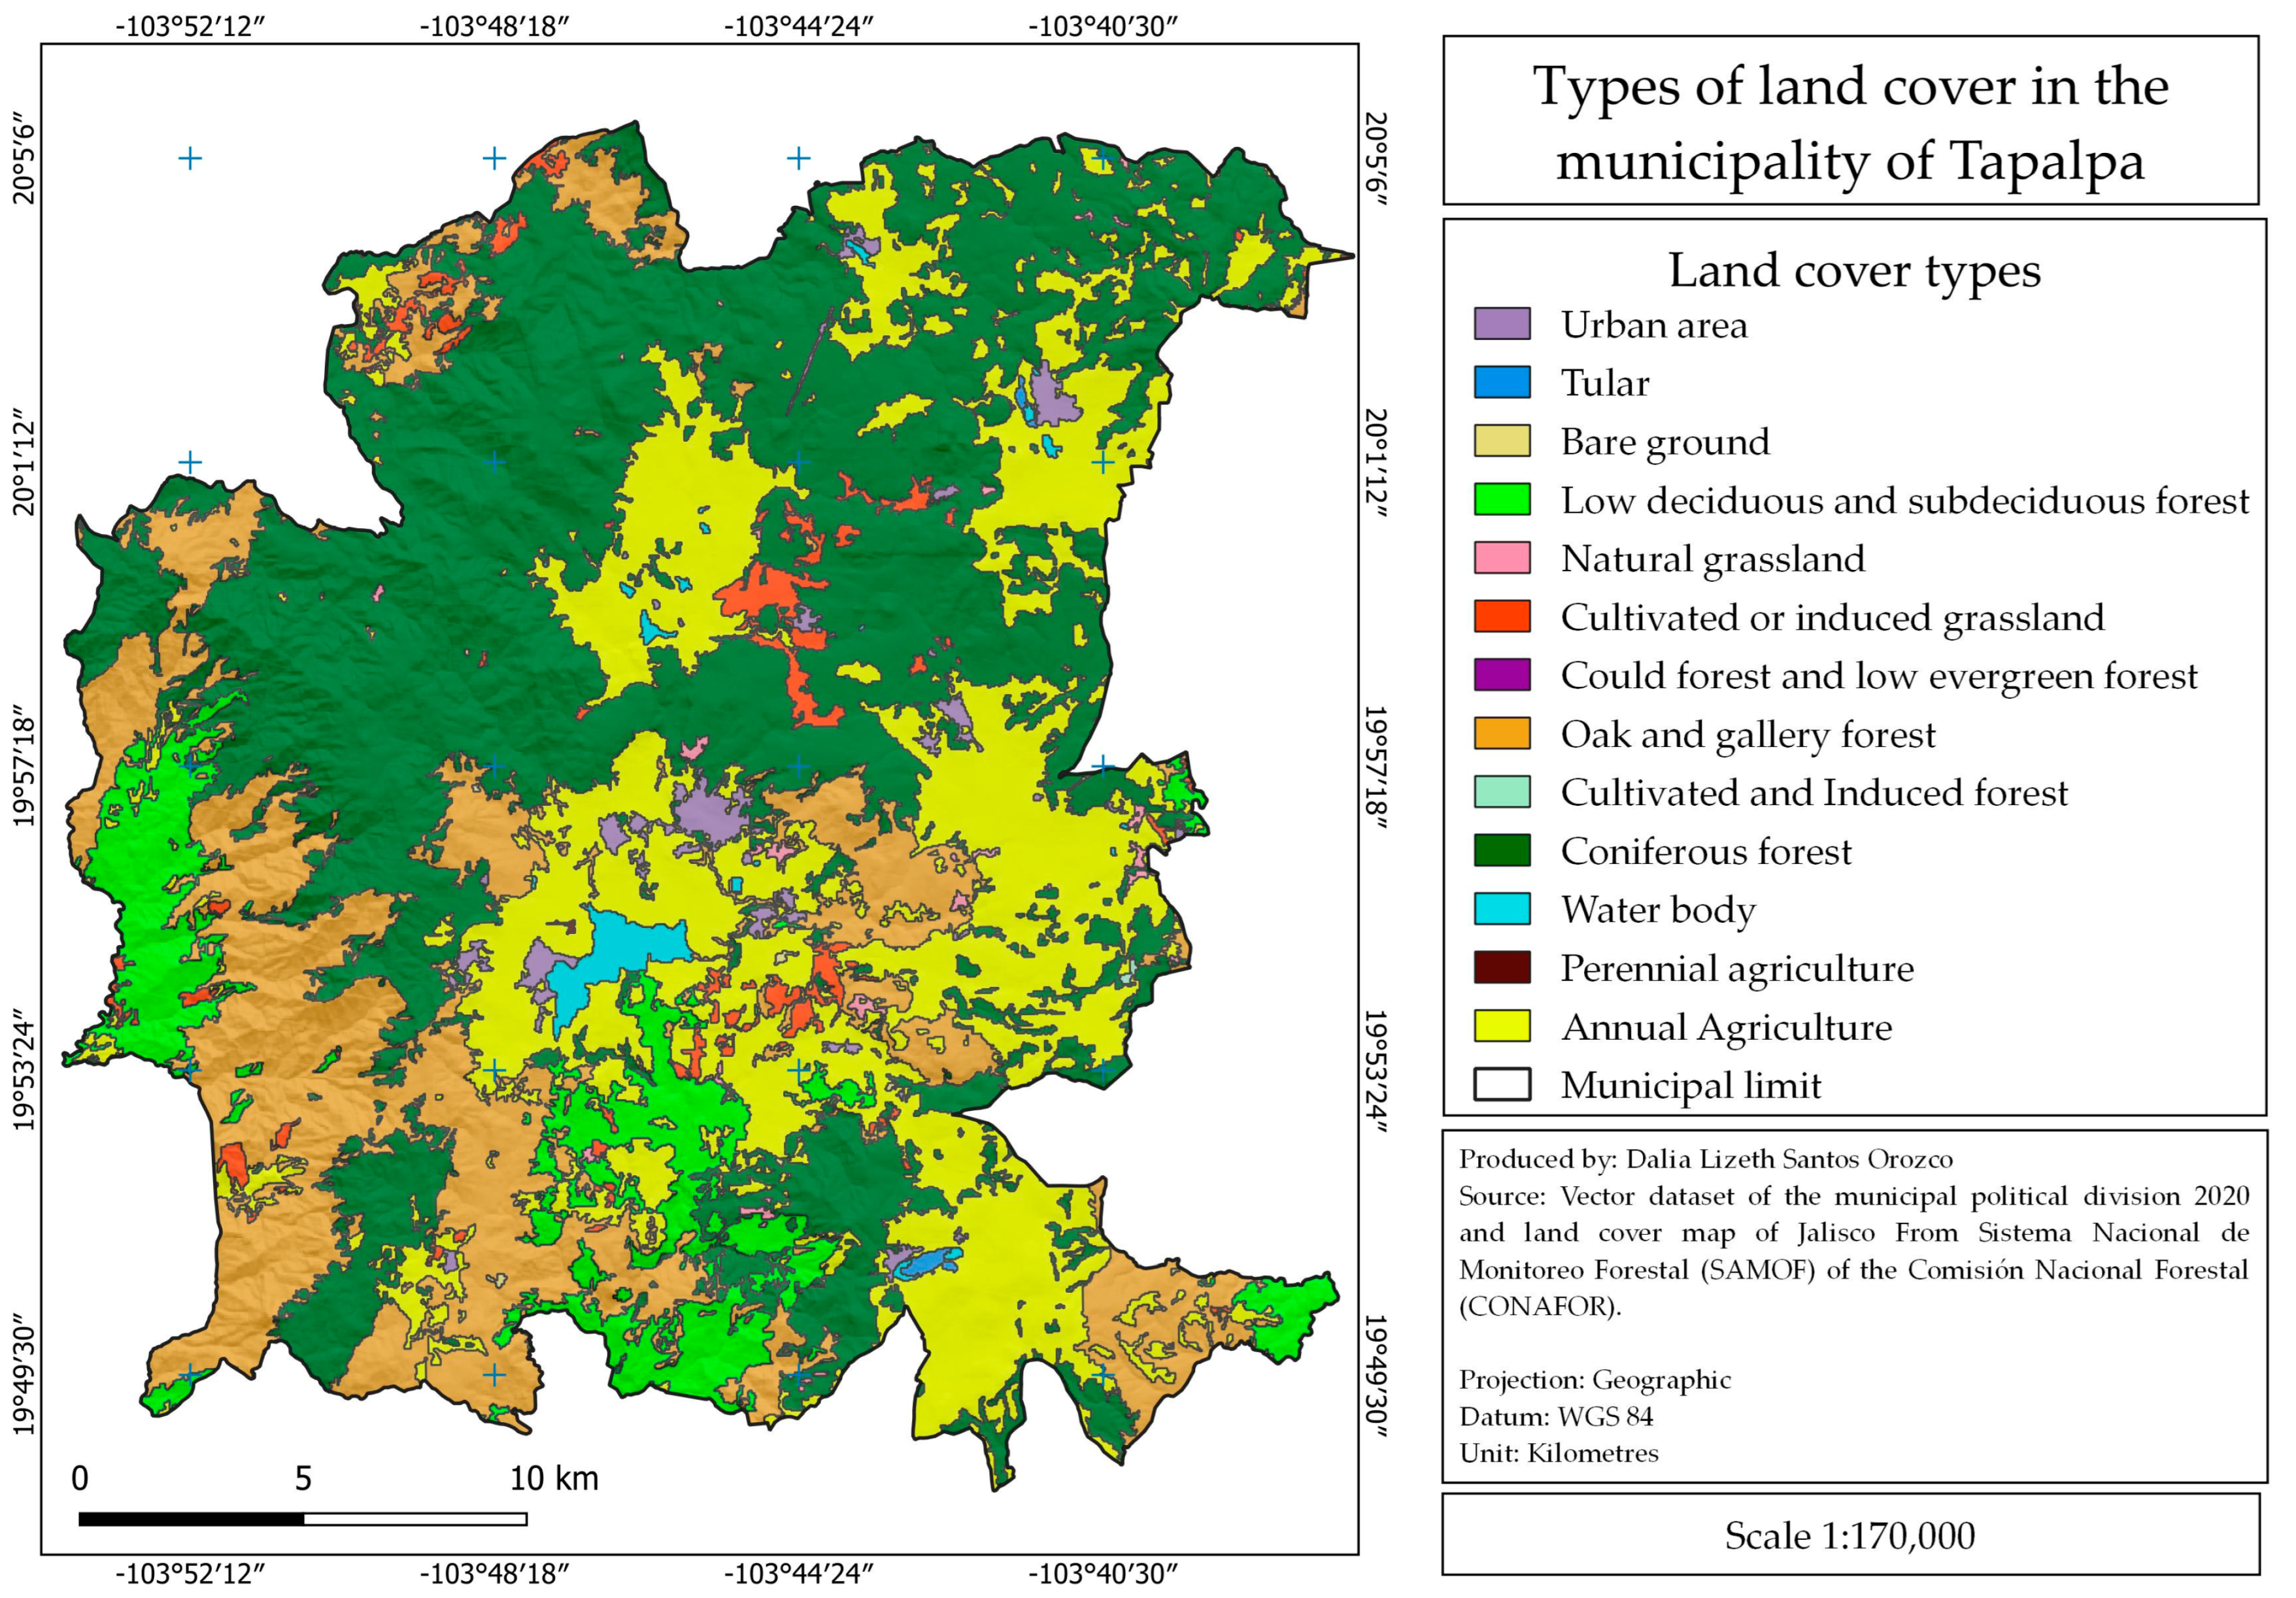

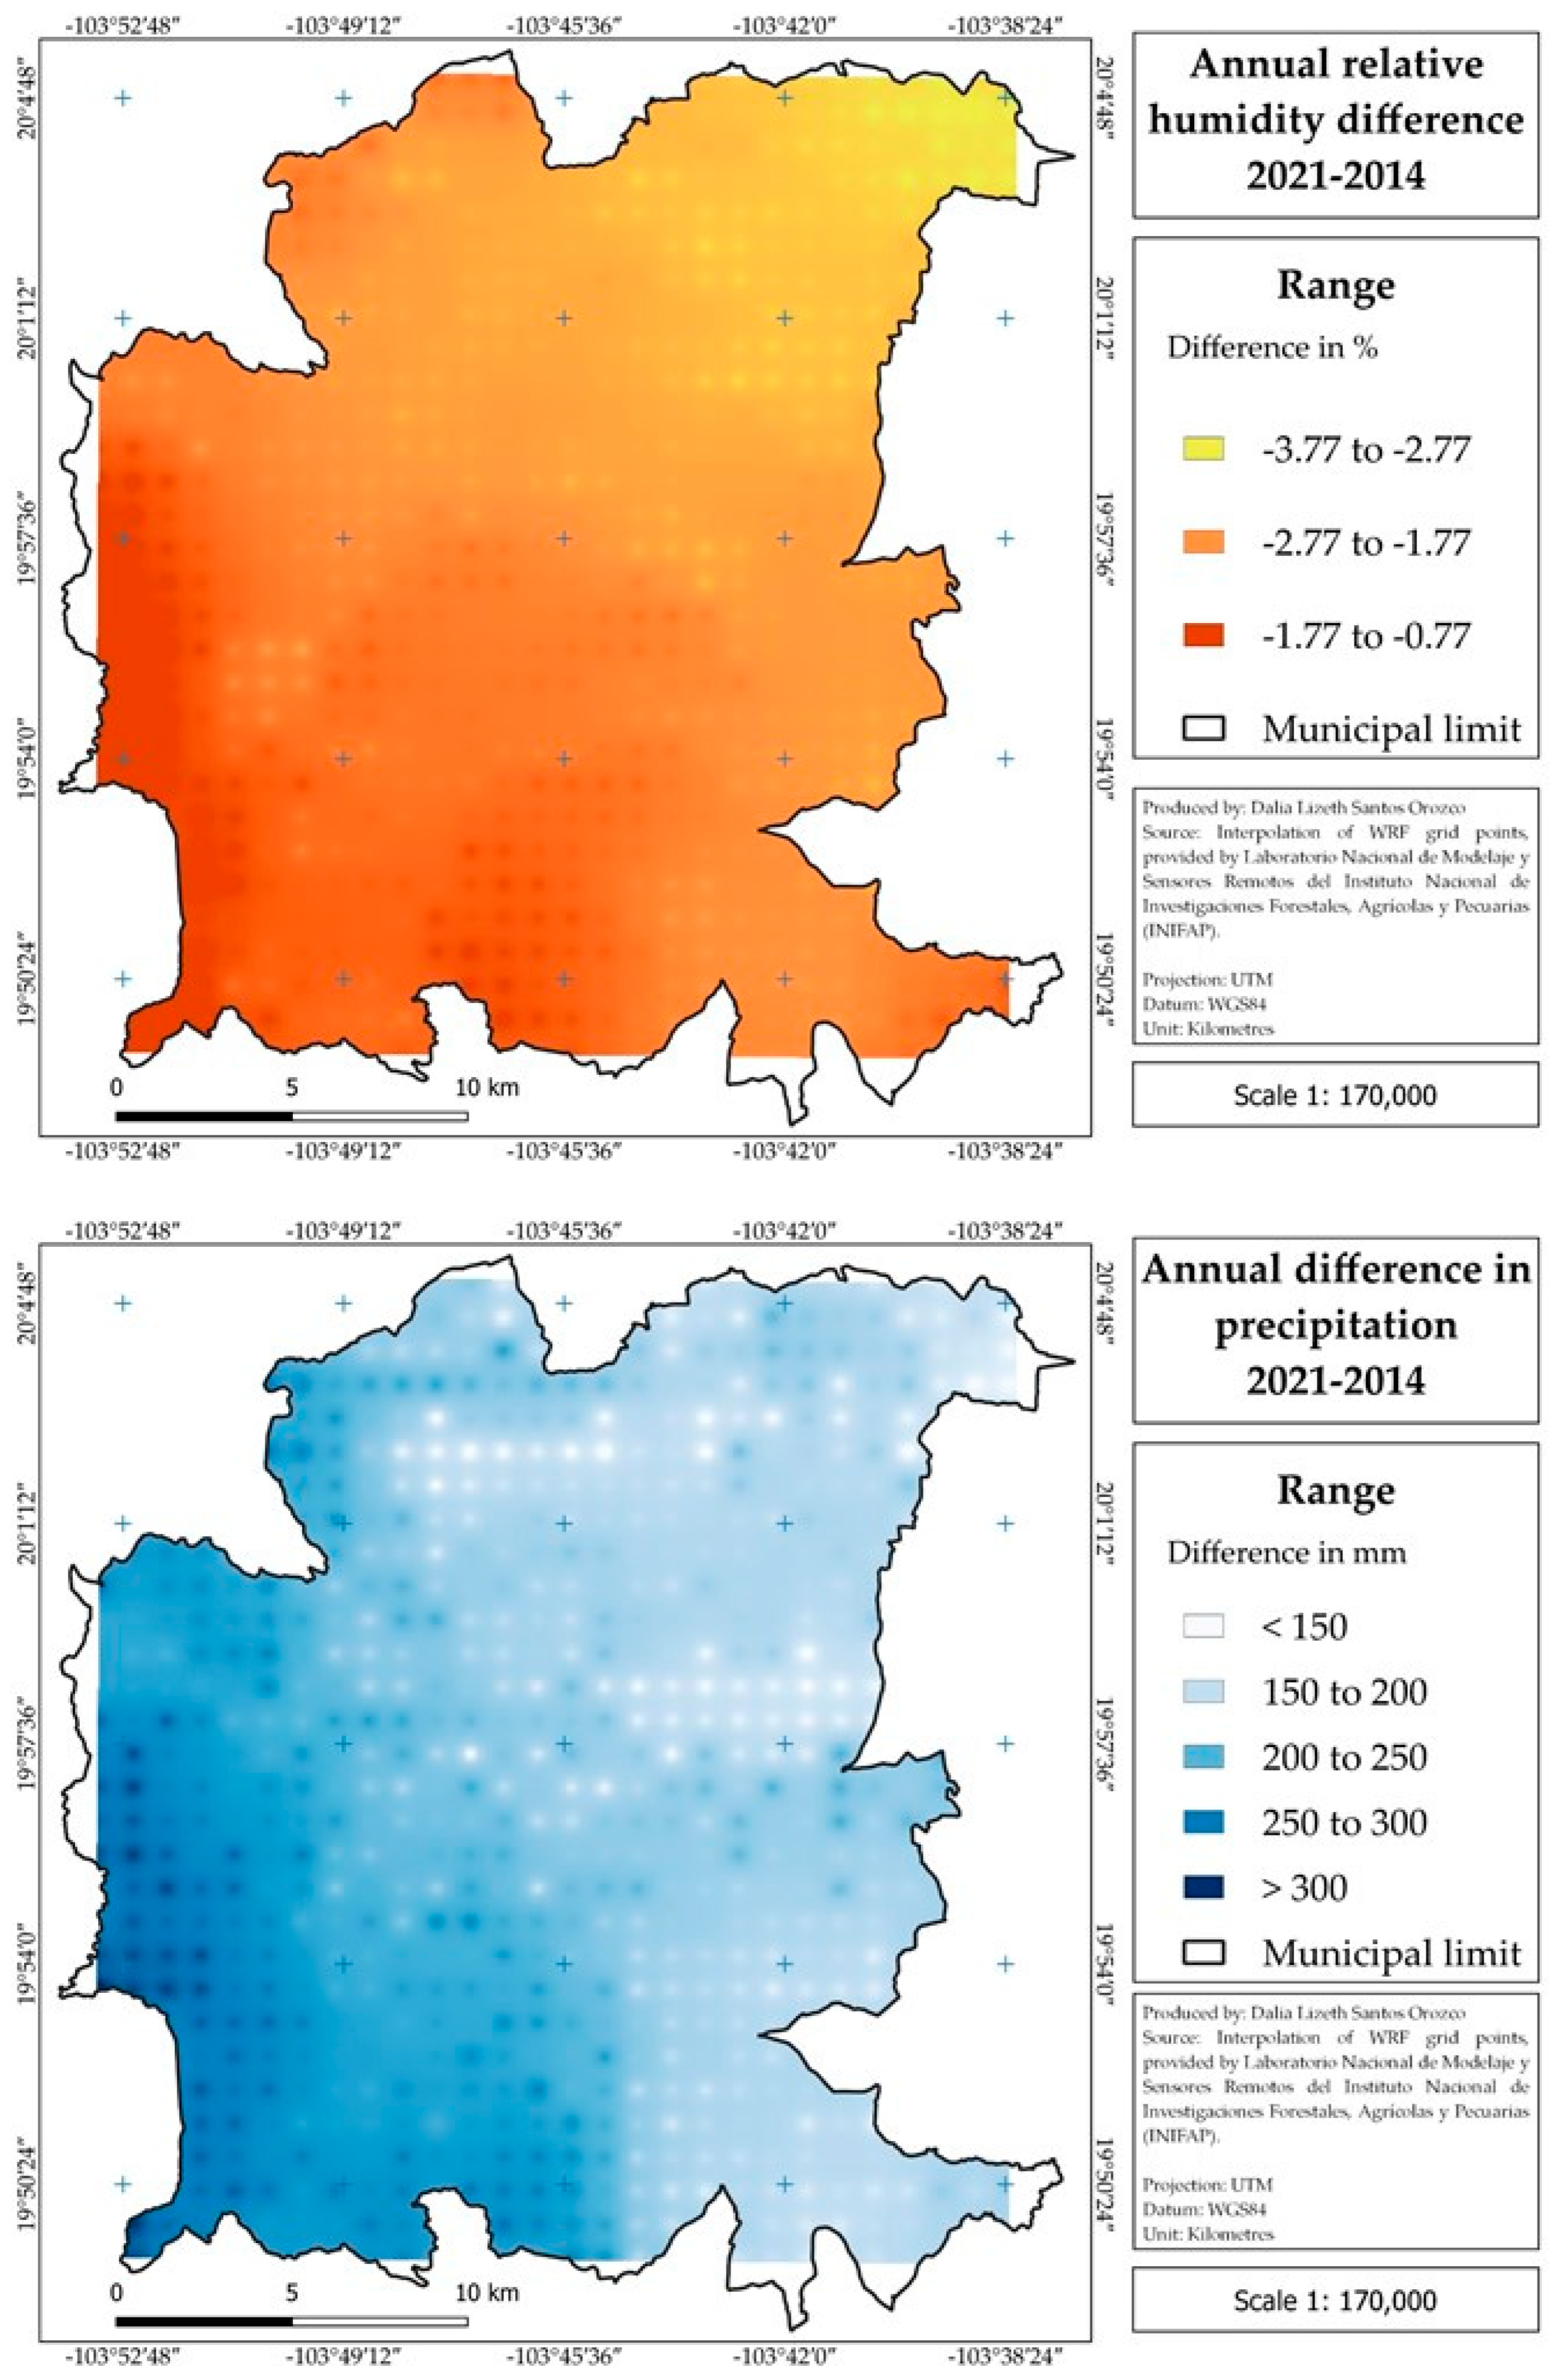
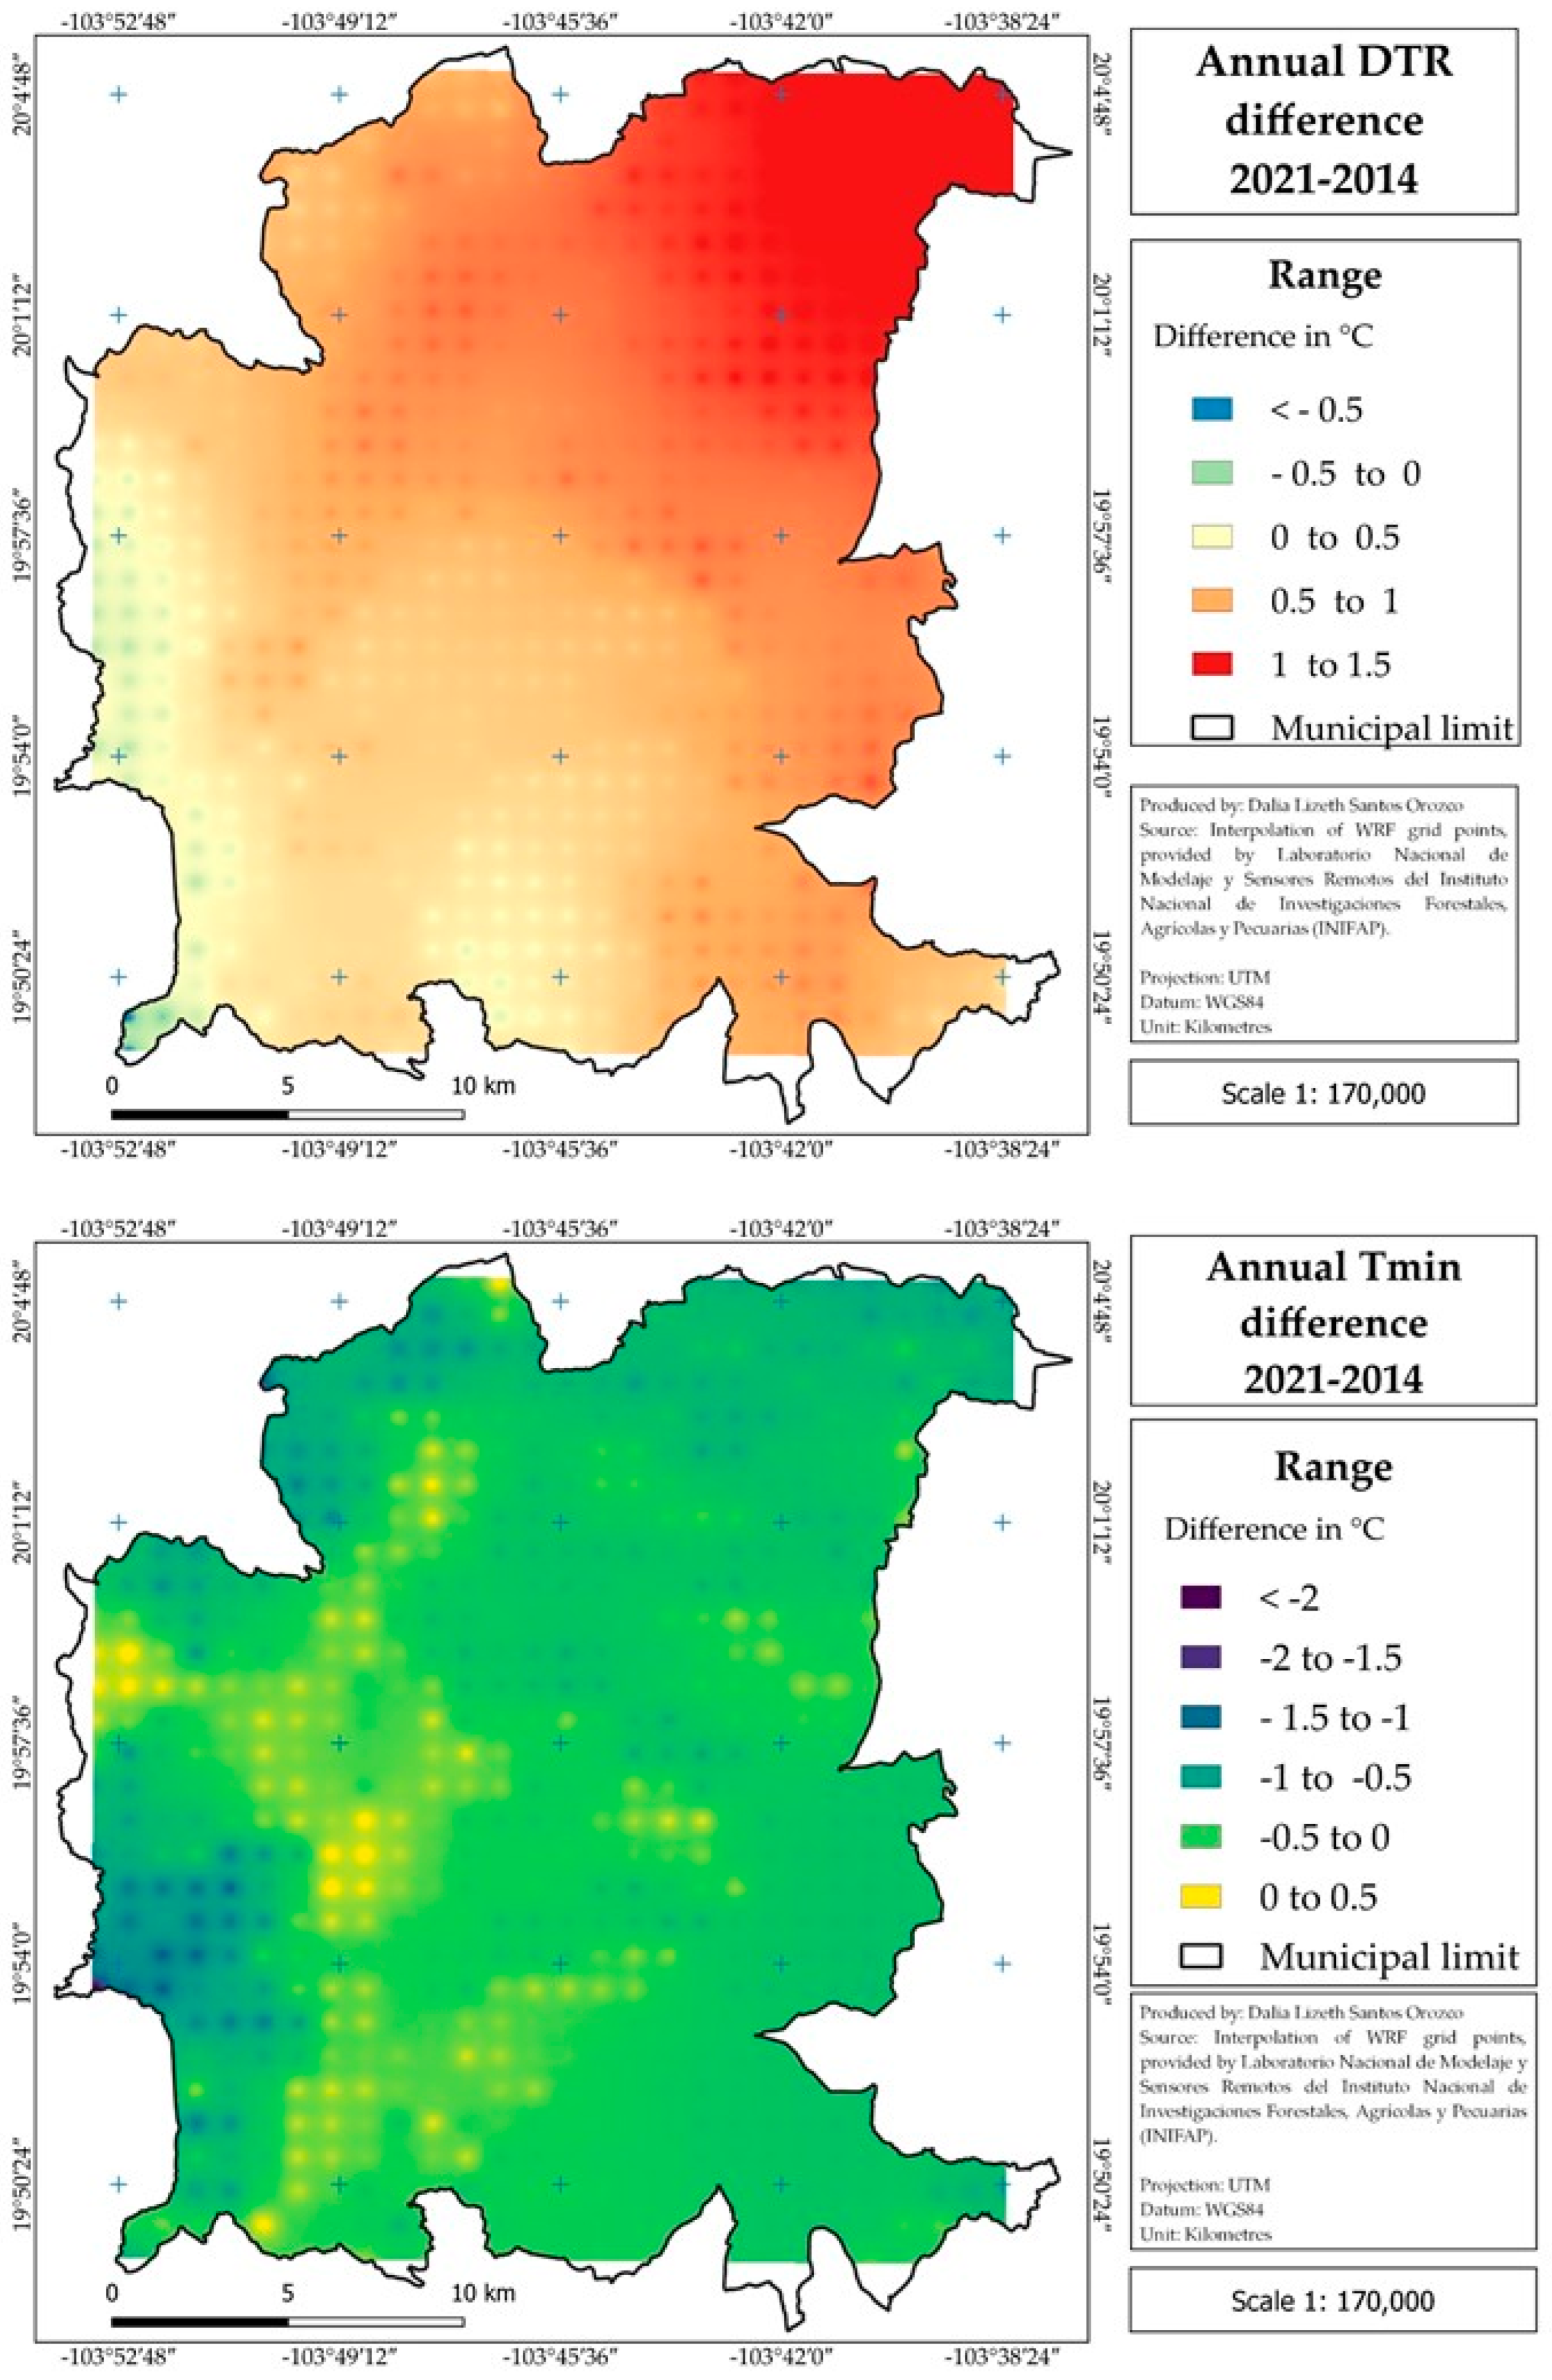
| Area | ||
|---|---|---|
| Land Cover Types | Hectares | % |
| Urban area (UA) | 773.09000 | 1.24 |
| Tular (TL) | 59.99484 | 0.09 |
| Bare ground (BG) | 32.5345 | 0.052 |
| Natural grassland (NGR) | 197.84891 | 0.31 |
| Low deciduous and sub-deciduous forest (LDF) | 4371.1777 | 7.05 |
| Cultivated or induced grassland (CGR) | 1214.52896 | 1.96 |
| Cloud forest and low evergreen forest (CEGF) | 1.35978 | 0.0021 |
| Oak and gallery forest (OGF) | 12,094.98695 | 19.52 |
| Cultivated and induced forest (CIF) | 11.69106 | 0.018 |
| Coniferous forest (CF) | 26,356.0703 | 42.55 |
| Water bodies (WB) | 483.7009 | 0.78 |
| Perennial agriculture (PA) | 5.98163 | 0.01096 |
| Annual agriculture (AA) | 16,337.47 | 26.37 |
| Total Municipality of Tapalpa | 61,940.44 | 100.00 |
| Albedo Values | ||||||
|---|---|---|---|---|---|---|
| Difference | ||||||
| 2014 | 2021 | Ave 2021 − Ave 2014 | ||||
| Land Cover Types | Max | Ave | Max | Ave | Diff | p-Value |
| Cloud and low evergreen forest | 7.15 | 6.12 | 7.87 | 6.46 | +0.34 | 0.191 |
| Cultivated and induced forest | 7.18 | 6.34 | 8.85 | 5.53 | −0.81 | 0.011 |
| Perennial agriculture | 8.40 | 6.84 | 9.29 | 6.52 | −0.32 | 0.0001 |
| Tular | 8.54 | 5.69 | 8.28 | 7.6 | +1.91 | 0.005 |
| Water bodies | 10.01 | 4.72 | 10.55 | 4.69 | −0.03 | 0.0001 |
| Natural grassland | 10.61 | 7.13 | 12.19 | 7.8 | +0.67 | 0.0001 |
| Low deciduous and sub-deciduous forest | 10.92 | 6.13 | 12.99 | 6.94 | +0.81 | 0.0001 |
| Cultivated and induced grassland | 12.97 | 7.11 | 19.63 | 5.77 | −1.34 | 0.0001 |
| Coniferous forest | 13.39 | 5.37 | 14.89 | 9.6 | +4.23 | 0.0001 |
| Urban area | 15.42 | 7.99 | 17.29 | 8.61 | +0.62 | 0.0001 |
| Bare ground | 16.01 | 9.51 | 16.67 | 7.81 | −1.70 | 0.340 |
| Oak and Gallery forest | 16.27 | 5.77 | 21.20 | 6.47 | +0.70 | 0.0001 |
| Annual Agriculture | 21.46 | 7.82 | 27.01 | 8.52 | +0.70 | 0.0001 |
| Municipality of Tapalpa | 21.46 | 6.22 | 27.01 | 6.79 | +2.16 | 0.0001 |
| Albedo Change in Land Cover Types | |||||
|---|---|---|---|---|---|
| Change Year | Land Cover Type 2014 | Land Cover Type 2021 | Albedo 2014 (%) | Albedo 2021 (%) | Difference 2021 − 2014 (%) |
| 2015 | Annual agriculture | Protected agriculture | 9.10 | 11.38 | +2.27 |
| 2015 | Annual agriculture | Protected agriculture | 8.43 | 7.49 | −0.94 |
| 2016 | Coniferous forest | Perennial agriculture | 4.99 | 9.97 | +4.97 |
| 2016 | Grassland | Protected agriculture | 7.47 | 16.84 | +9.37 |
| 2016 | Coniferous forest | Annual agriculture | 5.61 | 9.77 | +4.15 |
| 2016 | Coniferous forest | Grassland | 5.25 | 9.99 | +4.73 |
| 2016 | Oak forest | Annual agriculture | 5.10 | 10.56 | +5.46 |
| 2016 | Oak forest | Annual agriculture | 6.08 | 8.11 | +2.02 |
| 2016 | Annual agriculture | Protected agriculture | 9.40 | 14.39 | +4.98 |
| 2016 | Annual agriculture | Protected agriculture | 7.91 | 7.91 | 0.00 |
| 2016 | Annual agriculture | Protected agriculture | 10.31 | 10.11 | −0.19 |
| 2016 | Annual agriculture | Protected agriculture | 8.63 | 9.35 | +0.72 |
| 2016 | Annual agriculture | Irrigation agriculture | 10.40 | 8.43 | −1.97 |
| 2016 | Annual agriculture | Protected agriculture | 6.27 | 14.24 | +7.96 |
| 2017 | Annual agriculture | Protected agriculture | 8.73 | 11.05 | +2.32 |
| 2017 | Grassland | Protected agriculture | 7.34 | 10.54 | +3.19 |
| 2017 | Coniferous forest | Perennial agriculture | 5.02 | 6.54 | +1.52 |
| 2017 | Annual agriculture | Perennial agriculture | 6.78 | 6.25 | −0.53 |
| 2017 | Grassland | Annual agriculture | 9.61 | 15.76 | +6.15 |
| 2017 | Annual agriculture | Protected agriculture | 8.52 | 10.05 | +1.53 |
| 2018 | Coniferous forest | Perennial agriculture | 5.75 | 7.86 | +2.10 |
| 2019 | Oak forest | Annual agriculture | 5.85 | 9.65 | +3.79 |
| 2019 | Coniferous forest | Annual agriculture | 5.63 | 8.26 | +2.62 |
| 2019 | Coniferous forest | Annual agriculture | 5.34 | 7.12 | +1.77 |
| 2020 | Coniferous forest | Bare ground | 5.34 | 9.49 | +4.14 |
| 2020 | Oak forest | Annual agriculture | 7.64 | 9.94 | +2.30 |
| 2020 | Coniferous forest | Annual agriculture | 5.39 | 9.91 | +4.52 |
| 2020 | Coniferous forest | Annual agriculture | 5.48 | 7.92 | +2.43 |
| 2020 | Oak forest | Annual agriculture | 5.90 | 9.00 | +3.10 |
| 2020 | Coniferous forest | Grassland | 5.17 | 8.90 | +3.72 |
| 2020 | Oak forest | Grassland | 5.65 | 12.16 | +6.50 |
| 2020 | Oak forest | Secondary vegetation | 5.07 | 7.21 | +2.13 |
| 2020 | Annual agriculture | Protected agriculture | 7.42 | 12.87 | +5.45 |
| 2020 | Annual agriculture | Protected agriculture | 8.65 | 18.68 | +10.03 |
| 2020 | Annual agriculture | Protected agriculture | 7.60 | 17.97 | +10.36 |
| 2020 | Annual agriculture | Protected agriculture | 10.54 | 11.99 | +1.45 |
| 2021 | Perennial agriculture (trees < 1-year-old) | Perennial agriculture (trees > 7-year-old trees | 7.09 | 5.70 | −1.39 |
| 2021 | Perennial agriculture (trees < 1-year-old) | Perennial agriculture (trees > 7-year-old trees | 7.42 | 6.15 | −1.27 |
| Maximum Temperature (°C) | Minimum Temperature (°C) | Diurnal Temperature Range (DTR) (°C) | Relative Humidity (%) | |
|---|---|---|---|---|
| Spearman rho | −0.262 | −0.232 | 0.264 | −0.204 |
| p-value | 0.0001 | 0.0001 | 0.0001 | 0.0001 |
| 2014 | 26.6 | 9.7 | 16.9 | 49.4 |
| 2021 | 26.5 | 9.1 | 17.4 | 46.7 |
| Mann–Whitney U | 0.00002 | 0.000015 | 72470 | 17175 |
| p-value | 0.235 | 0.0001 | 0.0001 | 0.0001 |
| Statistics | Maximum Temperature (°C) | Minimum Temperature (°C) | DTR (°C) | HR (%) | Albedo (%) |
|---|---|---|---|---|---|
| N Sample A | 38 | 38 | 38 | 38 | 38 |
| N Sample B | 38 | 38 | 38 | 38 | 38 |
| A 2014 mean value | 26.41 | 9.45 | 16.96 | 49.42 | 5.19 |
| A 2021 mean value | 26.48 | 9.05 | 17.43 | 46.74 | 5.28 |
| A 2021 − 2014 deviation | 0.07 | −0.40 | 0.47 | −2.68 | 0.09 |
| B 2014 mean value | 26.02 | 8.97 | 17.06 | 48.91 | 7.73 |
| B 2021 mean value | 26.09 | 8.38 | 17.71 | 46.05 | 9.65 |
| B 2021 − 2014 deviation | 0.07 | −0.59 | 0.65 | −2.86 | 1.92 |
| Mann–Whitney U Test | |||||
| Mann–Whitney U | 1062 | 662 | 802 | 896 | 0 |
| p-value | 0.528 | 0.0002 | 0.01 | 0.05 | 0.0001 |
| Monthly/Annually | DTR 2014 (°C) | DTR 2021 (°C) | DTR 2021–DTR 2014 (°C) | Mann–Whitney U Test | p-Value |
|---|---|---|---|---|---|
| January | 17.14 | 20.35 | +3.21 | 10,975 | 0.0001 |
| February | 20.38 | 19.59 | -0.79 | 57,995 | 0.0001 |
| March | 20.67 | 19.59 | -1.07 | 33,746 | 0.0001 |
| April | 20.56 | 18.79 | -1.77 | 1848 | 0.0001 |
| May | 16.91 | 19.52 | +2.61 | 2300 | 0.0001 |
| June | 14.29 | 14.29 | 0.00 | 196,788 | 0.585 |
| July | 14.22 | 13.84 | -0.39 | 48,754 | 0.0001 |
| August | 14.13 | 13.70 | -0.43 | 16,655 | 0.0001 |
| September | 12.98 | 13.60 | +0.62 | 19,809 | 0.0001 |
| October | 15.14 | 15.55 | +0.40 | 69,646 | 0.0001 |
| November | 16.74 | 19.56 | +2.82 | 164 | 0.0001 |
| December | 19.06 | 19.14 | +0.07 | 1,777,151 | 0.0001 |
| Annual | 16.85 | 17.29 | +0.43 | 104,679 | 0.0001 |
Disclaimer/Publisher’s Note: The statements, opinions and data contained in all publications are solely those of the individual author(s) and contributor(s) and not of MDPI and/or the editor(s). MDPI and/or the editor(s) disclaim responsibility for any injury to people or property resulting from any ideas, methods, instructions or products referred to in the content. |
© 2023 by the authors. Licensee MDPI, Basel, Switzerland. This article is an open access article distributed under the terms and conditions of the Creative Commons Attribution (CC BY) license (https://creativecommons.org/licenses/by/4.0/).
Share and Cite
Santos Orozco, D.L.; Ruiz Corral, J.A.; Villavicencio García, R.F.; Rodríguez Moreno, V.M. Deforestation and Its Effect on Surface Albedo and Weather Patterns. Sustainability 2023, 15, 11531. https://doi.org/10.3390/su151511531
Santos Orozco DL, Ruiz Corral JA, Villavicencio García RF, Rodríguez Moreno VM. Deforestation and Its Effect on Surface Albedo and Weather Patterns. Sustainability. 2023; 15(15):11531. https://doi.org/10.3390/su151511531
Chicago/Turabian StyleSantos Orozco, Dalia Lizeth, José Ariel Ruiz Corral, Raymundo Federico Villavicencio García, and Víctor Manuel Rodríguez Moreno. 2023. "Deforestation and Its Effect on Surface Albedo and Weather Patterns" Sustainability 15, no. 15: 11531. https://doi.org/10.3390/su151511531
APA StyleSantos Orozco, D. L., Ruiz Corral, J. A., Villavicencio García, R. F., & Rodríguez Moreno, V. M. (2023). Deforestation and Its Effect on Surface Albedo and Weather Patterns. Sustainability, 15(15), 11531. https://doi.org/10.3390/su151511531


