Article

Spatial Analysis of Territorial Connectivity and Accessibility in the Province of Coclé in Panama

by
Jorge Quijada-Alarcón
1,2,*,
Roberto Rodríguez-Rodríguez
3,
Nicoletta González-Cancelas
4 and
Gabriel Bethancourt-Lasso
1
1
Grupo de Investigación del Transporte y Territorio, Facultad de Ingeniería Civil, Universidad Tecnológica de Panamá, Apdo 0819-07289, Panama
2
Centro de Estudios Multidisciplinarios en Ciencias, Ingeniería y Tecnología AIP (CEMCIT AIP), Apdo 0819-07289, Panama
3
Escuela de Relaciones Internacionales, Facultad de Administración Pública, Universidad de Panamá, Apdo 0824-03366, Panama
4
Department of Transport, Territorial and Urban Planning Engineering, Technical University of Madrid, 28040 Madrid, Spain
*
Author to whom correspondence should be addressed.
Sustainability 2023, 15(15), 11500; https://doi.org/10.3390/su151511500
Submission received: 10 June 2023 / Revised: 12 July 2023 / Accepted: 18 July 2023 / Published: 25 July 2023
(This article belongs to the Section Sustainable Urban and Rural Development)

Abstract

:
The province of Coclé is in the central zone of the Republic of Panama but lacks development of the road network. In order to assess the spatial analysis of territorial accessibility and connectivity, the methodology of this study was divided into three stages: determination of the working scenario, data acquisition, and spatial analyses. The data acquisition includes the GIS development and the field work for GIS validation. Within the province of Coclé, 19.55% of the population lives more than 500 m away from the nearest paved road, with the distance of the town farthest away from the nearest paved road being 36 km, which leads to different levels of accessibility and connectivity in this province. This study of the spatial analysis of connectivity and territorial accessibility sheds light on how the expansion of the road network affects access to health services and education.

1. Introduction

In recent years, the use of Geographic Information Systems (GIS) and spatial analysis have changed the way in which geospatial information is managed and analyzed [1,2]. Spatial analysis is a technique used to quantitatively determine the number of elements that are part of a specific space or area according to their geometric, geographic, and topological properties [3]. One of the activities using spatial analysis is spatial planning [4], which refers to activities carried out to establish policies on natural resource management, environmental protection, and the optimal location of different economic activities [5].
From the positional point of view, land use planning is mainly concerned with establishing the most appropriate use of the spatial position for equipment and roads to be built to find the optimal route that maximizes the potential of the location and minimizes the impact of the inconveniences that arise based on reasons and criteria attached to the conservation of the environment and the economy [6,7]. The environmental criteria measure the negative impact that the route will have on the environment [8,9], and the economic criteria establish the cost of the route and the advantages that the users will have [10].
In the case of facilities and equipment that are specific elements (schools, hospitals, stores, etc.), the main criteria in their spatial planning is focused on maximizing their accessibility according to the volume and distribution of the distances that must be traveled to use them [11], including several multidimensional measures of the road network [12]. Having a more efficient transportation infrastructure has a direct impact on territorial cohesion [13], allowing the population to benefit from better access to jobs, health centers, hospitals, education, and basic services [14].
The use of drones in the spatial analysis of territorial connectivity and accessibility has revolutionized the way geospatial information is collected and evaluated. The strategic use of drones contributes to the sustainable development of cities and provides significant advantages in terms of efficiency and safety, saving time and resources [15]. Drones can also access areas that are difficult to access or dangerous for humans, such as mountainous terrain or areas affected by natural disasters. This enables faster and more accurate evaluation of connectivity and accessibility in emergency situations or remote environments [16]. The use of this technology allows researchers and planners to evaluate the connectivity of geographic areas and the accessibility of their populations more effectively.
In 2019, 80.2% of Panama’s Gross Domestic Product (GDP) was contributed by the provinces of Panama and Colón. The remaining 19.8% of the GDP was contributed by the rest of the provinces. This evidences the need to boost the economic growth of the rest of the country and to enhance the accessibility and connectivity of Panama’s interior provinces to improve their production capacities [17].
For the case study, the aim was to evaluate the spatial distribution of the townships and their facilities in the province of Coclé in Panama according to their territorial connectivity and accessibility. The research questions were: What is the level of connectivity of the province with respect to the development of the paved road network? And what is the level of accessibility of towns to facilities such as schools and healthcare centers? The model developed for the study takes into consideration the specific realities of Coclé Province. The study seeks to understand the ways in which different areas within the province are interconnected and how easily individuals can access various locations. Factors such as the existing road network, public transportation systems, geographical features, and population distribution are likely to influence the patterns of connectivity and accessibility within the area. With all this, the territorial characteristics will be approached in an integral way in the analysis, which is necessary, considering the high positive and negative synergies that are produced between transportation and territorial development [18].
Coclé has two of Panama’s four strategic transportation corridors: the Panama–Azuero Peninsula Corridor, which shares space with the Pacific Corridor in the part corresponding to the Pan-American Highway in the provinces of Coclé and West Panama; here, Penonomé and, to a lesser extent, Antón and Natá, act as service nodes (workshops, warehouses, etc.) [19].
This makes this province an interesting case study, and considering the contribution of logistics and transportation to the economy of the province of Coclé is of utmost importance, as it has great potential due to the location of the most important centers around the Pan-American Highway. Most of the industry’s activities are related to passenger transportation between provinces (buses, cabs) [20].

2. State of Knowledge

2.1. Development of Spatial Analysis through GIS

The field of spatial analysis of territorial connectivity and accessibility has seen significant advancements in recent years. Researchers and scholars have focused on understanding the relationships between geographic spaces, transportation networks, and the ease of movement within and between regions [21]. This area of study plays a crucial role in urban planning, transportation systems, regional development, and overall socio-economic dynamics. Territorial connectivity refers to the existing connection in the direction of travel between destinations. A network that is optimally connected has many intersections as well as roads that allow routes to be maintained directly to their destinations [22].
The state of knowledge in this field encompasses various aspects. One important aspect is the development and application of spatial analysis techniques to assess and quantify connectivity and accessibility. These techniques involve the use of geographic information systems (GIS), network analysis, and mathematical modeling to measure and visualize the flow of people, goods, and information across different spatial units [23].
A GIS allows for the integration of multiple spatial datasets to analyze the influence of various factors on connectivity and accessibility. Researchers can overlay demographic data, land use data, economic data, and other relevant spatial information to identify spatial patterns and relationships [24]. This integration helps in understanding how different variables interact and impact connectivity and accessibility outcomes.
GIS-based spatial analysis also facilitates the visualization of results through maps, charts, and graphs. This visual representation enhances the communication of research findings and supports decision-making processes [25]. This accessibility has contributed to the widespread adoption of GISGISs in various disciplines, including transportation planning, urban studies, environmental analysis, and regional development [26].

2.2. Application of GIS in Connectivity and Accessibility Analysis

Geographic Information Systems (GIS) play a vital role in the spatial analysis of territorial connectivity and accessibility. The GIS is a powerful tool that integrates geographical data, such as maps, satellite imagery, and spatial databases, together with analytical capabilities to capture, store, manipulate, analyze, and visualize spatial information [27].
In the context of connectivity and accessibility analysis, a GIS enables researchers to represent and model transportation networks and infrastructure accurately. By digitizing and georeferencing these features, researchers can create network datasets that capture the spatial relationships and connectivity between different locations [28].
Network analysis tools within a GIS can assess accessibility by considering factors such as distance decay, impedance, and connectivity between origins and destinations [23]. These analyses help identify areas with high accessibility and those that are relatively isolated or poorly connected. A GIS plays a crucial role in the spatial analysis of territorial connectivity and accessibility. It enables the integration and analysis of spatial data, facilitates network analysis, supports the visualization of results, and enhances decision-making processes [29].
Researchers have also explored the factors influencing connectivity and accessibility [30]. Additionally, socio-economic factors, such as population distribution, land use patterns, and economic activities, have been examined to understand their impact on spatial connectivity. Here are some additional factors to consider regarding the factors influencing connectivity and accessibility:
  • Transportation Infrastructure: Well-developed road networks, efficient public transportation systems, and access to airports and seaports contribute to improved connectivity and accessibility within and between regions [31,32].
  • Road Network: Despite not being the sole purpose of the territorial structure, this represents the extent to which relationships and exchanges can take place within it, and its research approach involves not only distinguishing the availability of the network but also establishing its accessibility and connectivity as necessary conditions to achieve differentiation of its objectives and services [33].
  • Road Condition: The condition of the road infrastructure affects the macroscopic parameters of volume, speed, and density considered in the study of traffic phenomena [34,35]; according to the geometric characteristics of the road, the condition of the pavement, and complementary works, users (drivers and pedestrians) will define their preferences when making any trip, which, in turn, will affect the behavior of vehicular and pedestrian flows, the speeds developed by vehicles, and the results of the analysis of the values obtained for the aforementioned parameters [36,37].
  • Road Vulnerability: The susceptibility of the network to certain failures that may lead to a reduction in the level of traffic, service levels, and accessibility conditions [38].
  • Connection Nodes: This is used to understand what levels of connectivity the road network has [39]. A failure on a leg at one node of the network will lead to an increase in travel time due to the need to use alternative routes for optimal routing [40]; this can also cause congestion problems and therefore have consequences in terms of the level of service and travel time [41].
  • Spatial Configuration and Density: The spatial configuration and density of land use patterns play a significant role in connectivity and accessibility. Compact, mixed-use developments with a high density of residential, commercial, and recreational areas tend to enhance accessibility by reducing travel distances and providing proximity to amenities and services [42,43].
  • Socio-economic Factors: Socio-economic factors, such as population distribution, income levels, and employment opportunities, can have a profound impact on connectivity and accessibility. Areas with a higher population density and economic activity tend to have better transportation options and connectivity [44,45,46].
  • Policy and Planning: Government policies and planning decisions play a crucial role in shaping connectivity and accessibility. Transportation planning strategies, land use regulations, and investment in infrastructure projects all impact the connectivity and accessibility levels within a region [47,48].
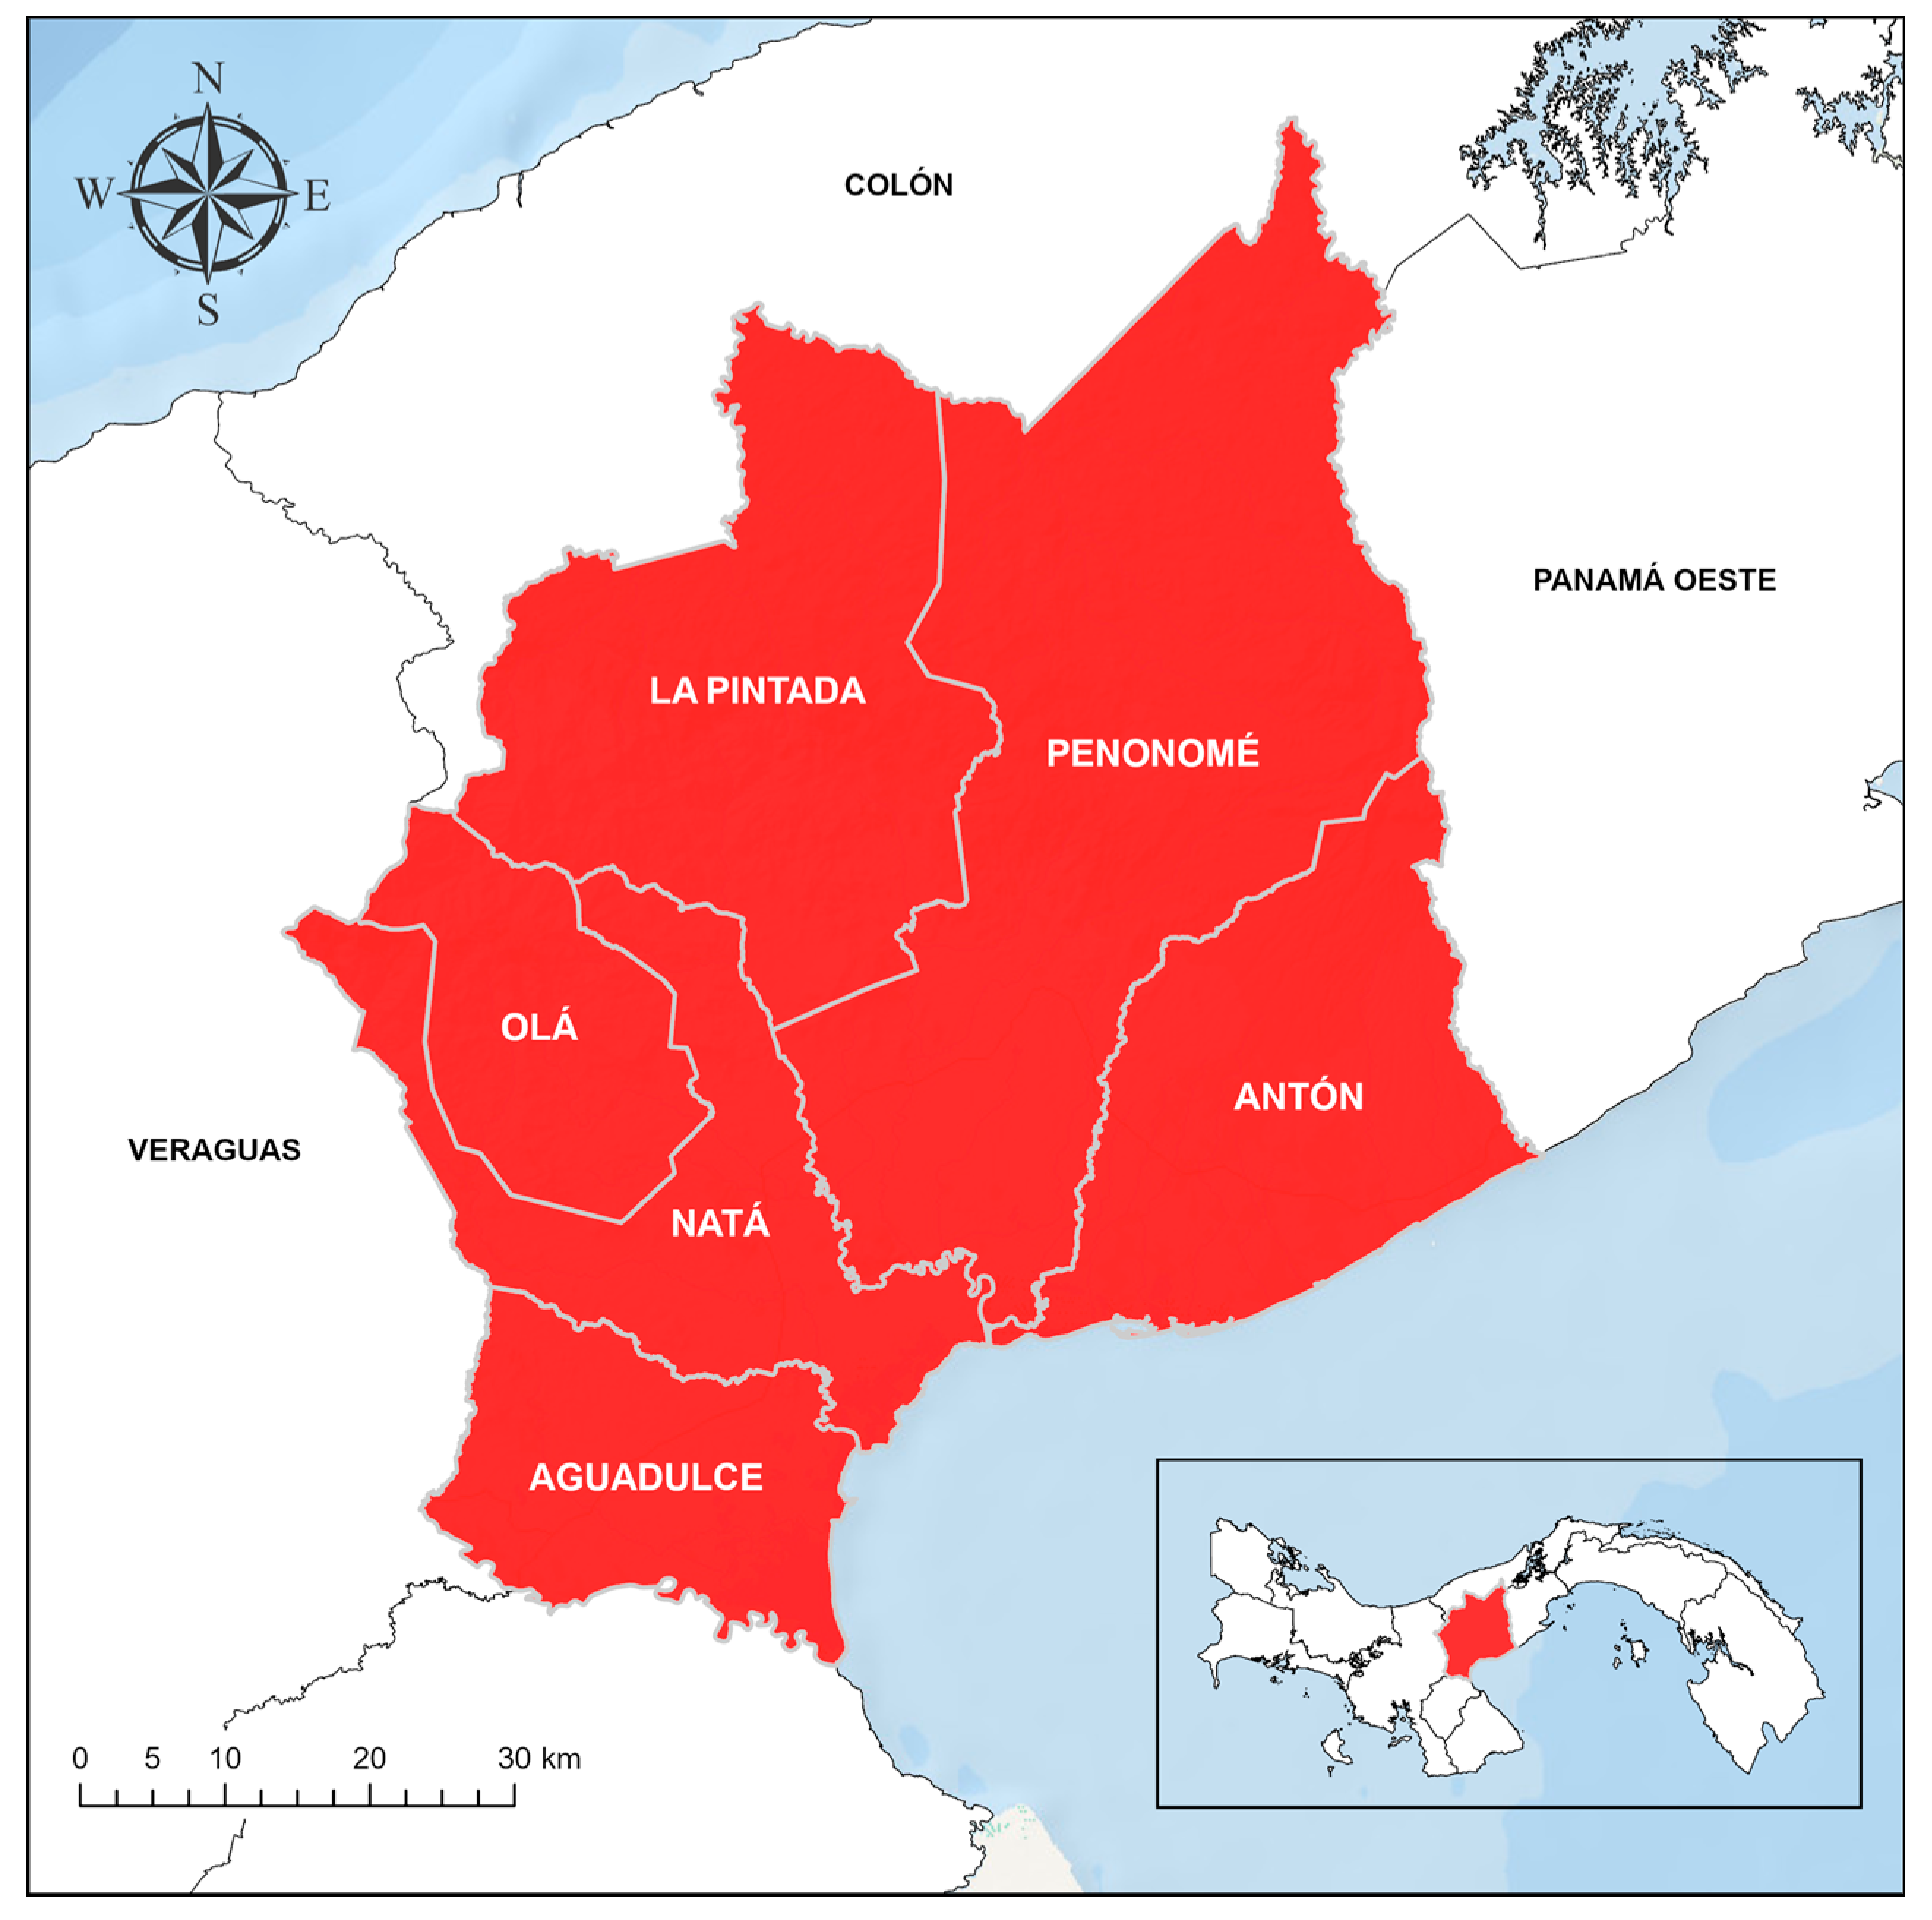
  • By considering these factors, researchers can gain a comprehensive understanding of the dynamics of connectivity and accessibility and inform evidence-based policies and interventions that promote sustainable and equitable development [49,50].
Furthermore, studies have investigated the implications of connectivity and accessibility for various domains. For example, researchers have analyzed the effects of transportation networks on regional development, urban sprawl, environmental sustainability, and social equity. They have also examined the relationships between accessibility and indicators of economic growth, quality of life, and public health [51].
The advancement in technology, particularly in data collection and analysis, has significantly contributed to the state of knowledge in this field [52]. With the availability of big data, remote sensing, and mobile positioning data, researchers can now capture detailed information about travel patterns, traffic flows, and spatial interactions. This has enabled more accurate modeling and simulation of territorial connectivity and accessibility.
However, despite the progress made, there are still challenges and gaps in understanding the complexities of a spatial analysis of territorial connectivity and accessibility [53]. Further research is needed to enhance the integration of spatial analysis techniques with other disciplines, such as transportation planning, urban design, and regional economics. Additionally, there is a need for more comprehensive data collection efforts and for the development of standardized methodologies to facilitate comparative studies across regions.
In conclusion, the state of knowledge on the spatial analysis of territorial connectivity and accessibility is continually evolving. Researchers are making significant contributions to understanding the dynamics of spatial interactions, transportation networks, and their impact on various socio-economic factors. By continuing to explore and address the remaining challenges, this field can provide valuable insights for informed decision making in urban and regional planning, transportation policies, and sustainable development.

3. Case Study

Panama, in recent years, has shown a high level of development in terms of its capacity as a trans-shipment and cargo transportation platform, thanks to the Panama Canal and the ports [54]. However, there are gaps between the development of the area adjacent to the Canal and the rest of the territory, which is affecting the productivity of the Canal’s logistics conglomerate and its capacity to stimulate the growth of productive sectors with an expanded hinterland that allows it to maintain economic growth in logistics and transportation [55]. Thus, developing the Canal’s complementary services could have an impact on increasing productivity and, therefore, help reduce territorial inequalities [56]. In Panama, the main logistics base, in addition to the Canal and adjacent ports, includes the highway network, the railway line linking Panama City to Colon City, and the Tocumen airport [19].
Panama has problems with its land connectivity, which impacts the socio-economic development of areas with growth potential, particularly the agricultural and tourism sectors [55]. This lack of connectivity represents a barrier to the integration of the economy beyond the areas influenced by the Panama Canal, contributing to an imbalance in the rest of the country’s regions.
The province of Coclé is in the central zone of the Republic of Panama, between 08°05′ and 09°03′ north latitude and 80°02′ and 80°50′ west longitude (Figure 1). The north of the province is crossed by the central mountain range of Panama, with steep elevations of volcanic origin ranging from 200 m above sea level to 1600 m above sea level; to the south is a great plain that extends to the coast. Its climate is tropical and rainy, with an annual rainfall of 2500 mm, although in some points in the north of the province, this reaches 4000 mm. It is politically divided into six districts and 53 townships. It has a territorial extension of approximately 4927 km2 [57] and had an estimated population of 266,969 inhabitants in 2020, which represented 6.2% of the total inhabitants of the Panamanian territory [58].
The province of Coclé contributed 2.48% to Panama’s GDP in 2019, with agriculture, livestock, hunting, forestry, transportation, storage, and communications among its most important sectors, which together accounted for 19.4% of its total contribution. Previous studies also indicate that the province of Coclé shares logistical characteristics in terms of its territorial and socio-economic composition with the provinces of Chiriquí and West Panama [59].
The production system in the province of Coclé is very diverse, with mining operations (in the province of Colón, but accessible from Coclé), energy infrastructure such as wind and solar energy, tourism facilities (mainly in Río Hato), and those related to agri-food products (salt mines, aquaculture facilities, agro-industrial or grain processing plants) being identified as productive facilities [20].

4. Methodology

The methodology of this study was divided into three stages: determination of the working scenario, data acquisition, and spatial analysis (Figure 2). The data acquisition includes the GIS development and the field work for GIS validation. The spatial analysis includes the distribution of population size and facilities, territorial connectivity, and territorial accessibility.

4.1. Determination of the Working Scenario

The working scenario consists of identifying the state of the province of Coclé according to its accessibility and territorial connectivity, and then, based on the information gathered, carrying out the different spatial analyses following the division of the territory into quadrants.

4.2. Data Acquisition

The acquisition of the working data was carried out through two intrinsically related processes: the development of the GIS, in which the geospatial information of the study will be contained, and the validation of the field data, which is necessary to corroborate that the information collected in the geodatabase is correct.

4.2.1. GIS Development

For the development of the GIS, a geodatabase was created containing specific elements that were georeferenced and quantified, such as population centers and facilities such as elementary schools, high schools, and public healthcare centers. Two types of healthcare centers were located: health centers and hospitals. In Panama, health centers are places where basic outpatient medical care is provided, and hospitals are places where all types of medical procedures are performed. Linear elements such as the paved and unpaved road networks were digitized. Polygonal elements were also added, which were obtained from free-access sites of governmental institutions. In addition, the raster elements from the orthomosaics generated through the images taken by the drone were added. Thus, with all these data, we have a fairly robust geodatabase of the spatial elements found all over the province.

4.2.2. Field Work for GIS Validation

In order to validate the GIS, field work was carried out to corroborate that the digitized information was correct and to update it if necessary. This field work included ground-measurement equipment such as total stations, GPS antennas and a fixed-wing drone. The fixed-wing drone used was the Swiss-made Wingtra One Gen II (Figure 3). This drone is equipped with a 42-megapixel Sony RX1R II camera that provides high resolution images, with a ground sample distance of up to 0.7 cm/px and a maximum coverage of up to 210 hectares [60].
The ground sampling distance (GSD) describes the distance between the center point of two consecutive pixels [61,62,63]. To perform the drone survey, optimal weather conditions must be considered because they are linked to the quality of the results [64].
The drone survey was performed by the kinematic post-processing method (PPK): this is a positioning process in which signals from a mobile GNSS receiver device [65] can be adjusted using a reference station after the data have been collected and stored [66]. Unlike static or rapid observations, PPK uses less time [67]. The results obtained for the horizontal coordinates are between 1 cm and 3 cm; for vertical coordinates, they are between 1 cm and 10 cm [68].
Once the field data were collected, they were processed through different specialized programs, which allowed photogrammetric and vector products to be obtained. These programs were Trimble Business Center (TBC) [69], WingtraHub, Agisoft Metashape [70], and ArcGIS Pro [71]. The validation process consisted of verification using the images taken with the drone (Figure 4) of GIS elements such as (a) paved roads and unpaved roads, (b) urban areas, (c) elementary schools, (d) high schools, (e) healthcare centers, and (f) hospitals.

4.3. Spatial Analysis

The spatial analysis of this article was carried out in such a way that the first approach was the division of the territory into quadrants. From there, we proceeded to analyze the spatial distribution of the population and the size of these in the different quadrants. Subsequently, connectivity and accessibility were analyzed in general and by quadrants.

4.3.1. Territorial Quadrants

The spatial analyses shown in this article were carried out for the entire province of Coclé. In addition, the territory was divided into four zones, called quadrants, based on the differences in territorial development observed throughout the territory and that show different indicators for population density, length of paved roads, proximity to the paved network, and access to facilities. The capital of the province, which is the city of Penonomé, was taken as the origin, thanks to its geographical position that places it right in the center of the province. Another parameter for the assignment of the quadrants was that they were distributed along the Pan-American Highway. Finally, a quadrant number was assigned to each one on the Cartesian plane.

4.3.2. Spatial Distribution of Population Size and Facilities

The size and spatial distribution of the population are essential considerations for social, economic, and environmental applications [72]. The estimation of the number of inhabitants per village was carried out following the estimation parameters used by the National Institute of Statistics and Census of the Republic of Panama in 2020 [58]. Also, their facilities were georeferenced.

4.3.3. Spatial Analysis of Territorial Connectivity Based on the Road Network Development

For the purposes of this research, territorial connectivity is expressed in terms of the development of the paved network and the nodes that connect them [14,73,74]. The existing road networks within the province were digitized using ArcGIS Pro-software. Then, we proceeded to calculate their total length. For the analyses presented in this article, the road network was divided into two elements: paved roads and unpaved roads. Unpaved roads are all roads with a dirt surface. In addition, connection nodes were geolocated between the main paved roads in the province. The assignment of these nodes was based on a node being placed at each intersection where different paved roads were connected. The validation of the nodes was made on the basis of the images taken by the drone and the field work conducted.

4.3.4. Spatial Analysis of Territorial Accessibility

Accessibility is a multidimensional concept that integrates several measures of the road network. For this research, we define accessibility in terms of the shortest distance between a town and the nearest paved network, schools, and hospitals [14,75,76].
The spatial analysis of territorial accessibility was performed by measuring the distance of the towns from the paved road network by creating buffers every 500 m. The geographic coordinates of the towns and the facilities (primary schools, secondary schools, health centers, and hospitals) were used to assemble a desire line matrix [77], which shows the closest distance of the facilities to the centroids of the towns. With this, we can measure how accessible it is for the inhabitants to reach these sites.

5. Results

5.1. Territorial Quadrants

First, general information about the province and its inhabitants was obtained. The province has a total area of 4927 km2, a population of 266,969, and a population density of 54 people per square kilometer distributed across 1240 towns. As indicated in the methodology, the province of Coclé was divided into quadrants in order to obtain a better understanding of the territory. Figure 5 shows the province of Coclé divided into quadrants, where the territory is analyzed starting from the main road (Pan-American Highway). The origin of the quadrants is Penonomé, which is the capital of the province. Figure 6 shows a simplified schema of the division by quadrants of the province of Coclé.

5.2. Population Size and Their Spatial Distribution

As a result of this analysis, a visualization was made of the spatial location of the towns and the number of inhabitants of the province. As shown in Figure 7, the towns with the largest size are those with the largest population. All the towns with more than 5001 inhabitants are towns adjacent to the Pan-American Highway. Table 1 shows the general data of the province of Coclé by quadrants.

5.3. Spatial Analysis of Territorial Connectivity

The road network of the province of Coclé has 1636.4 km of paved roads and 5813.9 km of unpaved roads. The paved network of the province of Coclé has 169 nodes, which means that, on average, there is a node every 9.68 km (Figure 8). The roads with the highest number of connection nodes are the roads in the large population centers. In addition, there are 63 nodes along the Pan-American Highway, representing 37.28% of the network connectivity. Table 2 shows the values per kilometer for paved roads and unpaved roads by quadrant.

5.4. Spatial Analysis of Territorial Accessibility

Figure 9 shows the spatial analysis of territorial accessibility for the population centers in relation to the nearest paved network. In the province of Coclé, 80.45% of the population lives less than 500 m from the paved network. When analyzing by quartiles, the population living less than 500 m away is 67.95% (first quadrant), 81.20% (second quadrant), 98.98% (third quadrant) and 95.61% (fourth quadrant). The towns farthest from the paved network are located at 36.0 km (first quadrant), 15.5 km (second quadrant), 10.5 km (third quadrant) and 3.5 km (fourth quadrant).
Figure 10 shows the spatial distribution of the 19.55% of the population of Coclé Province that lives more than 500 m from the paved network. The first and second quadrants contain the mountainous zone, which has led to a greater development of the paved network and a greater dispersion of the population compared with quadrants 3 and 4, which are very close to the coast and present little variation in their terrain.
The capital of the province of Coclé is the city of Penonomé, and it has five elementary schools, three high schools, one healthcare center and one hospital. Penonomé is the city in the province with the best accessibility to basic facilities; therefore, this area is excluded from the analysis of accessibility to educational centers and hospitals.
Figure 11a shows that in the province of Coclé (excluding the City of Penonomé), 25% of the population lives 1.0 km from the nearest health center, 50% of the population lives 3.80 km away, and the most distant population is 46.4 km away. If analyzed by quadrant, the towns farthest from the health centers are located at 46.4 km (first quadrant), 22.2 km (second quadrant), 14.9 km (third quadrant) and 17.3 km (fourth quadrant).
Figure 11b shows that in Coclé Province (excluding the city of Penonomé), 25% of the population lives 7.2 km from the nearest hospital, 50% of the population lives 16.1 km away, and the most distant population is 61.8 km away. If analyzed by quadrant, the towns farthest from the health centers are located at 61.8 km (first quadrant), 45.7 (second quadrant), 18.7 km (third quadrant), and 35.3 km (fourth quadrant).
Figure 12a shows that in the province of Coclé (excluding the City of Penonomé), 25% of the population lives 0.2 km from the nearest elementary school, 50% of the population lives 0.4 km away, and the most distant population is 10.9 km away. If analyzed by quadrant, the towns farthest from the primary schools are located at 4.5 km (first quadrant), 4.8 km (second quadrant), 10.9 km (third quadrant), and 9.2 km (fourth quadrant).
Figure 12b shows that in Coclé Province (excluding the city of Penonomé), 25% of the population lives 1.3 km from the nearest secondary school, 50% of the population lives 3.6 km away, and the most distant population is 41.6 km away. If analyzed by quadrant, the towns farthest from the secondary schools are located at 41.6 km (first quadrant), 19.4 km (second quadrant), 15.3 km (third quadrant), and 13.7 km (fourth quadrant).

6. Discussion and Conclusions

The results of this research provide important information to answer the main questions about the impact of the levels of connectivity with respect to the paved road network and the levels of accessibility to facilities (schools, healthcare centers) in the province of Coclé. The spatial analysis was approached by dividing the province into four areas known as quadrants and shows the impact that remoteness to facilities has on the populations and exposes them to social risk. The first quadrant of the province of Coclé exhibits higher connectivity due to its large number of connection nodes. Approximately every 8 km of paved road has a node connection. The second quadrant stands out for having the highest proportion of paved roads, reaching 35.48% of the total paved roads of the province. There is also a high percentage of unpaved roads, representing 35.32% of the total unpaved roads of the province. This is due to the fact that part of the quadrant is located in the central mountain range of Panama, which makes it a mountainous and difficult-to-access area. The third quadrant, although covering only 13.01% of the provincial territory, is the second smallest in extension. However, it is the most densely populated quadrant, with a density of 66 inhabitants per square kilometer. It also has the lowest number of connection nodes, with only 19 nodes, which means that it is necessary to travel about 13 km to find a node connection in this quadrant. The fourth quadrant is the smallest in terms of extension, covering only 6.65% of the territory. Therefore, it has the smallest number of facilities and population. Nevertheless, it stands out for having the best ratio of paved to unpaved roads, as well as the second-best connection between nodes, with nodes every 8.32 km. This is attributed to the fact that it is the quadrant in which the most tourist activity occurs.
Accessibility and connectivity in the province of Coclé present characteristics identified in previous studies, such as the following: the configuration of the transportation infrastructure is a critical factor in determining accessibility [78]; the core of the largest cities is surrounded by places with the highest level of accessibility, as shown by the growth of the network [12]; the road infrastructure is not homogeneous between towns [79]; and the Pan-American Highway is an important dynamic axis [80] that shapes accessibility and connectivity in Coclé.
The present research considered 1240 towns and their centroids in the analysis of accessibility to schools and healthcare centers. However, other studies have analyzed accessibility to schools by dividing large territories into zones [81], districts, or similar territorial divisions [82], and in the case of cities (smaller territories), the analysis has characterized the distance between residential areas and schools [83]. The scale of analysis, whether by zones (for large territories) or by residential areas in cities, has also been addressed in studies such as [84,85], which analyzed accessibility from different points in the city to different healthcare centers.
The study of Panama and its provinces is important in the context of spatial analysis due to the particular characteristics of its territorial and economic development that have been historically conditioned by the Panama Canal, which impacted the urban and productive configuration of the country. This situation is still reflected today in the contribution of the Canal and its activities to national development; its contribution in 2017 was 6.8% of the GDP, and in its international projection, its activity was associated with 6% of world trade [86]. In particular, the Panama Canal has divided the country into differentiable zones from the point of view of territorial development: The first is the interoceanic zone adjacent to the Canal, located within the provinces of Panama and Colon, where the greatest economic activity related to service activities, Pacific and Atlantic port activities, the country’s main international airport, the Panama Canal Railway, and the greatest urban development are concentrated, resulting in these provinces accounting for 76.6% of the GDP [87]. In contrast, the rest of the country, which includes the province of Coclé, shows a logistical dualization [88], where the presence of paved and unpaved roads defines territorial development [59], given the absence of development of other logistical infrastructure such as ports, and where less economic development is observed, contributing 23.4% of the GDP by 2020 [87].
In this sense, the spatial analysis of the province of Coclé, through the implementation of quadrants for the spatial analysis of the territory, allowed for a much more detailed analysis of the different realities. However, the applicability of this methodology in other areas of the country remains to be seen since the geographic distribution of each province is different. In addition to this, the methodology presented shows how the integration of GIS tools with other technologies, which, in our case, is the use of drones, enhances the framework, creating a totally synergistic environment when processing data and obtaining results.
The scientific evidence generated by this research shows how the Pan-American Highway directly influences the growth of the towns; an example of this is that seven of the eight towns with the highest number of inhabitants are located adjacent to the highway. Another piece of evidence that should be highlighted is that accessibility levels in the province are quite acceptable due to the fact that 80.45% of the population is within 500 m away from the paved road network. However, the other 19.55% of the population with accessibility problems due to their remoteness is in a situation of high social risk. It is worth mentioning the case of the town of Jobo de Río Indio, which is the most remote town, located 36 km from the paved road network and even further away from healthcare centers: 46 km from a healthcare center and 61 km from the nearest hospital.
A limiting factor in this research is that in Panama, there is no updated public database on geospatial information that can be used as a reference. Precisely for this reason of not having information on connectivity and accessibility, we see the need to apply this methodology to other provinces or regions of Panama, such as the Interoceanic Zone around the Panama Canal, which, in terms of logistical development, is the area with the main ports and airports.
In conclusion, it can be said that the model developed for the study of the spatial analysis of connectivity and territorial accessibility in the province of Coclé provides information on how the development of the road network affects the levels of connectivity in the different areas of the province. It shows the level of accessibility to schools and health centers, which allows for the identification of the localities that are at greater social risk due to their remoteness from these facilities. It has also generated sufficient evidence for decision makers to develop more effective strategies to address territorial connectivity and accessibility, thus facilitating the improvement of transportation infrastructure and promoting sustainable growth.

Author Contributions

Conceptualization, J.Q.-A., R.R.-R. and G.B.-L.; Funding acquisition, J.Q.-A.; Investigation, J.Q.-A., R.R.-R., N.G.-C. and G.B.-L.; Methodology, J.Q.-A., R.R.-R. and N.G.-C.; Supervision, J.Q.-A.; Writing—original draft, J.Q.-A., R.R.-R., N.G.-C. and G.B.-L.; Writing—review and editing, J.Q.-A. and N.G.-C.; Visualization, J.Q.-A. and G.B.-L. All authors have read and agreed to the published version of the manuscript.

Funding

Funding was provided by the Secretaría Nacional de Ciencia, Tecnología e Innovación. (SENACYT) de la República de Panamá, Contrato por Merito No. 150-2021.

Institutional Review Board Statement

Not applicable.

Informed Consent Statement

Not applicable.

Data Availability Statement

Not applicable.

Conflicts of Interest

The authors declare no conflict of interest.

References

  1. Anselin, L. The Future of Spatial Analysis in the Social Sciences. Geogr. Inf. Sci. 1999, 5, 67–76. [Google Scholar] [CrossRef]
  2. Malczewski, J. GIS-Based Land-Use Suitability Analysis: A Critical Overview. Prog. Plann. 2004, 62, 3–65. [Google Scholar] [CrossRef]
  3. Sahin, P. Analysis of Walkable Street Networks by Using the Space Syntax and GIS Techniques: A Case Study of Çankırı City. ISPRS Int. J. Geo-Inf. 2023, 12, 216. [Google Scholar] [CrossRef]
  4. Bey, A.; Díaz, A.S.P.; Maniatis, D.; Marchi, G.; Mollicone, D.; Ricci, S.; Bastin, J.F.; Moore, R.; Federici, S.; Rezende, M.; et al. Collect Earth: Land Use and Land Cover Assessment through Augmented Visual Interpretation. Remote Sens. 2016, 8, 807. [Google Scholar] [CrossRef] [Green Version]
  5. de Álvarez Montero, J.J.; Eslava Sarmiento, A. La logística Urbana, La Ciudad logística Y El Ordenamiento Territorial logístico. RTO 2017, 4, 21–40. Available online: https://revistas.sena.edu.co/index.php/RETO/article/view/605 (accessed on 30 May 2023).
  6. Mosadeghi, R.; Warnken, J.; Tomlinson, R.; Mirfenderesk, H. Comparison of Fuzzy-AHP and AHP in a Spatial Multi-Criteria Decision Making Model for Urban Land-Use Planning. Comput. Environ. Urban Syst. 2015, 49, 54–65. [Google Scholar] [CrossRef] [Green Version]
  7. Patino, J.E.; Duque, J.C. A Review of Regional Science Applications of Satellite Remote Sensing in Urban Settings. Comput. Environ. Urban Syst. 2013, 37, 1–17. [Google Scholar] [CrossRef]
  8. Jiang, R.; Wu, P. Estimation of Environmental Impacts of Roads through Life Cycle Assessment: A Critical Review and Future Directions. Transp. Res. D Transp. Environ. 2019, 77, 148–163. [Google Scholar] [CrossRef]
  9. Chen, N.; Cheng, G.; Yang, J.; Ding, H.; He, S. Evaluation of Urban Ecological Environment Quality Based on Improved RSEI and Driving Factors Analysis. Sustainability 2023, 15, 8464. [Google Scholar] [CrossRef]
  10. Iacono, M.; Levinson, D. The Economic Impact of Upgrading Roads; Minnesota Department of Transportation Research Services Section: St. Paul, MN, USA, 2009; pp. 1–75. Available online: https://www.lrrb.org/pdf/200916.pdf (accessed on 2 June 2023).
  11. Van Heerden, Q.; Karsten, C.; Holloway, J.; Petzer, E.; Burger, P.; Mans, G. Accessibility, affordability, and equity in long-term spatial planning: Perspectives from a developing country. Transp. Policy 2022, 120, 104–119. [Google Scholar]
  12. Chen, S.; Claramunt, C.; Ray, C. A Spatio-Temporal Modelling Approach for the Study of the Connectivity and Accessibility of the Guangzhou Metropolitan Network. J. Transp. Geogr. 2014, 36, 12–23. [Google Scholar] [CrossRef] [Green Version]
  13. Medeiros, E. Territorial Cohesion: An EU Concept. Eur. J. Spat. Dev. 2016, 1, 1–30. [Google Scholar]
  14. Calvo-Poyo, F.; Moya-Gómez, B.; García Palomares, J.C.; Gutiérrez Puebla, J. Efectos Sobre La Accesibilidad de La Red de Autovías Planeada En El Plan de Infraestructuras Para La Sostenibilidad Del Transporte En Andalucía (España). Cuad. Geogr. 2019, 58, 229–252. [Google Scholar] [CrossRef]
  15. Mohd Noor, N.; Abdullah, A.; Hashim, M. Remote Sensing UAV/Drones and Its Applications for Urban Areas: A Review. In IOP Conference Series: Earth and Environmental Science, Proceedings of the 9th IGRSM International Conference and Exhibition on Geospatial & Remote Sensing (IGRSM 2018), Kuala Lumpur, Malaysia, 24–25 April 2018; Institute of Physics Publishing: Bristol, UK, 2018; Volume 169. [Google Scholar] [CrossRef]
  16. Grubesic, T.H.; Nelson, J.R. UAVs and Urban Spatial Analysis; Springer: Cham, Switzerland, 2019; pp. 1–8. [Google Scholar] [CrossRef]
  17. Ministerio de Economía y Finanzas de la República de Panamá. Informe Económico y Social 2019. 2019. Available online: https://www.mef.gob.pa/wp-content/uploads/2023/05/MEF-DAES-Informe-Economico-y-Social-anual-2019.pdf (accessed on 2 June 2023).
  18. Vlčková, V.; Votruba, Z. The Synergy Transportation. Trans. Transp. Sci. 2010, 3, 179–186. [Google Scholar] [CrossRef] [Green Version]
  19. AC&A; Cenit. Análisis de Inversiones en el Sector Transporte Terrestre Interurbano Latinoamericano a 2040; CAF: Caracas, Venezuela, 2020; Available online: https://scioteca.caf.com/handle/123456789/1537 (accessed on 2 June 2023).
  20. Requejo Liberal, J.; Hernández Vergues, A.; Morilla Maestre, A.; Guerrero Sosa, J.; Macías Vivero, J.; Alonso Blanco, A.; Garrido Martín, A.; Rodríguez, F.; Barría, C.; Medina, M.; et al. Visión 2050 Diagnóstico. 2018. Available online: https://www.senacyt.gob.pa/publicaciones/?publicacion=vision-2050-cocle-diagnostico (accessed on 2 June 2023).
  21. Ito, M.; Okabe, D.; Anderson, K.; Research, I. Portable Objects in Three Global Citties: The Personalization of Urban Places; Routledge: London, UK, 2009. [Google Scholar]
  22. Labi, S.; Faiz, A.; Saeed, T.U.; Alabi, B.N.T.; Woldemariam, W. Connectivity, Accessibility, and Mobility Relationships in the Context of Low-Volume Road Networks. In Transportation Research Record; SAGE Publications Ltd.: Thousand Oaks, CA, USA, 2019; Volume 2673, pp. 717–727. [Google Scholar] [CrossRef]
  23. Abousaeidi, M.; Fauzi, R.; Muhamad, R. Geographic Information System (GIS) Modeling Approach to Determine the Fastest Delivery Routes. Saudi. J. Biol. Sci. 2016, 23, 555–564. [Google Scholar] [CrossRef] [Green Version]
  24. Cebrián Abellán, F.; Andrés López, G.; Bellet Sanfeliu, C. The Use of GIS and Multicriteria Techniques for the Socio-Spatial Analysis of Urban Areas in Medium-Sized Spanish Cities. Land 2023, 12, 1115. [Google Scholar] [CrossRef]
  25. Yang, Y.; Zhou, Q.; Chen, K. Multiagent-Based Modeling and Simulation of a Coal Multimodal Transport System. IEEE Access 2022, 10, 65873–65885. [Google Scholar] [CrossRef]
  26. Dhamaniya, A.; Sonu, M.; Krishnanunni, M.; Praveen, P.; Jaijin, A. Development of Web Based Road Accident Data Management System in GIS Environment: A Case Study. J. Indian Soc. Remote Sens. 2016, 44, 789–796. [Google Scholar] [CrossRef]
  27. Sreelekha, M.G.; Krishnamurthy, K.; Anjaneyulu, M.V.L.R. Interaction between Road Network Connectivity and Spatial Pattern. Procedia Technol. 2016, 24, 131–139. [Google Scholar] [CrossRef] [Green Version]
  28. Saidallah, M.; El Fergougui, A.; Elalaoui, A.E. A Comparative Study of Urban Road Traffic Simulators. In MATEC Web of Conferences, Proceedings of the 2016 5th International Conference on Transportation and Traffic Engineering (ICTTE 2016), Lucerne, Switzerland, 6–10 July 2016; EDP Sciences: Les Ulis, France, 2016; Volume 81. [Google Scholar] [CrossRef]
  29. Akberdina, V.; Kozonogova, E.; Dubrovskaya, Y. Digital Platforms for Regional Economic Research: A Review and Methodology Proposal. R-Economy 2023, 9, 52–72. [Google Scholar] [CrossRef]
  30. Menhas, R.; Mahmood, S.; Tanchangya, P.; Safdar, M.N.; Hussain, S. Sustainable Development under Belt and Road Initiative: A Case Study of China-Pakistan Economic Corridor’s Socio-Economic Impact on Pakistan. Sustainability 2019, 11, 6143. [Google Scholar] [CrossRef] [Green Version]
  31. Shi, F. Research on Accessibility and Equity of Urban Transport Based on Multisource Big Data. J. Adv. Transp. 2021, 2021, 1103331. [Google Scholar] [CrossRef]
  32. Jin, F.; Chen, Z. Evolution of Transportation in China since Reform and Opening up: Patterns and Principles. J. Geogr. Sci. 2019, 29, 1731–1757. [Google Scholar] [CrossRef] [Green Version]
  33. Bautista, A.F. Análisis de Accesibilidad y Conectividad de La Red Vial Intermunicipal En El Micro-Sistema Regional de La Provincia Centro En Boyacá, Colombia. Perspect. Geogr. 2018, 23, 123–141. [Google Scholar] [CrossRef]
  34. Leonardi, G.; Barrile, V.; Palamara, R.; Suraci, F.; Candela, G. 3D Mapping of Pavement Distresses Using an Unmanned Aerial Vehicle (UAV) System. In Smart Innovation, Systems and Technologies; Springer Science and Business Media: Berlin, Germany, 2019; Volume 101, pp. 164–171. [Google Scholar] [CrossRef]
  35. Droj, G.; Droj, L.; Badea, A.C. GIS-Based Survey over the Public Transport Strategy: An Instrument for Economic and Sustainable Urban Traffic Planning. ISPRS Int. J. Geoinf. 2022, 11, 16. [Google Scholar] [CrossRef]
  36. Quintero González, J. Road Inventories and the Road Net Categorization in the Traffic and Transport Engineering Studies. Rev. Fac. Ing. UPTC I Semest. 2011, 20, 65–77. Available online: https://revistas.uptc.edu.co/index.php/ingenieria/article/view/1413 (accessed on 2 June 2023).
  37. Yang, X.; Yuan, Y.; Liu, Z. Short-Term Traffic Speed Prediction of Urban Road with Multi-Source Data. IEEE Access 2020, 8, 87541–87551. [Google Scholar] [CrossRef]
  38. Berdica, K.; Mattsson, L.G. Vulnerability: A Model-Based Case Study of the Road Network in Stockholm. In Advances in Spatial Science; Springer International Publishing: Cham, Switzerland, 2007; pp. 81–106. [Google Scholar] [CrossRef]
  39. Mishra, S.; Welch, T.F.; Jha, M.K. Performance Indicators for Public Transit Connectivity in Multi-Modal Transportation Networks. Transp. Res. Part A Policy Pract. 2012, 46, 1066–1085. [Google Scholar]
  40. Jenelius, E.; Mattsson, L.G. Road Network Vulnerability Analysis: Conceptualization, Implementation and Application. Comput. Environ. Urban Syst. 2015, 49, 136–147. [Google Scholar] [CrossRef]
  41. Proffitt, D.G.; Bartholomew, K.; Ewing, R.; Miller, H.J. Accessibility Planning in American Metropolitan Areas: Are We There Yet? Urban Stud. 2019, 56, 167–192. [Google Scholar] [CrossRef] [Green Version]
  42. Li, M.; Stein, A.; Bijker, W.; Zhan, Q. Urban Land Use Extraction from Very High Resolution Remote Sensing Imagery Using a Bayesian Network. ISPRS J. Photogramm. Remote Sens. 2016, 122, 192–205. [Google Scholar] [CrossRef]
  43. Soltani, S.; Gu, N.; Ochoa, J.J.; Sivam, A. The Role of Spatial Configuration in Moderating the Relationship between Social Sustainability and Urban Density. Cities 2022, 121, 103519. [Google Scholar] [CrossRef]
  44. Zhao, C.; Nielsen, T.A.S.; Olafsson, A.S.; Carstensen, T.A.; Meng, X. Urban Form, Demographic and Socio-Economic Correlates of Walking, Cycling, and e-Biking: Evidence from Eight Neighborhoods in Beijing. Transp. Policy 2018, 64, 102–112. [Google Scholar] [CrossRef]
  45. Salemink, K.; Strijker, D.; Bosworth, G. Rural Development in the Digital Age: A Systematic Literature Review on Unequal ICT Availability, Adoption, and Use in Rural Areas. J. Rural. Stud. 2017, 54, 360–371. [Google Scholar] [CrossRef]
  46. Christodoulou, A.; Christidis, P. Bridges across Borders: A Clustering Approach to Support EU Regional Policy. J. Transp. Geogr. 2020, 83, 102666. [Google Scholar] [CrossRef]
  47. Attia, S.; Ibrahim, A.A.A.M. Accessible and Inclusive Public Space: The Regeneration of Waterfront in Informal Areas. Urban Res. Pract. 2018, 11, 314–337. [Google Scholar] [CrossRef]
  48. Rokem, J.; Vaughan, L. Geographies of Ethnic Segregation in Stockholm: The Role of Mobility and Co-Presence in Shaping the ‘Diverse’ City. Urban Stud. 2019, 56, 2426–2446. [Google Scholar] [CrossRef] [Green Version]
  49. Porru, S.; Misso, F.E.; Pani, F.E.; Repetto, C. Smart Mobility and Public Transport: Opportunities and Challenges in Rural and Urban Areas. J. Traffic Transp. Eng. 2020, 7, 88–97. [Google Scholar] [CrossRef]
  50. Mascarenhas, A.; Ramos, T.B.; Nunes, L. Developing an Integrated Approach for the Strategic Monitoring of Regional Spatial Plans. Land Use Policy 2012, 29, 641–651. [Google Scholar] [CrossRef]
  51. Bueno-Suárez, C.; Coq-Huelva, D. Sustaining What Is Unsustainable: A Review of Urban Sprawl and Urban Socio-Environmental Policies in North America and Western Europe. Sustainability 2020, 12, 4445. [Google Scholar] [CrossRef]
  52. Yu, M.; Yang, C.; Li, Y. Big Data in Natural Disaster Management: A Review. Geosciences 2018, 8, 165. [Google Scholar] [CrossRef] [Green Version]
  53. Deng, X.; Jin, G.; He, S.; Wang, C.; Li, Z.; Wang, Z.; Song, M.; Yang, Q.; Zhang, A.; Chen, J. Research Progress and Prospect on Development Geography. J. Geogr. Sci. 2021, 31, 437–455. [Google Scholar] [CrossRef]
  54. Bhadury, J. Panama Canal Expansion and Its Impact on East and Gulf Coast Ports of U.S.A. Marit. Policy Manag. 2016, 43, 928–944. [Google Scholar] [CrossRef]
  55. Granada Garcés, I.; Fioravanti, R.; Deambrosi, S.; Clara Gutiérrez, M.; Caldo, A.; Benavides, J.; Martínez, M.; Caldo, C.V.; Benavides, A.V.; Martínez, J., VII; et al. Evolución Del Sector Logístico y Apoyo Del BID En Panamá; Banco de Desarrollo Interamericano: Washington, DC, USA, 2018. [Google Scholar] [CrossRef]
  56. Porcel, M.R.; Fioravanti, R.; Martínez, M. Conectividad Vial y Su Contribución al Sistema Logístico de Panamá División de Transporte; Banco Interamericano de Desarrollo (BID): Washington, DC, USA, 2019. [Google Scholar] [CrossRef]
  57. Caja de Seguro Social. Análisis de Situación de la Prestación de la Salud y Económicas de la Caja de Seguro Social Provincia de Coclé. 2021. Available online: https://planificacion.css.gob.pa/wp-content/uploads/2021/12/Ana%CC%81lisis-de-Situacio%CC%81n-Cocle%CC%81.pdf (accessed on 2 June 2023).
  58. Instituto Nacional de Estadística y Censo. Estimación y Proyección de la Población Total de la Provincia de Coclé, Según Distrito, Co-rregimiento y Sexo: Años 2010–2020. 2010. Available online: https://www.inec.gob.pa/archivos/P5561Cuadro%2079.pdf (accessed on 2 June 2023).
  59. Quijada-Alarcon, J.; González Cancelas, N.; Camarero Orive, A.; Soler Flores, F. Logistic Groups in the Republic of Panama. J. Maps 2016, 12, 1248–1252. [Google Scholar] [CrossRef]
  60. Wingtra. WingtraOne Gen II Technical Specifications. 2023. Available online: https://wingtra.com/wp-content/uploads/Wingtra-Technical-Specifications.pdf (accessed on 2 June 2023).
  61. Felipe-García, B.; Hernández-López, D.; Lerma, J.L. Analysis of the Ground Sample Distance on Large Photogrammetric Surveys. Appl. Geomat. 2012, 4, 231–244. [Google Scholar] [CrossRef]
  62. Driggers, R.; Aghera, S.; Richardson, P.; Miller, B.; Doe, J.; Robinson, A.; Krapels, K.; Murrill, S. MWIR Persistent Surveillance Performance for Human and Vehicle Backtracking as a Function of Ground Sample Distance and Revisit Rate. In Infrared Imaging Systems: Design, Analysis, Modeling, and Testing XIX, Proceedings of the Spie Defense and Security Symposium, Orlando, FL, USA, 16–20 March 2008; SPIE: Stockholm, Sweden, 2008; Volume 6941, p. 69410Q. [Google Scholar] [CrossRef]
  63. Bartlett, B.D. Anomaly Detection with Varied Ground Sample Distance Utilizing Spectropolarimetric Imagery Collected Using a Liquid Crystal Tunable Filter. Opt. Eng. 2011, 50, 081207. [Google Scholar] [CrossRef]
  64. Gallacher, D. Drones to Manage the Urban Environment: Risks, Rewards, Alternatives. J. Unmanned Veh. Syst. 2016, 4, 115–124. [Google Scholar] [CrossRef] [Green Version]
  65. Rybansky, M.; Kratochvíl, V.; Dohnal, F.; Gerold, R.; Kristalova, D.; Stodola, P.; Nohel, J. GNSS Signal Quality in Forest Stands for Off-Road Vehicle Navigation. Appl. Sci. 2023, 13, 6142. [Google Scholar] [CrossRef]
  66. Catania, P.; Comparetti, A.; Febo, P.; Morello, G.; Orlando, S.; Roma, E.; Vallone, M. Positioning Accuracy Comparison of GNSS Receivers Used for Mapping and Guidance of Agricultural Machines. Agronomy 2020, 10, 924. [Google Scholar] [CrossRef]
  67. Zhang, H.; Aldana-Jague, E.; Clapuyt, F.; Wilken, F.; Vanacker, V.; Van Oost, K. Evaluating the Potential of Post-Processing Kinematic (PPK) Georeferencing for UAV-Based Structure-from-Motion (SfM) Photogrammetry and Surface Change Detection. Earth Surf. Dyn. 2019, 7, 807–827. [Google Scholar] [CrossRef] [Green Version]
  68. Pirti, A. Evaluating the Accuracy of Post-Processed Kinematic (PPK) Positioning Technique. Geod. Cartogr. 2021, 47, 66–70. [Google Scholar] [CrossRef]
  69. Department of Transport and Main Roads. Manual Trimble Business Center V5.40—Processing and Adjusting GNSS Survey Control Networks. 2021. Available online: https://www.tmr.qld.gov.au/_/media/busind/techstdpubs/surveying/surveying-support-documents/tbc/tbcmanual.pdf?sc_lang=en&hash=2CA967C6DB233B5614C153CC9377B572 (accessed on 2 June 2023).
  70. Agisoft. Agisoft Metashape User Manual Professional Edition, Version 2.0. 2023. Available online: https://www.agisoft.com/downloads/user-manuals (accessed on 2 June 2023).
  71. Esri. ArcGIS Pro Implementation Guide. 2021. Available online: https://www.esri.com/content/dam/esrisites/es-es/media/pdf/implementation-guides/arcgis-pro-implementation-guide.pdf (accessed on 2 June 2023).
  72. Liu, X.H.; Kyriakidis, P.C.; Goodchild, M.F. Population-Density Estimation Using Regression and Area-to-Point Residual Kriging. Int. J. Geogr. Inf. Sci. 2008, 22, 431–447. [Google Scholar] [CrossRef]
  73. Daniel, C.B.; Saravanan, S.; Mathew, S. GIS Based Road Connectivity Evaluation Using Graph Theory. In Lecture Notes in Civil Engineering; Springer: New York, NY, USA, 2020; Volume 45, pp. 213–226. [Google Scholar] [CrossRef]
  74. Perz, S.G.; Xia, Y.; Shenkin, A. Global Integration and Local Connectivity: Trans-Boundary Highway Paving and Rural-Urban Ties in the Southwestern Amazon. J. Lat. Am. Geogr. 2014, 13, 205–239. [Google Scholar] [CrossRef]
  75. Zhao, P.; Li, S.; Liu, D. Unequable Spatial Accessibility to Hospitals in Developing Megacities: New Evidence from Beijing. Health Place 2020, 65, 102406. [Google Scholar] [CrossRef] [PubMed]
  76. Boisjoly, G.; Deboosere, R.; Wasfi, R.; Orpana, H.; Manaugh, K.; Buliung, R.; El-Geneidy, A. Measuring Accessibility to Hospitals by Public Transport: An Assessment of Eight Canadian Metropolitan Regions. J. Transp. Health 2020, 18, 100916. [Google Scholar] [CrossRef]
  77. Burnett, S.; Lloyd, A. The Road Not Taken: Locating Desire Lines across Information Landscapes. In Proceedings of the 10th International Conceptions of Library and Information Science Conference (CoLIS 2019), Ljubljana, Slovenia, 16–19 June 2019; Available online: https://informationr.net/ir/24-4/colis/colis1911.html (accessed on 2 June 2023).
  78. Hashidu, B.R.; Abbas, A.M.; Hashidu, R.B. Transportation Network Analysis, Connectivity and Accessibility Indices in North East, Nigeria. J. Res. Humanit. Soc. Sci. 2019, 7, 60–66. Available online: https://www.questjournals.org/jrhss/papers/vol7-issue9/H07096066.pdf (accessed on 25 June 2023).
  79. Gómez, J.M.N.; Vulevic, A.; Couto, G.; Castanho, R.A. Accessibility in European Peripheral Territories: Analyzing the Portuguese Mainland Connectivity Patterns from 1985 to 2020. Infrastructures 2021, 6, 92. [Google Scholar] [CrossRef]
  80. Balsa-Barreiro, J.; Ambuühl, L.; Menéndez, M.; Pentland, A. Mapping Time-Varying Accessibility and Territorial Cohesion with Time-Distorted Maps. IEEE Access 2019, 7, 41702–41714. [Google Scholar] [CrossRef]
  81. Rekha, R.S.; Radhakrishnan, N.; Mathew, S. Spatial Accessibility Analysis of Schools Using Geospatial Techniques. Spat. Inf. Res. 2020, 28, 699–708. [Google Scholar] [CrossRef]
  82. Wolny, A.; Ogryzek, M.; Źróbek, R. Towards Sustainable Development and Preventing Exclusions-Determining Road Accessibility at the Sub-Regional and Local Level in Rural Areas of Poland. Sustainability 2019, 11, 4880. [Google Scholar] [CrossRef] [Green Version]
  83. Falih, K.T.; Alyaqoobi, A.M. Spatial Analysis of Educational Services Using GIS in Nasiriyah City. Turk. J. Comput. Math. Educ. 2021, 12, 1974–1984. [Google Scholar] [CrossRef]
  84. Blanford, J.I.; Kumar, S.; Luo, W.; MacEachren, A.M. It’s a Long, Long Walk: Accessibility to Hospitals, Maternity and Integrated Health Centers in Niger. Int. J. Health Geogr. 2012, 11, 24. [Google Scholar] [CrossRef] [PubMed] [Green Version]
  85. Mirad, A.A. Using Geographical Information Systems for Defining Accessibility to Health Care Facilities in Jeddah City. Geospat. Health 2014, 8, S661–S669. [Google Scholar] [CrossRef] [PubMed] [Green Version]
  86. Zegarra Méndez, E. Gestión Del Agua, Valoración y Desempeño Económico Del Canal de Panamá; Banco Interamericano de Desarrollo (BID): Washington, DC, USA, 2017. [Google Scholar] [CrossRef]
  87. Instituto Nacional de Estadística y Censo de Panamá. Producto Interno Bruto Provincial, a Precios Corrientes y en Medias de Volumen Encadenadas con año de Referencia 2007: Años 2017-20. 2021. Available online: https://www.inec.gob.pa/archivos/P053342420211123162346COMENTARIOS.pdf (accessed on 11 July 2023).
  88. Gabinete Logístico. Estrategia Logística Nacional de Panamá a 2030; Banco Interamericano de Desarrollo (BID). 2017. Available online: https://www.presidencia.gob.pa/pdfs/ELNP.pdf (accessed on 11 July 2023).
Figure 1. Study area—province of Coclé.
Sustainability 15 11500 g001
Figure 2. Methodology.
Sustainability 15 11500 g002
Figure 3. Wingtra One Gen II.
Sustainability 15 11500 g003
Figure 4. Images taken with the drone of GIS elements: (a) intersection between a paved road and an unpaved road, (b) urban area, (c) elementary school, (d) high school, (e) healthcare center, (f) hospital.
Sustainability 15 11500 g004
Figure 5. Division of the province by quadrants.
Sustainability 15 11500 g005
Figure 6. Schema of the division of the province by quadrants.
Sustainability 15 11500 g006
Figure 7. (a) Map of the population size and their spatial distribution. (b) Distribution of the elementary schools. (c) Distribution of the high schools. (d) Distribution public healthcare facilities (these include healthcare centers and hospitals).
Sustainability 15 11500 g007
Figure 8. Road network connectivity.
Sustainability 15 11500 g008
Figure 9. Road network accessibility.
Sustainability 15 11500 g009
Figure 10. Box-plot graphs of the accessibility of 19.55% of the population of Coclé Province that lives more than 500 m to the nearest paved road.
Sustainability 15 11500 g010
Figure 11. Box-plot graphs of the accessibility of the population to (a) healthcare centers and (b) hospitals in the province of Coclé and their quadrants.
Sustainability 15 11500 g011
Figure 12. Box-plot graphs of the accessibility of the population to (a) elementary schools and (b) high schools in the province of Coclé and their quadrants.
Sustainability 15 11500 g012
Table 1. General information about the province of Coclé by quadrants.
DataUnitsQ1Q2Q3Q4
Total Areakm22230.51779.3620.7310.3
Towns 1Number of towns5985565233
Population 1People116,45972,99440,97216,253
Density 1People per km52.241.0266.052.4
1 The table does not include the population of the city of Penonomé.
Table 2. Information about the connectivity in the province of Coclé by quadrants.
DataUnitsQ1Q2Q3Q4
Paved Roadskm511.5531.2246.7207.9
Unpaved Roadskm2692.02053.7727.9340.2
Nodes-65601925
Kilometers per nodeskm8.59.414.59.9
Disclaimer/Publisher’s Note: The statements, opinions and data contained in all publications are solely those of the individual author(s) and contributor(s) and not of MDPI and/or the editor(s). MDPI and/or the editor(s) disclaim responsibility for any injury to people or property resulting from any ideas, methods, instructions or products referred to in the content.

