Article

Can Environmental Centralization Enhance Emission Reductions?—Evidence from China’s Vertical Management Reform

1
School of Economics and Management, Hubei University of Technology, Wuhan 430068, China
2
Hubei Circular Economy Development Research Center, Wuhan 430068, China
3
College of Economics & Management, Huazhong Agricultural University, Wuhan 430070, China
4
Laboratory of Green and Low-Carbon Development in Agriculture, Huazhong Agricultural University, Wuhan 430070, China
*
Author to whom correspondence should be addressed.
Sustainability 2023, 15(15), 11482; https://doi.org/10.3390/su151511482
Submission received: 12 June 2023 / Revised: 15 July 2023 / Accepted: 22 July 2023 / Published: 25 July 2023
(This article belongs to the Section Air, Climate Change and Sustainability)

Abstract

In the industrialization process, the difficulty in implementing environmental protection and enhancing the effect of environmental emission reduction are common problems to the developing countries, which are directly related to the quality of social development. This paper takes environmental centralization as the solution idea, takes the vertical management reform of environmental protection agencies implemented in China as the research object, and evaluates the environmental emission reduction effect and mechanism of action of centralized reform based on provincial environmental economic panel data using difference-in-differences model and intermediary model. The following conclusions are drawn: (1) The environmental centralization has significantly improved the provincial environmental emission reduction effect. After China’s vertical management reforms were implemented, per capita CO2 emissions decreased by 11.1%, and industrial source SO2 emissions fell by 35.7%. (2) By increasing investment in urban environmental infrastructure construction, the reform has raised the level of investment and regulation in environmental protection construction, which in turn has effectively improved the ability to reduce environmental emissions. (3) After the implementation of the reform, the emission reduction effects of the reform on per capita CO2 and industrial source SO2 are 10.1% and 14.2% higher in provinces with lower industrial output value compared to those with higher industrial output value. At the same time, the effect of reform in provinces with a strong degree of local government intervention was significantly lower than that in provinces with a weak degree of local government intervention. The emission reduction effects of the reform implementation are 10.2% (per capita CO2) and 30.5% (industrial source SO2) lower, respectively. Based on the above findings, this paper argues that environmental centralization is an effective measure to advance the improvement of environmental quality and efficiency. In addition, China’s reform experience has implications for other developing countries.

1. Introduction

The ideal development model for almost all developing countries is to promote economic growth while reducing emissions of pollutants and greenhouse gases and to achieve sustainable development by balancing economic and environmental benefits. However, economic development and environmental protection are often contradictory and follow the law of environmental Kuznets curve in reality [1,2]. For countries or regions in the early stage of industrialization, economic growth means an increase in pollutant and greenhouse gas emissions [3]. Economic growth at the cost of the environment is a curse that many developing countries and even developed countries want to break. Learning how to ensure economic growth while maximizing environmental protection through the implementation of effective environmental systems and environmental regulation tools is a key issue in the study of sustainable development of various economies [4].
Take China as an example; since the 1980s, China’s economic growth has achieved world-renowned results. However, due to the long-term imbalance and backwardness of the economic structure and developmental approach, environmental issues have become a major shortcoming of China in its new development stage [5,6]. In fact, environmental protection has been a major concern of the Chinese central government, which has been optimizing environmental protection through legislation, institutional reform, environmental protection inspectors, and many other means, while actively improving the ecological environment directly through strategies, such as afforestation, mountain reforestation, and development of new energy sources. However, it is undeniable that environmental problems have remained prominent in China for a long time. On the one hand, subject to the environmental protection system design deficiencies and other factors, the central environmental policy measures were introduced in the local effective implementation. The effect of the policy deviates from the policy expectations. On the other hand, economic growth and environmental protection remain a prominent contradiction in all provinces and cities, making the quality and effectiveness of environmental regulation unsatisfactory. There are obvious deviations in the implementation of environmental regulations [7]. According to The 2022 Environmental Performance Index published by the Yale Center for Environmental Law and Policy, China is ranked 160th in the world, which is extremely unsuited to its economic status.
Therefore, the kind of environmental protection system design that can effectively reduce the deviation of environmental regulation implementation between central and local governments, reduce pollutant and greenhouse gas emissions, and enhance green development is a question that needs to be addressed by China and other developing countries. This study is from this perspective, and by verifying the effectiveness of China’s governance experience, it summarizes the institutional routes to enhance the effect of emission reduction.
Pollutants and greenhouse gases are the externalities of economic activity and the product of market failures [8,9]. Compensating for such negative externalities requires the intervention of the government. And the environmental protection system is an important expression of government power. An appropriate institutional design can reduce environmental externalities in the process of economic activity. Throughout the countries, the environmental protection system models can be divided into two types of environmental centralization and environmental decentralization, and the division is based on whether the personnel and financial authority of the local environmental department comes from the local government or the higher environmental protection department, but which system model is more suitable for environmental protection work enhancement and pollutant reduction is yet to be demonstrated [8,9,10]. China is in the midst of a shift between two paradigms, from environmental decentralization to environmental centralization. This is a very worthwhile case of reality to explore. Based on this, this study takes the vertical management reform policy of sub-provincial environmental protection agencies implemented in 2016 in China as the research object. Based on inter-provincial economic and environmental data from 2007 to 2020, we apply the difference-in-difference method to assess the effect of the environmental centralization regime model on pollutant and greenhouse gas emission reduction and the mechanism of action. The innovation of this study lies mainly in the following two points. First, it extends the influencing factors of emission reduction effects from the instrument level to the system level. Second, it is the first time to systematically assess the emission reduction effects of China’s vertical environmental management reform and to summarize and explore its role and experience in environmental governance.
The remainder of this paper is organized as follows: Section 2 provides an overview of the current state of research on environmental regulation and environmental systems. Section 3 provides an explanation of the background of the reform and the mechanism of action. Section 4 introduces the research methods and strategies of this paper. Section 5 presents the empirical results and analysis, which assesses the emission reduction effect brought by the reform on the one hand and examines the mechanism of action and heterogeneity of the effectiveness of the vertical management reform on the other hand. Section 6 is the discussion and Section 7 is the conclusion of the study.

2. Literature Review

2.1. Environmental Regulation Tools

In order to achieve sustainable development and further enhance the ability to reduce emissions and pollution, the kinds of policy tools or regulatory instruments that are more effective have been the focus of academic attention [11,12]. Among the existing studies, the study of environmental instruments has been a popular and important focus in the field of environmental regulation. The effects of emission reduction and the mechanisms of their effects have been much discussed in the context of command-based and market-based environmental regulatory instruments. The former mainly involves the review of regulations and policies, local laws and regulations, and so on. The latter mainly studies the effects of emission fees, environmental protection taxes, resource tax, and other enforcement measures [13,14,15,16,17,18]. Although there is no unanimous conclusion on the advantages and disadvantages of the two types of regulatory tools, it is generally agreed that environmental regulatory tools are important tools to achieve green development [16,19]. Moreover, government enhanced regulatory instruments can significantly improve regional environmental performance [20].
However, as an intermediary and instrument that directly affects environmental matters, environmental regulatory instruments are inherently volatile, and the intensity of their implementation can be altered by multiple factors [21]. One of the most critical factors is the environmental protection system, which is directly related to the compatibility of incentives between environmental protection departments and the government at all levels, and it has a direct impact on the level of performance of environmental protection departments and the intensity of environmental regulation at the grassroots level [22]. At the same time, as the research on the tools of environmental regulation becomes more mature, the implementation effect of the environmental system should be given more attention. Based on this, this paper extends the investigation of factors affecting the emission reduction effect of environmental regulations from the instrumental level to the institutional level and explores the emission reduction effect and regulatory changes brought about by institutional changes.

2.2. Environmental Regulation System

In the existing studies, scholars focus on the effects of different power structures in the distribution of environmental protection systems, i.e., environmental centralization and decentralization. On the one hand, studies on the institutional framework of environmental decentralization, with a sample of developing countries, have argued that environmental decentralization can cause more serious environmental pollution problems [22]. Lipscomb [23] analyzed the river pollution problem in Brazil and found that decentralization of environmental protection increased regional pollution and created pollution spillover problems, Lin [24] argued that China’s long-term environmental decentralization model significantly exacerbated pollution emissions from industrial enterprises, Chen [25] found that environmental decentralization was an important cause of China’s previous severe haze control difficulties, and India’s air pollution problem and its obvious spillover problems were persistently difficult to solve because it did not have sufficient administrative centralization to solve them [26]. On the other hand, it is generally accepted that centralization of power to higher-level environmental protection departments is conducive to improving environmental protection and enhancing emission reduction effects. After the change of the State Environmental Protection Administration to the Ministry of Environmental Protection in China, Li [27] found that the increase in environmental centralization was effective in reducing pollution in provinces with a high degree of environmental decentralization. Han [28] examined the strengthening of environmental centralization in some prefecture-level cities in China through the implementation of vertical management reforms of environmental protection agencies, which in turn enhanced emission reduction effects.
In general, there have been relatively more studies on the environmental effects under the environmental decentralization regime model, which fully verified that the environmental decentralization system is not conducive to enhancing emission reduction effects. However, studies on the environmental effects of the centralized environmental system model are relatively limited. China is a vast country with many municipalities. Studies on the environmental decentralization system have mainly focused on the changes at the central agency level and the changes at the local and municipal levels, which are limited in scope. Based on this, this paper systematically assesses the emission reduction effects of the provincial environmental centralization system by taking the vertical management reform of the sub-provincial environmental protection agencies implemented in China as the institutional study object.

3. Reform Background and Theoretical Mechanisms

3.1. Vertical Management Reform in China

The management system of environmental protection agencies in China is divided into four main levels from the central government to local counties and cities. These are, in order, the Ministry of Ecology and Environment, the Department of Ecology and Environment, the Municipal Ecology and Environment Bureau, and the Ecology and Environment Sub-Bureau. In the past, environmental protection departments at all levels were mainly under the jurisdiction of governments at all levels and also received work guidance from higher-level environmental protection departments. However, the environmental protection vertical management reform has changed the relationship between local environmental protection departments, local governments, and higher-level environmental protection departments. The definition of vertical management reform of environmental protection is as follows: Local environmental protection departments are reduced or removed from the local government management sequence, not subject to local government oversight mechanisms, and are managed directly by provincial or central environmental protection departments to coordinate “personnel appointments, financial funds, and affairs”. This is a manifestation of the centralization of the environmental protection system [24,27,28].
Since the end of the 20th century, vertical management has become a basic trend in the evolution of China’s environmental protection system. In 1994, Dalian took the lead in implementing the reform of the vertical management of jurisdictions [28]. In 2002, Shaanxi Province issued the “Opinions on the Reform of the Administrative Management System of Environmental Protection under Shaanxi Province” to implement the vertical management of environmental protection under municipalities throughout the province [28]. In 2008, the State Council abolished the General Administration of Environmental Protection to form the Ministry of Environmental Protection [27]. With the establishment of the Ministry of Ecology and Environment in 2018, the level of the environmental department has been upgraded and its authority has been further expanded. The verticalization of environmental protection work has been further strengthened.
In the past, the vertical management of environmental protection in China mainly focused on some prefecture-level cities, involving a smaller scope, and was limited to the prefecture-level cities and counties and urban areas between the two levels of government. At the same time, under economic performance assessment, there are more common interests and closer ties between municipalities and counties, and the possibility of complicity or deregulation is higher. The vertical reform of sub-provincial agencies across counties and cities is theoretically more conducive to ensuring the independence of grassroots environmental agencies, alleviating the problem of complicity, and better promoting environmental governance. However, the vertical management reform of environmental protection at the provincial level has not been implemented due to practical constraints such as contradictory coordination of central-territory relations and local pursuit of economic performance. Until September 2016, the General Office of the Central Committee of the Communist Party of China and the General Office of the State Council issued the “Guidance on the pilot reform of the vertical management system of monitoring, supervision and enforcement of environmental protection agencies below the provincial level”. The guidance released a clear signal of vertical management reform of environmental agencies below the province. The reform is the first implementation and piloting of environmental vertical reform at the provincial level. The official announcement of the first batch of pilot provinces to apply contains Hebei, Shanghai, Jiangsu, Fujian, Shandong, Henan, Hubei, Guangxi, Chongqing, Guizhou, Shanxi, and Qinghai, a total of 12 provinces and municipalities, and it requires pilot provinces to complete the pilot work by the end of June 2017. This initiative marked the beginning of a shift from a “block”-based to a “strip”-based management model for China’s environmental protection work, and the institutional changes before and after the reform are shown in Figure 1. Therefore, the reform can be explored as a quasi-natural experiment with exogenous shocks. This provides a good research material for this paper to identify the policy effects of environmental vertical management reform using the difference-in-differences model while effectively alleviating the endogeneity problems arising from the study.

3.2. Theoretical Analysis and Hypothesis

3.2.1. The Impact of Vertical Environmental Management Reform on Emission Reduction Effects

The shift from territorial management to vertical management is an important attempt by China to address environmental governance through a centralized approach. For developing countries like China, although local governments have environmental responsibilities, they are more likely to put economic growth ahead of environmental well-being under the incentive of asymmetric performance assessment between the economy and the environment. This leads to short-sighted behavior and relaxed environmental regulation, which is not conducive to the implementation of emission reduction efforts [10,24]. With the implementation of the vertical management reform of environmental protection agencies below the provincial level, environmental protection departments are subject to the control of higher-level environmental protection departments in terms of “personnel appointments, financial funds, and affairs”. This will change the incentive orientation of local environmental protection departments at all levels, reduce the compromise of local governments on environmental issues due to economic goals, reduce the space for government and corporate complicity, strengthen the regulation of environmental protection, and effectively improve the effect of emission reduction. Therefore, we postulate the following hypotheses:
H1.
Vertical management reform of environmental protection can effectively enhance the effect of environmental emission reduction.

3.2.2. The Mechanism of Vertical Management Reform to Enhance the Effect of Emission Reduction

In fact, the vertical management reform of environmental protection agencies is essentially designed to coordinate the relationship between the various levels of government and environmental protection departments. The reform will better achieve incentive compatibility and enhance the independence of local environmental protection departments, which will then improve the level of performance and ability of environmental protection departments to perform their duties. However, changes in the environmental regime do not have a direct effect on the abatement effect of microeconomic activities. According to the previous section, environmental regulatory instruments, as intermediaries and instruments that act directly on environmental matters, also have a certain volatility in their regulatory intensity and effects [21], affected by the system of environmental protection regimes. Under a system of vertical management of environmental protection agencies, the enforcement of local environmental protection departments is less constrained by the local government. The level of work of environmental protection departments will be reflected by the level of investment and implementation of environmental regulation tools. Based on the existing literature [29,30], this paper selects urban environmental infrastructure investment as a mediating indicator to explore the institutional effects of the reform. Therefore, we postulate the following hypotheses:
H2.
The vertical management reform of environmental protection enhances the effect of environmental emission reduction by increasing investment in urban environmental infrastructure.

4. Research Design

4.1. Data

In order to be able to objectively present the policy effects of the reform and exclude the interference caused by public health crisis events such as the COVID-19 pandemic and other unexpected events. In this paper, we selected provincial environmental data and economic data from 2007 to 2020 for the study. The raw data of relevant variables were obtained from the China Environmental Statistical Yearbook and the CSMAR database.
For the study sample, this paper was obtained by manually querying the above pilots and confirming them after screening them according to the Guidance on the Pilot Reform of the Vertical Management System for Monitoring, Supervision and Law Enforcement of Sub-Provincial Environmental Protection Agencies and in conjunction with the relevant government disclosures. Combining the periodicity of the reform and the time lag between different batches, this paper takes the 11 provinces that submitted the first batch of pilot applications, such as Hebei and Chongqing, and started to implement the reform in December 2016 as well as in 2017 as the experimental group. We used 11 provinces, including Shanxi and Zhejiang, that embarked on implementing reforms in 2019 and beyond as a control group. In order to ensure the purity of the sample, the specific operation excluded provinces that had been reformed for a longer period of time as well as individual reforms implemented during 2018. At the same time, considering the time lag of the reform and that the actual implementation of the reform in most pilot provinces is mostly concentrated in 2017, coupled with the possibility of retrograde phenomena before the official implementation of the new policy (i.e., local governments will complete certain projects and enterprises before the transfer of power unannounced review and assessment of matters related to environmental protection, or the phenomenon of short-term adverse to the level of greening), which in turn affects the policy assessment results, this paper identified 2017 as the policy shock point for analysis.

4.2. Variable Definition and Data Description

4.2.1. Dependent Variable

This paper examined the emission reduction effect of vertical management reform of environmental protection agencies. Referring to existing studies [31,32], we chose sulfur dioxide (SO2) and carbon dioxide (CO2) as the indicators to be examined. SO2, as an important pollutant monitoring indicator with more complete data and changing along with socioeconomic activities, can be used as an important representative indicator to examine the emission reduction effect of the reform. According to China’s official data released in 2020, industrial pollution sources accounted for 69.14% of the total pollution sources, and industrial pollution is the focus of government regulation. Therefore, this paper selected SO2 emissions from industrial sources as the explanatory variable. At the same time, the paper also selected CO2 emissions per capita as the explanatory variable. On the one hand, carbon emission reduction is one of the priorities of current environmental protection work, and it is highly relevant to examine the impact of reforms on the change of CO2 emissions. On the other hand, China’s dual carbon target was proposed in September 2020. It was not previously considered as an important target for the work of the environmental protection sector, so using this indicator for assessment could greatly reduce the interference of exogenous factors and alleviate endogenous problems. Therefore, it was conducive to a more accurate and scientific assessment of the reduction effect of the reform by using CO2 indicators for assessment, which can greatly reduce the interference of exogenous factors and alleviate endogenous problems.

4.2.2. Other Variables

The main explanatory variable in this paper was the environmental vertical management reform policy. Referring to existing research [10,28,33], we set the time dummy variable Post and the grouping dummy variable Treat, respectively. According to the previous, 2017 was taken as the processing point, and Post took 1 in 2017 and later and 0 before; Treat took 1 for provinces implementing vertical management reform of environmental protection and 0 otherwise. For the control variables, the number of patents granted (lnTec), the share of coal consumption (lnEst), ratio of tertiary industry to secondary industry output (lnIns), the share of foreign investment (lnFdi), the real GDP per capita (lnPeg), the local fiscal expenditure on science and technology per capita (lnPrd), and the level of urbanization development (lnurbanrate) were selected with reference to existing studies [10,28,34]. At the same time, we chose urban environmental infrastructure investment (lncityinvest) for mechanism test analysis. In order to eliminate the difference in magnitudes and reduce heteroskedasticity interference, the above variables were logarithmized in practice. Variable descriptions and descriptive statistics are detailed in Table 1 and Table 2.

4.3. Empirical Strategy

We used the differences-in-differences (DID) method to construct contrasting experimental and control groups [35] and set up the following standard DID measurement model:
l n i n s s o 2 i t = β 0 + β 1 T r e a t i × P o s t t + β 2 C o n t r o l s i t + μ i + λ t + ε i t
l n p e r c o 2 i t = β 0 + β 1 T r e a t i × P o s t t + β 2 C o n t r o l s i t + μ i + λ t + ε i t
l n c i t y i n v e s t i t = γ 0 + γ 1 × T r e a t i × P o s t t + μ i + λ t + ε i t
l n i n s s o 2 i t = φ 0 + φ 1 T r e a t i × P o s t t + φ 2 l n c i t y i n v e s t i t + φ 3 C o n t r o l s i t + μ i + λ t + ε i t
l n p e r c o 2 i t = φ 0 + φ 1 T r e a t i × P o s t t + φ 2 l n c i t y i n v e s t i t + φ 3 C o n t r o l s i t + μ i + λ t + ε i t
In the model (1) to (5), the subscript i indicated province, and t indicated year. C o n t r o l s i t indicated the control variable at the provincial level; μ i indicated individual effect; and λ t indicated time effect. It is necessary to point out that the reform was implemented in batches and multiple time points. However, the reform itself required a certain time period; the time interval between batches was short, and the policy effects had time lag overlap effects, so it was not suitable for the estimation of multi-period DID model. Meanwhile, in order to ensure the rigor and scientificity of the study, this paper also adopted the multi-period DID method for validation based on the above model. The results of the empirical tests did not measure significant policy effects, which was not consistent with the realistic theoretical logic and indicates that the reform may have a long time lag effect. This is more consistent with expectations. The essence of the difference-in-differences model was to assess the effect of policy shocks using a counterfactual analysis framework, which required a clear comparison of the experimental and control groups as a basis for a cleaner measure of the policy effect [36,37]. Referring to existing studies [38], this paper selected 22 of these provinces that meet the time requirement as the object of investigation and used the standard DID model for the metric, as shown in models (1) and (2). We focused on the coefficient β 1 of the interaction term between T r e a t i and P o s t t in models (1) and (2) to assess the policy effects of the vertical management reform of environmental agencies. In addition, models (3)–(5) was set up in this paper to examine the path mechanism of the role of vertical management reform in environmental protection agencies.

5. Results

5.1. Baseline Results

Table 3 reports the results of the baseline regressions of models (1) and (2), with columns (1) and (2) showing a significant negative effect of the vertical management reform of environmental protection agencies on both per capita CO2 emissions and industrial source SO2 emissions without the inclusion of any control variables. Columns (3) and (4) shows that the coefficient of the interaction term remains significantly negative and statistically significant under the condition of adding control variables, which indicates that the vertical management reform of environmental protection agencies can significantly enhance the environmental emission reduction effect. Compared to the regions that did not implement the reform, the provinces that implemented the reform had 11.1% lower per capita CO2 emissions and 35.7% lower industrial source SO2 emissions with significant policy effects, supporting hypothesis H1.

5.2. Parallel Trend Test

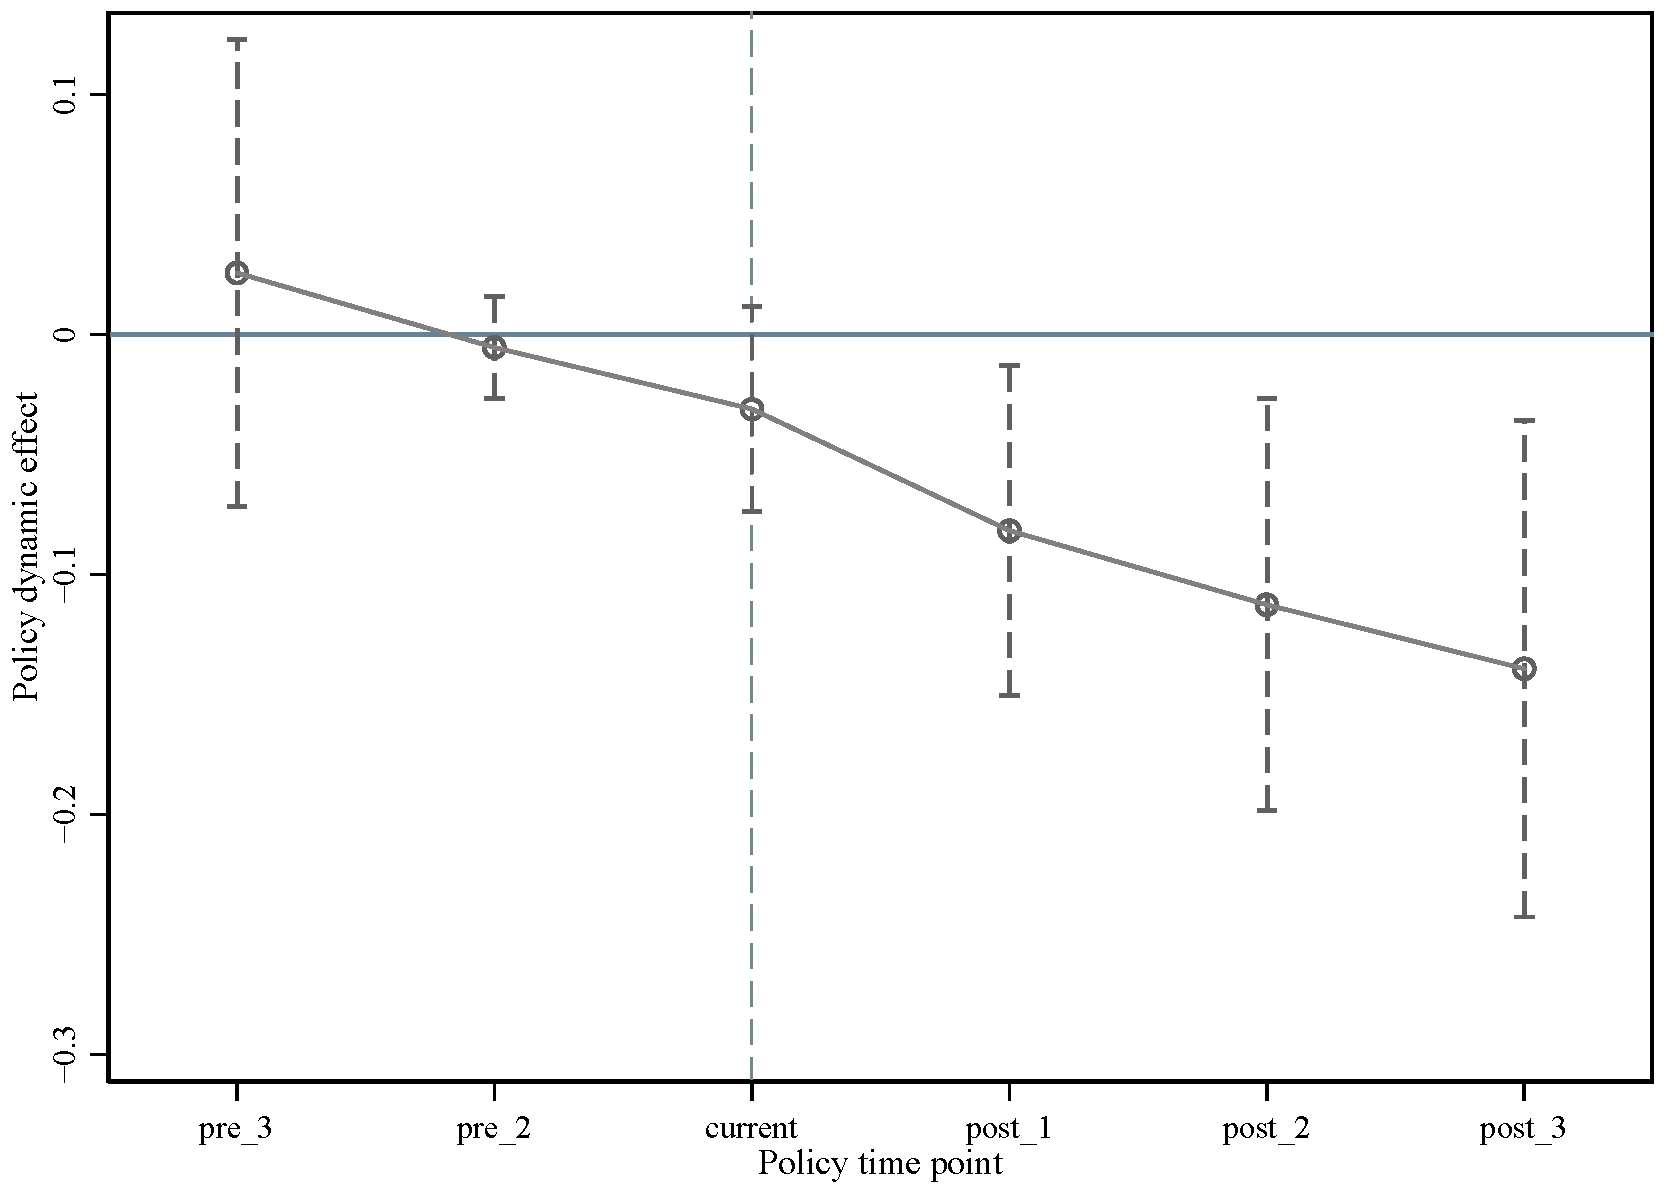
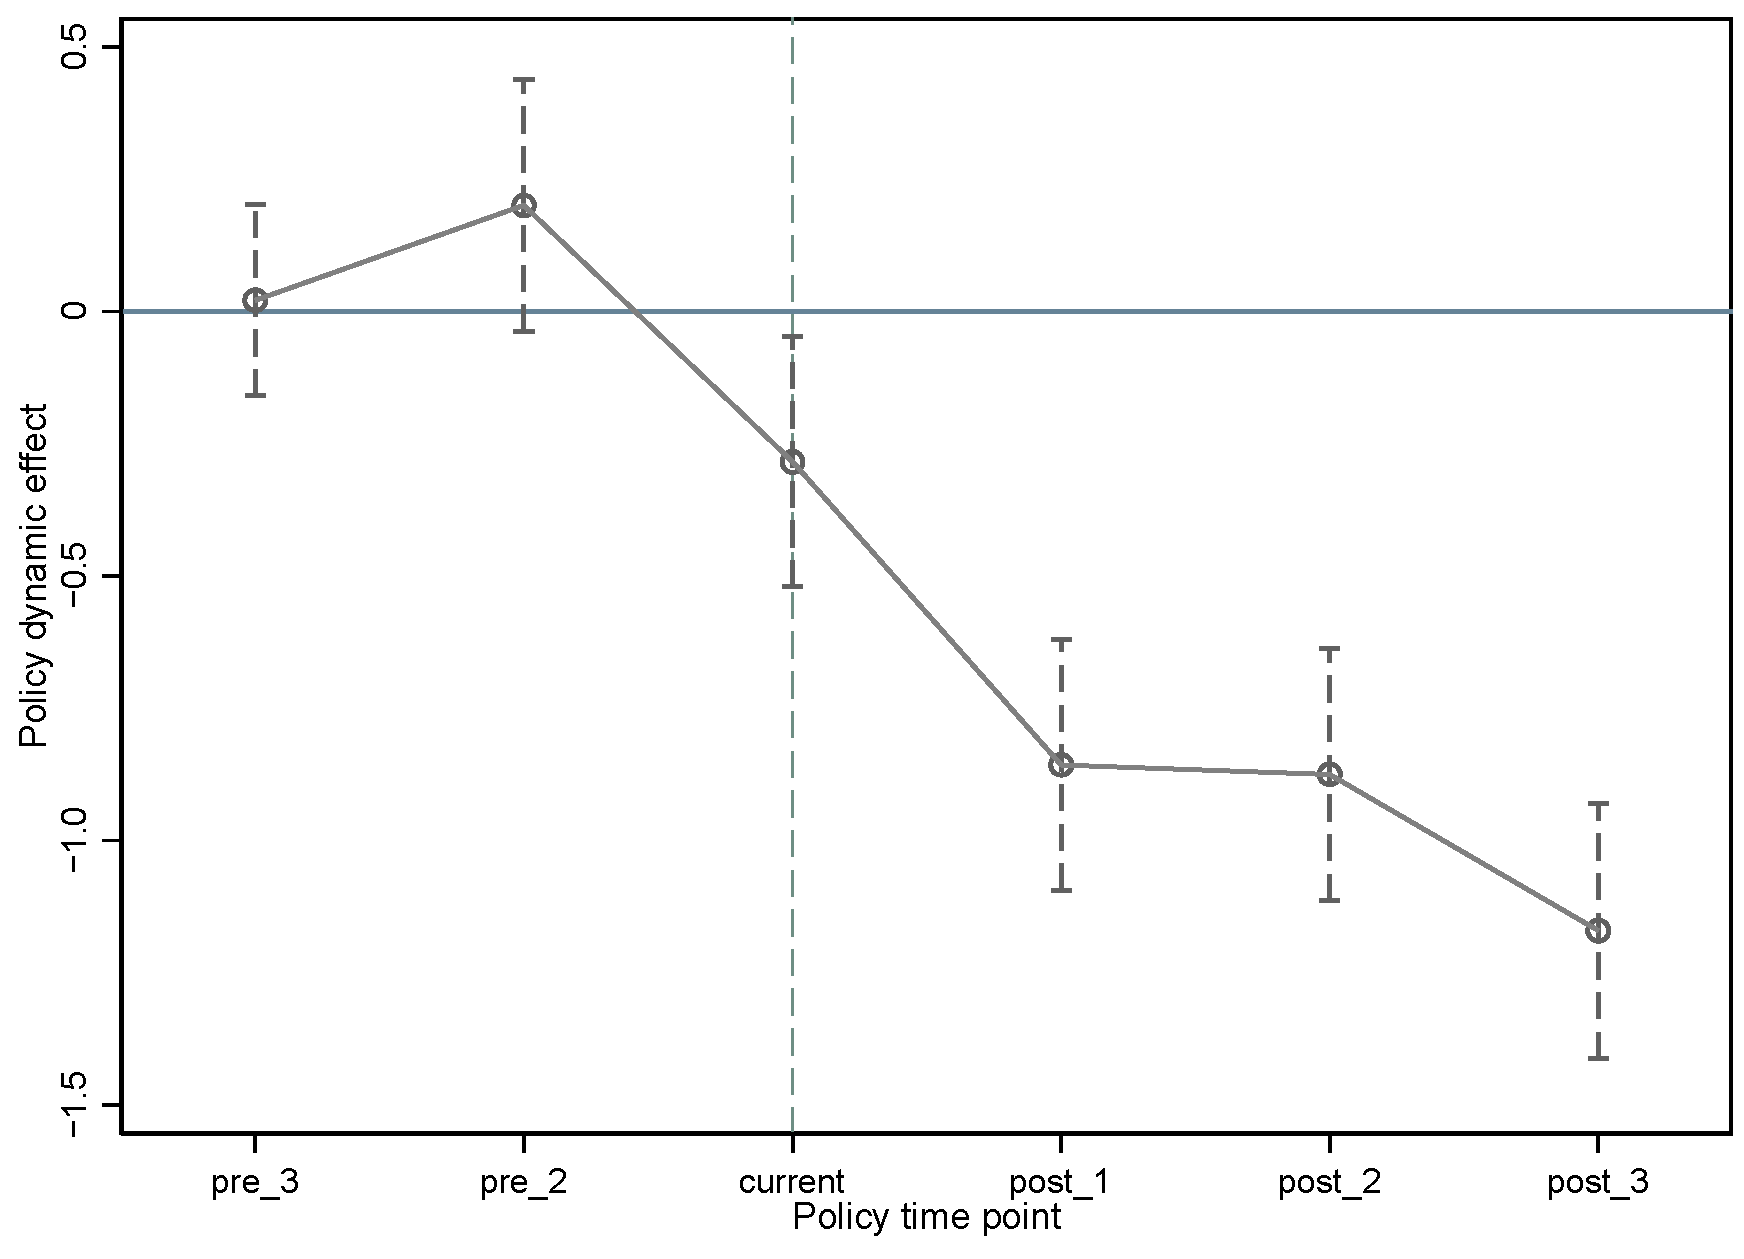
According to the requirements of DID, the inherent validity of the model design needs to be ensured by a parallel hypothesis trend test [38]. We need to ensure that the per capita CO2 and industrial source SO2 in the experimental and control groups need to maintain essentially similar parallel time trends before the implementation of the environmental protection vertical management reform. On this basis, we introduced cross terms of grouping variables and dummy variables for each year for parallel trend test, and we used 1 year before the policy implementation (2016) as the base period reference group, and the results are shown in Figure 2 and Figure 3.
Figure 2 shows the 95% confidence intervals of the regression coefficients of model (1), which show the same trend for both the experimental and control groups before the policy implementation. The policy implementation shows a significant difference, and the coefficient of the policy effect keeps strengthening. Figure 3 shows the parallel trend test of model (2), which shows a clear trend of policy effect after the policy implementation, as in Figure 2. However, there is a slight difference between the experimental group and the control group before the policy implementation. This paper argues that this is related to the endogeneity of the sample. Before the implementation of the reform, the documentary “Under the Dome” aired and became popular in China in 2015. The topic of PM2.5 air pollution is quickly becoming a hot topic in Chinese society. The event has sparked concern and inclination of governments, businesses, and people across the country to improve air quality [39]. Sulfur dioxide, as one of the important air pollution sources, was also affected as a result, making the results of this paper somewhat endogenously confounded.

5.3. Robustness Checks

5.3.1. DID Estimation Combined with Propensity Score Matching

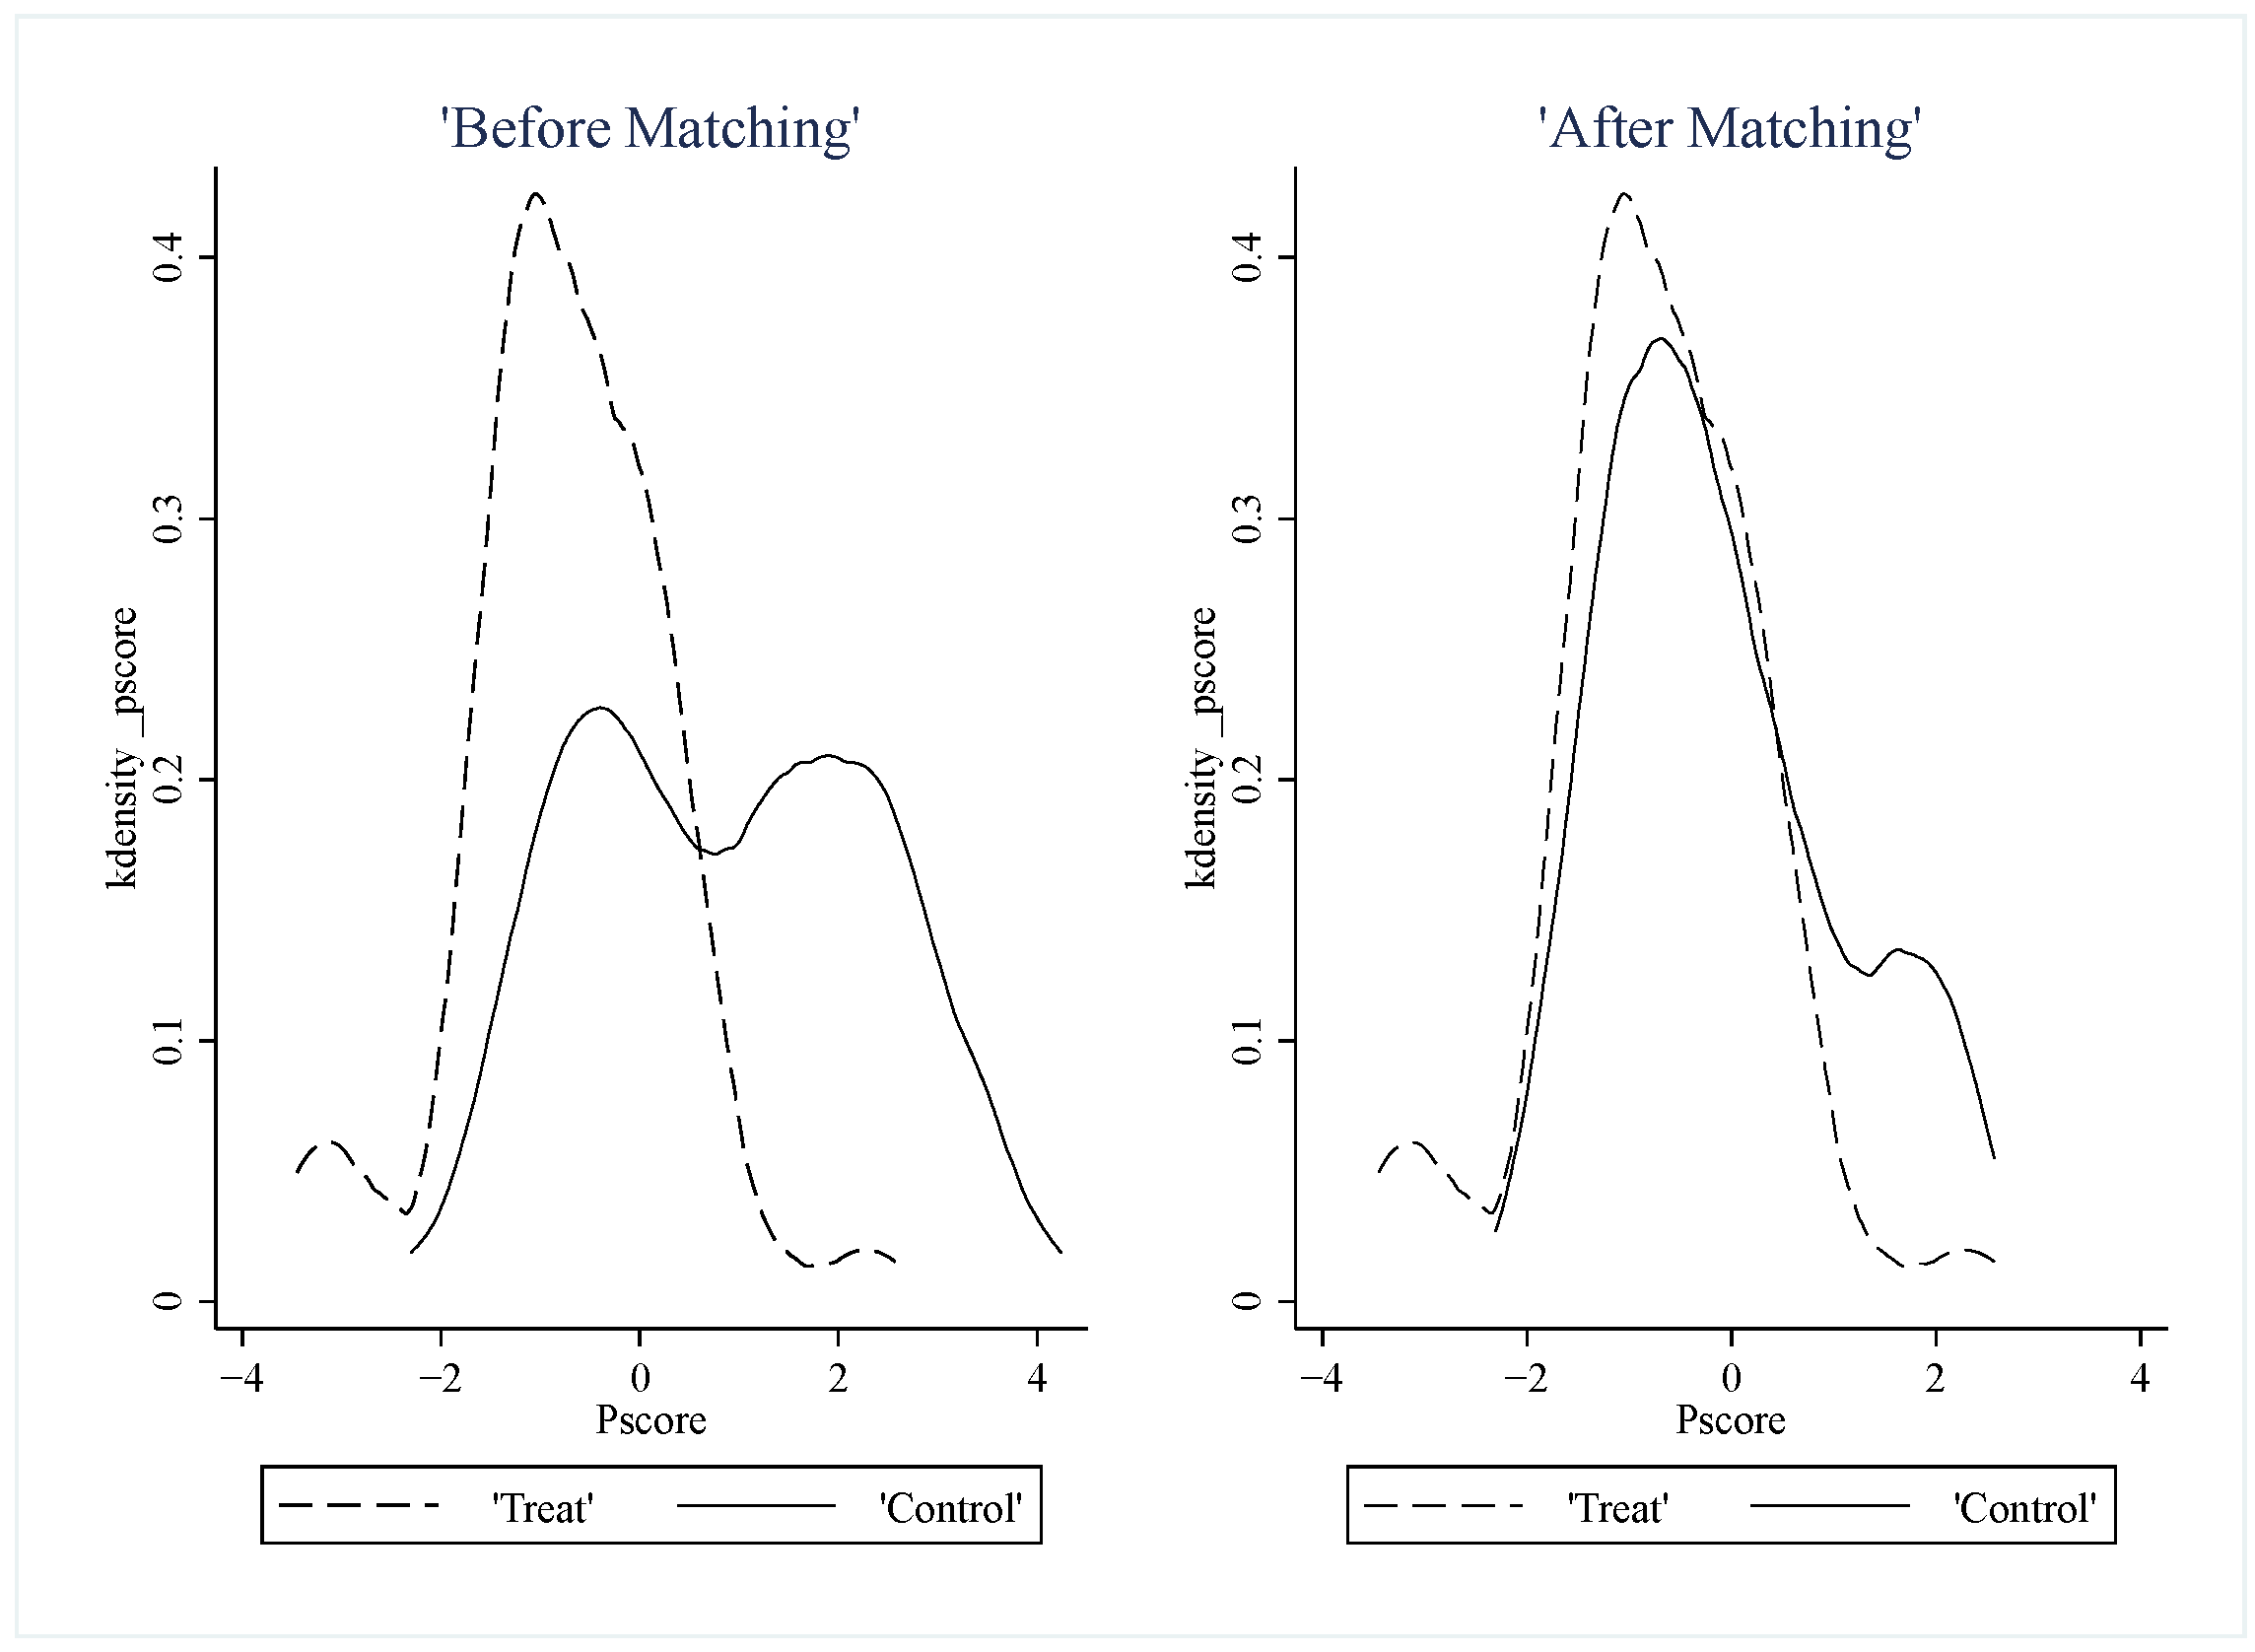
In order to avoid possible self-selection in sample selection, we conducted PSM matching followed by regression on the basis of a difference-in-differences model design in this paper so as to try to control the elimination of sample differences, alleviate the endogeneity problem, and further improve the similarity matching between the experimental and control groups [40,41]. Figure 4 shows that the closeness of the kernel density curves of the two groups of samples after matching is substantially higher, indicating a better matching effect.
After matching, we ran the sample regression again, with the result shown in Table 4. Columns (1) and (2) of Table 3 show the results without and with the introduction of control variables, respectively. The policy treatment effects are all significant at the 5% level, which is generally consistent with the previous results. Compared to provinces that did not implement vertical environmental management reforms, those that did implement reforms had significantly higher emission reduction effects, again validating hypothesis H1 and indicating that the conclusions remain robust.

5.3.2. Placebo Tests

To ensure the scientific validity of the empirical results and to avoid that the abatement effects in the treatment and control group provinces are due to time variation and other unobservable factors, this paper utilizes a counterfactual approach by introducing a temporal placebo test [42]. We set up a series of spurious reform counts and re-run the DID estimation. If the interaction term coefficients remain statistically significant, the baseline results are indicated to be due to other unobservable factors, and vice versa, the hypothesis is valid. This study assumes that the years of vertical management reform pilot implementation of environmental protection agencies are 2010, 2013, and 2015 in that order, and it adjusts Post values accordingly for regression tests. The results are shown in Table 5. Columns (1) to (3) show the regression results of model (1), and the interaction term Treat × Post coefficients are not significant. This indicates that the policy effect is significant because of the significant change in per capita CO2 emissions after the reform. Columns (4) to (6) show the regression results of model (2), and the coefficient statistics of the interaction term in columns (4) and (5) are not significant, as expected. However, column (6) shows a statistically significant coefficient of the interaction term, which is consistent with the previous section. Since 2015, the air pollution problem has become a general concern for the Chinese society at large. As a result, an externality interference is generated, which makes the statistical significance change.

5.4. Influential Mechanism Analyses

The previous paper has verified that the vertical management reform of environmental protection has a significant emission reduction effect, but the mechanism of the emission reduction effect needs further verification. Based on the previous analysis, we adopt urban environmental infrastructure investment as a mediating mechanism variable for validation here, and the results are shown in Table 6. Column (1) presents the estimated results of the reform on the investment in the construction of environmental infrastructure in towns. The value of the core explanatory variable coefficient is 0.270 and significant at the 10% level, indicating that the reform has strengthened the investment in environmental protection. From columns (2) and (3), it can be seen that there is a significant mediating effect of investment in urban environmental infrastructure, with coefficients of −0.073 and −0.054 for CO2 and SO2 per capita, respectively, both significant at the 1% level. The coefficients of intermediation effect are −0.020 and −0.015, respectively, which are incomplete intermediation effects. The results indicate that the reform enhances the emission reduction effect by strengthening the environmental protection financial investment.

5.5. Heterogeneity Analyses

The implementation of vertical management reform of sub-provincial environmental protection agencies significantly strengthened environmental centralization at the provincial level, changed the environmental governance structure between environmental protection agencies and the government at all levels, and enhanced the environmental mitigation effect. However, it is not clear whether this change has different effects on different types of areas. In this section, we will consider heterogeneity based on two factors: local economic structural differences and the degree of local government intervention.

5.5.1. Differences in the Proportion of Industrial Economy

There is a non-linear relationship between environmental governance and economic growth, which varies with industrial structure and economic level at different stages of development. As we all know, the secondary industry is the industry that consumes the most energy and emits the highest percentage of carbon emissions in China’s economic structure, and it is also the industry that is the focus of attention in environmental regulation. At the same time, industry is also an important part of the national economy, involving taxation and people’s livelihood, which is prone to conflict with environmental regulations. Especially for large industrial provinces, strengthening environmental regulations means making certain compromises between economic growth and employment and livelihood [43,44].
Based on this, the study divides the sample provinces into two groups, “high industrial share” and “low industrial share”, using the median of industrial output to GDP ratio data of each province in 2016 as the classification criterion, and conducts regressions separately. The results are shown in Table 7. The coefficient of the reform policy effect is significantly lower in provinces with a high industrial share than in provinces with a low industrial share. Compared to provinces with a high industrial share, provinces with a low industrial share have a 10.1% and 14.2% higher reduction effect on per capita CO2 and industrial source SO2 than provinces with a high industrial share. This indicates that the industrial structure affects the actual effect of the environmental protection vertical management reform. At the current stage of development, there is still some incongruity between China’s economic development and environmental emission reduction. Large industrial provinces and regions with a high industrial share are the areas that need to be focused on to enhance the emission reduction effect in the future.

5.5.2. Differences in the Degree of Local Administrative Intervention

In the list of powers and responsibilities of the Chinese administrative system, local governments and officials are usually tasked with multiple governance goals, including political, economic, and social. However, they need to compete through the scale to obtain political performance for promotion, which easily leads to governmental intervention in the market. Established studies [45,46] have found that a strong degree of government intervention is often detrimental to the optimization of market firm performance and the implementation of central policies. This in turn affects the effect of reform policies. While competition on the scale is conducive to improving the efficiency of the supply of public goods, a strong degree of government intervention is conducive to the implementation of policies on the ground and producing results more quickly. Then, in the environmental protection vertical management reform, the degree of local government intervention will be strong or weak to produce what role, which has yet to be identified to confirm.
Therefore, the paper adopts the local government intervention index in the marketization index report compiled by Wang Xiaolu and Fan Gang et al. as an indicator of the degree of intervention [47]. In practice, we divided the provinces into two groups, “strong local government intervention” and “weak local government intervention”, using the median as the criterion and ran the regressions separately. The results are shown in Table 8. The results show that for regions with weak local government intervention, the effect of reform policies is significantly higher than that of regions with strong intervention. The reduction effects on per capita CO2 and industrial source SO2 are 10.2% and 30.5% higher, respectively. This suggests that reducing the degree of local government administrative intervention is in some sense conducive to weakening competition for economic performance, reducing the behavior of limiting environmental regulation and public goods supply due to economic enhancement and thus improving the environmental mitigation effect.

6. Discussion

We provide empirical evidence that environmental centralization is conducive to enhancing the emission reduction effect, using China’s environmental vertical management reform as an example. The previous literature has used Brazil, India, and China as examples to reverse the conclusion that pollutants increase under environmental decentralization systems [24,25,26]. However, there is a lack of sufficient and effective real-world evidence on the emission reduction effects of environmental decentralization. This paper validates the sub-provincial environmental vertical management reform implemented in China as a quasi-natural experiment, as this reform moves China’s environmental protection system from decentralization to centralization. By excluding the confounding factors, it is empirically demonstrated that the environmental centralization system is conducive to enhancing the emission reduction effect. Moreover, investment in urban environmental infrastructure construction plays an important role as a mediating mechanism in the process. It shows that the independence of environmental protection agencies at all levels is enhanced under the environmental centralization system. It also reduces the local government’s intervention in environmental protection to improve economic performance, which makes environmental protection funding more secure. The study suggests that for developing countries in the industrialization stage, the implementation of a centralized environmental protection system is conducive to improving environmental quality.
Of course, there are some shortcomings in this paper. First, the implementation cycle of vertical management reform is long, and there are potential policy effectiveness time lag effects. In order to obtain clearer policy results, the study sacrifices the completeness of the sample and does not include a sample of all Chinese provinces. The effect of environmental vertical reforms in the provinces not included in the study and the effect of reforms in later implementation batches of provinces are yet to be supplemented by further research. Second, this paper analyzes the effects of the reform at the macro level using provincial panel data. Due to the limitations of data availability and analytical framework, the changes in the strategies of micro firms before and after the reform and the inherent mechanisms have to be verified. Therefore, the future research direction of this study is to examine the gradual effect of the reform under the environmental centralization model and to reveal the strategic changes in microeconomic activities generated by the reform of the vertical management of environmental protection and its internal mechanism of action. It is hoped that the study will provide feasible suggestions for further optimizing the environmental centralization system.

7. Conclusions

This paper mainly explores the governance effects of environmental centralization. We empirically test the impact effects and heterogeneity of environmental vertical management reform on pollutant and GHG emission reduction using a difference-in-differences model based on provincial panel economic environmental data in China from 2007 to 2020. The conclusions are summarized as follows: (1) Environmental centralization is conducive to improving environmental quality. China’s vertical management reform of sub-provincial environmental protection agencies has significantly improved the provincial environmental emission reduction effect, significantly reducing per capita CO2 and industrial source SO2 emissions. (2) Environmental centralization can improve the level of environmental protection factor inputs. China’s reforms have improved the level of environmental construction inputs and regulations by increasing investment in urban environmental infrastructure construction, which in turn has effectively improved the ability to reduce environmental emissions. (3) The environmental centralization effect plays out more significantly in different regions. The heterogeneity results indicate that the emission reduction effect of reforms is more pronounced in provinces with lower industrial output value relative to those with higher industrial output value, meaning that the policy effect is relatively weaker in large industrial provinces. At the same time, the effect of reforms in provinces with a higher degree of local government intervention is significantly lower than that in provinces with a weaker degree of local government intervention.
Based on the above conclusions, this paper puts forward the following suggestions for further optimizing the environmental centralization system in the future to enhance the effect of environmental emission reduction. First, developing countries and regions need to persist in implementing the environmental centralization system and continuously explore its optimization. We should promote the good experiences and practices of other regions, such as China, in environmental centralization systems. Second, in view of the contradiction between economic growth and environmental protection, it is recommended to provide appropriate financial support and policy inclination to high-energy-consuming regions so as to alleviate the difficulties in the transformation and green development of high-energy-consuming industries. Through financial and technical support, we can help key regions reduce the “compliance cost” of reform, effectively promote the implementation of the reform of the environmental centralization system, and help improve the level of green development in the whole region. In addition, the central government should also focus on guiding the deepening of reform in areas with strong local government intervention, optimizing the mechanism for implementing the centralized environmental system, and giving full play to the effective advantages of the centralized system.

Author Contributions

Conceptualization, L.C. and Q.S.; methodology, L.C.; formal analysis, Q.S.; data curation, Q.S.; writing—original draft preparation, Q.S.; writing—review and editing, L.C. and K.H.; visualization, K.H.; supervision, K.H. All authors have read and agreed to the published version of the manuscript.

Funding

This research was funded by The National Social Science Foundation of China, grant number 21BGL157, Social Science Foundation of Hubei Province, grant number 2019077, Hubei Provincial Department of Education, grant number 21Q063.

Institutional Review Board Statement

Not applicable.

Informed Consent Statement

Not applicable.

Data Availability Statement

The datasets generated during and analyzed during the current study are available from the corresponding author on reasonable request.

Conflicts of Interest

The authors declare no conflict of interest.

References

  1. Cole, M.A. Trade, the pollution haven hypothesis and the environmental Kuznets curve: Examining the linkages. Ecol. Econ. 2004, 48, 71–81. [Google Scholar] [CrossRef]
  2. Gill, A.R.; Viswanathan, K.K.; Hassan, S. The Environmental Kuznets Curve (EKC) and the environmental problem of the day. Renew. Sustain. Energy Rev. 2018, 81, 1636–1642. [Google Scholar] [CrossRef]
  3. Xu, S.C.; Li, Y.W.; Miao, Y.M.; Gao, C.; He, Z.-X.; Shen, W.-X.; Long, R.; Chen, H.; Zhao, B.; Wang, S. Regional differences in nonlinear impacts of economic growth, export and FDI on air pollutants in China based on provincial panel data. J. Clean. Prod. 2019, 228, 455–466. [Google Scholar] [CrossRef]
  4. Hove, S.; Tursoy, T. An investigation of the environmental Kuznets curve in emerging economies. J. Clean. Prod. 2019, 236, 117628. [Google Scholar] [CrossRef]
  5. Qiu, J.; Wang, S.; Lian, M. Research on the Sustainable Development Path of Regional Economy Based on CO2 Reduction Policy. Sustainability 2023, 15, 6767. [Google Scholar] [CrossRef]
  6. Ebenstein, A.; Fan, M.; Greenstone, M.; He, G.; Yin, P.; Zhou, M. Growth, pollution, and life expectancy: China from 1991–2012. Am. Econ. Rev. 2015, 105, 226–231. [Google Scholar] [CrossRef]
  7. Li, X.; Yang, X.; Wei, Q.; Zhang, B. Authoritarian environmentalism and environmental policy implementation in China. Resour. Conserv. Recycl. 2019, 145, 86–93. [Google Scholar] [CrossRef]
  8. Owen, A.D. Environmental externalities, market distortions and the economics of renewable energy technologies. Energy J. 2004, 25, 127–156. [Google Scholar] [CrossRef]
  9. Yang, X.; Yan, J.; Tian, K.; Yu, Z.; Li, R.Y.; Xia, S. Centralization or decentralization? the impact of different distributions of author-ity on China’s environmental regulation. Technol. Forecast. Soc. Chang. 2021, 173, 121172. [Google Scholar] [CrossRef]
  10. Chen, G.; Xu, J.; Qi, Y. Environmental (de)centralization and local environmental governance: Evidence from a natural experiment in China. China Econ. Rev. 2022, 72, 101755. [Google Scholar] [CrossRef]
  11. Keohane, N.O.; Revesz, R.L.; Stavins, R.N. The Choice of Regulatory Instruments in Environmental Policy. Harv. Environ. Law Rev. 1998, 22, 313. [Google Scholar] [CrossRef]
  12. Böcher, M. A theoretical framework for explaining the choice of instruments in environmental policy. For. Policy Econ. 2012, 16, 14–22. [Google Scholar] [CrossRef]
  13. Blackman, A.; Li, Z.; Liu, A.A. Efficacy of Command-and-Control and Market-Based Environmental Regulation in Developing Countries. Annu. Rev. Resour. Econ. 2018, 10, 381–404. [Google Scholar] [CrossRef]
  14. Peng, J.; Xie, R.; Ma, C.; Fu, Y. Market-based environmental regulation and total factor productivity: Evidence from Chinese enterprises. Econ. Model. 2021, 95, 394–407. [Google Scholar] [CrossRef]
  15. Liu, L.; Jiang, J.; Bian, J.; Liu, Y.; Lin, G.; Yin, Y. Are environmental regulations holding back industrial growth? Evidence from China. J. Clean. Prod. 2021, 306, 127007. [Google Scholar] [CrossRef]
  16. Yi, M.; Fang, X.; Wen, L.; Guang, F.; Zhang, Y. The Heterogeneous Effects of Different Environmental Policy In-struments on Green Technology Innovation. Int. J. Environ. Res. Public Health 2019, 16, 4660. [Google Scholar] [CrossRef]
  17. Zhang, Y.; Song, Y. Tax rebates, technological innovation and sustainable development: Evidence from Chinese micro-level data. Technol. Forecast. Soc. Chang. 2022, 176, 121481. [Google Scholar] [CrossRef]
  18. Song, Y.; Zhang, Y. Economic and environmental influences of resource tax: Firm-level evidence from China. Resour. Policy 2022, 77, 102751. [Google Scholar] [CrossRef]
  19. Rubashkina, Y.; Galeotti, M.; Verdolini, E. Environmental regulation and competitiveness: Empirical evidence on the Porter Hypothesis from European manufacturing sectors. Energy Policy 2015, 83, 288–300. [Google Scholar] [CrossRef]
  20. Zhang, Y.; Song, Y.; Zou, H. Non-linear effects of heterogeneous environmental regulations on industrial relo-cation: Do compliance costs work? J. Environ. Manag. 2022, 323, 116188. [Google Scholar] [CrossRef]
  21. Nordhaus, W. Climate Change: The Ultimate Challenge for Economics. Am. Econ. Rev. 2019, 109, 1991–2014. [Google Scholar] [CrossRef]
  22. Hou, X.; Cheng, B.; Xia, Z.; Zhou, H.; Shen, Q.; Lu, Y.; Nazemi, E.; Zhang, G. Investigating the Relationship be-tween Economic Growth, Institutional Environment and Sulphur Dioxide Emissions. Sustainability 2023, 15, 4678. [Google Scholar] [CrossRef]
  23. Lipscomb, M.; Mobarak, A.M. Decentralization and Pollution Spillovers: Evidence from the Re-drawing of County Borders in Brazil. Rev. Econ. Stud. 2017, 84, 464–502. [Google Scholar] [CrossRef]
  24. Lin, B.; Xu, C. Does environmental decentralization aggravate pollution emissions? Microscopic evidence from Chinese industrial enterprises. Sci. Total Environ. 2022, 829, 154640. [Google Scholar] [CrossRef] [PubMed]
  25. Chen, S.; Zhang, Y.; Zhang, Y.; Liu, Z. The relationship between industrial restructuring and China’s regional haze pollution: A spatial spillover perspective. J. Clean. Prod. 2019, 239, 115808. [Google Scholar] [CrossRef]
  26. Du, X.; Guo, H.; Zhang, H.; Peng, W.; Urpelainen, J. Cross-state air pollution transport calls for more centralization in India’s envi-ronmental federalism. Atmos. Pollut. Res. 2020, 11, 1797–1804. [Google Scholar] [CrossRef]
  27. Li, W.; Yang, Y. Can environmental centralization help reduce pollution? Evidence from an administrative re-form in China. J. Clean. Prod. 2021, 314, 127972. [Google Scholar] [CrossRef]
  28. Han, C.; Tian, X.L. Less pollution under a more centralized environmental system: Evidence from vertical envi-ronmental reforms in China. Energy Econ. 2022, 112, 106121. [Google Scholar] [CrossRef]
  29. Lin, B.; Zhu, J. Changes in urban air quality during urbanization in China. J. Clean. Prod. 2018, 188, 312–321. [Google Scholar] [CrossRef]
  30. Dou, X.S.; Wang, Z.F.; Yuan, H.M.; Jing, P. Function, barriers and policies of green infrastructure construction in ur-ban environment//Advanced Materials Research. Trans. Tech. Publ. Ltd. 2015, 1065, 2814–2818. [Google Scholar]
  31. Zhong, S.; Li, J.; Zhao, R. Does environmental information disclosure promote sulfur dioxide (SO2) remove? New evidence from 113 cities in China. J. Clean. Prod. 2021, 299, 126906. [Google Scholar] [CrossRef]
  32. Loganathan, N.; Mursitama, T.N.; Pillai, L.L.K.; Khan, A.; Taha, R. The effects of total factor of productivity, natural resources and green taxation on CO2 emissions in Malaysia. Environ. Sci. Pollut. Res. 2020, 27, 45121–45132. [Google Scholar] [CrossRef] [PubMed]
  33. Schmidheiny, K.; Siegloch, S. On Event Study Designs and Distributed-Lag Models: Equivalence, Generalization and Practical Implications; Institute of Labor Economics (IZA): Bonn, Germany, 2019. [Google Scholar]
  34. He, Q. Fiscal decentralization and environmental pollution: Evidence from Chinese panel data. China Econ. Rev. 2015, 36, 86–100. [Google Scholar] [CrossRef]
  35. De Chaisemartin, C.; D’Haultfœuille, X. Fuzzy Differences-in-Differences. Rev. Econ. Stud. 2018, 85, 999–1028. [Google Scholar] [CrossRef]
  36. Athey, S.; Imbens, G.W. Identification and Inference in Nonlinear Difference-in-Differences Models. Econometrica 2006, 74, 431–497. [Google Scholar] [CrossRef]
  37. Wissmann, D. Finally a Smoking Gun? Compensating Differentials and the Introduction of Smoking Bans. Am. Econ. J. Appl. Econ. 2022, 14, 75–106. [Google Scholar] [CrossRef]
  38. Bilinski, A.; Hatfield, L.A. Nothing to see here? Non-inferiority approaches to parallel trends and other model assumptions. arXiv 2018, arXiv:1805.03273. [Google Scholar]
  39. Tu, M.; Zhang, B.; Xu, J.; Lu, F. Mass media, information and demand for environmental quality: Evidence from the “Under the Dome”. J. Dev. Econ. 2020, 143, 102402. [Google Scholar] [CrossRef]
  40. Fan, F.; Zhang, X. Transformation effect of resource-based cities based on PSM-DID model: An empirical analysis from China. Environ. Impact Assess. Rev. 2021, 91, 106648. [Google Scholar] [CrossRef]
  41. Zang, J.; Wan, L.; Li, Z.; Wang, C.; Wang, S. Does emission trading scheme have spillover effect on industrial structure upgrading? Evidence from the EU based on a PSM-DID approach. Environ. Sci. Pollut. Res. 2020, 27, 12345–12357. [Google Scholar] [CrossRef] [PubMed]
  42. Yang, X.; Jiang, P.; Pan, Y. Does China’s carbon emission trading policy have an employment double dividend and a Porter effect? Energy Policy 2020, 142, 111492. [Google Scholar] [CrossRef]
  43. Zhang, M.; Sun, X.; Wang, W. Study on the effect of environmental regulations and industrial structure on haze pollution in China from the dual perspective of independence and linkage. J. Clean. Prod. 2020, 256, 120748. [Google Scholar] [CrossRef]
  44. Du, W.; Li, M. Assessing the impact of environmental regulation on pollution abatement and collaborative emis-sions reduction: Micro-evidence from Chinese industrial enterprises. Environ. Impact Assess. Rev. 2020, 82, 106382. [Google Scholar] [CrossRef]
  45. Taylor, J.B. Getting off Track: How Government Actions and Interventions Caused, Prolonged, and Worsened the Financial Crisis; Hoover Press: Stanford, CA, USA, 2013. [Google Scholar]
  46. Hong, J.; Wang, C.; Kafouros, M. The Role of the State in Explaining the Internationalization of Emerging Market Enterprises. Br. J. Manag. 2015, 26, 45–62. [Google Scholar] [CrossRef]
  47. Xiaolu, W.; Lipeng, H.; Gang, F. China Provincial Marketization Index Report; Social Science Academic Press: Beijing, China, 2021. [Google Scholar]
Figure 1. How China’s vertical reforms reshapes its local environmental system.
Sustainability 15 11482 g001
Figure 2. Parallel trend test (lnperCO2).
Sustainability 15 11482 g002
Figure 3. Parallel trend test (lninsSO2).
Sustainability 15 11482 g003
Figure 4. PSM propensity-matched kernel density distribution.
Sustainability 15 11482 g004
Table 1. Definition of variables.
Variable TypeVariableSource Variable DefinitionUnit
Dependent
variable
lnperco2CSMAR CO2 emissions per capita tons
lnlinsso2CSMARSO2 emissions from industrial sources tons
Core variablesPostManual organizationTime dummy variables-
TreatManual organizationArea dummy variables-
Mechanism VariableslncityinvestChina Environmental Statistical YearbookUrban environmental infrastructure investmentone hundred million CNY
Control
variables
lnTecCSMAR Number of patents granted per 10,000 peoplepieces
lnEstCSMARCoal consumption/total energy consumptionpercent
lnInsCSMAR Tertiary industry output value/Secondary industry output valuepercent
lnFdiCSMAR Foreign direct investment to GDP ratiopercent
lnPegCSMARReal GDP per capitaone hundred CNY
lnPrdCSMAR Local financial expenditure on science and technology per capitaten thousand CNY
lnurbanrateCSMARUrbanization development levelpercent
Table 2. Descriptive statistics.
VariableMeanStd.Dev.MinMax
lnperco22.3300.5201.4643.889
lnlinsso23.4721.1460.0845.099
Post0.2860.45201
Treat0.5000.50101
lncityinvest4.3651.58407.142
lnTec6.2741.2233.5848.915
lnEst4.4190.5970.7895.524
lnIns4.7310.4283.9846.264
lnFdi5.1610.8390.7286.920
lnPeg6.0560.5464.7327.404
lnPrd5.0940.9553.2617.591
lnurbanrate4.0570.2143.4844.506
Table 3. Effect of environmental decentralization on SO2 and CO2.
(1)(2)(3)(4)
VARIABLESlnperco2lnlinsso2lnperco2lnlinsso2
Treat × Post−0.239 **−0.328 **−0.111 **−0.357 **
(0.111)(0.150)(0.048)(0.132)
lntec 0.0130.163
(0.040)(0.130)
lnest 0.342 ***0.177 **
(0.082)(0.082)
lnins −0.387 ***−0.063
(0.124)(0.278)
lnfdi 0.010−0.089 ***
(0.019)(0.027)
lnpeg 0.0230.751 *
(0.183)(0.378)
lnprd −0.017−0.092
(0.041)(0.099)
lnurbanrate −0.067 **0.013
(0.032)(0.075)
Constant2.117 ***4.052 ***2.434 **−0.357 **
(0.111)(0.054)(1.113)(0.132)
R-squared0.0490.9210.7390.941
id FEYESYESYESYES
year FEYESYESYESYES
Standard errors in parentheses *** p < 0.01, ** p < 0.05, * p < 0.1.
Table 4. Results of DID estimation combined with PSM method.
(1)(2)
VARIABLESlnperco2lnlinsso2
Treat × Post−0.117 **−0.348 **
(0.050)(0.129)
Constant2.4612.986
(1.617)(3.175)
R-squared0.7270.949
ControlsYESYES
id FEYESYES
year FEYESYES
Robust standard errors in parentheses *** p < 0.01, ** p < 0.05, * p < 0.1.
Table 5. Results of time placebo tests.
(1)(2)(3)(4)(5)(6)
201020132015201020132015
VARIABLESlnperco2lnlinsso2
Treat × Post−0.017−0.049−0.0610.087−0.115−0.397 ***
(0.046)(0.040)(0.038)(0.136)(0.108)(0.098)
Constant−0.094−0.192−0.1729.729 ***9.283 ***8.886 ***
(0.599)(0.596)(0.570)(2.400)(2.261)(1.989)
R-squared0.6860.6930.6980.7210.7220.744
ControlsYESYESYESYESYESYES
id FEYESYESYESYESYESYES
year FEYESYESYESYESYESYES
Robust standard errors in parentheses *** p < 0.01, ** p < 0.05, * p < 0.1.
Table 6. Mechanism of Investment in urban environmental infrastructure.
(1)(2)(3)
VARIABLESlncityinvestlnperco2lnlinsso2
Treat × Post0.270 *−0.262 ***−0.347 **
(0.162)(0.066)(0.128)
lncityinvest −0.073 ***−0.054 ***
(0.015)(0.018)
Constant1.036−3.657 ***0.531
(2.262)(0.730)(2.779)
R-squared0.1780.6930.944
ControlsYESYESYES
id FEYESYESYES
year FEYESYESYES
Robust standard errors in parentheses *** p < 0.01, ** p < 0.05, * p < 0.1.
Table 7. Heterogeneity: The difference of industrial output value.
(1)(2)(3)(4)
VARIABLESlnperco2lnlinsso2lnperco2lnlinsso2
Low industrial output valueHigh industrial output value
Treat × Post−0.139 **−0.867 *−0.038 **−0.725 ***
(0.043)(0.387)(0.016)(0.112)
Constant2.9307.933 **−3.303 ***7.273 ***
(3.188)(2.217)(0.341)(2.421)
R-squared0.7460.8230.8490.839
Observations9898210210
ControlsYESYESYESYES
id FEYESYESYESYES
year FEYESYESYESYES
Robust standard errors in parentheses *** p < 0.01, ** p < 0.05, * p < 0.1.
Table 8. Heterogeneity: The difference of intervention of local government intervention.
(1)(2)(3)(4)
VARIABLESlnperco2lnlinsso2lnperco2lnlinsso2
Weak intervention of local government interventionStrong intervention of local government intervention
Treat × Post−0.147−0.887 ***−0.045−0.582 ***
(0.105)(0.146)(0.029)(0.136)
Constant0.37310.079 ***1.698 *7.160 **
(2.337)(2.265)(0.846)(2.620)
R-squared0.7130.8730.9090.765
Observations154154154154
ControlsYESYESYESYES
id FEYESYESYESYES
year FEYESYESYESYES
Robust standard errors in parentheses *** p < 0.01, ** p < 0.05, * p < 0.1.
Disclaimer/Publisher’s Note: The statements, opinions and data contained in all publications are solely those of the individual author(s) and contributor(s) and not of MDPI and/or the editor(s). MDPI and/or the editor(s) disclaim responsibility for any injury to people or property resulting from any ideas, methods, instructions or products referred to in the content.