Article

An Evolutionary Analysis of Higher-Order Interaction Collaborative Innovation Networks in China’s New Energy Vehicle Industry

1
Business School, University of Shanghai for Science and Technology, Shanghai 200093, China
2
School of Naval Architecture, Ocean & Civil Engineering, Shanghai Jiao Tong University, Shanghai 200240, China
*
Author to whom correspondence should be addressed.
Sustainability 2023, 15(15), 11478; https://doi.org/10.3390/su151511478
Submission received: 6 June 2023 / Revised: 12 July 2023 / Accepted: 15 July 2023 / Published: 25 July 2023

Abstract

:
As a manifestation of technological innovation achievements, patents reflect the frontier of technological development in the field. The aim of this research is to investigate the spatial evolution of patent collaboration networks and cooperation activities in the Chinese new energy vehicle (NEV) industry. We hypothesize that the higher-order collaboration networks will exhibit the formation of triangle groups centered around core nodes and the emergence of key edges indicating their importance. Key organizations and partners will play a significant role in shaping the future direction of cooperative innovation. The research utilizes data on collaboration patents in the NEV industry in China and constructs higher-order interaction collaboration innovation networks. The spatial evolution of networks and patent cooperation activities are examined using simplex methods. The results indicate that the generalized degree distribution of nodes and edges follows a power-law distribution. Two-dimensional simplex networks gradually form triangle clusters centered on core nodes and key edges. Large companies and research institutes prefer high-depth collaboration, while universities prefer high-breadth collaboration. Furthermore, the development of the new energy vehicle industry has gradually shifted from the eastern region to the central region. In the two-dimensional simplex network, Beijing and Jiangsu play a crucial role as key bridges in fostering stable and deep collaborations. The findings of this study shed light on the spatial evolution of patent collaboration networks and cooperation activities in the Chinese NEV industry. The identification of key organizations and partners, as well as the central positions of certain regions, provides valuable insights for innovation organizations in navigating innovation development and selecting collaboration partners.

1. Introduction

In the context of international innovation, technology R&D activities are becoming more complex. Many R&D entities seek cooperation with others to acquire various technology R&D resources and gain a competitive advantage [1]. As the breadth and depth of cooperation between R&D entities increase, the cooperation model between them gradually evolves into a collaborative network involving multiple entities interacting with each other [2,3]. Collaborative innovation networks have emerged as a promising approach to facilitate knowledge sharing and innovation among entities in various industries [4,5]. A large amount of literature has studied technology cooperation networks based on the complex network theory in different industries [6,7]. Liu et al. [8] utilize the complex network theory to examine the characteristics and structure of the patent cooperation network in the field of SG in China. Yin et al. [9] study technological collaborations and analyze CCS patents through a patent cooperation network all over the world. Liu et al. [10] analyze the characteristics of the international technological collaboration network in the ICM industry.
However, there is a fundamental limitation to the representation of complex networks: networks can only capture interactions between two nodes, while the functioning of many real-world systems involves not only dyadic connections but also collective actions at the level of multiple entities [11]. In the context of a patent collaboration network, for example, let us assume there is at least one patent jointly applied for by innovation entities i and j, but excluding entity h. Additionally, there are at least two other patents: one jointly filed by i and h, excluding j, and another jointly applied for by j and h, excluding i. In a complex network, this scenario would be represented by a triangle connecting nodes i, j, and h, which can be decomposed into the sum of three dyadic interactions. However, if there is a patent jointly applied for by i, j, and h, the situation becomes quite different. In this case, the interaction among the three innovation entities can still be represented by a triangle, but now this triangle signifies a genuine triadic interaction. Research has shown that multi-entity interactions play a crucial role in the collective dynamics and processes of networked systems. In certain cases, they can even determine the emergence of new states or states that are essentially prohibited in the presence of only dyadic interactions. Higher-order networks are one of the rapidly advancing fields in modern research, with diverse interdisciplinary applications [11]. However, there is currently a gap in empirical analysis utilizing higher-order networks. Therefore, we aim to fill this gap by introducing higher-order networks to explore patent collaboration networks.
In recent years, China’s new energy vehicle (NEV) industry has experienced rapid growth, driven by government policies and increasing consumer demand for environmentally friendly transportation options [12,13]. As the industry continues to evolve, collaboration and innovation are becoming increasingly important for companies to stay competitive [14,15]. Previous research has employed complex network approaches to investigate patent collaboration in the field of NEV [16]. However, it has been recognized that group interactions of this nature play a crucial role in the collective dynamics and processes within network systems. To illustrate our approach, we focus on the case of China’s NEV industry. The contributions of this paper can be summarized as follows: (1) we emphasize that the formation and evolution of social networks result from multiple interactions among diverse entities. To accurately describe such scenarios, we introduce the concept of simplicial complexes in higher-order networks to analyze the multi-entity behavior within the patent network of the NEV industry. (2) Our research comprehensively reveals the evolutionary dynamics of one-dimensional and two-dimensional simplicial networks. We investigate how individual characteristics, relationship characteristics, and cooperation characteristics of R&D entities influence the formation of higher-order collaborative networks in the NEV industry. (3) We conduct a study on interprovincial higher-order collaborative networks within the NEV industry. Our analysis uncovers the influence of regional boundaries on collaboration types and explores the characteristics of interprovincial collaboration. The findings of our research provide valuable insights for local governments in formulating relevant policies.
The remaining sections of the article are arranged as follows: Section 2 presents a comprehensive overview of previous studies. In Section 3, we represent some basic properties of higher-order interaction collaborative innovation networks and our methodology. Section 4 describes the data and divides the network into phases. The higher-order network is constructed and analyzed in Section 5. In Section 6, we identify key nodes and key partnerships. Section 7 analyses regional cooperation networks. Section 8 gives conclusions and some ideas for future work.

2. Literature Review

2.1. New Energy Vehicle Industry

The transportation sector is responsible for one-third of the world’s total energy consumption, making energy conservation in this sector a matter of widespread concern [17]. Among various modes of transportation, road transport is the primary contributor to global warming and air pollution [18]. Notably, vehicle exhaust is widely recognized as one of the major sources of severe air pollution in China. Mainstream countries formulate and implement strategic plans to encourage the development of the domestic NEV industry [19]. For the Chinese government and original equipment manufacturers (referred to as OEMs), the NEV industry provides a historic opportunity [20]. The goal is to enhance innovation capability and accomplish the transformation of the automotive industry [21]. However, since the majority of energy storage devices are still in the early phases of development in China [22], more efforts should be made to enhance the development of NEV from the technological perspective [13]. Therefore, it is necessary to implement corresponding technical innovation measures to address these technological challenges.
Obviously, the NEV industry has become a significant research focus, and numerous scholars have conducted extensive research on related topics. While most studies focus on the interpretation and evaluation of policies, environmental benefits and user needs, few scholars study China’s NEV from the perspective of organizational cooperation. The exploring of collaboration innovation for NEV can promote technological cooperation between organizations. Furthermore, it can achieve technology sharing and collaborative innovation, thus improving the level of NEV technology.

2.2. Patent Collaboration Network

Evaluating collaborative patents helps researchers understand the process of expansion of knowledge [23,24,25]. With the development of the social network analysis method, more research regards network science as an important tool for studying technological collaborations [26]. Ramos [27] demonstrated that participating in national or regional collaboration networks positively impacts R&D activities. Xiang et al. revealed that international innovation collaboration has facilitated the transfer of technology and the sharing of knowledge among countries [28,29]. For emerging industries such as the NEV industry, it is of great importance to form a collaborative innovation network for promoting sustainable development. Therefore, this study aims to construct and visualize a patent cooperation network in China’s NEV industry, to gain comprehensive insights into the patterns and dynamics of collaborative innovation.
Clarifying the geographical location of patent applicants helps to understand the distribution and flow of knowledge, providing a basis for researchers to conduct technical management and formulate policies [30]. Sun and Cao [31] constructed a patent collaboration network model of intra-regions and inter-regions in China during the period 1985–2012. Sun [32] also discovered that colleges and state-owned enterprises served as central entities in regional cooperation networks. These studies concentrate on the types of innovative entities and the distribution of patent cooperation networks, revealing the position of different organizational types and regions in the network [6]. Plainly, it is important to investigate the patent cooperation network in China’s NEV industry, considering the network’s components and regional distribution [33].
A patent cooperation network serves as a communication platform for patent inventors to connect with relevant experts and collaborative innovation partners, facilitating the exchange of external knowledge [4]. Scholars have extensively researched collaboration types, characteristics, motivations, and other aspects, from different perspectives [34]. However, limited attention has been given to the patent cooperation network within the context of the NEV industry.

2.3. Social Network Analysis

Social network analysis (SNA) provides a framework for studying and analyzing the relationships and interactions among entities. It is extensively utilized in various disciplines such as sociology, management science, statistics, graph theory, and many others [34]. With the development of social analysis tool visualization, the research of the patent cooperation application network has received increased attention from scholars. Liu et al. [35] analyze how new organizations join the network and how existing organizations form connections based on preferential attachment. Liu et al. [8] utilize the complex network theory and social network analysis (SNA) method to examine the characteristics and structure of the patent cooperation network in the field of SG in China. Yin et al. [9] study technological collaborations and analyze CCS patents through a patent cooperation network all over the world. Liu et al. [10] analyze the characteristics of the international technological collaboration network in the ICM industry.
Collaborative innovation research often employs complex network analysis as a major social network analysis (SNA) method. In this method, if a patent has two applicants, there will be an edge between the two applicants. However, due to the characteristics of the complex network structure, there are limitations in accurately depicting the interactions among members. For instance, when three or more enterprises jointly apply for a patent, it can be challenging to express the cooperative relationship between multiple enterprises using complex network analysis. Some scholars began to use hypergraphs to describe cooperative networks [36]. A hyperedge is a collection of nodes that can connect any number of nodes in a hypergraph [37]. The properties of nodes can be different, and nodes in the same hyperedge are completely connected. Zhao et al. [38] constructed a dynamic model that includes an enterprise hypergraph and a knowledge hypergraph. They used multiple entities to simulate the process of knowledge creation and diffusion.
Taken together, there have been significant achievements in using SNA to study patent cooperation in the industrial field. However, existing research on cooperative networks typically involves selecting a specific number of patent collaborators, whereas the number of patent collaborators in the real world is often random [39]. In this paper, we attempt to explore and investigate higher-order interaction cooperation innovation networks for China’s NEV.

3. Construction of Higher-Order Interaction Cooperation Innovation Networks

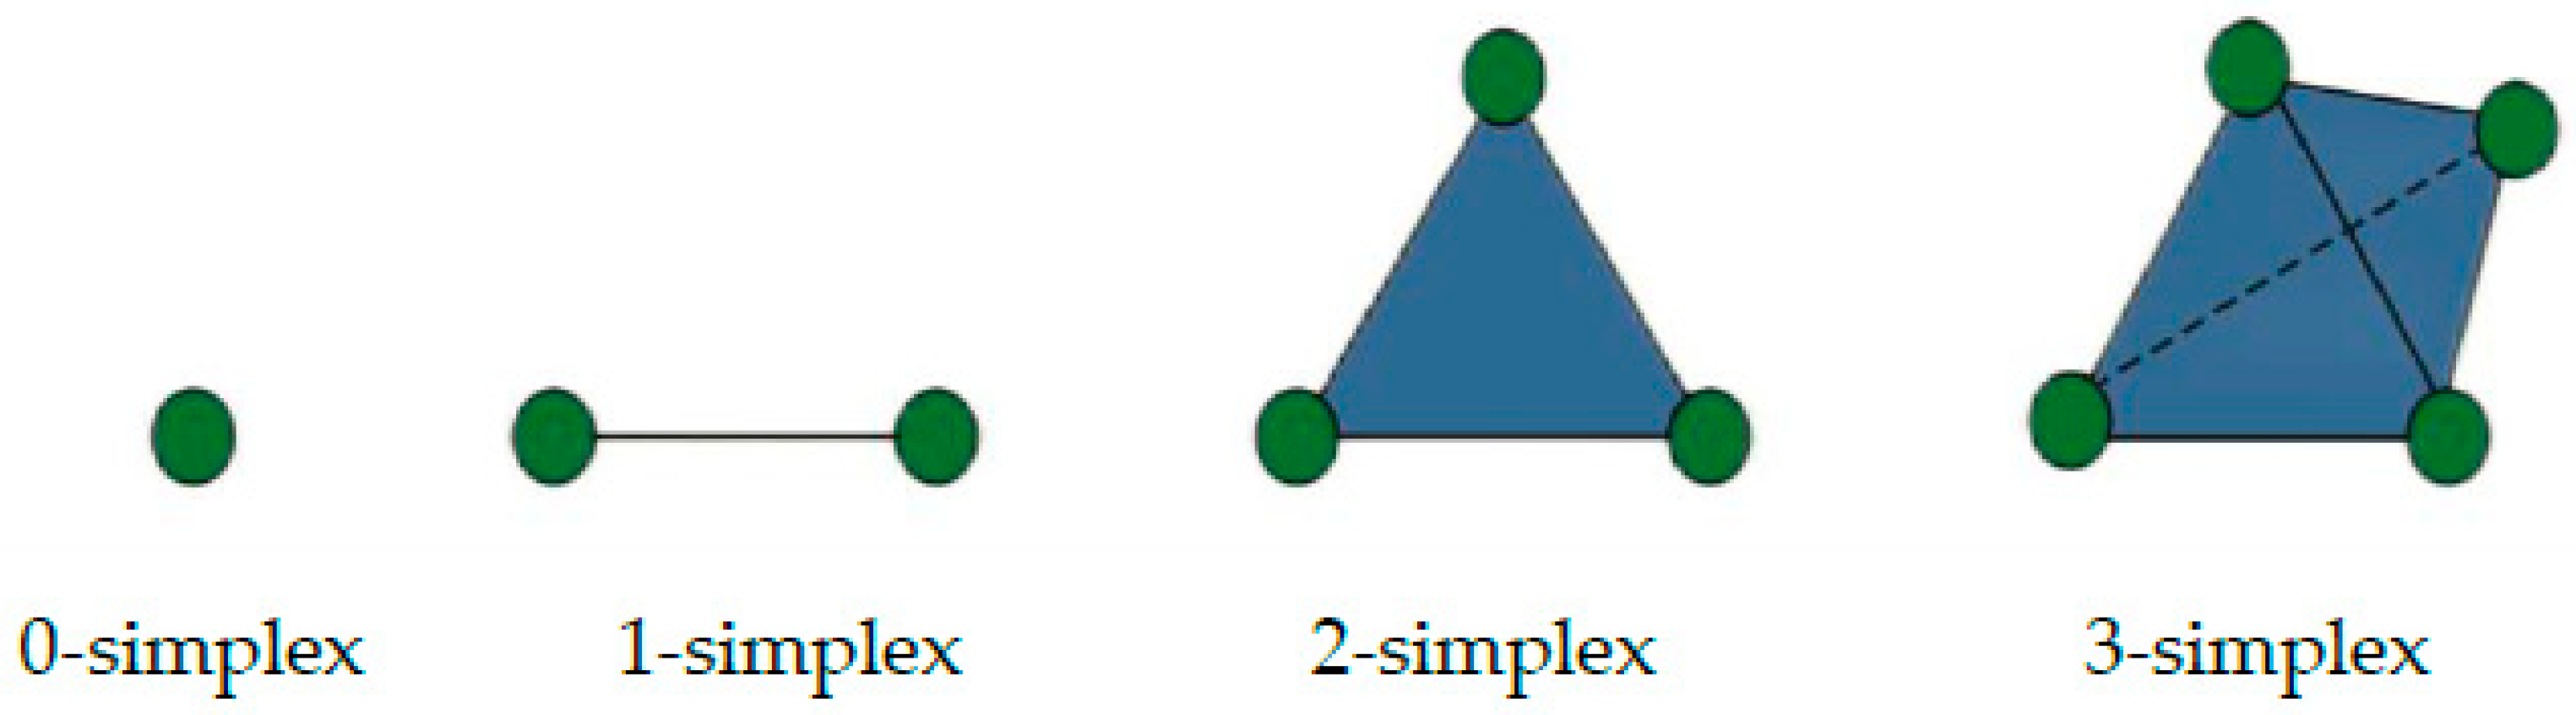
3.1. Basic Properties of Higher-Order Networks

A complex system can be represented by a network, which is essentially a graph denoted as G (V, E), where the set of nodes V represents the system’s elements, and the set of links E represents their interactions [40]. Networks are pivotal to capturing the architecture of complex systems. However, they cannot capture higher-order interactions. In a complex system, to encode the many-body interactions between the elements, higher-order networks need to be used. A powerful mathematical framework adopted to describe higher-order networks is provided by simplicial complexes [41]. Simplicial complexes are formed by a set of simplices. The simplices indicate the interactions existing between two or more nodes, and are defined as follows:
A d-dimensional simplex α (also indicated as a d-simplex) is formed by a set of (d + 1) interacting nodes [42]
α = v 0 , v 1 , , v d
It describes a many-body interaction among the nodes, enabling both a topological and a geometrical interpretation of the simplex. Here, d-simplex α represents the interactions among the 1 + d nodes. For instance, a node is a 0-simplex, a link is a 1-simplex, a triangle is a 2-simplex a tetrahedron is a 3-simplex, and so on [43] (see Figure 1).
A face of a d-dimensional simplex α is a simplex α formed by a proper subset of nodes of the simplex, i.e.,   α α . For instance, the faces of a 2-simplex v 0 , v 1 , v 2 include three nodes v 0 , v 1 , v 2   and three links v 0 , v 1 , v 0 , v 2 , v 1 , v 2 . Similarly, we characterize the faces of a tetrahedron in Figure 2 [42].
This paper studies the cooperation relationship on the patent application networks, taking the patent applicants as the network nodes. The 1-simplex means that two organizations apply for a patent jointly, and the 2-simplex means that three organizations apply for a patent jointly. According to the cooperation relationship between the innovation entities, the pure 1-simplex cooperation network composed of only 1-simplex and the pure 2-simplex cooperation network composed of only 2-simplex are constructed respectively [44].
The number of nodes reflects the scale of the higher-order interaction cooperation innovation networks. The weight of each 1-dimensional simplex represents the number of patents jointly applied for by the two organizations. The number of 1-dimensional simplexes on the 1-dimensional simplex network indicates the number of links formed by two innovators. Similarly, the weight of each 2-dimensional simplex represents the number of patents jointly applied for by the three applicants represented by these three nodes. The number of 2-dimensional simplexes indicates the number of triangles formed by three applicants, and so on, for higher-order interactions.

3.2. Generalized Degree

Inter-organizational differences in innovation resources, innovation capabilities, and innovation environment vary the importance of members in the patent application cooperative innovation network. The key nodes and key cooperation relationships that occupy an important position in the network often play a crucial role in the development of the innovation network. Degree centrality as the most direct indicator of node centrality in complex networks can describe node importance to identify significant nodes. The degree centrality of nodes in a collaboration network positively affects their innovation performance. The greater the degree of a node, the higher its degree centrality, and the more partners it has. It is natural to desire to extend the concept of degrees to simplicial complexes.
Additionally, the generalized degree k d , m α of an m-dimensional simplex α indicates the number of d-dimensional simplices incident to the m-simplex α. The higher-order networks constructed in this paper are pure d-dimensional simplex networks. The generalized degrees k d , m α of a pure d-dimensional simplicial complex can be represented in terms of the adjacency tensor a[d] as [45,46]:
k d , m α = α Q d N | α α a α d
where Q d N   is the set of all possible and distinct d-dimensional simplexes including N nodes. α is a simplex composed of a subset of nodes of the simplex α ( α α ). The adjacency tensor, denoted as a d , plays a crucial role in analyzing the presence or absence of each possible d-dimensional simplex within the set of simplexes. The adjacency tensor a[d] has elements a α d 0,1 indicating, for every possible d-dimensional simplex α Q d N , if the simplex is present ( a α = 1 ) or absent ( a α = 0 ). By examining the values in the adjacency tensor, one can understand the connectivity and relationships among the various d-dimensional simplexes in the overall structure.
The generalized degree of the node on the 1-dimensional simplex k 1,0 r represents the number of times that the organization r participated in applications for the patents jointly applied for by two innovation organizations. k 2,0 r   represents the number of times that the organization r participated in the joint patent applications involving three organizations. The higher the centrality of key nodes in the network, the more significance their position will hold. Establishing cooperative relationships with more innovative organizations is conducive to resource accumulation and promotes the flow and allocation of knowledge, information, technology, and other innovation elements between nodes. Key nodes with high centrality play a leading and organizational role in innovation aggregation, utilizing their resource advantages. A pure 2-dimensional simplicial complex patent application network is formed by a set of triangles, links, and nodes. The importance of innovation entities in pure 2-complex patent application networks can be described as the generalized degree k 2,1 r , s of the 2-dimensional simplicial complex. k 2,1 r , s   represents the times of the organization r and organization s joint patent application. The larger the k 2,1 r , s , the more organizations that innovation organization r and organization s cooperate with. Therefore, the generalized degree can be an indicator to identify critical partners in the 2-simplex patent cooperation application network [47]. To identify key nodes and cooperative partners, this paper extends the notion of degrees in complex networks to the generalized degree in the simplicial complex. The meanings of the symbols in the paper are presented in Table 1.

3.3. Spatial Analysis of Patent Cooperation Activities

We analyze the spatio-temporal evolution characteristics of industrial patent cooperation application activities from the view of pure simplicial complexes. To investigate the influence of regional boundaries on patent cooperation, the study first counts the number and proportion of patents applied for through internal cooperation in different regions (provinces, cities). Secondly, the evolutionary network of interregional cooperation applying for patents is constructed to analyze spatial patterns of cross-regional patent cooperation activities at different stages. Finally, we introduce the “cooperation breadth–cooperation depth” two-dimensional matrix to classify patent applicant regions into four categories. This classification can provide a theoretical basis for the government to formulate regional industrial innovation policies and for enterprises to make informed decisions.

4. Data and Life Cycle Division

In this study, the data utilized in this study were sourced from the website of the State Intellectual Property Office of the People’s Republic of China (SIPO) (http://www.sipo.gov.cn) [48]. We downloaded patent data using the keywords “electric vehicle OR hybrid vehicle OR fuel cell vehicle OR gas vehicle OR methanol vehicle OR energy storage vehicle OR capacitor vehicle OR new energy vehicle” and similar expressions. The retrieval period for joint patent applications was set from 2012 to 2021. The applicants were defined as companies, research institutes, research centers, universities, colleges, and other institutions. After deduplication, filtering, and removal of data with invalid patent applicants, a total of 4112 patents were identified and there were 1692 entities involved in collaborative innovation.
Figure 3 illustrates the annual distribution of collaborative patents for the NEV industry, providing insights into the evolving maturity of NEV technologies in China over the years. Overall, from 2012 to 2021, the number of patents generally exhibits a tortuous upward trend. The number of collaboration patents for the NEV industry from 2012 to 2015 ranged between 200 and 300 each year, and the number of co-patents started to increase, with over 300 in 2016. During the period between 2016 and 2018, the number of patents experienced rapid growth. The number of patents gradually remained stable from 2019 to 2021. This shows that China’s NEV industry is developing and moving forward in a tortuous manner. To observe the characteristic structure and evolutionary features of higher-order networks at different periods, we divided the data into three phases: 2012–2015, 2016–2018, and 2019–2021.

5. Evolution Analysis of Higher-Order Network Structure

5.1. The Description of the Higher-Order Network

If innovation organizations are regarded as network nodes and two innovation organizations cooperate to apply for a patent, the two nodes form a one-dimensional simplex (link). If three innovation organizations cooperate to apply for a patent, the three nodes form a two-dimensional simplex (triangle). The applicants for a patent include four organizations, and these four nodes form a three-dimensional simplex (tetrahedron), and so on. The weight of the simplex represents the number of collaborative patents by the organizations, and thus the sum of all simplex weights represents the total number of collaborative patents.
Table 2 shows the collaborative patents of each dimension simplex on the higher-order network constructed in the NEV industry. In Table 2, when the dimension equals 1, the number of patent applications is 2446, indicating that 2446 patents were jointly applied for by two innovative entities. When the dimension equals 2, the number of patent applications is 883, indicating that 883 patents were jointly applied for by three innovative entities. When the dimension equals 3, it means that 277 patents were jointly applied for by four innovative entities, and so on. Collaborative patents on one-dimensional simplex and two-dimensional simplex account for 66.4% and 24.0% of the higher-order collaborative network, respectively. The number of three-dimensional simplexes and higher-dimensional simplexes is relatively small, indicating that patent cooperation in the NEV industry is highly competitive and exclusive. It is difficult to find statistical rules from the small number of simplexes. Therefore, this paper mainly focuses on studying the characteristics of patent cooperation on one-dimensional and two-dimensional simplexes.

5.2. Structural Characteristics of the Higher-Order Collaboration Network

To further analyze the evolution characteristics of the three-stage interaction on patent collaboration networks in the NEV industry, this subsection introduces some structural indicators of the collaboration network. Table 3 shows the number of nodes, number of simplexes, number of patents, maximum node generalized degree, and maximum link generalized degree for one-dimensional and two-dimensional simplex networks in three different stages. “Number of d-simplexes” refers to the number of collaborative relationships between d + 1 innovative entities in the network, while “Number of patents” refers to the number of patents generated from those collaborations. “Maximum node Generalized degree” refers to the highest generalized degree among all nodes in the network, which represents the level of influence of a node within the network. “Maximum link Generalized degree” refers to the highest generalized degree among all links in the network, which represents the level of importance of a link within the network.
According to Table 3, the scale of patent applicants in the one-dimensional simplex collaborative innovation network of the NEV industry has increased significantly, from 183 in the period of 2012–2015 to 455 in the period of 2019–2021. The number of collaboration patents in the NEV industry has increased significantly from 704 to 982, indicating that an increasing number of organizations are willing to participate in the research and development (R&D) of the NEV industry through patent collaboration. It has been observed that the growth rate of “number of simplexes”, which refers to the relationships between innovative entities, is much higher than the growth rate of the “number of patents”, which refers to the number of patents. This suggests that the collaboration between innovative entities is becoming increasingly close, as evidenced by the rapid growth of their relationships in comparison to the relatively slow growth of patent quantity. This may help improve innovation efficiency and quality, as closer collaboration between innovative entities can lead to more effective and higher-quality innovation. In addition, the maximum node generalized degree has decreased from 20 to 14, which suggests that the power of important nodes in the network is gradually becoming more dispersed, and is no longer concentrated in a few nodes.
The number of nodes in the two-dimensional simplex collaboration network has significantly increased, from 237 to 525 in the period of 2019–2021, along with an increase in the number of simplexes from 91 to 193. This trend indicates that the mode of collaboration innovation among three organizations is becoming more and more popular over time. Moreover, the increase in the maximum node generalized degree and the maximum edge generalized degree from the second stage to the third stage is greater than the change from the first stage to the second stage on the two-dimensional simplex network. This suggests that the importance of the three-organization collaboration mode in the patent collaboration network is beginning to be highlighted.

5.3. Generalized Degree Distribution of Nodes and Edges

In the previous section, we analyzed the overall structural characteristics of the higher-order patent collaboration network in China’s NEV industry from 2012 to 2021, at different stages. To explore the distribution characteristics of nodes and edges, Figure 4 presents the generalized degree distribution of nodes and edges in the one-dimensional simplex network and two-dimensional simplex network of China’s NEV industry from 2012 to 2021, plotted on a double logarithmic coordinate system. Figure 4a,d,g represent the generalized degree distribution of nodes in a 1-simplex network in 2012–2015, 2016–2018, 2019–2021, respectively. Figure 4b,e,h represent the generalized degree distribution of nodes in a 2-simplex network for the periods 2012–2015, 2016–2018, and 2019–2021, respectively. Figure 4c,f,i represent the generalized degree distribution of edges in a 2-simplex network in 2012–2015, 2016–2018, and 2019–2021, respectively.
From Figure 4, it is evident that nodes in both the one-dimensional and two-dimensional simplicial networks follow a power law distribution. This indicates that the majority of nodes have only a few edges, while a small number of nodes have a large number of edges. This implies that in the NEV industry, most innovative organizations participate in a limited number of joint patent applications, while a select few organizations collaborate frequently and apply for most of the patents. These highly connected nodes occupy critical positions in the collaboration network, and play a significant role in driving innovation and development. The generalized degree distribution of edges in the two-dimensional simplex network also follows a power law distribution (see Figure 4c,f,i), indicating that a small number of edges contribute to a large number of triangles, while most edges only form a small number of two-dimensional simplices. This suggests that the two-dimensional simplex network includes some critical edges that play a leading role in the patent collaboration network of the three organizations. The heterogeneity of both nodes and edges in the network indicates that innovation organizations and their partners exhibit significant diversity in terms of their connectivity and collaboration patterns. Furthermore, it is clear from Figure 4 that, as time progresses, the equations describing the generalized degree distribution of nodes and links become increasingly steep. This indicates that as the network of the NEV industry evolves, the significance of nodes and links becomes more prominent. Exploring the changes in significant nodes and links is crucial for understanding the evolutionary process of higher-order networks.

6. Evolution Analysis of Key Nodes and Edges

6.1. Identification of Key Nodes and Links

In order to visualize the evolving higher-order networks, this section utilizes Gephi software to generate patent collaboration network maps of the NEV industry. These maps specifically focus on the applicants within the one−dimensional and two−dimensional simplex networks, covering three distinct periods: 2012–2015, 2016–2018, and 2019–2021. The resulting network maps are displayed in Figure 5. The nodes represent patent applicants, which are composed of a variety of organizations including enterprises, universities, and scientific research institutes. The links between the two nodes represent the collaborative relationship between two patent applicants. Similarly, the triangles represent the cooperative application relationship of three patent applicants. In the patent collaboration network maps shown in Figure 5, the thickness of the edges or triangles between nodes represents the frequency of collaboration between two or three patent applicants. The thicker the edge or triangle, the higher the frequency and intensity of collaboration between the respective patent applicants.
Figure 5a illustrates that the network was relatively sparse during the period from 2012 to 2015. From 2012 to 2015 to 2019 to 2021, the scale and density of the patent collaboration network in the NEV industry showed a significant increase. In the one-dimensional simplex patent collaboration network of 2012–2015 (Figure 5a), the State Grid Corporation of China and the China Academy of Launch Vehicle technology emerged as the core nodes. On the two-dimensional simplex patent collaboration network during the same period, a two-dimensional simplex group centered on the State Grid Corporation of China was formed, and the majority of collaborative patents involved either research institutes or universities. During the period from 2016 to 2018, the number of secondary-importance nodes in the network increased, leading to the emergence of a “one superpower, multiple strong players” situation.
During 2019–2021, the patent collaboration network in the NEV industry experienced a significant increase in scale, with many innovation hubs rapidly emerging in the one-dimensional simplex network during this period. These hubs included several enterprises such as the State Grid Corporation of China, the China Electric Power Research Institute Co., Ltd., the China Automotive Technology Research Center Co., Ltd., and the China Automotive Engineering Research Institute Co., Ltd. Moreover, the network also included some research institutes such as the China Academy of Launch Vehicle Technology, as well as universities such as Zhejiang University, North China Electric Power University, Chongqing University, Southeast University, Beijing Institute of Technology, Tsinghua University, and Beijing Jiaotong University. In the two-dimensional simplex patent collaboration network depicted in Figure 6f, it is worth noting that there were several key edges in the network, in addition to the two-dimensional simplex groups with the State Grid Corporation of China and Zhejiang University as central nodes.

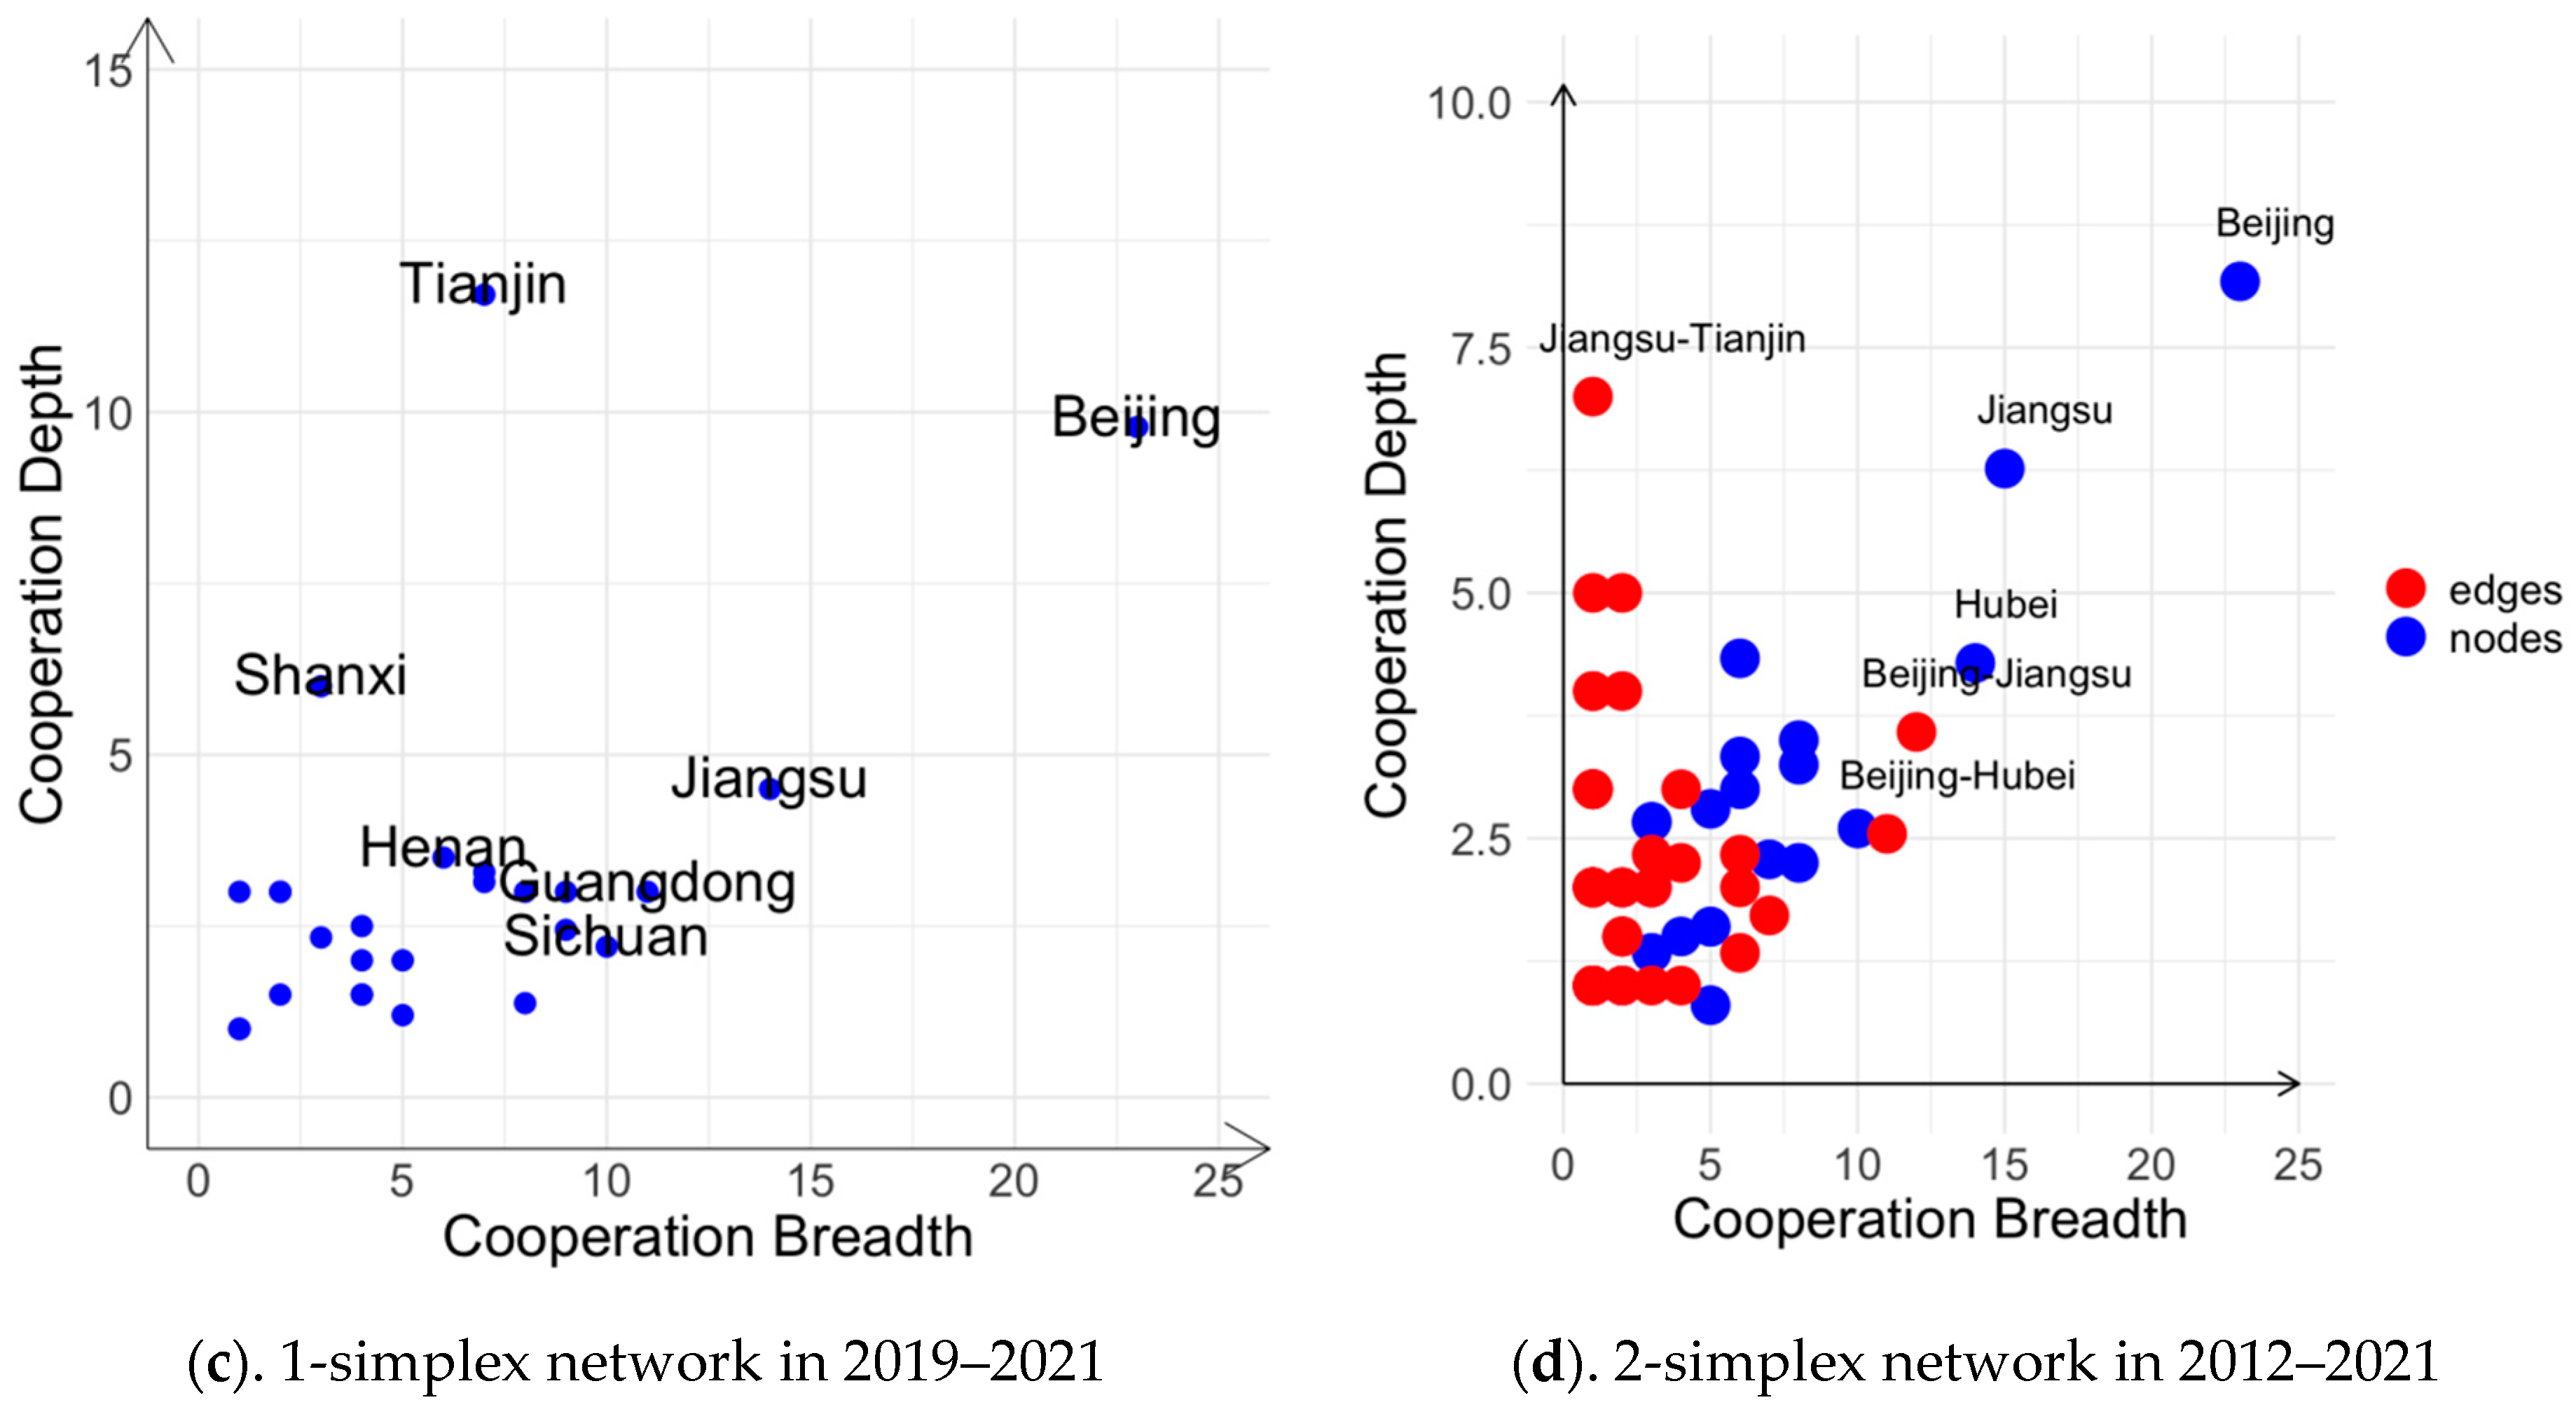
6.2. Collaboration Breadth and Depth of Nodes and Edges

To holistically evaluate the roles played by nodes and edges in innovation networks, this subsection presents the “cooperation breadth–cooperation depth” framework. This subsection is employed to analyze the collaboration breadth and depth distribution of innovation organizations and innovation partners on the one-dimensional and two-dimensional simplex networks during different periods. The collaboration breadth of nodes and edges is reflected by the node generalized degree and edge generalized degree, respectively. According to the theory of the Matthew effect, nodes and edges with a wider collaboration breadth have a greater ability to facilitate connections with others [49]. Broadening the scope of collaboration results in increased access to innovative resources, thereby incentivizing more organizations to join the collaboration and assume central roles in the network as key hubs. This section evaluates the collaboration breadth of innovation individuals and partners by analyzing the values of k 1,0 r , k 2,0 r and k 2,1 r , s . In general, the collaboration depth of a node is evaluated using its unit weight, where the unit weight is calculated as the sum of the weights of edges connected to the node divided by the node’s degree. Similarly, the collaboration depth of a node r in a two-dimensional simplex network is calculated as the sum of the weights of 2-simplex connected to that node divided by the node’s generalized degree k 2,0 r . The collaboration depth of an edge r , s   in a two-dimensional simplex network is calculated as the sum of weights of 2-simplex adjacent to that edge divided by the edge’s generalized degree k 2,0 r , s . This indicates the average weight of nodes or edges within the network. That is, the higher the average weight, the stronger the cooperative relationship with other organizations, indicating a more robust collaboration. Figure 6 depicts the cooperation breadth and cooperation depth of nodes and edges in both the 1-simplex and 2-simplex networks in China’s NEV industry.
Figure 6a,d demonstrate that the average breadth and depth of both nodes and edges were relatively low between 2012 and 2015. In the 1-simplex patent collaboration network, Zhejiang Geely Co., Ltd., Beijing Precision Electromechanical Control Equipment Research Institute and Beijing Aerospace Systems Engineering Research Institute exhibited a low-breadth–high-depth position. Tsinghua University and Nanjing University of Aeronautics and Astronautics held a high-breadth–low-depth position. The State Grid Corporation of China and the China Academy of Launch Vehicle Technology occupied a high-breadth–high-depth position, indicating their significant importance in the networks. On the two-dimensional simplex patent collaboration network of China’s NEV industry, the connection between the State Grid Corporation of China State and Grid Shandong Electric Power Company’s Electric Power Science Research Institute is positioned at a high breadth and high depth. Nevertheless, the connection between Zhejiang Geely Holding Group Co., Ltd. and Zhejiang Geely Automotive Research Institute Co., Ltd. is positioned at a low breadth and high depth. In general, during this period, most nodes and edges were characterized by a low-breadth–low-depth position, suggesting that the network was still in its infancy.
In the 1-simplex patent collaboration network between 2016 and 2018 (refer to Figure 6b), Southeast University and the University of Electronic Science and Technology were positioned at high breadth–low depth, indicating the presence of numerous targets for knowledge exchange. The Beijing Institute of Spacecraft System Engineering, Zhejiang Geely Automotive Research Institute Co., Ltd. and Pan Asia Technical Automotive Center Co., Ltd. were located in the low-breadth–high-depth position, suggesting that they had established relatively stable collaborative relationships with other organizations. The China Academy of Launch Vehicle Technology and the State Grid Corporation of China held positions of high breadth and high depth, indicating their significant influence as dominant players in the collaboration networks during 2016 and 2018. In the 2-dimensional simplex patent cooperation network of China’s NEV industry in 2016–2018 (as shown in Figure 6e), most nodes occupied low-breadth–low-depth positions, except for the State Grid Corporation of China and Beijing China Railway Technology Energy Conservation and the Environmental Protection New Technology Co., Ltd., which were in high-breadth–high-depth positions. Shandong Hengyuan New Energy Technology Co., Ltd. and Nanjing Otebo Electromechanical Technology Co., Ltd. held low-breadth–high-depth positions. Based on Figure 6e, it is evident that, compared to the first stage, there is a significant increase in the cooperation depth of the network. This indicates that the relationships between the partners have become closer, and they are more deeply involved in and committed to the collaborative process. Overall, the majority of nodes and edges occupied low-breadth–low-depth positions, indicating a stage of rapid expansion.
During the period of 2019 to 2021, the distribution of nodes on the breadth–depth matrix displays significant variation. Compared to Figure 6b, it is evident from Figure 6c that there is a significant increase in the number of nodes with a wide range of collaborations. As demonstrated in Figure 6c, universities such as Zhejiang University, Southeast University, and Chongqing University hold a prominent position in the network, situated in a high-breadth position. This suggests that they possess abundant innovation resources and have the capability to cooperate effectively with other organizations. The Geely Auto Automobile Research Institute Co., Ltd., Zhongqi Research Automobile Inspection Center Co., Ltd. and Beijing Aerospace Launch Technology Research Institute are situated in a high-depth position, indicating that they have established stable collaborative relationships. The China Automotive Technology Research Center Co., Ltd. and the China Academy of Launch Vehicle Technology are situated in a high-breadth–high-depth position, indicating that they possesses ample knowledge resources, innovative abilities, and advantages in establishing stable relationships with other entities, and generate a vital role in the evolution of the 1-dimensional simplex cooperation network in China’s NEV industry.
In the two-dimensional simplex patent collaboration network of the NEV industry from 2019 to 2021, most nodes occupy the low-depth position, indicating the network is in a phase of significant expansion (as shown in Figure 6f). Large enterprises and universities, such as the State Grid Corporation of China, the China Electric Power Research Institute Co., Ltd., and Zhejiang University, hold a high-breadth position, indicating their important role and abundant innovation resources in the network. On the other hand, Shanghai Automotive Electric Drive Co., Ltd., Shanghai Automotive Electric Drive Engineering Technology Research Center Co., Ltd., and Shanghai Electric Drive Co., Ltd., as well as the edges connecting them, are positioned at a high depth, indicating that these enterprises have established stable cooperation relationships. The partnership between the State Grid Corporation of China and the China Electric Power Research Institute Co., Ltd. forms a high-breadth–high-depth connection, indicating a strong and stable collaboration between two organizations with significant innovation capabilities. This type of partnership is critical to the success of a multi-entity cooperative innovation network, as it allows for deep cooperation between the involved organizations and effective collaboration with other entities.
In conclusion, as the NEV industry continues to develop, there is an increasing breadth and depth of collaboration among nodes and edges. This signifies a deepening of the industry, where innovative entities are increasingly inclined towards collaborative approaches for innovation. Additionally, our observations reveal that large companies and research institutes tend to favor collaborations with a higher depth, indicating a focus on intensive cooperation. On the other hand, universities exhibit a preference for collaborations with higher breadth, highlighting their inclination towards broader collaborative engagements. These findings have significant implications for fostering effective industry–academia research partnerships, and enhancing the overall innovation ecosystem in the NEV industry.

7. Evolutionary Analysis of Regional Cooperation

To investigate the influence of regional factors on collaborative invention patents in China’s NEV industry, this section examines the spatial evolution of the higher-order patent collaboration network from 2012 to 2021. Based on the registered places of applicants with collaboration relationships, the provinces to which they belong can be identified. These provinces can then be used as nodes to construct a regional patent collaboration network. The nodes representing the provinces are connected by edges that represent patent collaboration relationships between the provinces. We can measure the strength of the connections between two nodes in the regional patent collaboration network by assessing the number of patents that applicants from the two provinces have applied for together. Similarly, the strength of the triangles between the three nodes can be determined by the number of patents applied for jointly by applicants from the three provinces.

7.1. Evolution Analysis of Intra-Regional Cooperation

Based on the analysis of the intra-regional distribution of the patent collaboration network, we can explore the impact of regional boundaries on patent collaboration. Table 4 presents the number of patent applications for intra-regional cooperation in China’s NEV industry, the total number of regional patent applications, and the percentage of patent applications for intra-regional cooperation in relation to the total number of regional patent applications. During the initial stage of the one-dimensional simplex patent application network in the NEV industry, the number of patent applications was relatively low, and the time was early. Therefore, the following section mainly focuses on analyzing the two stages from 2016 to 2018 and 2019 to 2021. By comparing the average proportions of internal cooperation in the NEV industry between these two periods, the regions where internal cooperation exists have been classified into four distinct categories. The proportion of intra-regional cooperation in the first category remains high in both 2016–2018 and 2019–2021 (higher than 60%). In both stages, the proportion of collaboration in Shanghai, Zhejiang, Fujian, Guangdong, Gansu and Guangxi is higher than 60%, which suggests that these regions prefer to collaborate with partners within their own region and rely on knowledge exchange within the region. This also indicates that regional boundaries have a significant impact on their patent collaboration behavior. The second category of regions consistently exhibits low levels of internal cooperation (below 60%) during both the 2016–2018 and 2019–2021 periods. Specifically, Tianjin, Chongqing, Hebei, Liaoning, Jiangsu, Shandong, Henan, Hubei, Sichuan and Shaanxi all exhibit values below 60%, but greater than 0. This indicates that these regions prefer to collaborate with partners from outside their own region and rely on knowledge exchange across regions, thereby suggesting that regional boundaries have a relatively minor influence on their patent cooperation behavior. The third category of regions includes those where the proportion of internal cooperation was higher than 60% during 2016–2018, but lower than 60% during 2019–2021. The proportion of internal cooperation shows that the proportion of internal cooperation decreases significantly in Beijing, Shanxi and Anhui in the two periods. The decreasing trend from higher than the average value to lower than the average value indicates that the influence of regional boundaries on patent cooperation decreases significantly. The fourth category comprises regions where internal cooperation is negligible, as exemplified by Jilin, Heilongjiang, Jiangxi, Guizhou, Yunnan, and Inner Mongolia, all of which recorded 0 internal cooperation ratio during 2016–2018. This indicates that these regions face a scarcity of internal resources, and therefore seek out partners from other regions with richer resources. In the one-dimensional simplex patent application network, the overall proportion of intra-regional collaborative patents has decreased from 0.62 to 0.49. This indicates that with the development of globalization, information technology, and the NEV industry, cooperation is no longer limited to specific regions, but has become more frequent in terms of technological exchange and collaboration between different regions.
Since the number of collaboration patents of the three organizations of the NEV industry in every stage is relatively small, this paper counts the number and proportion of intra-regional collaboration patents in the two-dimensional simplex network between 2012 and 2021, and does not count by stages. In the two-dimensional simplex network, the three organizations also prefer internal cooperation, with an overall internal cooperation ratio of 0.63 (see Table 4). Collaborating on patents among multiple entities in a region can lead to cost savings and risk mitigation. By pooling resources and knowledge, the entities can reduce expenses and share the risks involved in the patent development process. The proportion of intra-regional patent applications in the Beijing, Shanghai, Shanxi, Hunan, and Zhejiang regions exceeds 60%, suggesting that these regions rely heavily on the accumulation of knowledge, technology, and information within their own region. Regional boundaries play a significant role in patent cooperation within these regions. On the other hand, the number of internal patent applications in Tianjin, Jiangsu, Shandong, Anhui, Hubei, and Sichuan, among others, is less than 60%, indicating that regional boundaries have a less significant impact on patent cooperation in these regions. Organizations within these regions tend to collaborate with partners from different regions and make the most of the advantages of other areas, such as combining different production elements.
Overall, Shanghai, Zhejiang, Guangdong, and Beijing, as economically prosperous regions with ample resources, have exhibited a preference for intra-provincial cooperation. However, with the advancement of industries and information technology, there has been a downward trend in the proportion of internal collaboration, indicating a shift towards collaboration with other regions. Conversely, Hebei, Shandong, Henan, Hunan, Sichuan, and Shaanxi, which have a relative lack of technology resources, have had lower rates of internal collaboration. Over time, there has been an increase in the internal collaboration proportion for these regions. The overall decrease in the intra-provincial collaboration proportion signifies the emerging trend of inter-regional cooperation as the future direction of development. These findings suggest that the impact of regional boundaries on patent cooperation varies across different regions, and it is essential to understand regional differences when developing strategies to promote innovation and collaboration.

7.2. Evolution Analysis of Cross-Regional Cooperation

(1)
Evolution map of cross-regional patent collaboration network
In this subsection, to visualize the patterns of patent collaborations across regions in China’s NEV industry, we use Gephi software to draw network maps. The section presents spatial evolution maps of 1-dimensional simplex patent collaboration networks from 2012 to 2015, 2016 to 2018, and 2019 to 2021(see Figure 7a–c), as well as a spatial evolution map of 2-dimensional patent collaboration networks from 2012 to 2021 (see Figure 7d). These visualizations provide insights into the changing dynamics of patent collaborations across regions and over time in China’s NEV industry. Figure 7 indicates that the nodes represent provincial administrative regions or municipalities directly under the control of the Central Government in China. The links between nodes on the map represent cross-regional collaboration relationships, with thicker edges indicating more frequent collaborations. The thickness of the edges represents the number of patents applied for by cross-regional collaborations in China’s NEV industry. The visualization clearly shows that the scale of cross-regional patents in China’s NEV industry has been expanding continuously. Beijing has always been at the center of the patent collaboration network, while Jiangsu, Zhejiang, Guangdong, and Shanghai are at the sub-center of the network. These regions have rapid economic development, well-established infrastructure, and a strong awareness of environmental protection and clean consumption, making them ideal partners for R&D collaboration in the NEV industry. They have actively sought out partners from different regions to establish patent collaboration relationships, leading to their prominent position in the network. Chongqing, Shandong, Hubei, Hebei, and Henan are also emerging as important players in the network. On the other hand, Inner Mongolia, Jilin, Shaanxi, Ningxia, Hunan, Qinghai, Anhui, and Guizhou have a relatively marginal position in the network, and show weak patent collaboration with other regions.
(2)
Cooperation breadth and depth of cross-regional patent collaboration
Additionally, this section introduces a “breadth–depth” two-dimensional matrix to analyze the spatial distribution pattern of cross-regional patent collaboration in China’s NEV industry [48]. As illustrated in Figure 8, the breadth of cross-regional cooperation is depicted by the generalized degree of regional nodes and cross-regional edges. The average weight of the generalized degree of nodes and edges is an indicator of the depth of cross-regional collaboration. The collaboration depth of a node r in a two-dimensional simplex network is calculated as the sum of weights of 2-simplex connected to that node, divided by the node’s generalized degree k 2,0 r . The collaboration depth of an edge r , s   in a two-dimensional simplex network is calculated as the sum of weights of 2-simplex adjacent to that edge divided by the edge’s generalized degree k 2,0 r , s .
Between 2012 and 2015, Jiangsu, Guangdong, and Beijing were in a high-breadth position, whereas Shandong, Hubei, Hebei, and Chongqing held a high-depth position (see Figure 8a). From Figure 8b, it can be observed that, compared to the previous period, the emergence of high-depth nodes in Tianjin and high-breadth and high-depth nodes in Hubei between 2016 and 2019 indicates that Tianjin has developed deeper levels of cooperation, while Hubei has gained significant prominence within the network. During the period from 2019 to 2021 (see Figure 8c), the breadth and depth of the nodes further increased, with the emergence of high-breadth and high-depth nodes in Henan, Shanxi, Sichuan, Shaanxi, and other central regions. This indicates that the central regions of China, including Henan, Shanxi, Sichuan, and Shaanxi, have gained significance in the network. It suggests that the development of the NEV industry has expanded from the eastern regions and entered the central regions of the country.
In the two-dimensional simplex patent collaboration network, Beijing, Jiangsu, Hubei, Shandong, Zhejiang, Guangdong, and Tianjin occupy a high-breadth–high-depth position (see Figure 8d). The Jiangsu–Tianjin, Jiangsu–Hubei, Zhejiang–Jiangsu, Jilin–Liaoning, Hubei–Shandong, and Hebei–Jiangsu links hold a high-depth position, indicating stable cooperative relationships have been established among these regions. The Beijing–Jiangsu, Beijing–Hubei, Beijing–Shandong, Beijing–Tianjin, and Beijing–Guangdong links also hold a high-breadth–high-depth position. This indicates that Beijing is not only the core of the three-entities cross-regional collaboration innovation network, but also serves as a bridge for collaboration and innovation with other regions.
In conclusion, the Beijing, Jiangsu, Hubei, Shandong, Zhejiang, Guangdong, and Tianjin regions hold significant positions in the network, indicating their importance in the development of the NEV industry in China. Additionally, Henan, Shanxi, Sichuan, Shaanxi, and other regions have gained prominence in the current stage, signifying a shift of the industry’s center from the eastern to the central regions in China. The central regions are expected to become crucial areas for future NEV development. Furthermore, Beijing has established stable and deep collaborations with Jiangsu, Hubei, Shandong, Tianjin, Guangdong, and other regions, acting as a pivotal bridge linking different areas within the network. Jiangsu has established stable cooperative relationships with several surrounding regions, leveraging its advantageous geographical location and the presence of multiple important economic centers.

8. Conclusions and Future Work

8.1. Conclusions

Nowadays, collaboration and teamwork are crucial for national innovation systems, with growing research focusing on collaborative innovation networks. However, little effort has been made to study higher-order interaction collaboration networks. This study aims to fill the gap in that many-body interactions of a complex system can be captured by simplicial complexes, expanding the limitations of SNA methods. Based on patent collaboration data on SIPO patents granted from 2012 to 2021 in China’s NEV industry, the 1-dimensional simplex network and 2-dimensional simplex network are constructed in different periods. Then, this paper identifies the key innovation organizations and key cooperative relationships in the patent collaboration network by introducing the generalized degree of nodes and edges in a higher-order network. Furthermore, the “cooperation breadth–cooperation depth” framework is used to analyze the impact of the organizations and partners on the collaboration network and the evolution characteristics of the cross-regional patent collaboration network. The following research conclusions are obtained.
(1) From 2012 to 2021, the number of patent collaborative organizations in China’s NEV industry increased rapidly, and patent collaboration networks are becoming increasingly dense. The generalized degree distribution of both nodes and edges follows a power-law distribution in both the one-dimensional and two-dimensional simplex networks, indicating the heterogeneity of nodes and edges. The heterogeneity of nodes and edges in the network signifies significant diversity in connectivity and collaboration patterns among innovation organizations and their partners. A small number of nodes and edges contribute to a large number of triangles, while the majority of nodes and edges only form a small number of two-dimensional simplices. The two-dimensional simplex network contains critical edges that play a leadership role in the patent collaboration network of the three organizations. Furthermore, as time progresses, the equations describing the generalized degree distribution of nodes and edges become increasingly steep, further illustrating the growing importance of nodes and edges in facilitating interactions among multiple innovation entities in the evolving network of the NEV industry.
(2) China’s NEV industry underwent a significant transformation from 2012 to 2021. Initially, the State Grid Corporation of China held an absolutely central position in the network. However, over time, the number of secondary-importance nodes increased, leading to the emergence of a “one superpower, multiple strong players” scenario in the one-dimensional network. In the two-dimensional simplex network, clusters of triangles centered around multiple nodes and edges have emerged. We also have found that large companies and research institutes tend to prefer collaboration with higher depth, while universities tend to adopt collaboration with higher breadth. This provides valuable insights for industry–academia research collaboration. In such collaborations, large companies and research institutes can establish deeper and closer partnerships with universities to share expertise and resources, thereby promoting technological innovation and product development. At the same time, universities can leverage their extensive collaboration networks to engage with diverse industries and research institutions, facilitating knowledge exchange and driving the translation of innovation and research outcomes.
(3) Intra-regional and cross-regional patent cooperation shows different spatial evolution patterns. The number of provinces involved in patent cooperation in China’s NEV industry is increasing, and patent cooperation is spreading from local regions all over the country. The overall decline in intra-provincial collaboration proportions highlights the emerging trend of inter-regional cooperation as the future direction of development. Regions such as Shanghai, Zhejiang, Guangdong, and Beijing tend to engage in intra-regional cooperation. However, with the development of industries and information technology, there has been a downward trend in the proportion of internal collaborations, indicating a shift towards collaborations with other regions. Conversely, regions such as Hebei, Shandong, Henan, Hunan, Sichuan, and Shaanxi, which have a relative lack of technological resources, have initially exhibited lower rates of internal collaborations but have seen an increase over time. In the cross-regional patent cooperation network, the regions of Beijing, Jiangsu, Hubei, Shandong, Zhejiang, Guangdong, and Tianjin play significant roles in the network, signifying their importance in the development of the NEV industry in China. The emergence of Henan, Shanxi, Sichuan, Shaanxi, and other central regions highlights the shift of the industry’s center from the eastern to the central regions of China. These central regions are expected to become crucial areas for future NEV development. Furthermore, Beijing acts as a vital bridge, fostering stable and deep collaborations with Jiangsu, Hubei, Shandong, Tianjin, Guangdong, and other regions. Jiangsu’s stable cooperative relationships with surrounding regions are facilitated by its geographical location and the presence of multiple important economic centers. These findings contribute to a comprehensive understanding of the NEV industry’s regional dynamics in China, and provide valuable insights for future research and industry development.

8.2. Future Work

The following future research directions are identified in this paper.
(1) This article does not provide a detailed analysis of the characteristics of patent applicants. In the future, more detailed research can focus on the nature and innovation assets of innovation organizations and investigate how these characteristics influence innovation cooperation behavior. Identifying the characteristics that have a significant impact on the network can provide valuable insights for policymakers and practitioners to facilitate and promote innovation collaboration more effectively.
(2) A higher-order network model can capture the multi-entity interaction behaviors that exist in the real world. Further research can use topological clustering of higher-order networks to explore communication and cooperation characteristics of different communities, promoting overall connectivity and openness of the cooperation network.
(3) This paper uses cooperative patent application data to construct a cooperative innovation network, which focuses on formal innovation. However, there may be other forms of informal innovation that are not considered in this study. It would be interesting to investigate the impact of informal innovation information on the collaborative innovation network of the NEV industry.
(4) We suggest incorporating comparison algorithms in the study of higher-order network models to gain a more comprehensive understanding of their strengths and weaknesses for future work. By comparing the performance and applicability of different algorithms, we can better evaluate the suitability and practicality of the higher-order network model, and determine which algorithm is more appropriate to use in different situations. This will help us better understand and apply the higher-order network model, thereby promoting innovation collaboration and improving innovation efficiency. Therefore, we encourage future researchers to include comparison algorithms in the study of higher-order network models, and explore them in depth.

Author Contributions

Writing—original draft, Y.Y.; Project administration, J.G.; Writing—review & editing, Z.G. All authors have read and agreed to the published version of the manuscript.

Funding

This research was funded by the National Natural Science Foundation of China under Grant No. 71571119.

Institutional Review Board Statement

Not applicable.

Informed Consent Statement

Not applicable.

Data Availability Statement

Not applicable.

Acknowledgments

This work was supported by the National Natural Science Foundation of China under Grant [71571119].

Conflicts of Interest

The authors declare no conflict of interest.

References

  1. Jaffe, A.B.; de Rassenfosse, G. Patent citation data in social science research: Overview and best practices. J. Assoc. Inf. Sci. Technol. 2017, 68, 1360–1374. [Google Scholar] [CrossRef]
  2. Jiang, X.; Wang, L.; Cao, B.; Fan, X. Benefit distribution and stability analysis of enterprises’ technological innovation cooperation alliance. Comput. Ind. Eng. 2021, 161, 107637. [Google Scholar] [CrossRef]
  3. Cho, R.L.-T.; Liu, J.S.; Ho, M.H.-C. The development of autonomous driving technology: Perspectives from patent citation analysis. Transp. Rev. 2021, 41, 685–711. [Google Scholar] [CrossRef]
  4. Alstott, J.; Triulzi, G.; Yan, B.; Luo, J. Mapping Technology Space by Normalizing Patent Networks. Scientometrics 2017, 110, 443–479. [Google Scholar] [CrossRef]
  5. Tsay, M.-Y.; Liu, Z.-W. Analysis of the patent cooperation network in global artificial intelligence technologies based on the assignees. World Pat. Inf. 2020, 63, 102000. [Google Scholar] [CrossRef]
  6. Liu, W.; Song, Y.; Bi, K. Exploring the patent collaboration network of China’s wind energy industry: A study based on patent data from CNIPA. Renew. Sustain. Energy Rev. 2021, 144, 110989. [Google Scholar] [CrossRef]
  7. Wang, C.; Zhang, G. Examining the moderating effect of technology spillovers embedded in the intra- and inter-regional collaborative innovation networks of China. Scientometrics 2019, 119, 561–593. [Google Scholar] [CrossRef]
  8. Liu, W.; Tao, Y.; Yang, Z.; Bi, K. Exploring and Visualizing the Patent Collaboration Network: A Case Study of Smart Grid Field in China. Sustainability 2019, 11, 465. [Google Scholar] [CrossRef] [Green Version]
  9. Yin, C.; Gu, H.; Zhang, S. Measuring technological collaborations on carbon capture and storage based on patents: A social network analysis approach. J. Clean. Prod. 2020, 274, 122867. [Google Scholar] [CrossRef]
  10. Liu, Y.; Yan, Z.; Cheng, Y.; Ye, X. Exploring the Technological Collaboration Characteristics of the Global Integrated Circuit Manufacturing Industry. Sustainability 2018, 10, 196. [Google Scholar] [CrossRef] [Green Version]
  11. Boccaletti, S.; De Lellis, P.; del Genio, C.I.; Alfaro-Bittner, K.; Criado, R.; Jalan, S.; Romance, M. The structure and dynamics of networks with higher order interactions. Phys. Rep. 2023, 1018, 1–64. [Google Scholar] [CrossRef]
  12. Gu, H.; Liu, Z.; Qing, Q. Optimal electric vehicle production strategy under subsidy and battery recycling. Energy Policy 2017, 109, 579–589. [Google Scholar] [CrossRef]
  13. Yuan, X.; Liu, X.; Zuo, J. The development of new energy vehicles for a sustainable future: A review. Renew. Sustain. Energy Rev. 2015, 42, 298–305. [Google Scholar] [CrossRef]
  14. Chen, Y.; Ni, L.; Liu, K. Does China’s new energy vehicle industry innovate efficiently? A three-stage dynamic network slacks-based measure approach. Technol. Forecast. Soc. Chang. 2021, 173, 121161. [Google Scholar] [CrossRef]
  15. Zhao, F.; Chen, K.; Hao, H.; Wang, S.; Liu, Z. Technology development for electric vehicles under new energy vehicle credit regulation in China: Scenarios through 2030. Clean Technol. Environ. Policy 2019, 21, 275–289. [Google Scholar] [CrossRef]
  16. Liu, J.; Chong, Z.; Lu, S. The Evolution and Determinants of Interorganizational Coinvention Networks in New Energy Vehicles: Evidence from Shenzhen, China. Complexity 2021, 2021, 6665945. [Google Scholar] [CrossRef]
  17. He, L.; Fan, F.; Hou, X.; Wu, H.; Wang, J.; Xu, H.; Sun, Y. 4(3H)-Quinazolone regulates innate immune signaling upon respiratory syncytial virus infection by moderately inhibiting the RIG-1 pathway in RAW264.7 cell. Int. Immunopharmacol. 2017, 52, 245–252. [Google Scholar] [CrossRef]
  18. Yang, S.; He, L.-Y. Fuel demand, road transport pollution emissions and residents’ health losses in the transitional China. Transp. Res. Part D Transp. Environ. 2016, 42, 45–59. [Google Scholar] [CrossRef] [Green Version]
  19. Zhang, L.; Qin, Q. China’s new energy vehicle policies: Evolution, comparison and recommendation. Transp. Res. Part A Policy Pract. 2018, 110, 57–72. [Google Scholar] [CrossRef]
  20. Brendel, A.B.; Lichtenberg, S.; Brauer, B.; Nastjuk, I.; Kolbe, L.M. Improving Electric Vehicle Utilization in Carsharing: A Framework and Simulation of an E-Carsharing Vehicle Utilization Management System. Transp. Res. Part D Transp. Environ. 2018, 64, 230–245. [Google Scholar] [CrossRef]
  21. Qin, S.; Xiong, Y. Innovation strategies of Chinese new energy vehicle enterprises under the influence of non-financial policies: Effects, mechanisms and implications. Energy Policy 2022, 164, 112946. [Google Scholar] [CrossRef]
  22. Wang, X. Research on the impact mechanism of green finance on the green innovation performance of China’s manufacturing industry. Manag. Decis. Econ. 2022, 43, 2678–2703. [Google Scholar] [CrossRef]
  23. Marković, D.; Petković, D.; Nikolić, V.; Milovančević, M.; Denić, N. DETERMINATION OF IMPORTANT PARAMETERS FOR PATENT APPLICATIONS. Facta Univ. Series: Mech. Eng. 2017, 15, 307. [Google Scholar] [CrossRef] [Green Version]
  24. Guan, J.; Chen, Z. Patent collaboration and international knowledge flow. Inf. Process. Manag. 2012, 48, 170–181. [Google Scholar] [CrossRef]
  25. Fleming, L.; King, C., III; Juda, A.I. Small Worlds and Regional Innovation. Organ. Sci. 2007, 18, 938–954. [Google Scholar] [CrossRef] [Green Version]
  26. Sternitzke, C.; Bartkowski, A.; Schramm, R. Visualizing patent statistics by means of social network analysis tools. World Pat. Inf. 2008, 30, 115–131. [Google Scholar] [CrossRef]
  27. Ramos, M. The relation between R&D spending and patents: The moderating effect of collaboration networks. J. Eng. Technol. Manag. 2017, 46, 26–38. [Google Scholar] [CrossRef]
  28. Xiang, J.Q.; Ma, F.; Wang, H. The effect of intellectual property treaties on international innovation collaboration: A study based on USPTO patents during 1976–2017. Libr. Hi Tech 2023, 41, 666–682. [Google Scholar] [CrossRef]
  29. Müller, M.; Kudic, M.; Vermeulen, B. The influence of the structure of technological knowledge on inter-firm R&D collaboration and knowledge discovery: An agent-based simulation approach. J. Bus. Res. 2021, 129, 570–579. [Google Scholar] [CrossRef]
  30. Lee, C.; Kogler, D.F.; Lee, D. Capturing information on technology convergence, international collaboration, and knowledge flow from patent documents: A case of information and communication technology. Inf. Process. Manag. 2019, 56, 1576–1591. [Google Scholar] [CrossRef]
  31. Sun, Y.; Cao, C. Intra- and inter-regional research collaboration across organizational boundaries: Evolving patterns in China. Technol. Forecast. Soc. Chang. 2015, 96, 215–231. [Google Scholar] [CrossRef]
  32. Sun, Y. The structure and dynamics of intra- and inter-regional research collaborative networks: The case of China (1985–2008). Technol. Forecast. Soc. Chang. 2016, 108, 70–82. [Google Scholar] [CrossRef]
  33. Han, G.; Zhang, Z. Regional innovation paths selection in complex environments of China: A configurational perspective. Manag. Decis. Econ. 2022, 43, 2598–2606. [Google Scholar] [CrossRef]
  34. Sun, H.; Geng, Y.; Hu, L.; Shi, L.; Xu, T. Measuring China’s new energy vehicle patents: A social network analysis approach. Energy 2018, 153, 685–693. [Google Scholar] [CrossRef]
  35. Liu, F.; Zhang, N.; Cao, C. An evolutionary process of global nanotechnology collaboration: A social network analysis of patents at USPTO. Scientometrics 2017, 111, 1449–1465. [Google Scholar] [CrossRef]
  36. Lin, W.; Liu, X.; Xiao, R. Data-driven Product Functional Configuration: Patent Data and Hypergraph. Chin. J. Mech. Eng. 2022, 35, 57. [Google Scholar] [CrossRef]
  37. Estrada, E.; Rodríguez-Velázquez, J.A. Subgraph centrality and clustering in complex hyper-networks. Phys. A Stat. Mech. its Appl. 2006, 364, 581–594. [Google Scholar] [CrossRef] [Green Version]
  38. Zhao, L.; Zhang, H.; Wu, W. Cooperative knowledge creation in an uncertain network environment based on a dynamic knowledge supernetwork. Scientometrics 2019, 119, 657–685. [Google Scholar] [CrossRef]
  39. Battiston, F.; Cencetti, G.; Iacopini, I.; Latora, V.; Lucas, M.; Patania, A.; Young, J.-G.; Petri, G. Networks beyond pairwise interactions: Structure and dynamics. Phys. Rep. 2020, 874, 1–92. [Google Scholar] [CrossRef]
  40. Barabási, A.-L. Luck or reason. Nature 2012, 489, 507–508. [Google Scholar] [CrossRef]
  41. Bianconi, G. Higher-Order Networks, 1st ed.; Cambridge University Press: Cambridge, UK, 2021. [Google Scholar] [CrossRef]
  42. Cinardi, N.; Rapisarda, A.; Bianconi, G. Quantum statistics in network geometry with fractional flavor. J. Stat. Mech. Theory Exp. 2019, 2019, 103403. [Google Scholar] [CrossRef] [Green Version]
  43. Iacopini, I.; Petri, G.; Barrat, A.; Latora, V. Simplicial models of social contagion. Nat. Commun. 2019, 10, 2485. [Google Scholar] [CrossRef] [PubMed] [Green Version]
  44. Bianconi, G.; Ziff, R.M. Topological Percolation on Hyperbolic Simplicial Complexes. Phys. Rev. E 2018, 98, 052308. [Google Scholar] [CrossRef] [Green Version]
  45. Courtney, O.T.; Bianconi, G. Generalized network structures: The configuration model and the canonical ensemble of simplicial complexes. Phys. Rev. E 2016, 93, 062311. [Google Scholar] [CrossRef] [Green Version]
  46. Yao, L.; Li, J.; Li, J. Urban innovation and intercity patent collaboration: A network analysis of China’s national innovation system. Technol. Forecast. Soc. Chang. 2020, 160, 120185. [Google Scholar] [CrossRef]
  47. Patania, A.; Petri, G.; Vaccarino, F. The shape of collaborations. EPJ Data Sci. 2017, 6, 18. [Google Scholar] [CrossRef] [Green Version]
  48. Liegsalz, J.; Wagner, S. Patent examination at the state intellectual property office in China. Res. Policy 2013, 42, 552–563. [Google Scholar] [CrossRef] [Green Version]
  49. Yan, D.; Ahmad, S.Z.; Yang, D. Matthew effect, ABC analysis and project management of scale-free information systems. J. Syst. Softw. 2013, 86, 247–254. [Google Scholar] [CrossRef]
Figure 1. Simplexes with different dimensions.
Sustainability 15 11478 g001
Figure 2. Different faces of a 3-simplex (tetrahedron).
Sustainability 15 11478 g002
Figure 3. Patent application trend from 2012 to 2021.
Sustainability 15 11478 g003
Figure 4. Generalized degree distribution of nodes and edges of 1-simplex and 2-simplex networks from 2012 to 2021.
Sustainability 15 11478 g004aSustainability 15 11478 g004b
Figure 5. Network maps of one-dimensional and two-dimensional simplex collaboration in the NEV industry from 2012 to 2021.
Sustainability 15 11478 g005aSustainability 15 11478 g005b
Figure 6. Collaboration breadth–depth matrix.
Sustainability 15 11478 g006
Figure 7. Evolution map of cross-regional patent collaboration in China’s NEV industry.
Sustainability 15 11478 g007
Figure 8. Distribution pattern of cross-regional patent collaboration in China’s NEV industry.
Sustainability 15 11478 g008aSustainability 15 11478 g008b
Table 1. List of the major symbols.
SymbolInterpretation
G (V, E)G represents the graph, V the set of nodes, E the set of edges
d-simplexSimplex of order d
k 1,0 r Generalized 1-degree of a node r
k 2,1 r , s Generalized 2-degree of an edge r , s
Q d N The set of all possible and distinct d-dimensional simplexes including N nodes
a d Adjacency tensor of d-simplex
k d , m α Generalized d-degree of m-simplex α
Table 2. The number of patent applications in each dimension.
Dimension1234567
Patent applications2446883277461994
Table 3. Structural characteristics of higher-order patent collaboration network in China’s NEV industry from 2012 to 2021.
Period2012–20152016–20182019–2021
Dimensiond = 1d = 2d = 1d = 2d = 1d = 2
Nodes277237418250671525
Number of simplexes18391269141455193
Number of patents704259754279986345
Maximum node Generalized degree204919931488
Maximum link Generalized degree-8-11-15
Table 4. Number and ratio of intra-regional collaboration patents.
2016–20182019–20212012–2021
Intra-Regional PatentsCollaboration PatentsRatioIntra-Regional PatentsCollaboration PatentsRatioIntra-Regional PatentsCollaboration PatentsRatio
Beijing25035470.62%12635135.90%30942472.88%
Tianjin53514.29%6886.82%31225.00%
Shanghai486277.42%557771.43%617087.14%
Chongqing163053.33%214348.84%112250.00%
Hebei1812.50%81457.14%1195.26%
Shanxi4580.00%153345.45%6875.00%
Liaoning51533.33%2922.22%2540.00%
Jilin000.00%1119.09%2366.67%
Heilongjiang000.00%1714.29%000.00%
Jiangsu356058.33%7714055.00%204445.45%
Zhejiang10111587.83%14316785.63%768292.68%
Anhui61060.00%102050.00%2633.33%
Fujian71070.00%111764.71%55100.00%
Jiangxi000.00%1714.29%000.00%
Shandong103033.33%194245.24%2385.26%
Henan2825.00%173844.74%4757.14%
Hubei63119.35%134032.50%1303.33%
Hunan132552.00%131968.42%91090.00%
Guangdong254160.98%508360.24%133339.39%
Sichuan82630.77%83026.67%2219.52%
Guizhou000.00%4580.00%000.00%
Yunnan1616.67%3475.00%11100.00%
Shaanxi11010.00%152657.69%1425.00%
Gansu3475.00%6966.67%2450.00%
Inner Mongolia000.00%1911.11%000.00%
Guangxi22100.00%1313100.00%000.00%
Sum54988762%639130249%53384863%
Disclaimer/Publisher’s Note: The statements, opinions and data contained in all publications are solely those of the individual author(s) and contributor(s) and not of MDPI and/or the editor(s). MDPI and/or the editor(s) disclaim responsibility for any injury to people or property resulting from any ideas, methods, instructions or products referred to in the content.

