Article

Numerical Study on Wave Dissipation Performance of OWC-Perforated Floating Breakwater under Irregular Waves

1
College of Marine and Civil Engineering, Dalian Ocean University, Dalian 116023, China
2
Key Laboratory of Environment Controlled Aquaculture, Dalian Ocean University, Ministry of Education, Dalian 116023, China
3
Sichuan Rural Water Conservancy Center, Chengdu 610031, China
4
School of Hydraulic Engineering, Faculty of Infrastructure Engineering, Dalian University of Technology, Dalian 116024, China
*
Author to whom correspondence should be addressed.
Sustainability 2023, 15(14), 11427; https://doi.org/10.3390/su151411427
Submission received: 5 June 2023 / Revised: 14 July 2023 / Accepted: 21 July 2023 / Published: 23 July 2023

Abstract

:
This paper utilizes ANSYS-AQWA hydrodynamic simulation analysis software (2022 R2) to investigate the wave dissipation performance of an Oscillating Water Column (OWC) perforated floating breakwater under irregular wave conditions. The study examines the effect of spacing, width of the OWC opening, water depth, incident wave angle, and significant wave height on the wave dissipation performance of the floating breakwater. The results indicate that the wave dissipation performance of the OWC-perforated floating breakwater surpasses that of similar structures. The transmission coefficient is significantly influenced by spacing and water depth when subjected to irregular waves. The width of the OWC opening also affects the wave dissipation to some extent, with wider openings demonstrating improved performance in the case of long-period waves. The incident wave angle of 0 degrees yields enhanced wave dissipation performance. Although the meaningful wave height has minimal impact on wave dissipation, it increases proportionally with the rise in meaningful wave height. This study offers valuable insights for the design and implementation of floating breakwaters and holds significant practical implications for the research on integrated devices combining floating breakwaters and wave power generation.

1. Introduction

In coastal engineering, floating breakwaters are crucial engineering structures that offer significant advantages such as portability, easy maintenance, and mobility. They hold great potential for broad application and align with the objectives of marine sustainable development, a key driver for global carbon reduction. Wave energy, being recognized as a clean and renewable energy source, has gained substantial attention. Therefore, the future development trend entails the research and development of floating breakwaters that exhibit excellent wave dissipation performance while incorporating wave power generation and other functionalities.
The transverse width of a double-body floating breakwater exceeds that of a single-body floating breakwater. Wave dissipation is based on the phase difference between the two bodies and the synergistic utilization of different energy dissipation methods [1]. In comparison to single-body floating breakwaters, double-body floating breakwaters demonstrate superior wave dissipation and attenuation effects. In recent years, scholars all over the world have continuously optimized the structure of double-body floating breakwaters and conducted numerous relevant numerical simulations and experimental research to enhance their wave dissipation effectiveness and ensure their safety and reliability.
In terms of numerical simulation, Williams et al. [1] employed the frequency domain method to calculate the transmission coefficient of the double-float floating breakwater. The results show that the width of the floating breakwater and the rigidity of the anchor chain significantly influence the transmission coefficient. Wang et al. [2] conducted simulations to assess the wave dissipation performance of a double floating box floating breakwater under long-period waves, demonstrating that the utilization of a double floating box (multi-floating box) effectively enhances the wave dissipation performance of the structure. Zheng et al. [3] utilized the time domain method to simulate the double box floating breakwater and validated its accuracy. Wang et al. [4] established through analysis of the time-domain motion equation that the spacing between the double-float breakwater elements exerts a considerable influence on the transmission coefficient. Sun et al. [5] proposed a box-type floating breakwater with kelp, and found that kelp improved the wave dissipation capacity of the breakwater, especially for long waves, by establishing a numerical model. Zhang et al. [6] propose a floating breakwater made of sponge material, and the results show that the breakwater has better wave-absorbing performance and range of motion response as the porosity of the sponge increases.
In terms of physical tests, Xu et al. [7] conducted experiments to investigate the relationship between the wave dissipation performance of a double row adjustable floating box breakwater and parameters such as wave steepness and spacing. Shen et al. [8] demonstrated that a rigidly connected double floating box type floating breakwater exhibits superior wave dissipation compared to a free double floating box type floating breakwater and a single box type floating breakwater. Shunichi and Yasuhiro [9] conducted physical tests on a double floating box type floating breakwater with inner and outer wings. The results indicate that the transmission coefficient gradually decreases with the increase in relative width, and the inner and outer wings also contribute to the reduction of wave energy.
Openings in a floating breakwater serve to effectively attenuate and break waves, leading to a reduction in the transmission coefficient and an enhanced wave dissipation effect. Wang [10] conducted tests on a porous floating breakwater constructed using a diamond module and concluded that the geometric structure within the floating breakwater significantly influences the transmission coefficient and cable force. Hu et al. [11] investigated the impact of porosity on structure wave dissipation through a combination of numerical simulation and physical experimentation. The findings indicate that the wave dissipation effect is not determined by porosity, and structures with smaller pore sizes exhibit better performance.
In wave energy development devices, oscillating water column (OWC) wave power generation devices are widely utilized. Many experts studied the OWC structure by experimental and numerical methods [12,13,14,15], and the research progression has laid the foundation for the integration of OWC devices with floating breakwaters. Several studies have explored the combination of oscillating water column installations with floating breakwaters. Compared to traditional floating breakwaters, these integrated structures exhibit improvements in the dissipation of long-period waves [16,17]. Physical experiments have been conducted to investigate the wave dissipation performance of oscillating water column structure breakwaters supported by pile foundations. The research findings indicate that these structures possess excellent wave absorption and dissipation capabilities. Yu et al. [18] proposed a pile-foundation permeable breakwater structure that integrates oscillating water-column power generation, resulting in combined power generation and wave dissipation effects. Kshma and Santanu [19] provide a detailed derivation of performance-related parameters for OWC equipment under irregular waves, emphasizing the significant improvements that can be achieved through appropriate combinations. Zhang et al. [20,21] calculated the energy capture and wave attenuation capacity of a triangular baffle heave float under linear PTO damping. It was found that the energy harvesting efficiency of the integrated system can be improved by increasing the width and draft of the buoy and reducing the distance between the buoy and the floating breakwater. Howe et al. [22] proposed an elbow-type OWC WEC and carried out relevant model experiments. The results showed that the spacing between two WECs plays a more important role in wave-energy extraction.
In this paper, a double-body floating breakwater is proposed, which combines an oscillating water column device with a perforated floating box. The OWC device is embedded within the floating box on the side facing the incoming waves, while the perforated structure is incorporated into the floating box on the opposite side facing the back wave. This combination aims to simultaneously reduce wave energy and harness wave energy. The focus of this paper is to investigate the wave dissipation characteristics of the floating breakwater under irregular waves. The study examines the influence of factors such as wave height, water depth, and incident wave angle on the transmission coefficient of the floating breakwater. These findings provide a theoretical foundation for the practical application of floating breakwaters in engineering projects.
The paper is organized as follows: Section 2 presents the underlying theory and numerical models. In Section 3, the amplitude response operator, mooring box, porous floating breakwater and wave energy conversion device breakwater are verified, which proves the accuracy of the numerical simulation. Section 4 studies the wave dissipation characteristics of the OWC-perforated floating breakwater under the action of irregular waves, and performs numerical simulation calculations on the floating breakwater, and simulates the floating breakwater by changing the parameters of the incident wave height, angle, and spacing of the box. According to the wave dissipation characteristics, the curve of the transmission coefficient changing with it is obtained. Finally, Section 5 presents the conclusion of this study.

2. Calculation Model

In analyzing hydrodynamic problems, fluid is usually assumed to be Newtonian and incompressible. Such an assumption is acceptable for water. Therefore, the fluid flow governed by a set of elliptic partial differential equations is known as the Navier–Stokes (N-S) equations. Due to the large dimensions of the structure, the viscosity of the fluid is negligible. So, water is assumed to be inviscid everywhere. Such an assumption, together with the assumption of incompressibility, results in an ideal fluid and the N-S equations reduced to Euler equations, in which all viscous stresses are eliminated. Assuming that the flow is irrotational, the governing equations reduce to a linear partial differential equation called the Laplace equation. Such a flow is known as potential flow. The boundary element method (BEM) has the advantage of converting a domain integration problem to a surface integration problem, and this may improve computational efficiency. However, BEM’s application is most prevalent in solving the Laplace equation, where the volume-surface transformation, ensured by Green’s theorem, is complete [23]. The Laplace equation calculations have provided acceptable results assuming the incompressible fluid and the irrotational flow in the wave structure interaction problems [24]. Here, the purpose is the analysis of the effect of wave environmental force on pontoon FBWs. In the analysis of the force of water waves on marine structures that are large in proportion to the wavelength, it is necessary to consider the wave-structure interaction. Diffraction and radiation problems have been applied on the interaction between a floating breakwater and a linear wave. In this study, ANSYS-AQWA commercial software (2022 R2) has been used for the hydrodynamic analysis of floating structures in the time and frequency domain, and the method and techniques of this application to solve problems are presented.

2.1. Governing Equations

In order to describe the fluid flow field around a floating structure, the velocity potential is defined as:
Φ X , t = A φ X e i ω t
where A is the incident wave amplitude, ω is the wave.
Frequency, t is the time, and X = x , y , z is the location relative to fixed reference axes (FRA). Here, using the usual symbol of floating Rigid Motions, three rotational and three translational motions of the body center of gravity are incited by an incident wave with unit amplitude:
X j = u j ,   j = 1 , 2 , 3 X j = θ j 3 ,   j = 4 , 5 , 6
Here, the total potential φ X can be considered as a sum of three components: incident wave φ I , diffracted wave φ D , and radiated wave φ R , and all three potentials satisfy the Laplace equation. This is mathematically represented as:
φ X e i ω t = φ I + φ D + j = 1 6 φ R j x j e i ω t
where φ I is the first-order incident wave potential with unit wave amplitude, φ D is the corresponding diffraction wave potential, and φ RJ is the radiation wave potential due to the j-th motion with unit motion amplitude.
The velocity potential function is ϕ X , t , time-independent term is φ X , according to linear hydrodynamic theory for incompressible and inviscid fluid, and irrotational fluid flow is described by the following equations:
The Laplace equation in the fluid domain ( Λ ):
2 φ x , y , z = 2 φ x 2 + 2 φ y 2 + 2 φ z 2 = 0
Linear free surface s f on z = 0:
ω 2 φ + g φ z = 0
Body surface conditions (sb):
φ n = i w n j ,     for   radiation   potential φ n ,     for   diffraction   potential
Seabed surface condition (sz) at z = −h:
φ z = 0
For far-field condition (s∞) where x 2 + y 2 ⟶∞,
φ 0
In this study, as described in the Introduction, the ANSYS-AQWA software is employed to solve the velocity potential, which is based on the potential-based BEM. In addition to the boundary conditions mentioned in the previous section, in the fluid domain, the below boundary condition is also satisfied:
2 G X , ξ , ω = 2 G x 2 + 2 G y 2 + 2 G z 2 = δ X ξ
where X Λ , ξ Λ , ξ = ξ , η , ζ is the location of a source on the FBW wetted surface, and δ X ξ is the Dirac function, which is described as:
δ X ξ = 0 ,     where , X ξ 0 ,     where , X ξ = 0  
Then, according to the Dirac function, Green’s function can be signified as:
G x , ξ , w = 1 r + 1 r 2 + 0 2 k + ν e kh cosh k z + h cosh k ζ + h k sin h kh ν cosh kh j 0 kR dk = i 2 π k 0 + v e k 0 h cosh k 0 z + h cosh k 0 ζ + h sinh k 0 h + k 0 h cosh k 0 h vh sin h k 0 h j 0 k 0 R
where J 0 is the first kind of Bessel function, and
R = x ξ 2 + y η 2 r = R 2 + z ζ 2 r 2 = R 2 + z + ζ 2 h 2 v = ω 2 g k 0 tanh k 0 h = v
where k = (2π/L) is the wave number, ω is the wave frequency, L is the wavelength, and g is the gravitational acceleration.
Here, the velocity potential of radiation and diffraction waves is defined as a Fredholm integral equation of the second kind by Green’s theorem.
c φ X = S 0 φ ξ G X , ξ , ω n ξ G X , ξ , ω φ ξ n ξ dS c = 0 ,     X Λ S 0     2 π ,     X S 0 4 π ,     X Λ
Then, the fluid potential is defined as:
φ X = 1 4 π S b σ ξ G X , ξ , ω dS
where X Λ S b .
In Equation (14), using the hull surface boundary condition given by Equation (6), the source strength over the mean wetted hull surface is defined as:
φ X n X = 1 2 σ X + 1 4 π S b σ ξ G X , ξ , ω n X dS
where X S b .

2.2. Equation of Motion and RAOs

The obtained solutions for the diffraction and radiation problems can be combined with the equation of motion of the floating FBW system to analyze the dynamic responses of the structural system in both the time and frequency domains.
In the frequency domain, the structural equation of motion is given by:
ω 2 M s + M a i ω C + K hys + K a X jm = F jm
where M a and M s are the total added mass matrices and the total structural mass, respectively, and the coefficient C is the hydrodynamic damping matrix. K a and K hys are the additional structural stiffness matrices and the assembled hydrostatic stiffness, respectively, and F jm represents the total Froude–Krylov and diffracting forces and moments, where m corresponds to the structure and j pertains to the motion modes.
Then, the equation of motion in the time domain is expressed as:
M X ¨ t + C X ˙ t + KX t = F t
where M is the added mass in the mass matrix and C is the hydrodynamic damping in the damping matrix, and both of them are frequency-dependent, and K is the total stiffness matrix. Here, according to the external force ( F t ), which has a constant amplitude, the equation of motion in the frequency domain cannot be straight converted into the time-domain equation. Therefore, by employing a convolution integral form, the equation of motion can be defined as follows:
M S + A X ¨ t + c X ˙ t + KX t + 0 t R t τ X ˙ τ d τ = F t
where A is the added mass matrix at the infinite frequency, c is the damping matrix, including the results of the radiation damping, R is the velocity impulse function matrix, and K is the total stiffness matrix.
In addition, the acceleration impulse function matrix can be used in the equation of motion as follows:
M S + A X ¨ t + c X ˙ t + KX t + 0 t h t τ X ¨ τ d τ = F t
The acceleration impulse function matrix can be determined as:
h t = 2 π 0 B ω sin ω t ω d ω = 2 π 0 A ω A cos ω t d ω
where B ω is the hydrodynamics damping matrix and A ω is the added mass matrix. By replacing the first-order and second-order wave loads into Equation (19), the equation of motion is obtained as:
m + A X ¨ t = F 1 t + F 2 t + F t t c X ˙ t KX t 0 t h t τ X ¨ τ d τ
where K is the total stiffness matrix, and it includes mooring stiffness and the linear hydrostatics, F t t is the mooring and articulation force, F 1 t is the first-order wave excitation force and moment, and F 2 t is the second-order wave excitation force.
Response amplitude operator (RAO) is the motion of a floating structure in six degrees of freedom (surge, sway, heave, roll, pitch, and yaw) due to hydrodynamic wave force. RAOs are utilized as input data for calculations to determine the displacements, accelerations, and velocities at any given location on a marine floating structure. In general, RAO is calculated by the ratio of response amplitude of the FBW X j to the wave amplitude A i for linear motion and the ratio of response amplitude of the FBW to the wave slope α i for rotational motion, which is defined as follows:
RAO = X j A i ,   Where   X j = u j , j = 1 , 2 , 3 , RAO = X j α i ,   Where   X j = θ j 3 , j = 4 , 5 , 6 .
where αi is the wave slope, Ai is the wave amplitude, and X j is the response amplitude of FBW in rotational ( θ j 3 ) and displacement ( u j ) mode. ANSYS-AQWA analyzes linear algebraic equations to determine the harmonic response of the body to regular waves. These response characteristics are commonly referred to as RAOs and are dependent on wave amplitude.

2.3. Mooring System

In order to analyze the dynamics of the cable motion, many factors should be considered, such as the effects of cable mass, drag forces, inline elastic tension, and bending moment. The forces applied to the cable vary with time and, generally, the cables behave nonlinearly. The simulation of cable dynamics is needed to discretize cable along its length and assemble the mass and applied forces. Each mooring line is discretized as a series of Morison-type elements subjected to various external forces.
The general equations for the force and moment acting on the cable are expressed as follows:
T s e + V s e + ω + F h = m 2 R t 2 , M s e + R s e × V = q ,
where R is the position vector of the first node of the cable element, T is the tension force vector at the first node of the element, M is the bending moment vector at the first node of the element, V is the shear force vector at the first node of the element, F h represents the external hydrodynamic loading vectors per unit length, q is the distributed moment loading per unit length, m is the structural mass per unit length, ω is the element weight per unit length, D e is the diameter of the element, and Δ s e is the length of the element.
The bending moment and tension are relevant to the bending stiffness and the axial stiffness of the cable material defined as follows:
M = EI R s e × 2 R s e 2 , T = EA ε ,
where M is the bending moment of the cable, T is the tension of the cable, ε is the axial strain of the element, EA is axial stiffness of the cable, and EI is the bending stiffness of the cable.

2.4. Wave Transmission Coefficients

The radiation wave energy transfer from the FBW causes the wave to pass through the structure. Its energy transfer occurs in three ways, that is, the waves passing over the structure, the waves passing under the structure, and the waves created by the motion of the structure.
FBWs are designed to reduce wave transmission. So, as explained in the Introduction, the primary and most effective parameter in determining the performance of FBWs is the wave transmission coefficient. The total wave energy per unit length of the FBW is straightly proportionate to the square of the wave height.
H i 2 = H r 2 + H t 2
where H i is the incident wave height, H t is the transmitted wave height, and H r is the reflected wave height. The transmission coefficient is defined by K t = H t H i , while the reflection coefficient is defined by K r = H r H i . Hence, by replacing the defined parameters in Equation (25), we can write the following equation:
K r 2 + K t 2 = 1
In the real situation, due to the presence of viscous dissipation, Equation (26) can be written as:
K r 2 + K t 2 + K d 2 = 1
where K d is the dissipation coefficient that is due to the viscous effects and the resulting energy loses, such as vortex shedding, friction, and wave breaking.
In this study, to calculate the wave transmission coefficient, the AQWA-GS module of ANSYS-AQWA is used. In this module, the results of calculations are displayed in different ways. After applying the wave load with determined characteristics, the wave amplitude can be calculated for different points of the domain. Then, by calculating the ratio of the amplitude of the incident wave to the amplitude of the wave behind the rear FBW, the wave transmission coefficient is obtained.
K t = A t A i = H t H i ,
where A t is the transmitted wave amplitude, H i is the transmitted wave height, A i is the incident wave amplitude, and H i is the incident wave height.

2.5. Irregular Sea States and Repetitions

The numerical simulation is conducted using irregular waves. The simulation considers three different seawater depths: 18 m, 25 m, and 36 m. The seawater density is 1.025 kg/m3, the gravity acceleration is 9.8065 m/s2, the wave spectrum is JONSWAP, the significant wave heights are 1 m, 3 m and 5 m, the period of waves are 3.69 s, 4.49 s, 5.28 s, 6.08 s, 6.89 s and 7.69 s, and the spectral peak factor gamma = 3.3.
The random wave input parameters are based on the modified JONSWAP spectrum given by Goda [25], as follows:
S f = β J H 1 3 2 T P 4 f 5 exxp 1.25 T P f 4 γ exp f f P 1 2 2 σ 2
where T P is the spectral dominant period, T P 4 = T H 1 3 / 1 0.132 γ + 0.2 0.559 ; H 1 3 and T H 1 3 are the significant wave height and period, respectively, f is the wave frequency, f P is the spectral peak frequency, σ is the peak shape factor, σ = 0.07 f f P , σ = 0.09 ( f > f P )   γ is the peak enhancement factor and normally a value of 3.3 can be used. The parameter β J is determined by the following expression:
β J = 0.06238 0.230 + 0.0336 γ 0.185 1.9 + γ 1 1.094 0.01915 ln γ

2.6. Meshing Method

For the numerical simulation, the calculation domain is 100 m × 100 m, and the automatic mesh generation method of hydro-dynamic diffraction is employed to generate the element mesh. This method involves switching between tetrahedral and swept mesh, depending on the overall structure. Tetrahedron mesh is generated if irregular spatial structure is encountered, and hexahedron mesh is generated if regular spatial structure is encountered. The maximum size of the grid is 3 m, and the setting tolerance is 1 m. Figure 1 shows the model mesh, and the mesh number of total calculation domain is about 25,000. There is a certain correlation between the maximum size of the division and the maximum allowable frequency. The maximum size of the mesh division should not be set smaller than the maximum frequency of the waves.

3. Validation of the Numerical Model 3

3.1. Simulation of Irregular Waves

In order to correctly simulate the wave surface situation, this paper conducts numerical simulation on irregular waves. In this paper, the wave parameters with spectral peak period TP = 6.89 s and wave effective wave height HS = 3 m are selected for simulation. Figure 2 shows the simulation of irregular waves in the center of the calculation domain in the repetition period of 100T, and the simulation is in good condition.

3.2. Validations for the RAO of Double Box Floating Breakwater

To ensure an accurate simulation of the motion state of the floating structure in the fluid and enhance the precision of the results, this paper verifies the motion response of the floating breakwater.
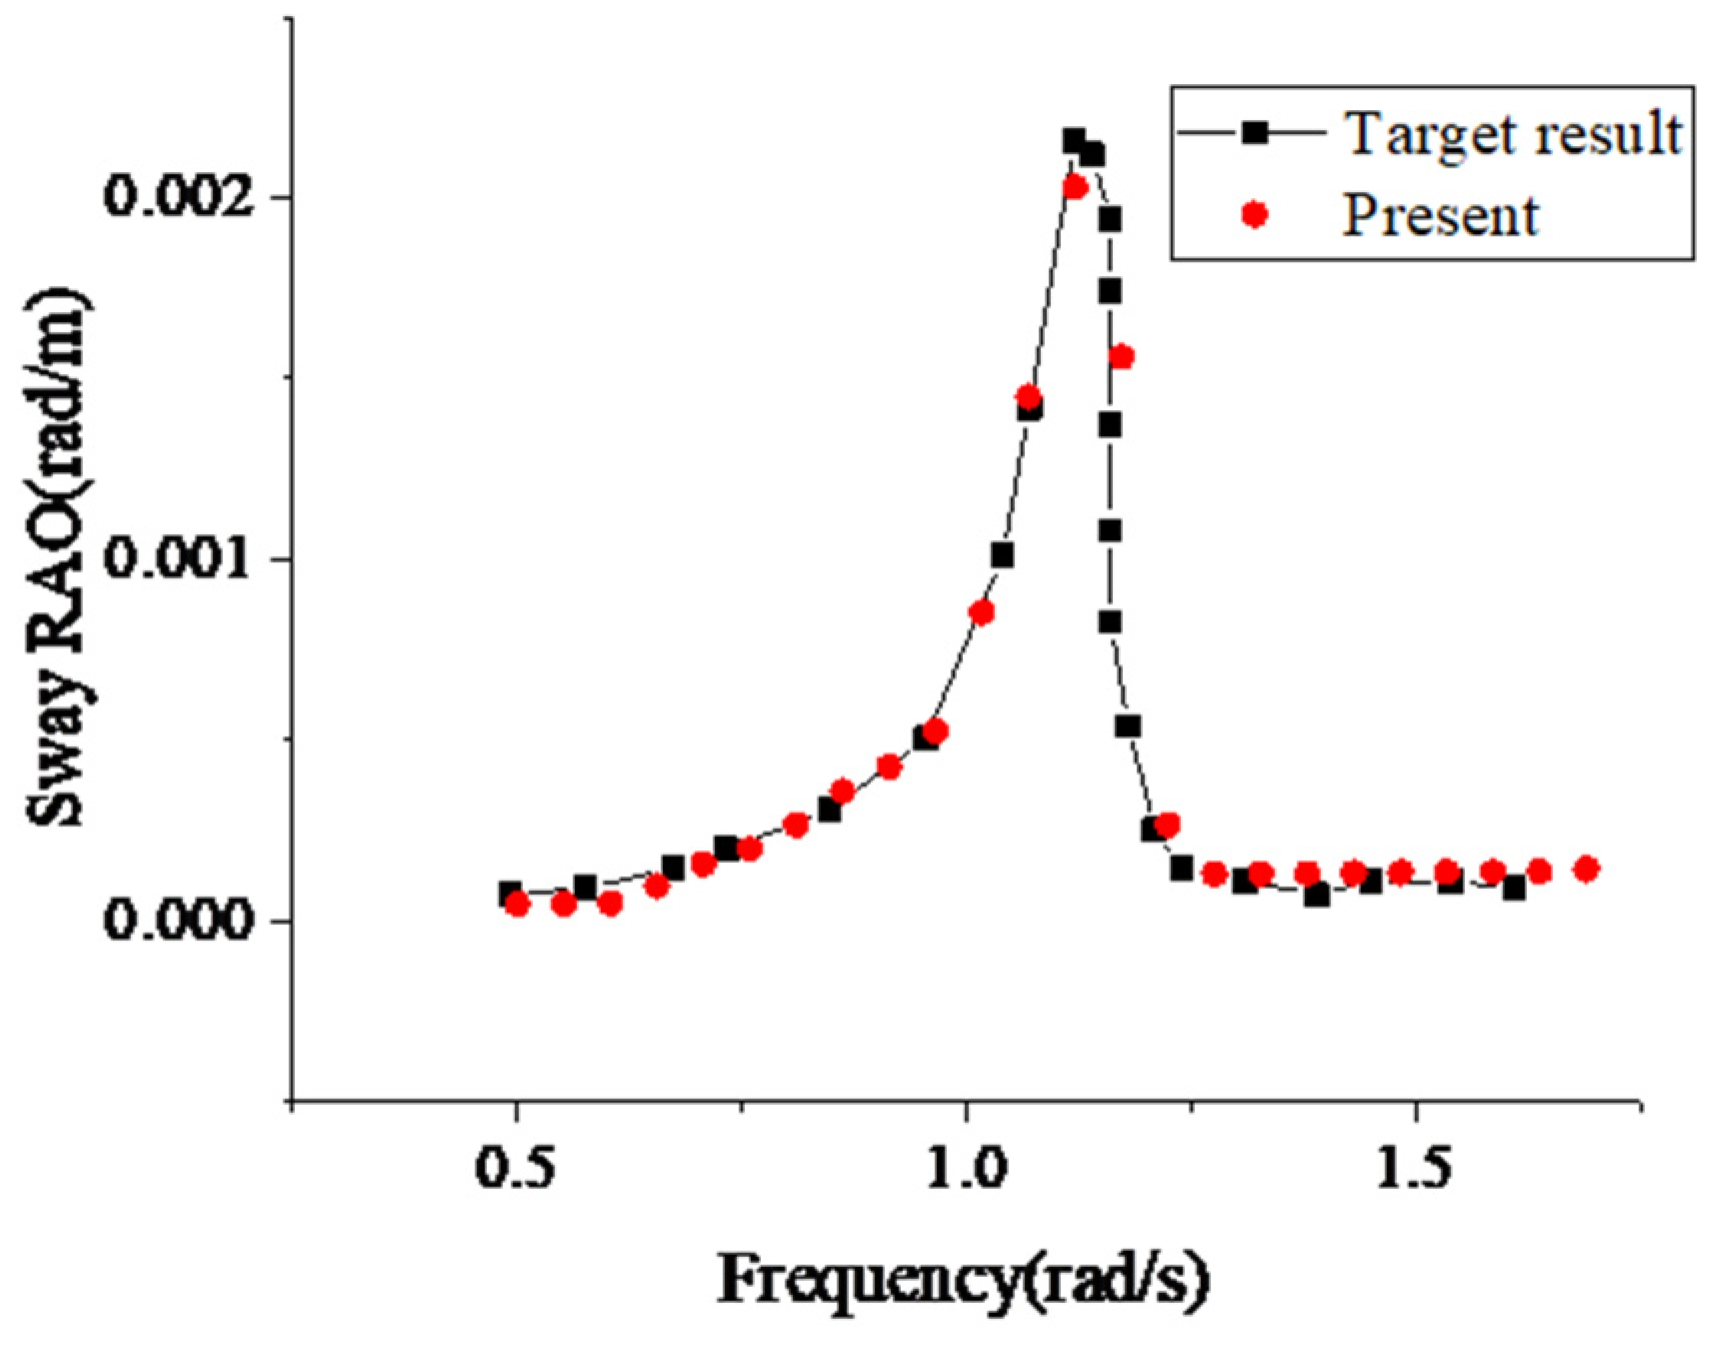
We established the mathematical model of the double box floating breakwater. The schematic diagram of the breakwater model is shown in Figure 3, where the relative plate spacing is the ratio of the plate spacing to the incident wave height, and the relative plate spacing is selected as 0.75 to calculate the motion response and compared with the findings of Wang and Liu [26] regarding relative width (Figure 4).

3.3. Validations for the Kt of the Mooring Floating Breakwater

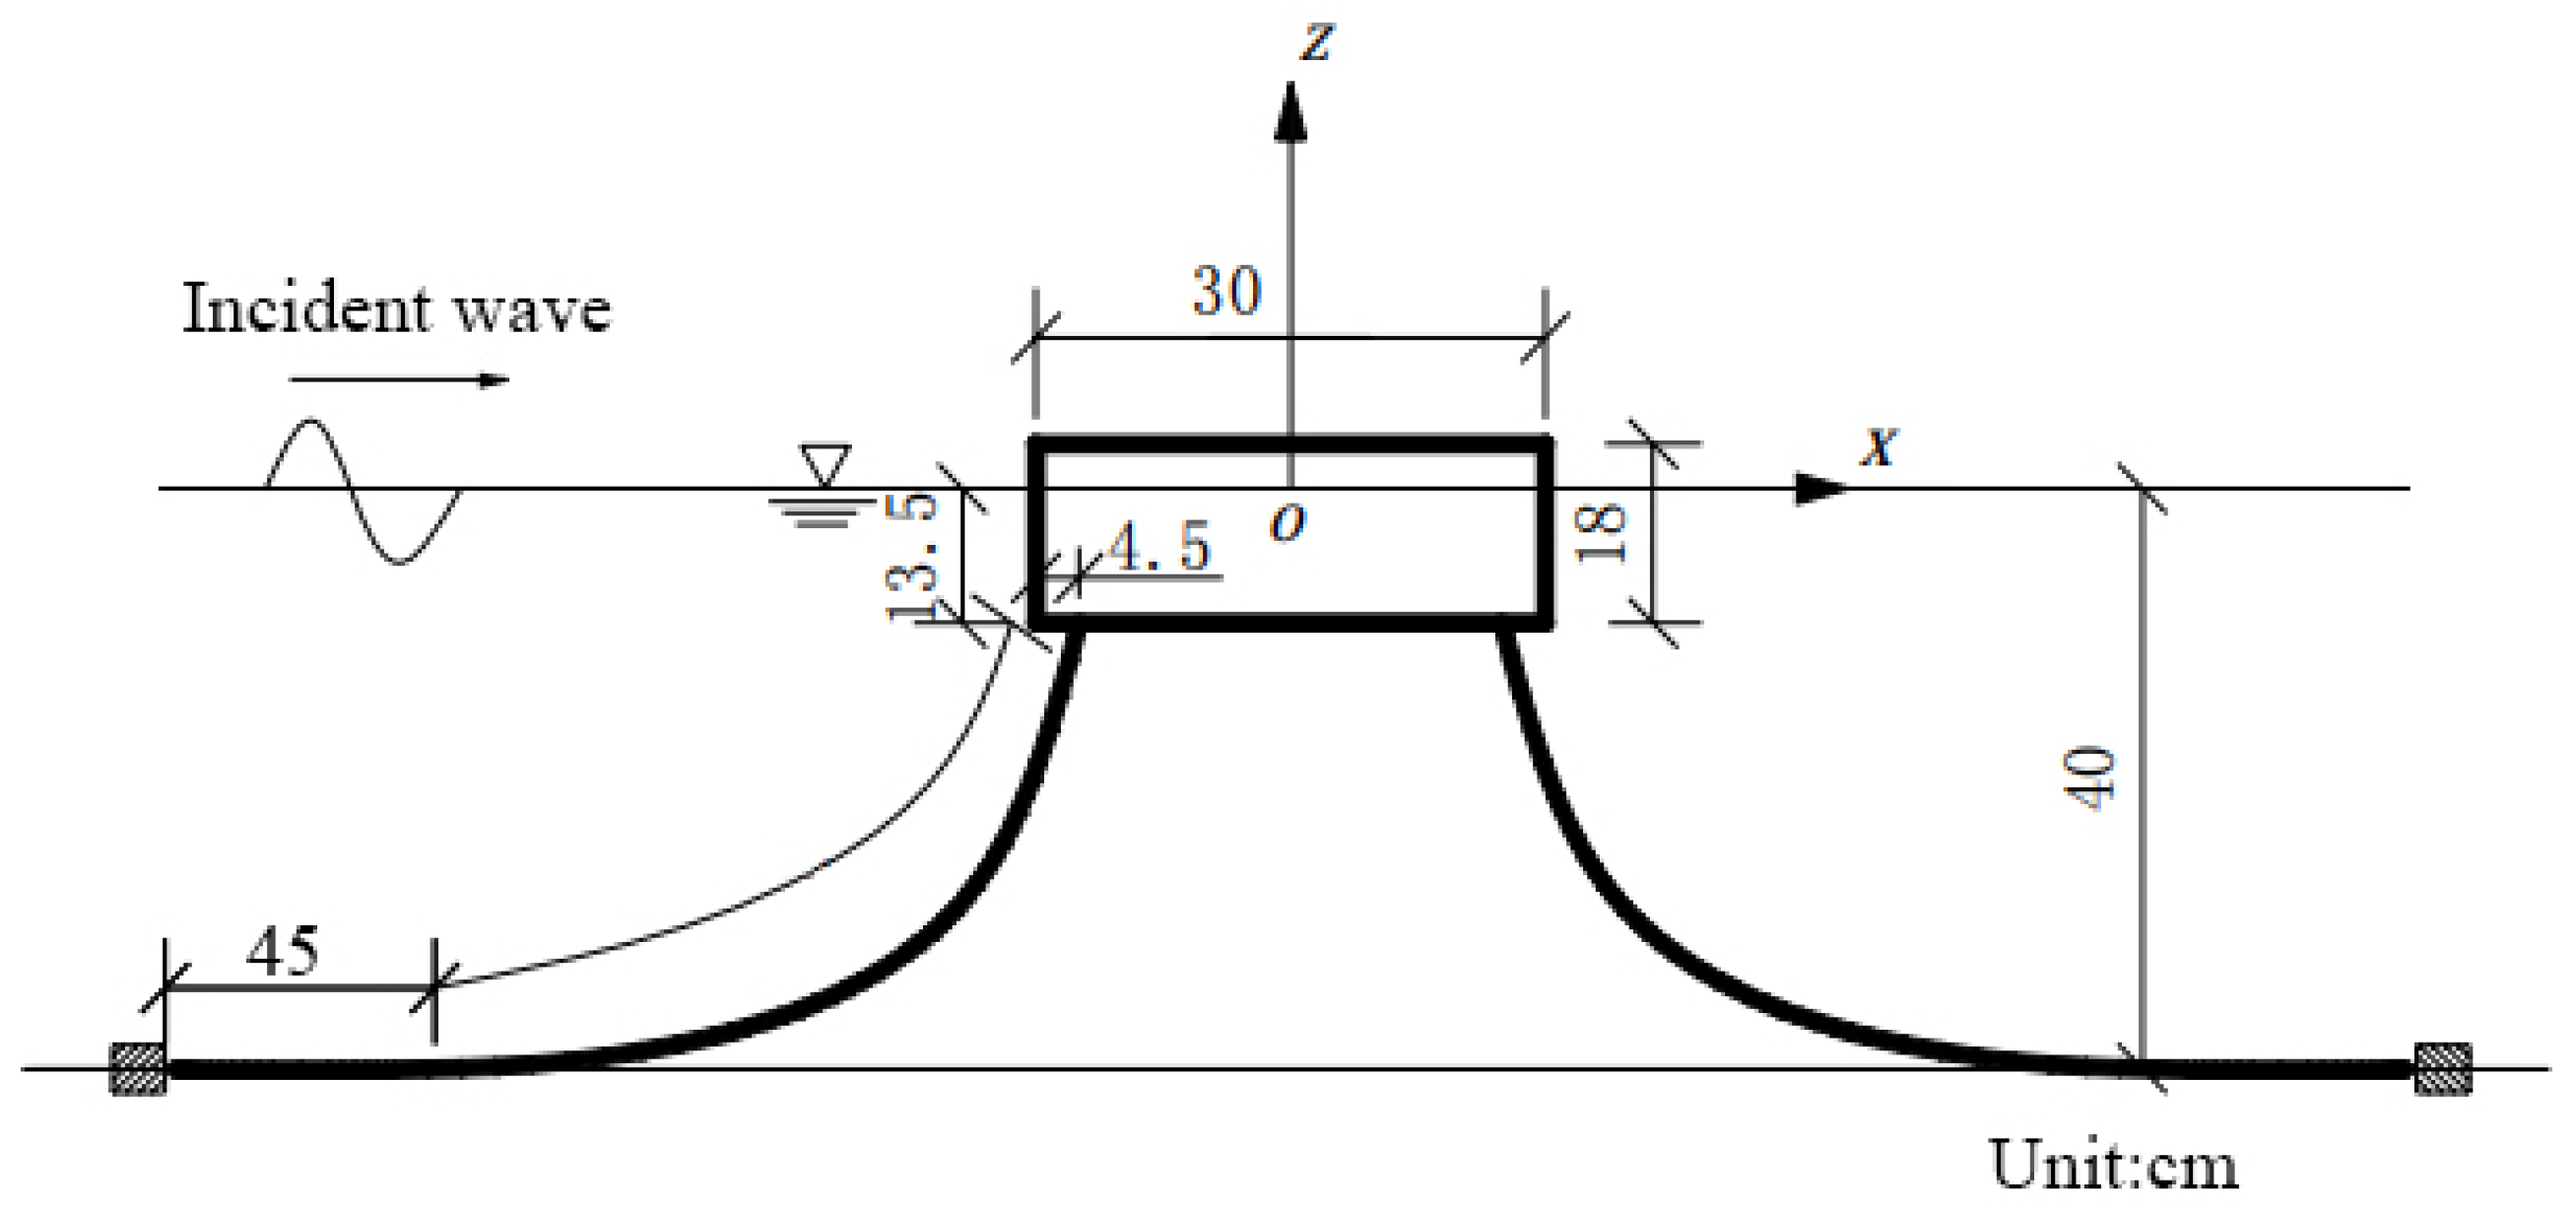
To verify the accuracy of the calculation of the moored floating breakwater, the splayed anchor chain moored single box floating breakwater is calculated. The width of the square box is 30 cm, and the draft is 13.5 cm. The mooring style is shown as Figure 5, and the length of the mooring chain is 46 m, the length lying on the seabed is 45 cm, the incident wave height is 0.10 m, the relative draft is S/d = 0.3375, and the results are compared with the experimental data from Hou [27], as shown in Figure 6. The average error of the comparison results is 1.69% which is basically the same as the experiment, indicating that the model proposed in this paper accurately simulates the wave field around the moored floating breakwater (Table 1).

3.4. Validations of the Porous Floating Breakwater

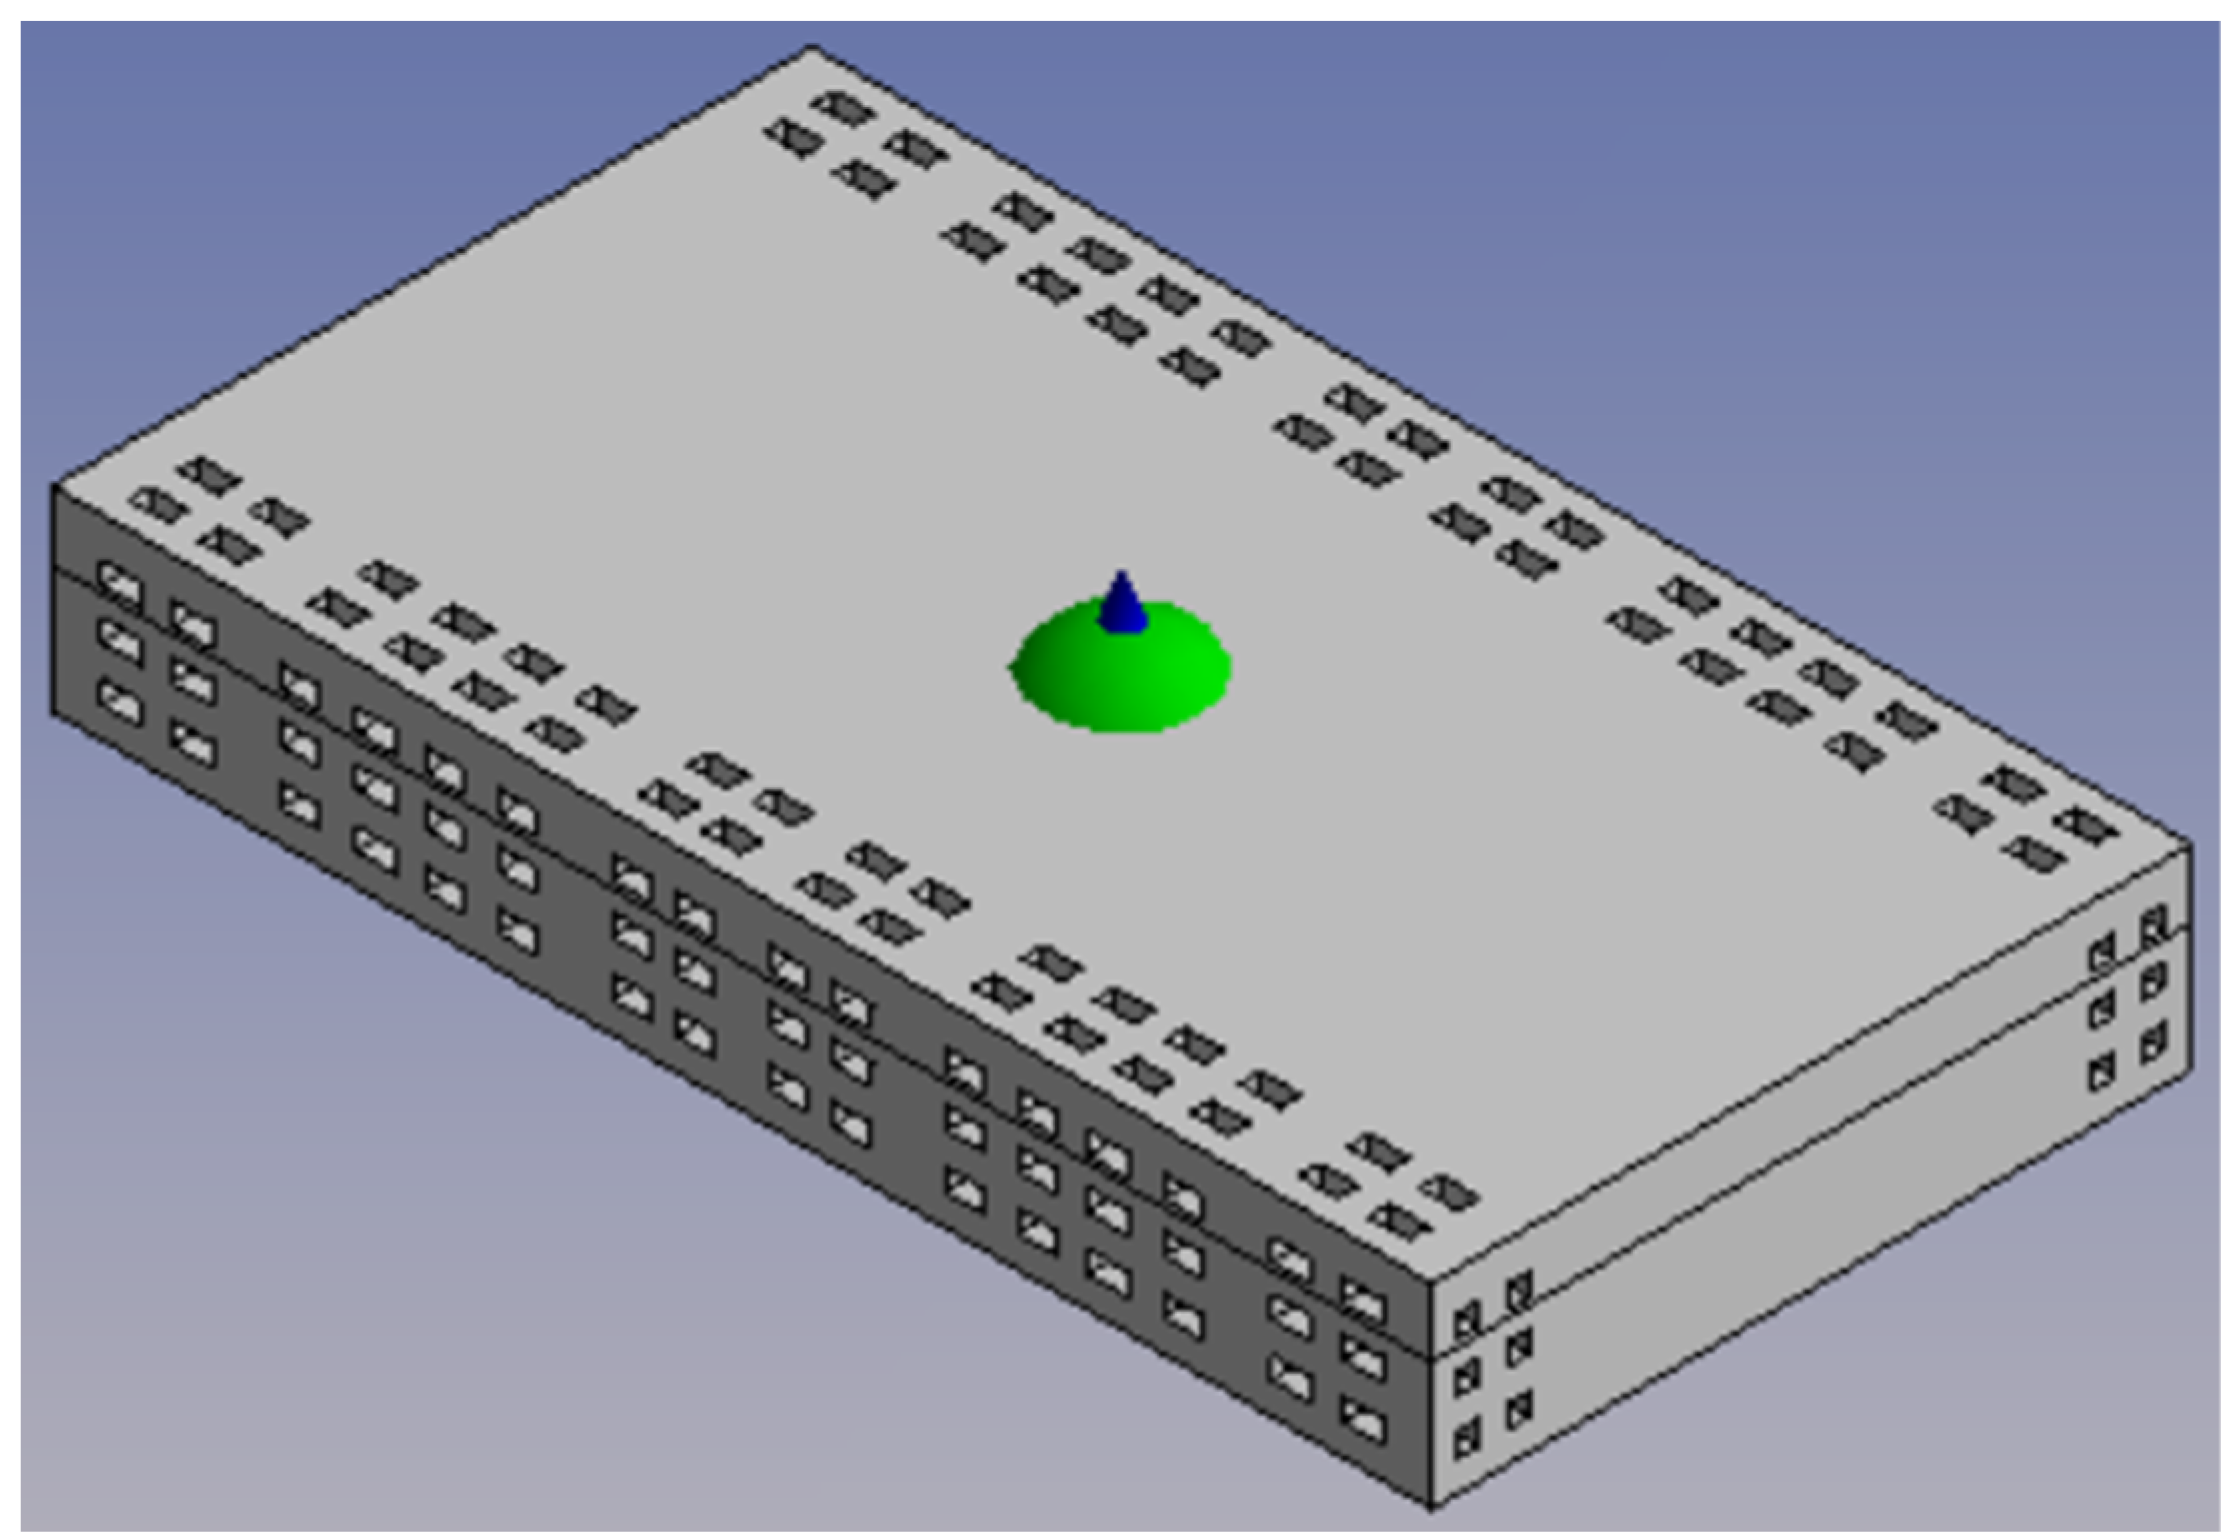
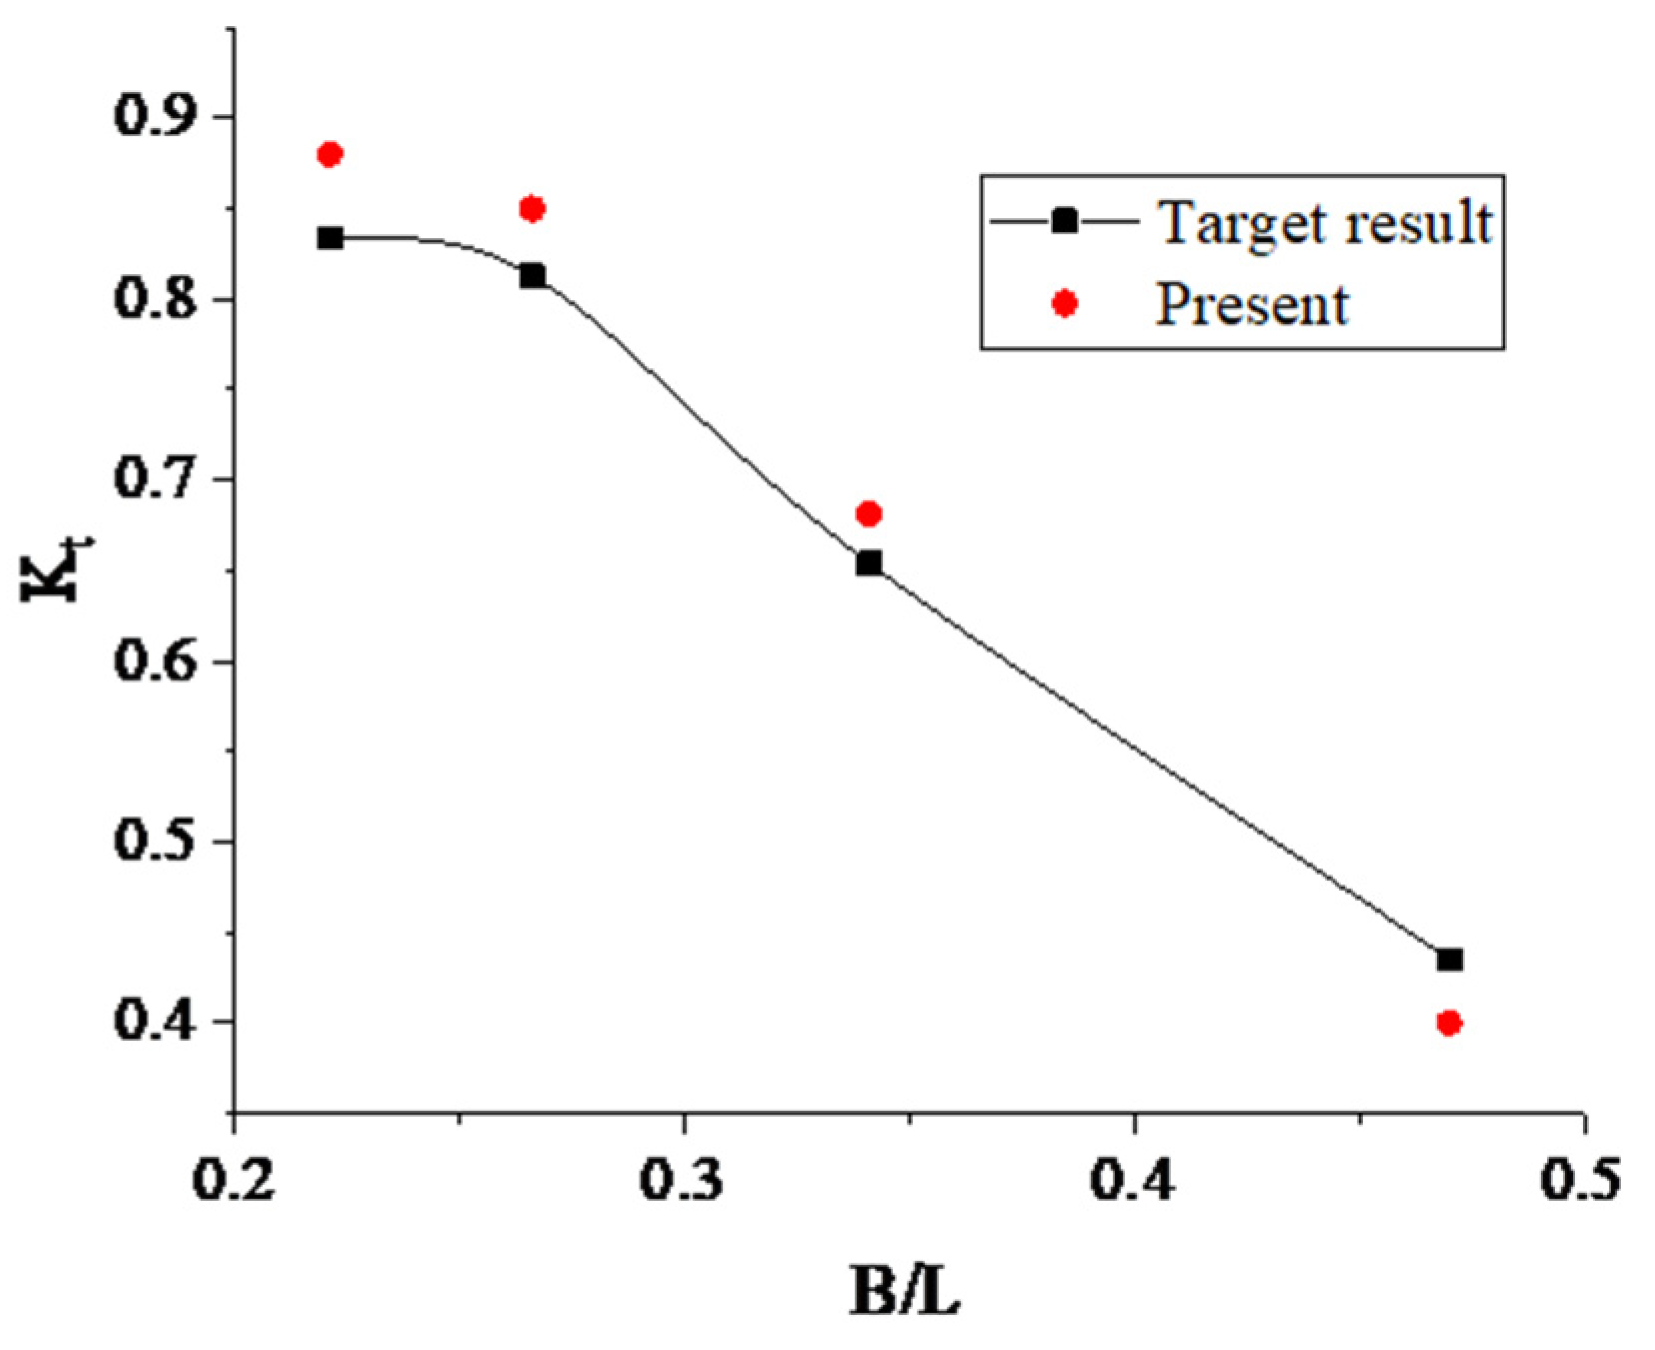
We established the mathematical model of the porous floating breakwater. The schematic diagram of the model is shown in Figure 7. Its main structure is a square box, and its six sides are perforated. The perforation rate is 16%. Figure 8 shows the comparison diagram of the dike transmission coefficient changing with the increase of the relative width B/L (width of breakwater/wavelength). The calculation results are basically consistent with the experimental results of Liu [28], with an error of 3.69% (as shown in Table 2).

3.5. Validations of the OWC Breakwater

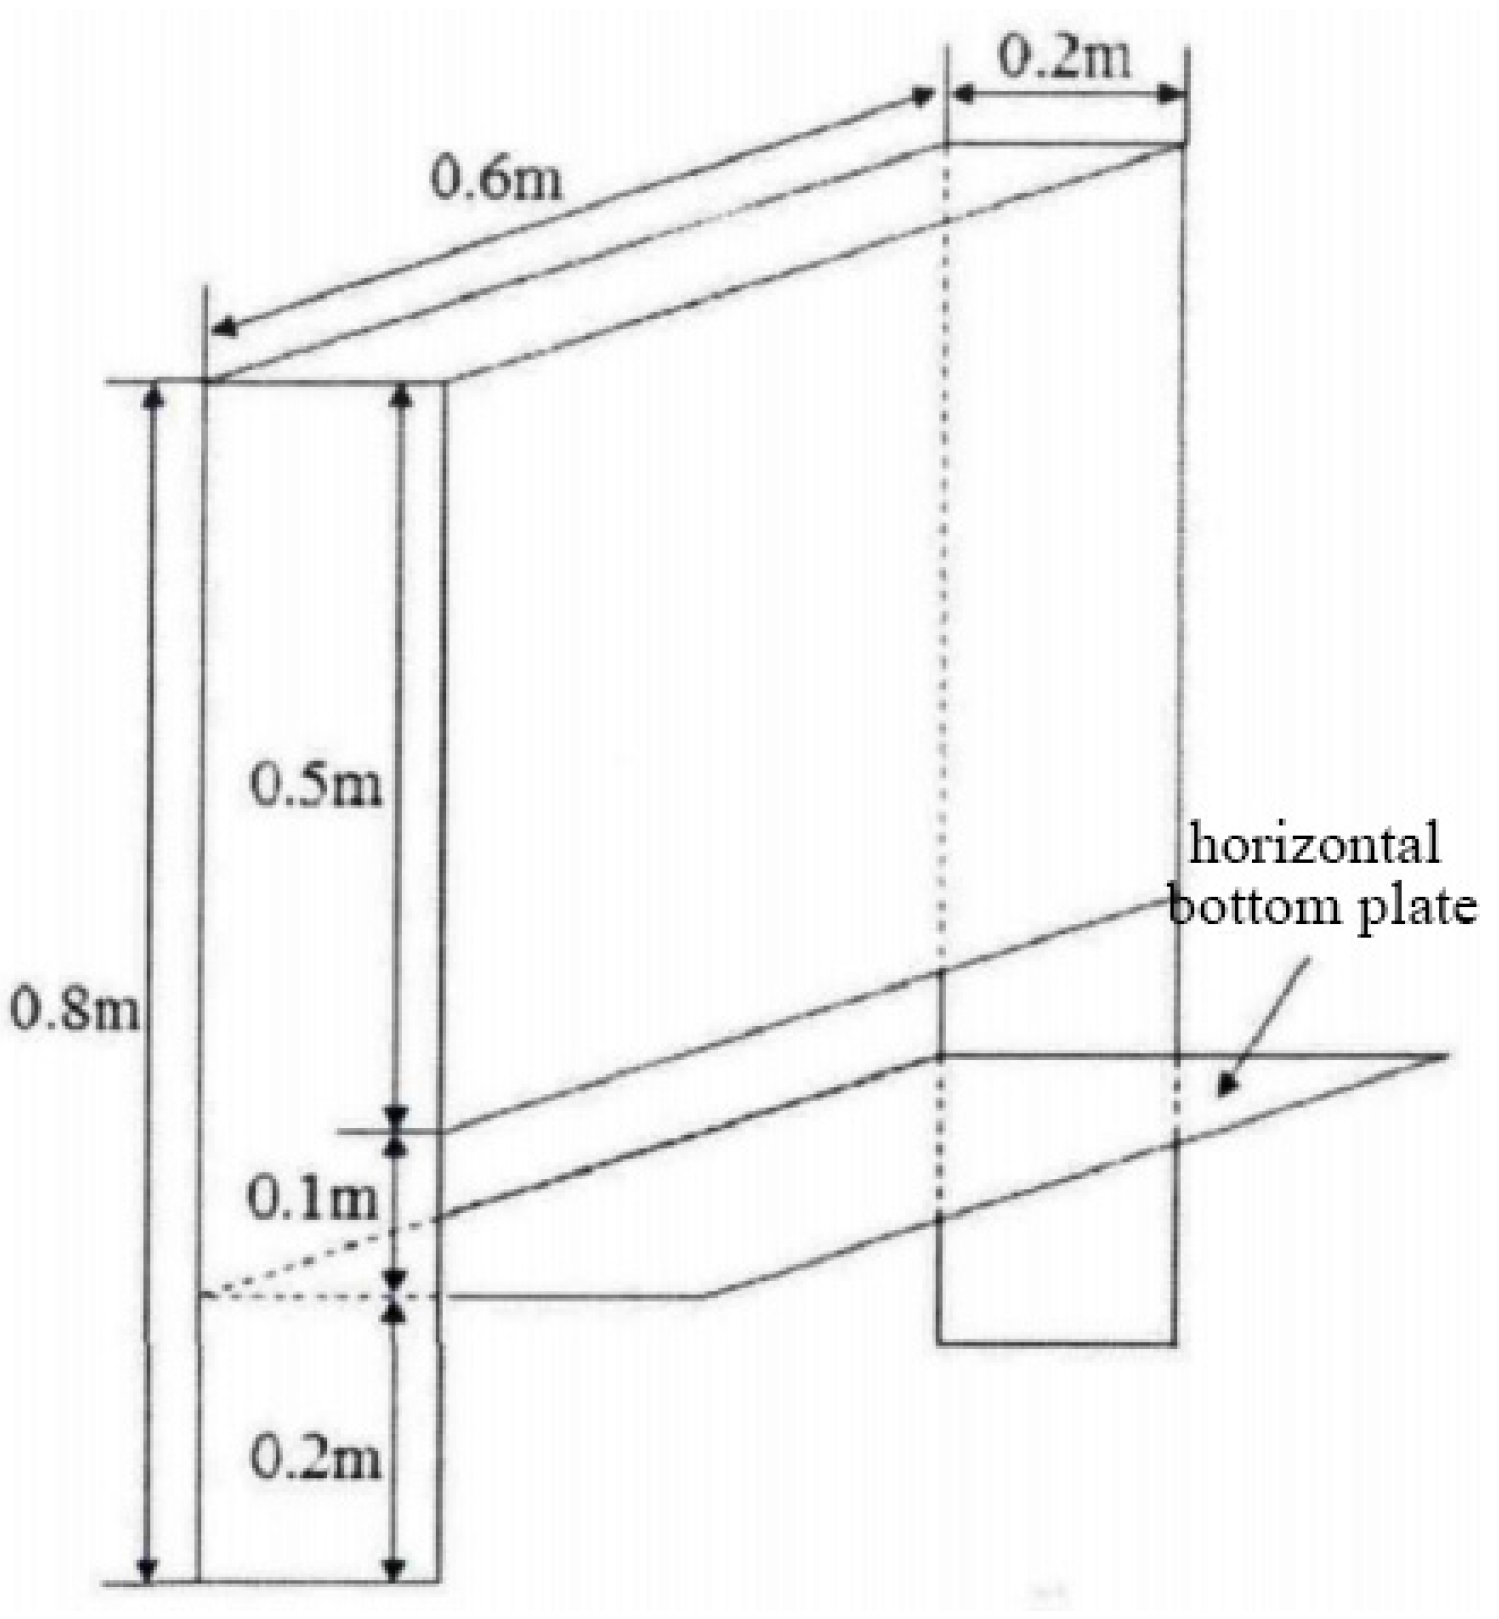
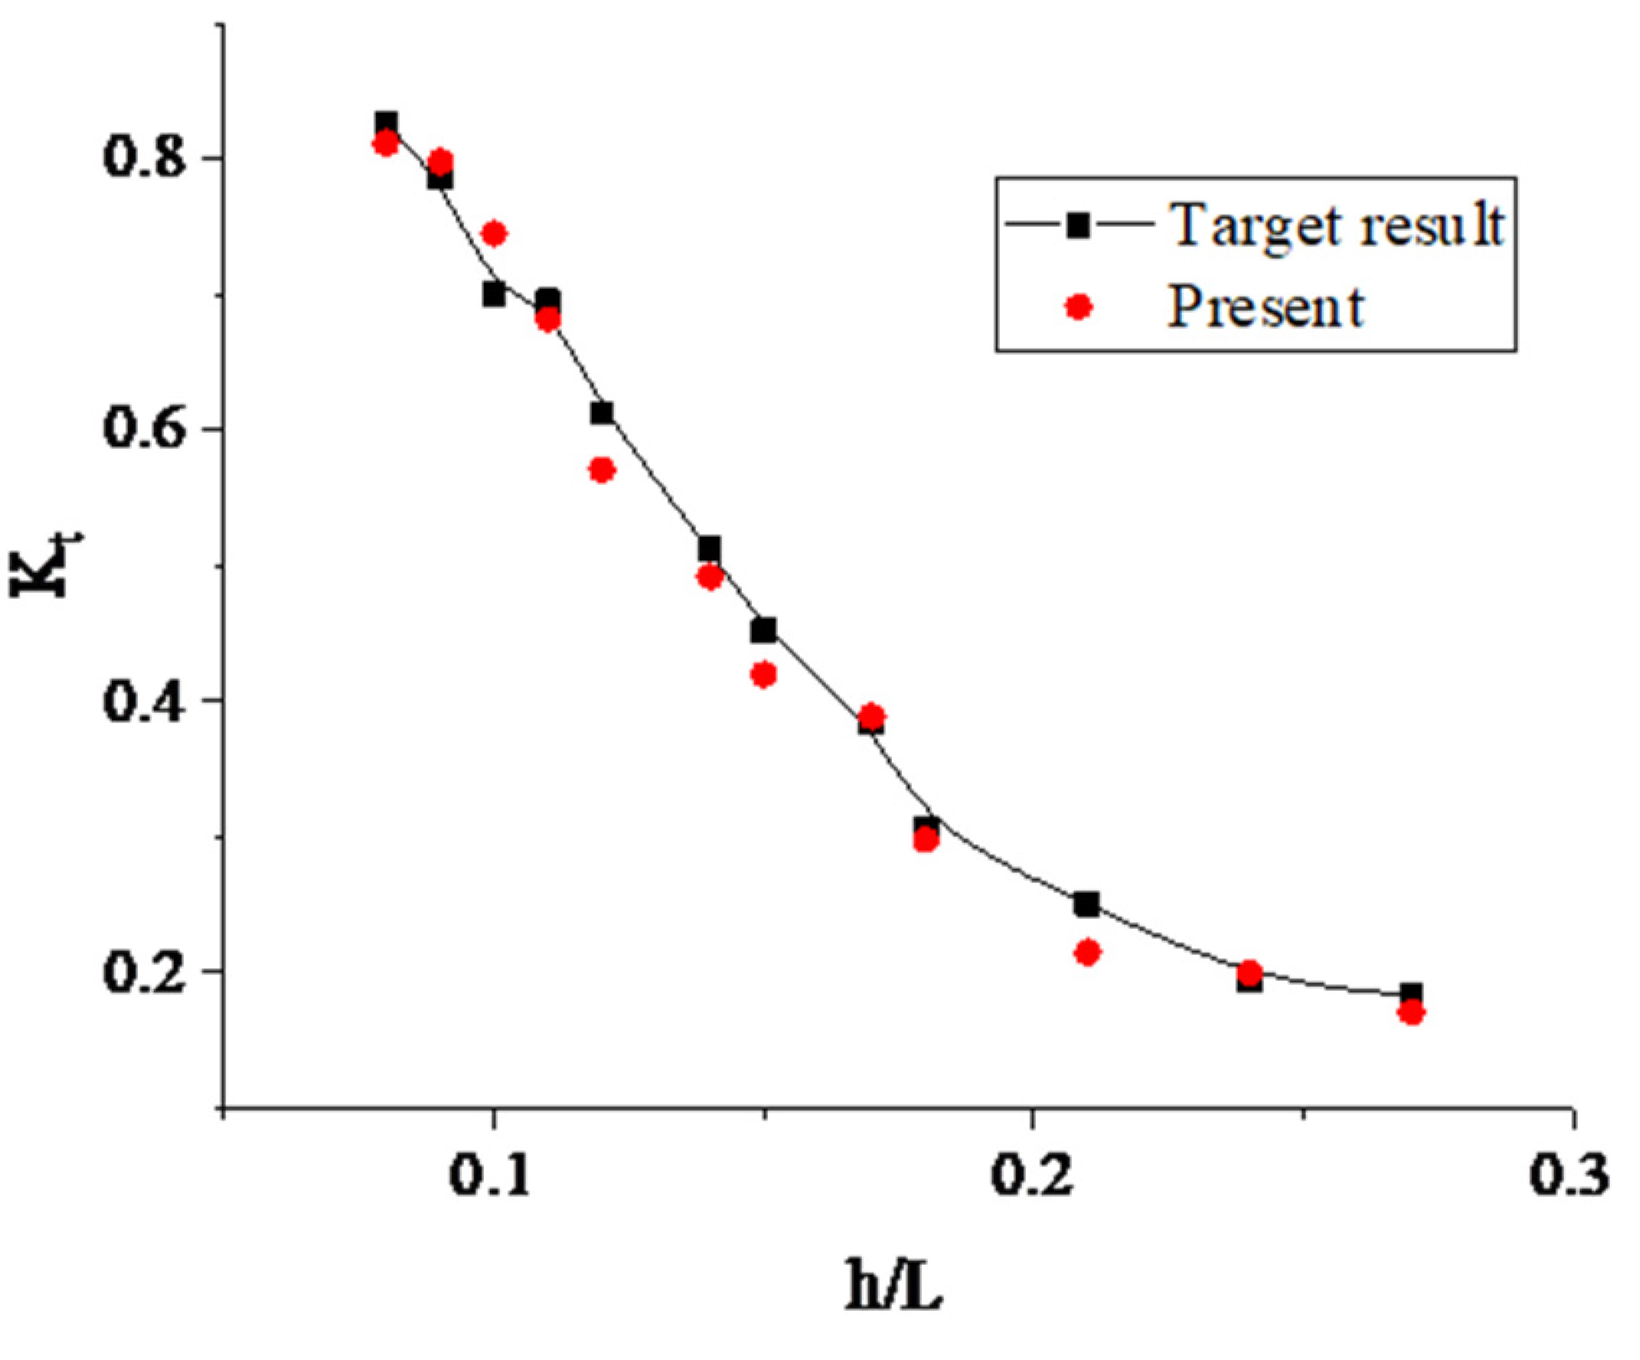
To verify the calculation accuracy of the upper OWC structure, we established an oscillating water column breakwater model with a horizontal floor, as shown in Figure 9, simulated water depth h = 0.4 m, wave height H = 0.06 m, plate spacing B = 0.18 m, D = 1.0 B, and the horizontal floor width and the device width is the same. The results are compared with the test results of Wang [29], as shown in Figure 10. It can be seen that the two are in good agreement. The errors between the target and present results are shown in Table 3 which shows the average error is 2.08%.

4. Results and Discussion

4.1. Numerical Simulation Conditions

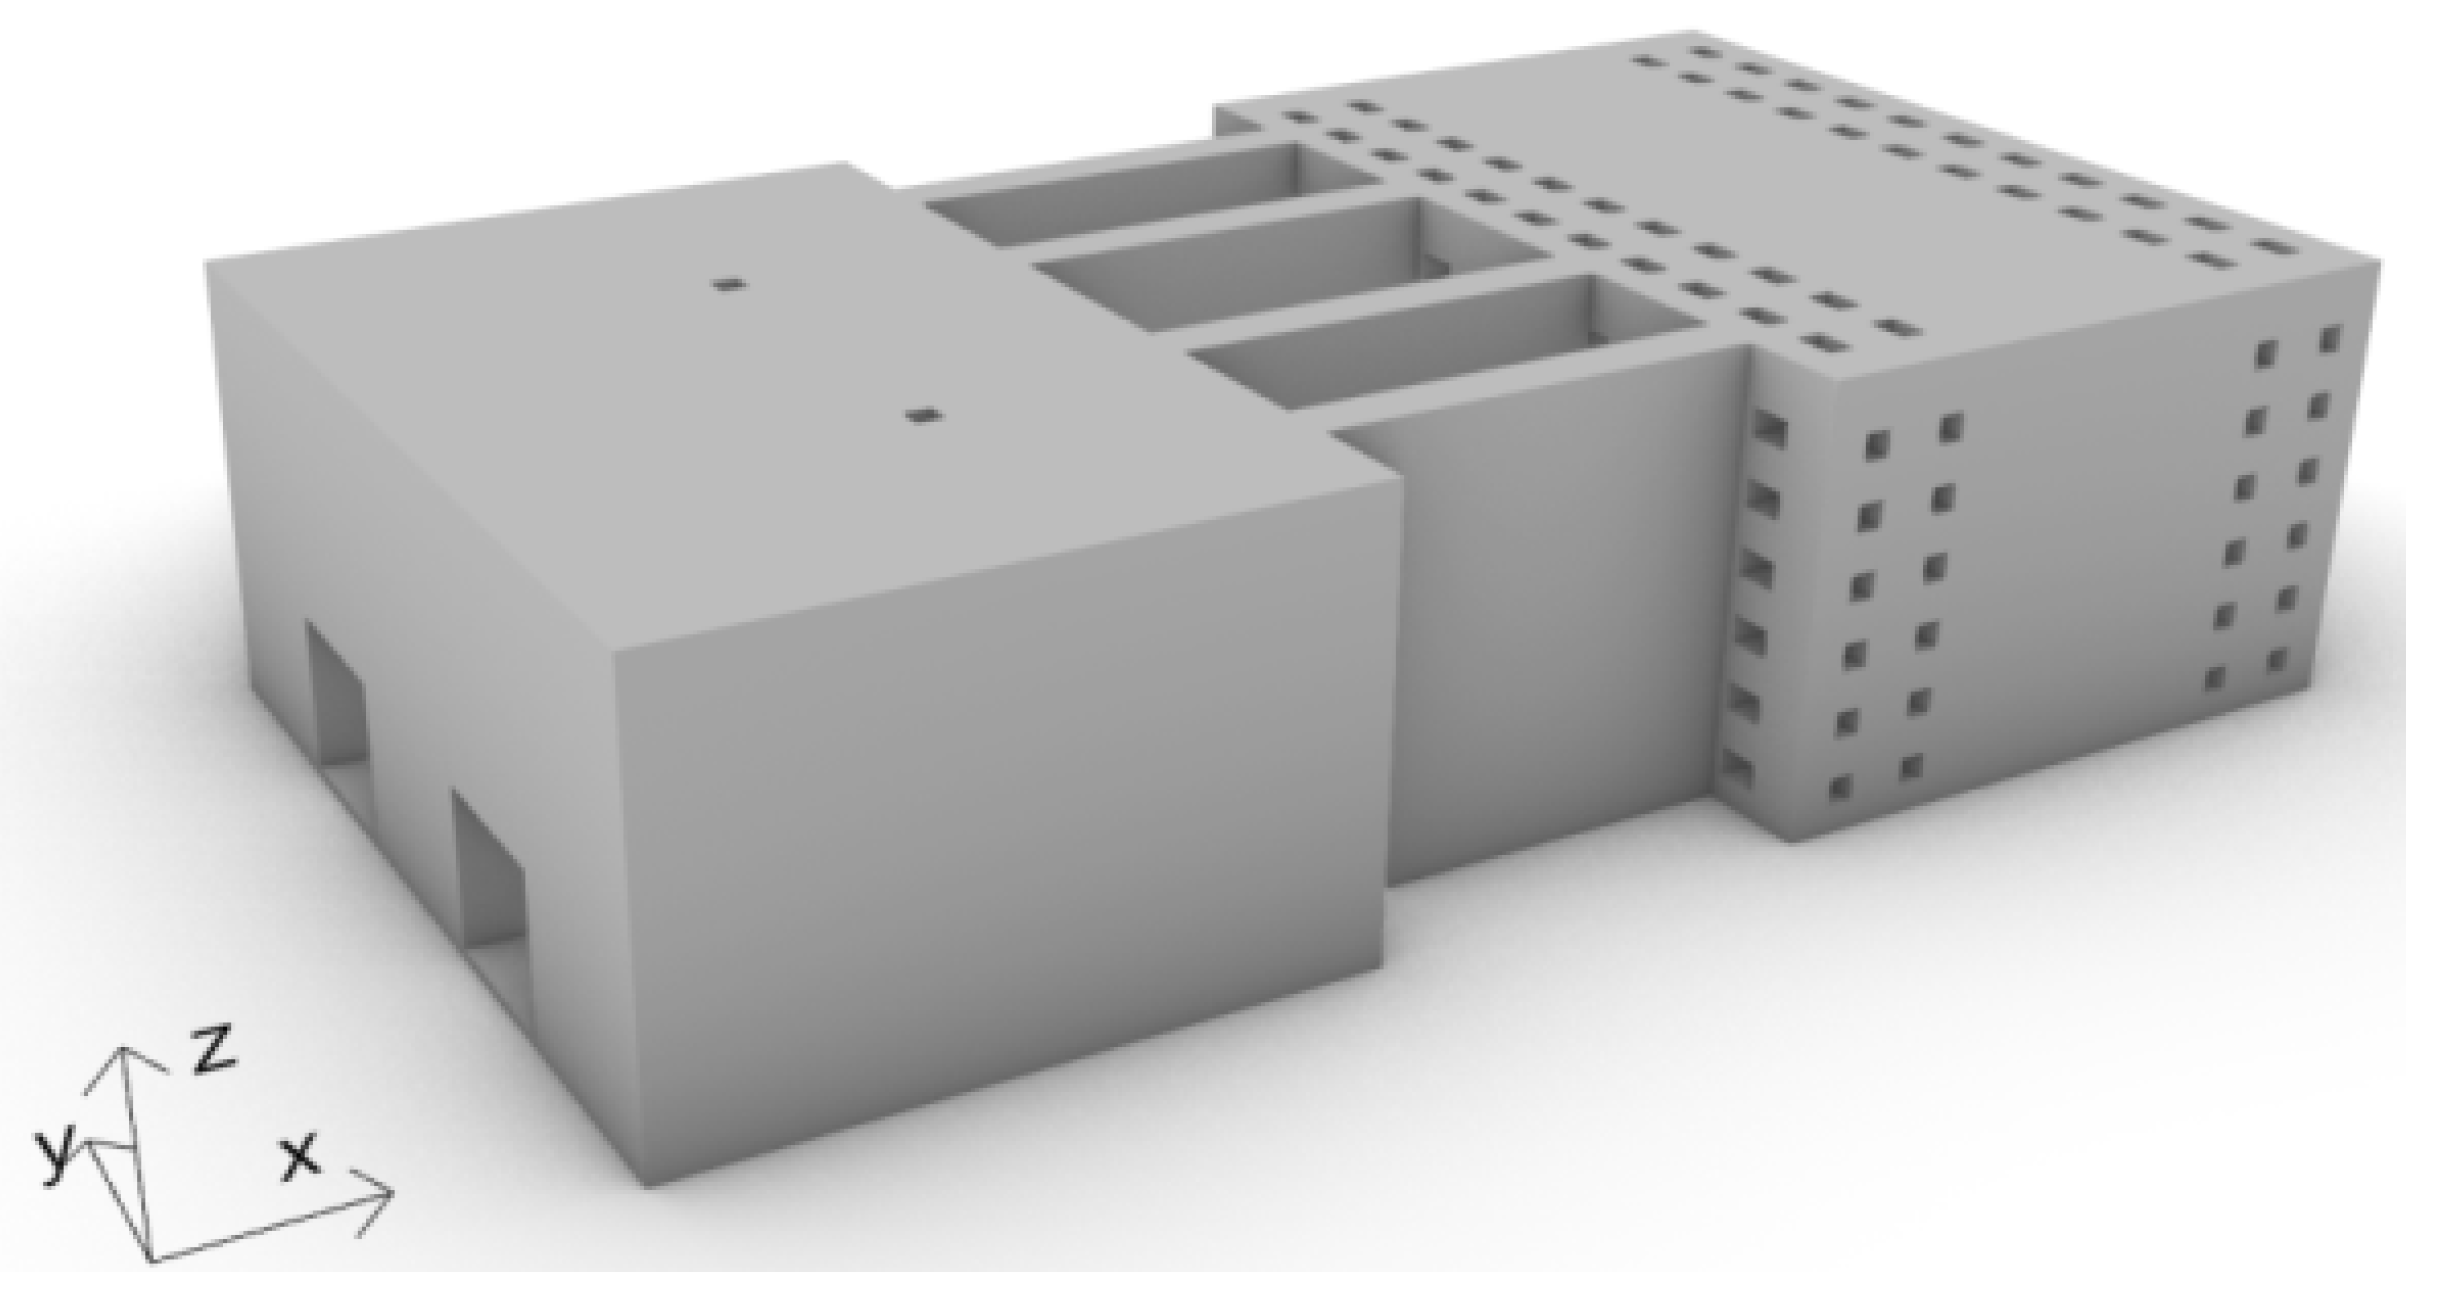
The basic structure of the OWC-perforated floating breakwater model is two floating boxes. The OWC is embedded in the front floater, which has an inner wall thickness of 0.2 m. The rear floater is a perforated floater with orifice sections size of 0.5 × 0.5 m and 0.5 × 0.8 m. The purpose of the perforations is to further break and dissipate the waves that pass through the front float, thereby achieving an improved wave dissipation effect. To maintain structural stability and wave dissipation efficiency, the opening spacing should not be too large or too small. The perforated rate is set at 16.7%, as shown in Figure 11 of the model. The dimensions of a single float are L × B × H = 18 × 12 × 8 m. The draft depth is 5 m, and the incoming waves propagate forward along the x-axis. The water depth is h. The two floating boxes are connected by baffles, with the baffle length denoted as d. The anchor chains are arranged in parallel, and the mooring length is specified as L. The rigid connection between the components is shown in Figure 12 and the dimensions of the upper floating breakwater are shown in Figure 13.
The numerical simulation is conducted using irregular waves. The simulation considers three different seawater depths: 18 m, 25 m, and 36 m. The seawater density is 1.025 kg/m3, the gravity acceleration is 9.8065 m/s2, the wave spectrum is JONSWAP, the significant wave heights are 1 m, 3 m and 5 m, the period of waves are 3.69 s, 4.49 s, 5.28 s, 6.08 s, 6.89 s and 7.69 s, and the spectral peak factor gamma = 3.3. The working conditions of relevant parameters are shown in Table 4.

4.2. Structure Comparison

In order to get a preliminary understanding of the wave dissipation performance of the OWC-perforated floating breakwater, four similar floating breakwater structures were selected and simulated in this paper. Model A is double float which is the common structure for dual-box floating breakwater. Model B is the combination of an OWC-box in seaside and a standard box in leeside. Model C is the combination of a standard box in seaside and a perforated box in leeside. Model D is the combination of an OWC-box in seaside and a perforated box in leeside, which is named “OWC-Perforated Floating Breakwater” in this paper. The difference between the four models only lies from the top structure, and the mooring system and the connected style are same. So, Table 5 only shows the sketch map of the four models. The mooring length lying on the seabed is l = 9 m, and the water depth is h = 25 m (as shown in Figure 12).
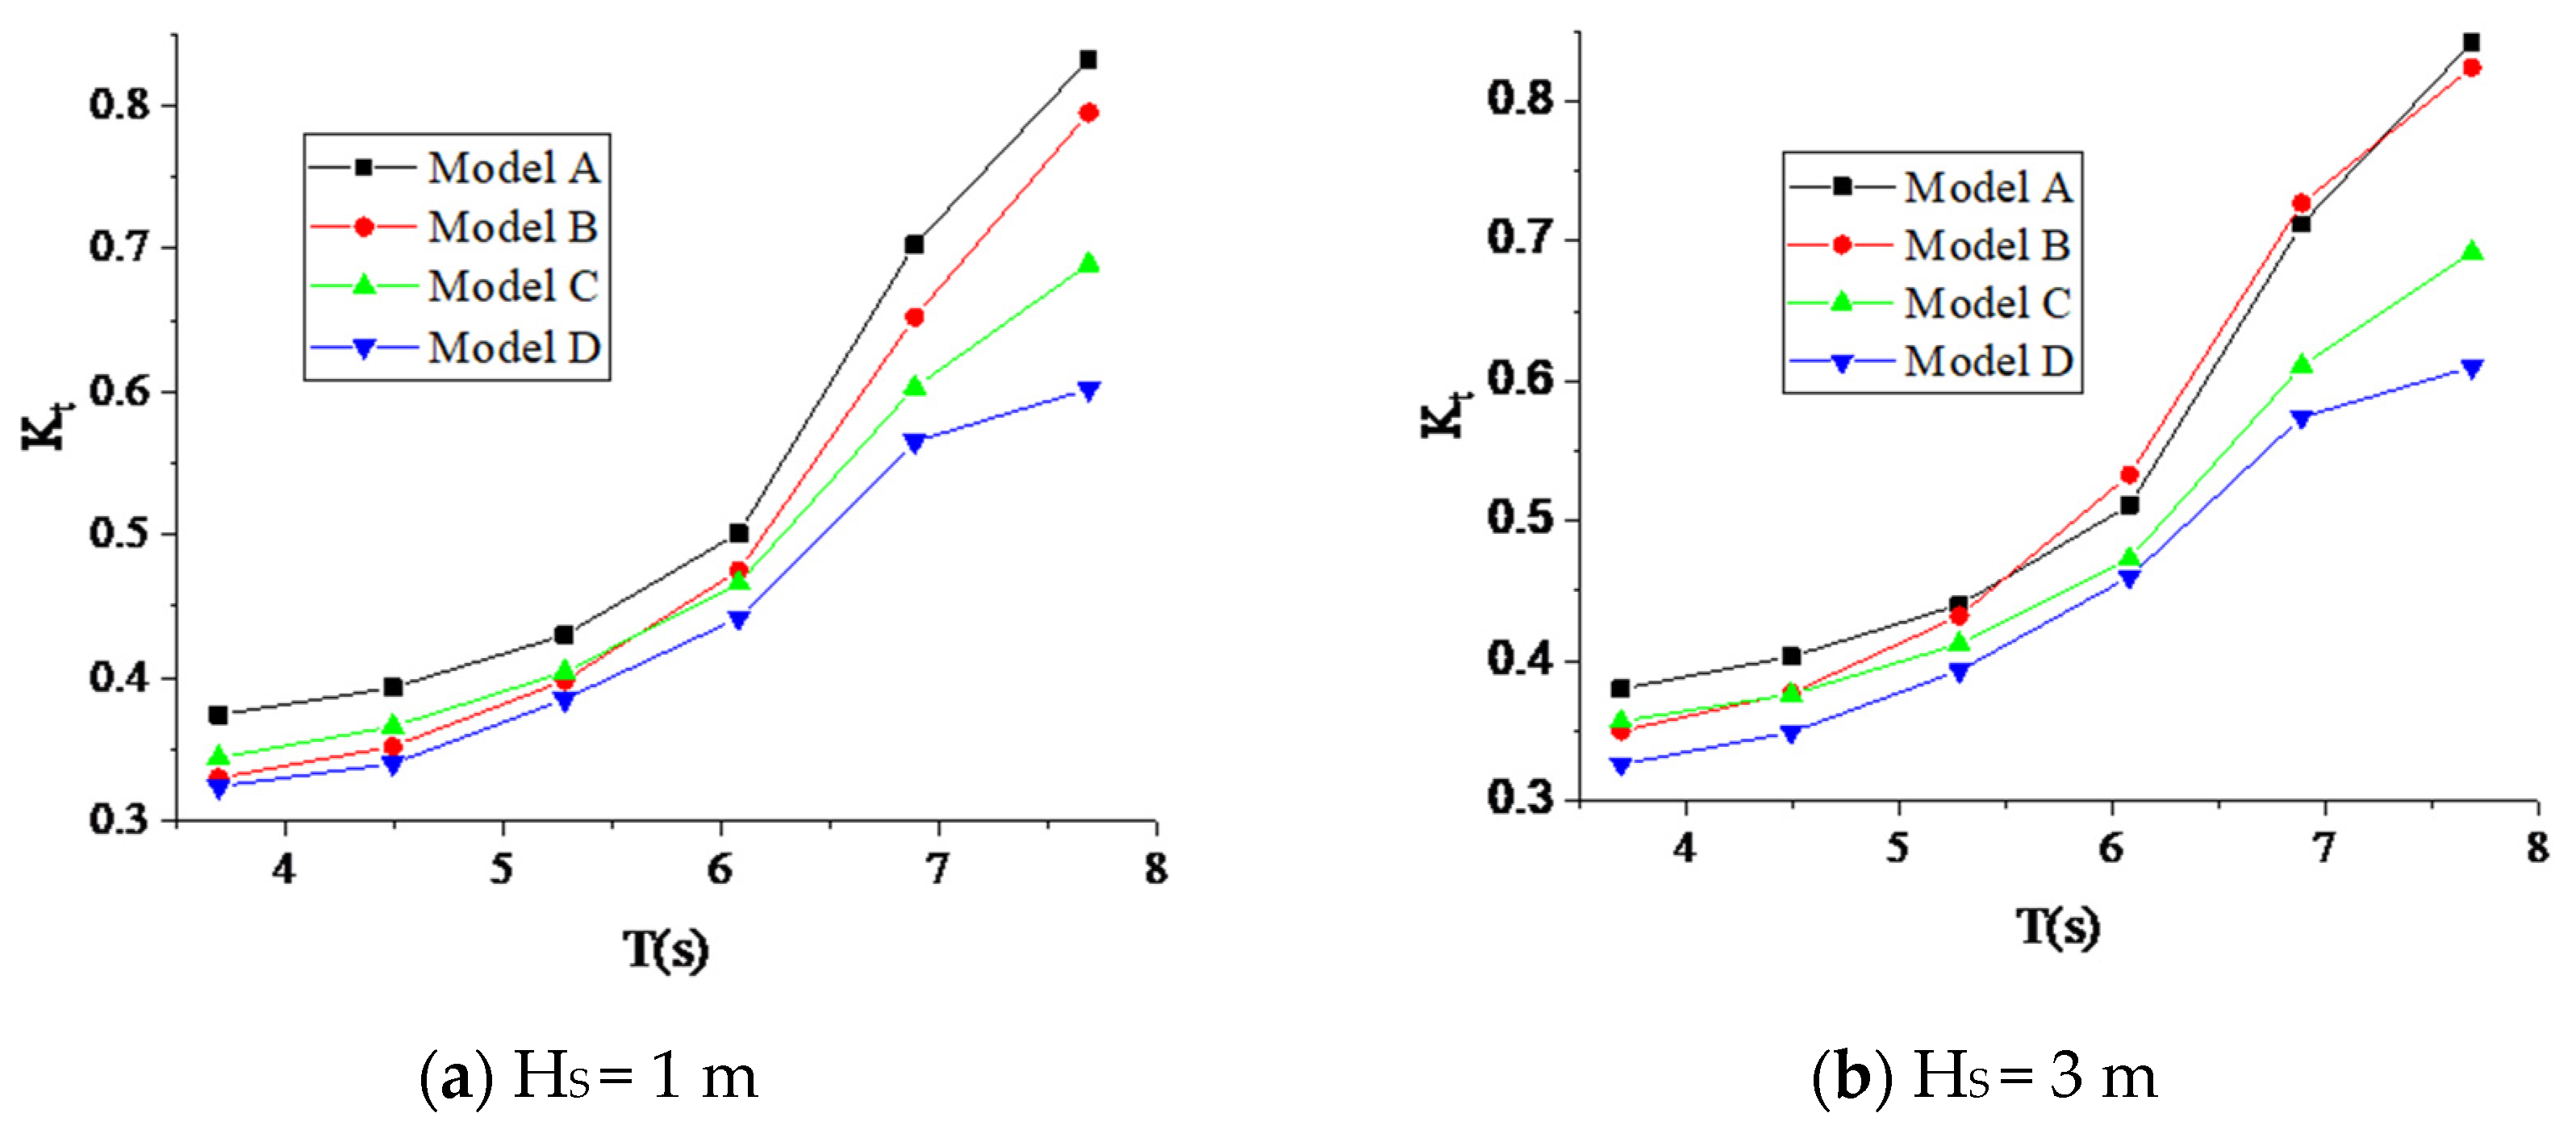
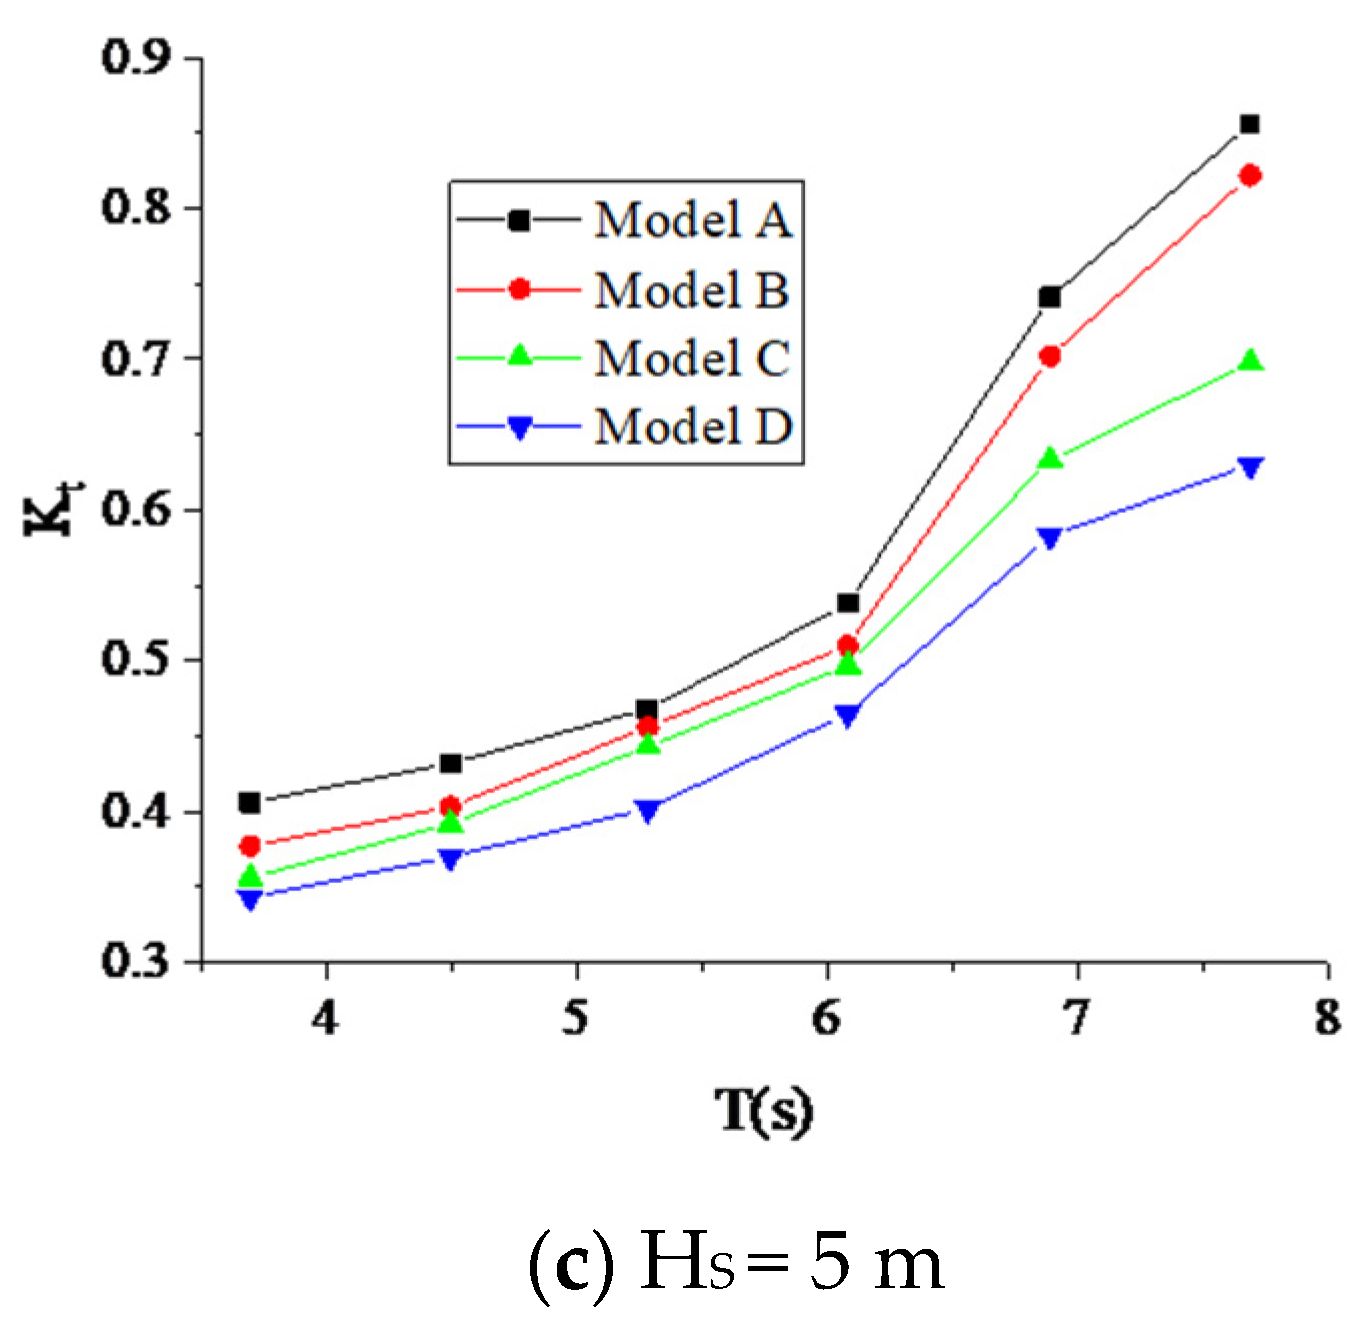
During the calculation, the space distance between the two boxes is 8 m and the opening width of OWC is 3 m with a water depth 25 m under three kinds of significant wave heights (1 m, 3 m and 5 m). The transmission coefficients of the four models are shown in Figure 14. The transverse coordinate represents the periodic T, and the longitudinal coordinate represents the transmission coefficient Kt. By comparing the transmission coefficients of the four structures, it can be observed that Model A exhibits relatively large transmission coefficients. Model D demonstrates relatively small transmission coefficients, approximately 27% lower than that of the double box structure. This suggests a significant wave dissipation effect. The transmission coefficients of Model C and Model B fall between these two. Therefore, considering the wave dissipation performance, Model D exhibits better wave dissipation characteristics. Additionally, the OWC float box on the upstream side possesses the potential to generate electricity from wave energy. Consequently, Model D represents a floating break-water with promising practical applications.

4.3. Influence of Spacing

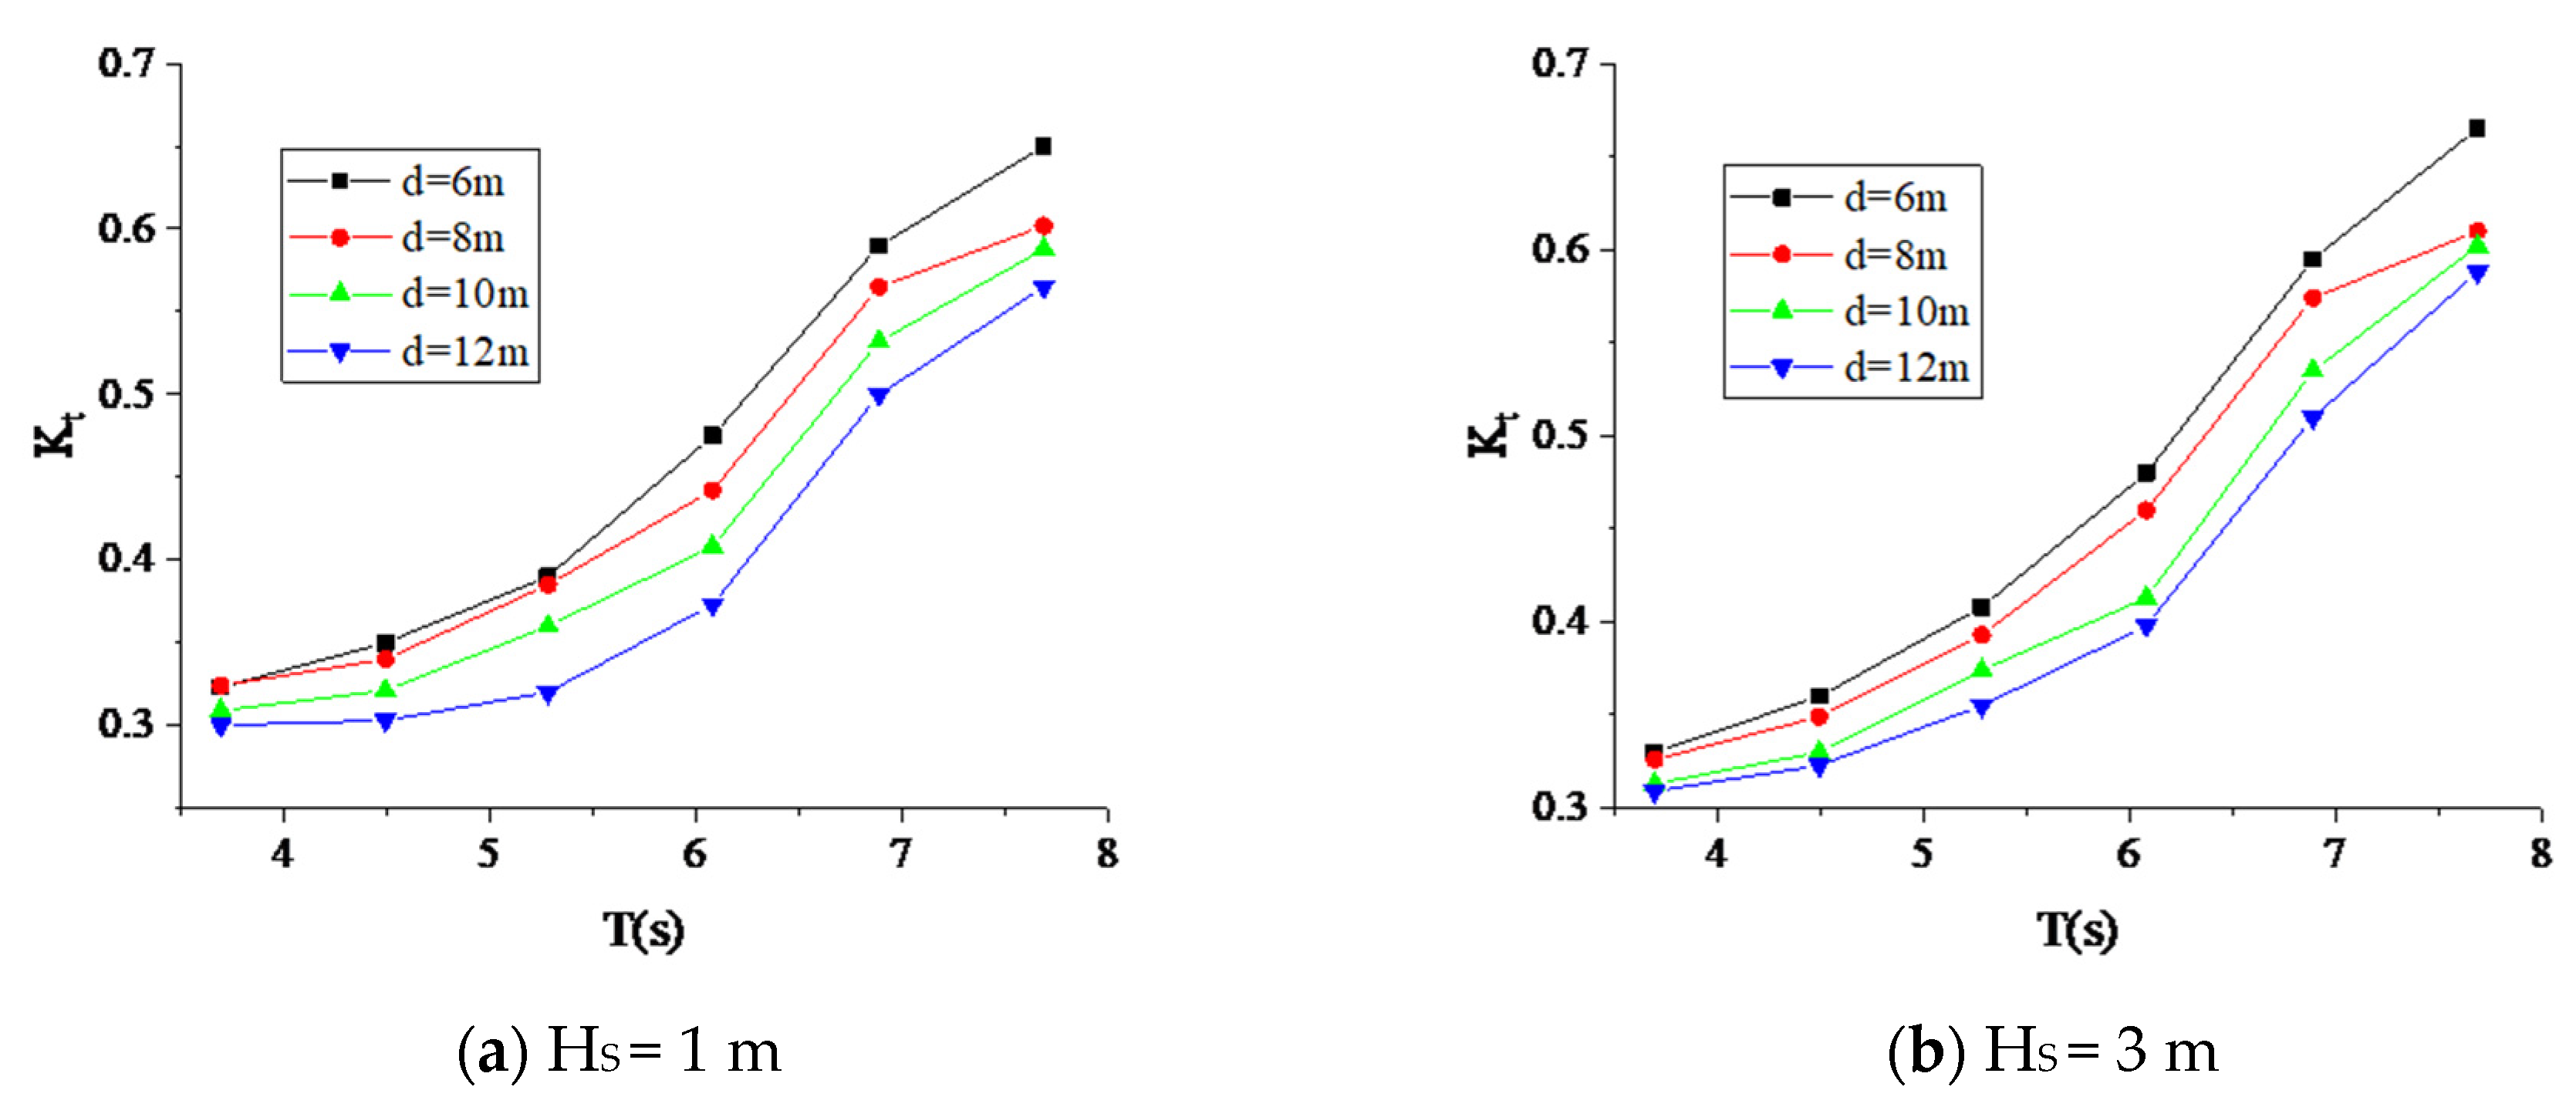
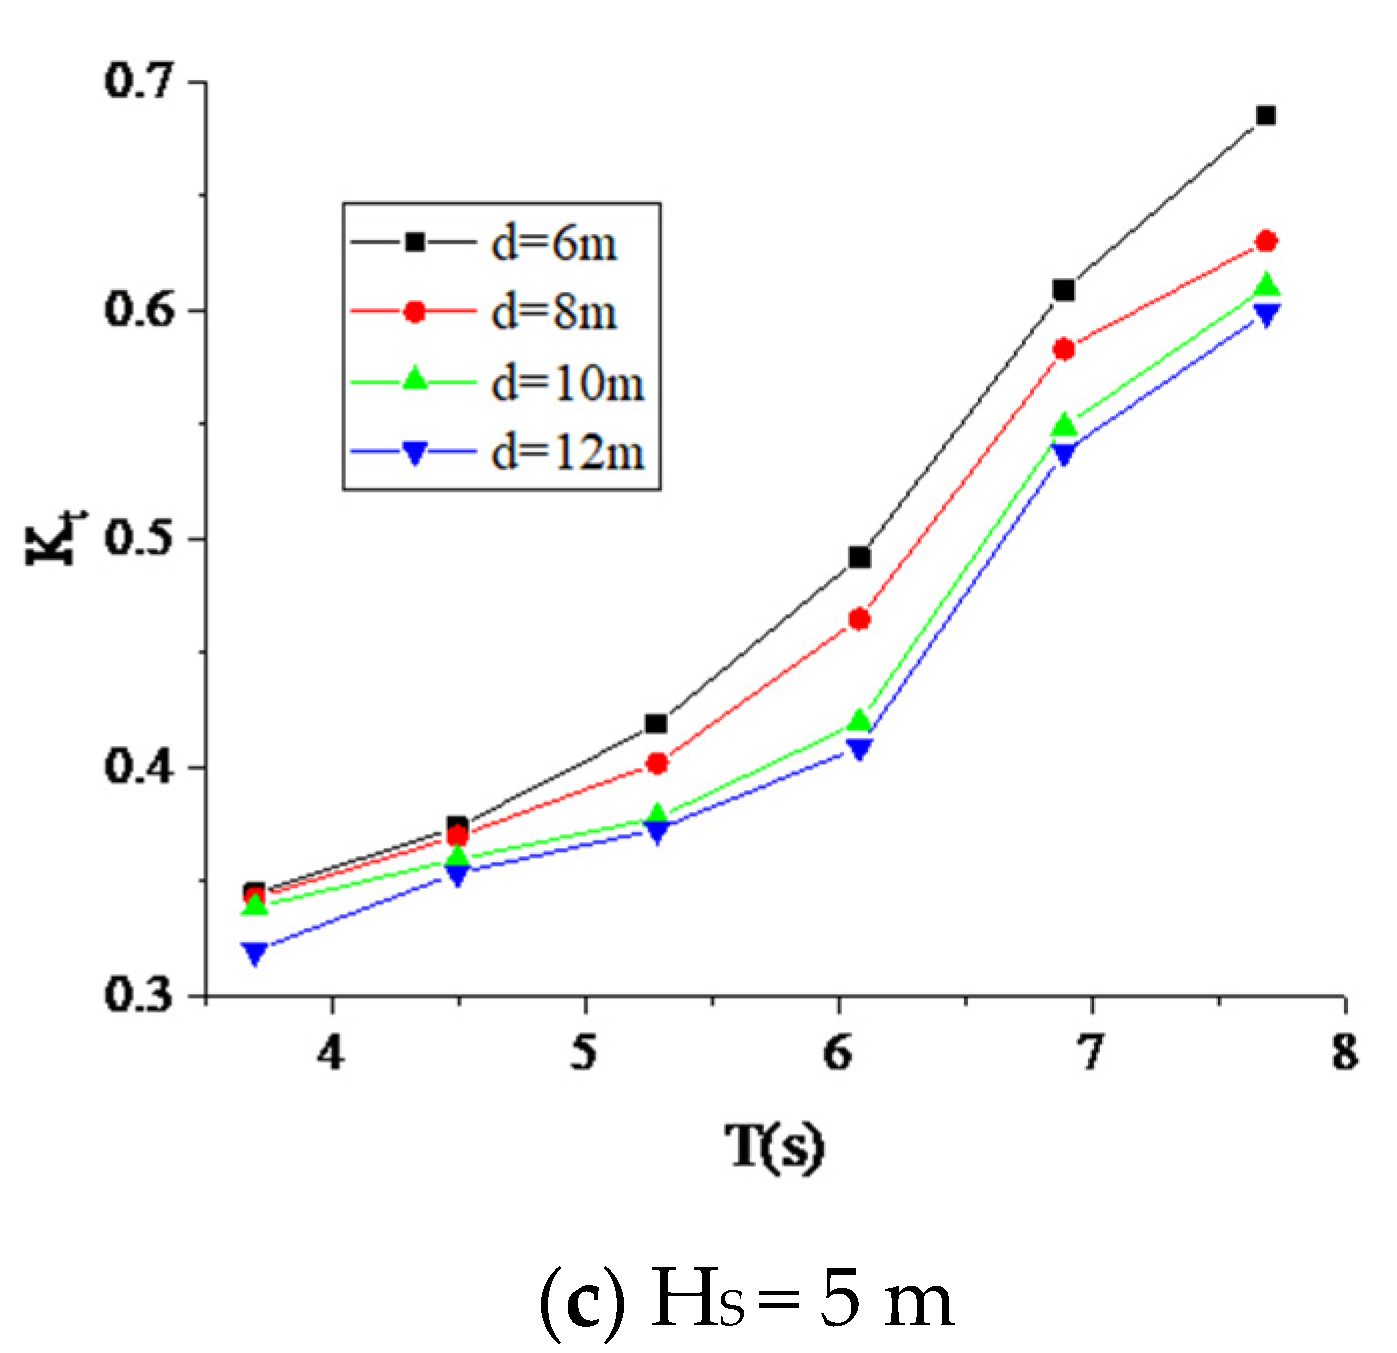
We changed the spacing of the OWC-perforated floating breakwaters to 6 m, 8 m, 10 m and 12 m, respectively. The simulated water depth is 25 m, and the significant wave heights are 1 m, 3 m and 5 m, respectively. The transmission coefficients are calculated, and the results are presented in Figure 11. From Figure 15a it can be seen that the transmission coefficient gradually decreases as the spacing increases. Comparing Figure 15a–c, it is shown that for short-period waves and smaller significant wave heights, the influence of spacing on the transmission coefficient is more pronounced. On the one hand, the increase of the spacing is equivalent to increasing the width of the floating breakwater and blocking more waves. On the other hand, the increase of the spacing makes the waves more completely mixed and broken between the two floating tanks, consuming more waves.

4.4. Influence of Water Depth

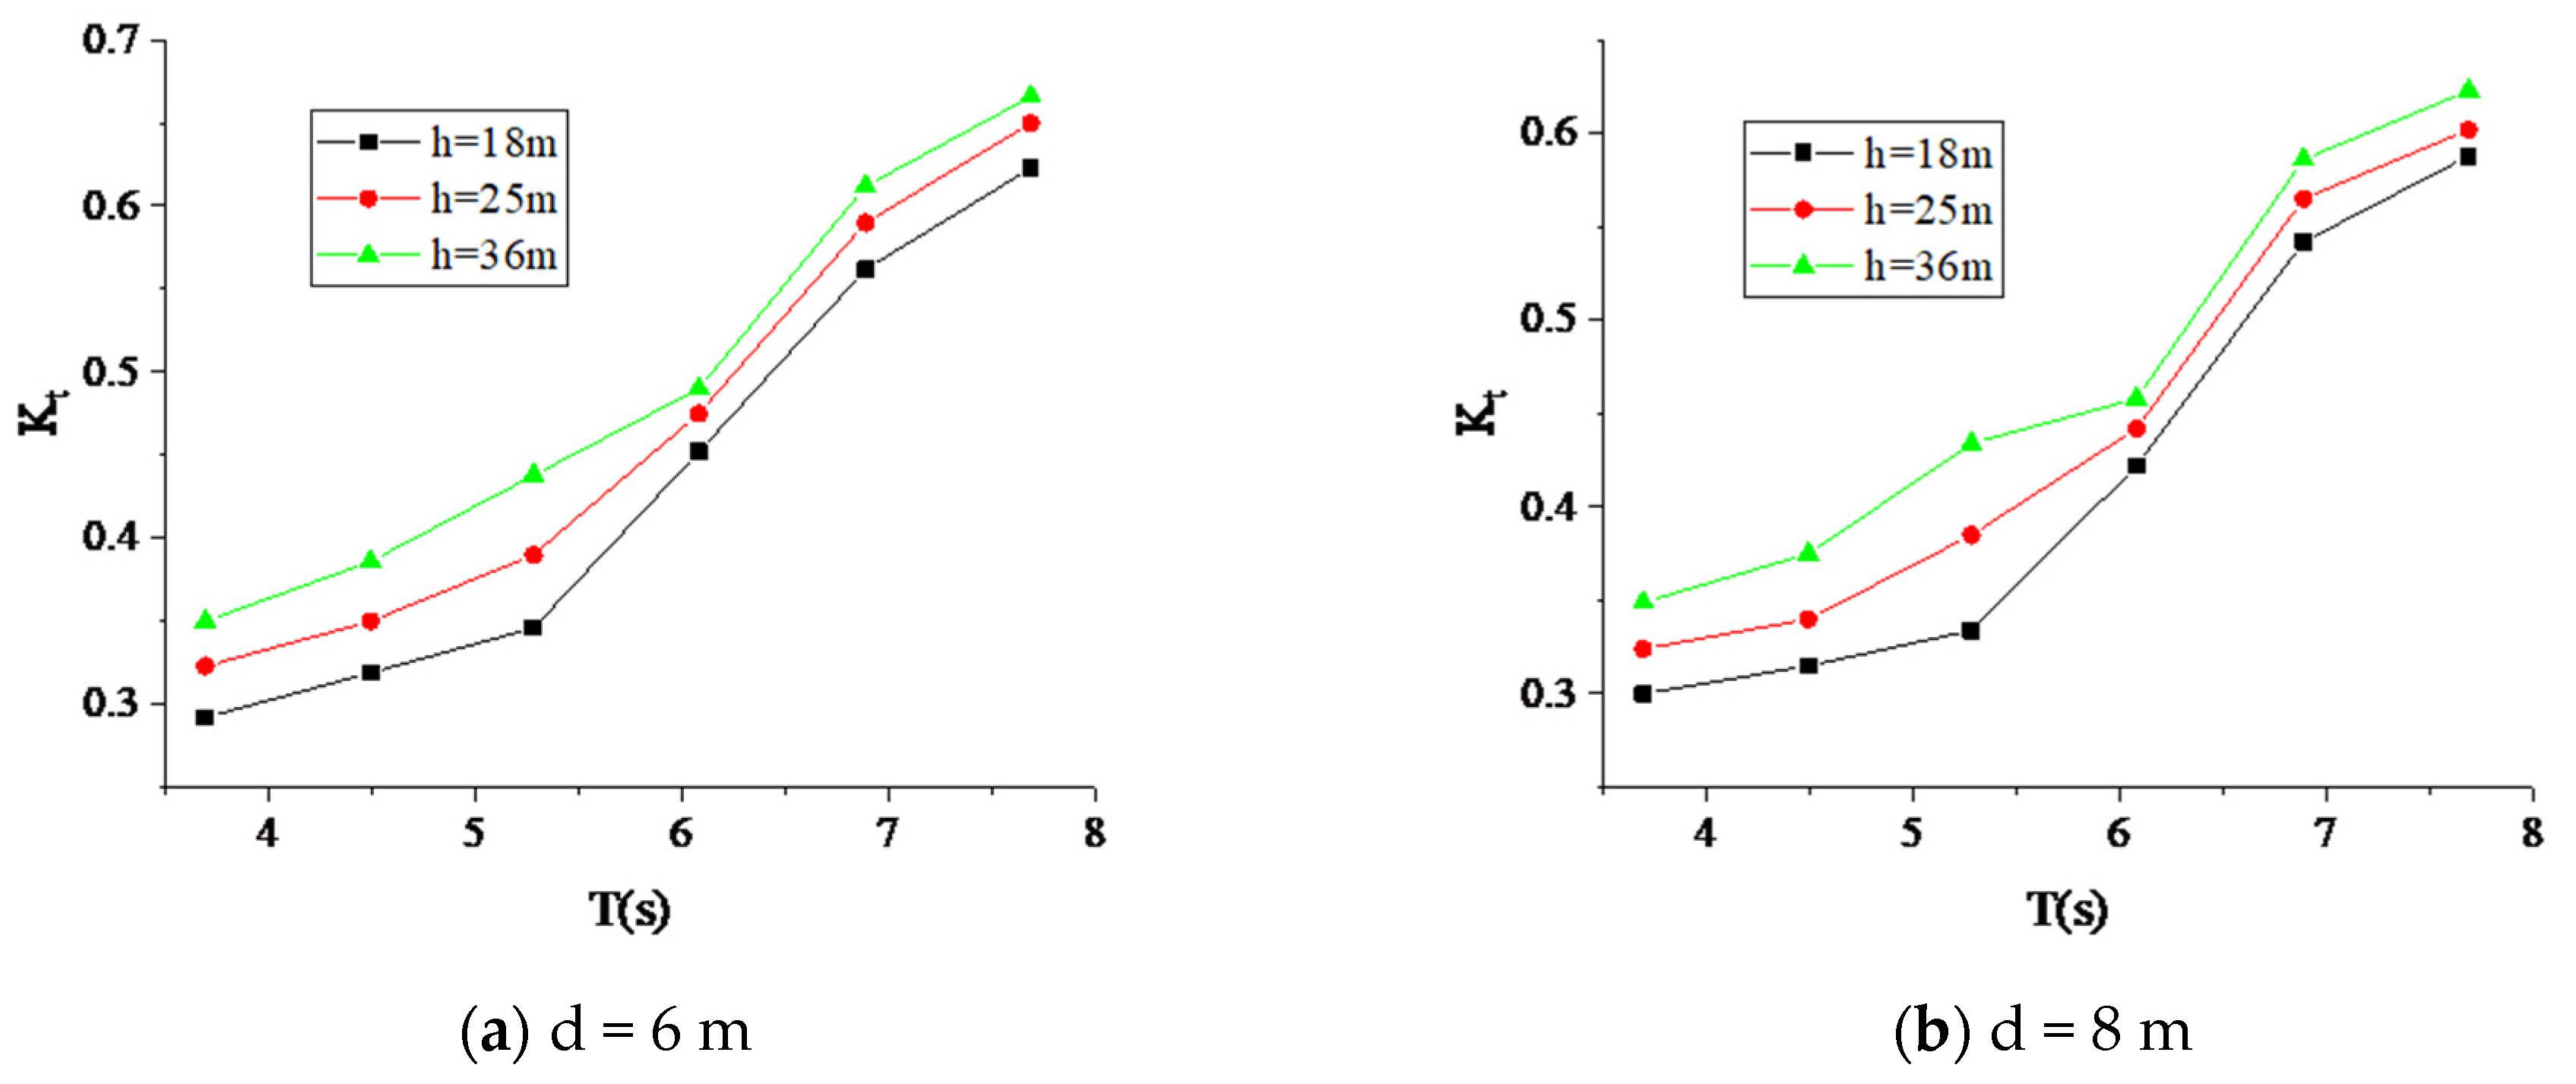
In this paper, three seawater depths are selected for simulation calculation, which are 18 m, 25 m and 36 m, respectively. The results, as shown in Figure 16, demonstrate that the transmission coefficient increases with an increase in water depth. Notably, the influence of water depth is more significant for short-period waves compared to long-period waves. Overall, as the water depth increases, the transmission coefficient gradually increases. This can be attributed to a decrease in water depth, equivalent to increasing the draft of the floating breakwater, which leads to a larger water-retaining area and greater wave-blocking capability, resulting in a decrease in the transmission coefficient.

4.5. Influence of Incident Wave Angle

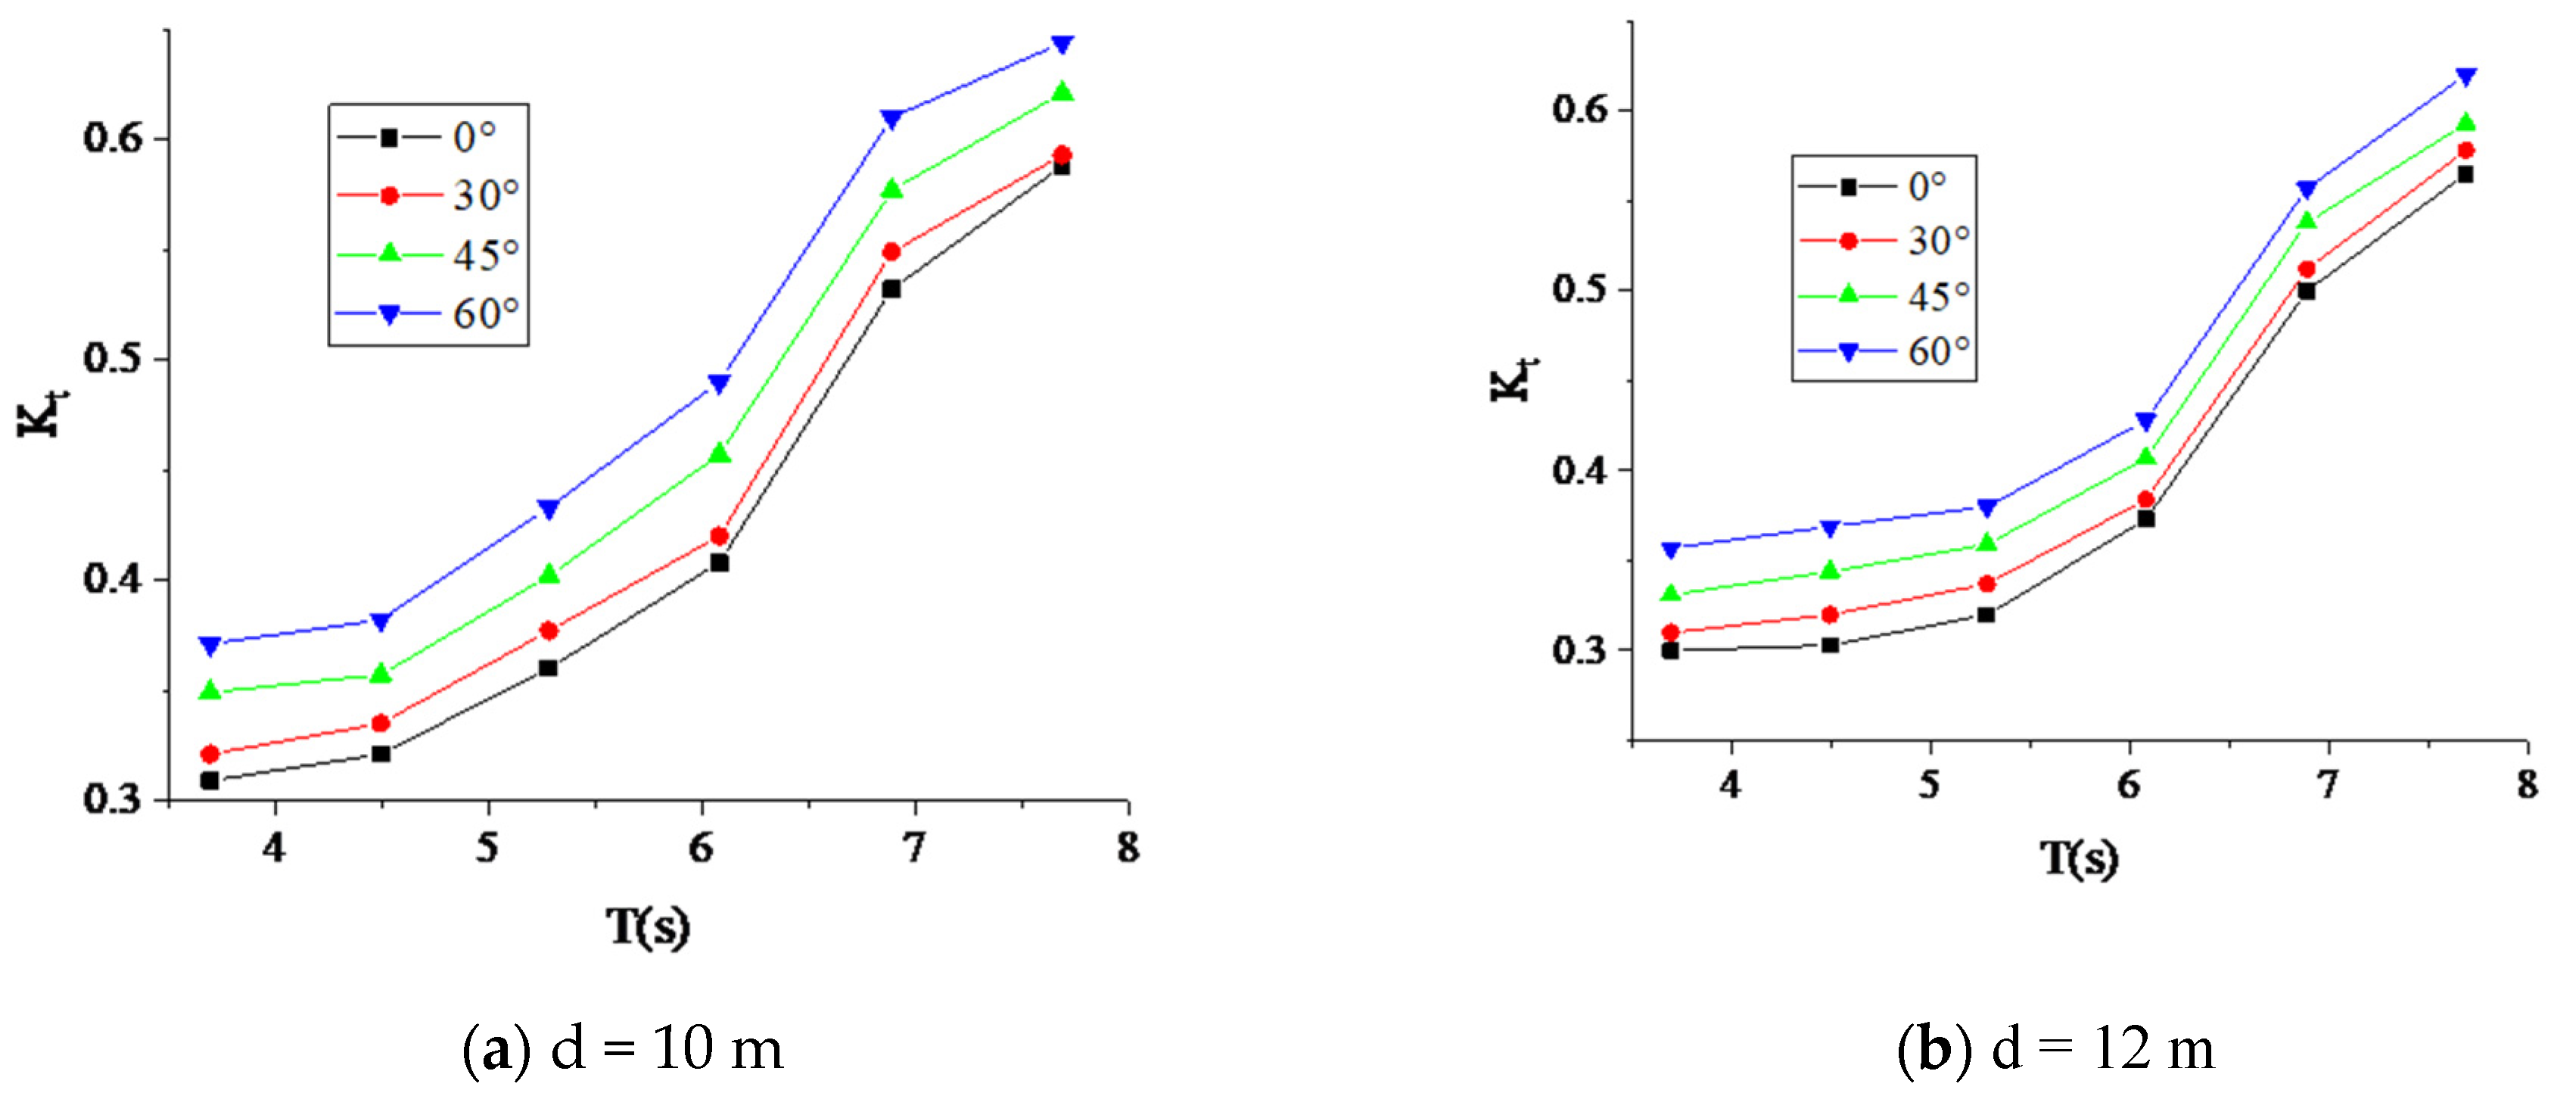
Under actual sea conditions, oblique incident waves are common. Therefore, it is essential to understand the influence of wave incidence angle on the transmission coefficient. In this study, the incident wave angle is defined as 0° when the wave propagates forward along the x-axis (as shown in Figure 11), and it is defined as 90° when the wave propagates forward along the y-axis. Figure 17 shows the variation of the transmission coefficient of the floating breakwater under the action of waves with two different spacings of 10 m and 12 m, a significant wave height of 1m, and four different wave incidence angles. It can be seen from the figure that the wave incidence angle has some impact on the transmission coefficient. When the incident angle is small (0°–30°), the influence is relatively small, and when the incident angle is large (30°–60°) it becomes more significant. In general, the transmission coefficient tends to increase with an increase in the wave incident angle, particularly when the incident angle is large, where the influence ratio becomes more evident.

4.6. Significant Wave Height

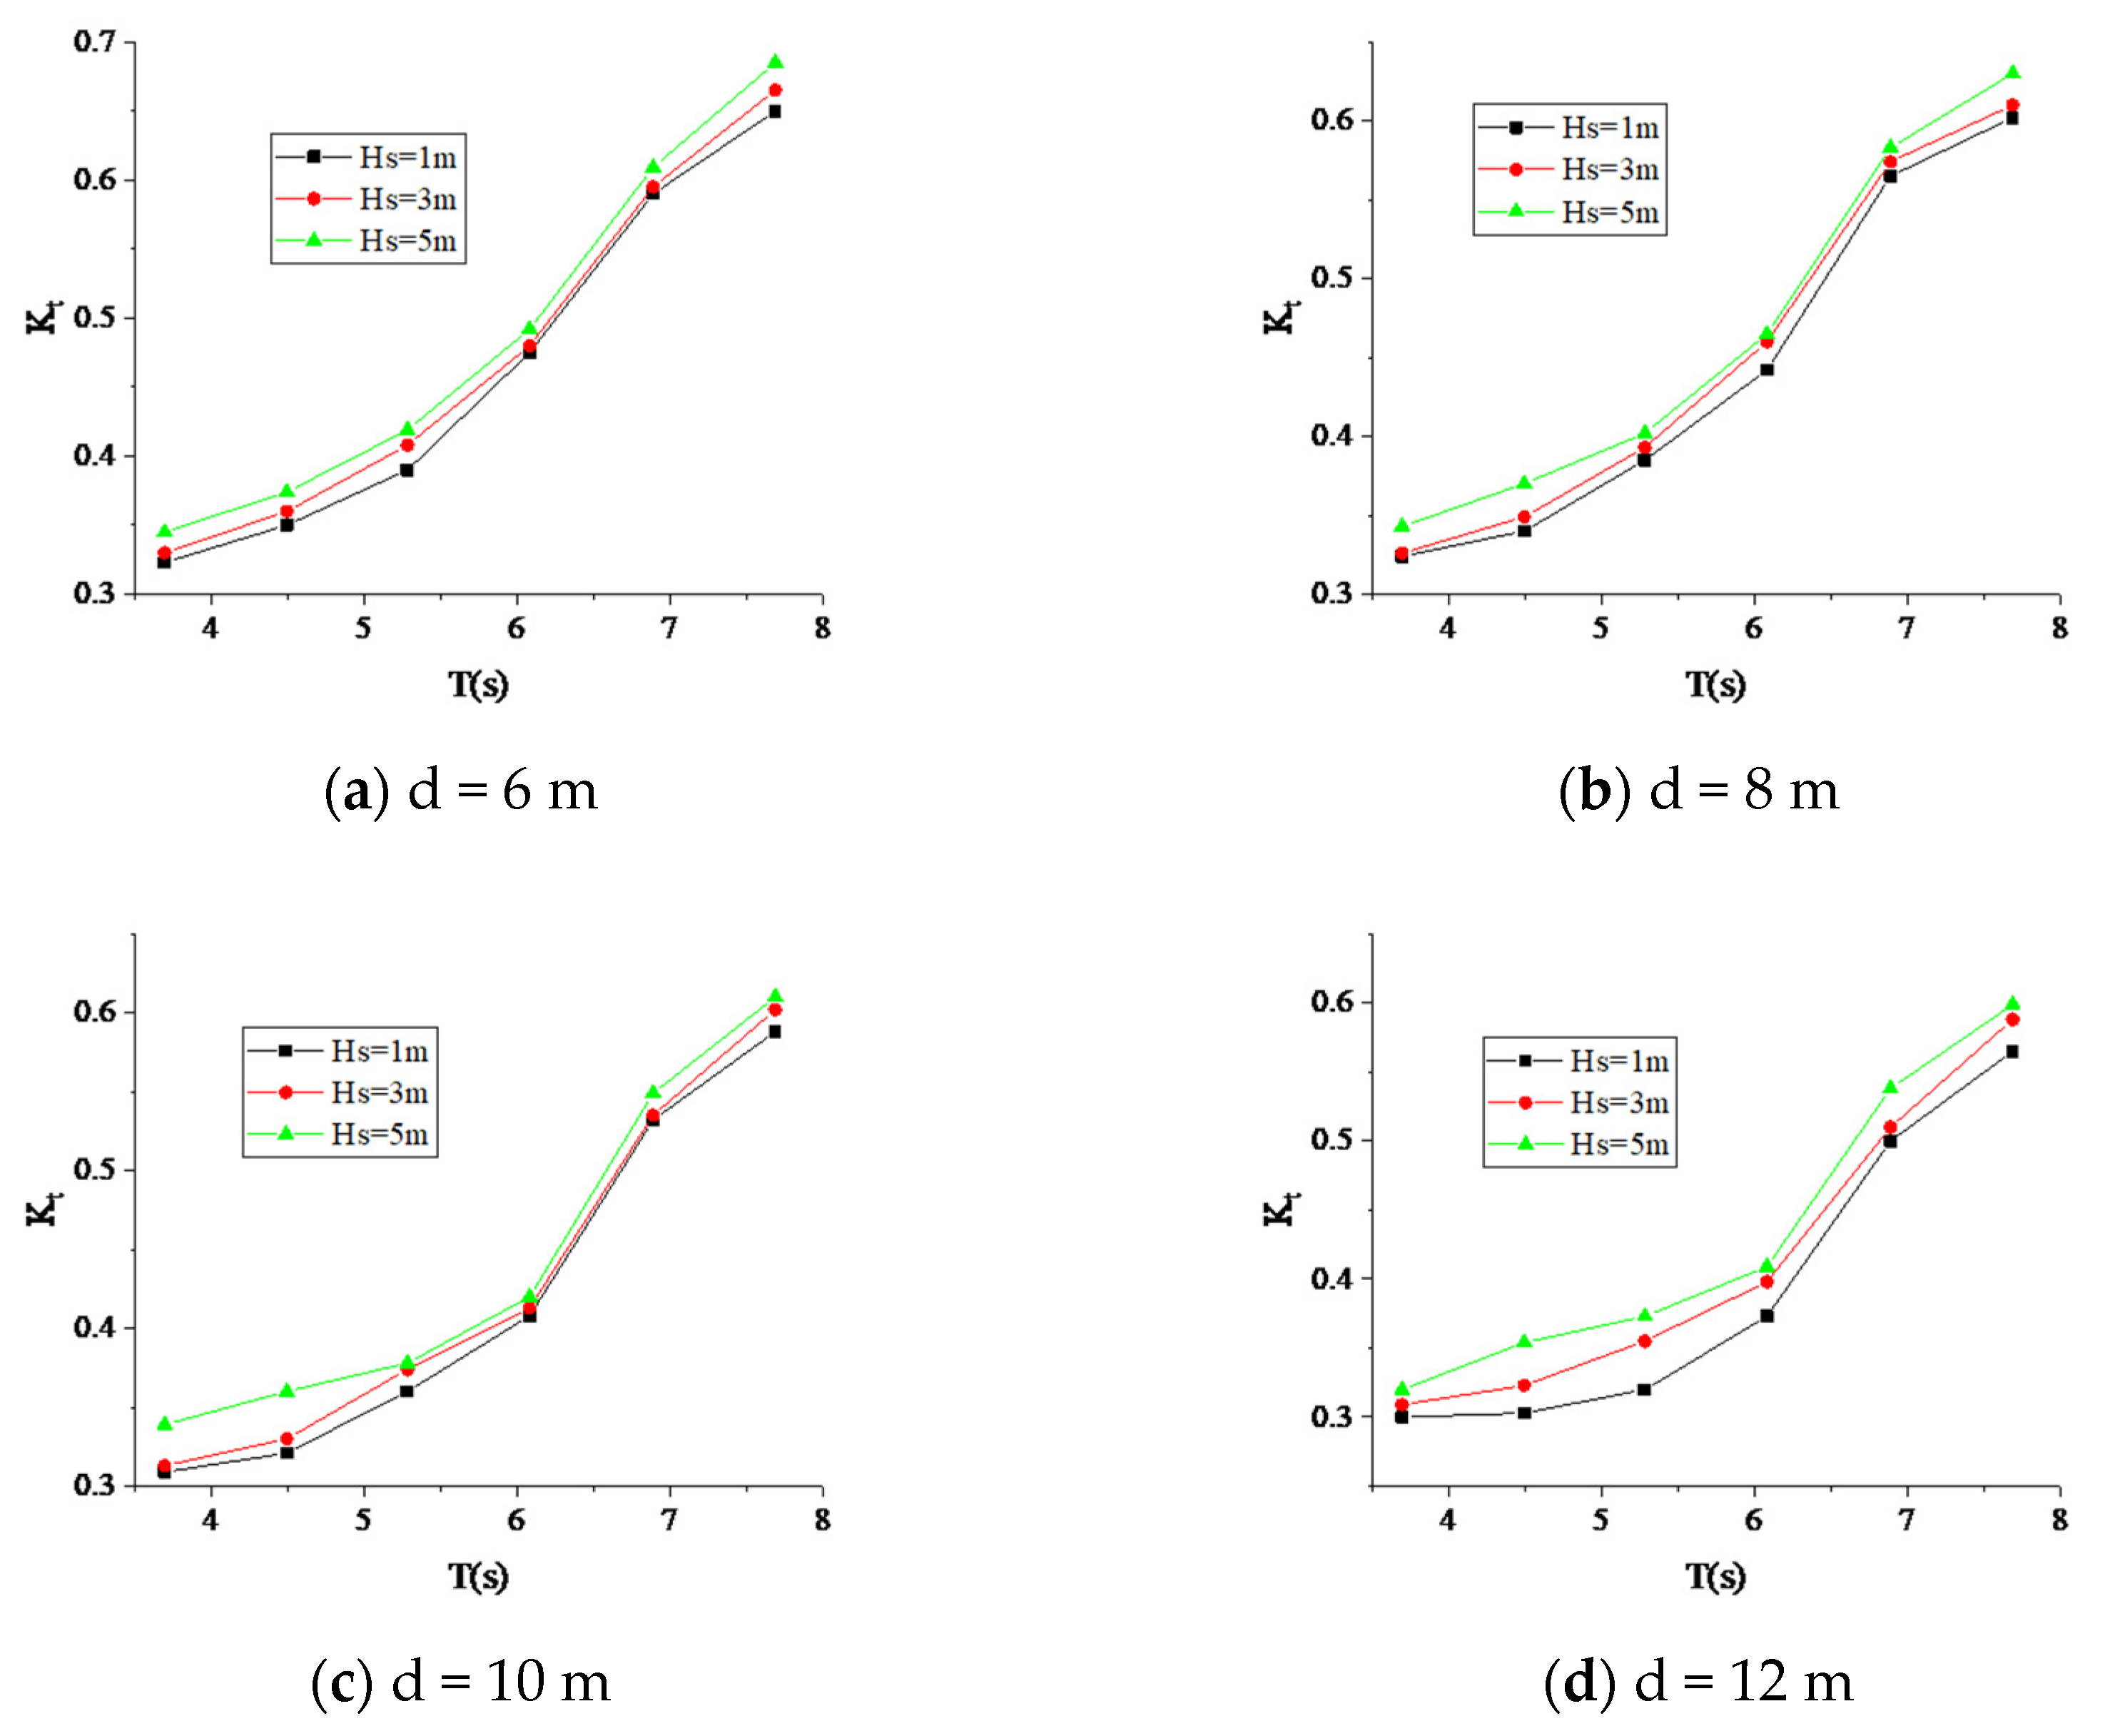
To determine the influence of significant wave height on the wave dissipation effect of the floating breakwater, simulations were conducted under the conditions of varying spacing: 6 m, 8 m, 10 m and 12 m, at a water depth of 25 m and an OWC opening width of 3 m. The calculated transmission coefficient is shown in Figure 18.
As can be seen from the transmission coefficient in Figure 18, the smaller the significant wave height, the smaller the transmission coefficient. When the spacing is 6 m, 8 m, 10 m, and 12 m, the average differences in transmission coefficients are 3%, 4.2%, 6.2%, and 7.7%, respectively. This indicates that the influence of significant wave height on the transmission coefficient increases with the increase in spacing. This observation can be attributed to the fact that increasing the significant wave height is equivalent to reducing the wave-retaining area of the structure. Consequently, more waves pass through the floating breakwater, leading to a deterioration in wave retention and an increase in the transmission coefficient. On the other hand, as the spacing increases, waves have more opportunity to be fully mixed and broken between the structures. Under these conditions, reducing the significant wave height can significantly decrease the transmission coefficient.

5. Conclusions

This paper presents a numerical simulation study on the wave dissipation performance of an OWC-perforated floating breakwater under irregular waves using ANSYS-AQWA software. The effects of spacing, opening width and water depth on the wave dissipation performance of floating breakwater are discussed. The following conclusions can be drawn:
(1)
The wave dissipation effect of the OWC-perforated floating breakwater is superior to that of similar structures.
(2)
The spacing between the floating breakwater components has a significant impact on the transmission coefficient, particularly for long-period waves. The width of the OWC opening influences the wave dissipation effect. A wider opening is more effective for long-period waves.
(3)
The water depth has a great influence on the wave dissipation performance of OWC-perforated floating breakwater. A shallower water depth yields better wave dissipation. The significant wave height has little effect on the wave dissipation effect. The wave dissipation performance is better when the incident wave angle is 0°.
In the numerical simulation research of this paper, the author believes that some of the research content still needs in-depth discussion and improvement, mainly reflected in the following aspects:
(1)
This paper only discusses the wave dissipation performance of the OWC-opening double-body floating breakwater. Further research is needed on factors such as anchor chain force and wave pressure, and the coupling effect between the mooring system and the floating breakwater also needs to be considered.
(2)
This paper does not simulate and calculate the conversion efficiency of the embedded OWC wave energy conversion device. The influence of different wave conditions and different OWC opening widths on the wave energy conversion efficiency can be further simulated and discussed.

Author Contributions

Conceptualization, Y.M.; Methodology, Y.Z. (Yanna Zheng); Software, J.L.; Validation, Y.Z. (Yu Zhang); Investigation, S.H.; Data Curation, X.S. All authors have read and agreed to the published version of the manuscript.

Funding

This research was funded by Key Laboratory of Environment Controlled Aquaculture (Dalian Ocean University; grant number-202302); General Project of the Educational Department of Liaoning Provincial (grant number-LJKZ0717); State Key Laboratory of Coastal and Offshore Engineering (grant number-LP2121); Scientific Research Project of the Educational Department of Liaoning Provincial (grant number-100920202019).

Institutional Review Board Statement

Not applicable.

Informed Consent Statement

Not applicable.

Data Availability Statement

Not applicable.

Conflicts of Interest

The authors declare no conflict of interest.

References

  1. Williams, A.N.; Lee, H.S.; Huang, Z. Floating pontoon breakwaters. Ocean Eng. 2000, 27, 221–240. [Google Scholar] [CrossRef]
  2. Wang, X.W.; Li, J.; Chen, J.Y.; Ji, C.Q.; Zhang, J.F. Wave attenuation performance of double floating box floating breakwater under long-period waves. Port Waterw. Eng. 2021, 8, 8–12. [Google Scholar]
  3. Zheng, Y.N.; Yao, Y.P.; Dong, G.H.; Chen, C.P. Time-domain numerical simulation of wave action on double-box floating breakwater. In Proceedings of the 15th China Offshore Engineering Symposium, Taiyuan, China, 3–6 August 2011; pp. 162–167. [Google Scholar]
  4. Wang, Z.Y.; Wang, Y.X.; Wang, G.Y. Numerical study on hydrodynamic characteristics of anchor chain anchored double pontoon floating breakwater. In Proceedings of the 15th China Offshore Engineering Symposium, Taiyuan, China, 3–6 August 2011; pp. 183–189. [Google Scholar]
  5. Sun, B.; Li, C.; Yang, S.; Zhang, H.; Song, Z. Experimental and numerical study on the wave attenuation performance and dynamic response of kelp-box type floating breakwater. Ocean Eng. 2022, 263, 112374. [Google Scholar] [CrossRef]
  6. Zhang, H.; Sun, B.; Li, Z.; Wang, F. Wave attenuation and motion response of floating breakwater with sponge material. Ocean Eng. 2023, 277, 114325. [Google Scholar] [CrossRef]
  7. Xu, X.L.; Li, Y.; Sun, X.L.; Chen, Z.; Zhang, Y.; Kong, F.; Shu, N. Experimental study on wave dissipation characteristics of double row adjustable floating box breakwater. Port Eng. Technol. 2017, 54, 28–33. [Google Scholar]
  8. Shen, X.S.; Pan, J.N.; Zhou, Y.R.; Wang, X.G. Experimental study on wave dissipation performance of double floating box floating breakwater. Ocean Eng. 2018, 36, 47–54. [Google Scholar]
  9. Shunichi, I.; Yasuhiro, S. Study On the Performance of a Floating Breakwater with Two Boxes. In Proceedings of the 12th International Offshore and Polar Engineering Conference, Kitakyushu, Japan, 26–31 May 2002. [Google Scholar]
  10. Wang, H.Y. Experimental Study and Numerical Simulation of Porous Floating Breakwater; Dalian University of Technology: Dalian, China, 2010. [Google Scholar]
  11. Hu, W.Q.; Yu, W.G.; Zhan, J.M.; Fan, Q.; Gong, Y.J. Study on wave attenuation characteristics of a three-dimensional porous structure. In Proceedings of the 10th National Conference on Fluid Mechanics, Hangzhou, China, 26 October 2018; pp. 185–186. [Google Scholar]
  12. Liu, D.X.; Zheng, Y.N.; Zhang, J.X. Research and application progress of oscillating water column wave energy power generation device. J. Dalian Ocean. Univ. 2015, 30, 231–236. [Google Scholar]
  13. Li, X.; Yu, Z.; Qu, H.; Yang, M.; Shi, H.; Zhang, Z. Experimental Study on the Aerodynamic Performance and Wave Energy Capture Efficiency of Square and Curved OWC Wave Energy Conversion Devices. Sustainability 2023, 15, 4963. [Google Scholar] [CrossRef]
  14. Masoomi, M.; Yousefifard, M.; Mosavi, A. Efficiency Assessment of an Amended Oscillating Water Column Using OpenFOAM. Sustainability 2021, 13, 5633. [Google Scholar] [CrossRef]
  15. Tsai, C.-P.; Ko, C.-H.; Chen, Y.-C. Investigation on Performance of a Modified Breakwater-Integrated OWC Wave Energy Converter. Sustainability 2018, 10, 643. [Google Scholar] [CrossRef] [Green Version]
  16. He, F.; Huang, Z.H.; Law, A.W. Hydrodynamic performance of a rectangular floating breakwater with and without pneumatic chambers: An experimental study. Ocean Eng. 2012, 51, 16–27. [Google Scholar] [CrossRef]
  17. He, F.; Huang, Z.H. Hydrodynamic performance of pile-supported OWC-type structures as break-waters: An experimental study. Ocean Eng. 2014, 88, 618–626. [Google Scholar] [CrossRef]
  18. Yu, D.Y.; Qu, M.; Xie, Y.J. Scheme design and experimental study of a pile foundation breakwater with integrated OWC air chamber. Acta Energiae Solaris Sin. 2021, 42, 379–386. [Google Scholar]
  19. Kshma, T.; Santanu, K. Mathematical modeling of breakwater-integrated oscillating water column wave energy converter devices under irregular incident waves. Renew. Energy 2021, 178, 403–419. [Google Scholar]
  20. Zhang, H.; Zhou, B.; Vogel, C. Hydrodynamic performance of a dual-floater hybrid system combining a floating breakwater and an oscillating-buoy type wave energy converter. Appl. Energy 2020, 259, 114212. [Google Scholar] [CrossRef]
  21. Zhang, H.; Zhou, B.; Vogel, C. Hydrodynamic performance of a floating breakwater as an oscillating-buoy type wave energy converter. Appl. Energy 2020, 257, 113996. [Google Scholar] [CrossRef]
  22. Howe, D.; Nader, J.R.; Macfarlane, G. Performance analysis of a floating breakwater integrated with multiple oscillating water column wave energy converters in regular and irregular seas. Appl. Ocean Res. 2020, 99, 102147. [Google Scholar] [CrossRef]
  23. Lin, P. Numerical Modeling of Water Waves; CRC Press: Boca Raton, FL, USA, 2008. [Google Scholar]
  24. Jin, J. A Mixed Mode Function-Boundary Element Method for Very Large Floating Structure-Water Interaction Systems Excited by Airplane Landing Impacts. Ph.D. Thesis, University of Southampton, Southampton, UK, October 2007. [Google Scholar]
  25. Goda, Y. A comparative review on the functional forms of directional wave spectrum. Coastal Engineering Journal 1999, 41, 1–20. [Google Scholar] [CrossRef]
  26. Wang, T.T.; Liu, Z.Q. Numerical simulation of double floating tank double water flat floating breakwater. Port Waterw. Eng. 2016, 3, 46–50. [Google Scholar]
  27. Hou, Y. Experimental Study on Hydrodynamic Characteristics of Single Square Box Anchor Chain Floating Breakwater; Dalian University of Technology: Dalian, China, 2008. [Google Scholar]
  28. Liu, X.M. Experimental Study on Physical Model of Porous Floating Breakwater; Dalian Ocean University: Dalian, China, 2019. [Google Scholar]
  29. Wang, P. Experimental Study on Hydrodynamic Characteristics of Multifunctional Oscillating Water Column Device with Horizontal Bottom Plate; Zhejiang University: Hangzhou, China, 2019. [Google Scholar]
Figure 1. OWC floating breakwater model mesh division.
Sustainability 15 11427 g001
Figure 2. Irregular wave simulation results.
Sustainability 15 11427 g002
Figure 3. Schematic diagram of double floating box double plate floating breakwater.
Sustainability 15 11427 g003
Figure 4. Verification of motion response amplitude.
Sustainability 15 11427 g004
Figure 5. Schematic diagram of mooring floating breakwater.
Sustainability 15 11427 g005
Figure 6. Verification of moored floating breakwater.
Sustainability 15 11427 g006
Figure 7. Schematic diagram of the porous floating breakwater.
Sustainability 15 11427 g007
Figure 8. Verification of porous floating breakwater.
Sustainability 15 11427 g008
Figure 9. Schematic diagram of the oscillating water column device with a horizontal bottom plate.
Sustainability 15 11427 g009
Figure 10. Regular wave simulation results.
Sustainability 15 11427 g010
Figure 11. Schematic diagram of superstructure model.
Sustainability 15 11427 g011
Figure 12. Schematic diagram of mooring structure model.
Sustainability 15 11427 g012
Figure 13. Dimension drawing of the upper structure (Unit: m).
Sustainability 15 11427 g013
Figure 14. Transmission coefficient of floating breakwaters with different structures.
Sustainability 15 11427 g014aSustainability 15 11427 g014b
Figure 15. Transmission coefficient of different spacing.
Sustainability 15 11427 g015aSustainability 15 11427 g015b
Figure 16. Transmission coefficient of different water depths.
Sustainability 15 11427 g016
Figure 17. Transmission coefficient of different wave incidence angles.
Sustainability 15 11427 g017
Figure 18. Transmission coefficients of different significant wave heights.
Sustainability 15 11427 g018
Table 1. Comparisons of the Kt of the moored floating breakwater between target result and present.
W/LTarget ResultPresentErrorAverage Error
0.110.9900.9950.52%1.69%
0.120.9830.9860.35%
0.140.9370.9280.87%
0.180.8580.8461.22%
0.240.6430.6783.50%
0.300.5630.6003.67%
Table 2. Comparisons of the Kt of the irregular wave simulation results and target result.
W/LTarget ResultPresentErrorAverage Error
0.220.8330.8814.78%3.69%
0.270.8150.8513.62%
0.340.6540.6832.89%
0.470.4370.4023.47%
Table 3. Comparisons of the Kt of the OWC breakwater between target result and present.
W/LTarget ResultPresentErrorAverage Error
0.080.8270.8141.33%2.08%
0.090.7900.8011.11%
0.100.7040.7484.42%
0.110.6970.6861.11%
0.120.6160.5714.42%
0.140.5160.4942.21%
0.150.4570.4243.31%
0.170.3860.3910.44%
0.180.3110.3001.11%
0.210.2540.2163.76%
0.240.1970.2030.66%
0.270.1860.1751.11%
Table 4. Calculation conditions.
ParameterSymbolContent
Water depthh18 m, 25 m, 36 m
Significant wave heightHS1 m, 3 m, 5 m
Spacingd6 m, 8 m, 10 m, 12 m
PeriodT3.69 s, 4.49 s, 5.28 s, 6.08 s, 6.89 s, 7.69 s
Incident wave angleθ0°, 30°, 45°, 60°
Table 5. Schematic diagram of superstructure model of floating embankment.
ModelTypeSketch Map
Model Adual-boxSustainability 15 11427 i001
Model Bcombination of OWC-box and standard boxSustainability 15 11427 i002
Model Ccombination of standard box and perforated boxSustainability 15 11427 i003
Model Dcombination of OWC-box and perforated boxSustainability 15 11427 i004
Disclaimer/Publisher’s Note: The statements, opinions and data contained in all publications are solely those of the individual author(s) and contributor(s) and not of MDPI and/or the editor(s). MDPI and/or the editor(s) disclaim responsibility for any injury to people or property resulting from any ideas, methods, instructions or products referred to in the content.