Abstract
Coal bottom ash (CBA) is a by-product generated in the coal furnaces of thermal power plants. It has adverse effects on the environment and requires additional landfill storage. However, the physical appearance of CBA is similar to that of sand, with particle sizes ranging from fine to coarse aggregates. Hence, many previous studies have focused on its application instead of sand for conventional concrete and structural fill materials considering natural sand depletion. Roller compacted concrete (RCC) is a zero-slump concrete with better compressive strength than conventional concrete because of the aggregate interlock achieved due to the compactness. It uses a low cement content but requires a large amount of sand. However, the applicability of CBA to RCC is limited. The properties of CBA may vary depending on the location. Therefore, this study aims to evaluate the effect of CBA as a sand replacement in RCC in terms of strength and long-term performance by conducting an empirical experiment under given conditions. Initially, a comprehensive literature review of various concrete strengths using CBA as sand replacement is provided. Thereafter, details related to the experiments on the strength and durability of the given CBA are presented. The results show that the RCC strength improves when CBA increases owing to the good gradation and low percentage of calcium oxide. Furthermore, the samples displayed acceptable freeze–thaw resistance values, but the scaling resistance values were small, owing to the high-water absorption. Therefore, CBA can be used in RCC as sand for improved structural performance, while additional research should be conducted to improve its long-term performance.
1. Introduction
Land, energy, and water are among the most treasurable assets of mankind that contribute to climate change, depending on their utilization methods and extensiveness of exploration [1]. Excessive use of these valuable assets without considering the well-being of the natural environment would harm future generations. After realizing the serious consequences of poor resource management in recent years, the United Nations General Assembly (UNGA) adopted sustainable development goals (SDGs) in 2015. It established a framework for global collaboration to achieve a sustainable future [1]. The construction industry, being one of the oldest, continues to play a vital role in human development and is also responsible for contributing to this agenda. This industry is the least sustainable globally as it consumes approximately half of the non-renewable resources [2]. Natural materials such as river sand and crushed fine stone are generally used in concrete as sand. However, there has been an expansion in global urban infrastructure development and a growing demand for environmental protection, particularly in developed countries such as South Korea. The availability of natural resources is diminishing rapidly. In South Korea, the production of sand and gravel was reported to be 661,000 metric tons in 2015, according to the United States Geological Survey [3]. This massive production has a significant detrimental effect on the environment. Therefore, it would be more beneficial, both economically and environmentally, if industrial waste could be used to partially or completely replace river sand in concrete without compromising the quality of the concrete [4].
For decades, coal has been the most used fuel in thermal power plants to generate electricity. Raw coal was pulverized to the consistency of flour in coal-fired thermal power plants before being force-fed into a furnace. Clay particles entrapped in coal cracks were separated from the coal during the pulverization process. These clay particles and other non-combustible matter were then produced during the combustion of coal in the furnace, resulting in the production of coal ash. The coal ash content depends on the non-combustible matter present in the coal. The rock detritus that fills the fissures of coal separates from the coal during pulverization. In the furnace, carbon and other combustible matter burn, whereas non-combustible matter results in coal ash. The swirling air carries ash particles out of the hot zone, where it cools. The flue gases extract finer and lighter ash particles from the flue gases. Coal ash produced by electrostatic precipitators is known as fly ash (FA). This accounts for approximately 80 percent of the whole coal ash. Coarser and heavier ash particles settle at the base of the furnace. Some ash particles also settle on the furnace walls and steam pipes. The formed clinkers accumulate and drop to the furnace base when they become too heavy. Before being sluiced at the disposal site, the clinkers were ground to the consistency of the fine aggregate. The ash collected at the base of the furnace is known as coal bottom ash (CBA), which accounts for nearly 20% of the total coal ash. Although a large amount of fly ash has already been used in the construction industry as a partial cement replacement and/or mineral additive in cement production, the use of CBA is limited because of its relatively high unburned carbon content and different structural properties compared to fly ash [5]. CBA contains coarser and more fused particles than FA, and thus, it has less pozzolanic activity. CBA is generally regarded as an inert material unsuitable for use as a supplementary cementing material. Because the particle size distribution of CBA is similar to that of sand, it has the potential to be used as a sand replacement in various civil engineering applications. CBA is commonly used as a low-cost substitute base material in road construction or blasting grit. According to the American Coal Ash Association (ACCA), the recycling rate of fly ash in concrete and concrete products is 47%, while the recycling rate of CBA is only 5.28% of the total recycling amount, with a total CBA production of around 19.8 million tonnes in 2002. Only 7.6 million tonnes of the output were recycled, with the majority going into structural fill/embankments (26.61%), mining applications (10.43%), and road base/subbase/pavement (19.15%). The same utilization profiles can be provided for the European Commission (EU). Nearly 89% of the produced CBA was recycled, but only 54% was evaluated for reclamation and restoration [6]. Moreover, the physical appearance of CBA is comparable to that of natural river sand, with particle sizes ranging from fine sand to gravel, as shown in Figure 1. The grading of CBA requires researchers to investigate its use as a substitute for sand in concrete production. To date, published research reports have shown promising results for the use of CBA as a partial or total substitute material for sand in concrete production. Triches et al. (2006) [7] indicated that adding CBA to roller compacted concrete (RCC) mixtures may result in low cement content as well as less demand for sand, and the results showed an increase in compressive and flexural strength levels of mixtures with high levels of sand replaced by CBA in a mix with less cement. A cost-benefit analysis revealed that this mixture was beneficial. Cheriaf et al. (1999) [8] observed that the strength activity index values of low-calcium (0.8%) CBA with ordinary Portland cement increased at all curing ages of hydration. At 28 d of hydration, they noticed the formation of calcium-silicate hydrate (CSH) gel and needles because of the reaction of CBA with portlandite. Shi and Sun (2008) [9] discovered that at the same W/C ratio, the mechanical properties of concrete indicated that the compressive strength of CBA concrete decreased with increasing CBA content at all ages. This may be the result of the high initial free water content used in the mixes, which resulted in bleeding and weaker interfacial bonding between the aggregate and cement paste. Siddique (2003) [10] reported that the mechanical properties increased due to the replacement of sand with CBA, which is attributed to the pozzolanic action of CBA. This occurred because coal ash type F (CBA) reacts slowly with calcium hydroxide Ca(OH)2 released during cement hydration and does not contribute significantly to the densification of the concrete matrix at early ages, according to ASTM C618 [11]. In addition, the interfacial bond between the paste and aggregates was strengthened. Ghafoori et al. (1997) [12] investigated a series of laboratory-made roller-compacted concrete (RCC) with high-calcium dry CBA as a sand concrete specimen with six different proportions (cement content of 188–337 kg/m3 and coarse aggregate content of 1042–1349 kg/m3) that were prepared and fabricated according to ASTM C1170 Procedure A at their optimum moisture content. The compression, splitting tension, drying shrinkage, abrasion resistance, and rapid freezing and thawing were tested. They concluded that compacted concrete containing CBA achieved good strength, stiffness, drying shrinkage, and abrasion resistance, as well as repeated freezing and thawing cycles. Bakoshi et al. (1998) [13] used bottom ash in the amount of 10–40% as a replacement for fine aggregate. Test results indicate that the compressive strength and tensile strength of bottom ash concrete generally increase in the replacement ratio of fine aggregate and curing age. The freezing–thawing resistance of concrete using bottom ash is lower than that of ordinary concrete is higher than that of ordinary concrete. Other investigations were conducted by Ghafoori and Cai (1998b) [14]. When subjected to 300 rapid freezing and thawing cycles, RCC made with 100% high-calcium (22.5%) CBA as sand exhibited 2.3% mass loss and a 91.2% durability factor. The cumulative mass loss of this concrete decreased by 57 and 67% when the cement content increased from 9 to 12 and 15%, respectively. Similarly, the durability factor increased by 21 and 20%, respectively. Furthermore, with an increase in the coarse aggregate quantity in concrete from 50 to 60% and 55 to 60%, the cumulative mass loss decreased by 38 and 25%, respectively.
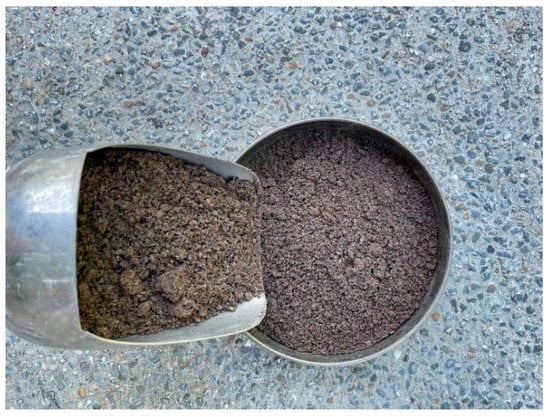
Figure 1.
Coal bottom ash from thermal power plants in Donghae, South Korea.
This study aimed to evaluate the mechanical properties and durability of roller-compacted concrete (RCC) containing CBA as a sand replacement. In this study, the mechanical and durability aspects of RCC, such as compressive and flexural strengths, freeze–thaw resistance, and scaling resistance, were investigated by comparing the effects of standard RCC and RCC with CBA in the laboratory.
2. Literature Review of the Strength Characteristics of Concrete with CBA
2.1. General Concept of Concrete Strength Using CBA
The development of concrete strength is affected by several factors. The hydrated paste porosity is controlled by the water–cement ratio and the bond cracks present at the interface of the aggregate and hydrated paste. The strength of the individual constituent materials also influences the strength of concrete. Upon incorporation of CBA as a partial replacement for sand, the volume of all pores in concrete is increased owing to the absorption ratio of CBA being higher than that of sand. Thus, the requirement for mixing water to obtain the desired workability of concrete increases with the inclusion of CBA. This phenomenon causes a weak microstructure in concrete; therefore, the inclusion of CBA as a sand replacement leads to a decrease in the strength of concrete. However, with time, the pozzolanic activity of CBA starts, and pores are filled with extra calcium silicate hydrate (CSH) gel formed because of the reaction of CBA with calcium hydroxide. In general, it was shown that a low percentage of calcium oxide (CaO) in the CBA material showed a large pozzolanic effect on long-term strength. Furthermore, aggregate gradation determines the void within the structure of the aggregate and, consequently, the amount of cement paste required to fill the void space and ensure workable concrete. The optimization of the aggregate gradation incorporation of CBA also improves the mechanical and durability properties of concrete. Additionally, proper aggregate gradation not only ensures a workable concrete mixture that can be compacted easily but also reduces problems associated with plastic concrete, such as the potential for segregation, loss of entrained air, and plastic shrinkage cracking. In addition, most of the concrete used in the construction of transportation infrastructure is often vibrated or compacted to achieve good compaction.
2.2. Material Aspect
2.2.1. Physical Properties of CBA
CBA has been observed in the laboratory as a dark gray material with most angular particles in shape. Coal bottom ash was transformed into a porous material with a rough surface texture and lower unit weight [15]. The size of CBA affects the mechanical and durability properties of concrete as different thermal power stations produce CBA with varying properties. The CBA grain size distribution had an indirect effect on the overall performance. Over the last decade, CBA has been successfully replaced with sand in the manufacturing of concrete owing to its similar particle size distribution. According to previous research, the particle size distribution of CBA varies according to the combustible source and combustion rate, which affects its overall performance. In general, the grain size of the CBA particles is similar to that of sand with a low percentage of silt clay. Compared to sand, the CBA contained a higher percentage of fine sand and a lower percentage of medium to coarse sand [16]. Furthermore, other properties of CBA, such as the percentage of water absorption, specific gravity, and fineness modulus, have produced a wide range of results in various studies. Table 1 lists the specifications of the parameters. The specific gravity of CBA ranges from 1.39 to 2.97 and varies depending on the source [17]. The water absorption values of CBA varied across most studies. In general, CBA had significantly higher water absorption values than those of natural sand. The observed property variation was most likely caused by changes in factors such as combustible nature, combustion time, and fuel used.

Table 1.
Physical properties of bottom ash reported by various authors.
2.2.2. Chemical Properties of CBA
Table 2 summarizes the chemical compositions of CBA reported by researchers from various continents. The chemical composition of CBA varies depending on the origin of the coal and the incineration method. Chemical analysis results demonstrated that CBA was primarily composed of silica and alumina. Earlier studies have reported changes in the chemical composition of CBA. According to Table 2, CBA generally resembles “Class F” materials (standard specification for FA and raw or calcined natural pozzolan for use in concrete) because the total composition of pozzolanic compounds exceeds 70%, as described in ASTM C618-15 [11]. Furthermore, the presence of a small amount of low-reactive lime (approximately 7%), along with additional pozzolanic properties, confirms that it belongs to “Class F” materials. Table 2 shows that the loss on ignition for CBA is less than 8%, which is under ASTM C618 (for Class F materials), out of the total composition. It was discovered that the presence of unburned carbon in CBA improved the overall performance of the concrete [17].

Table 2.
Chemical properties of bottom ash reported by various authors.
2.3. Gradation Effects in Concrete
The gradation of aggregates plays a major role in determining durability, porosity, workability, cement and water requirements, strength, and shrinkage. Therefore, gradation is a primary concern in plain cement concrete (PCC) mix design. Moreover, aggregates are sometimes analyzed using the combined grading of fine and coarse aggregates that exist in a concrete mixture. This provides a more thorough analysis of the performance of aggregates in concrete. Concrete mixtures produced with well-graded aggregate combinations tend to reduce the need for water, provide and maintain adequate workability, require minimal finishing, and consolidate without segregation. A well-graded aggregate combination was defined as a 0.45 power curve. When the combined gradation is close to the maximum power curve, it is possible to produce the maximum density that leads to an increase in the concrete strength at an early age [26,27]. Triches et al. (2006) [7] discovered that the compressive strength of combined CBA as sand at an early age was slightly higher than that of control RCC. This phenomenon was due to the gradation effect of CBA in RCC, as shown in Table 3.

Table 3.
Compressive strength of CBA reported by various authors.
2.4. Pozzolanic Effects of CBA in Concrete
The pozzolanic activity of a material is its ability to react with calcium hydroxide, as observed by Thomas (2013) [28]. According to Massazza (1998) [29], the total quantity of calcium hydroxide with which pozzolanic material can combine depends on the nature and content of the reactive phase in the pozzolan, SiO2 content of reactive phases, the ratio of calcium hydroxide and pozzolanic, and the curing duration. The rate of reaction of the pozzolanic material with calcium hydroxide depends on the specific surface area of the pozzolan, water/solid ratio, alkaline content in Portland cement, and temperature. Pozzolanic materials are generally high in SiO2 and Al2O3 and low in CaO, with or without reactivity, when immersed in water. J.Chai and C.Raungrut (2003) [30] indicated that bottom ash has a high potential to develop to be a good pozzolanic material. Triches et al. (2006) [7] showed that when using a low percentage of CaO (0.8%) of CBA in RCC, the compressive strength increases with increasing curing age. Furthermore, the strength is gradually improved, and calcium hydroxide consumption compared to that of an inert filler is important after 90 d of curing. Cheriaf et al. (1999) [8] observed that strength activity index values of low calcium (0.8%) CBA with ordinary Portland cement increased from 0.72 at 7 d to 0.76 at 14 d, 0.88 at 28 d, and 0.97 at 90 d of hydration. This particular ash, with a very low CaO content (0.8%), is similar to Class F fly ash. Malkit and Rafat (2014) [18] reported that the replacement of CBA with sand decreases the compressive strength for up to 28 d of curing, whereas comparable figures have been noticed for a higher curing period (up to 365 d of curing) in comparison with the control concrete strength. This clearly shows that the effect of long-term strength increased owing to the pozzolanic effect in type F CBA. Moreover, Rafat (2003) [10] reported that the strength of all mixes continues to increase with an increase in the curing age. This increase in strength owing to the replacement of sand with CBA is attributed to the pozzolanic action of CBA. At an early age, CBA reacts slowly with calcium hydroxide liberated during the hydration of cement and does not contribute significantly to the densification of the concrete matrix. With time, 90 d for the case with higher replacement of CBA as sand in concrete, the strength continued to increase owing to the pozzolanic effect of the CBA material in concrete. Table 3 lists the compressive strength results of CBA reported by various authors. The chemical composition of CBA is reported in Table 2.
2.5. General Concept of Strength Development in PCC and RCC
As previously discussed, some factors such as gradation, concrete hydration, and the pozzolanic effect influence the general concrete strength. The strength of concrete is also affected by the strength of the mixture and that of the individual constituent materials. Thus, the primary distinction between RCC and conventional concrete mixtures should be defined. RCC is named after the construction method used to build it. It is made using conventional or high-density asphalt paving equipment and compacted with rollers. RCC contains the same basic ingredients as traditional concrete: cement, water, and aggregates, such as gravel or crushed stone. However, unlike traditional concrete, it is a drier mix that is sufficiently stiff to be compacted by vibratory rollers. RCC are typically constructed without joints. They do not require any forms or finishing and do not contain any dowels or steel reinforcement. Unlike conventional concrete, as shown in Figure 2, RCC can benefit from both compaction and hydration. When this concrete is compacted to the required density, the friction between the particles increases, which provides the initial load-carrying capacity at an early age compared with PCC. As shown in Figure 3, well-compacted and high-density RCC can significantly improve the aggregate interlocking and remove superfluous air. Consequently, RCC can provide early traffic access when used in pavement construction. The paste hardens during the hydration process, binds the aggregate together, and provides the remaining strength. With these mechanical and chemical processes, dense pavements with properties similar to those of conventional concrete pavements can be achieved [31]. Based on this, using by-products such as CBA in RCC is a good alternative for pavement construction.
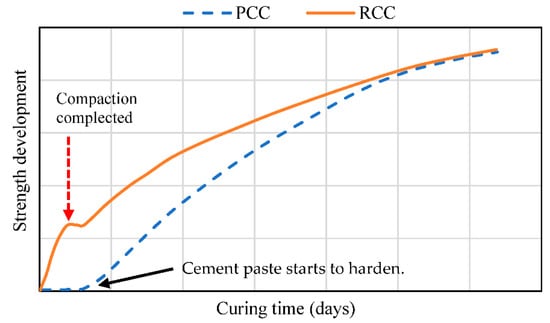
Figure 2.
Strength development of PCC and RCC over the first few days.
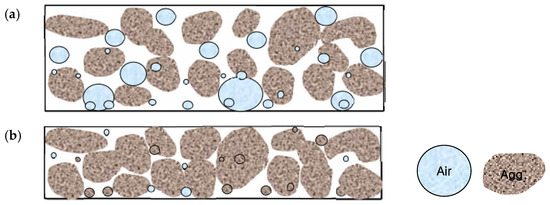
Figure 3.
Characteristics of RCC (a) before compaction and (b) after compaction.
3. Effect of Type F CBA in RCC
A previous investigation revealed that CBA has a high potential for use as a sand replacement in the production of concrete. However, when CBA was employed instead of sand, several different characteristics regarding the strength of the concrete were observed. In a few instances, the strength of CBA concrete at an early age demonstrated a more favorable tendency compared with the control mixture. In addition, the strength continued to increase with the curing process over time. This potential may be influenced by the different types of coal used, such as anthracite (hard coal), bituminous coal, sub-bituminous coal, and lignite, as well as the thermal power plant system, which can produce different CBA characteristics. Additionally, it clearly shows that, in the case of good gradation and a low percentage of calcium oxide in CBA, the possibility of achieving a higher concrete strength is high. However, there are limitations to the study of CBA incorporation into RCC. In this section, an empirical experiment is conducted to investigate the effect of class F CBA in RCC. This study investigated a set of tests on the mechanical and durability properties of RCC incorporating CBA as a partial or total replacement for sand.
3.1. Material Characteristics
Ordinary Portland cement, which was applied to all concrete specimens in this study, had a density of 3.15 g/cm3 and a specific surface area of 3260 cm2/g, and its other properties satisfied the ASTM type I standards [32]. Sand samples were collected from Jumunjin, northeastern Gangneng City, South Korea. The sand used in this study was in accordance with the specifications of ASTM C778-13 [33] and graded according to ASTM C33/C33M-13 [34]. The results for the water absorption and specific gravity of this river sand are presented in Table 4. CBA was obtained from the Donghae thermal power plant (Donghae City, South Korea), which uses a circulation fluidized bed combustion boiler system, and the primary fuel used to power the plant is anthracite (hard coal) and sub-bituminous coal. The particle size distributions of CBA and river sand are shown in Figure 4. CBA was graded according to ASTM C33/C33M-13 [34]. In this study, CBA was sieved through a 4.75 mm sieve before use as a replacement for sand. The chemical properties of CBA are presented in Table 5. The chemical properties of CBA used in this study conformed to class F as per ASTM C-618-03 [11] and are mostly composed of silica, iron, and alumina with a small amount of sulfate, magnesium, calcium, etc. The sum of the percentages of SiO2, Al2O3, and Fe2O3 present in the CBA was 92.28%. The physical properties of CBA are listed in Table 4. Figure 5 shows the field emission scanning electron microscope (FESEM) image of the CBA. The FESEM image shows that CBA has irregular and spherical shapes, porous particles, and complicated texture. Crushed stone aggregate was obtained from the Tanyang quarry in a local area in Gangneng-si City. The physical properties of the coarse aggregates are presented in Table 4. The maximum nominal size of the coarse aggregate was 25 mm. A commercially available dry-cast superplasticizer (PNS) was used in all the mixes.

Table 4.
Physical properties of CBA, river sand, and coarse aggregate.
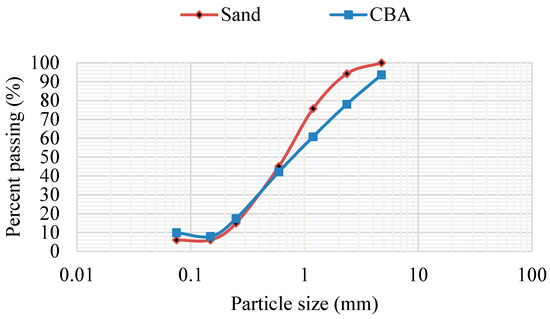
Figure 4.
Grading curve of sand and CBA.

Table 5.
Chemical composition of CBA.
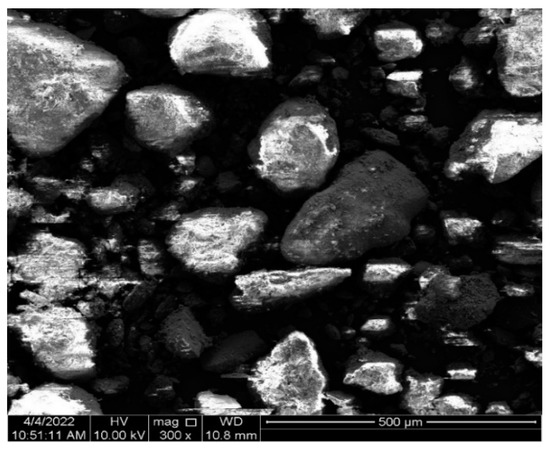
Figure 5.
FESEM image of CBA from thermal power plants in Donghae, South Korea.
3.2. Experimental Analysis Program
Mix Proportions
Initially, a control RCC mixture was prepared with varying percentages of CBA as the fine aggregate. In an RCC mixture with a fixed water–cement ratio (w/c) of 0.72 and the same consistency, the water in the mixture was controlled in all cases using a PNS to achieve the desired target consistency (Vebe time). The mixture was denoted as concrete RCC-A. The mixtures were designed according to the guidelines given in the American Concrete Standard ACI 211.1-91 [35] with the same sand–aggregate ratio of 0.5. Saturated surface dry (SSD) CBA, river sand, and coarse aggregate were added to all concrete mixtures in this study. The RCC mixture was replaced with CBA at 25, 50, and 100% levels. The proportions of the concrete mixtures are listed in Table 6.

Table 6.
Mix proportions.
- Combination Gradation
As explained previously, aggregate gradation affects the durability, porosity, workability, cement, and water requirements, strength, and shrinkage of the material. In addition, aggregates are sometimes evaluated by combining the grading of fine and coarse aggregates as they occur in a concrete mixture. This provides a more in-depth examination of the performance of the aggregate in concrete. Furthermore, CBA from different types of thermal power plant systems, as well as the mixed coal used to generate thermal power plants, such as anthracite (hard coal), bituminous coal, sub-bituminous coal, and lignite, may influence CBA performance, resulting in different aggregate gradations. Therefore, selecting the correct material, such as CBA, is essential for people who are responsible for examining the aggregate gradation to determine whether CBA is appropriate for usage. In a study conducted by Triches et al. (2006) [7] and Figure 6 from our study, the results showed the opposite trend, which could be attributed to the different sources of CBA used for the examination of the concrete mixture. Furthermore, as shown in Figure 6, in the case of good gradation, the mixture gradation containing 100% CBA (M-100%) from the Donghae thermal power plant was the closest to the maximum densification curve (0.45 power curve), whereas the mixture containing 100% sand (M-0%) was far from the power curve. This trend could lead to a high density of concrete in the mixture, resulting in a greater concrete strength at an early age.

Figure 6.
Combination gradation curves for composite aggregates.
- Pozzolanic Materials of CBA
Pozzolanic materials have a high percentage of SiO2 and Al2O3 but a relatively low percentage of CaO. According to Table 5, the CBA, which was derived from Donghae thermal power plants in Donghae City, South Korea, fulfilled all the requirements for a strong pozzolanic impact in the CBA material.
3.3. Consistency
The key parameter for defining RCC constructability is consistency (Vebe time). Freshly mixed concrete was packed into a cone similar to that used for the slump test. After the cone was lifted off the concrete, it was placed in a special container on a platform that vibrated at a constant rate. The time required to compact the concrete was measured. The Vebe time test provides useful results for stiff concretes. The consistency of the freshly mixed concrete was measured using a Vebe consistometer, following ASTM C1170 [36], as shown in Figure 7. As listed in Table 7, many researchers have proposed a possible Vebe time range for the construction of roller-compacted concrete.
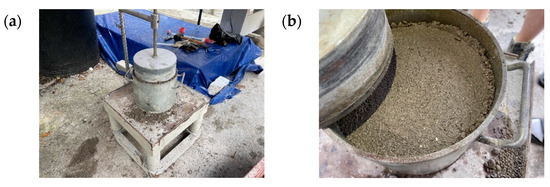
Figure 7.
Testing method: (a) vibrating table test and (b) mortar ring.

Table 7.
Vebe time range suggested by various authors.
The results of previous studies are summarized in Table 7, which displays a suitable range for the Vebe time. In this investigation, the Vebe times of all mixtures were between 45 and 50 s.
3.4. Compressive Strength
RCC cylindrical specimens of size 15 × 30 cm were prepared by adhering to ASTM C1435, and C1176/C1176M standards were used to determine the compressive strength, as shown in Figure 8a. The specimens were demolded after 24 ± 1 h of adding water to the concrete mixture, and a wet mat cover was used to cure them at room temperature up to the specified age of the test. Casting and curing of the samples were performed under the specifications of BS EN 12390-02 [41]. The compressive strengths of the concrete specimens were measured according to the ASTM C 39/C 39M [42], as shown in Figure 8b. Three cylinders were used in each test. The compressive strengths of the control concrete and CBA concrete mixtures were calculated at 1, 3, 7, 28, and 56 d of curing by dividing the maximum load applied during the test by the cross-sectional area of the cylinder. The average of three values was recorded as the compressive strength of the concrete mixture. The compressive strength of each cylinder was within 10% of the average compressive strength measured in the test.
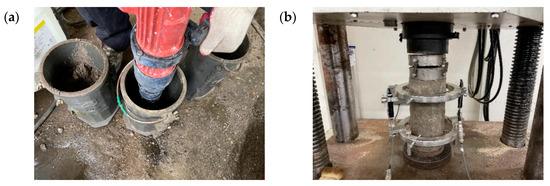
Figure 8.
Testing method: (a) vibrating hammer test and (b) compressive strength test.
The compressive strength test results are illustrated in Figure 9, which shows the variation in compressive strength with CBA percentage at different ages. From the test results, the compressive strengths of the RCC mixed with 25, 50, and 100% CBA were higher than those of the control mix (M-0%) at all ages. It was shown that the compressive strength of all mixes continued to increase with an increase in curing age. At the early ages from 1 to 7 d, the compressive strengths of the CBA concrete mixtures M-0% increased from 6.1 to 16.2 MPa, M-25% increased from 8.7 to 23.6 MPa, M-50% increased from 8.1 to 23 MPa, and M-100% increased from 10.4 to 26.5 MPa. Furthermore, at a curing age of 56 d, the compressive strength values with CBA contents of 0, 25, 50, and 100% were 107.6, 110.5, 115.67, and 104.6% of the corresponding values at a curing age of 28 d, respectively. The significant increase in the CBA compressive strength in the RCC mixture could be attributed to two possible factors: the gradation effect and the pozzolanic reaction in CBA. According to Figure 6, the combination gradation containing 100% CBA (M-100%) is the closest to the maximum densification curve (0.45 power curve), whereas the mixture containing 100% sand (M-0%) is far from the power curve that produces the maximum density of compaction in RCC mixtures. Trichês et al. (2006) [7] discovered similar gradation results when CBA was used as a replacement for sand in RCC mixes. Additionally, an early strength gain was evident from days 1 to 7. However, the long-term strength was much higher than the early strength, which appeared to be due to the pozzolanic effect that developed from 28 to 56 d. Abdulmatin et al. (2018) [43] and Cheriaf et al. (1999) [8] observed that the consumption of portlandite by the pozzolanic action of CBA between 28 and 90 d was significant. In addition, CSH and calcium aluminate hydrate (CAH) was formed; therefore, the porosity of the concrete matrix was filled with these materials, and Ca(OH)2 was transformed into CSH. Energy-dispersive spectrometry (EDS) analysis of the RCC mixtures showed a calcium silicate (Ca/Si) ratio of 3.7 for the control mixtures M-0%, 2.8 for M-25%, 1.26 for M-50%, and 0.22 for M-100%. A CSH gel with a low Ca/Si ratio (0.22) was formed in the RCC mixtures incorporating 100% CBA. The lower calcium silicate (Ca/Si) ratio of the CSH gel phase in CBA than sand in RCC mixtures demonstrates higher reactivity and thus displays higher strength compared to the control mixture [44]. Owing to these phenomena, the compressive strength of the concrete increased as the curing time increased.
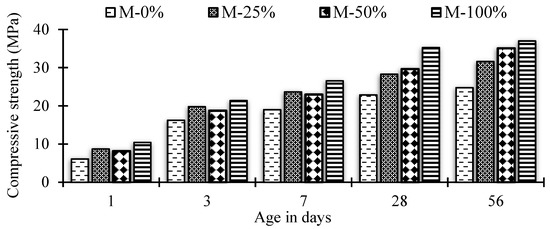
Figure 9.
Effect of coal bottom ash on compressive strength of RCC-A.
3.5. Flexural Strength
The flexural strength of the concrete was measured using prismatic beams with dimensions of 10 × 10 × 40 cm, as shown in Figure 10a. The curing method was identical to that for compressive strength. As shown in Figure 10b, the flexural strengths of the concrete specimens were measured according to ASTM C 293/C293M [45]. Three beam specimens were tested for each test. The results were recorded at 1, 3, 7, 28, and 56 d of curing. The process of recording the flexural strength was the same as that of recording the compressive strength.
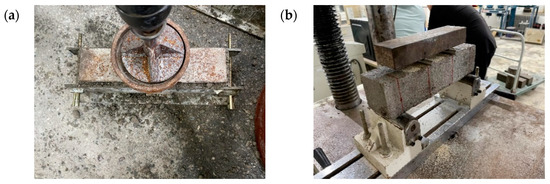
Figure 10.
Testing method: (a) vibrating hammer test and (b) flexural strength test.
The results of the flexural strength of the CBA with RCC mixtures are illustrated in Figure 11. Compared to the compressive strength, the flexural strengths of the RCC mixes with 25, 50, and 100% CBA were higher than those of the control mix (M-0%) at all curing ages. At 1 d age, RCC with CBA mixtures M-25%, M-50%, and M-100% gained flexural strengths of 2.09, 1.77, and 2.06 MPa, respectively. In addition, the flexural strength gained by the M-25%, M-50%, and M-100% mixtures were 113.81, 116.99, and 101.34%, respectively, after three days as compared to the 104.82% gain of the control mix M-0%. It is believed that early age may cause a better aggregate arrangement in the mixture with the CBA. As seen in Figure 11, the 28 d flexural strength of the control mix M-0% was 4.76 MPa, while those of the mixes M-25%, M-50%, and M-100% were 96.01, 96.22, and 111.34%, respectively. At 28 d of curing the RCC mixture with CBA, the flexural strengths of M-25% and M-50% were slightly lower than that of the control mix M-0%. However, at a curing period of 56 d, the flexural strengths of M-25%, M-50%, and M-100% were 107.62, 15.56, and 119.28%, respectively. This might be due to the large pozzolanic reaction and improved interfacial bonding between the paste and aggregate.
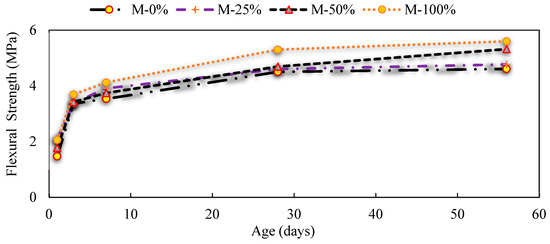
Figure 11.
Increase in flexural strength difference between sand and CBA in RCC.
3.6. Comparison of the Effects of CBA in RCC and PCC on Mechanical Properties
As noted previously, research on CBA incorporation into RCC is limited. However, to investigate the effect of CBA on RCC and PCC, a mixture has been proposed with the same approach by using similar cement ratios, s/a ratios, w/c ratios, and so on. Figure 12 shows a conceptual illustration of the strength development of conventional and RCC concrete mixtures by replacing sand with CBA in the early stages after casting or placement. Conventional concrete is in a plastic state immediately after these processes until hydration begins to harden the paste and bind the aggregate. However, RCC has a high strength development at an early age owing to the compaction process, which creates friction between the confined particles (aggregate interlock), as displayed in Figure 3. It is very useful for pavement construction because it allows the placement of a light vehicle on the RCC without damaging or disrupting the in-place material. Moreover, the strength of RCC measured in our study is significantly different compared with the general trend in the literature review, as shown in Figure 12, and it displays a significantly different curing time for long-term strength gain because, in previous studies, PCC used more cement than RCC. Furthermore, the strength of both the mechanical and flexural properties continued to increase with curing age owing to the pozzolanic activity of CBA, as explained above.
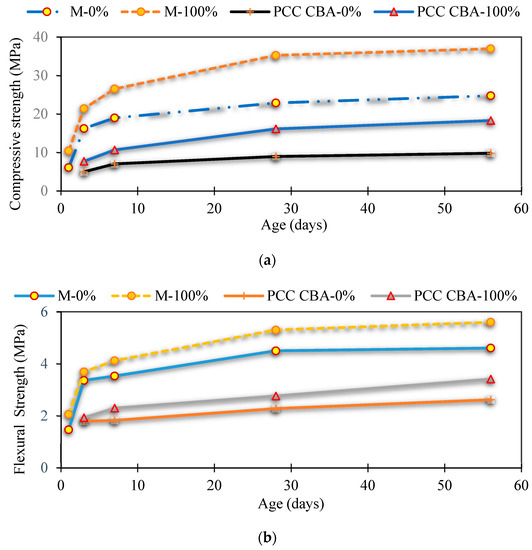
Figure 12.
Comparison of the use of CBA in RCC and PCC: (a) compressive strength and (b) flexural strength.
3.7. Freeze–Thaw Resistance
The freeze–thaw resistance of the RCC mixed with CBA specimens having the same size as the flexural strength specimens was measured in this experiment. A total of 12 specimens were used to assess the resistance of RCC containing CBA to repeated freezing-and-thawing cycles. Test samples were water-cured for 28 d prior to testing according to ASTM C666 [46]. Since an automatic cabinet was used, Procedure A [46] was followed, as shown in Figure 13a. Subsequently, the specimens were brought to room temperature to thaw, and the transverse frequency and mass were measured. The specimens were then placed in a water-filled container, as shown in Figure 13b, and the temperature of the water was automatically adjusted depending on the reading of a timer to complete each freeze–thaw cycle.

Figure 13.
Testing method: (a) freezing–thawing resistance measurement equipment and (b) specimens submerged in water.
RCC prisms were tested for freeze–thaw resistance according to ASTM C666 Procedure A [46], which requires exposing specimens to up to 300 freeze–thaw cycles. Figure 14 summarizes the observed data and presents the deterioration process with increasing rapid freeze–thaw cycles. According to Figure 14, it can be concluded that after 300 cycles, the responses of the different RCC mixes with 25, 50, and 100% CBA were identical. The relative dynamic modulus of elasticity (RDME) of all mixtures decreased slightly with an increase in the freeze–thaw cycles. After 150 cycles, the RDME of M-0%, M-25%, M-50%, and M-100% dropped by 10.65, 10.25, 17.96, and 15.61%, respectively, compared with the values at the start of the experiment. Moreover, after 300 cycles, at the end of the experiment, the RDME for M-0%, M-25%, M-50%, and M-100% dropped by 14, 12.75, 16.69, and 17.69%, respectively. However, all mixes achieved an RDME above the minimum 80% value, which is the criterion of durability in road construction specifications [47]. Thus, CBA incorporated with RCC can be used in cold weather conditions, such as in South Korea.

Figure 14.
Variation in relative dynamic modulus with number of freeze–thaw cycles.
3.8. Scaling Resistance
In this study, de-icing salt scaling was determined using three slabs measuring 10 × 30 × 30 cm in size, as shown in Figure 15a. An acrylic plate with a height of 20 mm was installed to distribute the test solution evenly at a specific level. Scaling resistance tests were performed according to ASTM C672 [48]. After 28 d of curing in the curing room, the sample was kept in the open air at 23 °C for 14 d. Furthermore, the specimens for deicing-salt testing were subjected to a minimum of 50 freeze–thaw cycles by alternatively placing them in a freezing environment (−18 ± 2 °C) and a thawing environment of approximately 18 °C. The test solution, calcium chloride (4 g per 100 mL of distilled water), was placed on the specimen, and the test was conducted on a cycle basis with one cycle consisting of freezing for 17 h and thawing for 7 h. The extent of surface scaling was assessed visually at regular intervals of five cycles, with visual ratings ranging between 0 and 5, as shown in Table 8. The variation in the mass of the scaled materials was also determined by removing the scaled materials at regular intervals using low-pressure water jetting and drying the scaled materials in an oven.
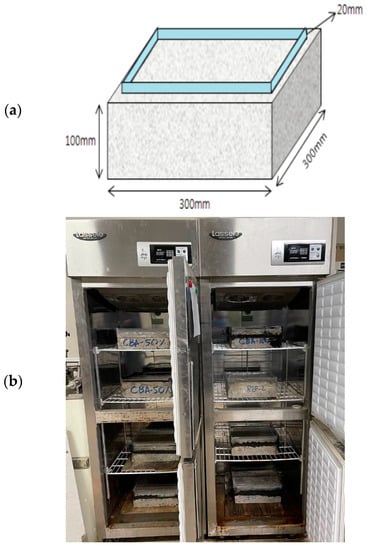
Figure 15.
Scaling test in progress (a) specimen model and (b) testing following the specimen type.

Table 8.
Rating of the surface condition according to the visual observation ASTM C672 [48].
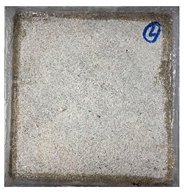
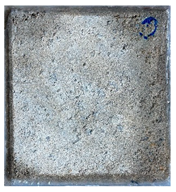
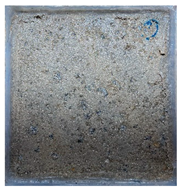
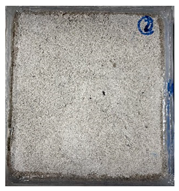
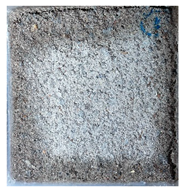
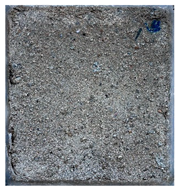
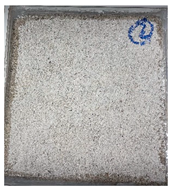
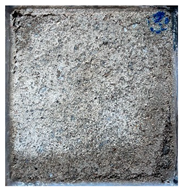
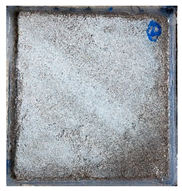
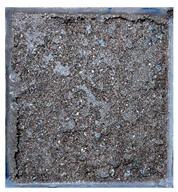
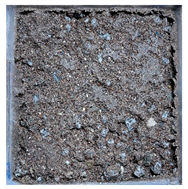
The results of RCC incorporation with the CBA surface after 50 cycles are shown in Table 9. The results of the analysis are based on the visual evaluation of ASTM C 672 on the surface of the specimen, where deterioration occurred owing to the de-icing agent. The RCC without CBA was found to undergo “slight to moderate scaling” on the surface after 50 cycles. However, the greater the replacement amount of CBA in the RCC mixture, the more deterioration occurred on the surface, which was verified by the exposure of coarse aggregate on visual inspection. Figure 16 clearly shows the weight reduction rate of RCC with different percentages of CBA during the de-icing scaling test. This poor scaling resistance performance might be due to the high-water absorption ratio of the CBA material, which was equal to 4.6%. To use CBA as a substitute in RCC mixtures, the durability performance should be considered by employing a minimum non-air-entrained agent or surface coating to prevent water infiltration through the surface. By contrast, countries without a winter season, such as Southeast Asia, may be able to use a combination of CBA and RCC.

Table 9.
Change in surface conditions due to scaling resistance.
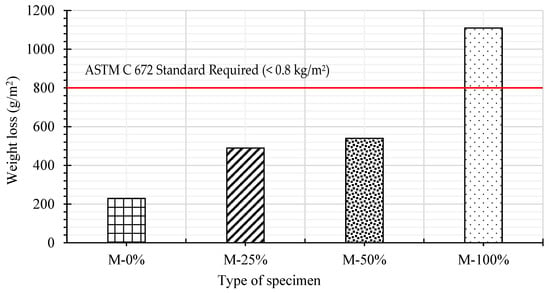
Figure 16.
Weight reduction rate of RCC mixture during de-icing salt scaling test based on ASTM C672.
4. Summary and Conclusions
This study examined various properties of RCC in which sand was replaced with CBA in various proportions. Therefore, owing to the limitations and lack of studies on RCC with CBA, the various properties of concrete with CBA have been reviewed. The performance of concrete prepared with CBA was evaluated based on the mechanical properties and long-term performance. Previous studies have shown that when concrete is mixed with CBA, the results indicate a better trend in concrete strength owing to a better aggregate arrangement and pozzolanic reaction with less CaO. However, the possibility of decreasing the strength can occur because of the weak CBA particles. Because the properties of CBAs may vary with different thermal power plants, only the CBA from the Donghae thermal power plant was evaluated in this study. The study can be summarized as follows:
- The CBA from the Donghae thermal power plant showed good gradation in comparison with the maximum densification curve (0.45 power curve). Furthermore, it had a low CaO content, which is advantageous for long-term strength because of the occurrence of pozzolanic reaction. These two factors are advantageous regarding strength gain;
- The mechanical properties of RCC at different ages mixed with 25, 50, and 100% CBA were higher than those of the control mixture for both early age and long-term strength. The results showed that the compressive strength at an early age of 1 to 7 d for M1 increased from 6.1 to 16.2 MPa, M2 increased from 8.7 to 23.6 MPa, M3 increased from 8.1 to 23 MPa, and M4 increased from 10.4 to 26.5 MPa. From 28 to 56 d, the strengths of these mixes increased more than that of the control mixture, possibly due to the large pozzolanic reaction and improved interfacial bonding between the paste and aggregate;
- By comparing the effects of CBA in RCC and PCC, it was discovered that RCC performs better because its strength is higher at an early age owing to the compaction process, which creates more friction between the confined particles (aggregate interlock);
- However, as a result of long-term durability, RDME achieved 14, 12.75, 16.69, and 17.69% of the freeze–thaw resistance at the end of the experiment (300 cycles). It was above the minimum 80% value, which is a criterion for durability in road construction. By contrast, the scaling resistance test showed that the surface of the specimen deteriorated because of the de-icing agent. This indicates an unsatisfactory performance. This poor scaling resistance performance might have occurred because of the low air-entraining agent (AEA) usage and the high-water absorption ratio of CBA (4.6%).
Although much research has been conducted on CBA’s properties when used as sand in concrete, more research is needed concerning its usage as sand in RCC. The CBA obtained from the Donghae thermal power plant with a circulating fluidized bed boiler system showed good performance. However, future studies should investigate other types of mixed coal from various thermal power plants to evaluate the CBA performance as a replacement of sand in RCC. Scaling resistance should be considered for durability, such as in surface coatings, to prevent water infiltration. Moreover, using an admixture to improve RCC incorporation into the CBA surface by preventing deterioration under freezing and thawing conditions should be considered. Both these options can improve RCC incorporation and CBA’s deterioration performance.
Author Contributions
Conceptualization, S.W.L. and Y.K.K.; methodology, N.S. and Y.K.K.; investigation, N.S., J.H.K. and K.S.K.; original draft preparation, Y.K.K.; writing—review and edition, S.W.L. and Y.K.K. All authors have read and agreed to the published version of the manuscript.
Funding
This research was supported by the Basic Science Research Program through the National Research Foundation of Korea (NRF), funded by the Ministry of Education (No. 2021R1A6A1A03044326).
Institutional Review Board Statement
Not applicable.
Informed Consent Statement
Not applicable.
Data Availability Statement
Some or all the data, models, or codes that support the findings of this study are available from the corresponding author upon reasonable request.
Acknowledgments
The authors would like to thank the members of the research team, NRF and MOE, for their guidance and support throughout the project.
Conflicts of Interest
The authors declare no conflict of interest.
References
- Gielen, D.; Boshell, F.; Saygin, D.; Bazilian, M.D.; Wagner, N.; Gorini, R. The role of renewable energy in the global energy transformation. Energy Strategy Rev. 2019, 24, 38–50. [Google Scholar] [CrossRef]
- Opoku, A. Biodiversity and the built environment: Implications for the sustainable development goals (SDGs). Resour. Conserv. Recycl. 2019, 141, 1–7. [Google Scholar] [CrossRef]
- United States Geological Survey. Available online: https://www.ceicdata.com/en/korea/mineral-and-metal-country-production-korea-mineral/nn-usgs-production-kr-stone-sand-and-gravel-sand-silica (accessed on 9 May 2023).
- Kassem, M.; Soliman, A.; El Naggar, H. Sustainable approach for recycling treated oil sand waste in concrete: Engineering properties and potential applications. J. Clean. Prod. 2018, 204, 50–59. [Google Scholar] [CrossRef]
- Manz, O.E. Worldwide production of coal ash and utilization in concrete and other products. Fuel 1997, 76, 691–696. [Google Scholar] [CrossRef]
- Barnes, I.; Sear, L. Ash Utilisation from Coal-Based Power Plants; Report No. COAL R274 DTI/PubURN-04/1915; UKQAA: Birminghem, UK, 2014. [Google Scholar]
- Trichês, G.; Pinto, R.C.A.; Silva, A.J.; Machado, T.T. Mechanical Properties of Roller Compacted Concrete with Bottom Ash for Sustainable Pavements Applications. In Airfield and Highway Pavement: Meeting Today’s Challenges with Emerging Technologies; American Society of Civil Engineers: Reston, VA, USA, 2006. [Google Scholar] [CrossRef]
- Cheriaf, M.; Rocha, J.; Péra, J. Pozzolanic properties of pulverized coal combustion bottom ash. Cem. Concr. Res. 1999, 29, 1387–1391. [Google Scholar] [CrossRef]
- Kou, S.-C.; Poon, C.-S. Properties of concrete prepared with crushed fine stone, furnace bottom ash and fine recycled aggregate as fine aggregates. Constr. Build. Mater. 2009, 23, 2877–2886. [Google Scholar] [CrossRef]
- Siddique, R. Effect of fine aggregate replacement with Class F fly ash on the mechanical properties of concrete. Cem. Concr. Res. 2003, 33, 539–547. [Google Scholar] [CrossRef]
- ASTM C618-15; Standard Specification for Coal Fly Ash and Raw or Calcined Natural Pozzolan for Use in Concrete. ASTM International: West Conshohocken, PA, USA, 2010; pp. 3–6.
- Ghafoori, N.; Cai, Y.; Ahmadi, B. Use of Dry Bottom Ash as a Fine Aggregate in Roller Compacted Concrete. ACI Spec. Publ. 1997, 171, 487–507. [Google Scholar] [CrossRef]
- Bakoshi, T.; Kohno, K.; Kawasaki, S.; Yamaji, N. Strength and durability of concrete using bottom ash as replacement for fine aggregate. ACI Spec. Publ. 1998, 179, 159–172. [Google Scholar]
- Ghafoori, N.; Cai, Y. Laboratory-made roller compacted concretes containing dry bottom ash: Part II–Long term durability. ACI Mater. J. 1998, 95, 244–251. [Google Scholar]
- Pasetto, M.; Baldo, N. Rutting resistance of stone mastic asphalts with steel slag and coal ash. In Sustainability, Eco-Efficiency and Conservation in Transportation Infrastructure Asset Management; Losa, M., Papagiannakis, T., Eds.; CRC Press, Taylor & Francis Group: London, UK, 2014; pp. 31–42. [Google Scholar]
- BS 882:1992; Specification for Aggregates from Natural Sources for Concrete. British Standard Institution: London, UK, 1992.
- Hannan, N.I.R.R.; Shahidan, S.; Ali, N.; Maarof, M.Z. A Comprehensive Review on the Properties of Coal Bottom Ash in Concrete as Sound Absorption Material. MATEC Web Conf. 2017, 103, 01005. [Google Scholar] [CrossRef]
- Singh, M.; Siddique, R. Compressive strength, drying shrinkage and chemical resistance of concrete incorporating coal bottom ash as partial or total replacement of sand. Constr. Build. Mater. 2014, 68, 39–48. [Google Scholar] [CrossRef]
- Jaleel, J.J.V.; Maya, T.M. Influence of metakaolin on concrete containing bottom ash as fine aggregate. Int. J. Res. Advent Technol. 2015, TASC-15, 41–46. [Google Scholar]
- Sharma, N.K.; Mitra, S.; Sehgal, V.; Mishra, S. An Assessment of physical properties of coal combustion residues w.r.to their utilization aspects. IJEP 2012, 2, 31–38. [Google Scholar]
- Rafieizonooz, M.; Mirza, J.; Salim, M.R.; Hussin, M.W.; Khankhaje, E. Investigation of coal bottom ash and fly ash in concrete as replacement for sand and cement. Constr. Build. Mater. 2016, 116, 15–24. [Google Scholar] [CrossRef]
- Kumar, D.; Kumar, R.; Abbass, M. Study the effect of coal bottom ash on partial replacement of fine aggregate in concrete with sugarcane molasses as an admixture. IJSRE 2016, 4, 5355–5362. [Google Scholar] [CrossRef]
- Singh, N.; Mithulraj, M.; Arya, S. Utilization of coal bottom ash in recycled concrete aggregates based self compacting concrete blended with metakaolin. Resour. Conserv. Recycl. 2019, 144, 240–251. [Google Scholar] [CrossRef]
- Baite, E.; Messan, A.; Hannawi, K.; Tsobnang, F.; Prince, W. Physical and transfer properties of mortar containing coal bottom ash aggregates from Tefereyre (Niger). Constr. Build. Mater. 2016, 125, 919–926. [Google Scholar] [CrossRef]
- Jamaluddin, N.; Hamzah, A.F.; Ibrahim, M.H.W.; Jaya, R.P.; Arshad, M.F.; Abidin, N.E.Z.; Dahalan, N.H. Fresh Properties and Flexural Strength of Self-Compacting Concrete Integrating Coal Bottom Ash. MATEC Web Conf. 2016, 47, 01010. [Google Scholar] [CrossRef]
- Kosmatka, S.H.; Kerkhoff, B.; Panarese, W.C. Aggregate for Concrete. In Design and Control of Concrete Mixtures; Portland Cement Association: Skokie, IL, USA, 2008. [Google Scholar]
- The Oklahoma Transportation. OHD L-52 Aggregate Proportioning Guide for Optimized Gradation Concrete Mix Designs; Oklahoma D.O.T.: Oklahoma City, OK, USA, 2006.
- Thomas, M. Supplementary Cementing Materials in Concrete; CRC Press: Boca Raton, FL, USA, 2013; p. 210. [Google Scholar] [CrossRef]
- Massazza, F. Pozzolana and pozzolanic cements. In Lea’s Chemistry of Cement and Concrete; Hewlett, P.C., Ed.; Butterworth-Heinemann: Burlington, MA, USA, 1998; pp. 471–631. [Google Scholar]
- Jaturapitakkul, C.; Cheerarot, R. Development of Bottom Ash as Pozzolanic material. J. Mater. Civ. Eng. 2003, 15, 48–53. [Google Scholar] [CrossRef]
- Harrington, D.; Abdo, F.; Adask, W.; Hazaree, C.V.; Ceylan, H. Guide for Roller-Compacted Concrete Pavements; National Concrete Pavement Technology Center Institute for Transportation Iowa State University: Ames, IA, USA, 2010. [Google Scholar]
- ASTM C150/C150M; Standard Specification for Portland Cement. ASTM International: West Conshohocken, PA, USA, 2011.
- ASTM C778-13; Standard Specification for Sand 65.198.187.10. American Society for Testing and Materials: West Conshohocken, PA, USA, 2014; pp. 1–3.
- ASTM C33/CC33M-13; Standard Specification for Concrete Aggregates. American Society for Testing and Materials: West Conshohocken, PA, USA, 2003; p. 11. [CrossRef]
- ACI 211.1-91; Standard Practice for Selecting Proportions for Normal, Heavyweight, and Mass Concrete. The American Concrete Institute (ACI): Detroit, MI, USA, 2002.
- ASTM C1170/C1170M; Standard Test Method for Determining Consistency and Density of Roller-Compacted Concrete Using a Vibrating Table. ASTM International: West Conshohocken, PA, USA, 2020.
- ACI Committee 325. ACI 325.10R-95 Report on Roller-Compacted Concrete Pavements; Federal Highway Administration: Washington, DC, USA, 2001.
- Jofre, C. The Use of Roller Compacted Concrete for Roads; Permanent International Association of Road Congresses: Paris, France, 1993. [Google Scholar]
- Marchand, J.; Gagne, R.; Ouellet, E.; Lepage, S. Mixture Proportioning of Roller Compacted Concrete-A Review. ACI Spec. Publ. 1997, 171, 457–486. [Google Scholar] [CrossRef]
- Chhorn, C.; Hong, S.J.; Lee, S.-W. A study on performance of roller-compacted concrete for pavement. Constr. Build. Mater. 2017, 153, 535–543. [Google Scholar] [CrossRef]
- BS EN 12390-02; Testing Hardened Concrete Curing. British Standard: London, UK, 2009; pp. 420–457.
- ASTM C39/C39M-01; Standard Test Method for Compressive Strength of Cylindrical Concrete Specimens. ASTM International: West Conshohocken, PA, USA, 2001; Volume 04.02.
- Abdulmatin, A.; Tangchirapat, W.; Jaturapitakkul, C. An investigation of bottom ash as a pozzolanic material. Constr. Build. Mater. 2018, 186, 155–162. [Google Scholar] [CrossRef]
- Singh, M.; Siddique, R. Properties of concrete containing high volumes of coal bottom ash as fine aggregate. J. Clean. Prod. 2015, 91, 269–278. [Google Scholar] [CrossRef]
- ASTM C293/C293M-10; Standard Test Method for Flexural Strength of Concrete (Using Simple Beam with Center-Point Loading). ASTM International: West Conshohocken, PA, USA, 2010.
- ASTM C666/C666M-03; Standard Test Method for Resistance of Concrete to Rapid Freezing and Thawing. Annual Book of ASTM Standards; American Society for Testing and Materials: Philadelphia, PA, USA, 2008.
- Kosmatka, S.H.; Kerkhoff, B.; Hooton, R.D.; McGrath, R.J. Design and Control of Concrete Mixtures: The Guide to Application, Methods and Materials, 8th ed.; Cement Association of Canada: Ottawa, ON, Canada, 2011. [Google Scholar]
- ASTM C672/C672M-12; Standard Test Method for Scaling Resistance of Concrete Surfaces Exposed to Deicing Chemicals. American Society for Testing and Materials: West Conshohocken, PA, USA, 2012.
Disclaimer/Publisher’s Note: The statements, opinions and data contained in all publications are solely those of the individual author(s) and contributor(s) and not of MDPI and/or the editor(s). MDPI and/or the editor(s) disclaim responsibility for any injury to people or property resulting from any ideas, methods, instructions or products referred to in the content. |
© 2023 by the authors. Licensee MDPI, Basel, Switzerland. This article is an open access article distributed under the terms and conditions of the Creative Commons Attribution (CC BY) license (https://creativecommons.org/licenses/by/4.0/).
