Article

Analysis of Spatial and Temporal Evolution of Regional Water Resources Carrying Capacity and Influencing Factors—Anhui Province as an Example

School of Economics and Management, Anhui University of Science and Technology, Huainan 232001, China
*
Author to whom correspondence should be addressed.
Sustainability 2023, 15(14), 11255; https://doi.org/10.3390/su151411255
Submission received: 27 April 2023 / Revised: 27 June 2023 / Accepted: 13 July 2023 / Published: 19 July 2023

Abstract

:
The study of water resources carrying capacity is a crucial aspect of water resources ecological security research. To account for the interplay between regional natural conditions and economic and social factors, a natural–economic–social–environmental evaluation index system is established within the framework of water resources. The comprehensive index of water resources carrying capacity in Anhui Province is then calculated using the entropy weight method and CRITIC model. Spatial kernel density and Dagum analysis are employed to analyze the results. The findings indicate that (1) the overall water resources carrying capacity of Anhui Province has exhibited an upward trend from 2003 to 2021, with the overall index of water resources carrying capacity increasing from 0.34 to 0.49. (2) The presence of water resources carrying capacity polarization in Anhui Province is evident, although this trend has been diminishing in recent years. (3) The Gini coefficient of water resources carrying capacity in Anhui Province first increases and then decreases, with the Gini coefficient between groups being more pronounced than the Gini coefficient within groups. (4) Geospatial factors play a significant role in shaping the future spatial distribution of water resources carrying capacity in Anhui Province. Additionally, the interaction of water resources carrying capacity among neighboring areas contributes to the reduction of differences between water resources carrying capacity in different regions in the future.

1. Introduction

Water resources, as a fundamental natural resource, play an indispensable role in supporting human survival and economic and social operations [1]. In recent years, due to climate change and population growth, water resources have been subjected to unprecedented pressure, resulting in water scarcity, ecological damage, pollution, and other issues that hinder economic and social development [2]. Currently, most regions in Central, Western, and Northern China are experiencing varying degrees of water scarcity, making it difficult to meet the needs of economic and social development [3,4]. Therefore, optimizing the rational allocation of water resources and enhancing the efficiency and carrying capacity of water resources utilization have become pressing issues that China urgently needs to address [5].
The notion of water resources carrying capacity was first introduced in the 1970s. The United Nations Educational, Scientific and Cultural Organization (UNESCO) and the Organization for Economic Cooperation and Development (OECD) conducted research on natural resources, including land, water, and forests, in some resource-scarce parts of the world to investigate their carrying capacity and sustainable development capacity. It was during this research that the concept of water resources carrying capacity was initially proposed [6]. As scholars worldwide delved deeper into the study of water resources carrying capacity, the concept and research methods have been significantly expanded.
At present, the concept of water resources carrying capacity is primarily divided into two types. The first type refers to the maximum support capacity of water resources for regional economic and social development [7], while the second type pertains to the overall coordination of economic, social, and environmental systems within the framework of water resources [8]. Despite their differences, both concepts indicate that the WRCC is influenced by numerous external factors. Therefore, while there are various methods for evaluating the water resources carrying capacity, the evaluation system essentially revolves around the water–economy–society system.
Regarding the former concept, the utilization of the water-footprint model by scholars is a common approach to studying the gains and losses of regional water resources. In a study conducted by Su et al., the ecological footprint model was employed to evaluate the temporal and spatial characteristics of the ecological footprint of water resources in Japan. The study revealed a declining trend in both traditional water accounts and water-pollution accounts [9]. Novoa et al. utilized the WFSblue and WFSgray models to examine the carrying capacity of agricultural water resources in the Cachapol River Basin in Chile. The study identified seasonal drought as a significant factor that limits the sustainability of water resources. In some cases, satellite remote-sensing technology is utilized by scholars to detect regional water quality and explore the key factors that influence water resources carrying capacity [10]. For instance, Zhang et al. studied the carrying capacity of agricultural water resources in Lancang County, Yunnan Province, using remote-sensing data [11]. Additionally, Eymen et al. conducted a study on the potential irrigated land in the Yamla Basin [12].
Regarding the latter concept, the majority of studies involve quantitative analysis and comprehensive evaluation of regional water resources carrying capacity through the construction of theoretical models and index systems. The research ideas can be summarized into three levels: (1) construction of the theoretical framework of water resources carrying capacity. The PSR model and DPSIR model are commonly used theoretical frameworks. Scholars have improved these models based on the characteristics of the study area, resulting in the formation of a series of new theoretical models. For instance, Yu et al. (2020) and Liu et al. utilized the DPSIRM model to construct a regional water resources carrying capacity model to evaluate the carrying capacity of water resources in Sichuan Province and the Yellow River Basin [13,14]. Wang et al. constructed an index-evaluation system based on the economic–social–environmental system under the framework of regional water resources [15]. (2) The selection of the weighting method for water resources carrying capacity is another important aspect. Currently, the application of weighted models is widespread and can be divided into subjective weighting and objective weighting. In recent years, most weighting methods for water resources carrying capacity have shifted from single weight to combined weight. For instance, Tang et al. and Jiang et al. utilized a combination of the analytic hierarchy process and entropy weight method, and a combination of subjective and objective indices was used for weighting [16,17]. (3) The evaluation method of water resources carrying capacity is also crucial. There are numerous evaluation methods for the comprehensive carrying capacity of water resources. Traditional evaluation methods, such as the coupling coordination degree model, grey correlation degree model [18,19], fuzzy comprehensive evaluation, and TOPSIS focus on spatial differentiation, are driving research on the overall level of water resources carrying capacity [20,21]. Swirepik et al. employed the UEA model to establish water requirements for Eastern Australia and proposed several measures for water resource management [22]. At present, the research direction is focused on the dynamic interaction between water resources and economic and social development. Therefore, some methods that explore the correlation of subsystems have been introduced into the evaluation system of water resources carrying capacity. Wu et al. utilized the multidimensional cloud model and the risk matrix coupling model to explore the pressure, support, and regulation of water resources in Anhui Province. The study concluded that the regional water resources carrying capacity changed little, and the spatial difference was evident from 2005 to 2015 [23]. Huang et al. studied the interaction between regional forestry structure and water resources carrying capacity using the VAR model [24]. Ahmed et al. investigated the relationship between irrigation investment and agricultural water use efficiency in Egypt based on the CGE model. The results indicated that water-saving irrigation plays a small role in driving economic growth and can improve the production efficiency of other sectors [25]. Hashemi et al. utilized the system dynamics method to simulate the change of water resources subsystem vectors to predict the trend of water resources carrying capacity in the future [26]. Ahilan et al. studied the influence of long-term suspended sediments on urban water quality using the SD model and found that the flow attenuation and sediment retention in small- and medium-flow rain pools were more evident [27].
Based on the aforementioned research, the water resources carrying capacity has been extensively studied by relevant scholars. However, there is still room for improvement in the empirical analysis method. Primarily, the majority of researchers have examined water resources carrying capacity from the perspectives of time and space separately, neglecting the interplay between these two factors. Additionally, the spatial analysis of water resources carrying capacity typically concentrates on the spatial similarity and aggregation characteristics of the study area, with limited attention paid to the measurement and analysis of disparities among different regions. Therefore, this paper proffers significant contributions in the following aspects: (1) by utilizing unconditional kernel density, static kernel density, spatial dynamic kernel density, and other methods, the paper investigates the spatial and temporal evolution process of water resources carrying capacity in 16 prefecture-level cities in Anhui Province under unconditional, spatial, and temporal conditions. This approach enables the exploration of the impact of geographical location factors on the evolution trend of regional water resources carrying capacity, thereby enriching the theoretical system of water resources carrying capacity. (2) In terms of measuring the differences in regional water resources carrying capacity, the paper employs the Dagum Gini coefficient model to divide Anhui Province into three regions from north to south and examines the differences and causes within and between groups. This analysis is beneficial in accurately identifying and measuring the spatial pattern of water resources carrying capacity in different cities in Anhui Province. (3) The paper employs the spatial kernel-density method to measure the transfer trend of water resources carrying capacity in different levels of cities in Anhui Province. Based on the location characteristics and economic- and social-development characteristics of different cities, the paper proposes policy suggestions to enhance the water resources carrying capacity of Anhui Province. These suggestions also serve as a reference for other regions to improve their water resources carrying capacity.

2. Methods

2.1. Study Area

Located in the central region of China’s Yangtze River Delta, Anhui Province spans between 114°54′–119°37′ E and 29°41′–34°38′ N (Figure 1). The province’s climate is influenced by the monsoon, resulting in volatile weather patterns and significant variations in precipitation from year to year. Summer precipitation accounts for 70% of the annual total and floods are known to occur periodically. The province is comprised of 16 prefecture-level cities, covering a total area of 140,100 km2, and is divided into three basins: the Huai River, the Yangtze River, and the Xin’an River. As of 2021, the province’s GDP stands at 429.592 billion yuan, with a primary, secondary, and tertiary industry proportion of 7.8:41:51.2, indicating a further optimization of the industrial structure. The resident population is 61.13 million, with an urbanization rate of 59.39%. However, Anhui Province’s water resources are limited, with a total volume of 88.326 billion m3, representing a 31.0% decrease from 2020. The per capita water consumption is 419 m3, which is similar to the national average, but the per capita water resources are only 1446.12 m3, significantly lower than the domestic average.

2.2. Indicator Selection and Data Sources

In accordance with the concept of ecological carrying capacity, and taking into account the impact of both natural and social dimensions on water resource carrying capacity, a water resources carrying capacity evaluation system has been established by selecting indicators from four dimensions: natural, economic, social, and environmental. This system is based on the research findings of relevant scholars [28,29,30]. The specific division of the evaluation system is presented in Table 1.
The water resources data utilized in this paper were sourced from the Anhui Water Resources Bulletin spanning from 2003 to 2021. The economic and social data, as well as environmental data, were obtained from the Anhui Statistical Yearbook, the China Urban Statistical Yearbook, and the Anhui Environmental Bulletin.

2.3. Research Methodology

2.3.1. Composite Index Model

To ensure the scientific and objective nature of this study, the objective assignment method was utilized to calculate the weights of each indicator and subsystem. The entropy model was used to assign weights to indicators based on their dispersion, with higher dispersion indicators receiving higher weights, thereby focusing on their unique characteristics. On the other hand, the CRITIC model was used to assign weights to indicators based on their correlation with other indicators, focusing on the interaction between indicators. To systematically examine the interaction between indicators, this paper adopts a comprehensive assignment method, combining the entropy model with the CRITIC model. The calculation process is as follows:
(1)
First, the indicators were categorized into positive and negative indicators based on the characteristics of water resources carrying capacity. Subsequently, the indicators were made dimensionless according to their attributes;
For positive indicators:
y i j = x i j m i n ( x j ) max ( x j ) m i n ( x j )
For negative indicators:
y i j = m a x ( x j ) x i j max ( x j ) m i n ( x j )
where i denotes the i-th study subject, j ( j = 1,2 , n ) represents the j-th indicator, x i j signifies the raw data, and y i j refers to the standardized data.
(2)
Calculate the entropy weight of indicators W 1 j . The entropy weight depends on the degree of indicator dispersion. The more dispersed an indicator is, the more information it carries, resulting in a higher weight for that indicator. The calculation process is as follows:
p i j = y i j i = 1 m y i j
E j = 1 ln ( n ) j = 1 n p i j × l n   ( p i j )
W 1 j = 1 E j j = 1 n ( 1 E j )
where E j denotes the entropy value of the j-th indicator and W 1 j , represents the entropy weight of the j-th indicator;
(3)
Calculate the CRITIC weight of indicators W 2 j . The CRITIC weight model is an objective weight model that uses the confrontation and conflict between indicators to describe their importance of things, which can take into account the interrelationship within the indicators and reduce the impact of the extreme values of the weight of a data indicator on the totality of the study, calculated by the formula:
R j = j = 1 n ( 1 r i j )
C j = S j j = 1 n 1 r i j = S j × R j
W 2 j = C j j = 1 n C j
where r i j denotes the correlation coefficient between indicator i and j , S j represents the variance of the j-th indicator, and W 2 j signifies the weight of the j-th indicator under the CRITIC weighting model;
(4)
Calculate the comprehensive weight. According to the research of relevant scholars and combined with the water resources carrying capacity index system, the entropy weight and CRITIC weight of the j-th index are expressed by W j 1 , W j 2 , respectively; then, the comprehensive weight W j is defined as follows:
W j = α W j 1 + ( 1 α ) W j 2
where α represents a constant and, herein, α = 0.5 is taken according to the research results of related scholars [31].
Calculate the comprehensive index. The calculation of the comprehensive index is employed in accessing the water resources carrying capacity of Anhui Province. The formula utilized for this purpose is as follows:
W R C C = k = 1 4 W R k = i = 1 4 W j × y i j
The value of the composite index for W R C C is determined by taking into account the composite index value of each subsystem, represented by W R k . The weight of the indicators used in the calculation of each subsystem is donated by W j , while the standardized value of these indicators is represented by y i j . It is worth noting that the calculation method for the composite index of each subsystem is similar to that of W R C C .

2.3.2. Spatial Kernel-Density Estimation

Kernel-density analysis is a nonparametric estimation method that exhibits excellent continuity and is not reliant on the interval length of the evaluation target. As such, it is well-suited for analyzing the time-evolution trend of regional water resources carrying capacity [32]. Let f ( x ) denote the probability-density function of the statistic X , the expression of f ( x ) is given by Equation (7), and in this study, the Gaussian kernel is selected as the expression of the kernel function, as shown in the form of (8):
f x = 1 N h i = 1 N K X i x h
K ( x ) 1 2 π e x p x 2 2
where X i represents the table of observations, x denotes the mean value, K represents the kernel function, N denotes the number of observation samples, and h denotes the bandwidth. It is worth noting that the estimation accuracy decreases as the bandwidth increases, resulting in a smoother curve. Spatial kernel-density estimation is utilized to estimate the probability-density function of state transitions that occur in a stochastic process and to explore the trends of different study regions over a specific time period. In this study, the same Gaussian kernel is employed for calculation, and its expression is given by:
g y x = f ( x , y ) f ( x )
g y x denotes the marginal kernel-density function of x and f ( x , y ) is the joint probability-density function of x , y whose expressions are:
f x , y = 1 N h x h y i = 1 N K x X i x h x K y Y i x h y
The h x and h y denote the bandwidth of x and y , X i ( Y i ) represents the observed value, and x is the mean value of the observed value.

2.3.3. Dagum Gini Coefficient Decomposition

The Dagum Gini coefficient, a method for measuring regional differences, takes into account the distribution of subsamples, effectively addresses the issue of crossover between samples, and identifies the sources of differences. The Gini coefficient is decomposed into the intraregional difference contribution G w , the interregional net difference contribution G n b , and the hypervariable density G t contribution through subgroup decomposition. The calculation is as follows:
G = G w + G n b + G t
G = j = 1 k h = 1 k i = 1 n j r = 1 n h | y j i y h r | 2 n 2 μ
Among them, k represents the number of regions divided, k = 3, n donates the number of prefecture-level cities, n = 16; y i j and y h r refer to the water resources carrying capacity index in j(h) region, and μ is the average value of regional water resources carrying capacity. The higher the Gini coefficient is, the more unbalanced the water resources carrying capacity is.
The Gini coefficient G j j of the region j can be expressed as:
G j j = 1 2 y j ¯ i = 1 n j r = 1 n h | y j i y h r |
The Gini coefficient G w within the region can be expressed as:
G w = j = 1 k G j j p j s j
The Gini coefficient G j h between regions j and h , the regional net value difference G n b and the hypervariable density G t can be expressed as:
G j h = 1 n j n h ( y j ¯ + y h ¯ ) i = 1 n j r = 1 n h | y j i y h r |
G n b = j = 2 k h = 1 j 1 G j h ( p j s h + p h s j ) D j h
G t = j = 2 k h = 1 j 1 G j h ( p j s h + p h s j ) ( 1 D j h )
Among them, p j = n j / n , which is the ratio of the number of cities in the j region to the total number of cities in Anhui Province, and D j h donates the interaction between the j region and the h region to measure the water resources carrying capacity. The calculation formula is:
D j h = d j h P j h d j h + P j h
The calculation formulas of d j h and P j h are:
d j h = 0 d F j ( y ) 0 y ( y x ) d F h ( x )
P j h = 0 d F h ( y ) 0 y ( y x ) d F j ( x )
Among them, d j h represents the difference of water resources carrying capacity between regions, P j h donates the super variable first moment, and F j ( F h ) indicates the cumulative distribution function of j ( h ) region.

2.3.4. Markov Chain Model

A Markov chain represents a specific type of Markov process characterized by discrete time and state [33]. In this study, the dynamic evolution characteristics of the water resources carrying capacity in Anhui Province during various periods are investigated through the construction of a Markov transfer probability matrix. The first step involves discretizing the continuous Anhui water resources carrying capacity index (WRCC) into categories. Subsequently, the probability distributions of these categories and their interannual variations are computed to approximate the entire process of the water resources carrying capacity index evolution in Anhui Province. The methodology employed is detailed below:
R t + 1 = M × R t
where M ( k × k ) represents the spatial transfer matrix, with element m i j signifying the probability of a city transitioning from type i in year t to type j in year t + 1 . R t denotes the probability matrix for K types in year t . In contrast, the spatial Markov chain takes into account the spatial lag characteristic based on the original matrix and decomposes the traditional k × k matrix into k k × k conditional transfer matrices. T h e spatial transfer probability, m i j ( k ) , indicates that a city with a WRCC of type i in the initial year has a spatial lag type conditional upon its transformation to type j in the subsequent year. To determine the spatial weights, this study employs the spatial adjacency matrix.

3. Results

3.1. Analysis of the Evolutionary Trend of WRCC in Anhui Province

From 2003 to 2021, Anhui Province has exhibited an overall increasing trend in its water resources carrying capacity. The average regional water resources carrying capacity has transitioned from 0.34 in 2003 to 0.39 in 2012 and then to 0.49 in 2021, indicating a significant increase in water resources carrying capacity. The water resources carrying capacity of Anhui Province was between 0.3 and 0.4 from 2003 to 2013, with a slow growth rate. However, after 2013, the growth rate increased significantly, with the value exceeding 0.5 in 2020, followed by a decrease in 2021. The evolution of water resources carrying capacity in Anhui Province can be subdivided into three stages, namely 2003–2010, 2011–2016, and 2016–2020. The water resources carrying capacity in these three phases exhibits a cyclical pattern, with a significant decline followed by a steady increase in the subsequent years. To further explore the spatial pattern of water resources carrying capacity in Anhui Province, the researchers utilized ArcGIS10.8 software to visualize the water resources carrying capacity of 16 cities in the province. The natural breakpoint method was employed to classify the water resources carrying capacity of Anhui Province, and the resulting classification is presented in Figure 2. The annual average water resources carrying capacity of Huangshan, at 0.51, is the highest in Anhui Province. The cities of Ma’anshan, Wuhu, Wuhu, Chizhou, Tongling, and Xuancheng exhibit a high level of water resources carrying capacity, with an average range of 0.4–0.5. Conversely, the water resources carrying capacity of Hefei, Anqing, Chuzhou, Huainan, and Huabei is considered “poor,” indicating a low level of water resources carrying capacity. The cities of Suizhou, Bengbu, Bozhou, Liuan, and Fuyang exhibit the lowest level of water resources carrying capacity in the province. When considering the natural geographic characteristics and economic and social development level of each region, it is evident that southern Anhui, represented by Huangshan, receives ample precipitation, has dense rivers, and abundant surface water resources, resulting in superior natural conditions for water resources. Additionally, the population in southern Anhui is relatively small, and the industrial structure is reasonable, with fewer polluting industries, resulting in a high overall ecological carrying capacity of water resources. The central region of Anhui Province, represented by Hefei, is a leader in terms of both economy and environment. However, the large population in the region places significant pressure on local water resources, and the proportion of domestic and public water consumption is excessively high, resulting in an overall water resources carrying capacity that is only at a moderate level. In the northern region of Anhui, the climate is primarily temperate monsoon, with scarce precipitation and high population density. As a result, the region experiences periodic water resource shortages. Additionally, the cities in the north of Anhui retain a significant number of mining and chemical industries, which have seriously damaged the water ecology, resulting in a poor carrying capacity of water resources.
This study conducts an analysis of the subsystem layer of water resources carrying capacity in Anhui Province. Within the framework of water resources carrying capacity, the comprehensive indices of natural, economic, social, and environmental systems are visualized in Figure 3. It is observed that the social subsystem accounts for the largest proportion of the regional water resources carrying capacity, while the natural subsystem exhibits the largest change compared to the economic, social, and environmental subsystems. The natural subsystem is influenced by regional geographic and climatic factors, particularly precipitation. Notably, the score of the natural subsystem displays a “W”-shaped increase from 2003 to 2021. However, the oscillation of the water resources subsystem increases after 2011 and no apparent upward or downward trend is observed. From 2003 to 2021, the economic subsystem of Anhui Province has exhibited significant growth, with a notable acceleration in the past decade. Specifically, the growth rate of the water resources system from 2012 to 2021 is approximately three times that of the period from 2003 to 2011. This growth has been accompanied by a weakening dependence of primary and secondary industries on water resources, and a significant improvement in the water resources utilization efficiency of the economic system. In contrast, the social subsystem has remained relatively stable over the same period, with only two large increases observed in 2008–2009 and 2019–2020. Despite the gradual improvement of infrastructure and water conservation measures in Anhui Province, the pressure on water resources caused by the growth of population and population density has been constantly increasing. The environmental subsystem index has exhibited a steady increase from 2003 to 2021, indicating effective control of water environment pollution and significant improvement in the water ecological status during the process of economic and social development in Anhui Province.

3.2. Kernel-Density Estimation of WRCC in Anhui Province

3.2.1. Conventional Kernel-Density Estimation

The utilization of the Gaussian function for the purpose of approximating the kernel density of water resources carrying capacity in Anhui Province is expounded upon in the following. Figure 4 illustrates the kernel-density curve of the water resources carrying capacity in Anhui Province during the years 2003, 2006, 2009, 2012, 2015, 2018, and 2021. The horizontal axis represents the water resources carrying capacity of Anhui Province, while the vertical axis represents the value of the density estimation. It is readily apparent that the kernel-density distribution curve undergoes a rightward shift from 2003 to 2009, with a conspicuous “long tail” phenomenon on the right-hand side, indicating the water resources carrying capacity of Anhui Province. Simultaneously, the peak of the kernel-density curve shifts to the right and decreases, suggesting a decrease in the disparity of regional water resources carrying capacity. From 2009 to 2012, the water resources carrying capacity experienced a decline, while from 2012 to 2018, the overall water resources carrying capacity of Anhui Province exhibits an upward trend, with the kernel-density curve shifting to the right and the peak tending to expand. Therefore, the regional coordination of water resources carrying capacity faces the risk of further expansion. Nevertheless, in general, the water resources carrying capacity of Anhui Province gradually increases and does not exhibit any polarization phenomenon.

3.2.2. Unconditional Kernel-Density Estimation

Figure 5 depicts the unconditional kernel-density estimation of water resources carrying capacity in Anhui Province. The X coordinate represents the water resources carrying capacity of this urban area in year t, the Y coordinate represents the water resources carrying capacity of this urban area in year t+3, and the Z coordinate represents the probability density. In the contour density graph, the higher the probability density, the more inward the curve is. If the graphs are concentrated near the 45° line, it indicates that the water resources carrying capacity of this urban area in year t+3 is not significantly different from that in year t. According to the contour density graph, the majority of the graphs are above the 45° line and there are only two primary peaks, implying that the water resources carrying capacity of Anhui Province generally increases in year t+3. This conclusion is consistent with the water resources carrying capacity of southern and northern Anhui Province discussed in the preceding article. In contrast, cities in northern Anhui, such as Bengbu and Suizhou, possess abundant water resources and high forest cover, resulting in strong water resources carrying capacity, which corresponds to the two peaks. Further analysis of the directionality of the contour distribution reveals that the graphs below 0.55 on the x-axis are primarily distributed above the 45° line, while the parts above 0.55 on the x-axis are distributed below the 45° line and concentrated around 0.5–0.6. This suggests that the urban areas with strong water carrying capacity in Anhui Province exhibit a tendency to decline and natural factors, such as precipitation, may be crucial factors influencing the unconditional kernel-density curve.

3.2.3. Static Kernel-Density Estimation under Spatial Conditions

To determine whether there exists a spatial effect on the water resources carrying capacity of Anhui Province, the static kernel-density estimation of spatial conditions is employed to examine the convergence pattern of water resources carrying capacity enhancement in Anhui Province. The kernel-density estimation results are presented in Figure 6.
In Figure 6, the x-axis represents the water resources carrying capacity of neighboring urban areas in year t, while the y-axis represents the water resources carrying capacity of the province in year t. If a spatial effect is evident, whereby urban areas with high water carrying capacity are adjacent to urban areas with high efficiency, and urban areas with low water carrying capacity are adjacent to urban areas with low efficiency, then the probability-density distribution should be concentrated on the 45° diagonal and be distributed along the diagonal. As shown in Figure 6, the majority of the graphs are concentrated on the 45° line, with the graphs being parallel to the x-axis around y = 0.65. Additionally, the graphs exhibit three peaks, with the peaks decreasing in size from south to north of Anhui Province. These findings suggest that the water resources carrying capacity of Anhui Province exhibits a significant spatial aggregation effect, without considering the role of time span.

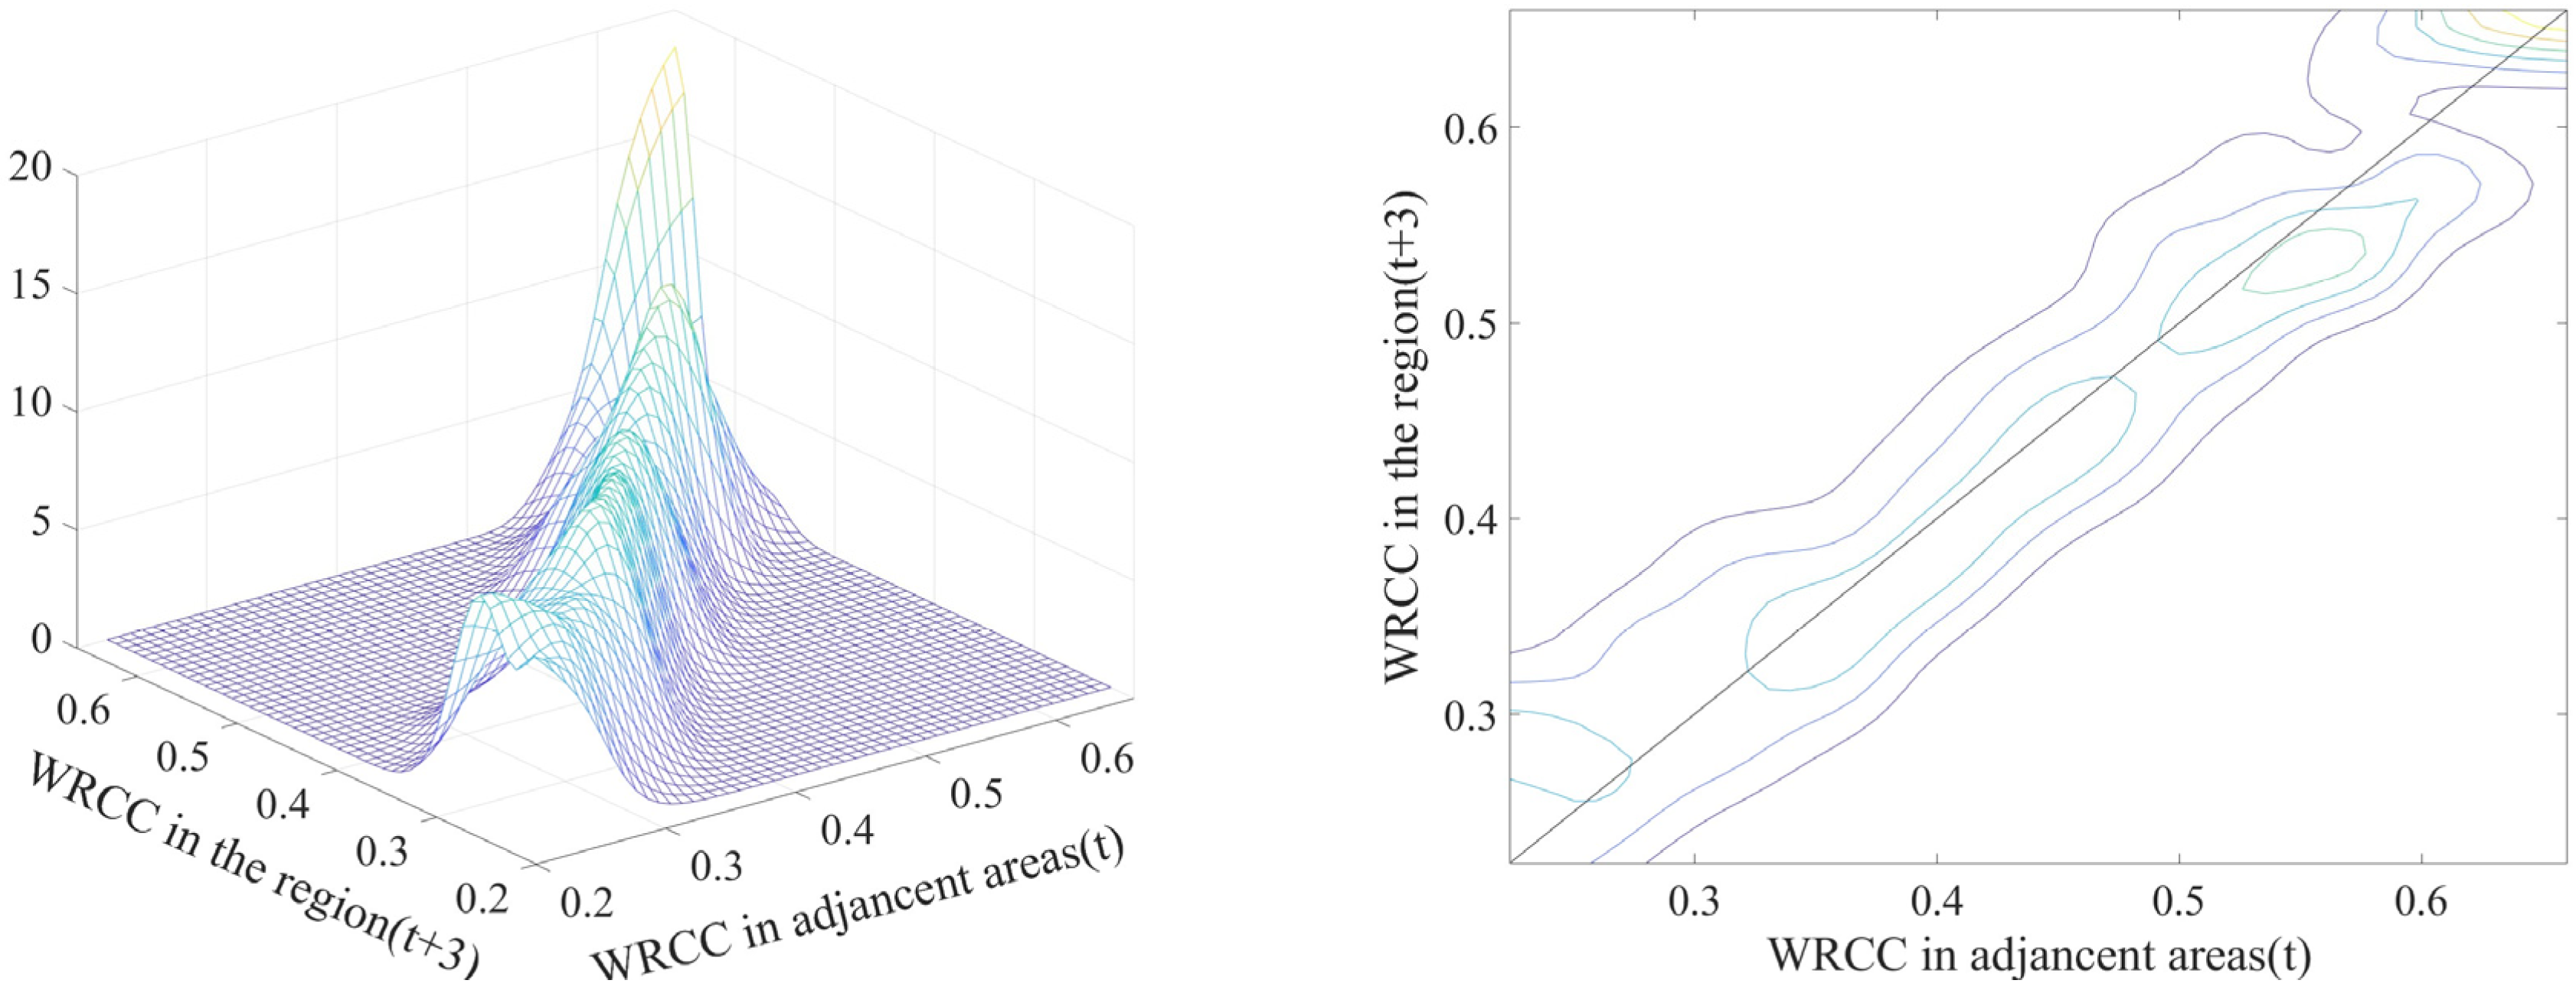
3.2.4. Dynamic Kernel-Density Estimation under Spatial Conditions

Factoring in the spatial factor, the study further examines the influence of neighboring urban areas’ water resources carrying capacity on the region, while also considering the time factor. Specifically, the mean value of the water resources carrying capacity of neighboring areas is compared with the mean value of the water resources carrying capacity of the entire Anhui Province. Based on this analysis, neighboring urban areas are divided into two categories: cities with a ratio interval of (0.85, 1) are classified as first-order spatial lag type, indicating low water resources carrying capacity cities, while cities with a ratio interval of (1.1, 1.15) are classified as second-order spatial lag type, indicating high water resources carrying capacity cities. The x-axis in the graph represents the water resources carrying capacity of neighboring provinces and regions in year t, i.e., the spatial lag term, while the y-axis represents the water resources carrying capacity level of the province and region in year t+3. By combining Figure 7 and Figure 8, it becomes evident that most of the graphs under spatial dynamic conditions are located near the 45° line. This suggests that the water resources carrying capacity of neighboring regions is similar to the increase of water resources carrying capacity of Anhui Province, indicating a tendency towards “high-high” and “low-low” water resources carrying capacity in geographic space. Specifically, the water resources carrying capacity of Anhui Province tends to exhibit a spatial pattern of “high-high” and “low-low”. Under the condition of first-order spatial lag, when the WRCC value is lower than 0.45, the probability density body shifts upward compared to the 45° line. However, as the WRCC value continues to increase, the probability-density curve concentrates on the range of 0.4–0.5. These findings suggest that although the water resources carrying capacity of the surrounding area may be low, cities of this type tend to exhibit an upward trend in their water resources carrying capacity. However, as the WRCC value of surrounding cities increases, the increase in the water resources carrying capacity of these cities becomes limited, with the density curve being concentrated around 0.4. Moreover, when the x-axis value exceeds 0.55, the y-axis value exhibits a clear tendency to converge. This indicates that the WRCC value of cities with a high water resources carrying capacity in Anhui Province tends to remain stable to a certain extent, with a high probability of shifting downward.
Upon combining Figure 7 and Figure 8, it becomes apparent that the water resources carrying capacity of each prefecture-level city in Anhui Province is subject to the influence of neighboring areas when both temporal and spatial factors are taken into account. Specifically, when a city’s neighboring areas exhibit low WRCC, the city’s WRCC value is likely to be low after three years. Conversely, if a region is adjacent to a city with a high WRCC in year t, its WRCC tends to be high in year t+3. However, the spatial WRCC under both first-order and second-order lag conditions tends to decrease after reaching a certain level, with the former converging to 0.4 and the latter converging to 0.55.

3.3. Decomposition of Dagum Gini Coefficient of WRCC of Anhui Province

Through an analysis of the spatial and temporal patterns of water resources carrying capacity across 16 prefectures in Anhui Province, notable differences in the WRCC were observed among various regions. Specifically, the study focused on the regional differences between the “South Anhui” (SA), “North Anhui” (NA), and “Central Anhui” (CA) regions.
By combining the findings from Table 2, it is evident that the Gini coefficient of the water resources carrying capacity in Anhui Province experienced an initial increase followed by a subsequent decrease between 2003 and 2021. This trend suggests that the balance of water resources carrying capacity in the province initially declined before subsequently improving. In recent years, with the deceleration of economic growth and the promotion of coordinated development, the relative balance of water resources ecology across different regions of Anhui Province has been enhanced, particularly after 2016. Regarding the contribution rate of regional differences, it was found that the contribution rate of intergroup differences was significantly higher than that of intragroup differences and hypervariable density. Prior to 2016, the contribution rate of intragroup differences increased from 66.81% to 86.14%, while the contribution rates of intragroup and hypervariable density decreased by approximately 10% each. After 2016, the contribution rates of intragroup and hypervariable density remained relatively stable, fluctuating at around 17% and 2%, respectively. At the regional level, the Gini coefficient of South Anhui was found to be significantly higher than that of North and Central Anhui. Between 2003 and 2016, the Gini coefficient of North Anhui was higher than that of Central Anhui but this trend reversed after 2016. On average, the Gini coefficient value within the study area was greater in South Anhui than in North Anhui and Central Anhui.

3.4. Markov Chain Analysis of WRCC in Anhui Province

To predict the long-term trend of water resources carrying capacity in Anhui Province, the traditional Markov chain method was employed to analyze the WRCC index of 16 prefecture-level cities in the province. The WRCC index was categorized into four levels, ranging from low to high on average, namely low level (I), lower level (II), higher level (III), and high level (IV). The WRCC index of cities in Anhui Province was calculated using a one-year lag condition. The transfer matrix used for this analysis is as follows:
As depicted in Table 3, the elements positioned along the diagonal represent the probability of water resources carrying capacity remaining unchanged. Conversely, the elements off the diagonal indicate the probability of change. It is evident that the values along the diagonal surpass those off the diagonal. This observation suggests that Anhui Province’s water resources carrying capacity is more likely to remain stable. Specifically, the diagonal values range from 0.67 to 0.90, indicating that each prefecture-level city within Anhui Province has a minimum probability of 0.67 of maintaining its current water resources carrying capacity level. In contrast, the highest value among the off-diagonal elements is only 0.26, significantly lower than the diagonal values. This suggests that the probability of transfer between different WRCC levels is relatively low. Simultaneously, the probability of WRCC remaining at “low level” and “high level” is relatively high, at 0.7895 and 0.8906, respectively. This suggests a polarization trend in the WRCC of Anhui Province. In addition, the nondiagonal elements are predominantly located on the right side of the diagonal line, indicating a higher probability of positive transformation of the WRCC level to “low level”, “lower level”, and “high level”, at 0.2105, 0.2305, and 0.2306, respectively. The probability of positive transfer is 0.2105, 0.2368, and 0.2639, respectively, with a higher probability of positive transfer associated with higher WRCC levels. This suggests a positive feedback effect in the WRCC, with greater difficulty in improving WRCC in the early stages.
To account for the geographical correlation between water resources carrying capacity levels across regions, it is necessary to consider spatial factors. To this end, a spatial Markov transfer probability matrix must be established and the spatial transfer probability matrix with a one-year lag must be calculated for further analysis. The spatial Markov transfer matrix of water resources carrying capacity in Anhui Province is presented in Table 4. Analysis of Table 4 reveals that the transfer matrix of WRCC varies under four spatial conditions, indicating that the probability of the water resources carrying capacity level for each prefecture-level city in Anhui Province is influenced by the water resources carrying capacity of neighboring cities and the spatial geographical characteristics will impact the development trend of water resources carrying capacity in this region. Thus, it is crucial to consider the spatial dimension when examining the development trend of water resources carrying capacity in the region. Secondly, when the water resources carrying capacity level of the region is low and the surrounding areas are high, it has a positive impact on the improvement of its own water resources carrying capacity. For instance, if the WRCC level of neighboring cities is at a “low level”, the WRCC level of the region can be improved from “low level” to “low level”. In cases where the WRCC level of neighboring cities is at a “lower level”, the probability of improving the WRCC level of the region from “lower level” to “lower level” is 0.3548, which exceeds the 0.2105 probability of the traditional Markov chain. Conversely, if the WRCC level of neighboring cities is at a “lower level”, the WRCC of the region may decrease from “higher level” to “lower level”. In such cases, the probability that the WRCC of the region decreases from “higher level” to “lower level” is 0.25, which is significantly higher than the 0.0556 probability in the traditional state. Therefore, it can be concluded that when the water resources carrying capacity in neighboring areas of the target city is higher, the probability of increasing the water resources carrying capacity in the region is greater. Conversely, when the water resources carrying capacity in neighboring areas is lower, the probability of decreasing the water resources carrying capacity of the target city is higher.

4. Discussion

The study of water resources carrying capacity is a crucial aspect of water resources ecological security and has become a prominent research topic. The research trends in this field include space–time analysis [4], simulation analysis [34], and promotion path research [35]. In contrast to the conventional spatial–temporal analysis of water resources carrying capacity, this study emphasizes the interplay between time and space and examines the multidimensional evolution process and transfer trend of water resources carrying capacity. By examining the carrying capacity of water resources in Anhui Province, it is evident that the carrying capacity of water resources is influenced not only by natural factors such as precipitation conditions in the region but also by social factors such as population and industrial structure. The northern region of Anhui Province, in particular, is confronted with a challenging situation due to its low precipitation, high population density, and severe water pollution. As a result, the carrying capacity of water resources is under significant strain. Nevertheless, with the advancement of science and technology, as well as the government’s emphasis on energy conservation and environmental protection, the water environment in most areas has witnessed a marked improvement. The approach to enhancing the carrying capacity of water resources is not restricted to reducing pollution emissions. For instance, Huainan City has leveraged coal mining subsidence areas to cultivate pond aquaculture and has actively implemented ecological compensation policies.
Based on the analysis of the evolutionary trend and spatial distribution characteristics of water resources carrying capacity in Anhui Province, as well as the interactions of internal factors, the following recommendations are proposed:
(1)
To promote high-quality economic development, it is recommended that Anhui Province vigorously develop science and technology, drive the transformation of regional economic structure through the utilization of high technology, and increase the proportion of tertiary industry. As the economy serves as the driving force of social development, it is necessary to prioritize the social and environmental aspects to improve the carrying capacity of water resources, given the inevitable limitations imposed by natural conditions;
(2)
To enhance the carrying capacity of water resources, the government should develop policy paths that take into account the different locational characteristics. In the northern region of Anhui, the focus should be on economic transformation, reducing dependence on mineral resources and heavy industry, and promoting the development of green industries and environmental technology. Efforts should also be made to address environmental pollution issues, such as declining water quality. In central Anhui, the role of radiation should be strengthened, with a focus on delivering high-tech industries to surrounding areas and driving their development in tandem with the region’s own economic and scientific, and technological strengths. In Southern Anhui, where the ecological environment is relatively superior but the total economic volume is relatively poor, it is important to make reasonable use of the region’s natural resource advantages and explore new paths of economic and social development;
(3)
Water resources carrying capacity is a multifaceted concept encompassing various aspects such as nature, economy, society, and environment. Therefore, it is necessary that future development in Anhui Province adopts a “five-in-one” coordinated approach, wherein the results of economic progress are leveraged to enhance the residents’ quality of life, participation, and happiness. Consequently, in the ongoing development of Anhui Province, our focus should be on achieving synergistic progress across all five dimensions, utilizing the dividends of economic growth to elevate residents’ well-being, foster increased engagement and contentment, enhance regional water resources carrying capacity, improve overall ecological sustainability, and, finally, achieve the objective of “high-quality development”.
Finally, the evaluation of water resources carrying capacity involves a plethora of research ideas and analysis methods. This paper centers on the spatial and temporal evolution of regional water resources carrying capacity. In future research, researchers may enhance their research of the factors that influence water resources carrying capacity and the pathways for its promotion. Additionally, they may enrich the connotation of water resources carrying capacity, thereby furnishing robust support for the high-quality development of regions.

5. Conclusions

This study sought to construct an evaluation index system for the water resources carrying capacity in Anhui Province based on the concept of water resources carrying capacity. The index system was divided into four subsystems, namely water resources, economy, society, and environment. To determine the weights of the subsystems, the entropy weight model and CRITIC model were employed. The comprehensive index was then used as the evaluation standard for water resources carrying capacity. To explore the time evolution and spatial pattern of the water resources carrying capacity in different cities of Anhui Province, spatial kernel-density estimation and Dagum Gini coefficient were combined. Finally, the spatial Markov chain was utilized to explore the evolution law of water resources carrying capacity. The findings of the study are as follows:
(1)
During the period from 2003 to 2021, the water resources carrying capacity of Anhui Province exhibited an improvement, with an average increase of approximately 0.15 in the comprehensive index of water resources carrying capacity. Notably, the comprehensive index of economic and environmental systems demonstrated a steady growth, while the index of social systems remained relatively stable;
(2)
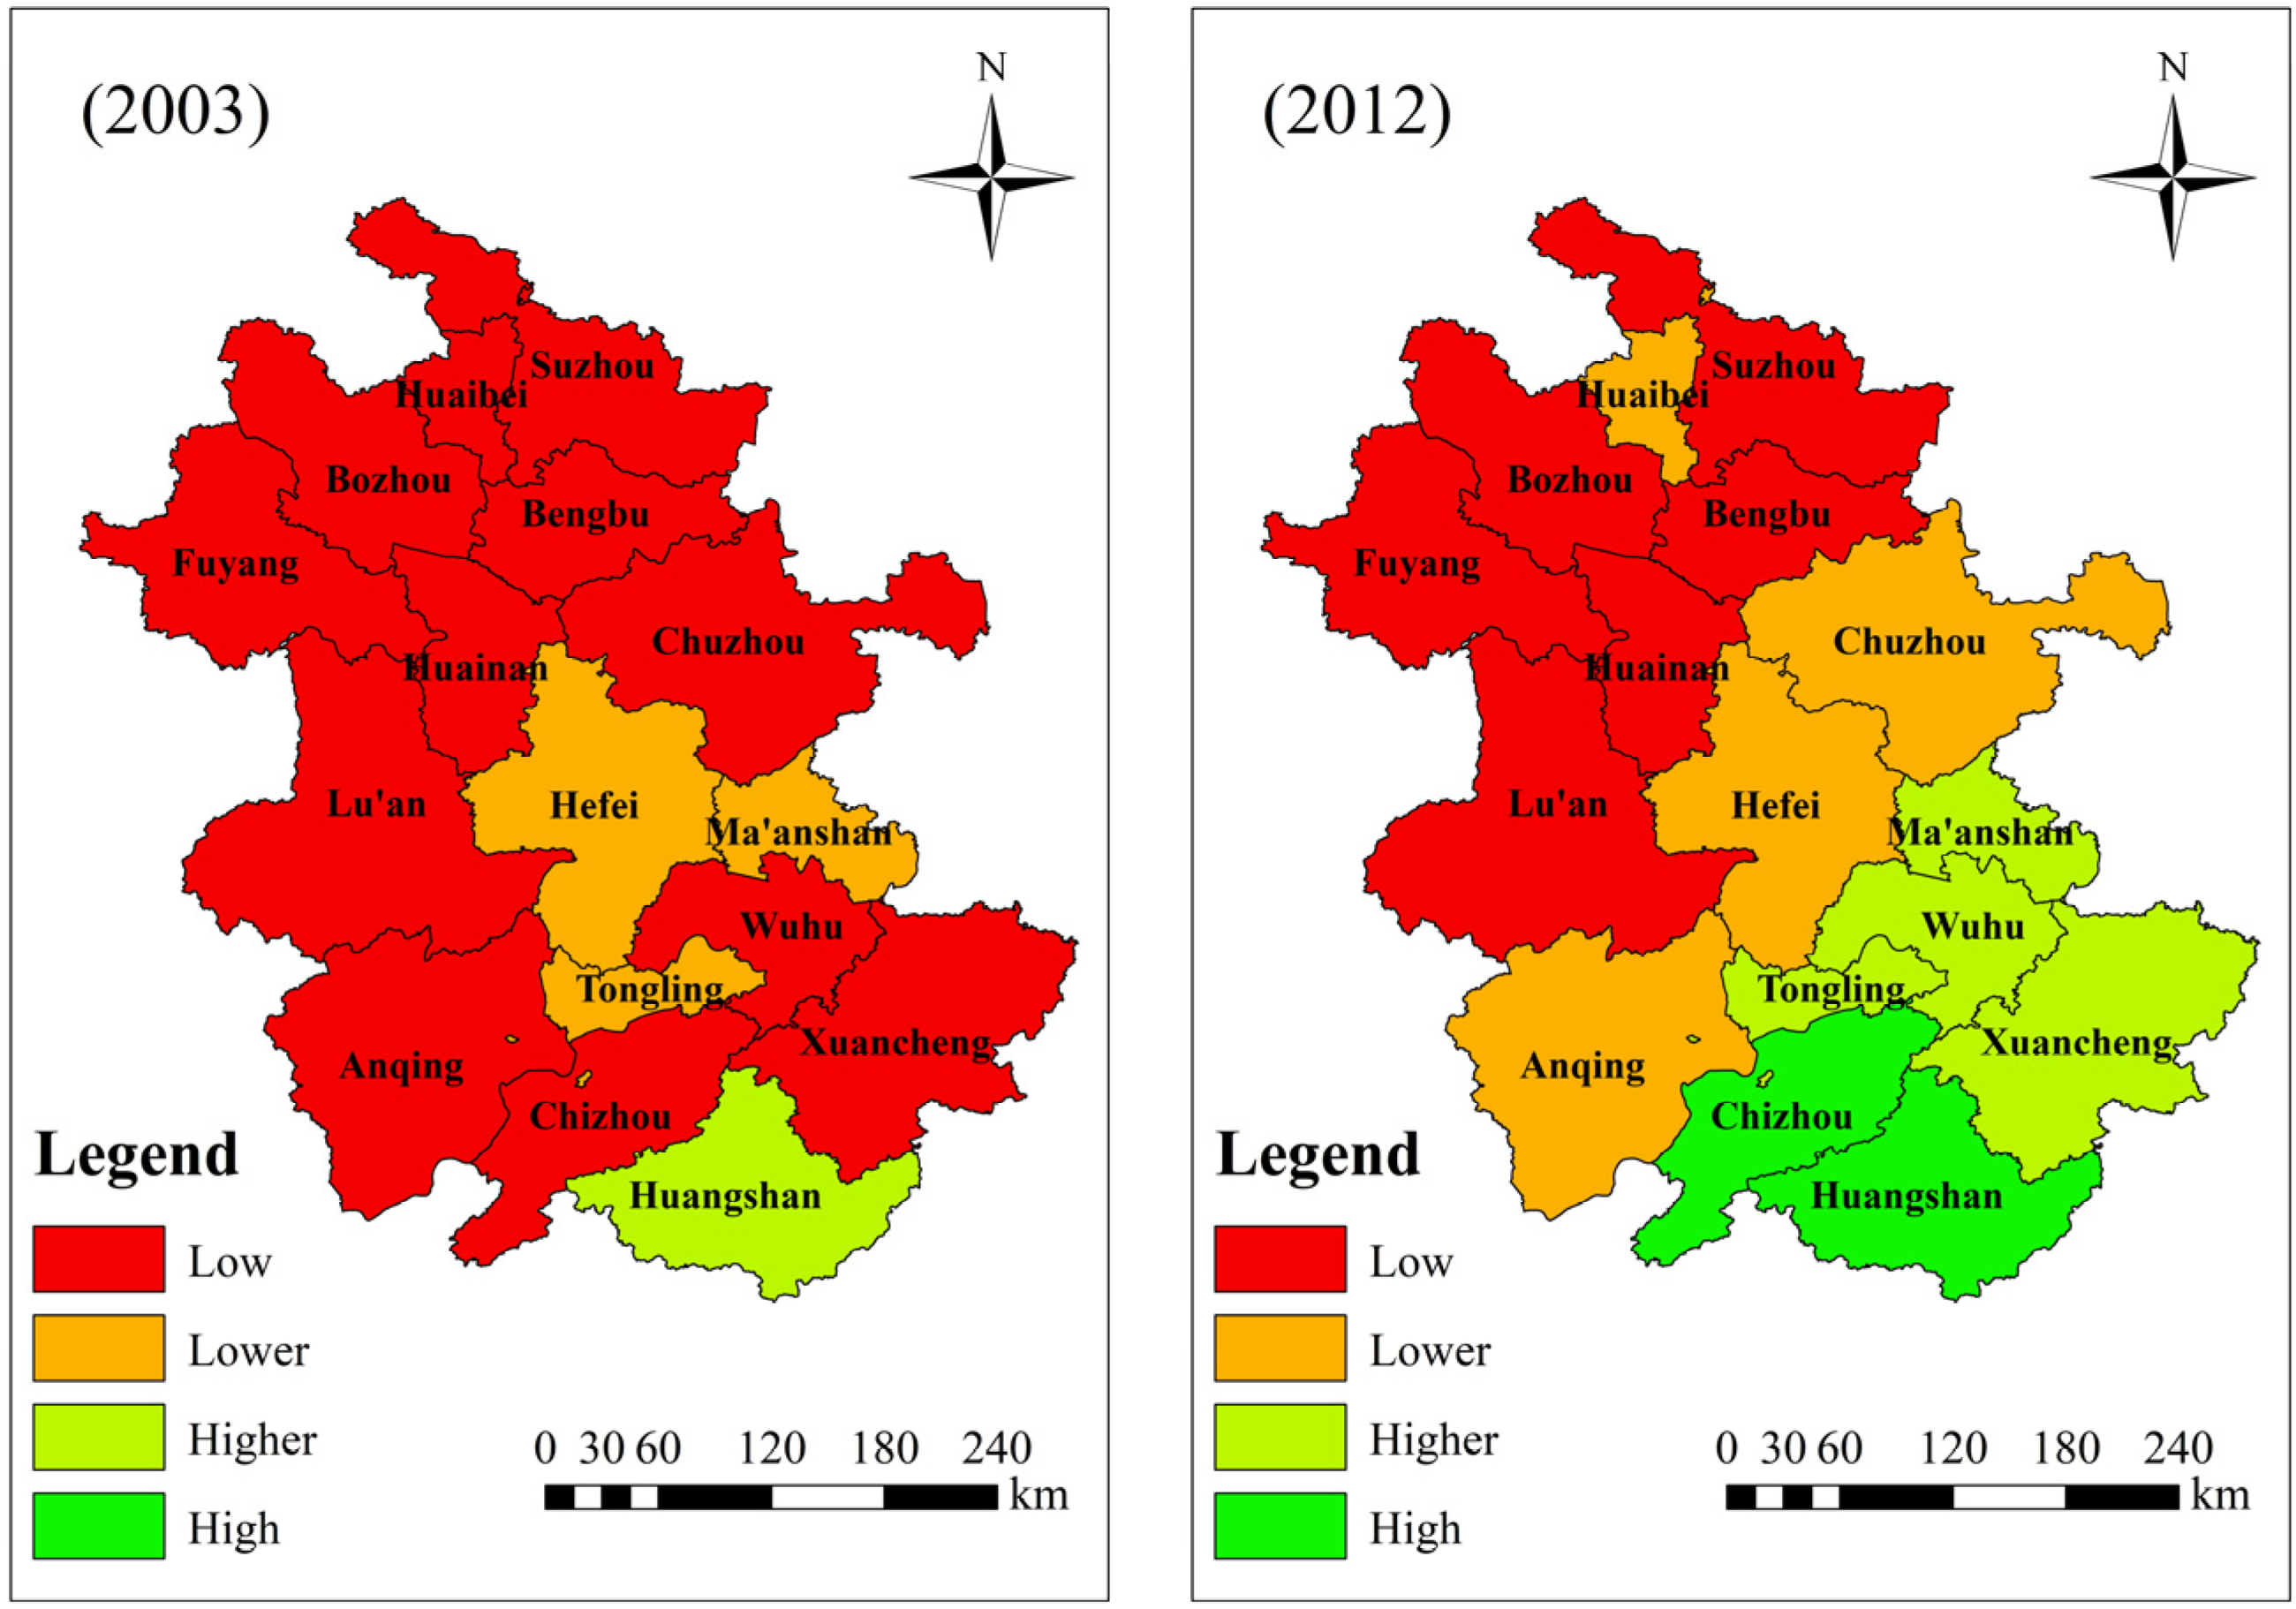
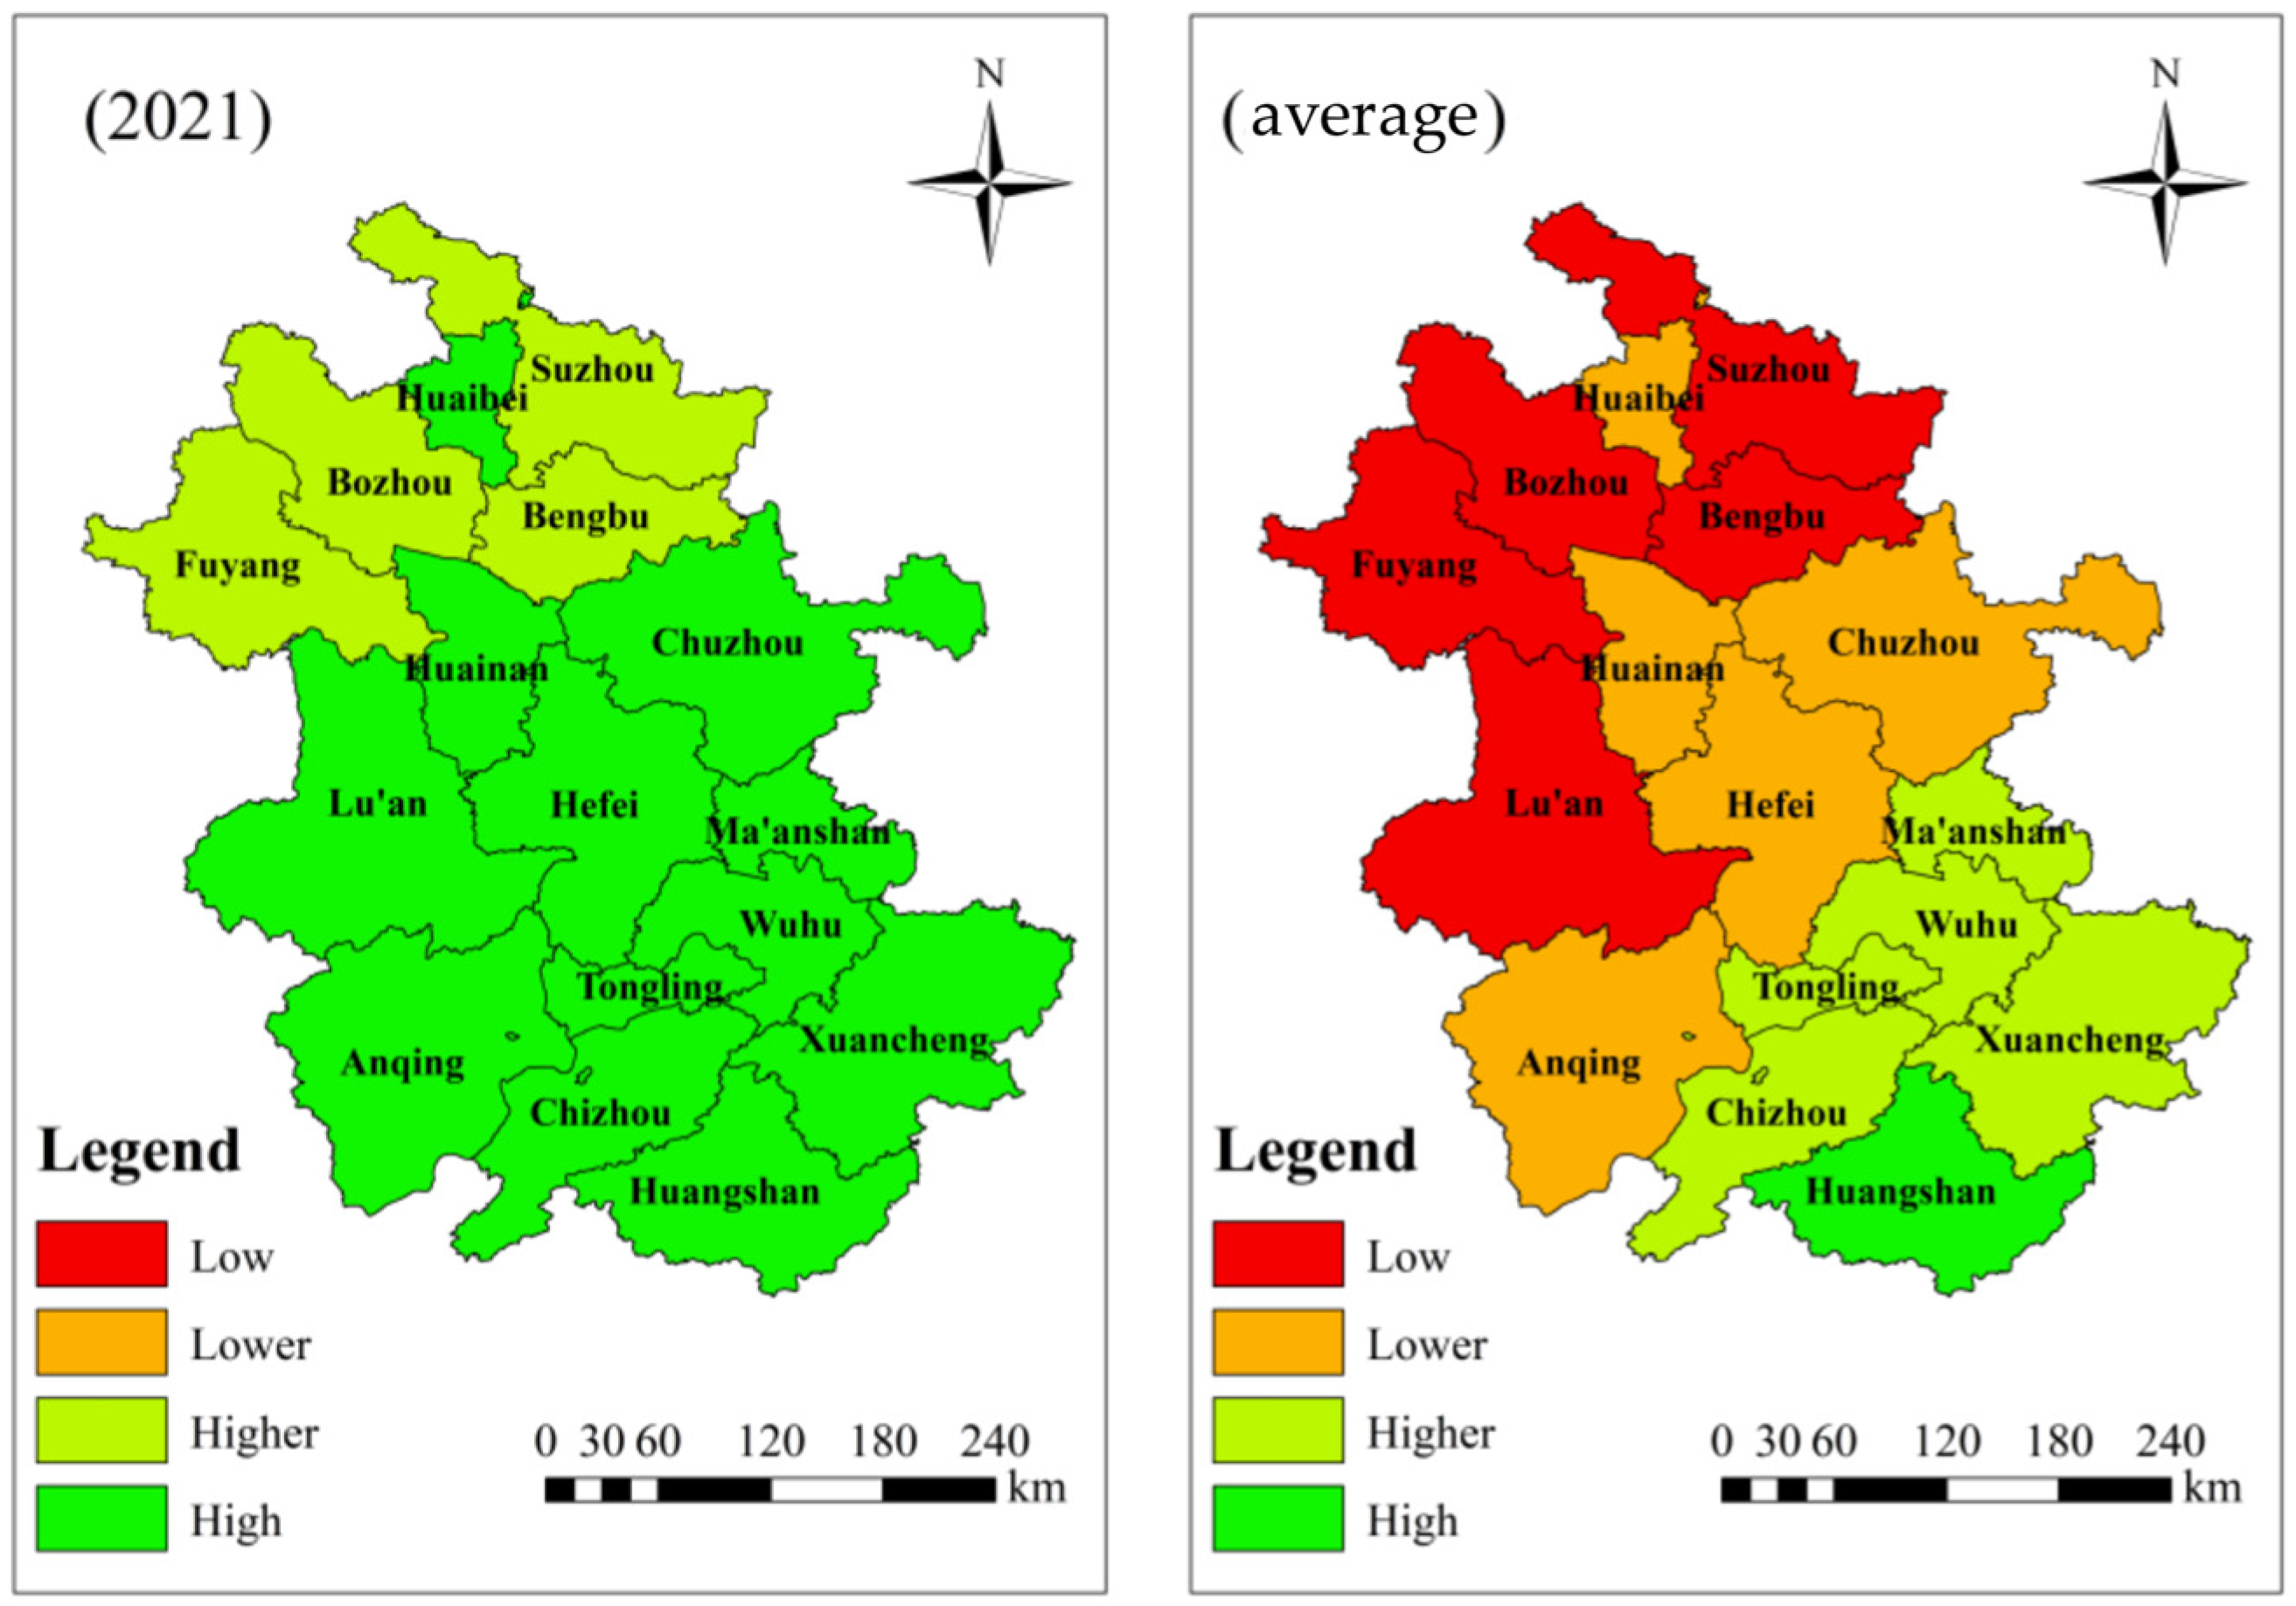
Between 2003 and 2021, the spatial difference characteristics of water resources carrying capacity in Anhui Province were evident. Specifically, the water resources carrying capacity gradually decreased from southern Anhui to northern Anhui, with the difference gradually diminishing after 2016. Notably, the intergroup Gini coefficient of the water resources carrying capacity in Anhui Province was significantly higher than the intragroup Gini coefficient.
The spatial effect resulting from geographical proximity can significantly impact the change of the water resources carrying capacity in a given region. Specifically, being adjacent to cities with higher water resources carrying capacities will increase the probability of upward transfer of WRCC in the city, while being adjacent to cities with a lower water resources carrying capacity will increase the probability of downward transfer of WRCC. Through exploring the causes of its formation, it becomes evident that the carrying capacity of water resources is a complex system that is composed of regional nature, economy, society, and environment. Notably, a strong carrying capacity of water resources not only indicates that the water resources in the region are sufficient but also signifies that the level of economic and social development in the region is high. The spillover effect of economic and social factors is robust, as it can radiate science, technology, and industry to surrounding cities, thereby driving the development of adjacent cities. Conversely, cities with low water resources carrying capacities may be affected by uncontrollable factors, such as topography and climate, leading to a poor level of economic and social development. Such cities typically require resources or economic support from neighboring cities, resulting in a downward trend in the water resources carrying capacity in their surrounding areas.

Author Contributions

Conceptualization, G.H.; writing—original draft preparation, H.J. and G.H.; review and editing, G.H. and H.J. All authors have read and agreed to the published version of the manuscript.

Funding

This study was supported by the National Natural Science Foundation of China (72271005) and the Humanities and Social Sciences Foundation of the Ministry of Education (22YJAZH025).

Institutional Review Board Statement

Not applicable.

Informed Consent Statement

Not applicable.

Data Availability Statement

The data presented in this study are available on request from the corresponding author.

Conflicts of Interest

The authors declare no conflict of interest.

References

  1. Ke, S.; Wu, Y.; Cui, H.; Lu, X.; Ge, K.; Chen, D. The Temporal-Spatial Pattern and Coupling Coordination of the Green Transition of Farmland Use: Evidence from Hubei Province. Sustainability 2021, 13, 11892. [Google Scholar] [CrossRef]
  2. Sun, X.; Guo, C.; Cui, J. Research on evaluation method of water resources carrying capacity based on improved TOPSIS model. La Houille Blanche 2021, 106, 68–74. [Google Scholar] [CrossRef]
  3. Wu, H.J. The research on under water resources supporting capacity restraint in Xi’an city of the water sports. Desalination Water Treat. 2018, 121, 208–212. [Google Scholar] [CrossRef]
  4. Wen, Z.; Li, X.; Li, T. Comprehensive Study on Freshwater Ecosystem Health of Lancang River Basin in Xishuangbanna of China. Water 2020, 12, 1716. [Google Scholar] [CrossRef]
  5. Jin, J.; Dong, T.; Li, J.; Zhang, L.; Li, H. Water resources carrying capacity evaluation method under different carrying standards. Adv. Water Sci. 2018, 29, 31–39. (In Chinese) [Google Scholar]
  6. Jia, Y.; Wang, H. Study on Water Resource Carrying Capacity of Zhengzhou City Based on DPSIR Model. Int. J. Environ. Res. Public Health 2023, 20, 1394. [Google Scholar] [CrossRef]
  7. Yang, G.; Dong, Z.; Feng, S.; Li, B.; Sun, Y.; Chen, M. Early warning of water resource carrying status in Nanjing City based on coordinated development index. J. Clean. Prod. 2021, 284, 124696. [Google Scholar] [CrossRef]
  8. Wu, C.; Jiang, A.-D.; Zheng, W. Study on the Measures for Optimizing China’s Provincial Territorial Space Based on the Perspective of Resource and Environmental Carrying Capacity in the New Situation. Sustainability 2022, 14, 13754. [Google Scholar] [CrossRef]
  9. Su, Y.; Zheng, Q.; Liao, S. Spatio-Temporal Characteristics of Water Ecological Footprint and Countermeasures for Water Sustainability in Japan. Int. J. Environ. Res. Public Health 2022, 19, 10380. [Google Scholar] [CrossRef]
  10. Novoa, V.; Ahumada-Rudolph, R.; Rojas, O.; Munizaga, J.; Sáez, K.; Arumí, J.L. Sustainability assessment of the agricultural water footprint in the Cachapoal River basin, Chile. Ecol. Indic. 2019, 98, 19–28. [Google Scholar] [CrossRef]
  11. Zhang, Y.; Yang, P. Agricultural Productive Carrying Capacity Improve and Water Optimal Allocation under Uncertainty Based on Remote Sensing Data in Lancang County, Southwest China. Water 2022, 14, 3641. [Google Scholar] [CrossRef]
  12. Eymen, A. Determination of potentially irrigable agricultural lands using remote sensing and geographic information system: Case study of Yamula Basin. Int. J. Environ. Sci. Technol. 2019, 16, 5101–5106. [Google Scholar] [CrossRef]
  13. Yu, X.; Xie, J.; Jiang, R.; Zuo, G.; Liang, J. Assessment of water resource carrying capacity based on the chicken swarm optimization-projection pursuit model. Arab. J. Geosci. 2020, 13, 39. [Google Scholar] [CrossRef]
  14. Liu, Y.; Yang, R.; Sun, M.; Zhang, L.; Li, X.; Meng, L.; Wang, Y.; Liu, Q. Regional sustainable development strategy based on the coordination between ecology and economy: A case study of Sichuan Province, China. Ecol. Indic. 2021, 134, 108445. [Google Scholar] [CrossRef]
  15. Wang, T.; Jian, S.; Wang, J.; Yan, D. Dynamic interaction of water–economic–social–ecological environment complex system under the framework of water resources carrying capacity. J. Clean. Prod. 2022, 368, e133132. [Google Scholar] [CrossRef]
  16. Tang, J.; Ding, W.; Li, W.; Liu, X. Study on evaluation of water resources carrying capacity and obstacle factors in the yellow river. Basin. Yellow River 2021, 43, 73–77. (In Chinese) [Google Scholar]
  17. Jiang, Z.; Wei, Z. Grassland resource evaluation based on improved bp network model and analytic hierarchy process. J. Intell. Fuzzy Syst. 2021, 40, 7109–7120. [Google Scholar] [CrossRef]
  18. Tan, S.; Liu, Q.; Han, S. Spatial-temporal evolution of coupling relationship between land development intensity and resources environment carrying capacity in China. J. Environ. Manag. 2022, 301, 113778. [Google Scholar] [CrossRef]
  19. Ji, J.; Qu, X.; Zhang, Q.; Tao, J. Predictive analysis of water resource carrying capacity based on system dynamics and improved fuzzy comprehensive evaluation method in Henan Province. Environ. Monit. Assess. 2022, 194, 500. [Google Scholar] [CrossRef]
  20. Gao, S.; Guo, H.; Yu, J. Urban Water Inclusive Sustainability: Evidence from 38 Cities in the Yangtze River Economic Belt in China. Sustainability 2021, 13, 2068. [Google Scholar] [CrossRef]
  21. Wang, D.; Li, Y.; Yang, X.; Zhang, Z.; Gao, S.; Zhou, Q.; Zhuo, Y.; Wen, X.; Guo, Z. Evaluating urban ecological civilization and its obstacle factors based on integrated model of PSR-EVW-TOPSIS: A case study of 13 cities in Jiangsu Province, China. Ecol. Indic. 2021, 133, 108431. [Google Scholar] [CrossRef]
  22. Swirepik, J.L.; Burns, I.C.; Dyer, F.J. Establishing Environmental Water Requirements for the Murray–Darling Basin, Australia’s Largest Developed River System. River Res. Appl. 2016, 32, 1153–1165. [Google Scholar] [CrossRef]
  23. Wu, C.; Zhou, L.; Jin, J.; Ning, S.; Zhang, Z.; Bai, L. Regional water resource carrying capacity evaluation based on multi-dimensional precondition cloud and risk matrix coupling model. Sci. Total Environ. 2020, 710, 136324. [Google Scholar] [CrossRef] [PubMed]
  24. Huang, Z.; Liu, Y.; Qiu, K.; López-Vicente, M.; Shen, W.; Wu, G.-L. Soil-water deficit in deep soil layers results from the planted forest in a semi-arid sandy land: Implications for sustainable agroforestry water management. Agric. Water Manag. 2021, 254, 106985. [Google Scholar] [CrossRef]
  25. Ahmed, Y.N.; Negm, M.M.; Alnafissa, M.; Hefnawy, F. An empirical analysis of irrigation modernization projects using the CGE model. Environ. Dev. Sustain. 2022, 1–18. [Google Scholar] [CrossRef]
  26. Hashemi, M.; Zadeh, H.M.; Arasteh, P.D.; Zarghami, M. Economic and Environmental Impacts of Cropping Pattern Elements Using Systems Dynamics. Civ. Eng. J. 2019, 5, 1020–1032. [Google Scholar] [CrossRef] [Green Version]
  27. Ahilan, S.; Guan, M.; Wright, N.; Sleigh, A.; Allen, D.; Arthur, S.; Haynes, H.; Krivtsov, V. Modelling the long-term suspended sedimentological effects on stormwater pond performance in an urban catchment. J. Hydrol. 2019, 571, 805–818. [Google Scholar] [CrossRef]
  28. Peng, T.; Deng, H. Comprehensive evaluation on water resource carrying capacity based on DPESBR framework: A case study in Guiyang, southwest China. J. Clean. Prod. 2020, 268, 122235. [Google Scholar] [CrossRef]
  29. Zhang, J.; Zhang, C.; Shi, W.; Fu, Y. Quantitative evaluation and optimized utilization of water resources-water environment carrying capacity based on nature-based solutions. J. Hydrol. 2019, 568, 96–107. [Google Scholar] [CrossRef]
  30. Chai, N.; Zhou, W. The DPSIRM-Grey cloud clustering method for evaluating the water environment carrying capacity of Yangtze River economic Belt. Ecol. Indic. 2022, 136, 108722. [Google Scholar] [CrossRef]
  31. Fu, W.Z.; Chu, L.P. Research on the Evaluation of High-Quality Development of Manufacturing Industry from the Perspective of Integration of the Yangtze River Delta—TOPSIS Evaluation Model Based on Improved CRITICAL-Entropy Weight Method. Ind. Technol. Econ. 2020, 39, 145–152. [Google Scholar]
  32. Liu, H.J.; Qiao, L.C.; Sun, S.H. Spatial distribution and dynamic change of water use efficiency in the Yellow River Basin. Resour. Sci. 2020, 42, 57–68. [Google Scholar] [CrossRef]
  33. Yang, W.; Li, D. Spatio-temporal evolution of ecological environment quality in China from a concept of strong sustainability. Environ. Sci. Pollut. Res. 2022, 29, 28769–28787. [Google Scholar] [CrossRef]
  34. Chen, X.; Xu, Q.; Cai, J. Research on the urban water resources carrying capacity by using system dynamics simulation. Hydrol. Res. 2023, 54, 418–434. [Google Scholar] [CrossRef]
  35. He, N.; Li, J.Y.; Zhang, Y.Q. Research on the paths in the formation of collaborative behavior of multi-subject water environmental governance. J. Arid Land Resour. Environ. 2023, 37, 56–63. (In Chinese) [Google Scholar]
Figure 1. Study area.
Sustainability 15 11255 g001
Figure 2. Spatial variations of WRCC in Anhui Province.
Sustainability 15 11255 g002aSustainability 15 11255 g002b
Figure 3. Water resources carrying capacity subsystem composite index.
Sustainability 15 11255 g003
Figure 4. Estimated kernel density of WRCC.
Sustainability 15 11255 g004
Figure 5. Unconditional kernel density and contour map of WRCC.
Sustainability 15 11255 g005
Figure 6. Static kernel density and contour map of WRCC.
Sustainability 15 11255 g006
Figure 7. Dynamic kernel density and contour map of WRCC under first-order spatial lag.
Sustainability 15 11255 g007
Figure 8. Dynamic kernel density and contour map of WRCC under second-order spatial lag.
Sustainability 15 11255 g008
Table 1. Water resources carrying capacity evaluation index system.
Target LayerSystem LayerIndicator LayerPropertiesWeights
Water Resources Carrying CapacityNatureWater resources per capita+0.1162
Water production modulus+0.0571
Annual precipitation+0.0479
Water supply modulus+0.0836
Water consumption per capita0.0374
EconomyWater consumption of 10,000 Yuan GDP0.0206
Tertiary industry share+0.0424
Water consumption of 10,000 Yuan industrial GDP0.0157
GDP per capita+0.0693
Water consumption of 10,000 yuan of agricultural output0.0373
SocialTotal population0.0443
Natural population growth rate0.0189
Domestic water0.0306
Urbanization rate+0.0491
Urban public water0.0285
Wastewater treatment facilities for 10,000 people+0.0688
EnvironmentWan Yuan GDP sewage discharge0.0222
Ecological water+0.0834
Greening coverage of built-up areas+0.0219
Agriculture, forestry, and water account for the proportion of financial+0.0533
Green space per capita+0.0291
Nitrogen fertilizer application per unit of agricultural output0.0221
Table 2. Decomposition of Dagum Gini coefficient of WRCC in Anhui Province.
TimeGini Coefficient
OverallCANASAIntragroupIntergroupHypervariable Density
20030.0520.0250.0340.0390.0120.0350.005
20040.0690.0310.0420.040.0140.0520.004
20050.0530.0250.0310.0330.0110.0390.003
20060.0680.0370.0470.0460.0150.0470.005
20070.0570.0260.0360.0340.0120.0430.002
20080.0780.0270.0360.0490.0140.060.004
20090.0830.0260.0380.0350.0120.0670.004
20100.0970.0310.0380.0510.0150.0810.001
20110.0580.0240.0280.0280.0090.0460.002
20120.0880.020.0270.0620.0150.0720.001
20130.0710.0210.0290.0470.0120.0570.001
20140.080.0270.0260.0480.0130.0670.001
20150.0960.0240.0290.0730.0170.0780
20160.1040.0460.0210.0540.0140.090
20170.0690.0330.0190.0520.0130.0560.001
20180.0610.030.0220.0340.010.050.001
20190.0650.0360.0220.0420.0120.0510.002
20200.0890.0180.0230.0590.0130.0740.002
20210.0530.0350.0270.0230.0090.0410.003
Table 3. Markov transfer matrix.
IIIIIIIV
I0.78950.21050.00000.0000
II0.09210.67110.23680.0000
III0.00000.05560.68060.2639
IV0.00000.00000.10940.8906
Table 4. Spatial Markov transfer matrix.
A = 1WRCC Grade in Adjacent AreasIIIIIIIV
II0.88890.11110.00000.0000
II0.05880.82350.11760.0000
III0.00000.25000.75000.0000
IV0.00000.00000.00000.0000
III0.64520.35480.00000.0000
II0.15000.70000.15000.0000
III0.00000.00000.76920.2308
IV0.00000.00000.00001.0000
IIII0.00000.00000.00000.0000
II0.00000.47370.52630.0000
III0.00000.06980.67440.2558
IV0.00000.00000.12500.8750
IVI0.00000.00000.00000.0000
II0.00000.00000.00000.0000
III0.00000.00000.58330.4167
IV0.00000.00000.10640.8936
Disclaimer/Publisher’s Note: The statements, opinions and data contained in all publications are solely those of the individual author(s) and contributor(s) and not of MDPI and/or the editor(s). MDPI and/or the editor(s) disclaim responsibility for any injury to people or property resulting from any ideas, methods, instructions or products referred to in the content.

