Article

Numerical Investigation of the Effects of Stress Heterogeneity on the Propagation Behaviors of Hydraulic Fractures in a Shale Oil Reservoir

1
State Key Laboratory of Shale Oil and Gas Enrichment Mechanisms and Effective Development, Beijing 102206, China
2
Sinopec Research Institute of Petroleum Engineering Co., Ltd., Beijing 102206, China
3
Geological Research Institute of CNPC Logging Company Limited, Xi’an 710000, China
4
Petroleum and Gas Engineering, School of Petroleum Engineering, China University of Petroleum (Beijing), Beijing 102249, China
5
Beijing Gas Group Co., Ltd., Beijing 100034, China
6
Beijing Gas Energy Development Co., Ltd., Beijing 100012, China
*
Authors to whom correspondence should be addressed.
Sustainability 2023, 15(14), 11209; https://doi.org/10.3390/su151411209
Submission received: 28 March 2023 / Revised: 16 May 2023 / Accepted: 9 June 2023 / Published: 18 July 2023

Abstract

:
Minimum principal stress is a key factor governing the hydraulic fracturing behaviors in shale oil reservoirs. Due to the existence of stress heterogeneity, the hydraulic fracture growth and footprints can be affected, and the hydraulic fracturing efficacy can be consequently altered. This phenomenon is especially common during the development of shale oil reservoirs associated with continental sedimentary facies. This study uses a numerical workflow to analyze the effect of stress heterogeneity on hydraulic fracture growth. The numerical workflow consists of an open-source planar hydraulic fracturing model and a derived coupled flow and geomechanics model, which can address the effect of minimum principal stress heterogeneity on hydraulic fracturing. Two types of stress heterogeneity are considered: stress heterogeneity caused by legacy production in the horizontal direction and stress heterogeneity caused by high-stress interlayers in the vertical direction. Simulation results indicate that stress heterogeneity in the horizontal and vertical directions leads to asymmetric fracture growth horizontally and vertically. The corresponding fracture footprints and widths also become asymmetric accordingly. Thin interlayers cannot fully limit the fracture growth, and the fracture height growth can still penetrate through. When the high-stress interlayers are thick enough, the fracture cannot penetrate through them vertically, while the corresponding fracture growth is no longer highly sensitive to the thickness of the interlayer.

1. Introduction

The successful development of shale oil reservoirs in many fields around the world has demonstrated that the use of hydraulic fracturing techniques can help to improve production efficiency [1,2,3]. The successful and efficient establishment of hydraulic fracture networks in shale reservoirs is the key to commercial and sustained hydrocarbon productivity [4]. If the fracturing design is not carefully optimized, unwanted fracture networks can be obtained, and the resultant production performance can be limited [5,6]. Shale oil reservoirs are usually associated with marine facies and continental facies [7,8]. During the development of shale oil reservoirs associated with continental facies, it is sometimes more difficult to obtain economic production due to the existence of thin interlayers. These thin interlayers are usually characterized by stress heterogeneities that impact the growth of hydraulic fractures, especially in the vertical direction, and limit the depletion in hydrocarbon-bearing layers [9]. Multiple wells and multi-stage fracturing are often used in such reservoirs to improve productivity. To optimize this process, it is important to understand the interaction between hydraulic fractures and stress heterogeneities in the reservoir.
The existence of bedding layers and interlayers in shale reservoirs introduces heterogeneities and largely affects the propagation behaviors of hydraulic fractures [10,11,12,13,14]. Based on a finite element simulation using F-RFPA, it is suggested that the initiation, propagation, roughness, and breakdown pressure are all largely affected by the existence of heterogeneities [15]. Oparin et al. [16] analyzed the varying breakdown pressure in multiple stress regimes and indicated that the use of open-hole logs and uniaxial compressive strength data helped to understand the stress heterogeneity in a Saudi Arabian case study. In an analysis of hydraulic fracturing growth in a lacustrine shale oil reservoir where stress heterogeneity is strong, the brittleness index and the b-value are considered key parameters controlling fracture length and the complexity of the geometry of fracture networks [17]. They also presented another study [18] where a 3D model was implemented, and the interface opening and fracture height containment effects were quantified. They indicated that there is an interfacial sliding distance caused by the horizontal interface. Stress heterogeneities are associated with the presence of faults, and stiff interlayers can restrict the growth of hydraulic fractures as these layers have more intense stress [19]. Zia and Lecampion [20] proposed a planar 3D hydraulic fracture simulator. It solves the growth of fluid-driven fractures, and the effect of fracture containment implemented by interlayers’ stress heterogeneity is fully considered. Li et al. [10] and Li and Wu [11] presented a model for fracture height growth honoring the effect of bedding layers in shale formations, and they quantified the shear slippage effect on height growth speed. In an experimental investigation, the hydraulic fracture propagation patterns in interbedded rock samples were analyzed. Three patterns of hydraulic fracture initiation and propagation in the interbedded heterogeneity are identified, and fractures initiated in sandstone layers are more likely to penetrate through the interfaces; the transitions zones in layered formations can limit the height growth of fractures [21,22]. Chang and Hou [23] investigated the fracture propagation behaviors in a continental shale oil reservoir in northwestern China where the effects of interlayers and heterogeneous in situ stress cannot be ignored. A 1 MPa stress difference can lead to extended fracture height growth near the perforation cluster, while stress differences of 3 MPa and 5 MPa strictly contain the fracture height within certain layers. Chen et al. [24] and Ren et al. [25] both emphasized the importance of using well logs in the determination of optimum perforation locations. They indicated that the integration of geology, geomechanics, and fracture modeling can improve the efficacy of well completion in interlayered payzones. In glutenite formations with strong heterogeneity and lithology variability, Huang et al. [26] concluded that the negative effect of heterogeneity on fracture propagation in formations with large gravels and low gravel strengths is limited.
Except for stress heterogeneities caused by interlayers and stiff layers, stress heterogeneities can also be caused by the poromechanical behaviors in the reservoir due to depletion and injection of fluids through wellbores. Fluid injection and production are very common in the development of hydrocarbon-bearing layers [27]. Based on poromechanics, pore pressure changes can lead to complex geomechanical responses, such as displacement and changes in normal and shear stresses [28]. As a result, fluid injection and production associated with petroleum engineering lead to stress heterogeneities as well [29,30,31,32], and this type of dynamic stress evolution during the exploitation of hydrocarbons is also investigated in the literature. Several coupling methods for the porous media flow problem and the geomechanics problem are compared, and it is noted that the full coupling method can preserve numerical accuracy and stability [33]. Roussel et al. [34] quantified the heterogeneous stress distribution caused by horizontal well depletion and proved that depletion-induced stress heterogeneities can alter the growth patterns of hydraulic fractures. Safari et al. [35] further presented a workflow to calculate the stress alterations caused by poromechanics, and they indicated that the resultant curved hydraulic fracture paths can be controlled or mitigated by adjusting the operation schedules in the horizontal wells. Effects of rock mechanical properties and depletion volume on the heterogenous stress evolution in the reservoir are also quantified in a series of studies, and it is found that it is possible for the total stress to increase in the early stage even when there is strong pressure depletion, and loading fluids in produced wells can help to mitigate the stress heterogeneity caused by poromechanical effects [36].
Since the stress heterogeneity caused by the existence of interlayers and depletion/injection-induced geomechanical behaviors has impacts on the hydraulic fracturing paths and geometries, it is meaningful to carry out a qualitative analysis of these effects on hydraulic fracture propagation patterns. In this study, a numerical workflow is implemented for a typical shale oil reservoir associated with continental facies, where an open-source 3D planar fracture simulator PyFrac and a derived finite element model for coupled flow and geomechanics are involved. The effects of interlayers and the production of neighboring wells are specifically analyzed. This study provides a reference for hydraulic fracturing designs in the fields, especially in shale oil reservoirs characterized by thin interlayers and multiple-well development.

2. Methodology

In this study, a numerical workflow is employed. The workflow consists of two sections: an open-source planar fracture simulator and a derived finite element model for coupled flow and geomechanics. Specifically, the open-source planar fracture simulator is from Zia and Lecampion [20], where a typical linear elastic hydraulic fracture problem for a 3D planar fracture is considered, and the coupled flow and geomechanics model considers single-phase porous media flow and linear elasticity. The workflow is based on elasticity and poroelasticity.
The methodology of hydraulic fracturing modeling is based on an existing open-source simulation package based on Python. The fracture surfaces are governed by traction-separation-based criteria, and the opening and sliding behaviors can be quantified. Relevant parameters include fluid pressure, viscosity, rock strength, and permeability. The model solves the governing equations iteratively, and modeling parameters are changed as the fracture propagates through the rock.
The planar hydraulic fracture simulator solves the elastic deformation and the opening model fracture under quasi-static momentum balance. The fracture width or the normal displacement discontinuity is solved. A typical lubrication approximation for the fluid flow inside the fracture is used in the simulator, where a slightly compressible fluid is considered. The leak-off effect is described by Carter’s model. The numerical solution to the model is based on the implicit level set algorithm [20,37,38].
In the fracture model, based on the derivation from Zia and Lecampion [37], the evolution of the area of a planar fracture in a homogeneous and isotropic material can be represented as:
T x , y , t σ 0 x , y = E 8 π A ( t )   w ( x , y , t ) d A ( x , y ) x x 2 + y y 2 3 / 2
where T and σ 0 are the normal components of the traction and the far-field compressive stress. The fracture opening of w is non-negative. Intrinsic fracture roughness is also used in the fracture criterion. The contact conditions of w w a > 0 and T p ( w w a ) > 0 jointly govern whether the fracture is mechanically open.
The fluid flow within the fracture is described by mass conservation and the lubrication approximation:
w t + c f w p t + · q + v L = Q ( x , y ) δ ( x , y )
where v L and q are the fluid velocity for the leaking out and the fluid flux in the fracture, respectively. The leak-off velocity can then be written as:
v L = 2 C L ( x , y ) t t 0 ( x , y )
In the equation above, C L is the widely used term for Carter’s leak-off coefficient, and it is related to the properties of the fracturing fluid and the rock.
The coupled flow and geomechanics model for the modeling of fluid injection/production-induced stress heterogeneity is achieved through a typical poroelastic assumption [27,39]. A single-phase fluid is considered in this problem. The mass balance and fluid flow diffusivity are written as:
( ϕ ρ ) t + · ( ρ u ) = s
where ϕ represents the porosity; ρ represents the density; t represents the time during injection or production; u is the flow velocity; and s is the sink and source term, where the sink indicates production and the source indicates injection of fluid.
Since the fluid flow in the porous media is slow, it can be approximated as Darcy’s flow [40]:
u = k μ ( p + ρ g )
where k represents the permeability and μ represents the viscosity, and the entire term represents mobility; p is the fluid pressure in the porous media. g represents the effect of gravity.
Similar to the fluid flow model in the fracture in the fracture simulator, a slightly compressible fluid assumption is also used. Compressibility is written as:
c = 1 ρ ρ p
The poroelastic theory is employed to couple the fluid flow problem and the geomechanical problem. The momentum balance equation is written as:
· σ = 0
where σ represents the stress tensor. The total stress term considers pore pressure, Biot’s coefficient, and effective stress.
The planar 3D fracture model has been validated with the penny-shaped fracture propagation in a homogeneous medium and with the analytical PKN solutions [20]. The coupled flow and geomechanical model have been validated with Mandel’s problem and McNamee-Gibson’s problem. The simulation results are matched against the two analytical solutions to the pressure changes induced by solid deformation [39].

3. Results and Discussion

In this section, the effect of stress heterogeneity on the fracture propagation behaviors is numerically analyzed in a synthetic shale oil reservoir, and the types of stress heterogeneity considered in this study include the heterogeneity caused by the coupled flow and geomechanical behaviors and the one caused by the existence of interlayers.
Simulation cases are designed based on realistic scenarios in a continental shale reservoir in eastern China. The target layers are characterized by significant stress contrasts and strong interlayering. Multiple payzones are located within a depth range of 200 m, indicating that thin payzones and interlayers are significantly stacked. In such cases, the placement of perforation clusters should be carefully determined since it directly affects whether the stimulated fractures can vertically penetrate through interlayers containing the perforated layer. Additionally, legacy production-induced stress heterogeneities also have an impact on newly stimulated hydraulic fractures.
Two sets of simulation scenarios are considered in the numerical analysis. In the first case, the effect of depletion-induced heterogeneities is quantified. This case is focused on the variation and heterogeneity in the horizontal direction. The original stress field is strictly uniform, and the heterogeneity is caused by the depletion of a nearby producing well. After the depletion-induced stress heterogeneity is established, the hydraulic fracture propagation process in a new location is studied. In the problem setup, the depletion location is 25 m outside the right boundary, and the new hydraulic fracture initiation location is at the center of the domain. The distance is, therefore, 50 m between the new fracture initiation and the legacy production. In this problem, although the stress field is horizontally heterogeneous due to depletion effects, other rock mechanical and rock physical parameters are uniform. These parameters include permeability, porosity, Young’s modulus, Poisson’s ratio, and density of the formation rock. In the second case, the stress heterogeneity in the vertical direction is studied. In this case, the heterogeneity is no longer caused by depletion. It is caused by the presence of an interlayer with a stress magnitude other than the rest of the domain. Its presence can contain the height growth and lead to heterogeneous propagation profiles. In this case, the hydraulic fracture is initiated at the center of the domain. A certain thickness is assigned to the interlayer. Uniform modeling parameters are assigned to the interlayer and to the rest of the domain. Figure 1 shows the setup of the two problems.

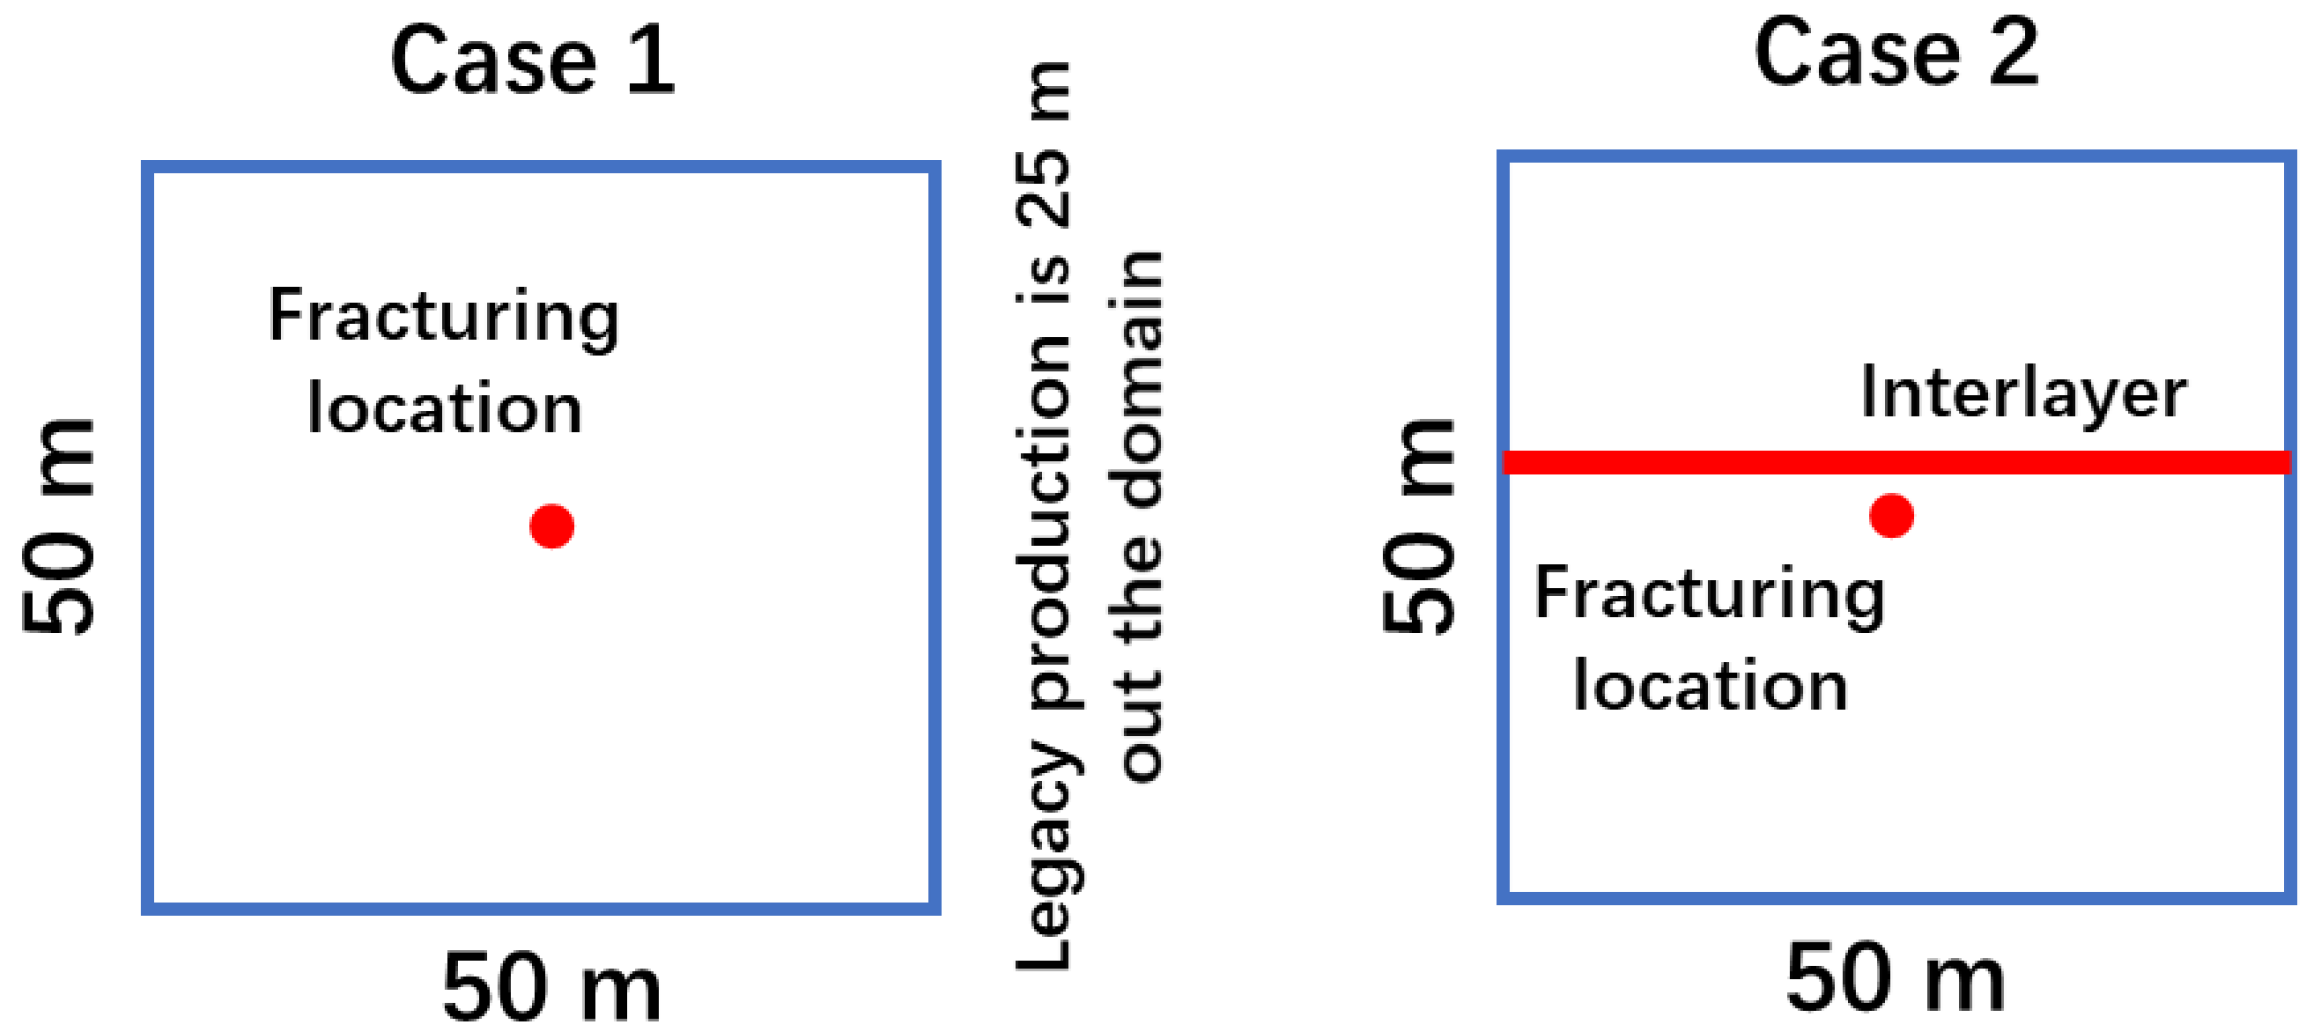
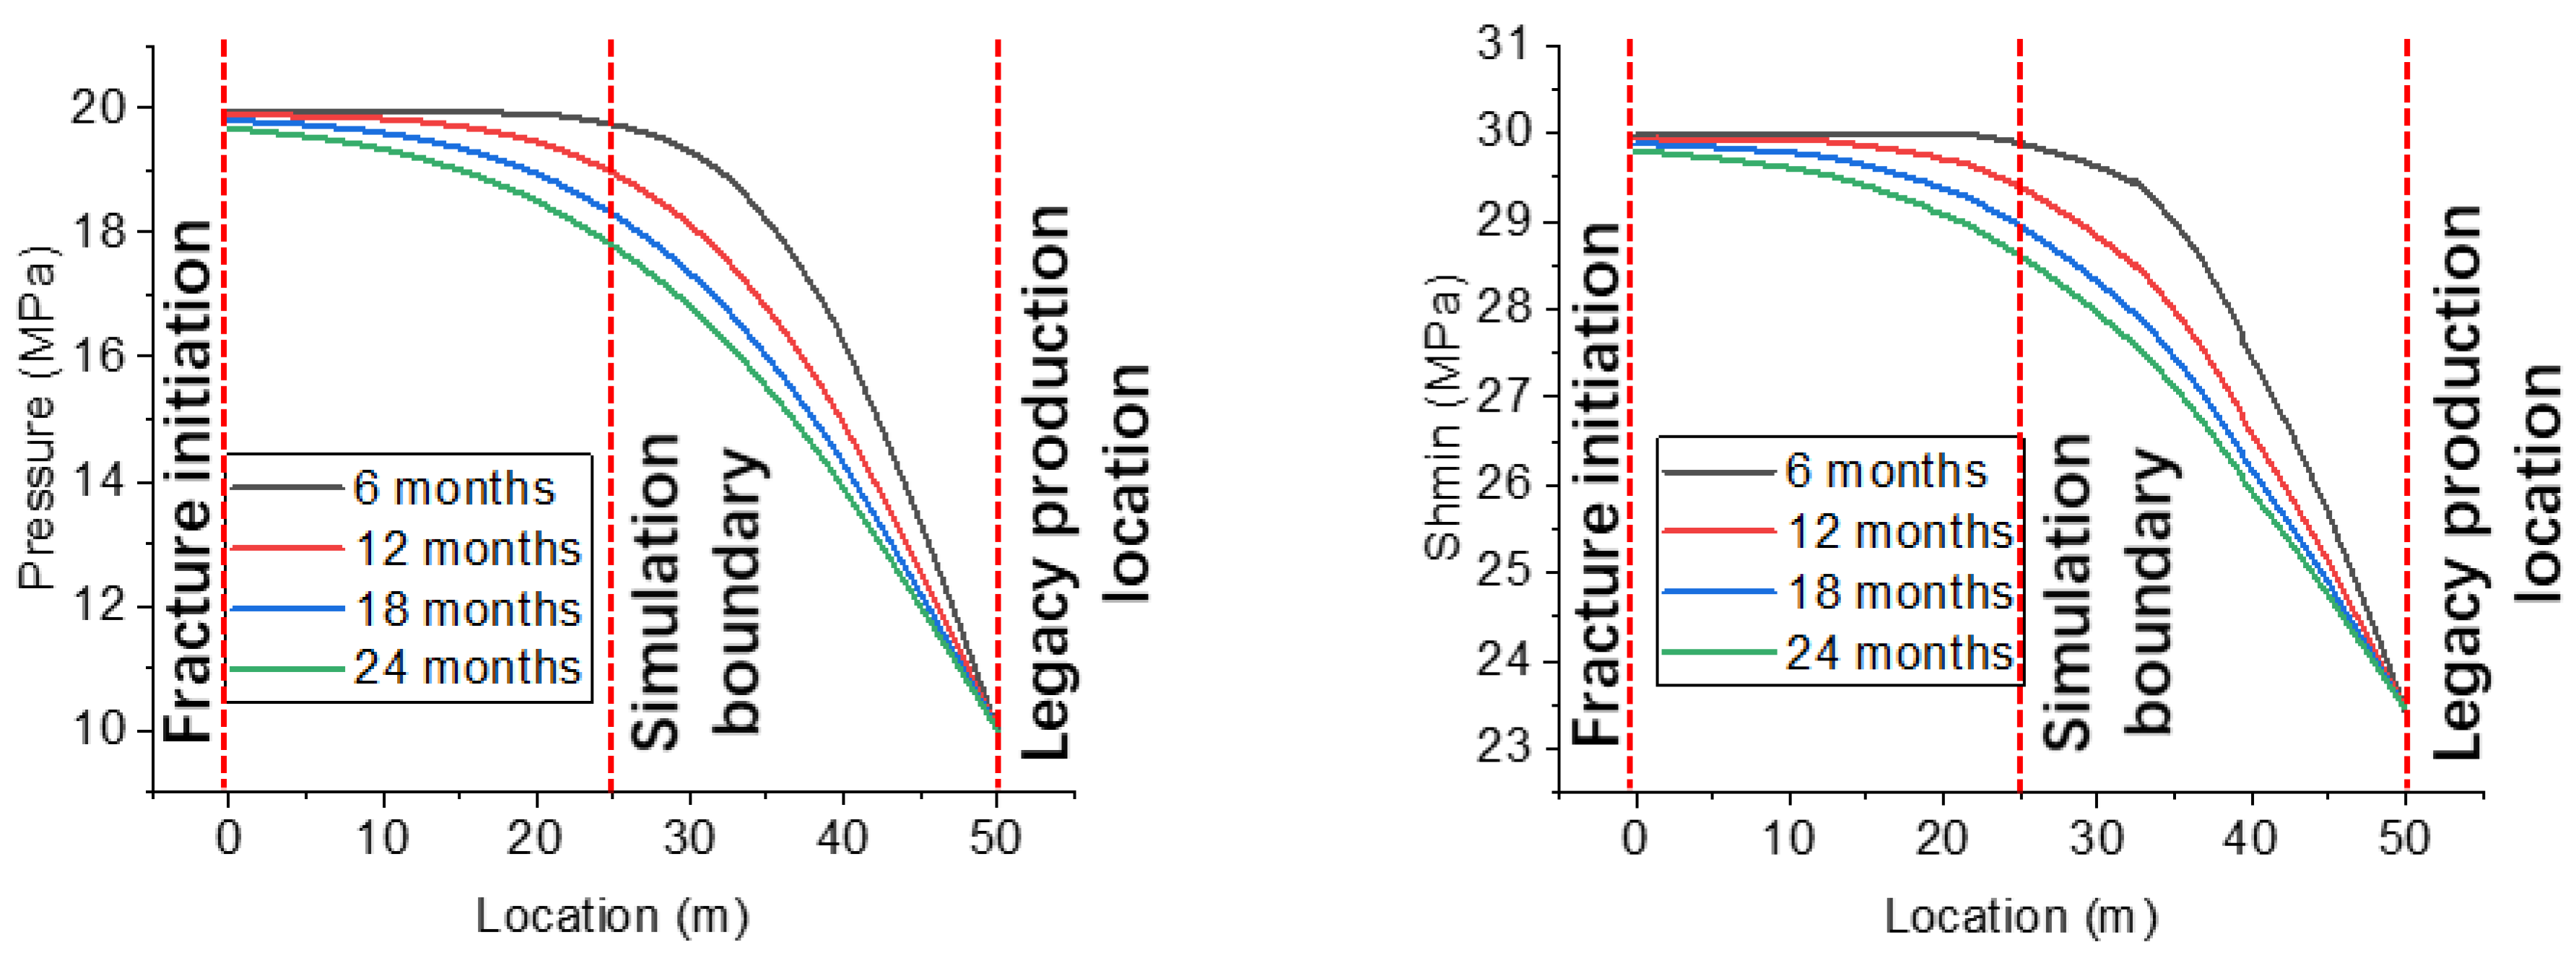
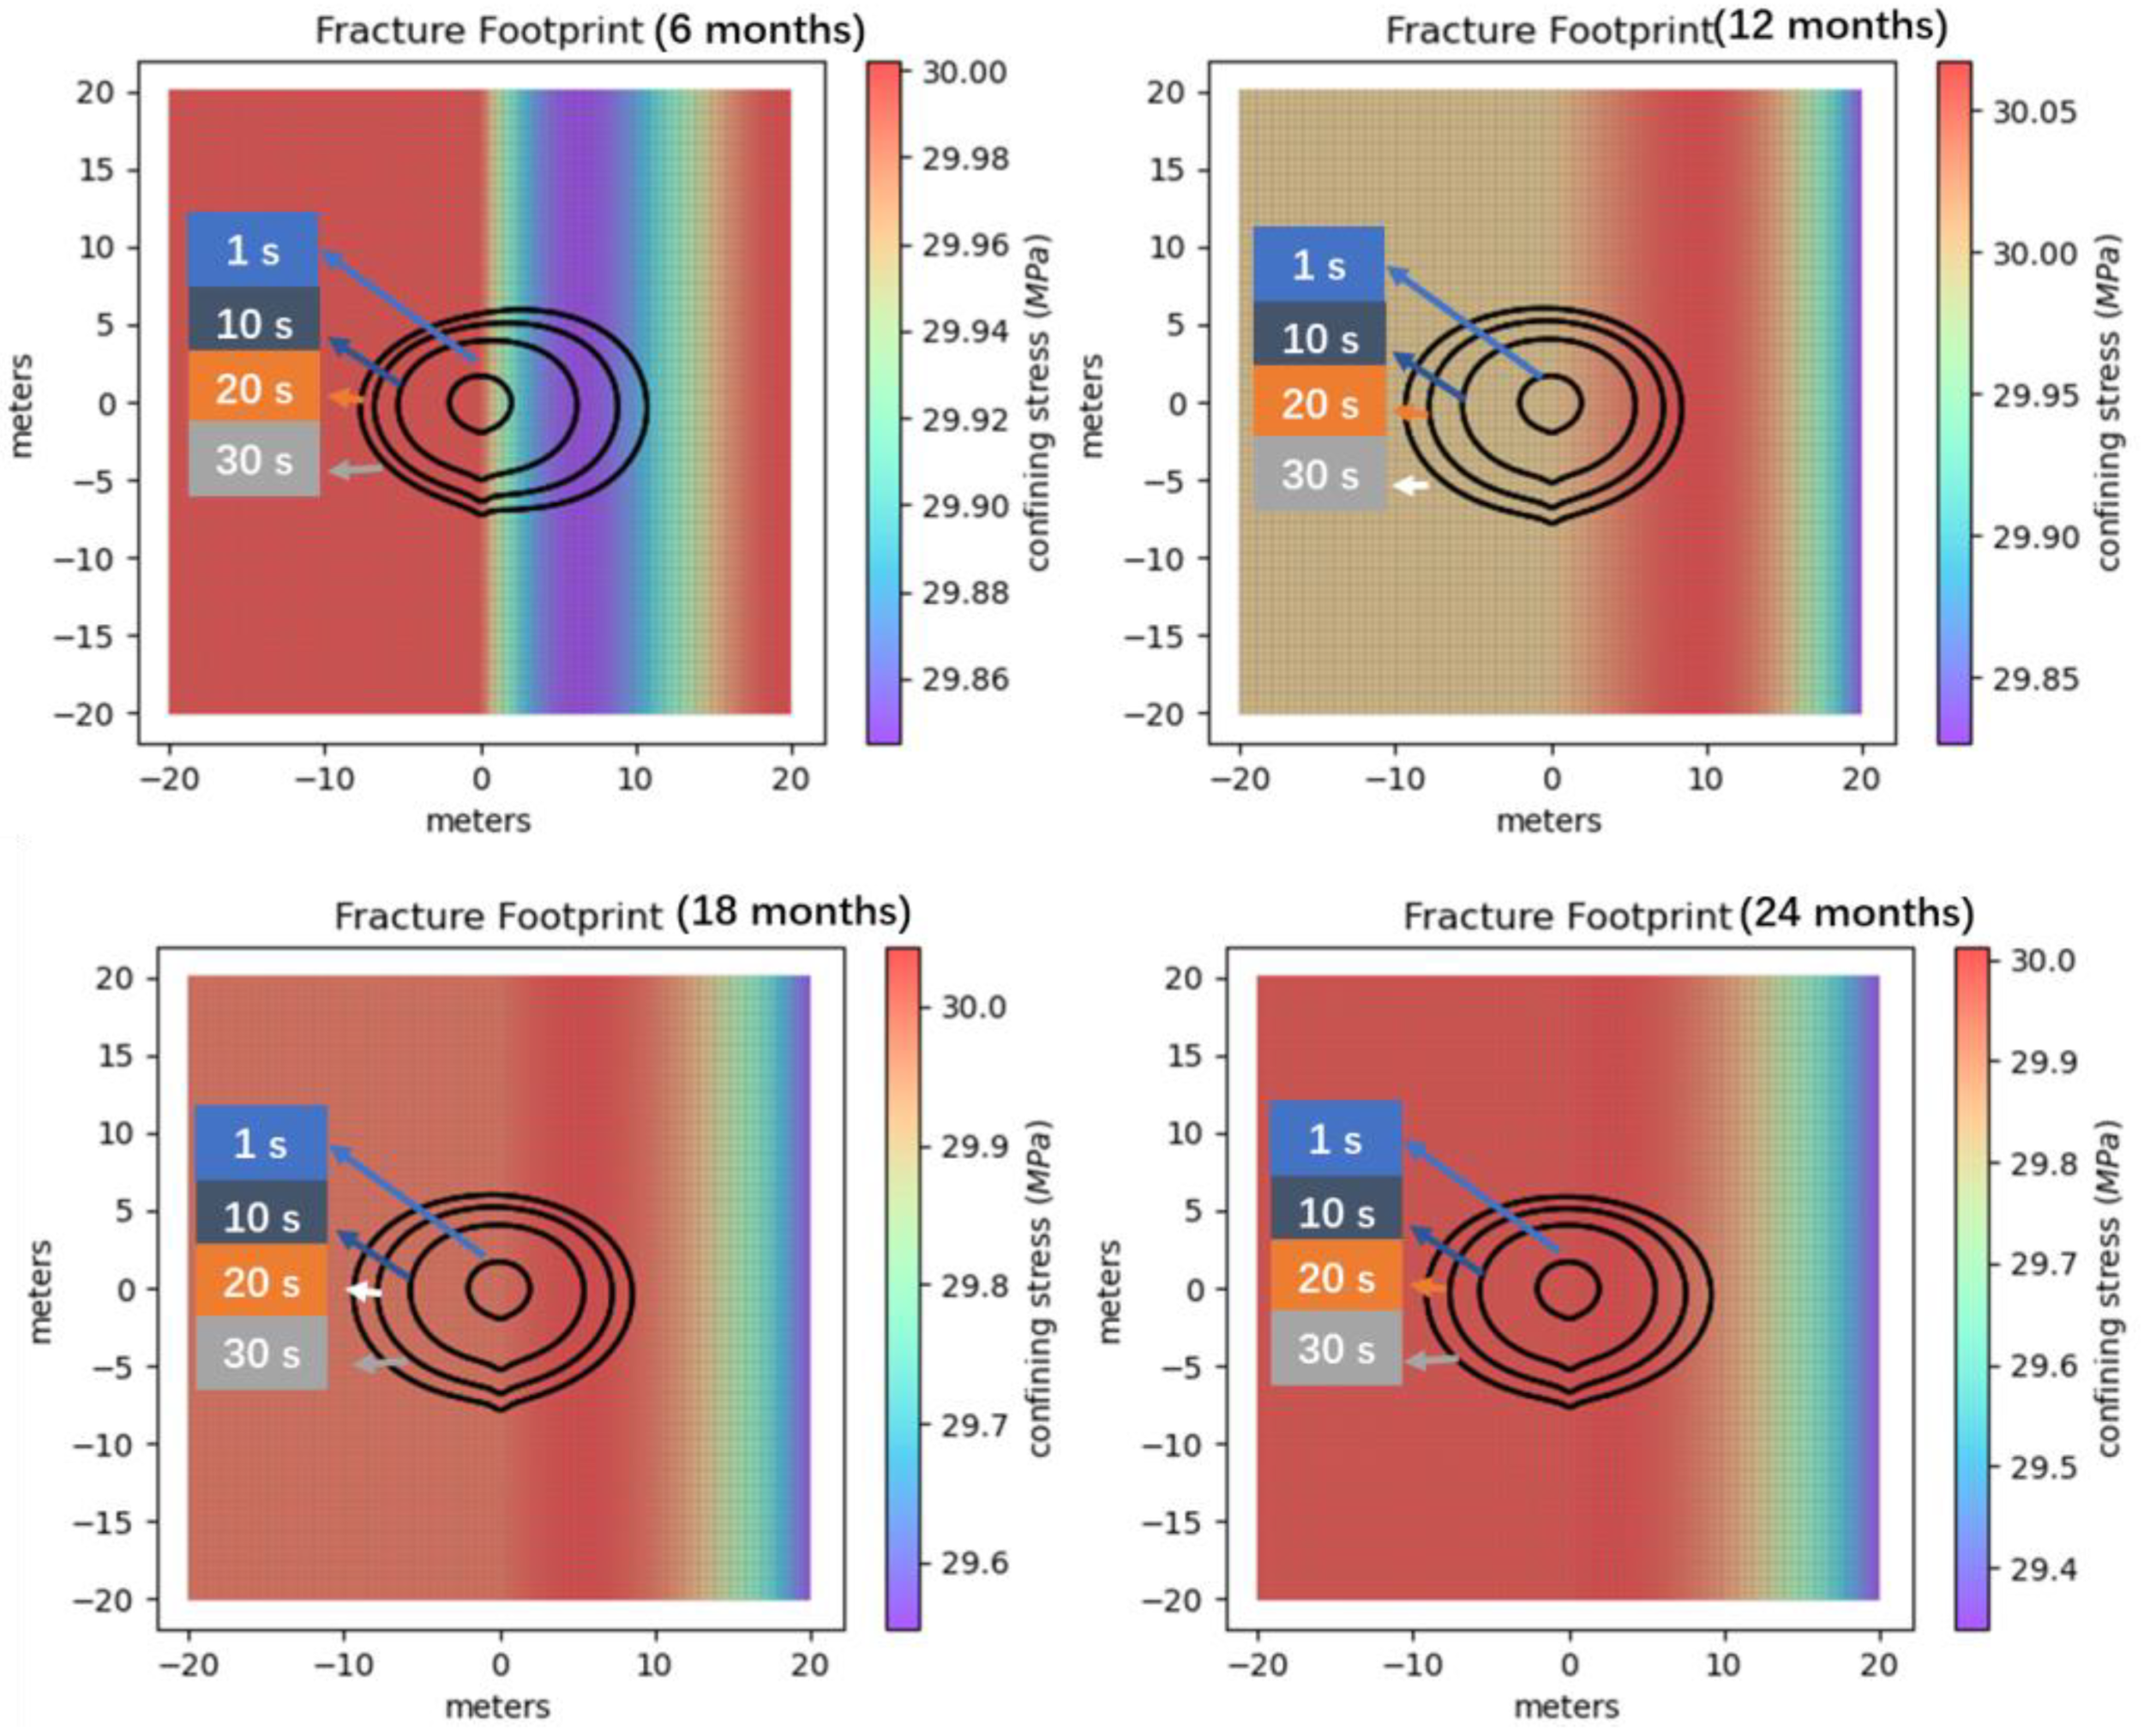
3.1. Effects of Stress Heterogeneity Caused by Coupled Flow and Geomechanics

Legacy production can alter the stress field. As a result, the value of the minimum horizontal stress can be affected, and stress heterogeneity is induced. Fracture propagation from new wells is consequently affected. In this study, the legacy production in a horizontal well and its induced coupled flow and geomechanics response in the reservoir are simulated. Then, hydraulic fracturing in a new well 50 m away in the same layer is simulated. Thus, the effect of stress heterogeneity caused by parent well production can be quantified.
The simulation parameters are in Table 1. The permeability is 0.05 mD, and the porosity is 8%. The initial pressure in the reservoir is 20 MPa, and the bottom hole pressure during the legacy production in the old well is 10 MPa. The Young’s modulus of the rock is 27 GPa, and the Poisson’s ratio is 0.25. The density of the rock is 2600 kg/m3. The minimum horizontal principal stress is 30 MPa, and the maximum horizontal principal stress is 35 MPa. Figure 2 records the pressure drops and stress changes in the reservoir during 24 months of legacy production in the old horizontal well. The stress changes presented here are the minimum horizontal principal stress, as it is a key factor governing the propagation behaviors of hydraulic fractures. The results indicate that the pressure drop is largely affected by the production time. Two years of production largely depletes the reservoir. It is also noticed that the left boundary (x = 0 m) is not significantly affected by the old well production 50 m away. Comparatively, it is noted that the distribution of the minimum horizontal principal stress has similar patterns. This is because the pressure distribution is highly correlated with the total stress distribution, and the magnitude of effective stress changes is not as significant as the magnitude of pressure decreases. Based on the numerical results, it can be deduced that when a new fracture starts to propagate from the left boundary of the domain, the minimum principal stress governing the opening fracture of the rock changes as the fracture propagates, and the resultant fracture geometry is affected. Since the early-stage depletion causes effective stress increases in reservoir areas not significantly depleted, the area near the left boundary can endure slight increases in total stress. This phenomenon can also lead to the asymmetric propagation of the two wings of a newly propagated fracture.
After the calculation of the pore pressure profiles and the minimum horizontal principal stress, hydraulic fracture propagation from the new well is considered. The 3D planar fracture growth is obtained by the hydraulic fracturing simulator.
The fracture propagation behaviors at four different depletion stages (6 months, 12 months, 18 months, and 24 months) are investigated. Thus, the relationship between the stress heterogeneity caused by legacy production and the new well hydraulic fracturing can be quantified. In the simulation of the hydraulic fracture growth, the rock’s mechanical properties are the same as the modeling of the coupled flow and geomechanics process. A plane strain consideration is employed in the modeling process. The minimum horizontal principal stress distributions are obtained from the previous coupled flow and geomechanics simulation. A constant pumping rate of 0.002 m3/s is used.
In Figure 3, the fracture footprints after 1 s, 10 s, 20 s, and 30 s of fracturing are plotted at four distinct time steps. Note that, compared to Figure 2, only the 0~25 m section is considered, and the legacy production location in Figure 2 is not included in the fracture simulation domain in Figure 3. They are 6 months, 12 months, 18 months, and 24 months of legacy production in a neighboring well. The vertical coordinates on the right represent the confining stress values in the domain. The results indicate that the stress heterogeneity introduced by the legacy production leads to asymmetric fracture geometries. The half-lengths of the left wings are not identical to the right wings. Although the initial fractures are elliptical, the heterogeneous stress field affects the propagation of fractures, and fracture footprints are not elliptical during the fracture growth. The minimum stress is not strictly monotonically changing as the depletion is not significant near the new fracturing location. In the results for 12 months and 18 months of legacy production, the fractures on the right wings are actually inhibited by the increased stress near the new fracturing location. This is because the legacy production from the location 50 m away has not induced significant depletion at the new fracturing location while deformation is already accumulated. This effect is not observed in the results after 6 months and 24 months of legacy production since more monotonically decreasing patterns for the minimum stress are obtained in these two cases.
Figure 4 shows the width of the fractures after 6 months of legacy production. In this figure, the contour plot is the fracture profile with fracture width marked with different colors. The dotted curves are fracture width values along the horizontal line at four different fracture propagation times. The fracture width from the top view and the width profiles along the line y = 0 m at 1 s, 10 s, 20 s, and 30 s are also shown. During the simulation, the maximum width reaches 0.46 mm. At the beginning of fracture propagation, the profile of the fracture width is relatively symmetric. At fracturing time steps of 10 s, 20 s, and 30 s, the width profiles become more asymmetric due to the effect of stress heterogeneity. At 30 s, the maximum width is no longer located at the center of the domain. The maximum width location moves to the right as there is a decrease in S h m i n . It is also observed that the width increases are more drastic in the right wings. The contour plot in Figure 4 shows the fracture width distribution obtained by the 30 s fracturing. The boundary of the fracture footprint has relatively small widths, while the central area of the fracture has greater widths.
Figure 5 shows the fracture width profiles for the hydraulic fracturing behavior after 12 months of legacy production at a neighboring location. Due to the increase in the minimum principal stress in the right half of the domain, it can be noted that the fracture widths on the right are generally narrower than those on the left. Higher minimum stress makes it more difficult to propagate, and the resultant fracture widths are reduced. The difference between the fracture width results in Figure 4 and Figure 5 is in accordance with the results in Figure 3. This comparison shows that the wings with longer half-lengths tend to have greater widths. The maximum width location at the last time step is on the left due to the effect of stress heterogeneity. The fracture width results obtained after 18 months of legacy production are shown in Figure 6. Similar to the results for fracturing after 12 months of legacy production, the minimum principal stress here is also slightly increased on the right due to the coupled flow and geomechanical effect. Therefore, the half-lengths and fracture widths for the left wings are greater than the right wings. The fracture width profiles obtained after 24 months of legacy production are shown in Figure 7. After 24 months of legacy production, the effect of pressure depletion becomes more significant, and the total stress increase caused by the compressive effective stress increases is no longer significant at the fracture paths of the right wings of the fractures. The maximum width occurs in the left half of the domain, indicating that the effect of total stress increase still exists while its magnitude is no longer significant.
Based on the fracture footprint results and the fracture width profiles, it is noted that the minimum stress values in the right half of the domain oscillate with legacy production time. The maximum width occurs in the right domain for the 6-month legacy production scenario, while it occurs in the left domain for the other three scenarios.
The temporal changes in the minor axis and major axis lengths of the fractures propagated in different minimum principal stress scenarios are compared in Figure 8. The changes in the minor axis represent the height of the fracture footprint versus fracturing time. It focuses on the temporal change in the footprint in the minor axis. The minor axis of the fractures (in the y direction) evolves in 30 s of hydraulic fracturing. In general, the fracture propagates faster in the early stage and slower later on, and this is indicated by the change in the slope of the curves.

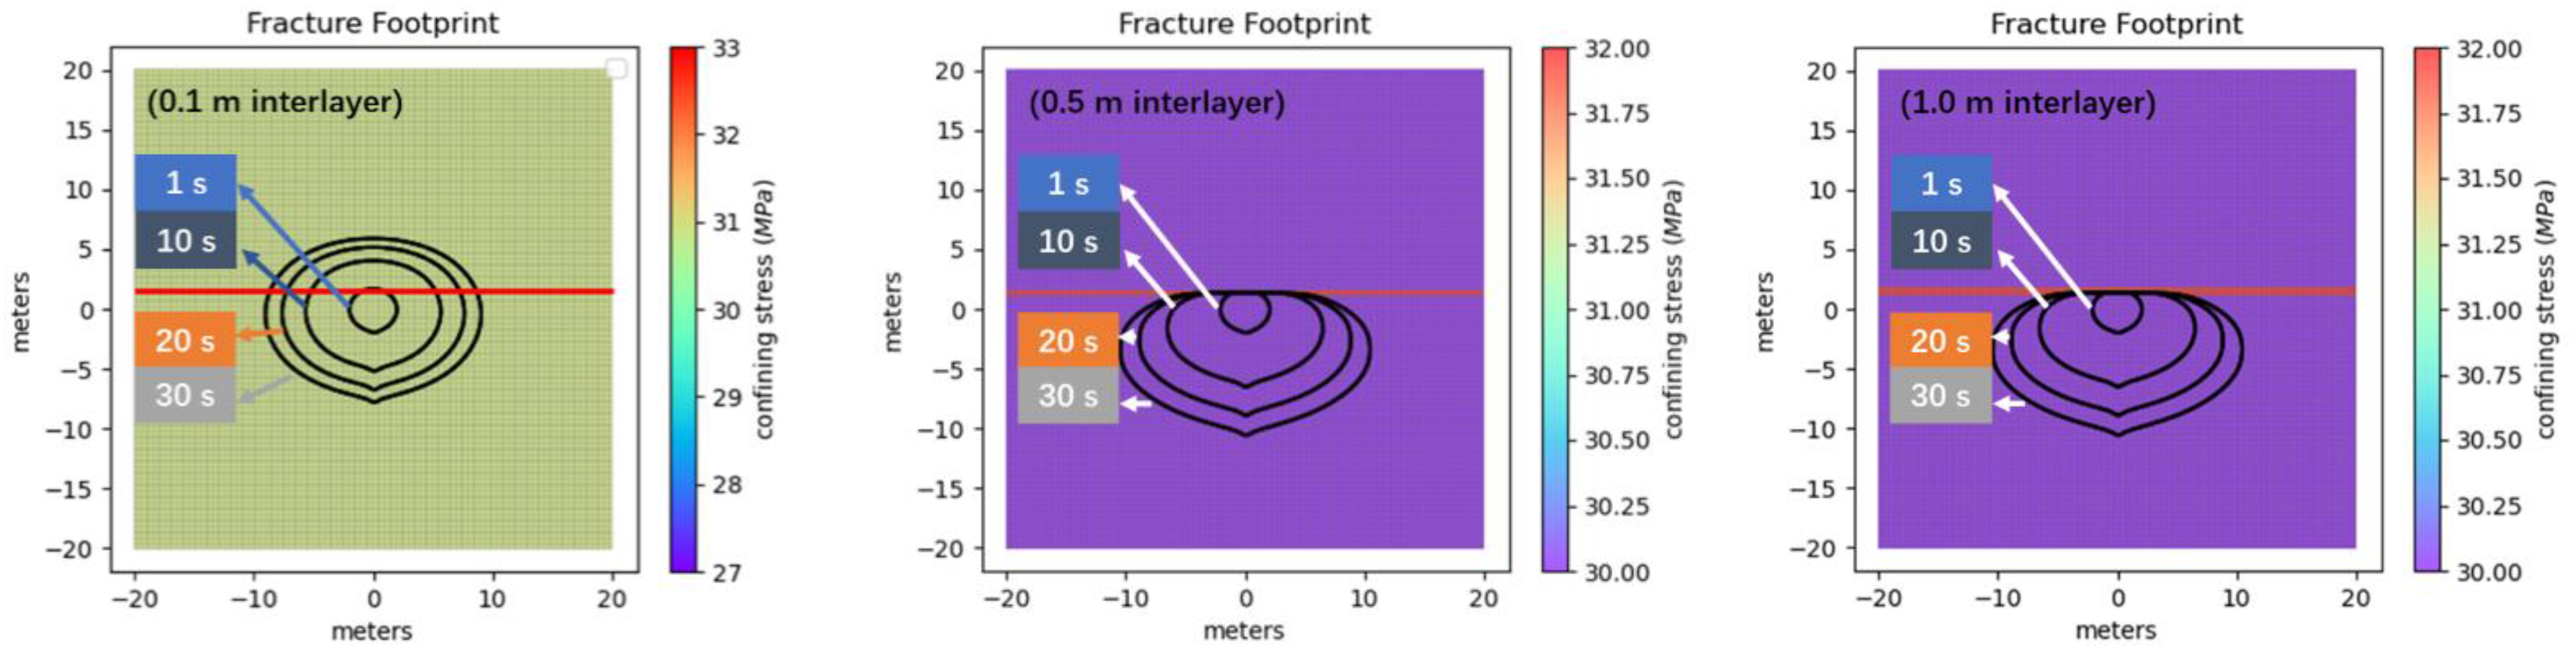
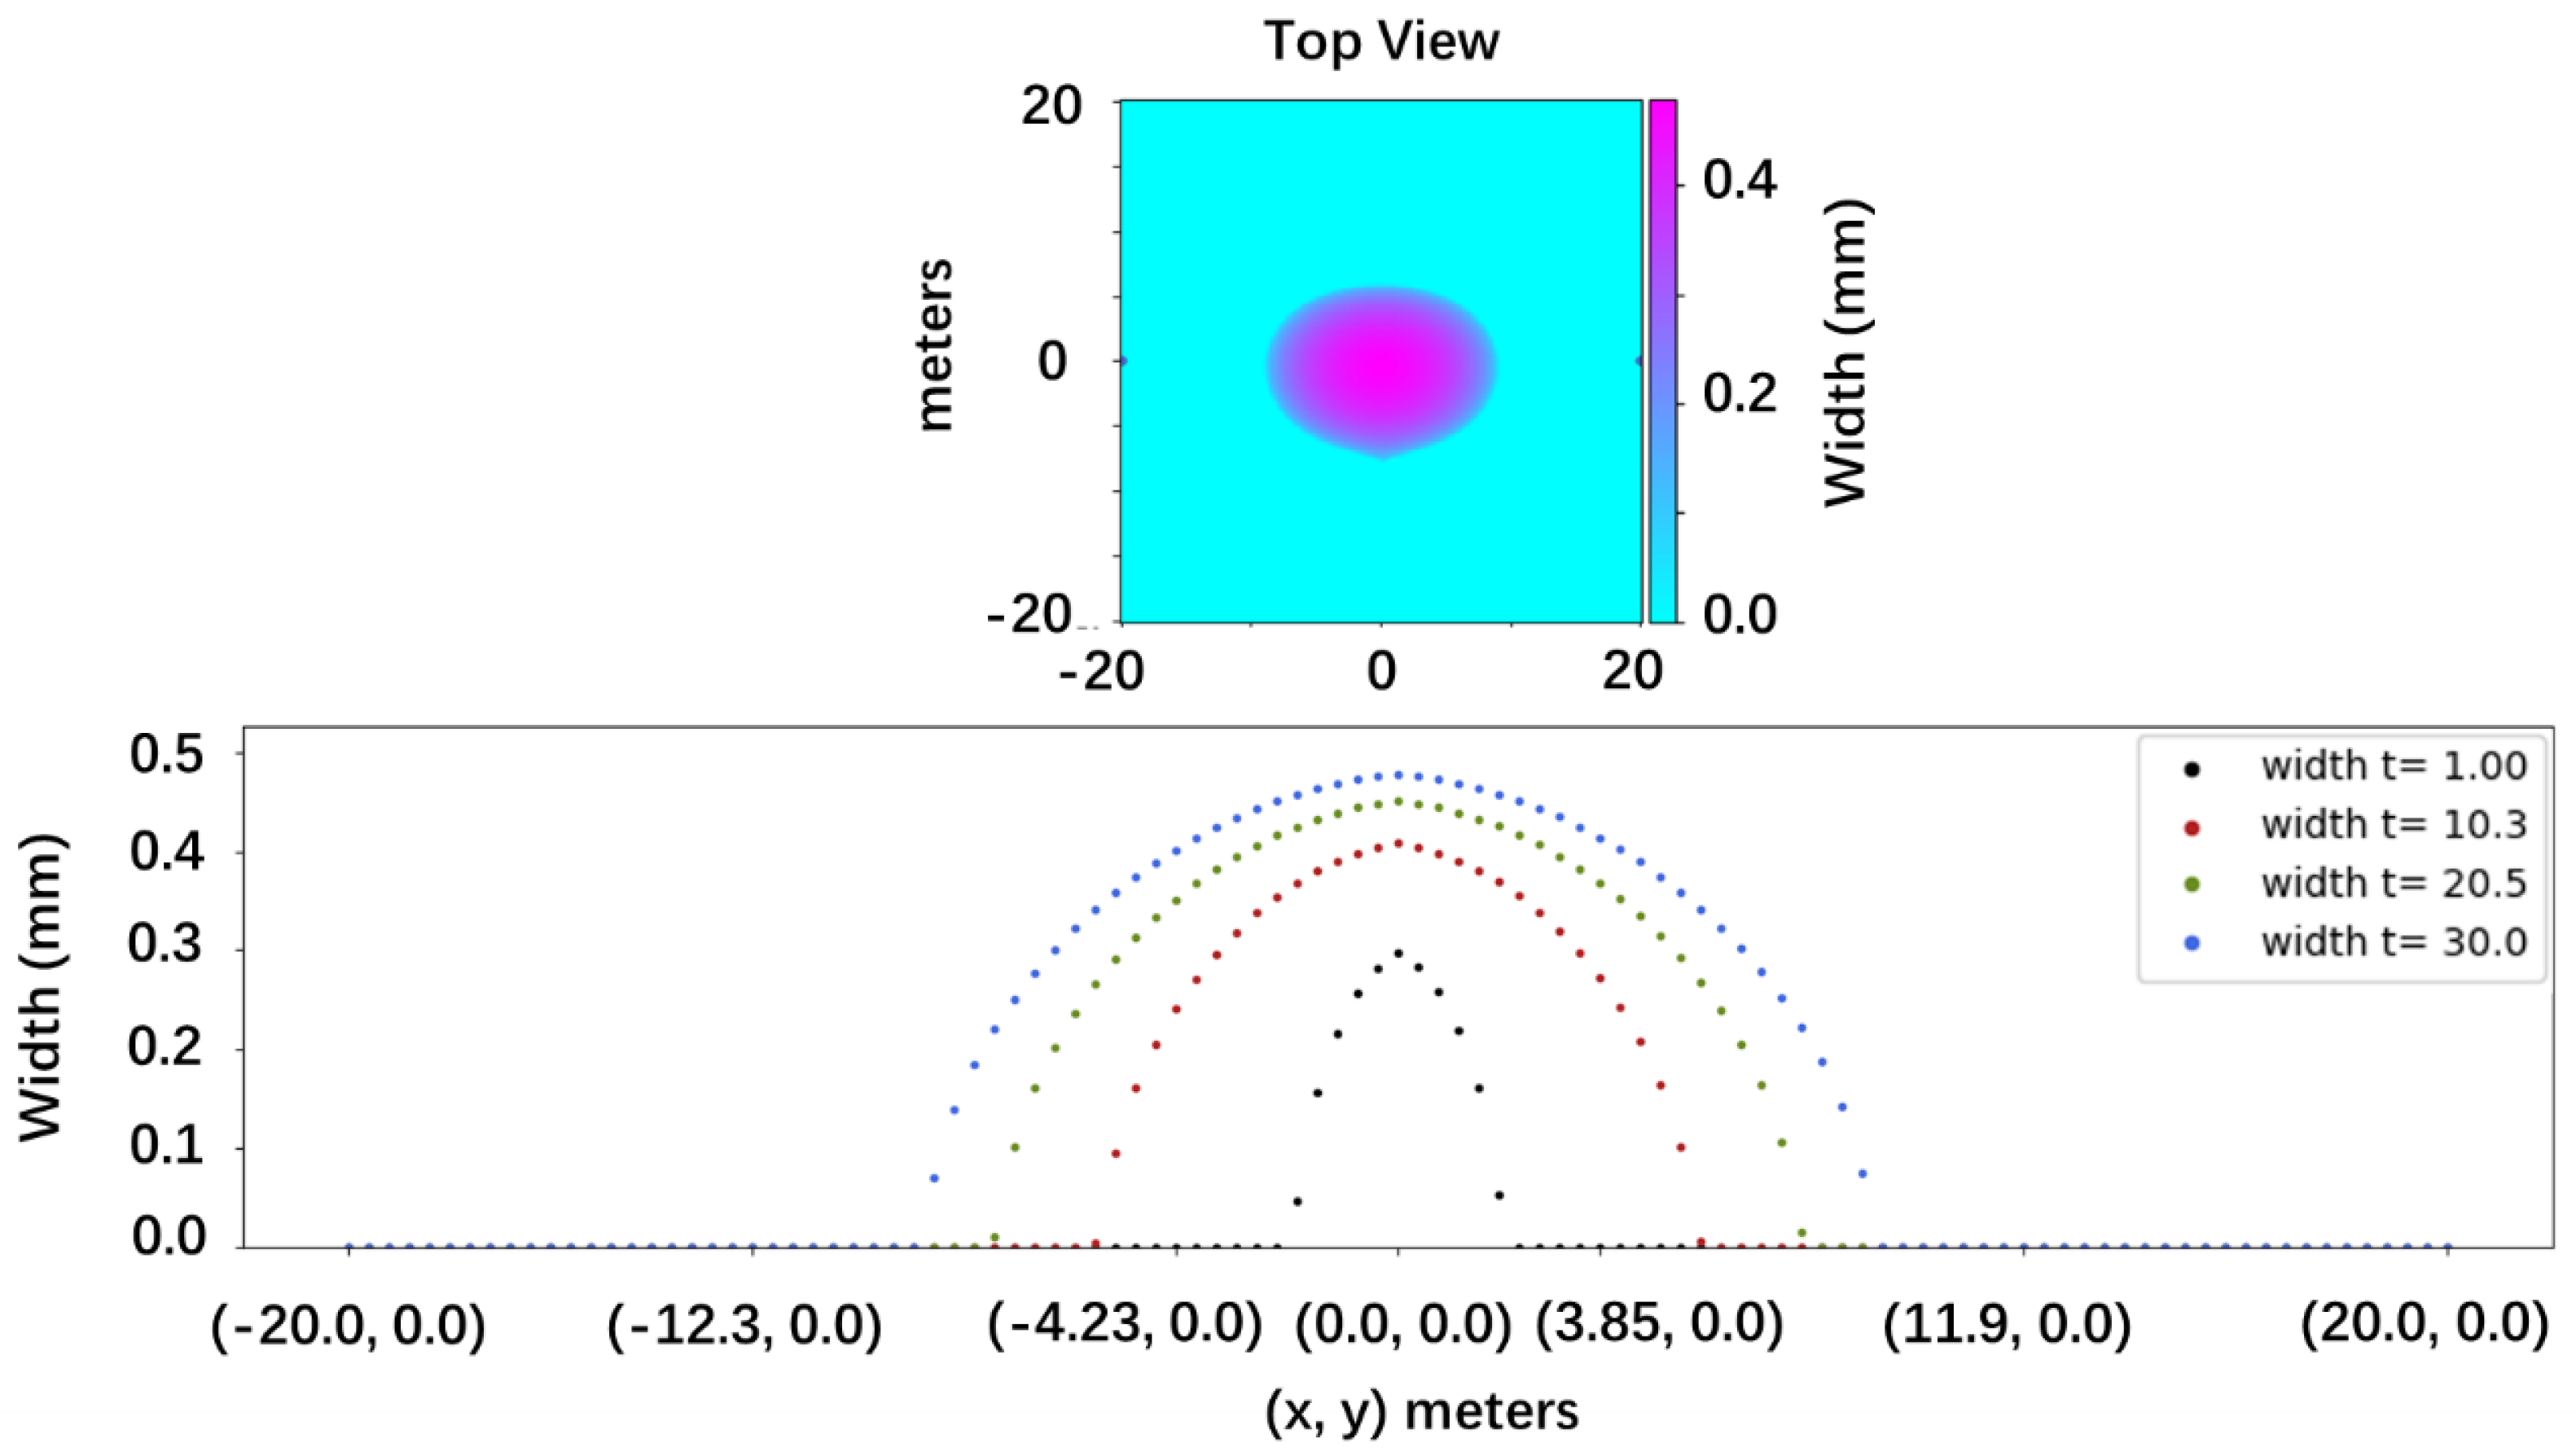
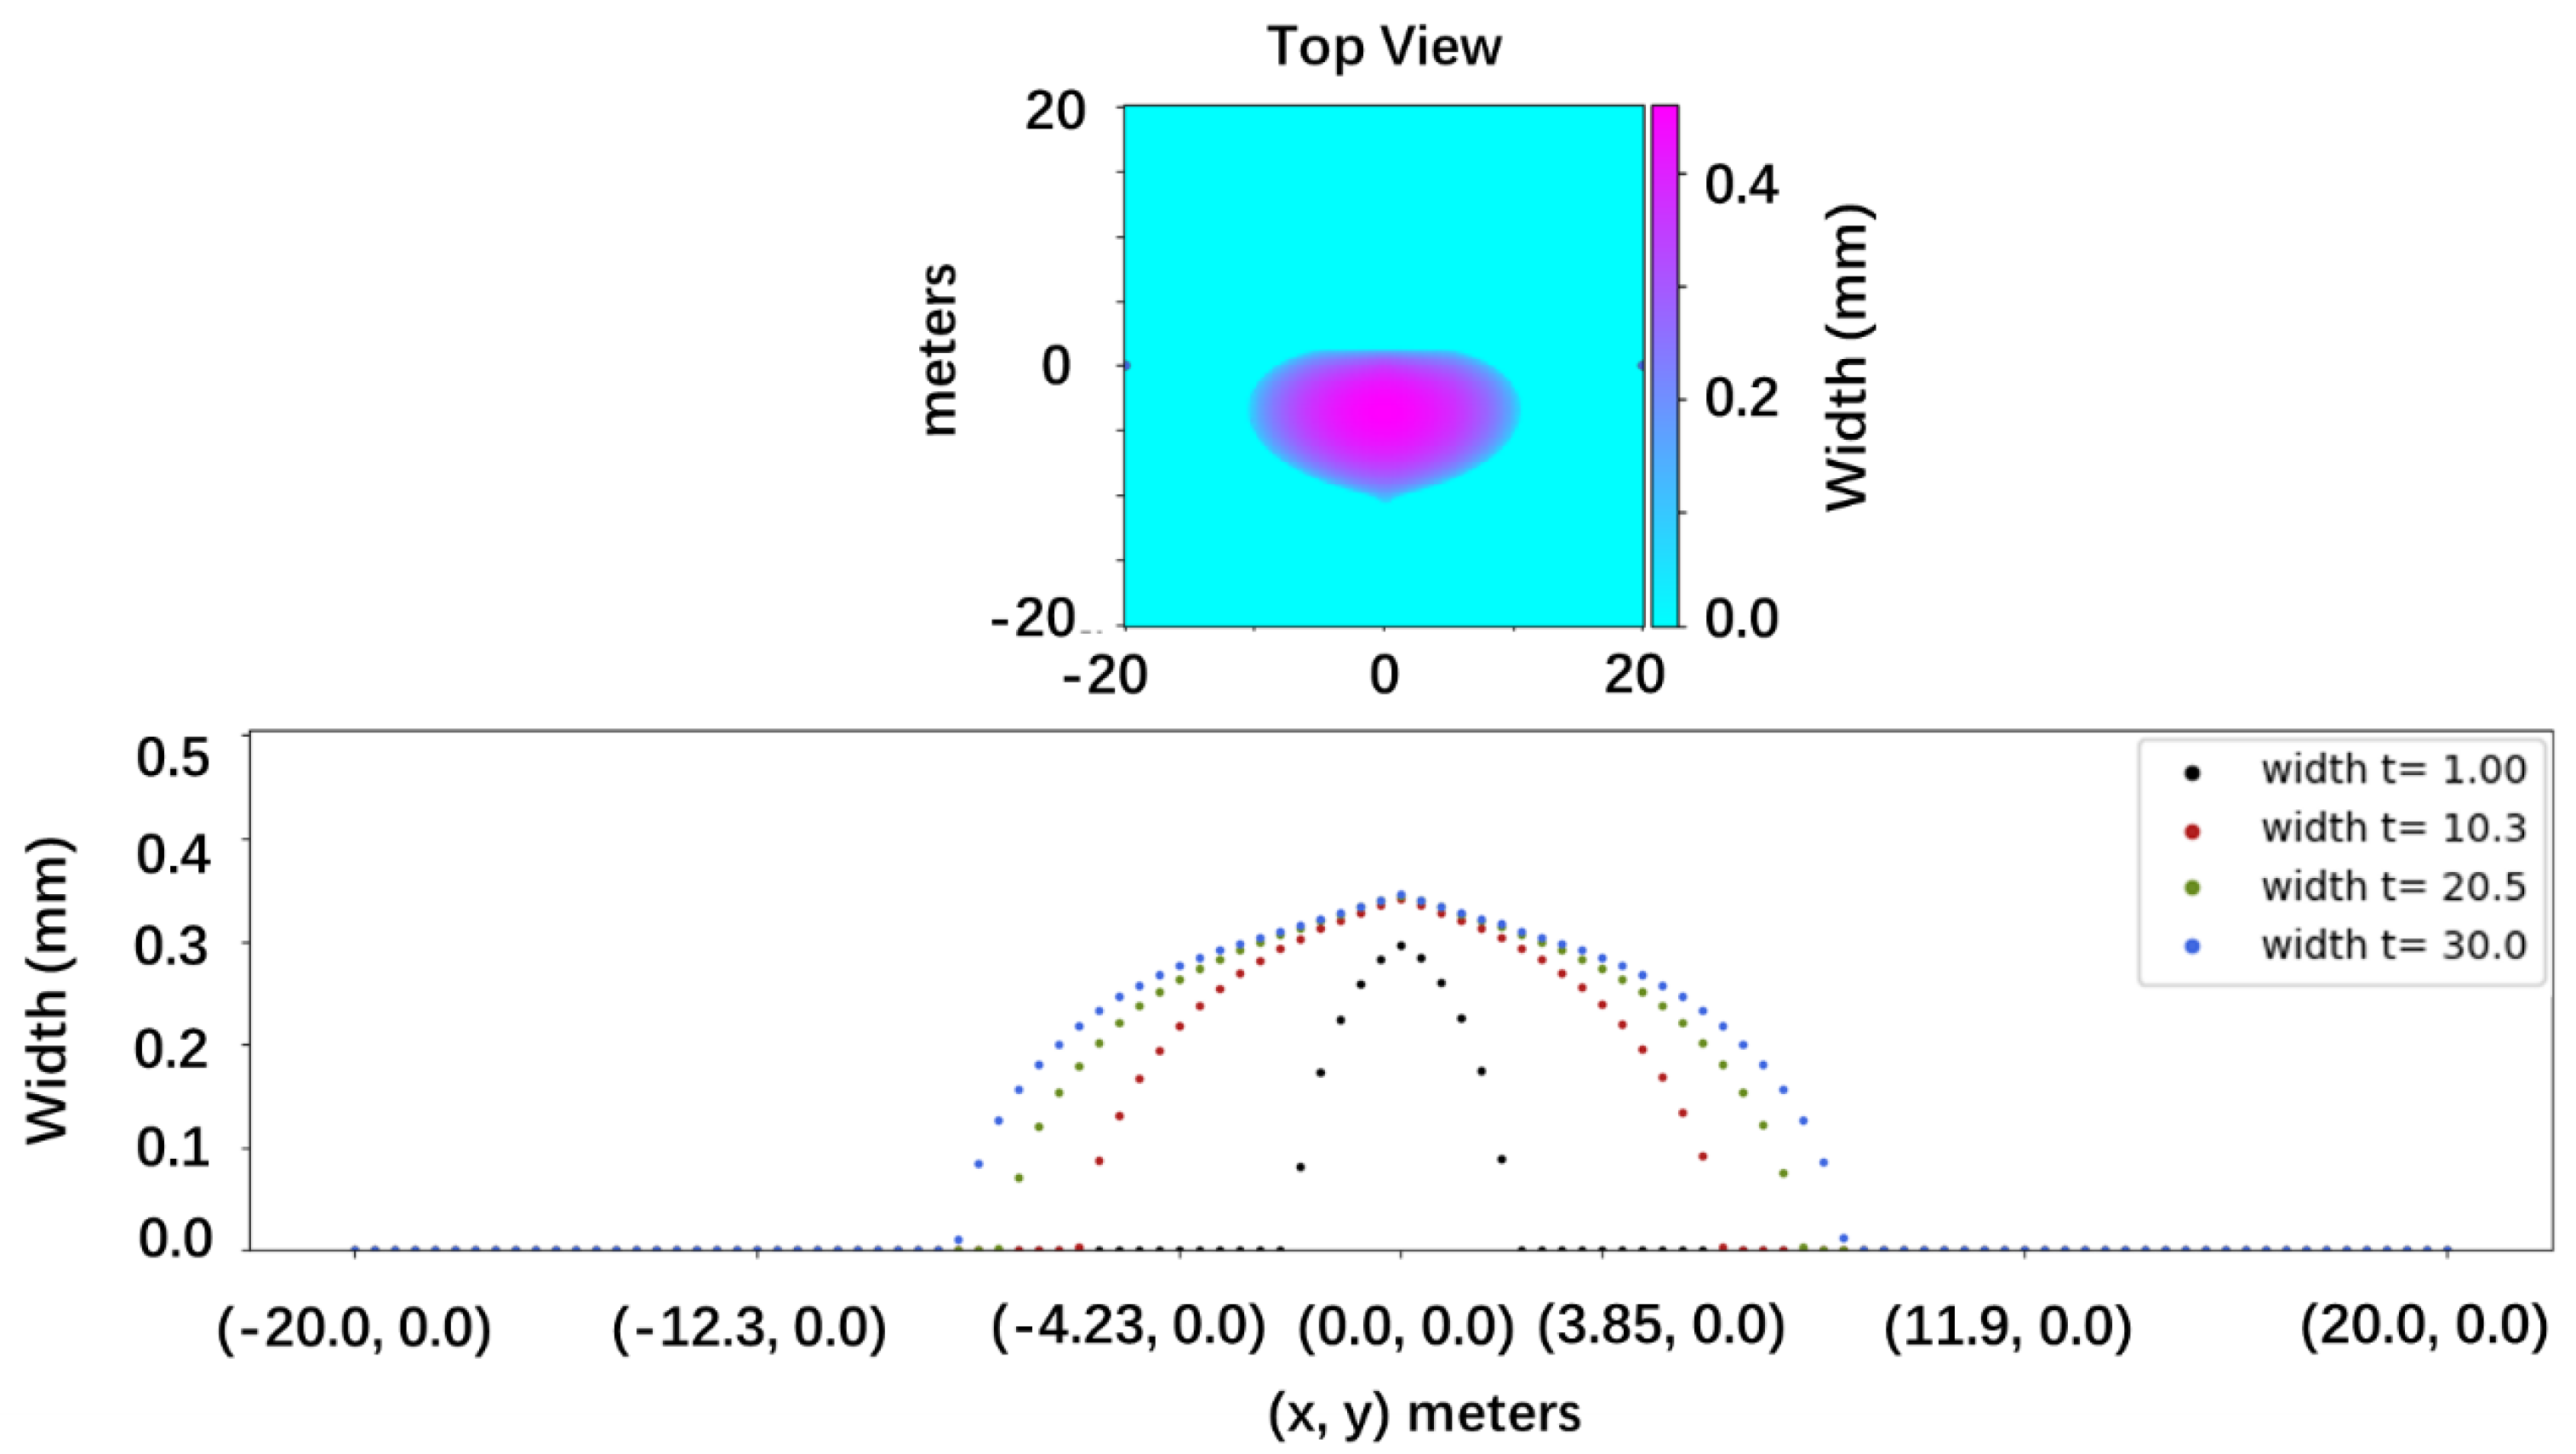
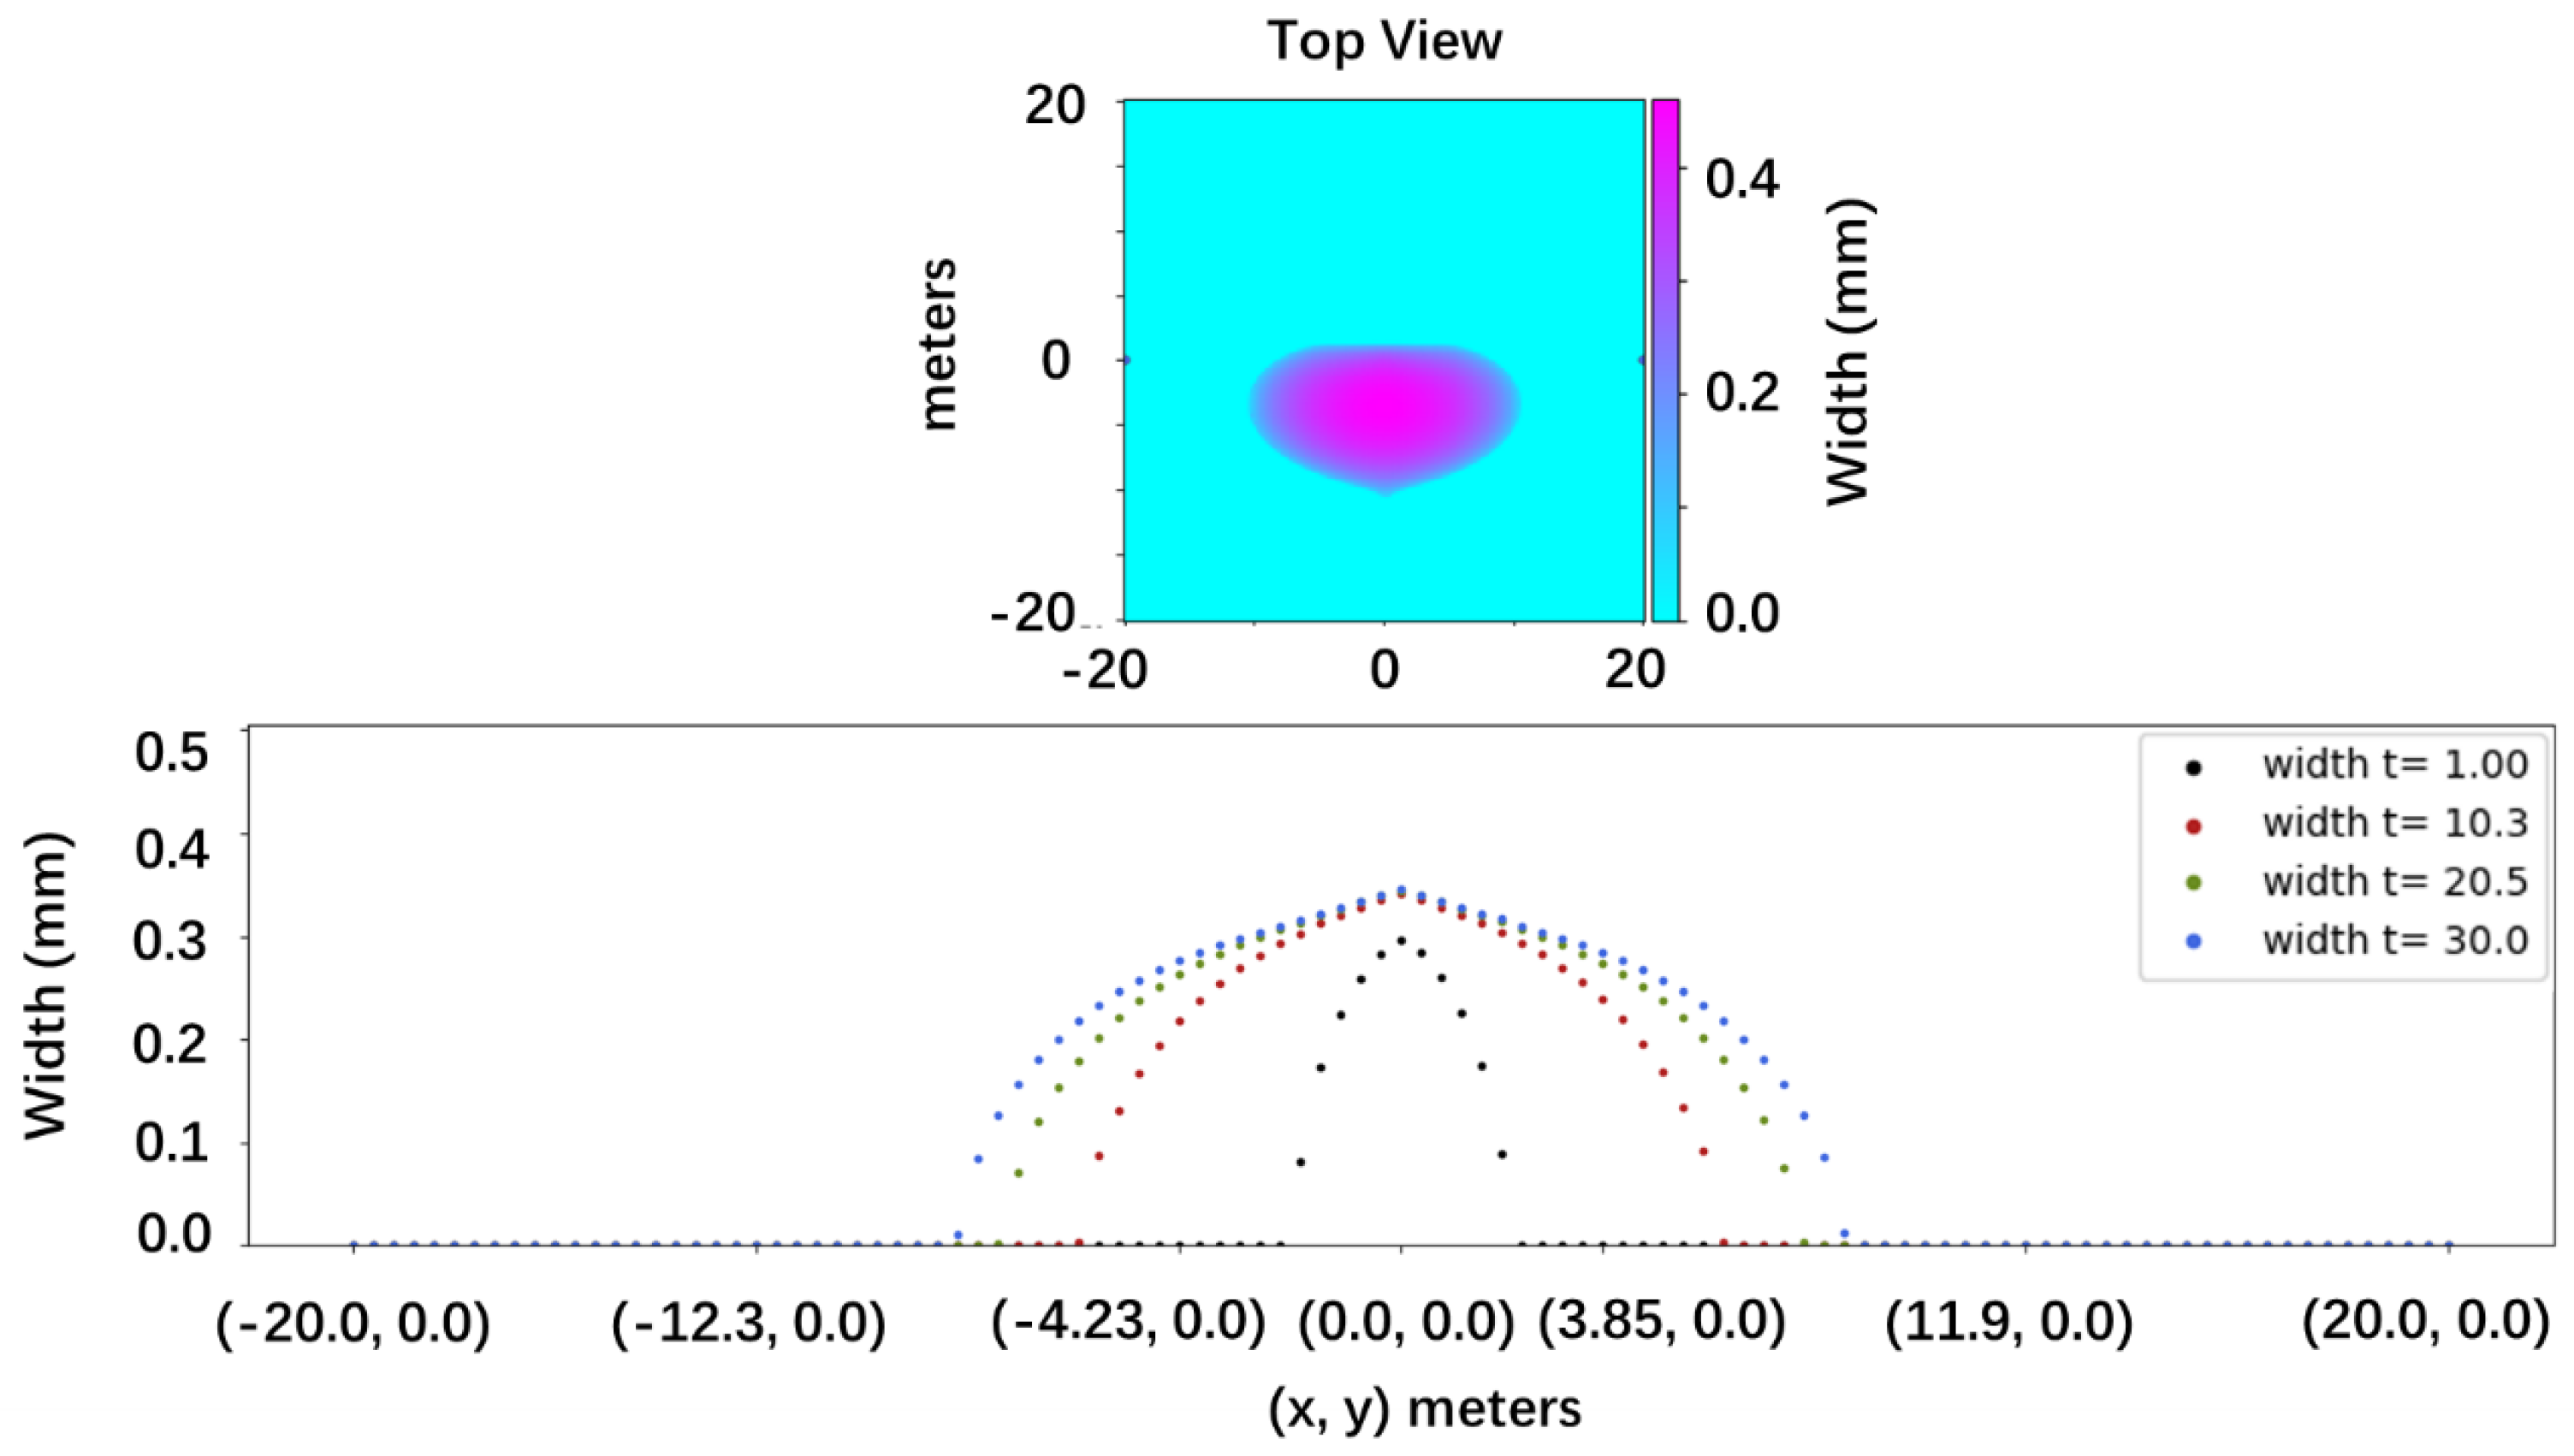
3.2. Effects of Stress Heterogeneity Caused by the Presence of Interlayers

The previous section discusses the effect of stress heterogeneity caused by legacy production and coupled flow and geomechanical behaviors on hydraulic fracturing in a new location. In the previous section, the heterogeneous stress varies in the x (or the horizontal direction). In this section, stress heterogeneity that varies in the y (the vertical) direction is studied. This type of stress heterogeneity often exists in shale oil reservoirs associated with continental facies where interlayers introduce varying minimum principal stress magnitudes at different depths. In this study, a thin layer is located 1 m near the fracturing point, and three interlayer thicknesses of 0.1 m, 0.5 m, and 1.0 m are simulated. The resultant hydraulic fracture footprints and width profiles are obtained. The minimum principal stress is 30 MPa, which is the same as the original minimum principal stress in the previous section, and the minimum principal stress in the interlayer is 32 MPa. The stress difference is 2 MPa. Simulation parameters are shown in Table 2.
Figure 9 shows the comparison of fracture footprints at 1 s, 10 s, 20 s, and 30 s of hydraulic fracturing with a pumping rate of 0.002 m3/s. The horizontal lines in the plots represent the thin interlayer with a 2 MPa stress difference. The stress difference leads to fracture height containment and affects the fracture geometries.
Figure 10 shows that the 0.1 m interlayer cannot effectively contain the vertical growth of the hydraulic fracture, and the fracture footprints extend continuously from the beginning. However, it is noted that the existence of the thin layer still inhibits vertical growth, and the upper half of the fracture footprints are shorter than the lower half. It indicates that a very thin interlayer cannot fully contain the fracture height to a certain layer, while its existence can restrict the height growth to a certain degree. Compared to the results in Figure 3, it can be noted that the vertical stress heterogeneity leads to symmetric fracture footprints horizontally and asymmetric fracture footprints vertically, while the horizontal stress heterogeneity leads to relatively symmetric fracture footprints vertically and asymmetric fracture footprints horizontally.
When the interlayer thickness increases to 0.5 m with a stress difference of 2 MPa, the fracture containment effect becomes significant, and the fracture footprints are fully restricted to the layer where the initial fracture is at. As a result, while horizontal symmetry is obtained, the fracture footprints are vertically asymmetric. The difference in the fracture footprints in the case with a 0.5 m interlayer and in the case with a 0.1 m interlayer indicates that, as the thickness of the interlayer increases, the fracture containment effect increases. A very thin interlayer cannot fully contain the fracture to a certain layer.
In the case with a 1.0 m thick interlayer, the fracture footprints are contained in the original layer, and the fracture propagates symmetrically in the horizontal direction. Compared with the 0.5 m interlayer case, the shapes of the fracture footprints are similar. It means that when the interlay is thick enough to contain the vertical growth of a fracture, the propagation behaviors below the interlayer are not quite sensitive to the thickness of interlayers. Due to the influence of the interlayer, the fracture footprints are no longer elliptical.
Figure 11 shows the fracture width profiles for fracture footprints when the interlayer is 0.1 m thick. Since the fracture height containment effect is not strong in this scenario, the evolution and distribution of width profiles along the line y = 0 m are similar to the typical elliptical fracture footprints. As the fracturing time increases, the maximum width increases, and it is always located at the original fracturing point due to symmetry. This is different from the cases with horizontal stress heterogeneity in the previous section. Figure 12 shows the fracture width results for the case with an interlayer thickness of 0.5 m. As the thickness increases, the fracture height growth upward is contained, and it is directly reflected by the changes in the fracture width results. At the fracturing time of 1 s, the width at the original point is still increasing. The fracture width at the center of line y = 0 m stops to increase from 10 s to 30 s. This means that when the fracture growth in the vertical direction reaches the interlayer and stops growing vertically, the width also stops increasing at the central point. However, the other locations in line y = 0 m still endure width increases as fracturing time increases. When the interlayer thickness increases to 1.0 m, the fracture width distribution and width profiles in Figure 12 are similar to those in Figure 11. This again indicates that when the interlayer is thick enough, the containment effect caused by vertical stress heterogeneity does not affect the fracture growth pattern much.
Based on the numerical results, it can be observed that the horizontal stress heterogeneity leads to asymmetric fracture growth, and the vertical stress heterogeneity leads to the containment of the vertical growth of fractures. In hydraulic fracturing designs, it is important to characterize the stress contrasts in multiple layers. In this numerical analysis, when the interlayer thickness is equal to or less than 0.1 m, the containment effect can be neglected. It can be assumed that the fracture obtained from a certain layer can finally penetrate neighboring layers. However, when the interlayer is thicker than 0.5 m, the fracture height cannot penetrate through interlayers. If the payzones are located in multiple layers, perforations should be placed correspondingly, as it is likely that the stimulation through perforations in a single layer cannot result in a fracture that connects multiple layers.

4. Conclusions

In this study, a numerical workflow is used to analyze the effect of stress heterogeneity horizontally and vertically. The numerical workflow consists of a derived coupled flow and geomechanics simulator and an open-source planar fracture simulator. The stress heterogeneities in the horizontal direction and in the vertical direction are attributed to legacy production and the existence of high-stress interlayers. The planar fracture growth patterns in these stress heterogeneities are simulated and discussed. In conclusion:
(1)
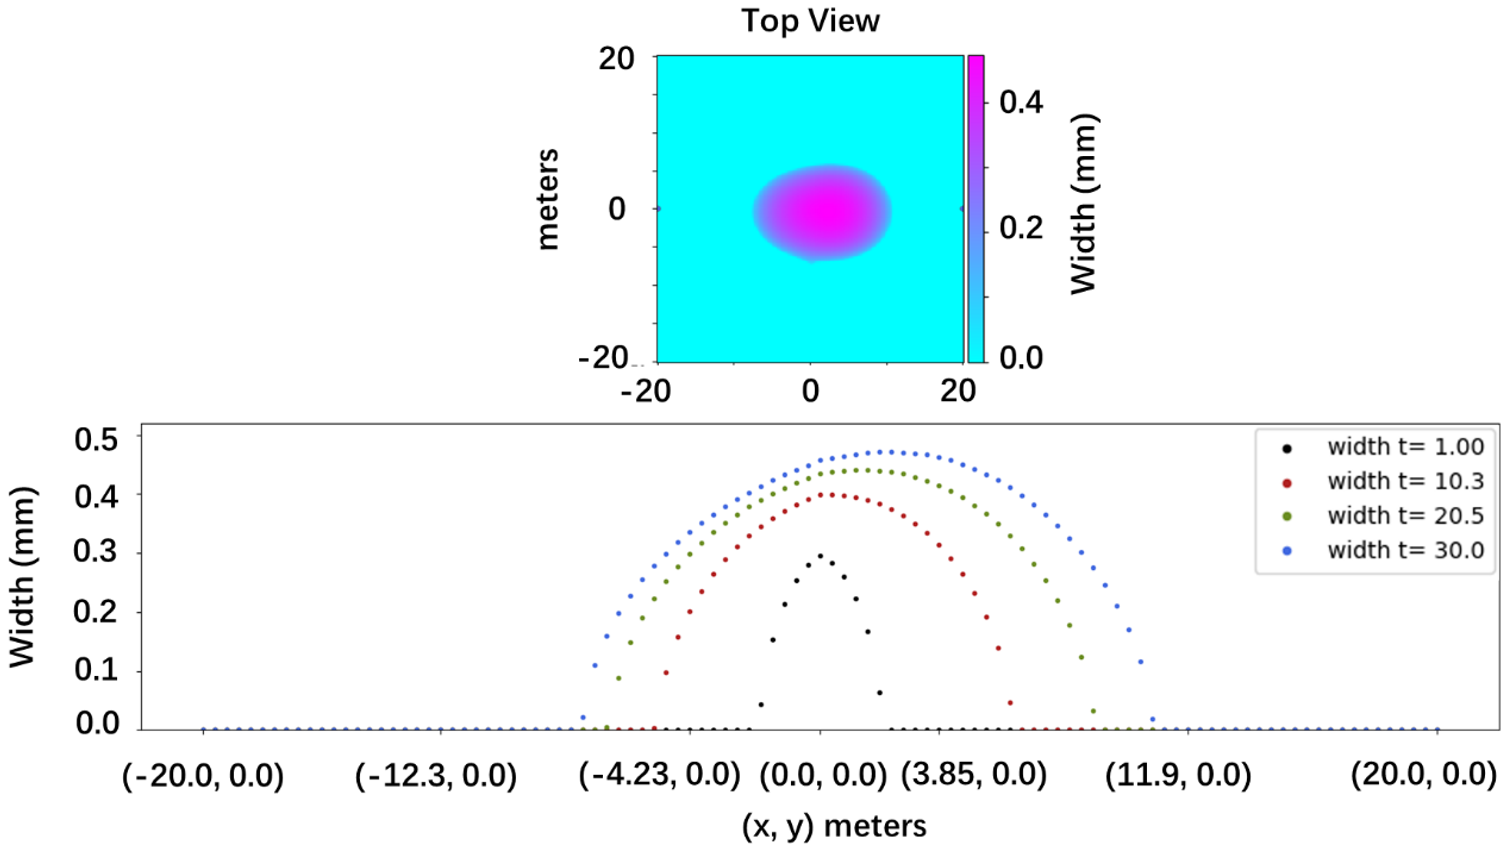
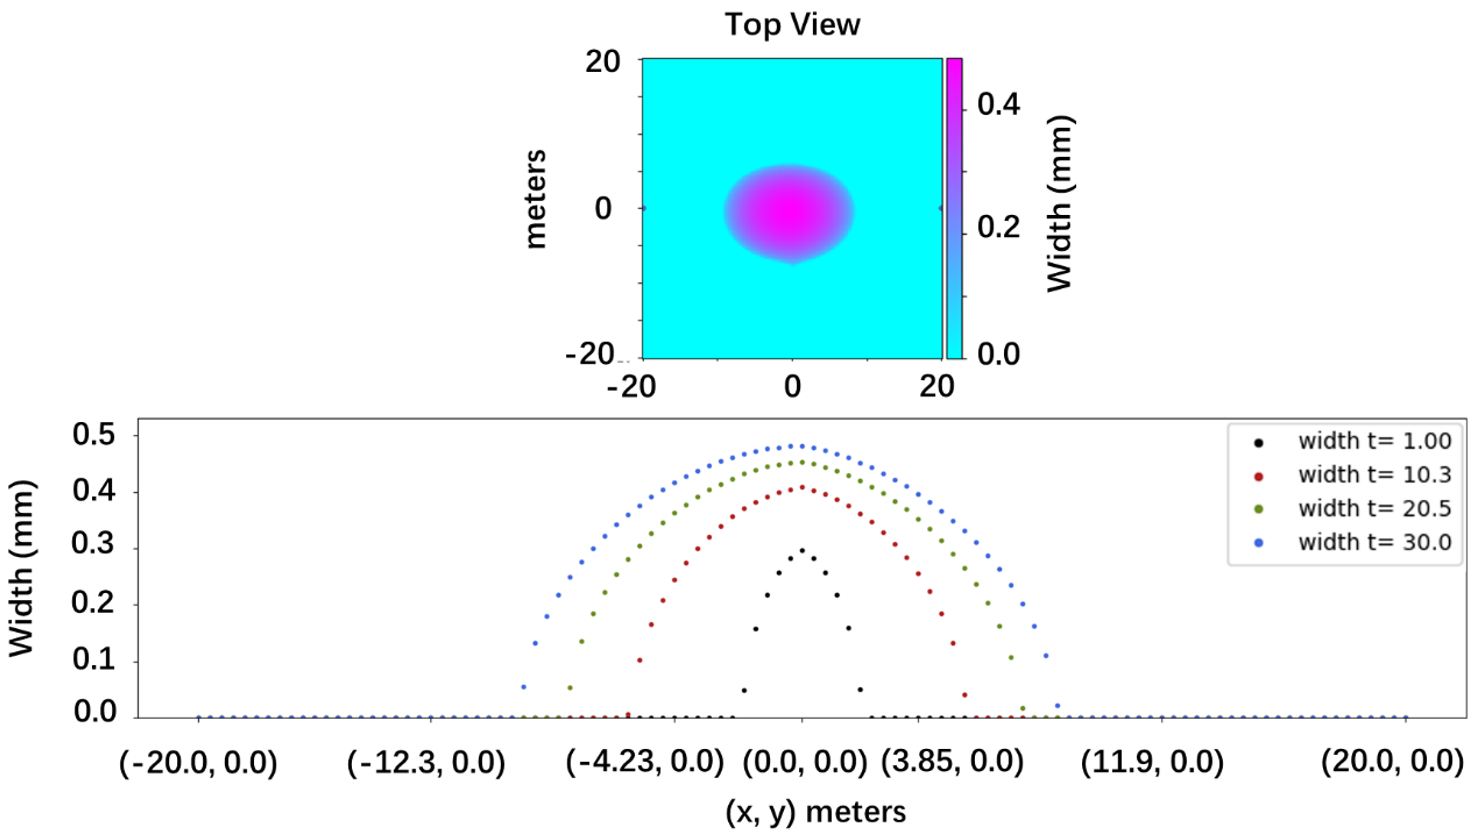
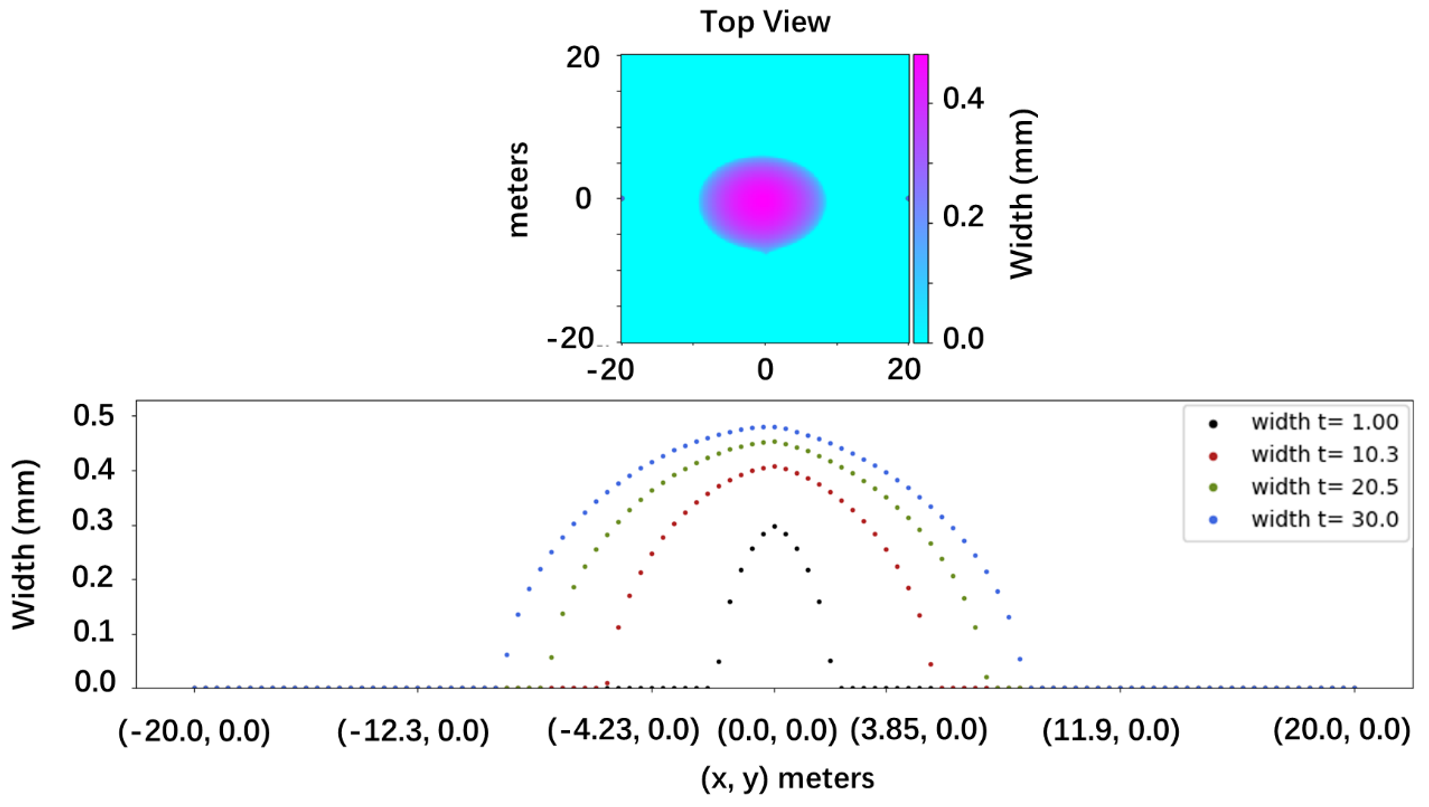
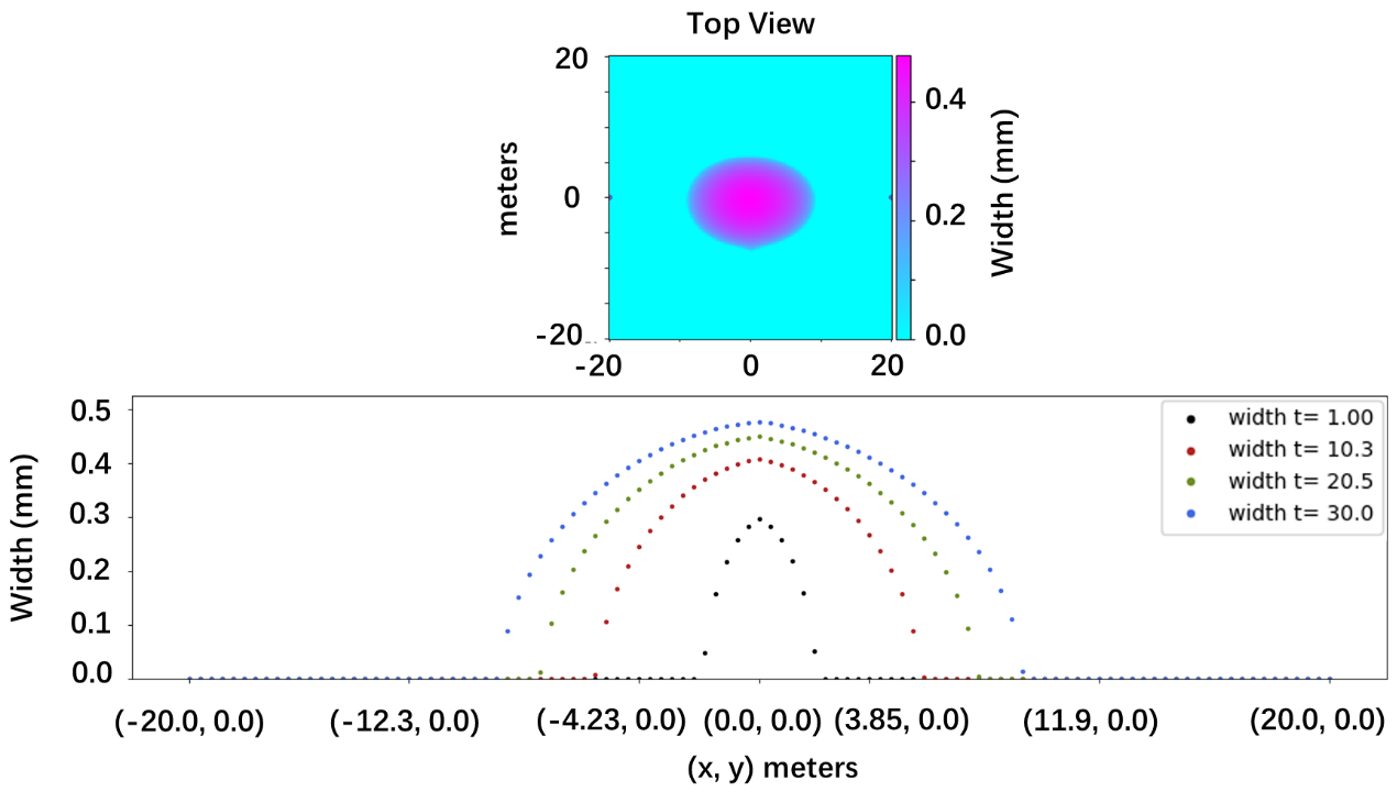
In a horizontally heterogeneous stress field caused by the coupled flow and geomechanics effect during legacy production, the hydraulic fracture footprints and width profiles become asymmetric. The maximum width location can be skewed due to asymmetric fracture growth. Legacy depletion of 6 months is enough to lead to asymmetric fracture geometries in newly fractured wells.
(2)
In a horizontally heterogeneous stress field, an elevated minimum principal stress makes it difficult to obtain greater half-lengths and fracture widths. When the effect of pressure depletion outweighs the effect of compressive effective stress increase, the fracture tends to propagate more easily toward the legacy production direction.
(3)
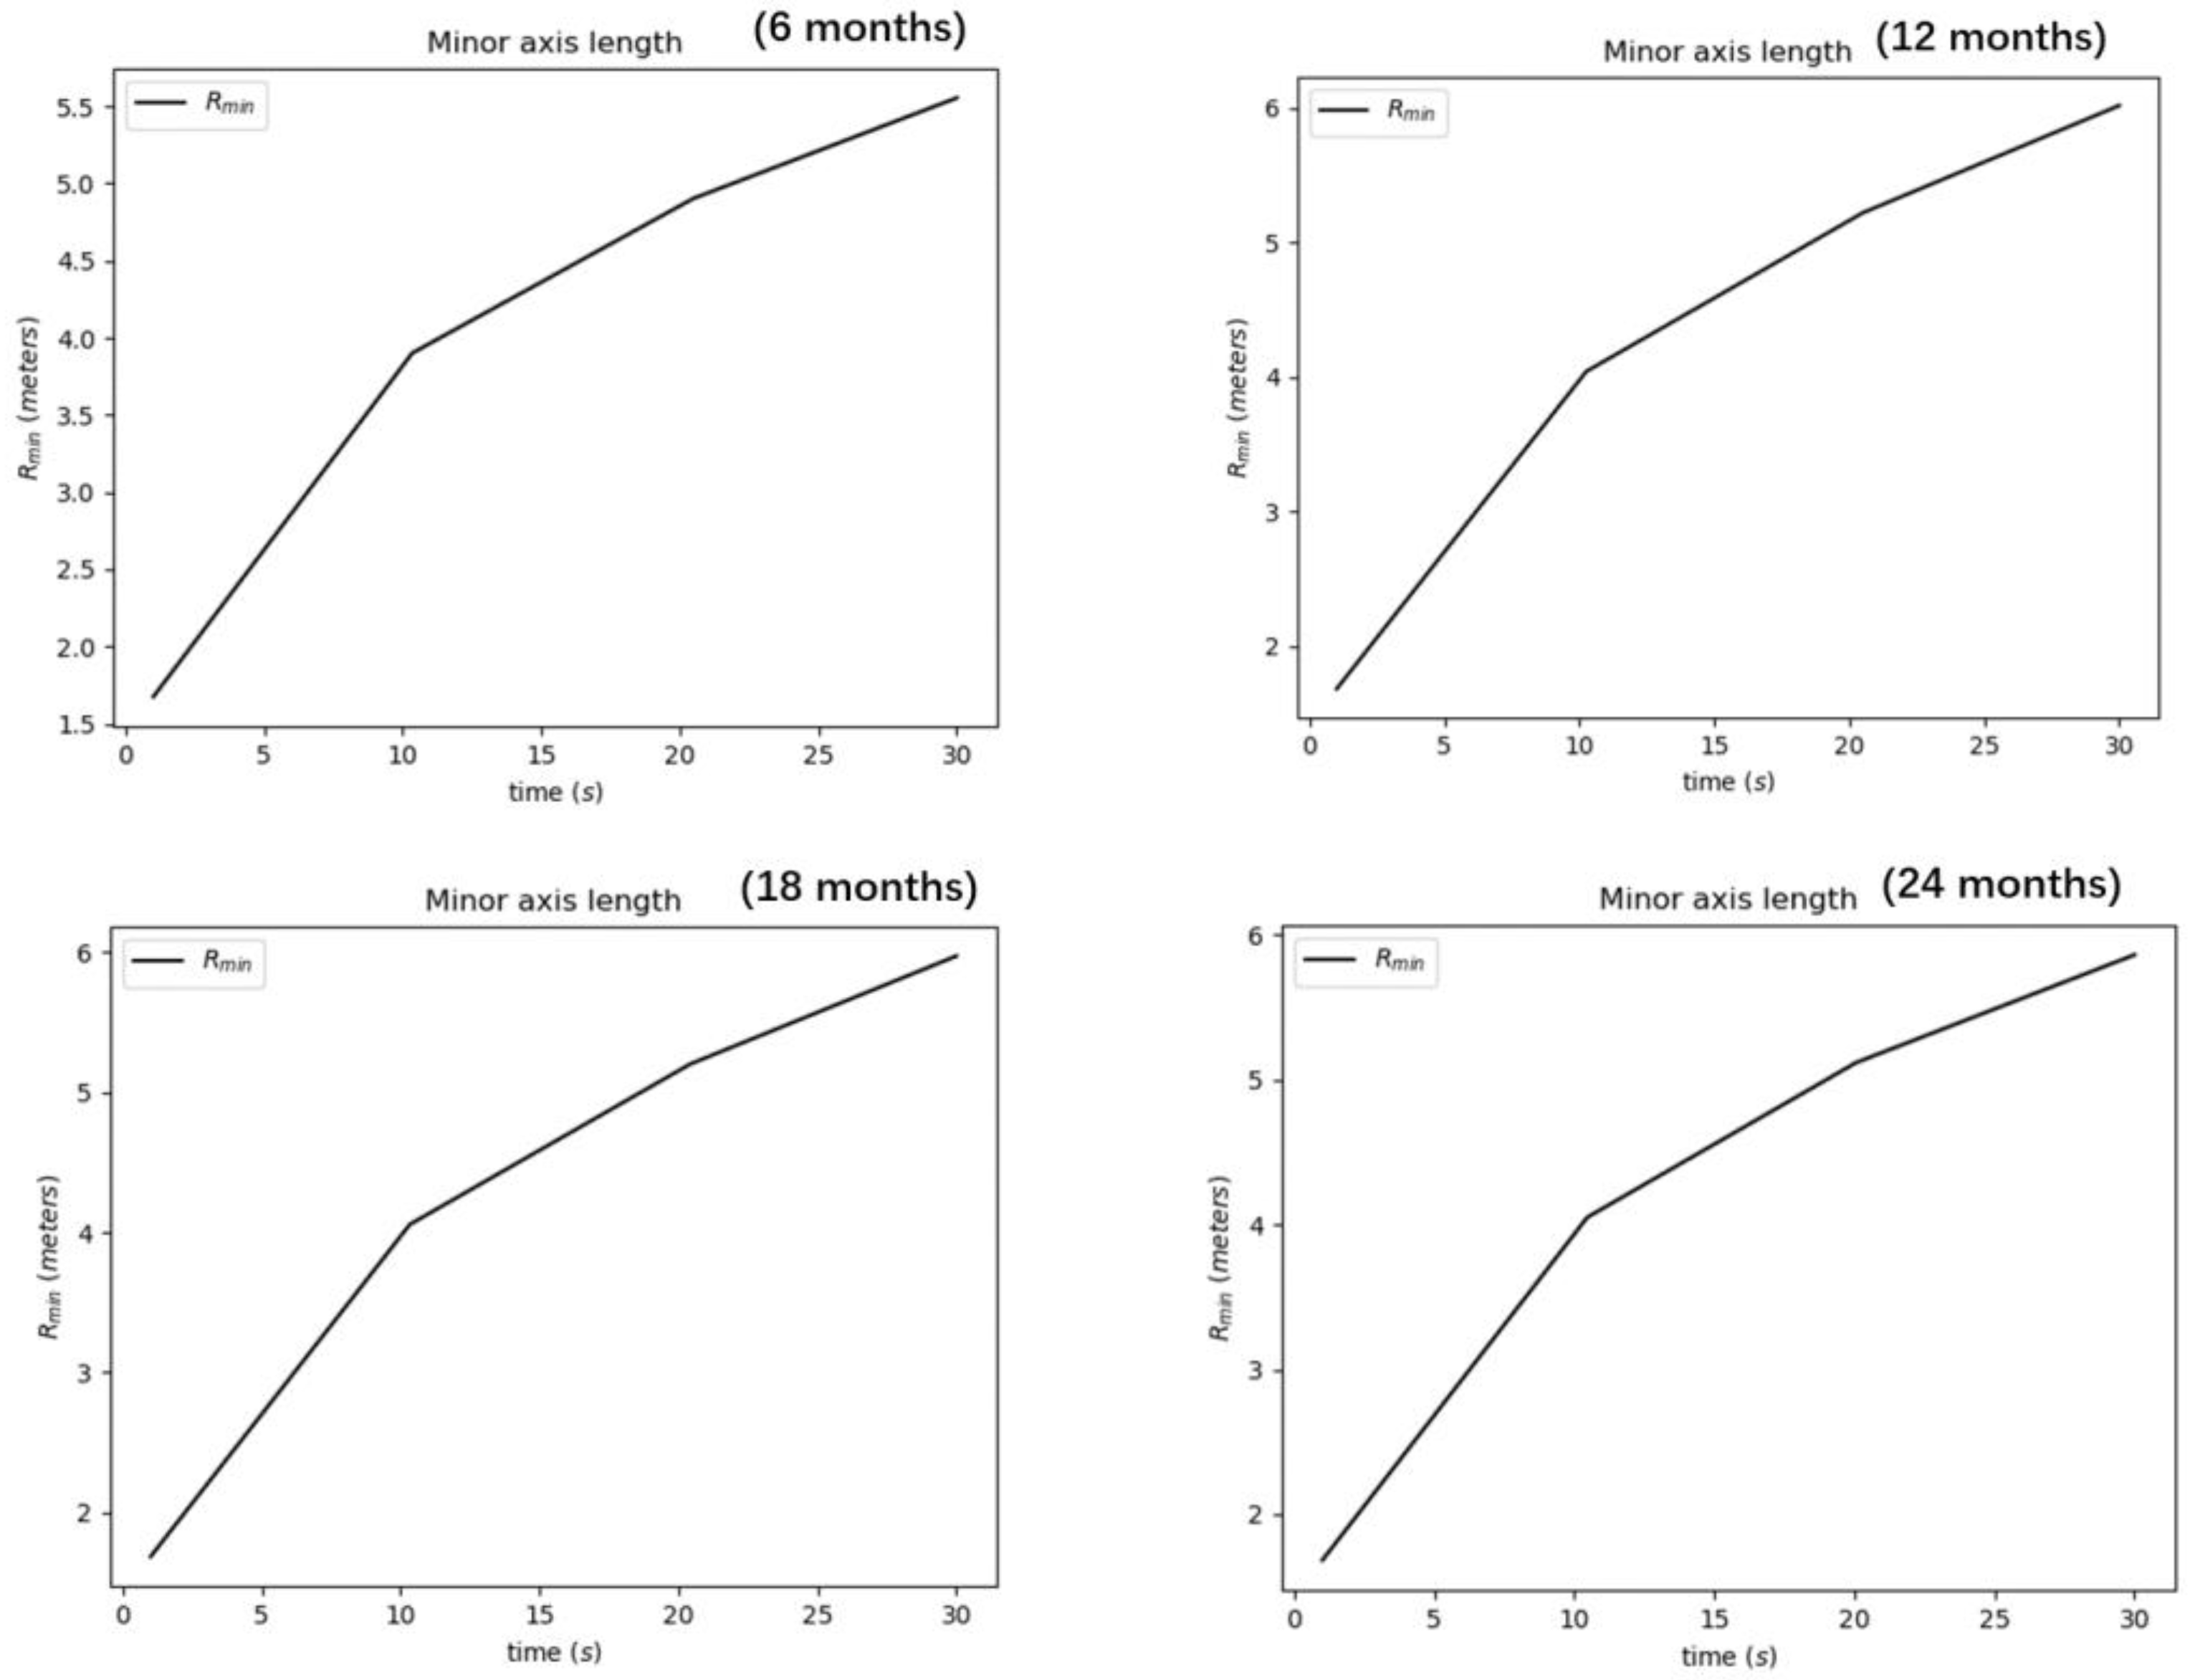
In a vertically heterogeneous stress field with the existence of high-stress interlayers, the fracture height growth can be restricted. When the interlayer is thin enough, the fracture still penetrates through the interlayer with vertical asymmetry in fracture footprints. When the interlayer becomes thicker, the fracture cannot penetrate through, and the fracture footprints become less sensitive to the thickness of interlayers. Based on the analysis in this study, interlayers thinner than 0.1 m cannot contain the growth of fracture height, and the placement of perforations in a certain can lead to fractures connecting multiple adjacent layers. Interlayers thicker than 0.5 m can effectively contain fracture height growth and placement of perforations in multiple layers is required if stimulation is required in these layers. Note that this is based on the geomechanical setup used in this analysis, and the change in geomechanics can result in different observations.

Author Contributions

Conceptualization, S.Z.; methodology, Z.C.; software, J.L., X.Z. and Z.C.; validation, B.Z. and X.W.; writing—original draft preparation, S.Z.; writing—review and editing, J.L.; visualization, Q.W. and Q.J. All authors have read and agreed to the published version of the manuscript.

Funding

This research was funded by the National Natural Science Foundation of China (U19B6003-05) and the CNPC Innovation Fund (no. 2021DQ02-0502) and the Open Fund of the State Key Laboratory of Shale Oil and Gas Enrichment Mechanisms and Effective Development (no. 21-GJ-KF-16). Support from the National Natural Science Foundation of China (no. 51904314) is also acknowledged And the APC was funded by the CNPC Innovation Fund.

Institutional Review Board Statement

Not applicable.

Informed Consent Statement

Not applicable.

Data Availability Statement

The data presented in this study are available in the result sections in this article.

Acknowledgments

The authors acknowledge financial support from the National Natural Science Foundation of China (no. U19B6003). The research is also sponsored by the CNPC Innovation Fund (no. 2021DQ02-0502) and the Open Fund of the State Key Laboratory of Shale Oil and Gas Enrichment Mechanisms and Effective Development (no. 21-GJ-KF-16). Support from the National Natural Science Foundation of China (no. 51904314) is also acknowledged.

Conflicts of Interest

The authors declare no conflict of interest.

References

  1. Hou, B.; Chang, Z.; Fu, W.; Muhadasi, Y.; Chen, M. Fracture Initiation and Propagation in a Deep Shale Gas Reservoir Subject to an Alternating-Fluid-Injection Hydraulic-Fracturing Treatment. SPE J. 2019, 24, 1839–1855. [Google Scholar] [CrossRef]
  2. Dong, J.-N.; Yuan, G.-J.; Wang, X.-Y.; Chen, M.; Jin, Y.; Zeng, C.; Zaman, M. Experimental study of multi-timescale crack blunting in hydraulic fracture. Pet. Sci. 2020, 18, 234–244. [Google Scholar] [CrossRef]
  3. Shi, C.; Lin, B. Principles and influencing factors for shale formations. Pet. Sci. Bull. 2021, 1, 92–113. [Google Scholar]
  4. Zhi, D.; Guo, X.; Wang, W.; Jin, Y.; Liu, C.; Chen, G.; Wang, Z. Fracturing and production analysis of the efficacy of hydraulic fracture stage reduction in the improvement of cost-effectiveness in shale oil development: A case study of Jimsar shale oil, China. Energy Sci. Eng. 2021, 9, 1337–1348. [Google Scholar] [CrossRef]
  5. Chen, A.; Guo, X.; Yu, H.; Huang, L.; Shi, S.; Cheng, N. A parametric study of hydraulic fracturing interference between fracture clusters and stages based on numerical modeling. Energy Explor. Exploit. 2020, 39, 65–85. [Google Scholar] [CrossRef]
  6. Chen, B.; Ji, J.; Lin, J.; Chen, H.; Wang, X.; Guo, X.; Yang, W.; Lin, J. Experimental and Numerical Investigation of Characteristics of Highly Heterogeneous Rock Mechanical Responses in Tight Sandy Conglomerate Reservoir Rock Under Tri-axial Compression. Front. Earth Sci. 2021, 9, 735208. [Google Scholar] [CrossRef]
  7. French, K.L.; Birdwell, J.E.; Lewan, M.D. Trends in thermal maturity indicators for the organic sulfur-rich Eagle Ford Shale. Mar. Pet. Geol. 2020, 118, 104459. [Google Scholar] [CrossRef]
  8. Hu, S.; Zhao, W.; Hou, L.; Yang, Z.; Zhu, R.; Wu, S.; Bai, B.; Jin, X. Development potential and technical strategy of continental shale oil in China. Pet. Explor. Dev. 2020, 47, 877–887. [Google Scholar] [CrossRef]
  9. Cao, D.S.; Zeng, L.B.; Lü, W.Y.; Xiang, U.; He, T. Progress in brittleness evaluation and prediction methods in unconventional reservoirs. Pet. Sci. Bull. 2021, 6, 31–45. [Google Scholar]
  10. Li, Q.; Han, Y.; Liu, X.; Ansari, U.; Cheng, Y.; Yan, C. Hydrate as a by-product in CO2 leakage during the long-term sub-seabed sequestration and its role in preventing further leakage. Environ. Sci. Pollut. Res. 2022, 29, 77737–77754. [Google Scholar] [CrossRef]
  11. Li, Q.; Wu, J. Factors affecting the lower limit of the safe mud weight window for drilling operation in hydrate-bearing sediments in the Northern South China Sea. Geomech. Geophys. Geo-Energy Geo-Resour. 2022, 8, 82. [Google Scholar] [CrossRef]
  12. Li, Q.; Wang, F.; Wang, Y.; Zhou, C.; Chen, J.; Forson, K.; Miao, R.; Su, Y.; Zhang, J. Effect of reservoir characteristics and chemicals on filtration property of water-based drilling fluid in unconventional reservoir and mechanism disclosure. Environ. Sci. Pollut. Res. 2023, 30, 55034–55043. [Google Scholar] [CrossRef]
  13. Li, J.; Wu, K. An Efficient Model for Hydraulic Fracture Height Growth Considering the Effect of Bedding Layers in Unconventional Shale Formations. SPE J. 2022, 27, 3740–3756. [Google Scholar] [CrossRef]
  14. Li, J.; Liu, Y.; Wu, K. A New Higher Order Displacement Discontinuity Method Based on the Joint Element for Analysis of Close-Spacing Planar Fractures. SPE J. 2022, 27, 1123–1139. [Google Scholar] [CrossRef]
  15. Yang, T.H.; Tham, L.G.; Tang, C.A.; Liang, Z.Z.; Tsui, Y. Influence of Heterogeneity of Mechanical Properties on Hydraulic Fracturing in Permeable Rocks. Rock Mech. Rock Eng. 2004, 37, 251–275. [Google Scholar] [CrossRef]
  16. Oparin, M.; Sadykov, A.; Khan, S.; Tineo, R. Impact of Local Stress Heterogeneity on Fracture Initiation in Unconventional Reservoirs: A Case Study from Saudi Arabia. In Proceedings of the SPE Annual Technical Conference and Exhibition, Dubai, United Arab Emirates, 26–28 September 2016. [Google Scholar] [CrossRef]
  17. Tang, J.; Li, J.; Tang, M.; Du, X.; Yin, J.; Guo, X.; Wu, K.; Xiao, L. Investigation of multiple hydraulic fractures evolution and well performance in lacustrine shale oil reservoirs considering stress heterogeneity. Eng. Fract. Mech. 2019, 218, 106569. [Google Scholar] [CrossRef]
  18. Tang, J.; Wu, K.; Zeng, B.; Huang, H.; Hu, X.; Guo, X.; Zuo, L. Investigate effects of weak bedding interfaces on fracture geometry in unconventional reservoirs. J. Pet. Sci. Eng. 2018, 165, 992–1009. [Google Scholar] [CrossRef]
  19. Liu, R.; Jiang, D.; Zheng, J.; Hao, F.; Jing, C.; Liu, H.; Zhang, J.; Wei, G. Stress heterogeneity in the Changning shale-gas field, southern Sichuan Basin: Implications for a hydraulic fracturing strategy. Mar. Pet. Geol. 2021, 132, 105218. [Google Scholar] [CrossRef]
  20. Zia, H.; Lecampion, B. PyFrac: A planar 3D hydraulic fracture simulator. Comput. Phys. Commun. 2020, 255, 107368. [Google Scholar] [CrossRef]
  21. Tan, P.; Jin, Y.; Yuan, L.; Xiong, Z.-Y.; Hou, B.; Chen, M.; Wan, L.-M. Understanding hydraulic fracture propagation behavior in tight sandstone–coal interbedded formations: An experimental investigation. Pet. Sci. 2019, 16, 148–160. [Google Scholar] [CrossRef] [Green Version]
  22. Tan, P.; Jin, Y.; Pang, H. Hydraulic fracture vertical propagation behavior in transversely isotropic layered shale formation with transition zone using XFEM-based CZM method. Eng. Fract. Mech. 2021, 248, 107707. [Google Scholar] [CrossRef]
  23. Chang, Z.; Hou, B. Numerical Simulation on Cracked Shale Oil Reservoirs Multi-Cluster Fracturing Under Inter-well and Inter-cluster Stress Interferences. Rock Mech. Rock Eng. 2022, 56, 1909–1925. [Google Scholar] [CrossRef]
  24. Chen, F.; Tang, K.; Ren, G.; Zhao, Z.; Zheng, Y.; Zeng, B.; Song, Y. Research on Application and Development of Shale Gas Multi-Cluster Perforation Technology in Southern Sichuan Basin. Well Logging Technol. 2020, 44, 425–431. [Google Scholar]
  25. Ren, G.; Zhao, X.; Lu, Y.; Li, K.; He, J.; Zhang, Z.; Guo, J.; Chen, Y.; Liu, W. on Perforation Geology and Engineering integration Technology in South Sichuan Area Shale Gas Exploration. Well Logging Technol. 2021, 45, 87–92. [Google Scholar]
  26. Huang, L.; He, R.; Yang, Z.; Tan, P.; Chen, W.; Li, X.; Cao, A. Exploring hydraulic fracture behavior in glutenite formation with strong heterogeneity and variable lithology based on DEM simulation. Eng. Fract. Mech. 2023, 278, 109020. [Google Scholar] [CrossRef]
  27. Guo, X.; Wang, Y.; Killough, J. The application of static load balancers in parallel compositional reservoir simulation on distributed memory system. J. Nat. Gas Sci. Eng. 2016, 28, 447–460. [Google Scholar] [CrossRef]
  28. Coussy, O. Poromechanics; John Wiley & Sons: Hoboken, NJ, USA, 2004. [Google Scholar]
  29. He, Y.; Cheng, S.; Sun, Z.; Chai, Z.; Rui, Z. Improving oil recovery through fracture injection and production of multiple fractured horizontal wells. J. Energy Resour. Technol. 2020, 142, 053002. [Google Scholar] [CrossRef]
  30. He, Y.; Qiao, Y.; Qin, J.; Tang, Y.; Wang, Y.; Chai, Z. A novel method to enhance oil recovery by inter-fracture injection and production through the same multi-fractured horizontal well. J. Energy Resour. Technol. 2021, 144, 043005. [Google Scholar] [CrossRef]
  31. Guo, X.; Jin, Y.; Zi, J.; Lin, B. Numerical investigation of the gas production efficiency and induced geomechanical responses in marine methane hydrate-bearing sediments exploited by depressurization through hydraulic fractures. Energy Fuels 2021, 35, 18441–18458. [Google Scholar] [CrossRef]
  32. Guo, X.; Jin, Y.; Zi, J.; Lin, J.; Zhu, B. A 3D modeling study of effects of heterogeneity on system responses in methane hydrate reservoirs with horizontal well depressurization. Gas Sci. Eng. 2023, 115, 205001. [Google Scholar] [CrossRef]
  33. Dean, R.H.; Gai, X.; Stone, C.M.; Minkoff, S.E. A comparison of techniques for coupling porous flow and geomechanics. SPE J. 2006, 11, 132–140. [Google Scholar] [CrossRef]
  34. Roussel, N.P.; Florez, H.A.; Rodriguez, A.A. Hydraulic Fracture Propagation from Infill Horizontal Wells. In Proceedings of the SPE Annual Technical Conference and Exhibition, New Orleans, LA, USA, 30 September–2 October2013. SPE-166503-MS. [Google Scholar]
  35. Safari, R.; Lewis, R.; Ma, X.; Mutlu, U.; Ghassemi, A. Infill-Well Fracturing Optimization in Tightly Spaced Horizontal Wells. SPE J. 2016, 22, 582–595. [Google Scholar] [CrossRef]
  36. Guo, X.; Wu, K.; An, C.; Tang, J.; Killough, J. Numerical investigation of effects of subsequent parent-well injection on interwell fracturing interference using reservoir-geomechanics-fracturing modeling. SPE J. 2019, 24, 1884–1902. [Google Scholar] [CrossRef]
  37. Lecampion, B.; Bunger, A.P.; Zhang, X.J. Numerical methods for hydraulic fracture propagation: A review of recent trends. Nat. Gas Sci. Eng. 2018, 49, 66–83. [Google Scholar] [CrossRef] [Green Version]
  38. Batchelor, G. An Introduction to Fluid Dynamics; Cambridge University Press: Cambridge, UK, 1967. [Google Scholar]
  39. Guo, X.; Wu, K.; Killough, J. Investigation of Production-Induced Stress Changes for Infill-Well Stimulation in Eagle Ford Shale. SPE J. 2018, 23, 1372–1388. [Google Scholar] [CrossRef]
  40. Dake, L.P. A Comparison of Techniques for Coupling Porous, revised ed.; Elsevier: Amsterdam, The Netherlands, 2001. [Google Scholar]
Figure 1. Setup of the two studied problems.
Sustainability 15 11209 g001
Figure 2. One-dimensional pressure and minimum horizontal principal stress changes caused by the legacy production in the old well.
Sustainability 15 11209 g002
Figure 3. Fracture footprints obtained after 6 months, 12 months, 18 months, and 24 months of legacy production. At each time step, the fracture footprints are shown for 1 s, 10 s, 20 s, and 30 s after fracturing. Footprints extending with time correspond to the results at 1 s, 10 s, 20 s, and 30 s.
Sustainability 15 11209 g003
Figure 4. Fracture width from the top view and along the line y = 0 m for fracture footprints obtained after 6 months of legacy production.
Sustainability 15 11209 g004
Figure 5. Fracture width from the top view and along the line y = 0 m for fracture footprints obtained after 12 months of legacy production.
Sustainability 15 11209 g005
Figure 6. Fracture width from the top view and along the line y = 0 m for fracture footprints obtained after 18 months of legacy production.
Sustainability 15 11209 g006
Figure 7. Fracture width from the top view and along the line y = 0 m for fracture footprints obtained after 24 months of legacy production.
Sustainability 15 11209 g007
Figure 8. The temporal changes in minor axis and major axis lengths of the fractures propagated in different minimum principal stress scenarios (6 months, 12 months, 18 months, and 24 months).
Sustainability 15 11209 g008
Figure 9. The temporal changes in minor axis and major axis lengths of the fractures propagated in different minimum principal stress scenarios (6 months, 12 months, 18 months, and 24 months). Footprints extending with time correspond to the results at 1 s, 10 s, 20 s, and 30 s.
Sustainability 15 11209 g009
Figure 10. Fracture width from the top view and along the line y = 0 m for fracture footprints when the interlayer thickness is 0.1 m.
Sustainability 15 11209 g010
Figure 11. Fracture width from the top view and along the line y = 0 m for fracture footprints when the interlayer thickness is 0.5 m.
Sustainability 15 11209 g011
Figure 12. Fracture width from the top view and along the line y = 0 m for fracture footprints when the interlayer thickness is 1.0 m.
Sustainability 15 11209 g012
Table 1. Simulation parameters in the first simulation case.
Simulation ParameterValue
Permeability0.05 mD
Porosity8%
Initial pressure20 MPa
Production pressure in the nearby well10 MPa
Young’s modulus27 GPa
Poisson’s ratio0.25
Rock density2600 kg/m3
Minimum horizontal principal stress30 MPa
Maximum horizontal principal stress35 MPa
Table 2. Simulation parameters in the second simulation case.
Simulation ParameterValue
Interlayer location1 m above the fracture initiation location
Minimum principal stress in the shale reservoir30 MPa
Interlayer thicknesses considered in the case0.1 m, 0.5 m, and 1.0 m
Minimum principal stress in the interlayer32 MPa
Permeability0.05 mD
Porosity8%
Initial pressure20 MPa
Young’s modulus27 GPa
Poisson’s ratio0.25
Rock density2600 kg/m3
Disclaimer/Publisher’s Note: The statements, opinions and data contained in all publications are solely those of the individual author(s) and contributor(s) and not of MDPI and/or the editor(s). MDPI and/or the editor(s) disclaim responsibility for any injury to people or property resulting from any ideas, methods, instructions or products referred to in the content.

