Article

An Optimization Design for the Resource Utilization of Grape Branches Based on the Orthogonal Test and Gray Relational Analysis Method

1
Research Institute of Pomology, Chinese Academy of Agricultural Sciences, Xingcheng 125100, China
2
Key Laboratory of Horticultural Crops Germplasm Resources Utilization, Ministry of Agriculture and Rural Affairs of the People’s Republic of China, Xingcheng 125100, China
3
Key Laboratory of Mineral Nutrition and Fertilizers Efficient Utilization of Deciduous Fruit Tree, Xingcheng 125100, China
*
Authors to whom correspondence should be addressed.
These authors contributed equally to this work.
Sustainability 2023, 15(14), 11211; https://doi.org/10.3390/su151411211
Submission received: 7 March 2023 / Revised: 10 June 2023 / Accepted: 8 July 2023 / Published: 18 July 2023
(This article belongs to the Section Resources and Sustainable Utilization)

Abstract

:
Composting is an environment-friendly and sustainable way to transform grape branches (GBs) into a useful product. Different parameters can differently affect fertilizer quality. Here, the compost product nutrient content was evaluated using an L9 orthogonal array (parameters, nitrogen source: chicken manure, sheep manure, urea; stirring temperature: 50, 60, 70 °C; initial pH: 6, 7, 8; conditioning agent: calcium superphosphate, zeolite, and copper sulfate). Among the treatments, the T3 (chicken manure, 70 °C, pH = 8, copper sulfate), T2 (chicken manure, 60 °C, pH = 7, zeolite), and T9 (urea, 70 °C, pH = 7, calcium superphosphate) had high gray relational grades (0.7424, 0.7132, 0.7110, respectively). The nitrogen source type (R = 0.1140) had the greatest influence on the nutrient content of the final product, followed by the stirring temperature (R = 0.1104), the conditioning agent (R = 0.0522), and the initial pH (R = 0.0408). Finally, the best nitrogen source of the grape branch compost was chicken manure, the best stirring temperature was 70 °C, the best initial pH was 7, and the best conditioning agent was zeolite. An experimental verification showed that the weighted correlation degree of the optimal treatment predicted by the orthogonal experiment increased by 3.63%.

Graphical Abstract

1. Introduction

Urban greening and agricultural activities produce a large amount of green waste every year, which will cause serious damage to the environment if it is not dealt with effectively [1,2]. Composting is a green waste disposal method and can convert organics into stabilized humus, which can be used widely in agriculture and industry to achieve a cleaner product and sustainability [3,4]. Grape branches (GBs) are a type of green waste that can be converted into organic products containing nutrients, and especially humic substances, by composting [5]. Recently, scholars have improved the composting efficiency of garden wastes by controlling the composting conditions [2,6]. Compared with fallen leaves and rank grass, GBs contain more lignin and cellulose, which is difficult to degrade, limiting their resource utilization. Therefore, optimizing composting conditions can promote the degradation of cellulose and lignin and improve the product quality [3].
The nitrogen source type, temperature, pH, and conditioning agents are important factors during composting [5,7,8,9]. Specific nitrogen sources have distinct nitrogen contents and morphology, which impact the utilization of microorganisms and final quality of the compost [10]. A suitable temperature and pH can improve the microbial activity and accelerate the degradation of crude fiber [11]. Stirring ensures adequate ventilation in the composting to ensure a proper oxygen concentration in the stack [12], while reducing the reactor temperature. Conditioning agents can effectively improve the physical and chemical conditions of the stack, react with the NH4+ in the stack to reduce nutrient loss, and speed up the composting process [5,9].
Although the factors that affect composting have been previously studied for the organic waste [7,13,14], they have not been studied in combination for the green waste. Meanwhile, there are many types of green waste (dry branches, fallen leaves, seeds, rank grass, etc.), with different degradation difficulties [5]. In addition, with the development of the grape and wine industry, a large amount of GBs are produced around the world every year [15]. Therefore, it is necessary to study the composting of GBs. To better achieve the goal of sustainable development of vineyards, our study focuses on the fertilizer properties of the compost product compared to previous studies. We establish corresponding evaluation criteria based on previous studies [16,17] and predict the optimal treatment, which will provide an effective theoretical and practical guidance for the return of GBs to the field.

2. Materials and Methods

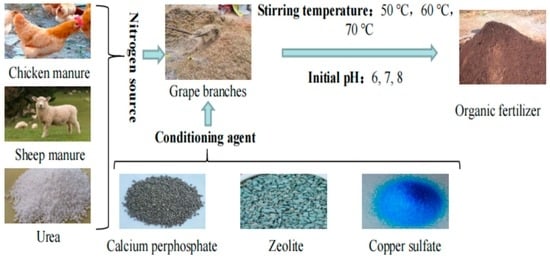
2.1. Collection of Materials

GBs, collected in the Wenquan and Lashan Demonstration Base, Research Institute of Pomology, Chinese Academy of Agricultural Sciences (Liaoning Province, China), were dried and cut to lengths of 10–25 mm. The following substances are used as sources of nitrogen during GB composting: chicken manure, sheep manure, and urea [18]. Some selected physicochemical properties of the raw materials are shown in Table 1 (a). Potassium dihydrogen phosphate and calcium oxide are used to regulate the pH of compost. These two substances are common pH regulators and widely used in compost production [19,20]. The conditioning agents used were copper sulfate, calcium superphosphate, and zeolite, which can adjust the physical and chemical properties of the stack and reduce nutrient loss. These conditioning agents have the characteristics of optimizing compost conditions and improving the quality of the compost [9,21].
Chicken manure was purchased from the Xingcheng broiler farm and sheep manure was purchased from Xilin Gol League, Inner Mongolia. Urea was purchased from Lianmeng Co., Ltd. (Shandong, China). Potassium dihydrogen phosphate was purchased from Yuda Co., Ltd. (Sichuan, China). Calcium superphosphate was purchased from Chuming Co., Ltd. (Hubei, China).

2.2. Experimental Design

2.2.1. Orthogonal Test

Orthogonal testing is an efficient, fast, and economical test design method and is widely used in many fields [22,23]. The orthogonal experimental design in this study included L9 orthogonal arrays to organize these process parameters at possible combinations of factors and their levels to get a robust design. Table 1 (b) shows factors and their levels of the process parameters.
We added GBs and the nitrogen source to adjust the carbon–nitrogen ratio (C/N) to 30. The dosage of the conditioning agent was 5% by weight of dry matter. We used calcium oxide and potassium dihydrogen phosphate to adjust the initial pH to 6, 7, and 8. The water content of the reactor was maintained at about 60%. In the process of fermentation, we added no bacterial agent. Native bacteria were used for natural fermentation. The experimental design of the current investigation is displayed in Table 1 (c).
Each compost stack was 1.5 m long, 1 m wide, and 0.8 m high. The temperature was measured once a day. Samples were collected every 10 days to measure the physical and chemical indexes.
Composting was performed for 112 days, from 11 July 2021 to 31 October 2021, at the Wenquan Base Grape Core Technology Demonstration Park, Research Institute of Pomology, Chinese Academy of Agricultural Sciences.

2.2.2. Gray Relational Analysis

The gray relational analysis method was proposed in the gray system theory. This theory is based on the comparison of a development trend and the degree of dissimilarity between the data columns of several factors in a system. The purpose of the method is to judge the degree of closeness of the correlation and the behavior of the examined factors [24].
The different treatments of GB composting were examined as a gray system:
u = u (i),
where u stands for treatment; i = integers from 0 to 9, and i = 0 is the ideal compost and each nutrient component is calculated according to the highest content between treatments: i = 1, u (1) is T1; i = 2, u (2) is T2; … i = 9, u (9) is T9. The ideal compost sample sequence
{ x 0 ( k ) } = { x 0 ( 1 ) , x 0 ( 2 ) , x 0 ( 3 ) , x 0 ( 4 ) , x 0 ( 5 ) , x 0 ( 6 ) , x 0 ( 7 ) }
was set as the reference sequence, and
{ x i ( k ) } = { x i ( 1 ) , x i ( 2 ) , x i ( 3 ) , x i ( 4 ) , x i ( 5 ) , x i ( 6 ) , x i ( 7 ) }
was set as the compared sequence, where i is the composting treatment sequence number, x stands for nutrient category, and k is taken as integers 1–7.
The basic formula for a correlation analysis is the correlation coefficient (L0i) formula, which can be expressed as follows in the evaluation process:
L 0 i k = m i n i     m i n k x 0 k x i k + ρ m a x i   m a x k x 0 k x i k x 0 k x i k + ρ m a x i   m a x k x 0 k x i k .
where ρ is the resolution coefficient (approximately 0–1), and is generally taken as 0.5. The degree of correlation between the compared sequence { x i ( k ) } and the reference sequence { x 0 ( k ) } can be calculated using Equation (3):
r 0 i = 1 7 k = 1 7 L 0 i k .
According to the gray relational grade (r0i), the similarity between different composting treatments and the ideal compost can be determined. The larger the r0i, the closer the compost is under that treatment condition to the ideal compost.

2.3. Analytical Procedure

2.3.1. Physical Analyses

The stack temperature was measured using a mechanical thermometer and recorded daily. Particle-size distribution and Coarseness index (CI) were determined according to Gabhane et al., [9]. Air-dried compost samples were shaken on sieves with openings of 0.3, 1, 2, and 5 mm (3 min of shaking on each sieve size). The material retained on each sieve was weighed. The CI—i.e., a percentage (based on air-dried weight) of particles > 1 mm—was calculated [5]. The bulk density (BD), water-holding capacity (WHC), and porosity were determined as described by Yin et al. [5]. The void ratio (VR) was the ratio of the aerated porosity (AP) to water-filled porosity, and was determined as described by Yin et al. [5]. For the determination of these properties, the air-dried sample was first placed in a 100-cm3 ring knife (M0), which was weighted (M1). The ring knife was then placed in distilled water and was then removed from the water after 24 h (M2). The lid of the ring knife was removed, and the ring knife was sealed with water-permeable gauze. Then, the ring knife with the saturated compost was placed upside down on a screen until the water stopped dripping from the bottom for about 4 h. When the water had stopped dripping, the ring knife was weighed and recorded as M3. Finally, the ring knife was oven-dried at 65 °C until the weight (M4) did not change. BD (g/cm3) = (M4 − M0)/100; WHC (%) = 100 (M3 − M1)/(M1 − M0); total porosity (TPS) (%) = 100 (M2 − M4)/100; AP (%) = 100(M2 − M3)/100; WFP (%) = TPS − AP; and VR = AP/WFP. The above physical properties are commonly used to evaluate composting efficiency and compost maturity [5,9].

2.3.2. Chemical Analyses

The pH was determined for a filtrate (Wcompost/Vdistilled water = 1/10) using a SevenCompact pH meter (METTLER TOLEDO, Swiss). The electrical conductivity (EC) value was determined for a filtrate (Wcompost/Vdistilled water = 1/5) using a DDS-307 digital conductivity meter (DAPU, China). The organic matter content was determined using the high-temperature external heat potassium dichromate oxidation method. The total humic acid (THA) content was determined using the sodium pyrophosphate–sodium hydroxide extraction of potassium dichromate oxidation capacity method. Available phosphorus (AP) was extracted with 50 ml of 0.5 M NaHCO3 (1:20 ratio for 0.5 h) and determined using a flow analyzer (Futura AMS Alliance, Paris, France). Available potassium (AK) was extracted with 50 ml of 1 M NH4OAc (1:20 ratio for 0.5 h) and determined using flame photometry. NH4+-N and NO3-N (AN) were extracted using 50 mL of 2 M KCl (1:20 ratio for 1 h) and determined using a flow analyzer (Futura AMS Alliance, France). Available calcium (ACa) and magnesium (AMg) were extracted with 50 mL of 1 M NH4OAc (1:20 ratio for 0.5 h), diluted with 30 g/L SrCl2·6H2O, and determined using an atomic absorption spectrometer (ZEENIT 700P, Jena, Germany).

2.3.3. Seed Germination Test

First, a filter paper in a sterile Petri dish was wetted with a filtrate (1 g of compost with 10 mL of water). Distilled water (CK, the control) was used as the control. After 10 green stem cabbage (Hebei, China) seeds were spread on the filter paper in each dish, the dishes were incubated for 48 h at 25 °C in the dark. The seed germination rate (SGR), root length (RL), and germination index (GI) were then calculated according to Yin et al. [5]: GI (%) = (mean number of germinated seeds in the treatment × mean RL in the treatment × 100)/(mean number of germinated seeds in the CK × mean RL in the CK).

2.4. Statistical Analysis

Data processing was performed with Microsoft Office 2016, and statistical analysis was completed using R-4.04. Analysis of variance (ANOVA) was used to determine whether the effects were significant. When ANOVA was significant (p < 0.05), the means were separated with an LSD test at p < 0.05.

3. Results and Discussion

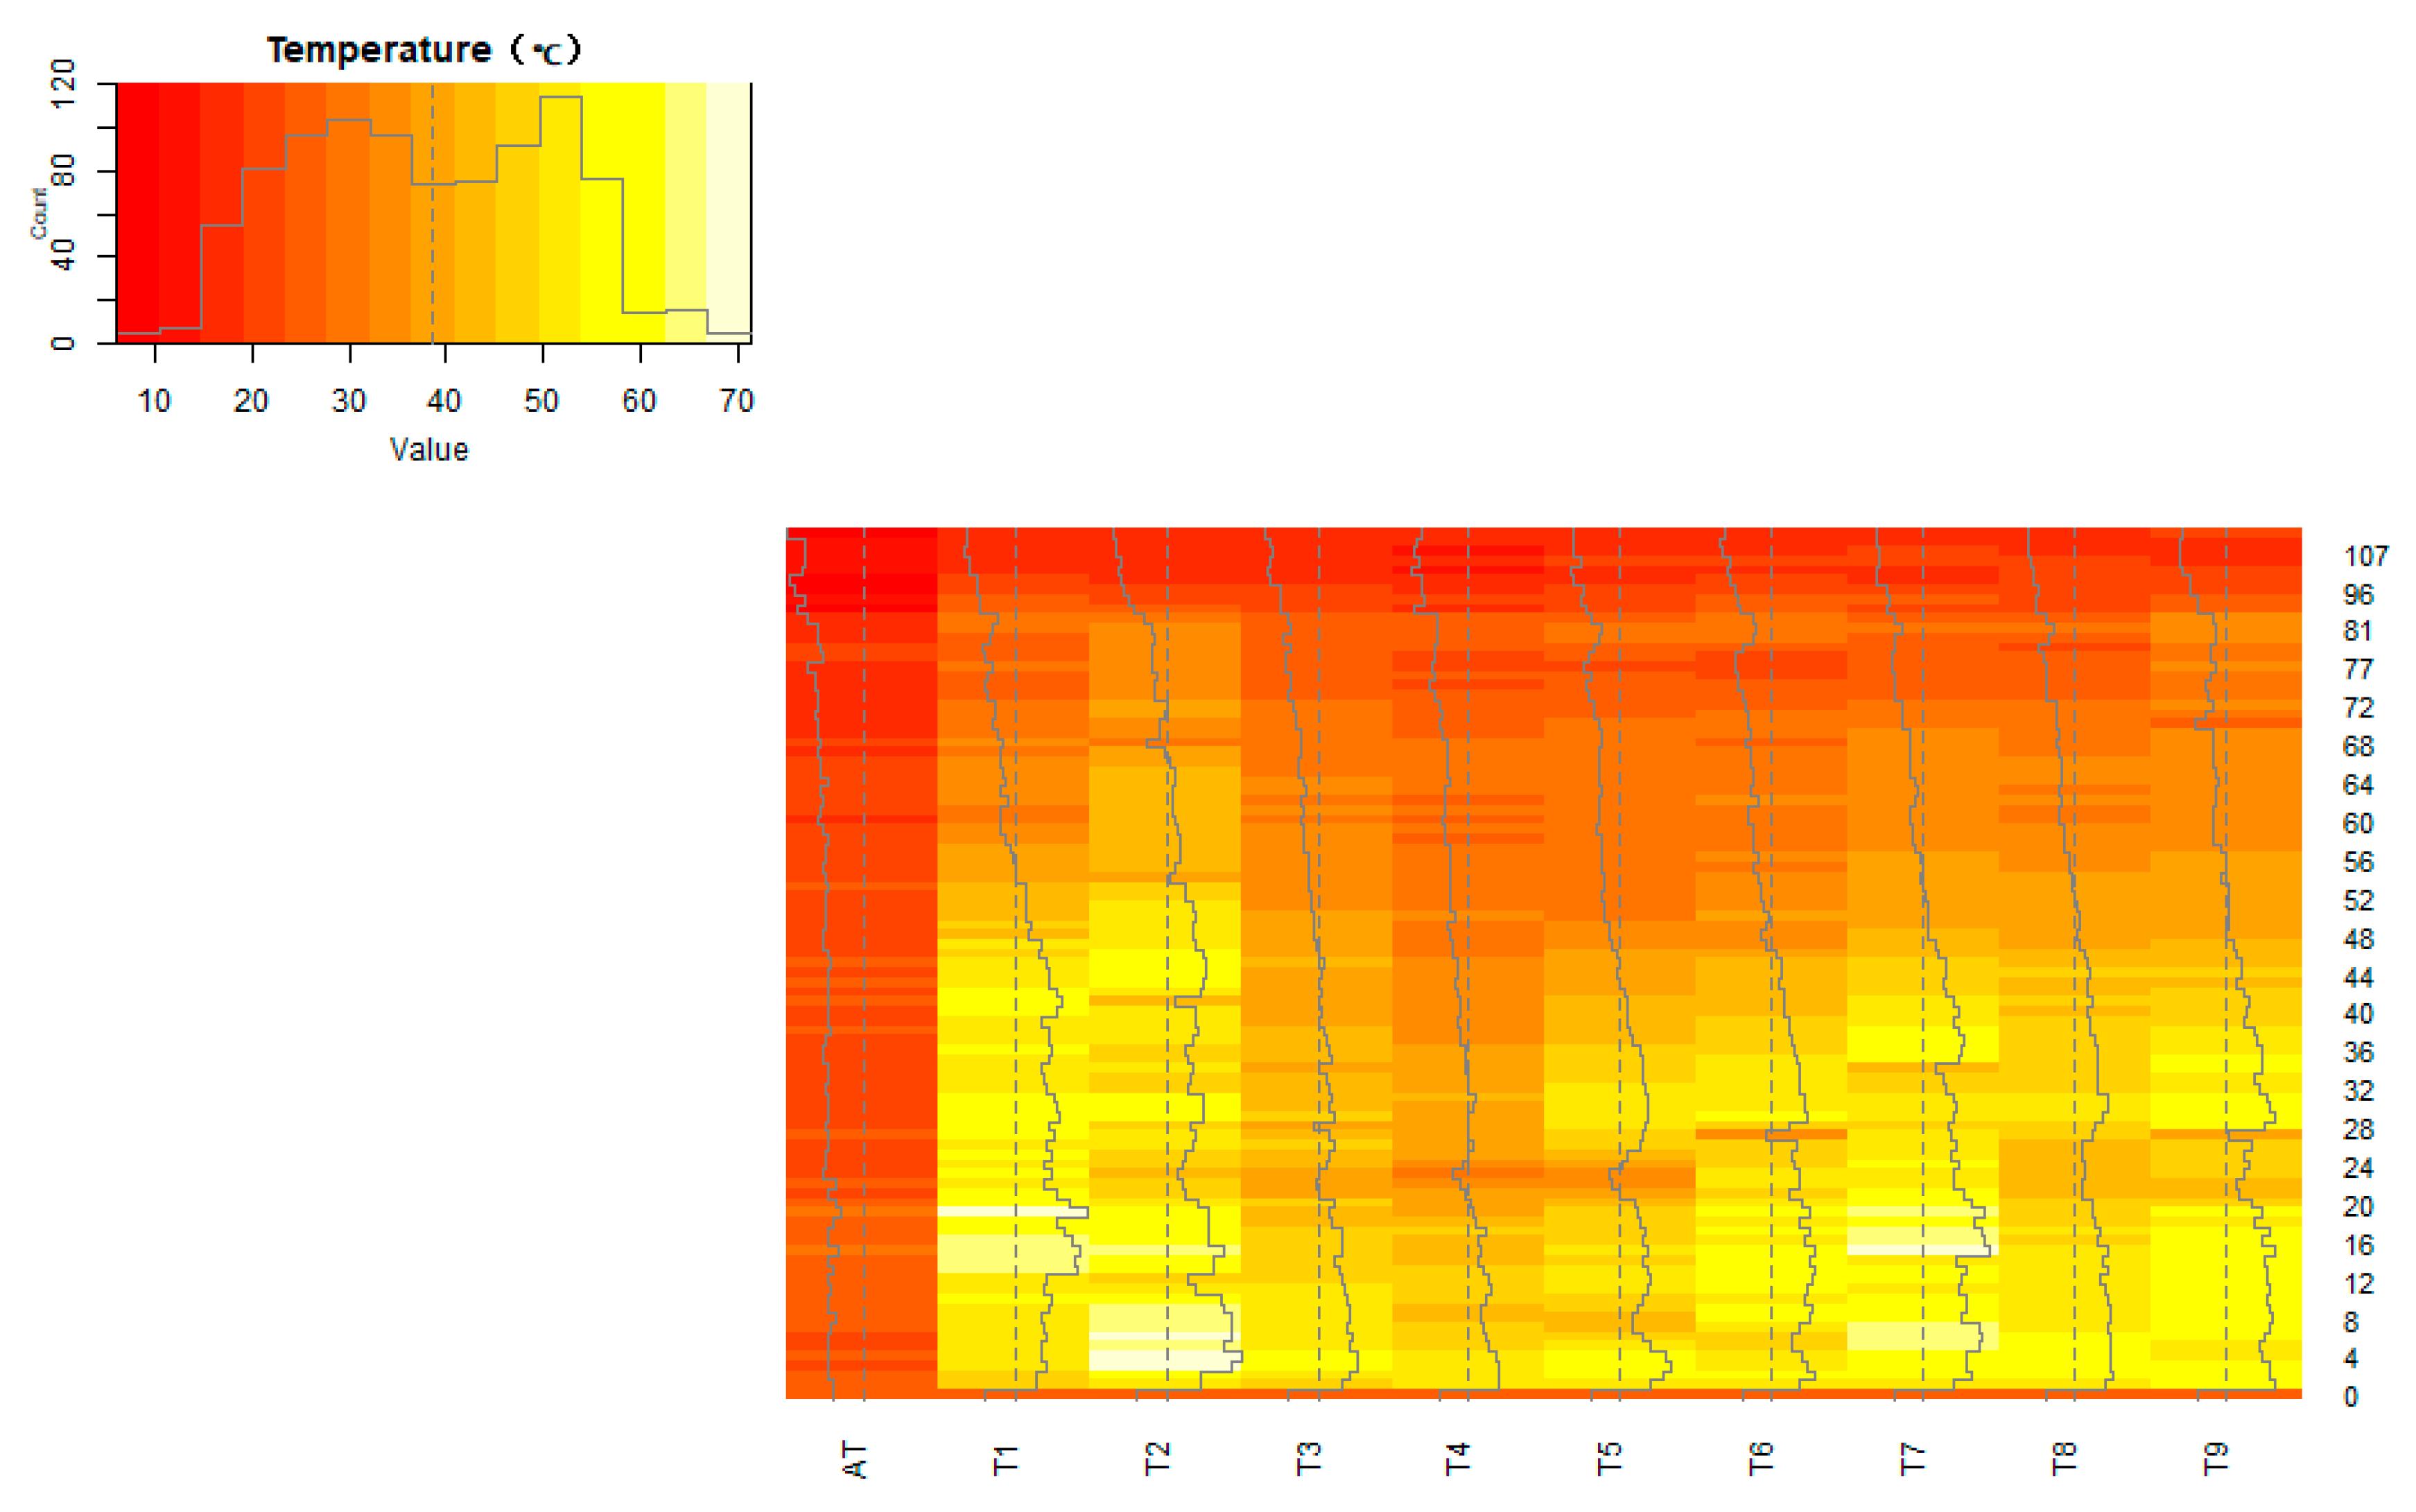
3.1. Effect of Different Conditions on the Temperature during the Composting Process

Temperature can directly reflect the activity of microorganisms in a compost system [25]. In the early stage of composting, the microorganisms were active, and the temperature of each treatment increased rapidly. The temperature of each stack was maintained at 50–60 °C for more than 3 days to meet the requirements of disinfection in the compost [1]. Differences in the temperature changes among treatments occurred over time (Figure 1). T2 and T1 maintained a high temperature for the longest time, with the high temperature above 50 °C for 52 days and 46 days, respectively. Fresh chicken manure contains more active microorganisms which are more active under neutral-to-weakly acidic conditions [26]. Therefore, the duration of the elevated temperatures for T1 and T2 was longer than for other treatments and the temperature of the reactor was the highest, exceeding 70 °C. The duration of the elevated temperatures for T3, T4, and T8 were shorter than those for T1 and T2. This may be related to the addition of copper sulfate. When Cu2+ fixed nitrogen, it also destroyed the structure and function of enzymes and inhibited the normal life activities of microorganisms, resulting in a shorter duration of elevated temperatures than other treatments with the same nitrogen source [27].

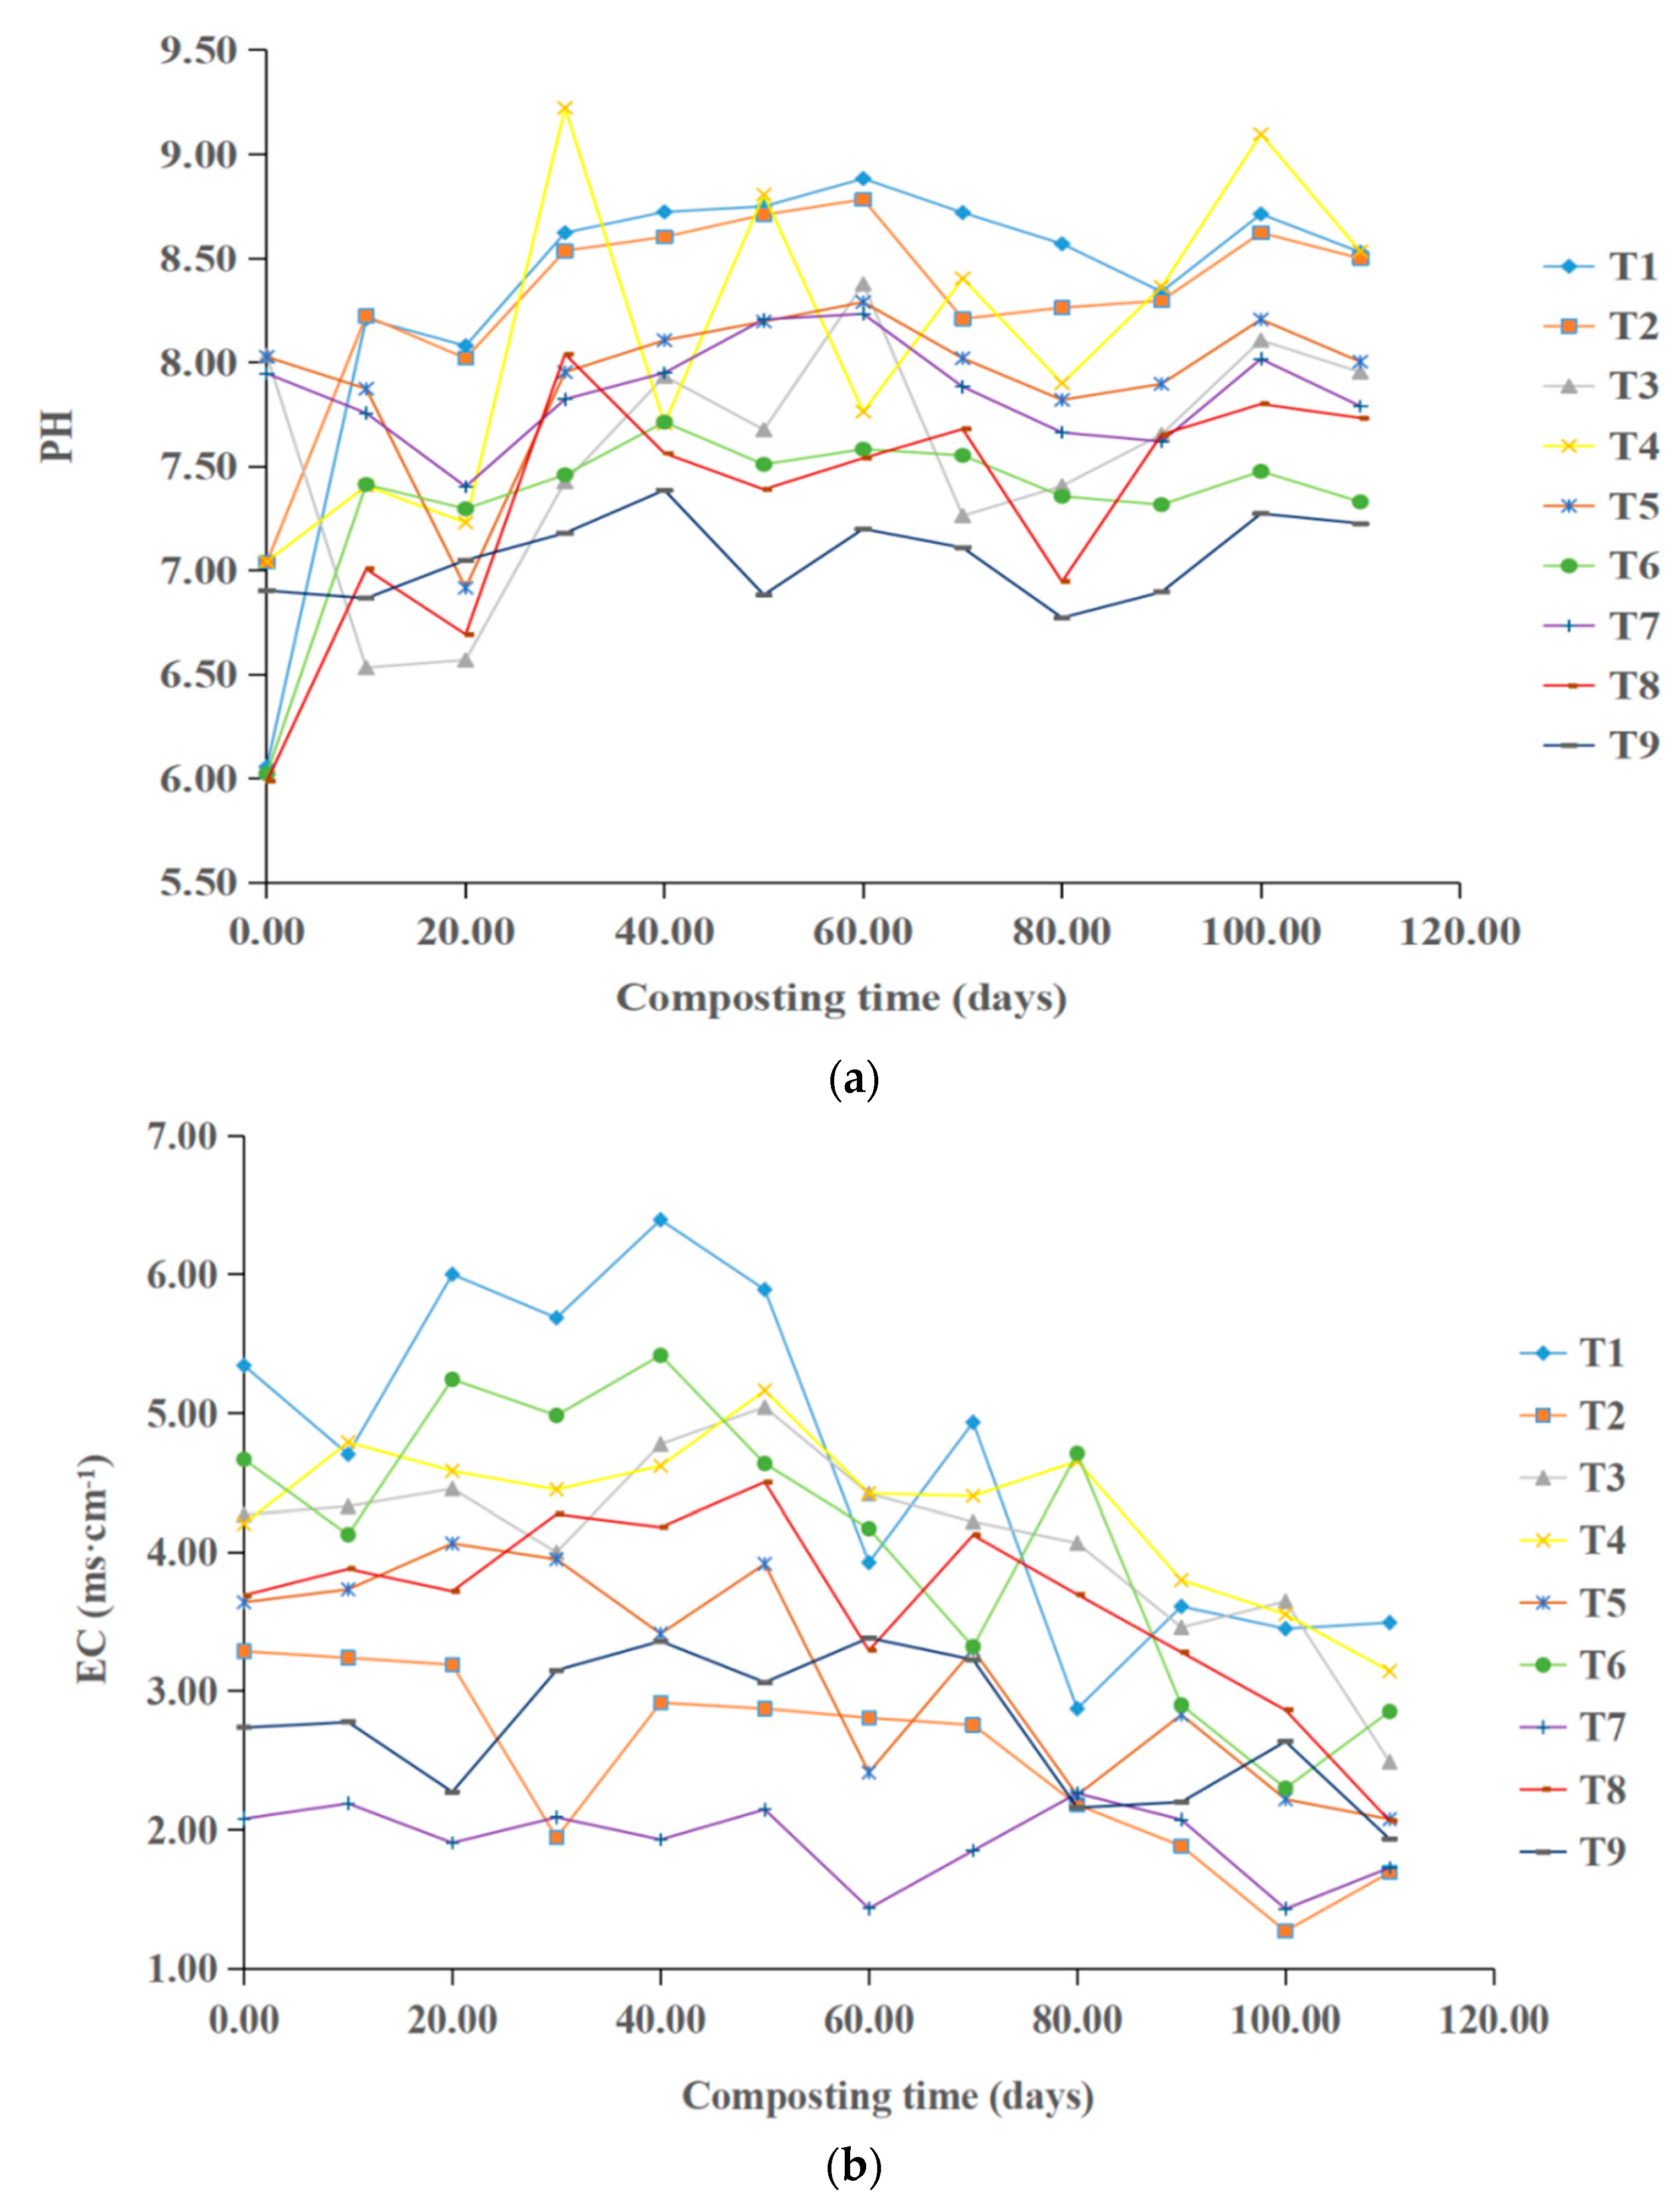
3.2. Effect of Different Conditions on the pH and Electrical Conductivity of the Compost Product

The pH changes for the nine treatments differed (Figure 2a). Compared to the pH before composting, the pH significantly (p < 0.05) increased in 6 treatments (T1, 40.76%; T2, 20.74%; T4, 21.16%; T6, 21.76%; T8, 29.05%; and T9, 4.78%). T3 and T7 experienced no significant decreases in pH and there was only a minor change in pH in T5. During the composting process, the increase in pH may be related to the degradation of organic acids and the accumulation of NH4+ [28]. The NH4+-N contents were lower after T1, T2, T6, and T8 than that at the beginning of composting. The increase in pH for these treatments may have been primarily owing to the decomposition of organic acids in the process of composting. The NH4+-N content increased in T4 and T9 during composting. Proteins and urea can be broken down by microorganisms to produce NH4+, causing the pH to increase [7]. The main reason for the decrease in pH in T3, T5, and T7 was that the stack was a complex reactor and had a certain self-regulating ability. A higher pH will inhibit the life activities of microorganisms, so microorganisms work to reduce the pH value of the reactor in various ways, such as producing organic acids and CO2, so that the conditions of the reactor change in the direction suitable for microbial survival [29]. However, this self-regulating ability is limited, so the decrease in pH may be indiscernible.
After composting, the EC values decreased to varying degrees in the nine treatments (Figure 2b). T2 demonstrated the greatest decrease at 48.63%. T7 experienced the least decrease at 16.83%. Chicken manure and sheep manure have higher EC values owing to their own complex nutrient content and total ions. In the process of fermentation, with the addition of water, some of the ions were lost, reducing the ion concentration in the stack [30]. Additionally, further evaporation of ammonia will reduce the EC value [11]. Related studies have shown that when the EC value is greater than 4 ms/cm, the composting product may have phytotoxicity, negatively impacting crop growth [14]. Each of the nine treatments met the requirements of farmland application after composting, despite T1, T3, T4, and T6 having initial EC values exceeding 4 ms/cm. The EC value was reduced through composting to meet the requirements of farmland application. However, the excessive reduction of EC also indicates a serious loss of soluble mineral nutrients during the composting process. This has a negative impact on the quality of composted products [31]. The initial EC value in T2 was within a reasonable range, but dropped more than other treatments during composting, resulting in a loss of nutrients. The same problem was evident in T5, T7, T8, and T9. Volatilization of NH3 and CO2 [32], accumulation of soluble ions, and mineralization of composting materials [33] are the main reasons for the decrease in EC when composting livestock and poultry manure. In T5, although livestock manure was not added, the available potassium content decreased substantially after composting. The loss of soluble ions may be the main reason for this decrease of EC.

3.3. Effect of Different Conditions on Phytotoxicity of the Compost Product

The germination index can be used to evaluate the phytotoxicity of composting products [34]. The higher the GI, the weaker the phytotoxicity of composting products [6,35,36]. The process of composting can degrade, transform, and accumulate harmful substances to reduce phytotoxicity [37]. Of the 9 treatments, the GI in T7 was the greatest at 188%, followed by T4 and T9 at 175% and 162%, respectively (Table 2). The germination index is affected by the EC of compost products. The higher the EC value at the end of compost, the lower the GI. Elevated EC values will have a negative impact on the germination of seeds [3].
Substances produced in compost that are phytotoxic, such as low molecular weight organic acids and inorganic nitrogen, can inhibit seed germination [13]. Because of the elevated temperatures, the maintenance time in T3 was substantially shorter than that in the other two treatments with added chicken manure (T1, T2). The pH value was the lowest in T3 among the three treatments with chicken manure as a nitrogen source. The higher organic acid content and other substances may have reduced the GI [38]. Concurrently, NH4+ and Cu2+ in high concentrations also resulted in a low seed germination rate.

3.4. Effect of Different Conditions on Organic Matter and Total Humic Acid of the Compost Product

The variation of organic matter in the composting process reflects the decomposition of GB by microorganisms. The organic matter degradation rates of the 9 treatments were 28.72%, 20.75%, 4.37%, 8.44%, 13.33%, 9.64%, 2.37%, 6.17%, and 6.02%, respectively (Table 3). In general, the organic matter degradation rate of urea as a nitrogen source was significantly lower than that of chicken manure as a nitrogen source (p < 0.05). As the types and contents of microorganisms in urea were lower than those in the chicken manure treatment, the degradation rate of organic matter was lower than that in the chicken manure treatment [26]. Stirring the stack can reduce the temperature of a reactor and avoid elevated stack temperatures, which inhibit the life activities of microorganisms. At the same time, stirring can improve porosity and oxygen concentration, promote microbial respiration, and accelerate GB decomposition. For GB compost fermentation, the degradation rate of organic matter is the highest at 60 °C. Under conditions close to 60 °C, the enzyme activity is higher, thus promoting the decomposition of cellulose and other macromolecular substances [39].
Humic acid is a kind of polymer complex organic colloid which can improve the activity of polyphenol oxidase in plants, thus accelerating the metabolism and dry matter accumulation of crops. Organic matter can be transformed into humus after mineralization and saponification [40]. The species and activity of microorganisms are closely related to the transformation of organic matter and the formation of humic acid. NH4+ is a precursor to humic acid formation. T2, T3, and T9 treatments had higher NH4+ and humic acid contents [41].

3.5. Effect of Different Conditions on the Particle-Size Distribution and Coarseness Index of the Compost Product

The particle-size distribution is relevant to compost maturity because it indicates the extent of the degradation of complex substances [5]. Due to the large particle size, it is difficult for GB to decompose, and the CI of all final compost products is generally higher than the requirements of general compost [9]. The CI in T1 was the lowest at 59.94%, compared to above 70% in other treatments, with T3, T5, T6, T7, and T8 over 80% (Table 4). In this study, treatment with chicken manure as the nitrogen source effectively reduced the CI value of compost products. Meanwhile, pH influenced the CI value of compost products. The treatments with an initial pH of 8 had a larger CI value. Under the condition of a higher pH, the growth of microorganisms was inhibited and the decomposition effect of microorganisms on GB was reduced [42]. At the beginning of the treatment with chicken manure, the content of available mineral nutrients was higher, which provided nutrients required for the growth of microorganisms, thus improving the particle size distribution of compost [3].

3.6. Effect of Different Conditions on the Mineral Nutrient of the Compost Product

GB can break down and release mineral nutrients, such as N, P, K, Ca, and Mg, for the direct absorption and utilization by plants, which are essential for plant growth [43]. In this study, the amount of available calcium was substantially increased in all nine compost treatments (Table 3). Among them, T7 had the greatest increase in available calcium content, which was up to 76.11%. The increase of available calcium content cannot be separated from the activity of microorganisms, which can convert calcium oxalate, pectate calcium, and other storage calcium in organic materials into active calcium [44], thus improving the calcium utilization rate.
After composting, the available potassium content in T2 and T7 increased, while that in T1 remained stable. T2 and T7 included zeolite as the conditioning agent. The loose and porous nature of zeolite and its large surface area can adsorb more potassium elements, thus reducing the loss of elemental potassium introduced by water runoff [45].
The type of conditioning agent had a pronounced effect on the change in the available magnesium. Zeolite can effectively promote the increase of available magnesium content in the composting process. T6 increased the available magnesium content by 28.28%, while the available magnesium increase in T4 was minimal at only 6.96%. Under alkaline conditions, the content of magnesium ions is reduced, while a lower pH value favors magnesium in the form of ions [46] to increase the available magnesium content in the compost.
Specific nitrogen sources produce distinct changes in available phosphorus content. The nitrogen source for T1, T2, and T3 was chicken manure, and the available phosphorus content of the 3 treatments was increased after composting by 36.02%, 3.76%, and 77.09%, respectively. The effect of chicken manure in improving the available phosphorus content was remarkably better than that of sheep manure and urea. A lower initial pH promotes an increase in available phosphorus content during composting [47]. The available phosphorus contents in T1 and T8 increased by 0.58 and 0.10 mg/g, respectively. A higher available phosphorus content tends to inhibit phosphorus release during composting and may even lead to the loss of available phosphorus [48].
In the 9 composting treatments, compared to conditions before composting, NO3-N content increased only in treatments T1 and T2 (33.15% and 51.42%, respectively), and decreased in the other treatments. T4 and T6 showed the largest decreases, decreasing by 77.57% and 67.38%, respectively. The NH4+-N contents of treatments T4, T5, and T9 increased by 13.42%, 14.66%, and 5.66%, respectively, after composting. However, the NH4+-N contents in other treatments decreased, among which the decreases in T1, T2, T6, and T7 treatments were significant (36.80–54.64%). These four treatments were maintained at elevated temperatures for extended times, causing the NH4+ to be altered into NH3 and escape into the atmosphere [10]. Furthermore, the higher pH value of the stack led to NH4+ loss [49].

3.7. Analysis of GB Composting Effects

3.7.1. Gray Relational Analysis of GB Composting

The mean values of each index of 10 composting treatments (including the ideal treatment) were nondimensionalized by the initial value method. Then, 9 treatments were compared with the ideal treatment and the correlation coefficients of each index between the nine treatments and the ideal treatment were obtained. Finally, according to Winarso [16], Zheng [17], and the weighting factors (the weight of each indicator was successively: 2:2:2:2:2:3:1), we calculated the degree of correlation between the 9 treatments and the ideal treatment (Table 5).
The optimization of a single gray relation grade (GRG) can be transformed into the optimization of multi-performance characteristics. The better the multiple performance attributes, the greater the GRG. Table 5 shows that in the experiment sequence T3, the process parameter configuration has the greatest GRG. Therefore, the third experiment provided the best multiple performance features out of the nine gray relational analysis experiments. In terms of the parameters’ nitrogen source type (a), the stirring temperature (b), the initial pH (c), and the conditioning agents (d), the combination of a1 (chicken manure), b3 (70 °C), c3 (pH = 8), and d3 (copper sulfate) exhibited a more significant GRG for each and was therefore the ideal parameter combination for multi-performance characteristics.

3.7.2. Prediction of Optimal Conditions for GB Composting

The degree of the equal weight correlation between each treatment and the ideal treatment was set as the evaluation index. An orthogonal test analysis was conducted using R-4.04 (Table 6).
According to the R value, the order of importance of the four factors was: nitrogen source > stirring temperature > conditioning agent > initial pH value. The orthogonal test method predicted that the optimal fermentation condition was a1b3c2d2, meaning that the optimal nitrogen source was chicken manure as a nitrogen source, a stirring temperature of 70 °C, initial pH of 7, and zeolite as conditioning agent. Under this condition, the contents of available calcium, potassium, magnesium, phosphorus, nitrogen, THA, and OM were 17.99 mg/g, 14.00 mg/g, 3.89 mg/g, 1.24 mg/g, 184.63 mg/kg, 25.59 g/kg, and 398.05 g/kg, respectively. After adding the optimal treatment, the correlation degree of T3 was 0.6771, and that of the optimal treatment was 0.7017, which increased by 3.63%.

4. Conclusions

We employed an orthogonal test design centered on gray relational analysis for optimizing composting. The highest gray relational grade was obtained when the nitrogen source was chicken manure, the stirring temperature was 70 °C, the initial pH was 8, and the conditioning agent was copper sulfate. Among the many factors of GB compost, the nitrogen source type (R = 0.1140) had the greatest influence on the nutrient content of the final product, followed by the turning temperature (R = 0.1104), conditioning agent (R = 0.0522), and initial pH (R = 0.0408). The optimal nitrogen source type was chicken manure, the optimal stirring temperature was 70 °C, the optimal conditioning agent was zeolite, and the optimal initial pH was 7. After optimization, the weighted correlation degree increased by 3.63% compared with the T3 treatment.

Author Contributions

M.Y.: Conceptualization, Software, Formal analysis, Data curation and Writing—Original Draft; Y.Z.: Conceptualization, Writing—Reviewing, Editing, and Methodology; X.W. (Xiaodi Wang): Investigation; Z.W.: Data curation and Resource; P.L.: Methodology, Investigation; X.S.: Methodology; X.W. (Xiaolong Wang): Methodology; B.W.: Methodology and Project administration; Y.L.: Methodology; Y.M.: Methodology; F.L.: Funding acquisition, and Project administration; H.W.: Methodology, Revision, Funding acquisition, and Project administration. All authors have read and agreed to the published version of the manuscript.

Funding

This work was supported by the earmarked fund for the China Agriculture Research System (CARS-29); the Agricultural Science and Technology Innovation Program, Chinese Academy of Agricultural Sciences (CAAS-ASTIP-2021-RIP-04); and the National Key Research and Development Program of China (2020YFD1000204).

Institutional Review Board Statement

Not applicable.

Informed Consent Statement

Not applicable.

Data Availability Statement

Not applicable.

Conflicts of Interest

The authors declare no conflict of interest.

References

  1. Wang, W.; Zhang, L.; Sun, X. Improvement of two-stage composting of green waste by addition of eggshell waste and rice husks. Bioresour. Technol. 2021, 320, 124388. [Google Scholar] [CrossRef] [PubMed]
  2. Liu, L.; Wang, S.; Guo, X.; Zhao, T.; Zhang, B. Succession and diversity of microorganisms and their association with physicochemical properties during green waste thermophilic composting. Waste Manag. 2018, 73, 101–112. [Google Scholar] [CrossRef] [PubMed]
  3. Wang, G.; Yang, Y.; Kong, Y.; Ma, R.; Yuan, J.; Li, G. Key factors affecting seed germination in phytotoxicity tests during sheep manure composting with carbon additives. J. Hazard. Mater. 2022, 421, 126809. [Google Scholar] [CrossRef] [PubMed]
  4. Jiang, Z.W.; Meng, Q.R.; Niu, Q.Q.; Wang, S.S.; Yan, H.L.; Li, Q.L. Understanding the key regulatory functions of red mud in cellulose breakdown and succession of β-glucosidase microbial community during composting. Bioresour. Technol. 2020, 318, 124265. [Google Scholar] [CrossRef]
  5. Yin, Z.; Zhang, L.; Li, R. Effects of additives on physical, chemical, and microbiological properties during green waste composting. Bioresour. Technol. 2021, 340, 125719. [Google Scholar] [CrossRef]
  6. Zhang, L.; Sun, X. Changes in physical, chemical, and microbiological properties during the two-stage composting of green waste due to the addition of β-cyclodextrin. Compost Sci. Util. 2019, 27, 46–60. [Google Scholar] [CrossRef]
  7. Cao, Y.; Wang, X.; Bai, Z.; Chadwick, D.; Misselbrook, T.; Sommer, S.D.; Qin, W.; Ma, L. Mitigation of ammonia, nitrous oxide and methane emissions during solid waste composting with different additives: A meta-analysis. J. Clean. Prod. 2019, 235, 626–635. [Google Scholar] [CrossRef]
  8. Ekinci, K.; Keener, H.M.; Elwell, D.L. Composting short paper fiber with broiler litter and additives: Part I: Effects of initial pH and carbon/nitrogen ratio on ammonia emission. Compost. Sci. Util. 2000, 8, 160–172. [Google Scholar]
  9. Gabhane, J.; William, S.P.; Bidyadhar, R.; Bhilawe, P.; Anand, D.; Vaidya, A.N.; Wate, S.R. Additives aided composting of green waste: Effects on organic matter degradation, compost maturity, and quality of the finished compost. Bioresour. Technol. 2012, 114, 382–388. [Google Scholar] [CrossRef]
  10. Zhong, X.Z.; Zeng, Y.; Wang, S.P.; Sun, Z.Y.; Tang, Y.Q.; Kida, K. Insight into the microbiology of nitrogen cycle in the dairy manure composting process revealed by combining high-throughput sequencing and quantitative PCR. Bioresour. Technol. 2020, 301, 122760. [Google Scholar] [CrossRef]
  11. Guo, H.H.; Gu, J.; Wang, X.J.; Yu, J.; Nasir, M.; Zhang, K.Y.; Sun, W. Microbial driven reduction of N2O and NH3 emissions during composting: Effects of bamboo charcoal and bamboo vinegar. J. Hazard. Mater. 2020, 390, 121292. [Google Scholar] [CrossRef] [PubMed]
  12. Zhang, L.U.; Sun, X. Using cow dung and spent coffee grounds to enhance the two-stage co-composting of green waste. Bioresour. Technol. 2017, 245, 152–161. [Google Scholar] [CrossRef] [PubMed]
  13. Chen, Z.Q.; Fu, Q.Q.; Cao, Y.S.; Wen, Q.X.; Wu, Y.Q. Effects of lime amendment on the organic substances changes, antibiotics removal, and heavy metals speciation transformation during swine manure composting. Chemosphere 2021, 262, 128342. [Google Scholar] [CrossRef]
  14. Li, X.; Shi, X.S.; Lu, M.Y.; Zhao, Y.Z.; Guo, R.B.; Peng, H. Improved nitrogen conservation capacity during composting of dairy manure amended with oil shale semi-coke as the porous bulking agent. J. Hazard. Mater. 2020, 388, 121742. [Google Scholar] [CrossRef] [PubMed]
  15. Jindo, K.; Goron, T.L.; Pizarro, T.P.; Sánchez, M.M.Á.; Audette, Y.; Deolu, A.A.O.; Van, D.W.A.; Goitom, T.M.; Shenker, M.; Pombo, S.C.; et al. Application of biostimulant products and biological control agents in sustainable viticulture: A review. Front. Plant Sci. 2022, 13, 932311. [Google Scholar] [CrossRef]
  16. Winarso, S.; Pandutama, M.H.; Purwanto, L.D. Effectivity of humic substance extracted from palm oil compost as liquid fertilizer and heavy metal bioremediation. Agric. Agric. Sci. Proc. 2016, 9, 146–157. [Google Scholar] [CrossRef] [Green Version]
  17. Zheng, C.S.; Lan, X.; Tan, Q.L.; Zhang, Y.; Gui, H.P.; Hu, C.X. Soil application of calcium and magnesium fertilizer influences the fruit pulp mastication characteristics of Nanfeng tangerine (Citrus reticulata Blanco cv. Kinokuni). Sci. Hortic. 2015, 191, 121–126. [Google Scholar] [CrossRef]
  18. Mariano, E.; Sant Ana Filho, C.R.; Bortoletto-Santos, R.; Bendassolli, J.A.; Trivelin, P.C.O. Ammonia losses following surface application of enhanced-efficiency nitrogen fertilizers and urea. Atmos. Environ. 2019, 203, 242–251. [Google Scholar] [CrossRef]
  19. Wang, X.; Selvam, A.; Wong, J.W. Influence of lime on struvite formation and nitrogen conservation during food waste composting. Bioresour. Technol. 2016, 217, 227–232. [Google Scholar] [CrossRef]
  20. Wang, X.; Selvam, A.; Lau, S.S.S.; Wong, J.W. Influence of lime and struvite on microbial community succession and odour emission during food waste composting. Bioresour. Technol. 2018, 247, 652–659. [Google Scholar] [CrossRef]
  21. Liao, C.S.; Yuan, S.Y.; Huang, B.H.; Chang, B.V. Removal of organic toxic chemicals using the spent mushroom compost of Ganoderma lucidum. J. Environ. Monit. 2012, 14, 1983. [Google Scholar] [CrossRef]
  22. Shivanand, C.; Ashwin, G. Optimization of enzymatic hydrolysis of bamboo biomass for enhanced saccharification of cellulose through Taguchi orthogonal design. J. Environ. Chem. Eng. 2021, 9, 104807. [Google Scholar]
  23. Chen, Y.; Wen, X.; Liu, S. Analysis of the Factors Influencing the Sludge Aerobic Microbial Compost Using Orthogonal Mode. Inf. Technol. J. 2013, 12, 4715–4719. [Google Scholar]
  24. Deng, J. Control problem of grey systems. Syst. Control Lett. 1982, 1, 288–294. [Google Scholar]
  25. Rich, N.; Bharti, A.; Kumar, S. Effect of bulking agents and cow dung as inoculant on vegetable waste compost quality. Bioresour. Technol. 2018, 252, 83–90. [Google Scholar] [CrossRef] [PubMed]
  26. Alcaraz, L.D.; Hernández, A.M.; Peimbert, M. Exploring the cockatiel (Nymphicus hollandicus) fecal microbiome, bacterial inhabitants of a worldwide pet. Peer J. 2016, 4, e2837. [Google Scholar] [CrossRef] [Green Version]
  27. Chen, Y.; Cheng, J.J.; Kurt, S.C. Inhibition of anaerobic digestion process: A review. Bioresour. Technol. 2008, 99, 4044–4064. [Google Scholar] [CrossRef]
  28. Cegarra, J.; Alburquerque, J.A.; Gonzalvez, J.; Tortosa, G.; Chaw, D. Effects of the forced ventilation on composting of a solid olive-mill by-product (“alperujo”) managed by mechanical turning. Waste Manag. 2006, 26, 1377–1383. [Google Scholar] [CrossRef]
  29. Li, S.; Huang, G.; An, C.; Yu, H. Effect of different buffer agents on in-vessel composting of food waste: Performance analysis and comparative study. J. Environ. Sci. Health Part A 2013, 48, 772–780. [Google Scholar] [CrossRef]
  30. Biemelt, D.; Schapp, A.; Kleeberg, A.; Grünewald, U. Overland flow, erosion, and related phosphorus and iron fluxes at plot scale: A case study from a non-vegetated lignite mining dump in Lusatia. Geoderma 2005, 129, 4–18. [Google Scholar] [CrossRef]
  31. Bernal, M.P.; Alburquerque, J.A.; Moral, R. Composting of animal manures and chemical criteria for compost maturity assessment. A review. Bioresour. Technol. 2008, 100, 5444–5453. [Google Scholar] [CrossRef] [PubMed]
  32. Zmora, N.S.; Markovitch, O.; Tarchitzky, J.; Chen, Y. Dissolved organic carbon (DOC) as a parameter of compost maturity. Soil Biol. Biochem. 2005, 37, 2109–2116. [Google Scholar] [CrossRef]
  33. Jalili, M.; Mokhtari, M.; Eslami, H.; Abbasi, F.; Ghanbari, R.; Ebrahimi, A.A. Toxicity evaluation and management of co-composting pistachio wastes combined with cattle manure and municipal sewage sludge. Ecotoxicol. Environ. Saf. 2019, 171, 798–804. [Google Scholar] [CrossRef] [PubMed]
  34. Yuan, J.; Li, Y.; Wang, G.Y.; Zhang, D.F.; Shen, Y.J.; Ma, R.N.; Li, D.Y.; Li, S.Y.; Li, G.X. Biodrying performance and combustion characteristics related to bulking agent amendments during kitchen waste biodrying. Bioresour. Technol. 2019, 284, 56–64. [Google Scholar] [CrossRef] [PubMed]
  35. Luo, Y.; Liang, J.; Zeng, G.; Chen, M.; Mo, D.; Li, G.; Zhang, D. Seed germination test for toxicity evaluation of compost: Its roles, problems and prospects. Waste Manag. 2018, 71, 109–114. [Google Scholar] [CrossRef]
  36. Wang, G.; Li, G.; Chang, J.; Kong, Y.; Jiang, T.; Wang, J.; Yuan, J. Enrichment of antibiotic resistance genes after sheep manure aerobic heap composting. Bioresour. Technol. 2021, 323, 124620. [Google Scholar] [CrossRef]
  37. Kebibeche, H.; Khelil, O.; Kacem, M.; Harche, M.K. Addition of wood sawdust during the co-composting of sewage sludge and wheat straw influences seeds germination. Ecotoxicol. Environ. Saf. 2019, 168, 423–430. [Google Scholar] [CrossRef]
  38. Guan, T.Y.; Holley, R.A. Pathogen survival in swine manure environments and transmission of human enteric illness—A review. J. Environ. Qual. 2003, 32, 383–392. [Google Scholar] [CrossRef]
  39. Zhang, L.; Zhu, Y.; Zhang, J.; Zeng, G.; Dong, H.; Cao, W.; Fang, W.; Cheng, Y.; Wang, Y.; Ning, Q. Impacts of iron oxide nanoparticles on organic matter degradation and microbial enzyme activities during agricultural waste composting. Waste Manag. 2019, 95, 289–297. [Google Scholar] [CrossRef]
  40. Meng, L.Q.; Li, W.G.; Zhang, S.M.; Wu, C.D.; Lv, L.Y. Feasibility of co-composting of sewage sludge, spent mushroom substrate and wheat straw. Bioresour. Technol. 2017, 226, 39–45. [Google Scholar] [CrossRef]
  41. Wu, J.; Wei, Z.; Zhu, Z.; Zhao, Y.; Jia, L.; Lv, P. Humus formation driven by ammonia-oxidizing bacteria during mixed materials composting. Bioresour. Technol. 2020, 311, 123500. [Google Scholar] [CrossRef]
  42. Nakasaki, K.; Yaguchi, H.; Sasaki, Y.; Kubota, H. Effects of pH control on composting of garbage. Waste Manag. Res. 1993, 11, 117–125. [Google Scholar] [CrossRef]
  43. Abou-el-Seoud, I.I.; Abdel-Megeed, A. Impact of rock materials and biofertilizations on P and K availability for maize (Zea maize) under calcareous soil conditions. Saudi J. Biol. Sci 2012, 19, 55–63. [Google Scholar] [CrossRef] [PubMed] [Green Version]
  44. Moni, P.J.K.; Ronit, B.; Prasanna, D.B. Calcium oxalate degrading thermophilic oxalate oxidase from newly isolated Fusarium oxysporum RBP3. Biocatal. Agric. Biotechnol. 2020, 25, 101583. [Google Scholar]
  45. Wei, Z.Q.; Luo, Y.M.; Wu, S.H.; Sun, Q.P.; Liu, B.S.; Li, J.J. Effects of zeolite addition on the loss of phosphorus and potassium through runoff and leaching in poultry manure composting. J. Agro-Environ. Sci. 2012, 31, 2486–2492. [Google Scholar]
  46. Gransee, A.; Führs, H. Magnesium mobility in soils as a challenge for soil and plant analysis, magnesium fertilization and root uptake under adverse growth conditions. Plant Soil 2013, 368, 5–21. [Google Scholar] [CrossRef] [Green Version]
  47. Paul, D.; Sinha, S.N. Isolation and characterization of phosphate solubilizing bacterium Pseudomonas aeruginosa KUPSB12 with antibacterial potential from river Ganga, India. Ann. Agrar. Sci. 2016, 15, 130–136. [Google Scholar] [CrossRef] [Green Version]
  48. McDowell, R.W.; Monaghan, R.M.; Carey, P.L. Potential phosphorus losses in overland flow from pastoral soils receiving long-term applications of either superphosphate or reactive phosphate rock. N. Z. J. Agric. Res. 2003, 46, 329–337. [Google Scholar] [CrossRef]
  49. Sanchez-Monedero, M.A.; Roig, A.; Paredes, C.; Bernal, M.P. Nitrogen transformation during organic waste composting by the Rutgers system and its effects on pH, EC and maturity of the composting mixtures. Bioresour. Technol. 2001, 78, 301–308. [Google Scholar] [CrossRef]
Figure 1. Temperature variations for treatments (AT, ambient temperature). Note. AT = ambient temperature; T1 = chicken manure, calcium superphosphate, initial pH of 6, and stirring temperature 50 °C; T2 = chicken manure, zeolite, initial pH of 7, and stirring temperature 60 °C; T3 = chicken manure, copper sulfate, initial pH of 8, and stirring temperature 70 °C; T4 = sheep manure, copper sulfate, initial pH of 7, and stirring temperature 50 °C; T5 = sheep manure, calcium superphosphate, initial pH of 8, and stirring temperature 60 °C; T6 = sheep manure, zeolite, initial pH of 6, and stirring temperature 70 °C; T7 = urea, zeolite, initial pH of 8, and stirring temperature 50 °C; T8 = urea, copper sulfate, initial pH of 6, and stirring temperature 60 °C; T9 = urea, calcium superphosphate, initial pH of 7, and stirring temperature 70 °C.
Sustainability 15 11211 g001
Figure 2. The pH and EC variations for the various treatments: the pH variations for the various treatments (a), and the electrical conductivity (EC) variations for the various treatments (b).
Sustainability 15 11211 g002
Table 1. Physicochemical properties of each material and the orthogonal experimental design.
(a) Selected Physicochemical Properties of Raw Materials.
Sheep ManureUreaGrape BranchChicken Manure
Carbon content (g/kg)76.18 (0.92) c37.61 (3.12) d423.09 (20.29) a373.75 (13.43) b
Nitrogen content (g/kg)8.94 (0.77) c464.57 (11.35) a10.18 (0.04) c57.09 (2.96) b
C/N8.52 (0.69) b0.08 (0.01) d41.55 (1.82) a6.55 (0.58) c
Rate of water content0.26 (0.01) b——0.09 (0.01) c0.59 (0.02) a
(b) Process Parameters (Factors and Levels).
Process ParametersSymbolLevel 1Level 2Level 3
Nitrogen sourceAChicken manureSheep manureUrea
Stirring temperature (°C)B506070
Initial pHC678
Conditioning agentDCalcium superphosphateZeoliteCopper sulfate
(c) Test Treatment Arrangement and Amount of Raw Material Added.
TreatmentGB (kg)Nitrogen Source
(kg)
Stirring Temperature (°C)Initial pHConditioning Agent
(kg)
Chicken ManureSheep ManureUreaCalcium superphosphateZeoliteCopper Sulfate
T11359 5067
T21359 607 7
T31359 708 7
T486 59 507 7
T586 59 6087
T686 59 706 7
T7147 1508 7
T8147 1606 7
T9147 17077
Note. Values are listed as the means with the standard deviation in parentheses. Lower case letters a, b, c, and d represent a significance in the differences between the nitrogen source at p < 0.05. The sample size was 3 in each instance.
Table 2. Plant toxicity study of compost products based on a Chinese cabbage seed germination test.
TreatmentSeed Germination Rate (%)Average Root Length (mm)GI (%)
T193 (12) a14 (5) a143 (64) abc
T287 (6) ab15 (3) a137 (29) abc
T340 (10) d16 (5) a70 (32) c
T477 (23) ab23 (9) a175 (12) ab
T550 (10) cd23 (5) a122 (23) abc
T683 (6) ab15 (2) a131 (9) abc
T777 (6) ab22 (6) a188 (61) a
T873 (15) ab15 (5) a119 (55) abc
T980 (10) ab19 (6) a162 (58) ab
CK67 (6) bc14 (7) a100 (53) bc
Note. T1 = chicken manure, calcium superphosphate, initial pH of 6, and stirring temperature 50 °C; T2 = chicken manure, zeolite, initial pH of 7, and stirring temperature 60 °C; T3 = chicken manure, copper sulfate, initial pH of 8, and stirring temperature 70 °C; T4 = sheep manure, copper sulfate, initial pH of 7, and stirring temperature 50 °C; T5 = sheep manure, calcium superphosphate, initial pH of 8, and stirring temperature 60 °C; T6 = sheep manure, zeolite, initial pH of 6, and stirring temperature 70 °C; T7 = urea, zeolite, initial pH of 8, and stirring temperature 50 °C; T8 = urea, copper sulfate, initial pH of 6, and stirring temperature 60 °C; T9 = urea, calcium superphosphate, initial pH of 7, and stirring temperature 70 °C; CK = without additives. GI = germination index. Values are listed as the means with the standard deviation in parentheses. The sample size was 3 in each instance. Lower case letters a, b, c, and d represent a significance in the differences between treatments at p < 0.05.
Table 3. Selected physicochemical properties of the feedstock mixture and the final compost product.
TreatmentBefore Composting
ACa
(mg/g)
AK
(mg/g)
AMg
(mg/g)
AP
(mg/g)
N O3-N
(mg/kg)
N H4+-N
(mg/kg)
OM
(g/kg)
T112.88 (0.42) b18.71 (0.57) b1.66 (0.08) c1.61 (0.12) b95.12 (3) c199.76 (1.29) a692.96 (0.45) b
T210.91 (0.36) c11.38 (0.20) c1.89 (0.02) a1.33 (0.11) c61.31 (3.91) f186.43 (7.12) b689.17 (1.42) c
T315.45 (1.15) a9.43 (0.25) e1.86 (0.05) ab0.48 (0.02) f74.27 (2.25) e181.11 (4.91) b693.49 (1.04) b
T412.42 (0.74) bc10.35 (1.28) d1.87 (0.02) ab0.70 (0.18) e242.54 (3.67) a106.31 (7.17) d481.79 (0.40) e
T510.6 (1.22) c10.46 (0.28) d1.84 (0.06) ab1.26 (0.06) c86.37 (1.52) d102.66 (5.89) d480.23 (1.18) e
T66.3 (0.38) d21.90 (0.29) a1.44 (0.06) d6.89 (0.05) a182.29 (3.04) b172.61 (3.43) c483.75 (1.80) d
T77.59 (0.78) d8.73 (0.09) e1.68 (0.08) c0.94 (0.05) d63.48 (2.51) f203.24 (0.33) a700.41 (0.99) a
T810.97 (1.39) c7.33 (0.17) f1.80 (0.04) ab0.49 (0.08) f61.64 (4.8) f205.81 (0.17) a699.1 (0.45) a
T910.84 (1.68) bc7.59 (0.17) f1.76 (0.10) bc1.04 (0.07) d76.95 (11.62) e205.39 (0.93) a700.54 (0) a
THA
(g/kg)
BD (g/cm3)WHC (%)VRBacteria
(×1010CFU/g)
Actinomycetes
(×107CFU/g)
Fungi
(×105CFU/g)
T1-------
T2-------
T3-------
T4-------
T5-------
T6-------
T7-------
T8-------
T9-------
TreatmentAfter composting
ACa
(mg/g)
AK
(mg/g)
AMg
(mg/g)
AP
(mg/g)
N O3-N
(mg/kg)
N H4+-N
(mg/kg)
OM(g/kg)
T114.45 (0.85)
cd, δ
18.72 (1.18)
b, β
2.02 (0.06)
cd, αβ
2.19 (0.33)
b, α
126.66 (4.41)
a, α
90.61 (8.09)
g, γ
493.95 (12.85) c, α
T215.96 (1.73)
bc, αβ
13.00 (0.44)
c, α
2.26 (0.01)
a, αβ
1.38 (0.07)
c, βγ
92.84 (0.56)
b, α
108.77 (5.00)
ef, δ
582.80 (68.83) b, β
T318.55 (0.52)
a, βγδ
8.08 (0.06)
e, γ
2.18 (0.02)
ab, αβ
0.85 (0.03)
d, αβ
58.64 (4.53)
cd, γ
153.87 (12.04)
c, γ
663.17 (2.27) a, ε
T416.55 (0.92)
b, αβγ
7.25 (0.12)
ef, δ
2.00 (0.03)
d, γ
0.43 (0.10)
e, γ
54.39 (0.99)
de, ζ
120.58 (1.98)
de, α
441.15 (1.37) d, δε
T513.2 (0.46)
d, γδ
7.21 (0.27)
ef, δ
2.07 (0.07)
bcd, βγ
1.30 (0.02)
c, βγ
56.48 (0.27)
cd, δ
117.70 (5.09)
de, α
416.20 (6.44) d, γ
T68.88 (1.41)
e, γδ
21.83 (0.65)
a, β
1.85 (0.12)
e, α
5.83 (0.40)
a, δ
59.47 (3.49)
c, ε
97.67 (6.39)
fg, α
437.10 (5.88) d, δ
T713.37 (0.56)
d, α
10.87 (0.17)
d, α
2.06 (0.06)
cd, αβ
0.93 (0.15)
d, βγ
51.17 (1.29)
e, γ
128.44 (8.51)
d, γ
683.81 (0.60) a, ζ
T817.21 (1.13)
ab, α
6.72 (0.16)
f, βγ
2.11 (0.05)
bc, αβ
0.59 (0.12)
de, βγ
59.06 (2.31)
cd, β
175.00 (1.64)
b, β
655.98 (1.13) a, δε
T912.79 (0.54)
d, γδ
6.99 (0.07)
f, βγ
2.08 (0.02)
bcd, αβ
0.85 (0.04)
d, γ
49.74 (1.16)
f, δ
217.02 (5.38)
a, β
658.33 (1.20) a, δε
THA
(g/kg)
BD (g/cm3)WHC (%)VRBacteria
(×1010CFU/g)
Actinomycetes
(×107CFU/g)
Fungi
(×105CFU/g)
T118.21 (0.63) d0.28 (0.02) b215 (8) d2.78 (0.24) f9.23 (0.35) a5.17 (0.57) ab6.13 (0.71) a
T226.48 (0.45) a0.27 (0.01) b228 (13) d9.83 (0.82) de8.47 (0.31) b5.27 (0.25) a4.83 (0.15) b
T326.38 (0.62) a0.14 (0.03) e218 (18) d56.79 (6.53) a5.2 (0.46) c2.83 (0.32) d1.83 (0.35) d
T421.76 (1.86) c0.23 (0.01) c151 (9) f27.80 (3.65) b4.43 (0.45) d3.67 (0.32) c2.63 (0.31) cd
T517.17 (0.18) d0.32 (0.02) a165 (19) ef11.99 (1.39) d3.33 (0.42) e3.17 (0.45) cd2.33 (0.42) cd
T618.59 (1.66) d0.32 (0.01) a187 (4.5) e7.26 (1.26) def3.87 (0.35) de3.17 (0.47) cd2.93 (0.31) c
T723.86 (1.76) b0.23 (0.01) c276 (21) c8.31 (1.37) de5.23 (0.38) c5.23 (0.32) a5.7 (0.36) a
T823.48 (0.31) bc0.14 (0.02) e303 (18) b19.95 (2.33) c3.5 (0.35) e4.5 (0.36) b3.13 (0.57) c
T926.45 (1.11) a0.17 (0.01) d330 (15) a5.37 (0.81) ef4.5 (0.36) d5.4 (0.46) a4.73 (0.76) b
Note. T1 = chicken manure, calcium superphosphate, initial pH of 6, and stirring temperature 50 °C; T2 = chicken manure, zeolite, initial pH of 7, and stirring temperature 60 °C; T3 = chicken manure, copper sulfate, initial pH of 8, and stirring temperature 70 °C; T4 = sheep manure, copper sulfate, initial pH of 7, and stirring temperature 50 °C; T5 = sheep manure, calcium superphosphate, initial pH of 8, and stirring temperature 60 °C; T6 = sheep manure, zeolite, initial pH of 6, and stirring temperature 70 °C; T7 = urea, zeolite, initial pH of 8, and stirring temperature 50 °C; T8 = urea, copper sulfate, initial pH of 6, and stirring temperature 60 °C; T9 = urea, calcium superphosphate, initial pH of 7, and stirring temperature 70 °C. Values are listed as the means with the standard deviation in parentheses. The sample size was 3 in each instance. Lower case letters a, b, c, d, e, and f represent a significance in the differences between treatments at a specific time at p < 0.05. Greek letters α, β, γ, δ, ε, and ζ represent a significance in the differences in the amount of change between treatments at p < 0.05.
Table 4. Initial value transformation of each index in compost treatments.
Treatment>5.00 (mm)2.00–5.001.00–2.001.00–0.30<0.30CI (>1.00)
T18.37 10.28 11.32 16.77 3.26 59.94 (0.29) g
T210.40 22.63 6.27 7.97 2.73 78.60 (0.24) e
T316.07 22.57 5.31 2.44 3.61 87.91 (0.78) b
T49.50 22.00 7.39 8.84 2.27 77.77 (1.11) e
T515.09 18.82 6.87 7.66 1.56 81.56 (0.66) d
T68.57 25.52 7.30 5.50 3.11 82.79 (0.58) c
T713.39 26.77 4.37 4.39 1.08 89.06 (0.36) a
T87.47 27.56 6.76 7.02 1.19 83.58 (0.22) c
T98.29 22.77 4.64 9.26 5.05 71.38 (0.27) f
Note. T1 = chicken manure, calcium superphosphate, initial pH of 6, and stirring temperature 50 °C; T2 = chicken manure, zeolite, initial pH of 7, and stirring temperature 60 °C; T3 = chicken manure, copper sulfate, initial pH of 8, and stirring temperature 70 °C; T4 = sheep manure, copper sulfate, initial pH of 7, and stirring temperature 50 °C; T5 = sheep manure, calcium superphosphate, initial pH of 8, and stirring temperature 60 °C; T6 = sheep manure, zeolite, initial pH of 6, and stirring temperature 70 °C; T7 = urea, zeolite, initial pH of 8, and stirring temperature 50 °C; T8 = urea, copper sulfate, initial pH of 6, and stirring temperature 60 °C; T9 = urea, calcium superphosphate, initial pH of 7, and stirring temperature 70 °C. Lower case letters a, b, c, d, e, f, and g represent a significance in the differences between treatments at a specific time at p < 0.05.
Table 5. Initial value transformation of each index in compost treatments.
TreatmentInitial Value Transformation
ACaAKAMgAPANTHAOM
Ideal treatment1.00 1.00 1.00 1.00 1.00 1.00 1.00
T10.78 0.86 0.89 0.38 0.81 0.69 0.72
T20.86 0.60 1.00 0.24 0.76 1.00 0.85
T31.00 0.37 0.96 0.15 0.80 1.00 0.97
T40.89 0.33 0.88 0.07 0.66 0.82 0.65
T50.71 0.33 0.92 0.22 0.65 0.65 0.61
T60.48 1.00 0.82 1.00 0.59 0.70 0.64
T70.72 0.50 0.91 0.16 0.67 0.90 1.00
T80.93 0.31 0.93 0.10 0.88 0.89 0.96
T90.69 0.32 0.92 0.15 1.00 1.00 0.96
TreatmentCorrelation CoefficientsGray Relational Grade
ACaAKAMgAPANTHAOM
T10.6106 0.7113 0.7582 0.4286 0.6449 0.5267 0.5520 0.6028
T20.7113 0.4631 1.0000 0.3796 0.5897 1.0000 0.6970 0.7132
T31.0000 0.3538 0.8961 0.3536 0.6330 1.0000 0.9200 0.7424
T40.7582 0.3399 0.7419 0.3333 0.5036 0.6571 0.4964 0.5587
T50.5433 0.3399 0.8118 0.3735 0.4964 0.4964 0.4694 0.5063
T60.3988 1.0000 0.6571 1.0000 0.4570 0.5349 0.4894 0.6514
T70.5520 0.4083 0.7931 0.3563 0.5111 0.7753 1.0000 0.6120
T80.8313 0.3333 0.8313 0.3407 0.7419 0.7582 0.8961 0.6663
T90.5267 0.3366 0.8118 0.3536 1.0000 1.0000 0.8961 0.7110
Note. T1 = chicken manure, calcium superphosphate, initial pH of 6, and stirring temperature 50 °C; T2 = chicken manure, zeolite, initial pH of 7, and stirring temperature 60 °C; T3 = chicken manure, copper sulfate, initial pH of 8, and stirring temperature 70 °C; T4 = sheep manure, copper sulfate, initial pH of 7, and stirring temperature 50 °C; T5 = sheep manure, calcium superphosphate, initial pH of 8, and stirring temperature 60 °C; T6 = sheep manure, zeolite, initial pH of 6, and stirring temperature 70 °C; T7 = urea, zeolite, initial pH of 8, and stirring temperature 50 °C; T8 = urea, copper sulfate, initial pH of 6, and stirring temperature 60 °C; T9 = urea, calcium superphosphate, initial pH of 7, and stirring temperature 70 °C.
Table 6. Analysis results of the GB composting orthogonal experiment.
TreatmentabcdWeighted Correlation Degree
T111110.6028
T212220.7132
T313330.7424
T421230.5587
T522310.5063
T623120.6514
T731320.6120
T832130.6663
T933210.7110
K 1 ¯ 0.68610.59120.64020.6067
K 2 ¯ 0.57210.62860.66100.6589
K 3 ¯ 0.66310.70160.62020.6558
R0.11400.11040.04080.0522
Note. Column a indicates the nitrogen source: 1 chicken manure, 2 sheep manure, and 3 urea. Column b indicates the stirring temperature: 1 50 °C, 2 60 °C, and 3 70 °C. Column c indicates the initial pH value: 1 6, 2 7, and 3 8. Column d indicates the type of conditioning agent: 1 calcium superphosphate, 2 zeolite, and 3 copper sulfate. T1 = chicken manure, calcium superphosphate, initial pH of 6, and stirring temperature 50 °C; T2 = chicken manure, zeolite, initial pH of 7, and stirring temperature 60 °C; T3 = chicken manure, copper sulfate, initial pH of 8, and stirring temperature 70 °C; T4 = sheep manure, copper sulfate, initial pH of 7, and stirring temperature 50 °C; T5 = sheep manure, calcium superphosphate, initial pH of 8, and stirring temperature 60 °C; T6 = sheep manure, zeolite, initial pH of 6, and stirring temperature 70 °C; T7 = urea, zeolite, initial pH of 8, and stirring temperature 50 °C; T8 = urea, copper sulfate, initial pH of 6, and stirring temperature 60 °C; T9 = urea, calcium superphosphate, initial pH of 7, and stirring temperature 70 °C. KJm was named as the mean of the corresponding experiments of the m level of the J factor. The number could determine the quality of the level of J factor. RJ was the range of the column J factor, which responded the fluctuation of each level. That is to say, RJ = KJmax − KJmin.
Disclaimer/Publisher’s Note: The statements, opinions and data contained in all publications are solely those of the individual author(s) and contributor(s) and not of MDPI and/or the editor(s). MDPI and/or the editor(s) disclaim responsibility for any injury to people or property resulting from any ideas, methods, instructions or products referred to in the content.

