Article

Bridge Performance Recovery Test after Strengthening with a Prestressed CFRP Laminate

1
Shanghai Municipal Engineering Design Institute (Group) Co., Ltd., Shanghai 200092, China
2
Department of Bridge Engineering, Tongji University, Shanghai 200092, China
*
Author to whom correspondence should be addressed.
Sustainability 2023, 15(14), 11197; https://doi.org/10.3390/su151411197
Submission received: 9 June 2023 / Revised: 12 July 2023 / Accepted: 17 July 2023 / Published: 18 July 2023
(This article belongs to the Section Sustainable Engineering and Science)

Abstract

:
This paper introduces the strengthening of a concrete bridge using a CFRP laminate anchorage system and describes the static and dynamic test process, including the loading method and the test results. This paper compares the stress, strain, and deformation of each key section before and after reinforcement under static loads, moving loads, braking vehicles, and jumping vehicles to demonstrate the strengthening effect of the bridge and the performance of the CFRP laminate. The CFRP laminate anchorage system effectively restores the structural elastic properties of the bridge, enabling the prestressed CFRP laminates and the bridge structure to synergistically function as a composite, exhibiting exceptional operational performance. After reinforcement, the maximum dynamic deflection in the middle span after reinforcement decreases by 25.73%, and the maximum dynamic strain in the middle span decreases by 18.00%; under the jumping vehicle, the damping ratio decreases by 43.69%. By strengthening with prestressed CFRP, the original damaged bridge can have its performance restored and its service life extended, and the need for bridge demolition and reconstruction is avoided. This brings about social benefits by saving raw materials, reducing demolition waste, and protecting the environment.

1. Introduction

China has built a large number of bridges in recent decades and become the world leader both in total length and number of bridges. However, these bridges are currently experiencing a high frequency of deterioration and accidents. Approximately one-fifth of China’s million bridges require strengthening due to natural weathering and construction techniques. In urban areas, the rapid development of transportation has led to a high number of bridges requiring maintenance and strengthening too. The typical type of bridge currently in service in China is made of reinforced or prestressed concrete, and damage to such bridges directly impacts traffic safety and economic development. The dismantling of such bridges generates a significant amount of construction waste and pollution removal, and the construction of new bridges incurs a high social cost. To repair these damaged bridges and extend their service life, researchers worldwide have studied different strengthening techniques [1,2,3,4].
There are several strengthening techniques: one is increasing the cross-section; the second is bonding a steel plate or bonding a fiber-reinforced polymer (FRP) (e.g., fiberglass, carbon sheet) in the weak section of a component [5,6]; and the third is applying prestress with steel strands to counter a portion of the bending moment or repairing the deformation-induced and closed cracks [7,8,9].
Carbon fiber materials have many advantages, including high strength, low density, corrosion resistance, etc., which are very advantageous in structural strengthening. Unidirectional fiber sheets are more commonly used in reinforcement than bidirectional fiber sheets. When bonded with multiple layers of carbon fiber sheets, the quality is not different from the fiber laminates. They can bear a load more evenly and bring the strength of fiber into full play [10,11,12].
However, a carbon fiber laminate/plate/bar also has disadvantages. When used for structural strengthening through bonding, the structure has certain limitations and difficulties [13,14,15], including low strength utilization efficiency (less than 15%) and bonding failure between the concrete and the CFRP, which easily lead to premature failure of the strengthened structure. Therefore, it is necessary to use prestressing technology to take advantage of the high strength of carbon fiber materials [16,17].
To fully utilize the strength of carbon-fiber-reinforced composites, a large deformation is required to utilize their modulus of elasticity. When combined with steel bars, the steel bars use their full strength, while the carbon fiber material only uses less than 20% of its strength. This requires a large amount of carbon fiber materials to restrain the structural deformation and cracks, resulting in the loss of the advantages of high strength and economic benefits. This property limits the further application of CFRP in the field of reinforcement. Many countries have developed new types of prestressed CFRP reinforcement technology, which uses carbon fiber plates or laminates instead of sheets and applies a certain degree of prestress. Prestressed CFRP for reinforcement has several advantages [3,13,18,19,20], including turning the passive strengthening into active strengthening, closing the cracks and limiting new cracks, increasing the stiffness, and reducing the deflection with improved performance in the reversing stages.
When a bridge is damaged, the cost of demolition is enormous. This is not only reflected in the economic cost of re-modifying a bridge, but also in the large amount of waste caused by the demolition process, resulting in a large amount of air, water, and even noise pollution. Through convenient reinforcement and modification, the life of the bridge is extended, a lot of bridge construction materials are saved, a lot of carbon dioxide emissions and pollutants are correspondingly reduced, and the idea of sustainable development is fully reflected. In this paper, a concrete bridge was strengthened with the prestressing CFRP laminate system [21]. The test process and the results of the test before and after strengthening were introduced in detail. The efficiency of the anchorage system and the effect of the system of the CFRP laminate were examined.

2. Reinforcement Application of the Prestressing CFRP Laminate

2.1. Prestressing CFRP Laminate Anchorage System

The prestressing CFRP laminate anchorage system used in the background project of this paper was produced by OVM Machinery Co. of China and has the following characteristics:
(1)
The system has a unique anchorage mode that has been proven to have an anchorage efficiency coefficient greater than 0.95, giving full play to the high-strength advantage of carbon fiber plates and greatly improving the utilization rate of carbon fiber materials.
(2)
This product system size is small, light, and thin, and it almost does not increase the weight of the original structure. It will not affect the original structure space and it leaves no traces after reinforcement.
(3)
It has good durability and corrosion resistance and it can reduce dependence on adhesives. It can also be constructed in winter without the need for large construction machinery or wet operations, making it convenient for construction and installation at small sites.
Applications of the OVM CFRP anchorage system in different projects have shown that it can greatly improve the strength and stiffness of reinforced concrete members, effectively reduce the deflection of the structure, and reduce and close cracks. Therefore, the OVM CFRP anchorage system has been applied to various structural reinforcements in China, including the main beam, capping beam, abutment, and other parts where stress cracks occur.
Figure 1 illustrates the anchorage system applied to the longitudinal web of the main girder, the capping beam of the bridge, the longitudinal bottom plate of the main girder, and the transverse bridge direction of the box girder bottom.
The parameters of the CFRP laminate and the OVM anchorage system are listed in Table 1 and Table 2.
Based on prestress construction specifications worldwide and the anchorage system characteristics of CFRP laminates in China, the tensile control stress can be calculated using the following formula (Equation (1)), which refers to standards related to external cables, to fully utilize the high strength performance of CFRP:
σ c o n = K σ u
where σ c o n is the tensile control stress; σ u is the tensile strength of the CFRP laminate; and K is the tension control coefficient, K = 0.4~0.65. K is related to the length, width, and thickness of the CFRP laminate and to the amount of extension.
Generally, the K value is 0.4, as in the project of this paper. For some projects with special requirements, the value of K should be chosen after taking the safety factor into consideration with the deformation of the girder. To ensure that the fiber does not break, the maximum tensile stress shall be controlled to be no more than 0.65. According to the characteristics of the anchorage system of the CFRP laminate, the prestress loss has friction, internal shrinkage, etc., and the total prestress loss of the tensioning anchorage is less than 2%.

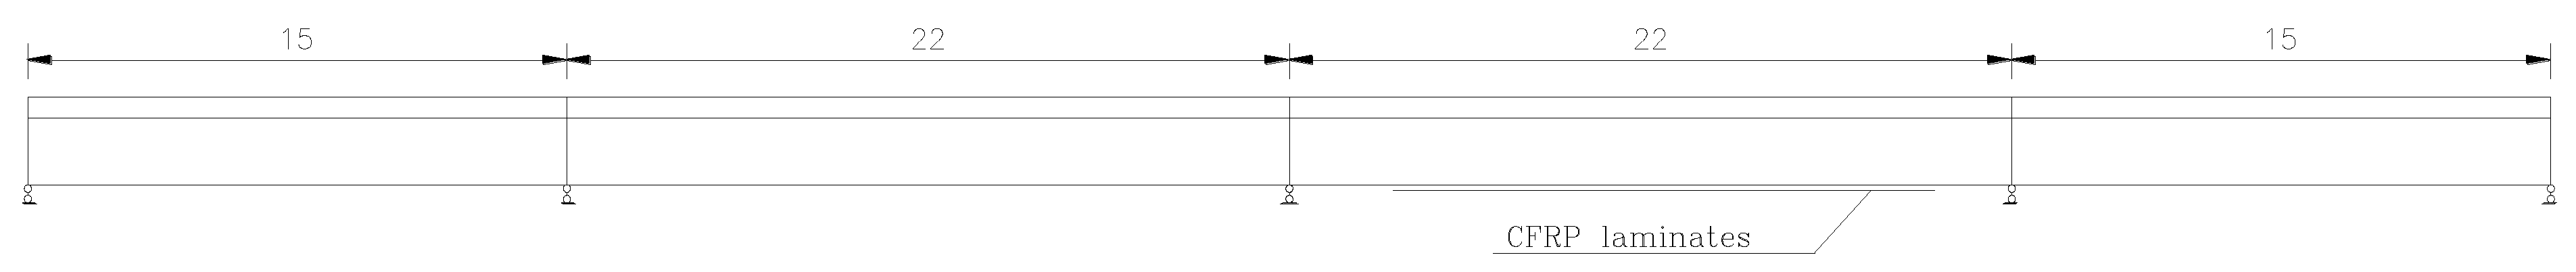
2.2. Introduction of the Strengthened Bridge for Test

For the strengthening test, the No. 1 Xiaojia Bridge of Qinglan Highway (former Jiaozhou Bay Highway section) was chosen because it was found to have more cracks and greater durability problems; it has also previously been used in other cases involving CFRP laminates [22,23,24,25]. The continuous prestressed concrete bridge consists of hollow-slab beams and pot-type rubber bearings, and the span layout is 5 × 25.0 m and 75 m (15.5 m + 2 × 22.0 m + 15.5 m). The bridge was designed to handle loads of over 20 tons for automobiles and 120 tons for trailers, and it is rated for class VII seismic resistance. The pictures listed in Figure 2 are the process pictures arranged from the pre-reinforcement, during reinforcement, and post-reinforcement tests.
The loading tests were conducted in accordance with relevant design documents, construction data, and prior inspections. Maintenance and strengthening will comply with technical specifications for highways and bridges in China [26,27,28,29,30,31].
Static and dynamic tests were conducted for the following purposes:
(1)
To determine the mechanical performance to meet the design and the specifications after being strengthened.
(2)
To evaluate the strengthening results, with a particular focus on the prestress loss, the elastic compression loss, and the effective prestress [13,32].
(3)
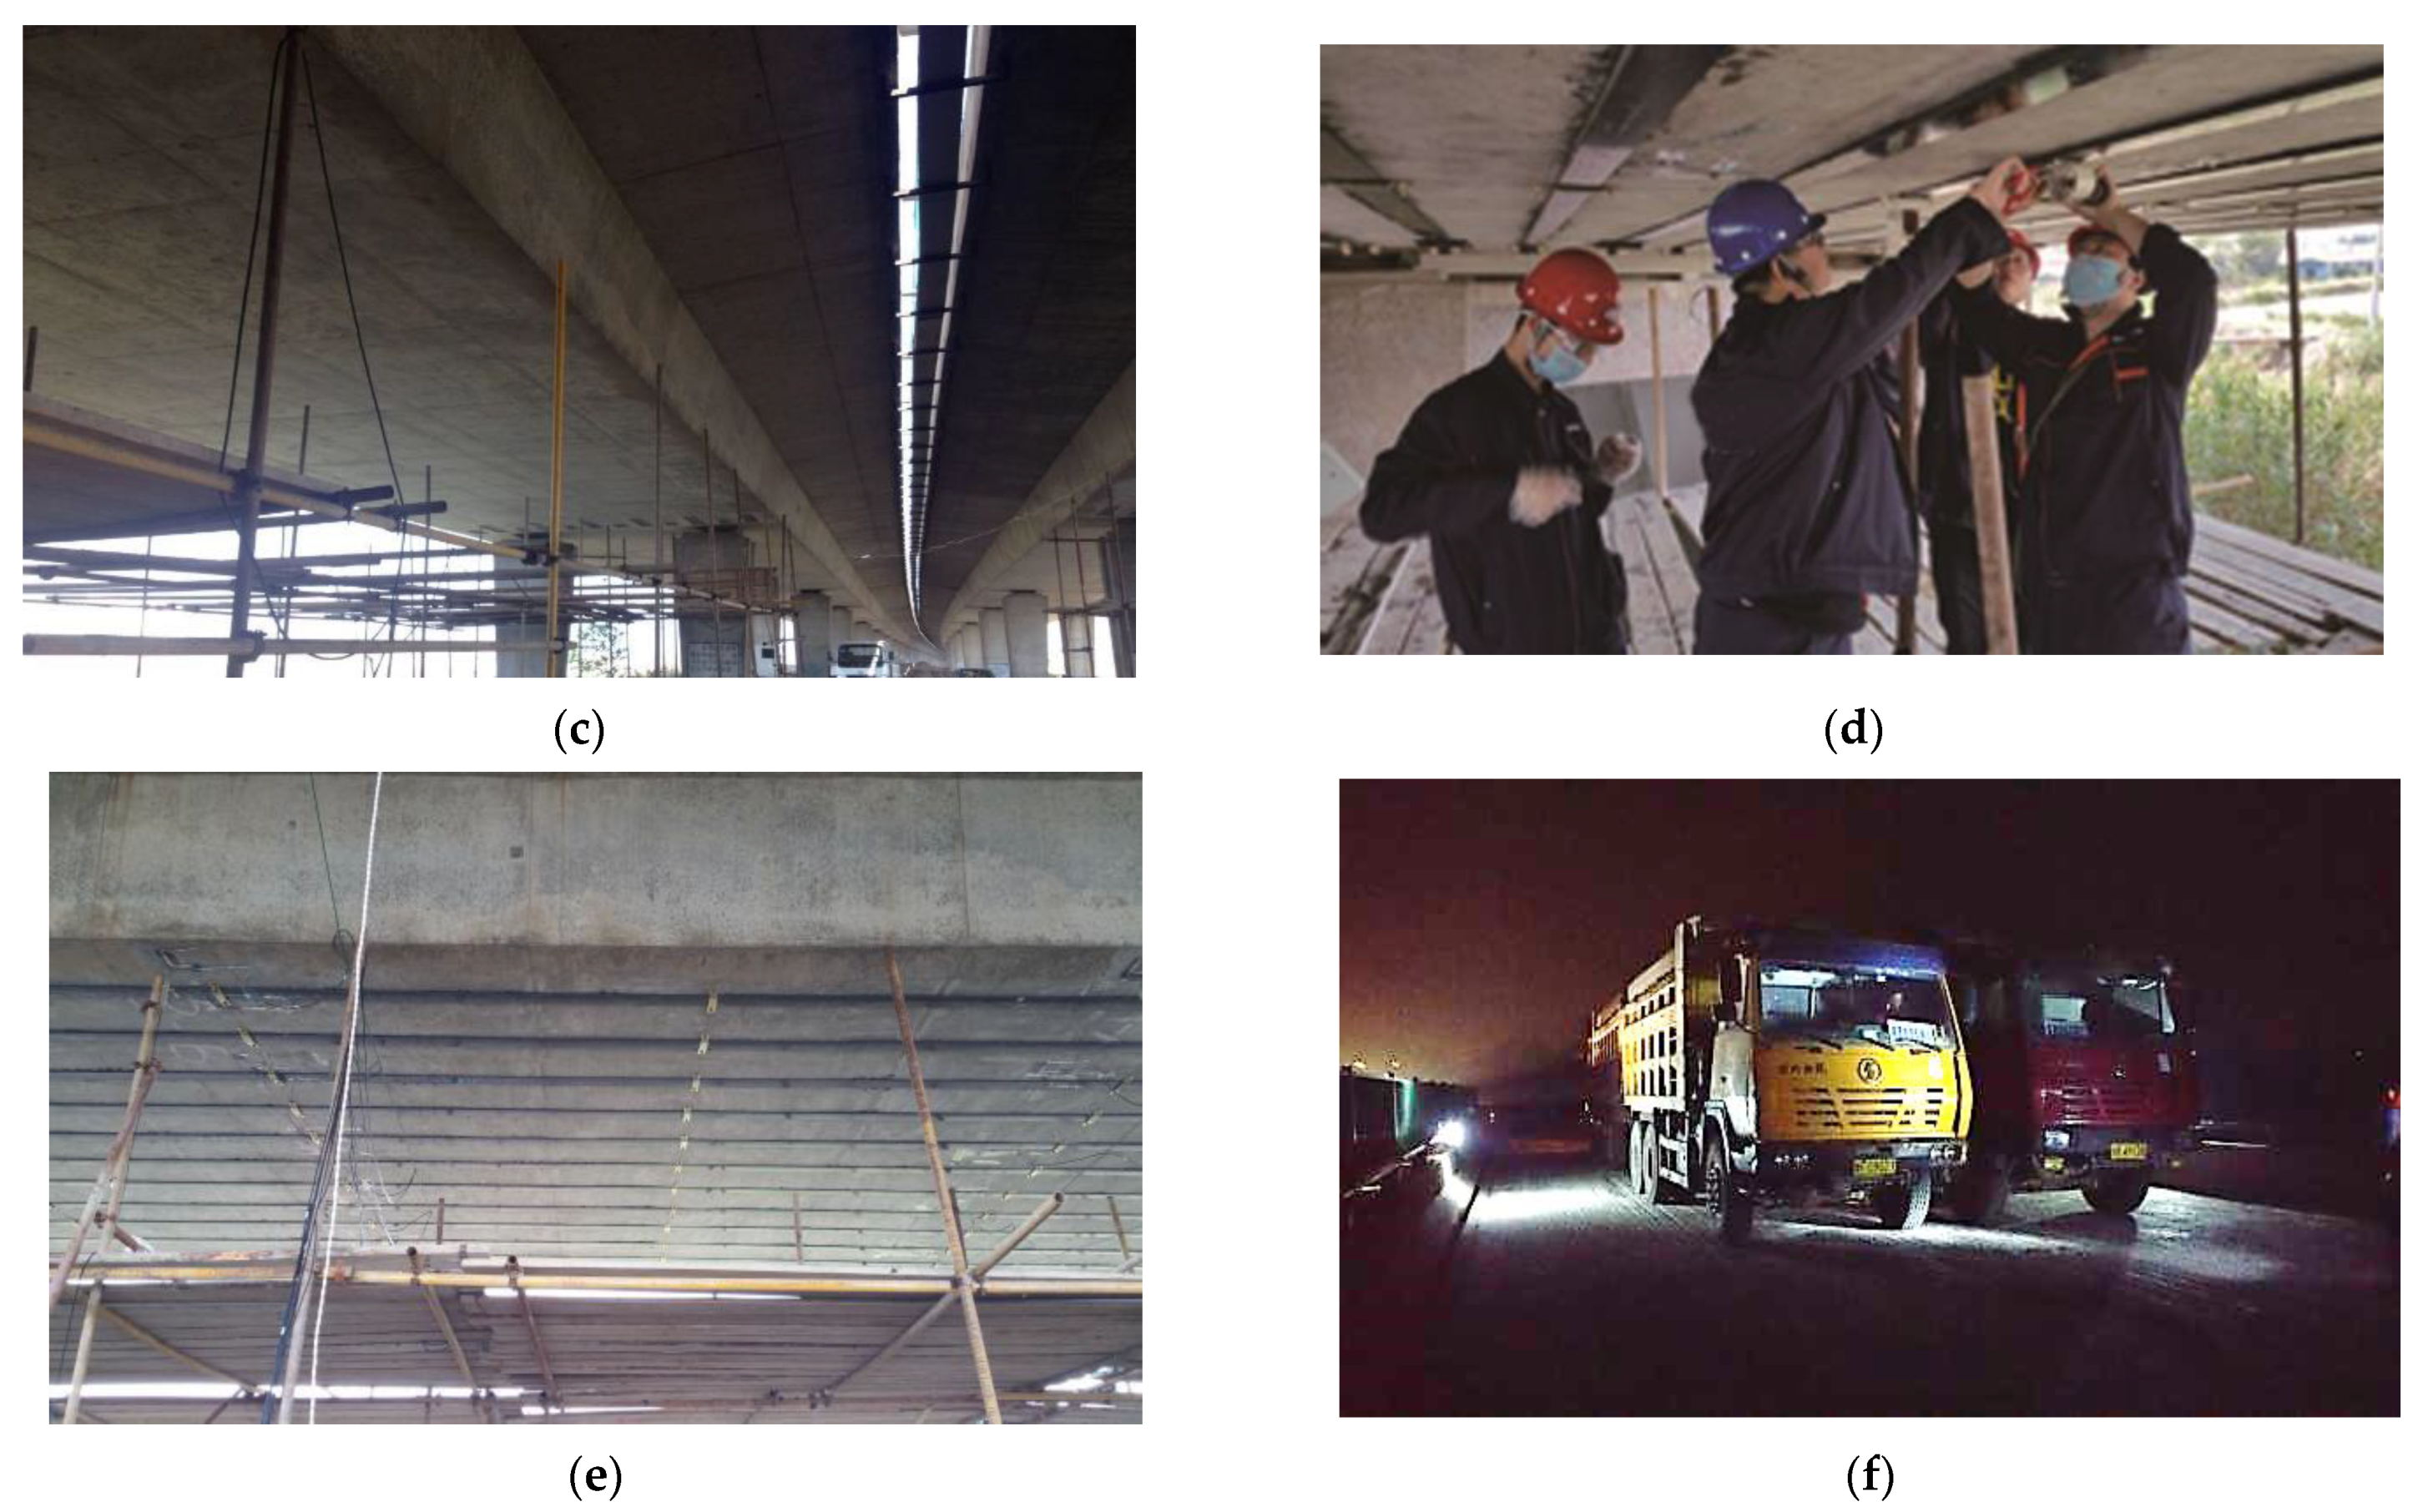
To inspect the construction method and technological process for strengthening a prestressed concrete bridge structure to improve the method.
(4)
To analyze the stress status after strengthening, verify the effectiveness of the prestressed CFRP laminate application, evaluate the adhesive performance, and assess the reasonableness of the calculation [13,18,32,33].
The bridge was tested under an equivalent vehicle load according to calculations based on the design load standard (Highway-I level). The loading scheme was formulated based on the design specification [28,29,31] as well as on relevant drawings, construction completion data, theoretical analysis, and calculation results.
According to the objectives of the loading test and the strengthening scheme mentioned above, the third span from the fourth section of the bridge (15.5 + 2 × 22.0 + 15.5 m) was selected as the test span because it was the only span on the right wing that was strengthened. Figure 3 displays the section of the bridge that was strengthened and the length of the test span. Figure 4 shows the cross-section of the strengthened bridge.
Four carbon laminates (1#~4# in Figure 5) were selected for the fiber Bragg grating (FBG) coupling test, and the arrangement of CFRP with FBG is shown in Figure 5. No. 1 and No. 3 have pretension stress according to the design, and No. 2 and No. 4 do not have tension. In addition, three carbon laminates were selected to stick the strain gauge, and the position of the strain gauge corresponded to the test section.

3. Test Design

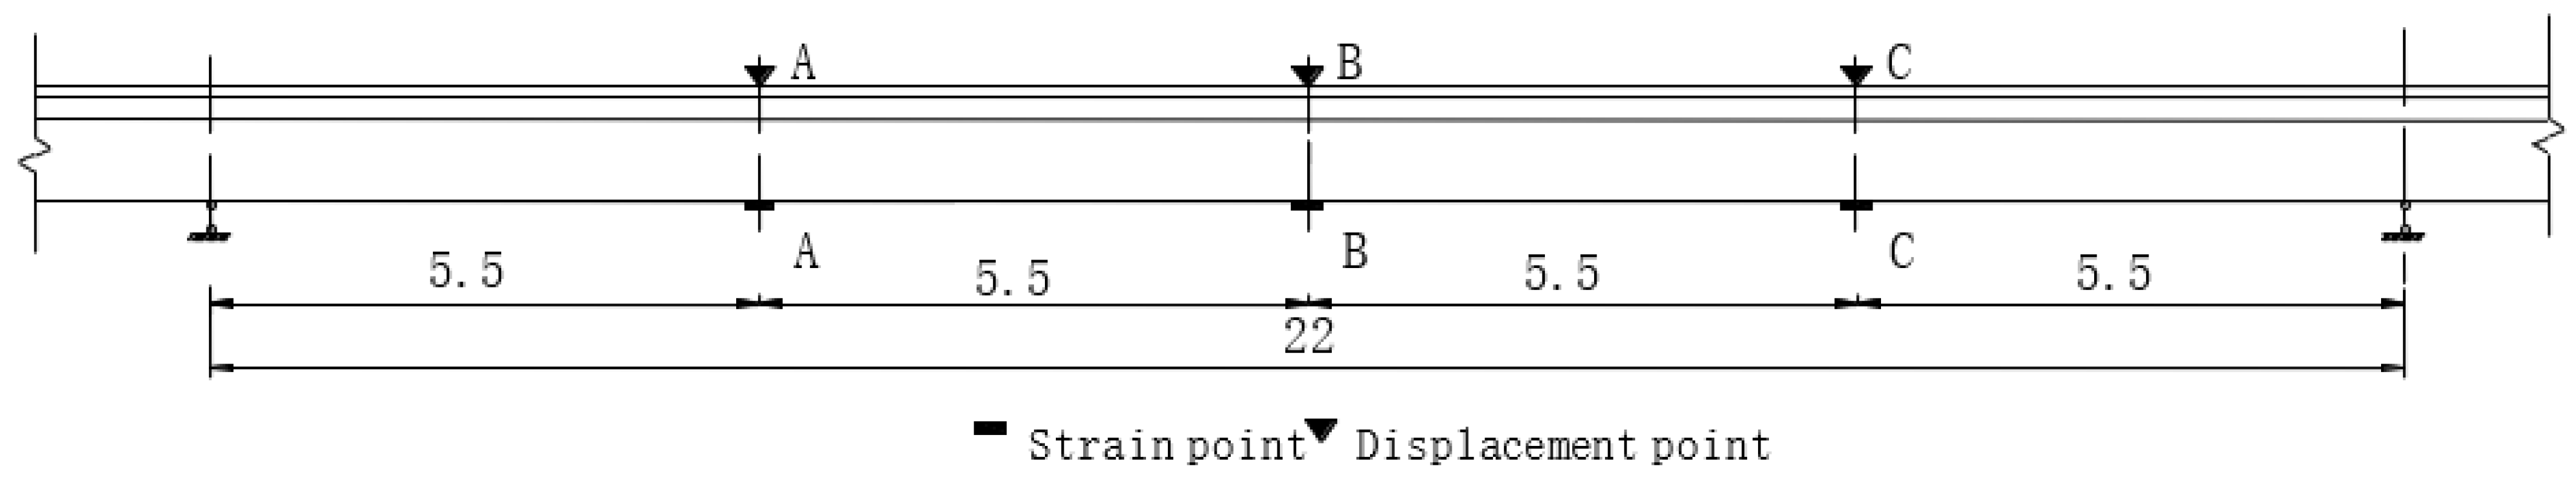
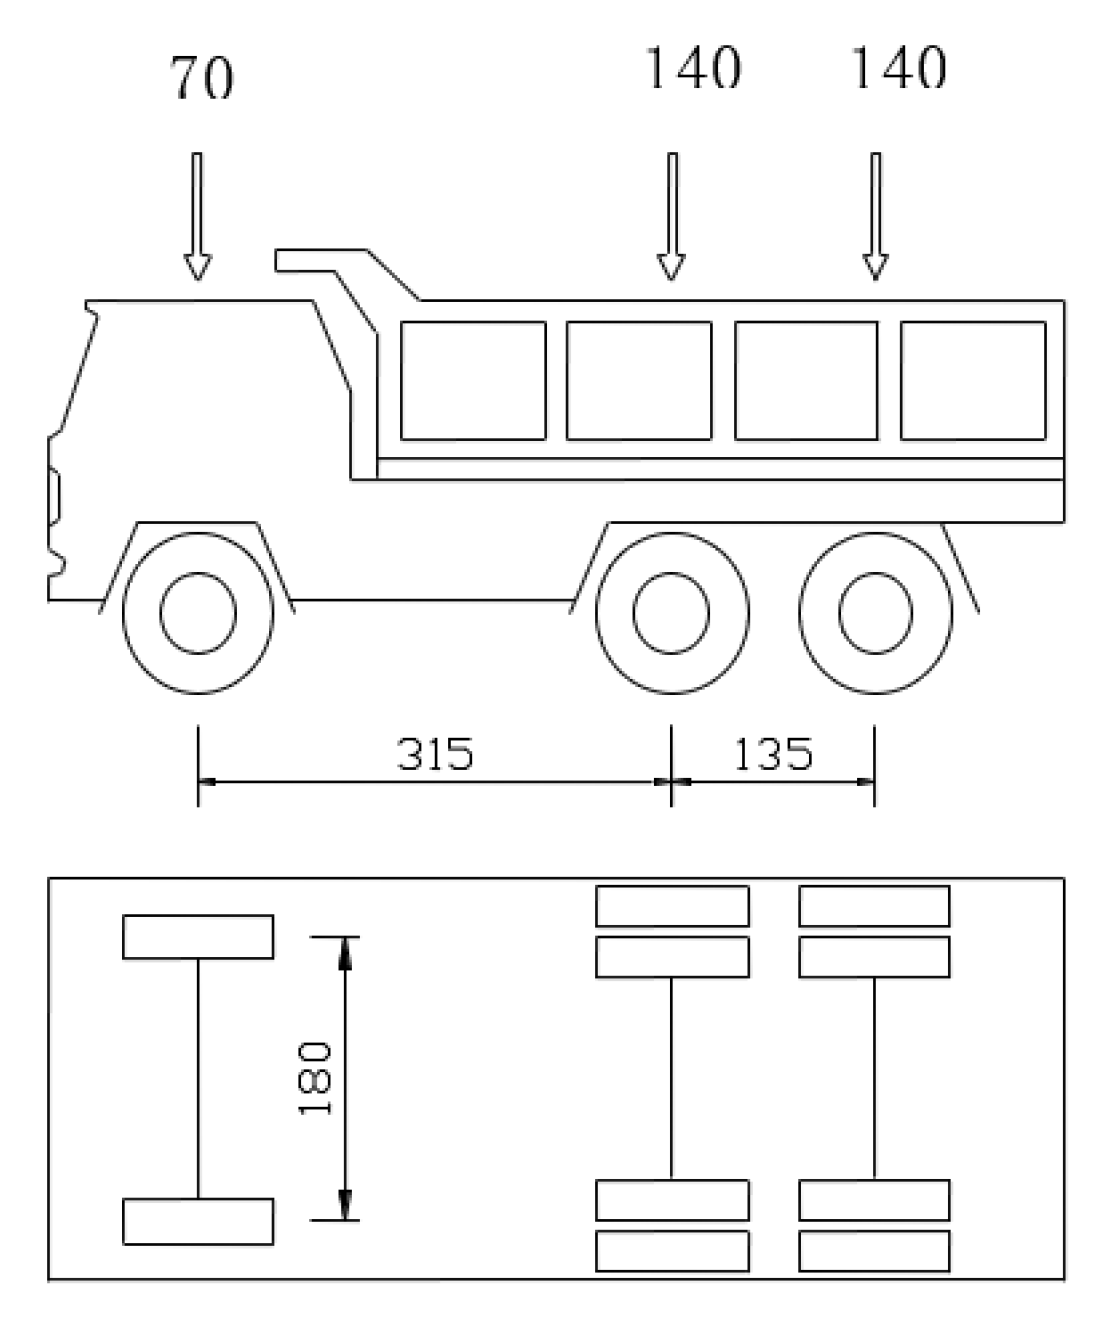
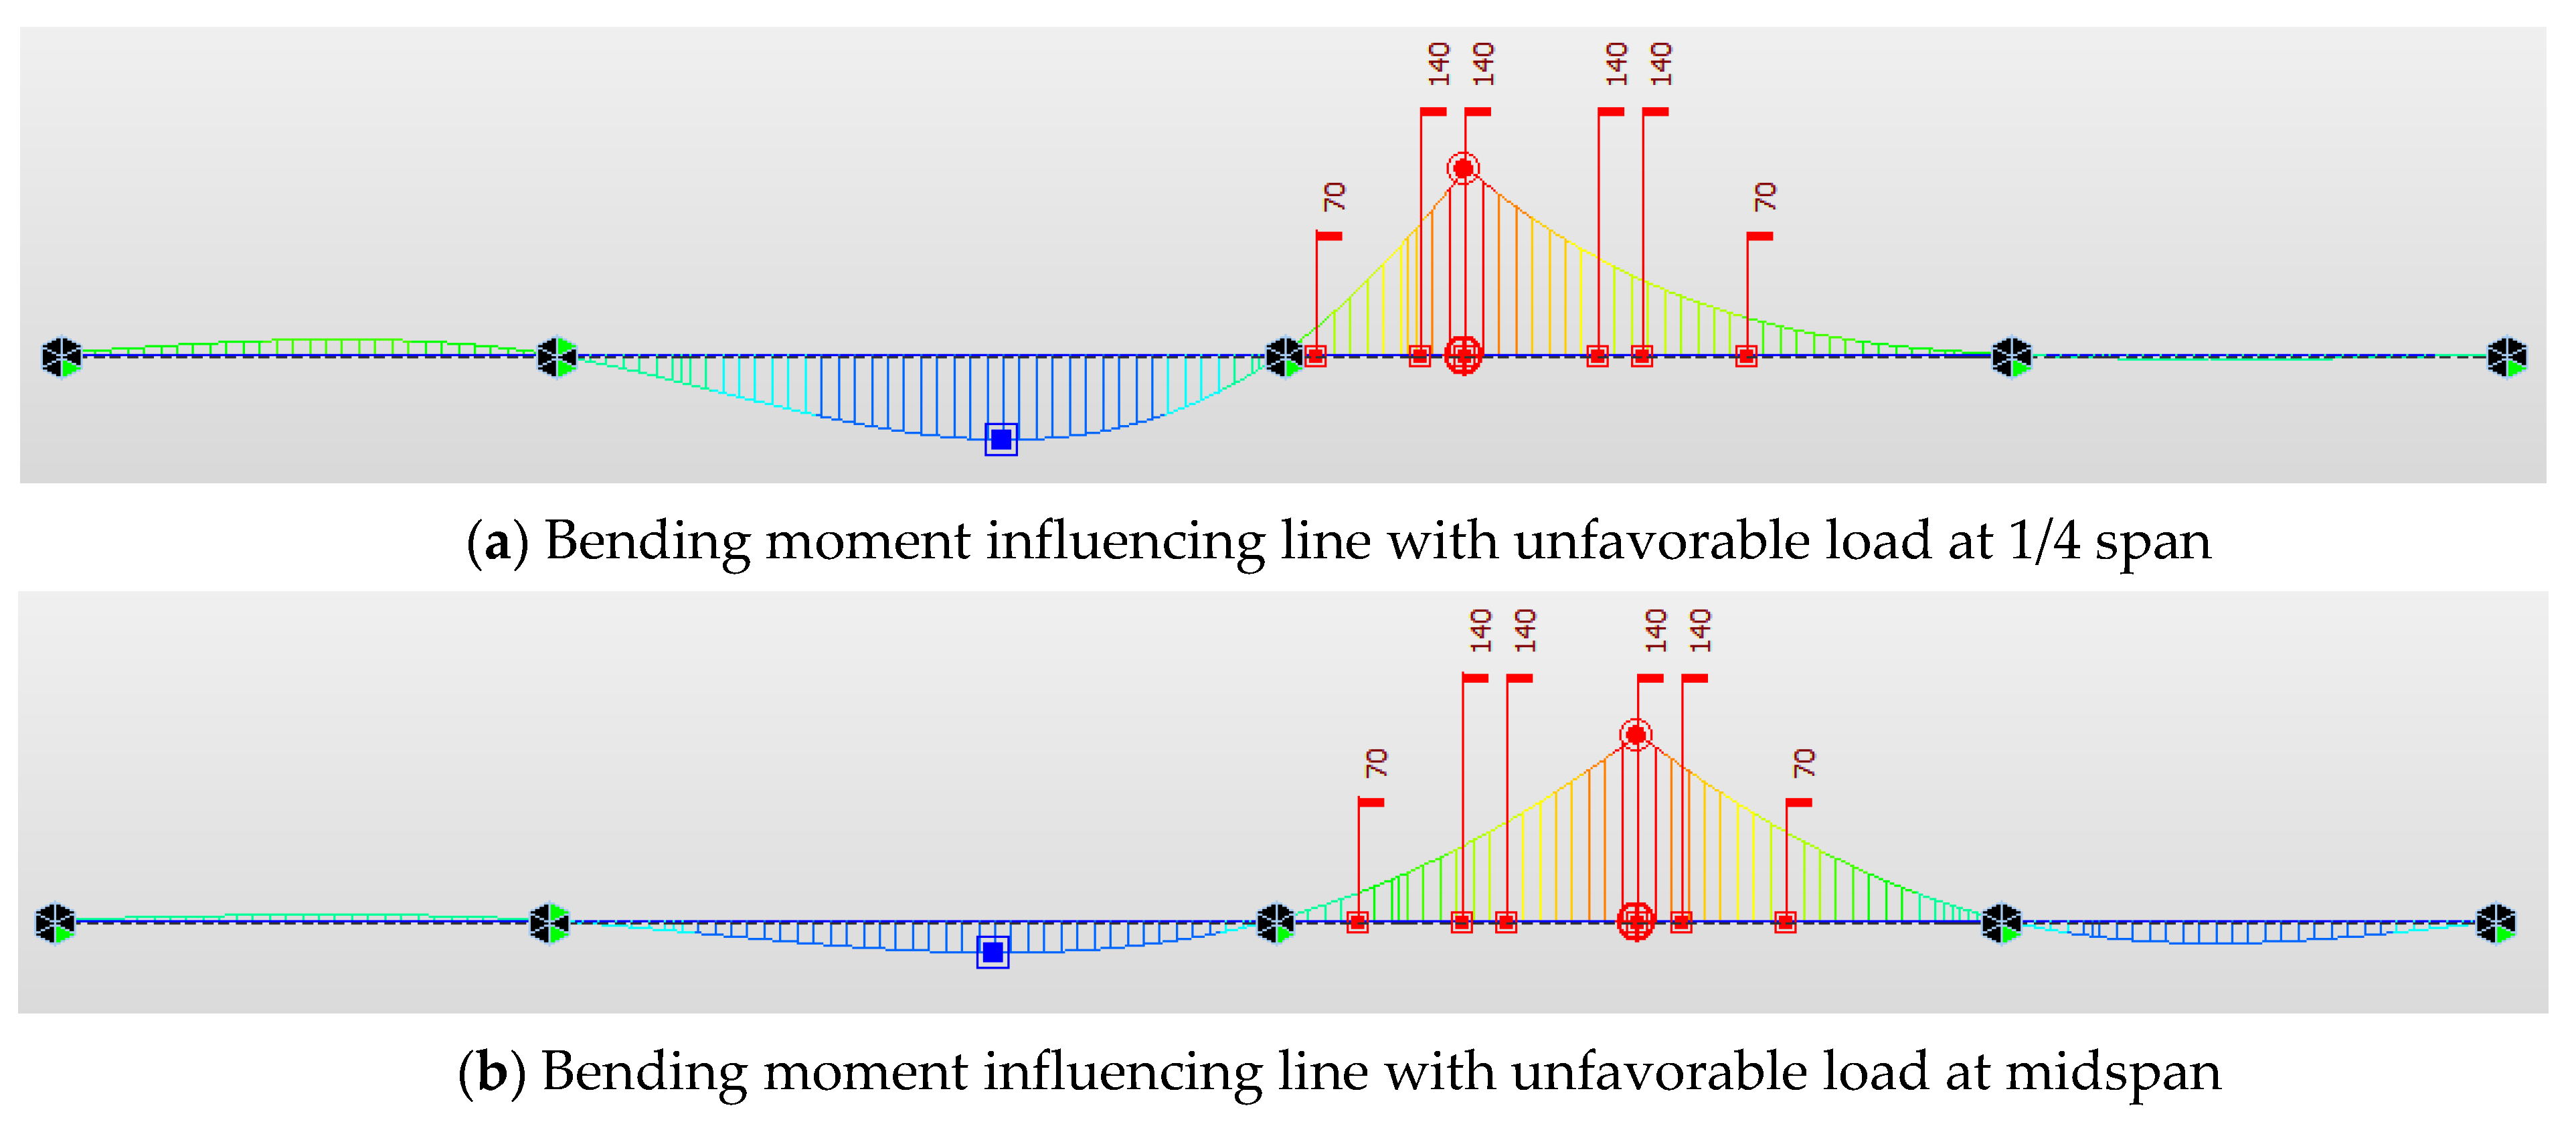
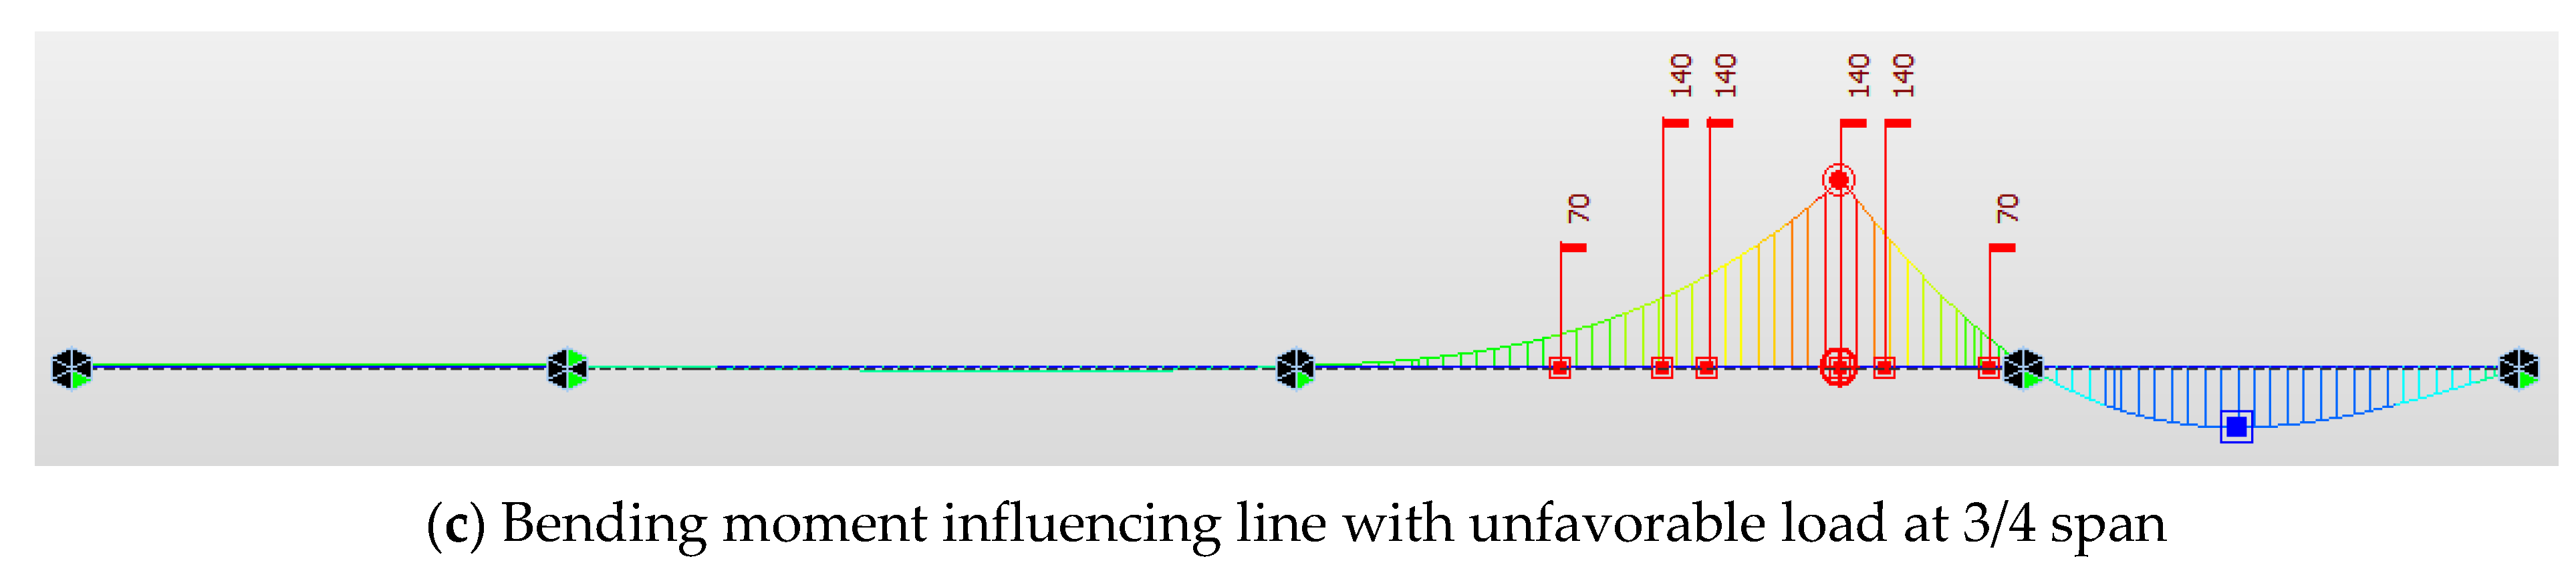
3.1. Static Test Scheme

Based on the structural characteristics of the third bridge span, cross-sections A-A, B-B, and C-C were selected to perform the static test. The vertical arrangement of measurement points on the cross-sections selected for testing is shown in Figure 6.
The strain and displacement measurement points on each of the cross-sections of A-A, B-B, and C-C were numbered 1–6 and 1–3, respectively, from south to north. Three measurement points at the bottom (between the edge of the bottom and the center of the bottom surface) of each of the three cross-sections were selected as points to measure the displacements. During the loading test, the deflections were measured using displacement meters and used as the deflection measurements.
Three measurement points at the top (between the inner side of the railing at the top and the center of the top surface) of each of the three cross-sections were selected as displacement measurement points. A point at one end of the bridge was selected as the reference point. Before strengthening, the change in the bridge deck height because of the loading test was determined based on the measurements of the bridge deck height using an electronic level before and after loading. After strengthening, the change in the bridge deck height because of the loading test was measured again. The results were used as auxiliary data for determining the strengthening effect.
Figure 7 shows the longitudinal arrangement of the measurement points. Figure 8 and Figure 9 show the horizontal arrangement of the measurement points.
In addition, three CFRP laminates were selected, and three strain gauges were adhered to the tensioning end, anchor end, and cross-sections of the three selected CFRP laminates to observe changes in the strain during the tensioning, anchoring, and loading processes.
Before the test, the most unfavorable test load and check load were calculated. An equivalent load was applied during the loading process. Before the test, based on the conditions of where the bridge was located, the axle weight and the wheelbase standard of each loading vehicle were determined. The bending moment influence line of each cross-section was calculated. Then, the internal forces of the girder under the test load and check load were calculated based on the bending moment influence line and the distribution of the load to obtain S s and S . S s is the maximum calculated effective value of the internal force, stress, or deflection at the cross-section under a loading that corresponds to a certain loading test item under a static test load. S is the most unfavorable calculated effective value of the internal force, stress, or deflection at the cross-section under the same loading generated by the check load. The loading efficiency ( η q ) is calculated using the following equation:
η q = S s S × ( 1 + μ )
where μ is the impact coefficient from the specification. η q was maintained between 0.95 and 1.05 when applying the test load to meet the requirements specified in the specification [31]. Table 3 lists the calculation results for each cross-section.
For the 1/2 span and 3/4 span cross-sections, η q was controlled within 0.95–1.05 to meet the requirements specified in the specification [31]. Because the 1/4 span cross-section was close to the negative bending moment zone of the middle pier, the effect of the positive bending moment was relatively small. In addition, the 1/4 span cross-section was not the focus of observations during the loading test. Therefore, for the convenience of easily performing the loading test, loading vehicles (Figure 10) with the same weight were used during the test, and the test efficiency was reduced to a proper level.
Based on the test load distribution calculation, the number, axle load, and position of the loading vehicles used during the test were determined. The theoretical values of the stress and deflection at each measurement point under each loading condition were calculated using a finite element program. The stress and deflection at each measurement point were monitored during the test and compared with the theoretical values [22,23,24,25,33].
Based on the calculations, a total of four 350 kN loading vehicles were used during the test. Before a test, the axle weight of each vehicle was carefully measured, and the weight error was less than 3.5%.
Based on the analysis of the bending moment influencing line (see Figure 11) at each of the 1/4, ½, and 3/4 span cross-sections selected for testing, the three most unfavorable arrangements of load were determined as follows, which were analyzed with MIDAS/Civil 2021 software. When an influence line is used for moving load analysis, the program automatically calculates the position of the vehicle and axle when a specific section is selected for unfavorable load placement, resulting in the most unfavorable force on that section.
According to these three most unfavorable arrangements, each cross-section (A-A, B-B, and C-C) was subjected to two load cases with four vehicles (①–④): central loading and eccentric loading. Table 4 only shows the loading arrangements of one unfavorable arrangement of vehicles: (a) plane arrangement; (b) longitudinal arrangement; and (c) transversal.
Loading was controlled during the loading test according to the following scheme:
(1)
The load was applied according to the abovementioned sequence during the loading test. The load gradually increased. Strain and displacement were monitored after each column of vehicles was driven to its designated position.
(2)
Preloading was performed prior to the actual loading process to eliminate the effect of inelastic deformation.
(3)
The load was applied strictly according to the sequence. A loading vehicle was used to apply a load only after its weight was measured and if it met the requirement.

3.2. Dynamic Loading Test
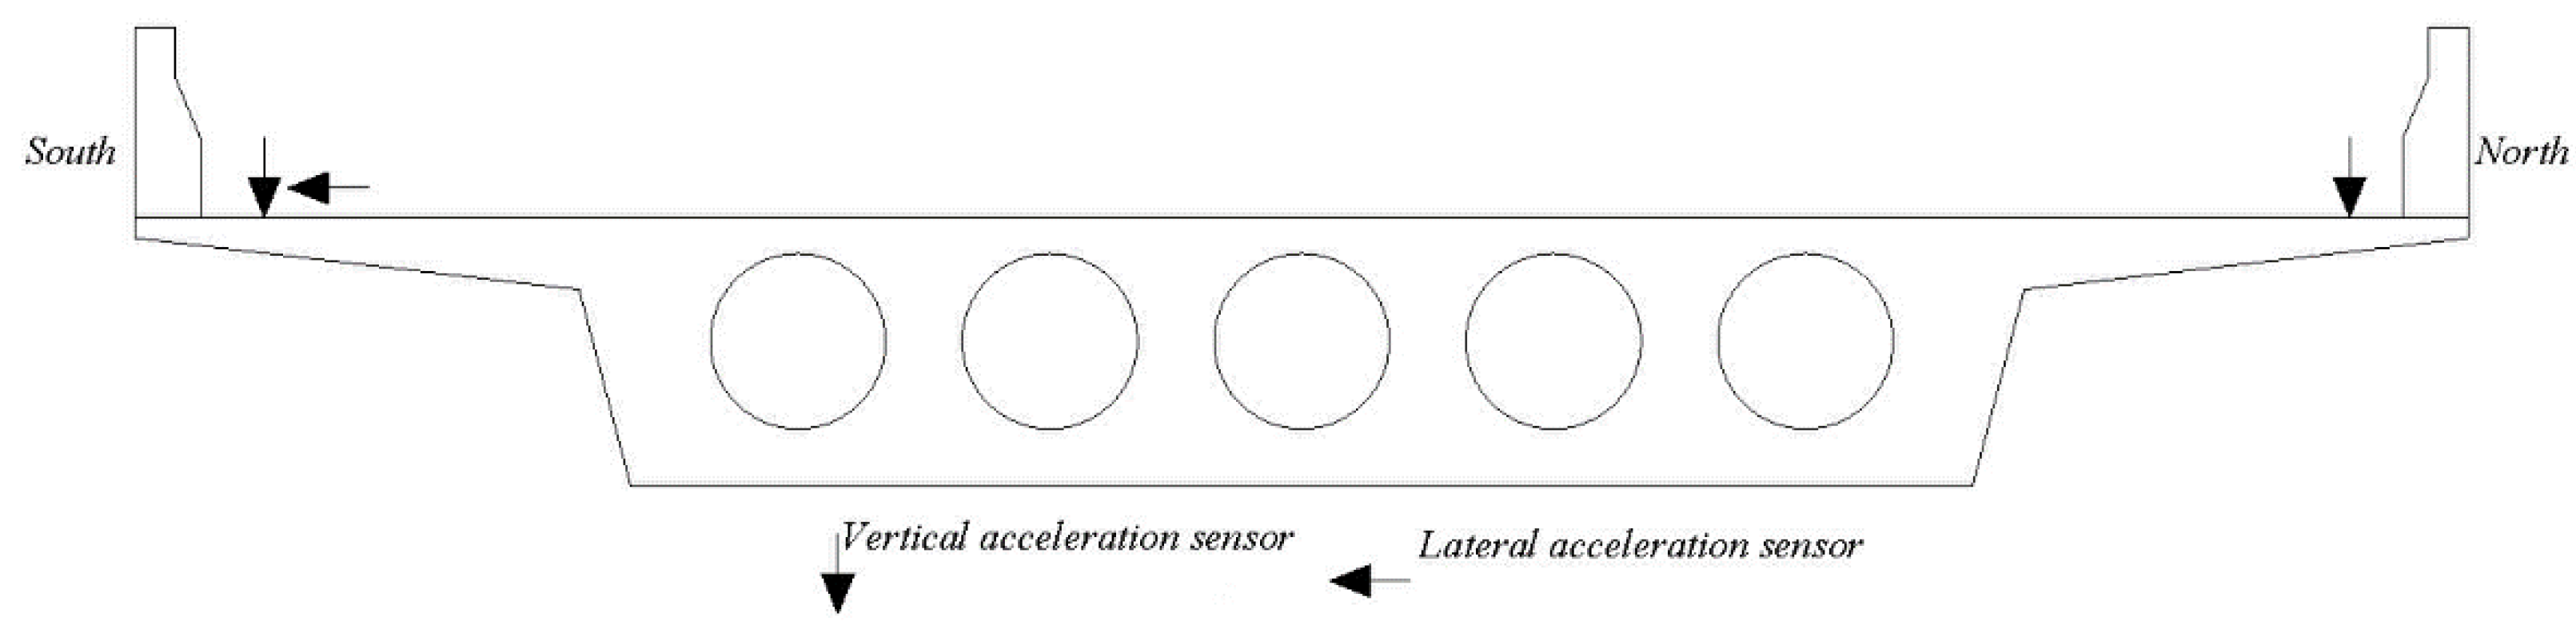
3.2.1. Test Scheme

(1) Acceleration Sensor Point
In the middle section B-B of the test span, two vertical acceleration sensors were arranged on the upstream and downstream sides of each section, and another horizontal transverse bridge acceleration sensor was arranged on the upstream side. The horizontal bridge acceleration sensor was arranged as shown in Figure 12, the arrow’s direction indicates the sensor test direction.
(2) Dynamic strain measuring point
Two dynamic strain measurement points were arranged at the bottom of the beam of section B-B in the middle span of the test span. The transverse dynamic strain layout is shown in Figure 9.

3.2.2. Loading Test

(1) Load case 1 (moving load test)
A 350 kN vehicle was used to pass over the bridge at speeds of 20 km/h, 30 km/h, and 40 km/h to test the dynamic stress and forced vibration frequency of section B-B.
(2) Load case 2 (vehicle braking test)
A 350 kN vehicle was used to pass over the bridge at a speed of 30 km/h to measure the dynamic stress and vibration characteristics of section B-B.
(3) Load case 3 (jumping vehicle test)
A 350 kN vehicle was used to test the vibration characteristics of the bridge by crossing 15 cm triangular wood at section B-B and then braking.

4. Results Analysis

4.1. Comparison of the Static Strain Measurements

The strain at each of the three cross-sections under central loading differed before and after strengthening, and all differences in the strain occurred in cross-section B. After strengthening, the maximum strain increment was 13 με. However, the change in the strain after strengthening was less than 20 με, except for at measurement point C-4 under loading case 3 (Table 5).

4.2. Comparison of Deflection Measurements

A change in the deflection after strengthening occurred in the midspan cross-section for all loading conditions. The maximum change in the deflection (0.501 mm) occurred at measurement point B-2 under loading case 5 (Table 6).
In addition, the level of the bridge deck was measured before and after strengthening using an electronic level. Based on processing of the deflection measurements at nine measurement points on the bridge deck, the bridge deck arched upward after the bridge was strengthened with prestressed CFRP laminates. The maximum change in the level of the bridge deck after strengthening was 3.2 mm and occurred in cross-section C-C.

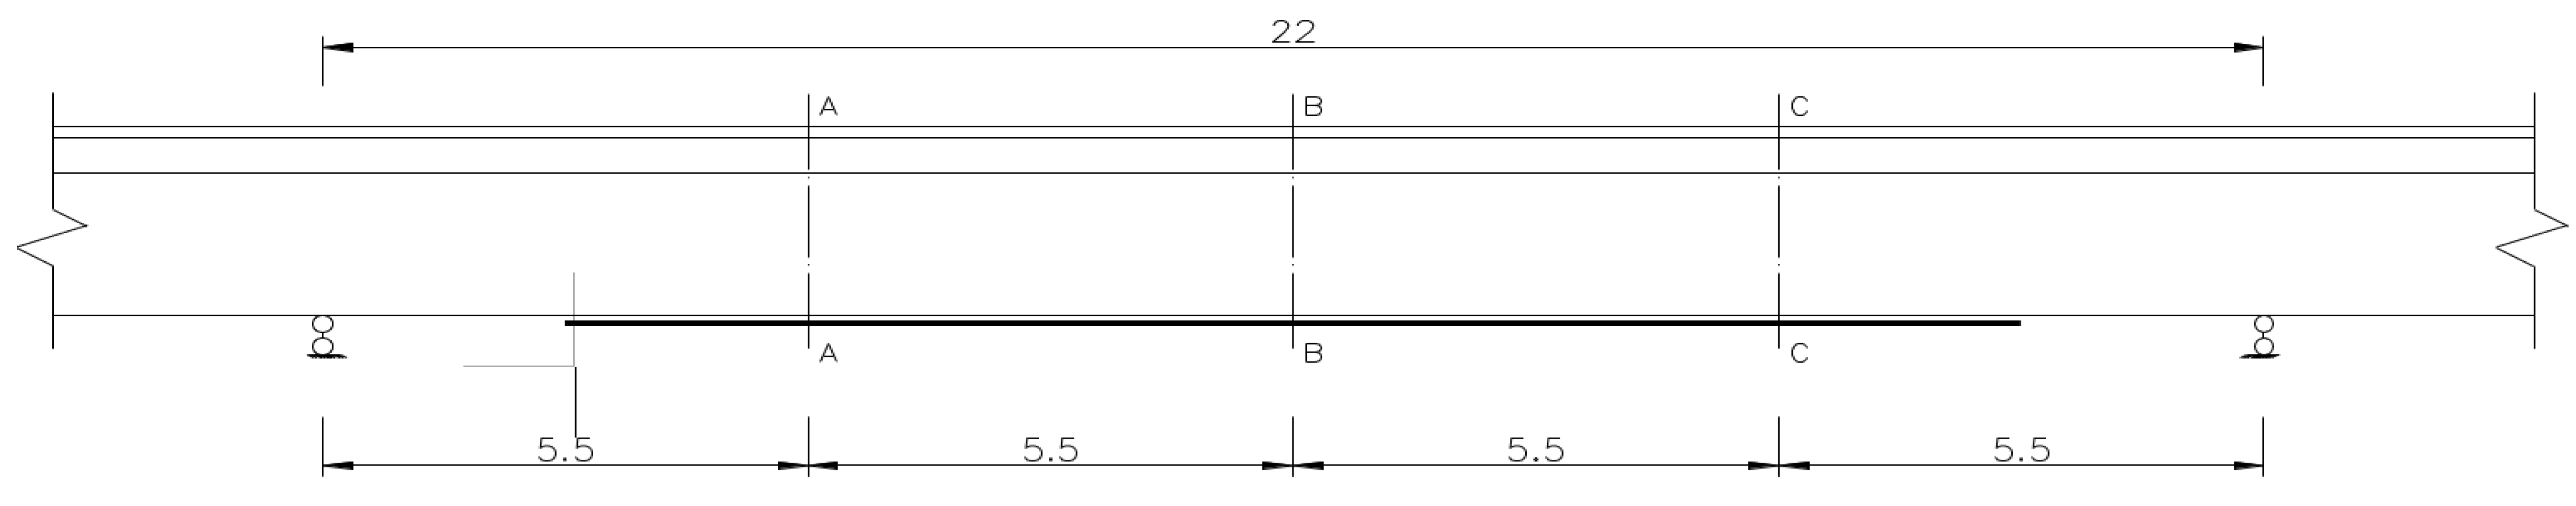
4.3. Test Results concerning the Prestressed CFRP Laminates

Three strain points were arranged to measure the three ordinary CFRP laminates on cross-sections A-A, B-B, and C-C. For each CFRP laminate, the maximum strain increment occurred at the midspan cross-section. The maximum strain increment was 57 με in No. Load case 4.
Based on the results, the effect of central versus eccentric loading conditions on the mechanical conditions of a CFRP laminate for the same cross-section was relatively small. Additionally, the mechanical properties of the bond between the CFRP laminates and the concrete were satisfactorily utilized in all three cross-sections tested.
Based on the findings, the influence of central versus eccentric loading conditions on the mechanical properties of a CFRP laminate for the same cross-section was negligible. Moreover, the mechanical bond between the CFRP laminates and the concrete was effectively exploited in all three cross-sections examined.
Nos. 1 and 3 CFRP laminates were prestretched to 134.4 kN. No. 2 and No. 4 CFRP laminates were measured at sections A-A, B-B, and C-C. Corresponding force changes at each measuring point were obtained according to the measured wavelength changes of the optical fiber. The detailed measurement results are shown in Table 7. The increment obtained is corrected according to the temperature compensation.
According to the test results of the CFRP laminate with FBG, the following conclusions can be drawn:
  • For the same CFRP laminate (regardless of tension), the stresses under different load cases were relatively uniform, and the range of change was relatively consistent;
  • Regarding the final uniform stress of each CFRP laminate at the A-A, B-B, and C-C sections, the adhesive performance between the prestressed CFRP and the concrete was proven with a small prestress loss.

4.4. Comparison of Dynamic Behaviors

4.4.1. Moving Load Test

(1)
Dynamic Deflection in Midspan
Table 8 lists the maximum deflection in the midspan under different vehicle speeds.
The following conclusions can be drawn from the comparison of the midspan maximum dynamic deflection:
At different speeds, the maximum dynamic deflection in the middle span after reinforcement decreases by 25.73% compared with that before reinforcement;
With the increase in the vehicle speed, the change rate of the dynamic deflection in the middle span before and after reinforcement increases gradually;
The use of prestressed CFRP laminate for reinforcement can obviously improve the bridge’s dynamic response.
(2)
Dynamic strain in midspan
In Table 9, the change in dynamic strain in the midspan is listed.
The following conclusions can be drawn from the maximum dynamic strain in the midspan:
Compared with before reinforcement, the maximum dynamic strain in the middle span after reinforcement decreases by 18.00% compared with that before reinforcement, and the change rate increases gradually with increasing vehicle speed.
Similar to the dynamic deflection, it was proven again that the reinforcement obviously improved the bridge’s dynamic response.
(3)
Impact coefficient comparison
Table 10 shows the change in the impact coefficient. The reinforcement of the bridge resulted in a reduction in the rate of vertical force generated on the bridge when a vehicle passed through it. This improvement in dynamic performance suggests that the quality of the new pavement reconstruction should be well-controlled to ensure the flatness of the bridge deck and to reduce the impact effect of the bridge. Figure 13 presents the time–history curve when the vehicle runs at 40 km/h after reinforcement.

4.4.2. Vehicle Braking Test

The results comparison under vehicle braking at 30 km/h before and after reinforcement is shown in Table 11.
According to the result comparison, after reinforcement, the dynamic deflection decreased by approximately 6%, while the dynamic strain increased by approximately 60%, because the prestress improved the reserves of tensile stress at the bottom of the girder.

4.4.3. Jumping Vehicle Test

The first-order vibration frequency of the bridge is higher, and the stiffness of the bridge is larger. Modal analysis results of load tests before and after reinforcement show that the natural frequency remains 6.75 Hz, and the damping ratio remains at 1.53%.
It can be concluded (Table 12) that under the jumping vehicle, the impact coefficient and damping ratio before and after reinforcement are both reduced, and the damping ratio decreases greatly, reaching 43.69%. Figure 14 shows the time–history curve under the jumping vehicle after reinforcement.
Figure 14 shows the time–history curve of the vibration waveform, and Figure 15 show the amplitude spectrum under the jumping vehicle at Point 3-Z.

5. Conclusions

(1)
The anchorage system for CFRP laminates was effective in enhancing the anchorage efficiency of CFRP laminates, and the strengthening results demonstrated that the stress distribution at the midspan section after strengthening was reasonable. Additionally, the distribution trend of the longitudinal displacement at each measurement point was consistent with the theoretical calculations, and the measurements were lower than the theoretical values.
(2)
The loading test proved that the prestressed CFRP laminates showed excellent operating performance and established bonding performance between CFRP laminates and concrete. The anchorage did not undergo any retraction deformation, with only a small loss in prestress.
(3)
The prestressed CFRP laminates and bridge structure experienced stress and deformed together as a composite. The CFRP laminates and the bridge structure exhibited excellent operating performance together.
(4)
For each loading condition, the maximum measurement of the deflection at the midspan cross-section was smaller than the allowable value specified in the design specification. Therefore, the stiffness of the bridge met the requirements of the specification.
(5)
The small residual deformation and strain after removing the vehicles demonstrated that the bridge was in the elastic stage, indicating the efficiency of the CFRP prestressing.
(6)
The dynamic results under moving, braking, and jumping vehicles proved that the reinforcement with the prestressing CFRP laminate satisfied the original expectation and verified that the strengthening recovered the performance of the bridge.

Author Contributions

Conceptualization, F.L.; methodology, Y.L.; validation, Y.L.; formal analysis, Y.L.; investigation, Y.L.; resources, F.L.; data curation, Y.L. and F.L.; writing—original draft preparation, Y.L.; writing—review and editing, F.L.; visualization, Y.L.; supervision, F.L.; project administration, F.L.; funding acquisition, F.L. All authors have read and agreed to the published version of the manuscript.

Funding

This research received no external funding.

Institutional Review Board Statement

Not applicable.

Informed Consent Statement

Not applicable.

Data Availability Statement

The data used to support the findings of this study are included within the article.

Conflicts of Interest

The authors declare that they have no conflict of interest.

References

  1. Hollaway, L.C. A review of the present and future utilisation of FRP composites in the civil infrastructure with reference to their important in-service properties. Constr. Build. Mater. 2010, 24, 2419–2445. [Google Scholar] [CrossRef]
  2. Pimenta, S.; Pinho, S.T. Recycling carbon fibre reinforced polymers for structural applications: Technology review and market outlook. Waste Manag. 2011, 31, 378–392. [Google Scholar] [CrossRef] [Green Version]
  3. Shen, Y.; Jiang, X.; Qiang, X.; Chen, L. Experimental Study on Steel‒Concrete Composite Beams Strengthened by Externally Prestressed CFRP Strips. Prestress. Technol. 2023, 27, 39–52. [Google Scholar] [CrossRef]
  4. Ren, Y.; Wang, H.; Guan, Z.; Yang, K. Evaluation of the properties and applications of FRP bars and anchors: A review. Rev. Adv. Mater. Sci. 2023, 62, 20220287. [Google Scholar] [CrossRef]
  5. El-Sayed, A.K. Effect of longitudinal CFRP strengthening on the shear resistance of reinforced concrete beams. Compos. Part B Eng. 2014, 58, 422–429. [Google Scholar] [CrossRef]
  6. Jokubaitis, A.; Valivonis, J. An Analysis of the Transfer Lengths of Different Types of Prestressed Fiber-Reinforced Polymer Reinforcement. Polymers 2022, 14, 3931. [Google Scholar] [CrossRef]
  7. Burningham, C.A.; Pantelides, C.P.; Reaveley, L.D. Repair of reinforced concrete deep beams using post-tensioned CFRP rods. Compos. Struct. 2015, 125, 256–265. [Google Scholar] [CrossRef]
  8. Garden, H.N.; Hollaway, L.C. An experimental study of the influence of plate end anchorage of carbon fibre composite plates used to strengthen reinforced concrete beams. Compos. Struct. 1998, 42, 175–188. [Google Scholar] [CrossRef]
  9. Schmidt, J.W.; Bennitz, A.; Taljsten, B.; Goltermann, P.; Pedersen, H. Mechanical anchorage of FRP tendons—A literature review. Constr. Build. Mater. 2012, 32, 110–121. [Google Scholar] [CrossRef]
  10. Jayaprakash, J.; Pournasiri, E.; Choong, K.K.; Tan, C.G.; De’nan, F. External CFRP repairing of pretested beams reinforced using prestress rebars. J. Reinf. Plast. Compos. 2011, 30, 1753–1768. [Google Scholar] [CrossRef]
  11. Mostafa, A.; Razaqpur, A.G. CFRP Anchor for Preventing Premature Debonding of Externally Bonded FRP Laminates from Concrete. J. Compos. Constr. 2013, 17, 641–650. [Google Scholar] [CrossRef]
  12. Mostafa, A.A.B.; Razaqpur, A.G. A new CFRP anchor for preventing separation of externally bonded laminates from concrete. J. Reinf. Plast. Compos. 2013, 32, 1895–1906. [Google Scholar] [CrossRef]
  13. Mosavi, S.M.; Nik, A.S. Strengthening of steel-concrete composite girders using carbon fibre reinforced polymer (CFRP) plates. Sadhana Acad. Sci. 2015, 40, 249–261. [Google Scholar] [CrossRef] [Green Version]
  14. Sun, W.; Ghannoum, W.M. Modeling of anchored CFRP strips bonded to concrete. Constr. Build. Mater. 2015, 85, 144–156. [Google Scholar] [CrossRef]
  15. Xu, Y.; Dong, Y.; Luo, Y.; Lin, B. Experimental study on shear behavior of reinforced concrete beams strengthened with CFRP sheet after fire. J. Build. Struct. 2015, 36, 123–132. [Google Scholar]
  16. Wang, H.-T.; Bian, Z.-N.; Xu, G.-W.; Chen, M.-S.; Xiong, H.; Liu, S.-S. Flexural Strengthening of Large-Scale RC Beams with Nonprestressed and Prestressed CFRP Using Different Anchorages. Polymers 2022, 14, 5498. [Google Scholar] [CrossRef]
  17. Rogowski, J.; Kotynia, R. Comparison of Prestressing Methods with CFRP and SMA Materials in Flexurally Strengthened RC Members. Materials 2022, 15, 1231. [Google Scholar] [CrossRef]
  18. Wang, W.W.; Dai, J.G.; Harries, K.A.; Zhang, L. Prediction of prestress losses in RC beams externally strengthened with prestressed CFRP sheets/plates. J. Reinf. Plast. Compos. 2014, 33, 699–713. [Google Scholar] [CrossRef]
  19. Yapa, H.D.; Lees, J.M. Rectangular Reinforced Concrete Beams Strengthened with CFRP Straps. J. Compos. Constr. 2014, 18, 04013032. [Google Scholar] [CrossRef] [Green Version]
  20. Trentin, C.; Casas, J.R. Safety factors for CFRP strengthening in bending of reinforced concrete bridges. Compos. Struct. 2015, 128, 188–198. [Google Scholar] [CrossRef] [Green Version]
  21. Li, F.; Li, W.; Lu, S.; Shen, Y. Development of a Prestressing CFRP Laminate Anchorage System and Bridge Strengthening Application. Adv. Mater. Sci. Eng. 2019, 2019, 3503898. [Google Scholar] [CrossRef] [Green Version]
  22. Richardson, T.; Fam, A. Modulus Effect of Bonded CFRP Laminates Used for Repairing Preyield and Postyield Cracked Concrete Beams. J. Compos. Constr. 2014, 18, 04013054. [Google Scholar] [CrossRef]
  23. Sakar, G.; Tanarslan, H.M. Prestressed CFRP Fabrics for Flexural Strengthening of Concrete Beams with an Easy Prestressing Technique. Mech. Compos. Mater. 2014, 50, 537–542. [Google Scholar] [CrossRef]
  24. Verbruggen, S.; Tysmans, T.; Wastiels, J. TRC or CFRP strengthening for reinforced concrete beams: An experimental study of the cracking behaviour. Eng. Struct. 2014, 77, 49–56. [Google Scholar] [CrossRef]
  25. Xie, J.H.; Guo, Y.C.; Liu, Y.F.; Chen, G.F. Experimental Study on Flexural Behaviour of Pre-Damaged Reinforced Concrete Beams Strengthened with CFRP. Mater. Plast. 2014, 51, 370–375. [Google Scholar]
  26. JTG/T J22-2008; Specifications for Strengthening Design of Highway Bridge. CCCC First Highway Consultants Co., Ltd., China Communications Press: Beijing, China, 2008.
  27. JTG/T J23-2008; Technical Specifications for Strengthening Construction of Highway Bridges. CCCC First Highway Consultants Co., Ltd., China Communications Press: Beijing, China, 2008.
  28. JTGD62-2004; Code for Design of Highway Reinforced Concrete and Prestressed Concrete Rridge and Culverts. CCCC Highway Consultants Co., Ltd., China Communications Press: Beijing, China, 2004.
  29. JTG D60-2015; General Specifications for Design of Highway Bridges and Culverts. CCCC Highway Consultants Co., Ltd., China Communications Press: Beijing, China, 2015.
  30. GB 50010-2010; Code for Design of Concrete Structure. CCCC Highway Consultants Co., Ltd., China Architecture & Building Press: Beijing, China, 2015.
  31. Volume JTG/T J21-2011; Specification for Inspection and Evaluation of Load-Bearing Capacity of Highway Bridges. Academy of Highway Science, Ministry of Transport, China Communications Press: Beijing, China, 2011.
  32. Saadatmanesh, H.; Ehsani, M.R. RC beams strengthened with GFRP plates. I: Experimental study. J. Struct. Eng. ASCE 1991, 11, 3417–3433. [Google Scholar] [CrossRef]
  33. Boukhezar, M.; Samai, M.L.; Mesbah, H.A.; Houari, H. Flexural behaviour of reinforced low-strength concrete beams strengthened with CFRP plates. Struct. Eng. Mech. 2013, 47, 819–838. [Google Scholar] [CrossRef]
Figure 1. Pictures of different application cases. (a) T-beam web longitudinal reinforcement; (b) Capping beam transverse reinforcement; (c) Longitudinal reinforcement of the small box girder; (d) Transverse reinforcement of the box girder.
Sustainability 15 11197 g001
Figure 2. Bridge bottom before and after strengthening. (a) Layout of bridge; (b) Deck of bridge; (c) Bridge bottom before strengthening; (d) Measurement during strengthening; (e) Bridge bottom after strengthening; (f) Loading test with vehicles.
Sustainability 15 11197 g002aSustainability 15 11197 g002b
Figure 3. The location of the strengthened span of the bridge (unit: m).
Sustainability 15 11197 g003
Figure 4. The cross-section of the strengthened bridge beam (unit: m).
Sustainability 15 11197 g004
Figure 5. Arrangement of the CFRP laminate and FBG (unit: mm).
Sustainability 15 11197 g005
Figure 6. The cross-section for testing (unit: m).
Sustainability 15 11197 g006
Figure 7. The longitudinal measurement points’ locations (unit: m).
Sustainability 15 11197 g007
Figure 8. The measurement points’ locations of sections A-A and C-C (unit: m).
Sustainability 15 11197 g008
Figure 9. The measurement points’ locations of section B-B (unit: m).
Sustainability 15 11197 g009
Figure 10. Axle weight and axle base of loading vehicles (unit: kN, cm).
Sustainability 15 11197 g010
Figure 11. Bending moment influencing line with unfavorable load. (Red represents a positive bending moment and blue represents a negative bending moment).
Sustainability 15 11197 g011aSustainability 15 11197 g011b
Figure 12. Locations of acceleration sensors.
Sustainability 15 11197 g012
Figure 13. Time–history curve vibration of vibration waveform under 40 km/h after reinforcement.
Sustainability 15 11197 g013
Figure 14. Time–history curve of the vibration waveform.
Sustainability 15 11197 g014
Figure 15. Amplitude spectrum under the jumping vehicle at Point 3-Z after reinforcement.
Sustainability 15 11197 g015
Table 1. Technical parameters of the CFRP laminate.
TypeWidth × Thickness/mmTensile Strength/
MPa
Ultimate Strength/
kN
Tensile Modulus/
GPa
Extensibility/
%
OVM.CFP100-1.4100 × 1.4≥2600364≥160≥1.6
Technical parameters of anchorage device
TypeC’ × D’ × H (thickness)A’ × B’K × JK’ × J’ΦG × h (depth)
OVM.CFP100-1.2150 × 150 × 55100 × 1.2210 × 260260 × 21024 × 300
Table 2. Anchorage space requirement.
Installation Space for AnchorageGroove Dimensions for Fixed Anchorage End
E × F × H
Groove Dimensions for Tension Anchorage End
E’ × F’ × H
Chemical Bolt Hole Size
250 × 500 × 25300 × 1100 × 25d28 × 210
Table 3. The load and loading efficiency of each cross-section.
LocationUnder Design Load Action
(Truck-Load over 20, Including μ )
Under Test Vehicle Load
(70 + 140 + 140 = 350 kN)
Loading Efficiency η q
1/4 span2269.72070.60.912
1/2 span31523176.71.008
3/4 span2034.41931.70.950
Note: Design load action is truck-load over 20, including μ ; The test vehicle load is 350 kN with three axles (70 kN + 140 kN).
Table 4. Loading vehicle layout—central loading at the A-A section (unit: m).
ArrangementCentral LoadingEccentric Loading
(a)EastSustainability 15 11197 i001Sustainability 15 11197 i002West
(b)EastSustainability 15 11197 i003West
(c)SouthSustainability 15 11197 i004Sustainability 15 11197 i005North
Table 5. Strain change before and after strengthening (unit: με).
Section LocationPoint IDLoad Case 1Load Case 2Load Case 3Load Case 4Load Case 5Load Case 6
1/4 spanA-1−10.48−17.60−12.48−9.48−11.48−11.48
A-2−10.52−17.94−11.52−11.52−11.52−11.52
A-3−11.33−17.43−9.33−11.33−12.33−13.33
A-4−10.08−12.16−10.08−10.08−10.08−11.08
A-5−7.65−4.69−7.65−6.65−8.65−10.65
A-6−10.56−5.69−9.56−9.56−11.56−11.56
1/2 spanB-1−11.00−17.07−11.00−10.00−11.00−10.00
B-2−11.25−19.35−12.25−11.25−12.25−13.25
B-3−10.83−14.88−11.83−10.83−10.83−8.83
B-4−6.70−6.73−5.70−3.70−7.70−5.70
B-5−10.85−11.90−11.85−10.85−11.85−11.85
B-6−14.40−10.41−10.40−8.40−13.40−13.40
3/4 spanC-1−11.96−13.03−11.96−12.96−10.96−10.96
C-2−7.17−8.25−12.17−12.17−13.17−7.17
C-3−10.83−14.88−11.83−12.83−12.83−11.83
C-4−20.66−21.70−36.66−25.66−6.66−2.66
C-5−11.55−11.57−10.55−10.55−11.55−9.55
C-6−11.07−10.04−11.07−10.07−12.07−8.07
Table 6. Deflection change before and after strengthening under different load cases (unit: mm).
Section
Location
Point
ID
Load Case
123456
A-A1−0.320−0.330−0.300−0.330−0.320−0.300
2−0.339−0.309−0.319−0.299−0.319−0.309
3−0.314−0.314−0.314−0.304−0.314−0.324
B-B1−0.455−0.445−0.345−0.395−0.385−0.395
2−0.461−0.451−0.411−0.401−0.501−0.391
3−0.428−0.438−0.418−0.398−0.398−0.398
C-C1−0.334−0.324−0.344−0.364−0.314−0.254
2−0.343−0.303−0.343−0.303−0.313−0.313
3−0.329−0.339−0.329−0.359−0.349−0.359
Table 7. Force increment in CFRP (unit: kN).
Number of CFRP13 2 4
LocationB-BB-BA-AB-BC-CA-AB-BC-C
Load Case Point 1Point 2Point 3Point 1Point 2Point 3
Preload11.2053.1133.9144.2023.7164.0584.3283.734
110.9173.3153.6804.2023.9863.7704.3103.950
210.9533.2603.6984.2204.0223.7344.2023.878
310.9893.3343.7884.2564.0403.8424.4363.950
411.0073.2423.7344.2204.0043.7524.2563.806
511.1333.0583.8964.1843.6803.9684.3103.680
611.2052.9843.8604.1483.6263.8064.0943.572
Table 8. Maximum deflection in midspan under different vehicle speeds.
No.Vehicle Speed/km/hBefore Reinforcement/mmAfter Reinforcement/mmRate of Change/%
1200.88280.8232−6.75
2300.98070.7748−21.00
3400.92540.6873−25.73
Table 9. Dynamic strain in midspan.
No.Vehicle Speed/km/hBefore Reinforcement/μεAfter Reinforcement/μεRate of Change/%
1209.00208.6495−3.92%
2309.70818.6495−10.90%
3408.82557.2369−18.00%
Table 10. Impact coefficient.
No.Vehicle Speed/km/hBefore ReinforcementAfter ReinforcementRate of Change/%
1201.241.12−9.68
2301.221.21−0.82
3401.121.2814.29
Table 11. Dynamic results under vehicle braking at 30 km/h.
No.ItemBefore ReinforcementAfter ReinforcementRate of Change/%
1Dynamic deflection at midspan/mm0.85410.8047−5.78%
2Dynamic strain of concrete at midspan/με6.530910.414159.46%
3Dynamic strain of CFRP laminate at midspan/με21.4265
Table 12. Results before and after reinforcement.
ItemBefore ReinforcementAfter ReinforcementRate of Change/%
Impact coefficient1.401.37−2.14%
Damping ratio2.93%1.65%−43.69%
Disclaimer/Publisher’s Note: The statements, opinions and data contained in all publications are solely those of the individual author(s) and contributor(s) and not of MDPI and/or the editor(s). MDPI and/or the editor(s) disclaim responsibility for any injury to people or property resulting from any ideas, methods, instructions or products referred to in the content.

