1. Introduction
The ongoing energy transition is based on the rapid proliferation and integration of clean and sustainable energy technologies in every domain of the economy. The building domain typically represents a significant share of the total energy consumption of a given economy, mainly due to the need for heating, cooling, and domestic hot water [
1]. Indeed, in 2021, the building sector accounted for 27% of global energy emissions, with the indirect emissions associated with the production of electrical energy and heat constituting an additional 19% of such emissions [
2]. Thus, the use of highly energy-efficient technologies in buildings is essential for accelerating building decarbonization and for eventually achieving the net zero emissions goals of the 2050 scenario. Such technologies include heat pumps (HPs) at their forefront, which are actually emerging as some of the most advanced, flexible, and low-carbon technologies for a sustainable low-carbon future [
3]. Solar thermal systems and biomass and district heat networks can also aid in the decarbonization of the building sector. Moreover, the renovation of building envelopes can lead to important energy efficiency enhancements [
4,
5]. Specifically, the use of insulation and passive houses can lead to an important reduction in a building’s thermal needs.
Air-source heat pumps (ASHPs) are conventional, widely used mechanical compression systems [
6], which nonetheless suffer from a high dependency on the ambient air temperature and an inability to adapt to extreme weather conditions, compromising their energy performance [
7]. Ground-source heat pump (GSHP) systems, on the other hand, feature significant advantages in terms of energy efficiency, performance, and levelized cost, which has allowed for their smooth introduction to the residential and commercial building sectors as promising alternatives to conventional ASHP systems [
8]. The general idea behind their function is that they utilize the ground as a heat source or sink [
9] to produce heating, cooling, and domestic hot water, taking advantage of the underground thermal properties and steadier temperature profiles of soil compared to the highly fluctuating profiles of ambient air [
8]. Moreover, the increased temperature of the ground allows for a better energy performance than conventional heat pumps [
10]. Thus, such systems can provide significant energy savings of up to 50% and 40% for cooling and heating demands, respectively [
11]. ASHRAE has categorized GSHPs into groundwater, ground-coupled, and surface water HP systems. Among them, the groundwater systems are widely utilized and characterized by their vertical (i.e., borehole heat exchangers—BHEs) or horizontal (i.e., horizontal heat exchangers—HHEs) ground closed loops. The increasing research interest and the need for rapid integration into sustainable building systems have led to numerous studies and reports in terms of their performance, hybridization potential with other renewables or thermal storage systems, and techno-economic analysis. However, significant limitations still exist on the use of GSHPs, referring mainly to the lack of available space and a relatively high installation cost in specific cases. Furthermore, the continuous operation of a GSHP system leads to gradual variation in the ground’s temperature. Thus, there is a need for proper design for ground thermal regeneration.
Boba et al. [
12] produced a detailed literature summary on the core design parameters that affect the efficiency of vertical, horizontal, and shallow ground heat exchangers (GHEs). They concluded that advanced spiral configurations, larger spaces among pipes, and a secondary coating of the soil enhance the energy performance of a horizontal GHE, while the depth of installation is not significant within seasonal temperature variations. From another viewpoint, Bellos et al. [
13] conducted research on a vertical GCHP with CO
2 as the working fluid and concluded that the heater outlet temperature, the borehole number, and the ground temperature are among the most influential parameters on the performance of an HP. Both experimental and numerical analyses of a horizontal GCHP at 1 m installation depth revealed the importance of the ground temperature distribution on the HP performance coefficient [
14], suggesting that, upon system selection, it is useful to take into account the GCHP limitations due to the high construction and maintenance costs of the piping as well as the thermal properties of the ground [
8].
The need to further improve GCHP efficiency has led to the coupling of various renewable energy sources with such GCHPs for the optimization of the thermal source temperature [
7]. The solar-assisted heat pump (SAHP) is a promising solution in this context, utilizing thermal solar panels as a low-temperature heat sink, improving the overall performance of the evaporator heating cycle [
15], while the use of photovoltaics to drive the HPs has also been reported as being a promising solution [
16]. Nonetheless, the variable and intermittent nature of solar irradiation may still undermine the reliability and performance of SAHPs [
17]. For this reason, various studies have focused on the coupling of solar energy to geothermal fields through ground heat exchangers (i.e., solar-assisted ground-coupled heat pumps—SAGCHPs) that are used for ground storage with vertical heat exchangers [
18]. For instance, Hengel et al. [
19] examined a solar-assisted GCHP system with a photovoltaic thermal panel (PVT) as a supplementary source for a dwelling in Austria; indeed, thermal energy utilization via this system has led to the enhancement of the evaporator inlet temperature and therefore to the improvement of the seasonal performance factor (SPF) of the HP system under discussion by 4.1%. Yuehong et al. [
20] have coupled, through experimental research, a GSHP with a vertical double spiral coil GHE and a SAHP for the coverage of heating demand. Another experimental study by Ozgener et al. [
21] has examined the characteristics of a SAGCHP system coupled with vertical GHEs. Esen et al. [
22] have compared the coupling of a solar-assisted GCHP for heating with a horizontal slinky-type GHE and a vertical one (via modeling using artificial neural networks and adaptive neuro-fuzzy inference systems), concluding that the horizontal GHE leads to higher performance. Ciampi et al. [
23] have found that the increase in the solar field area in a solar–ground source-driven heat pump can lead to higher solar fraction but with a decreasing rate. In another work, Rosato et al. [
24] calculated 42% primary energy savings and 38% CO
2 emission avoidance by using a renewably driven heat pump system in Italy. However, it must be taken into account that since SAGCHPs affect the ground source in the long term, the annual performance of such systems depends highly on the ground temperature profile. SAGCHP presents techno-economic advantages compared to GSHP with deep boreholes (for achieving the same efficiency) because the extra costs for solar collectors and tanks are not as high as the cost for extra drilling [
18].
Moreover, the literature includes a few comparative studies regarding different heat pump heating systems. Fraga et al. [
25] have found that the use of groundwater is the best source for feeding a heat pump, while the use of river source, lake source and borehole follows. The less efficient choice was found to be the solar/air sources. Jonas et al. [
26] have found that the incorporation of solar thermal collectors with a ground or air-source heat pump can improve the system’s performance. Duarte et al. [
27] conducted a comparative study regarding domestic hot water for different heat pump heating systems. They have found that the hybrid design that combines solar and ground sources is more efficient compared to the one-source design with only solar or ground or air sources.
The use of solar and ground-driven HPs is widely perceived in the field as a promising strategy for reducing electricity consumption. While the majority of studies reported in the literature focus on assessing a specific technology, there is a lack of detailed comparative studies examining various configurations of heat pump-driven heating systems. In response to such lack of effective HP design configuration insights, the present work investigates, systematically, different configurations of heat pumps to entirely cover the heating demands of a building located in Zaragoza (Spain) with 40 apartments. Specifically, four different configurations are investigated; namely, (i) ASHP, (ii) GSHP, (iii) dual-source heat pump with solar thermal collectors, and (iv) triple-source heat pump with driven solar, geothermal, and air sources. Note that the triple-source case optimally combines the different heat sources, enabling the simultaneous feeding of the heat pumps with the aim of increasing efficiency.
The primary scope of this study is to systemically and comparatively investigate the selected optimized heat pump configurations from an energetic point of view, primarily in terms of efficiency. To conduct such analysis, we utilize a custom-made, dynamic energy tool (i.e., the INTEMA.building tool), which uses the Modelica language [
28] in the Dymola environment [
29]. The unique attribute of this tool is that it allows for the investigation of the examined energy systems and building via the use of detailed models on a
component basis. The simulations are performed with adjustable time steps to take into consideration any abrupt phenomena in the analysis (e.g., as a result of the installation of control systems), thereby providing an outmost realistic framework of the obtained results. The final optimal configuration comparison aims to define the most effective cases in terms of energy efficiency and net present cost (NPC).
2. Materials and Methods
This part includes a thorough description of the examined building and HP heating configurations. Moreover, it includes the detailed mathematical background of the present work and then describes the examined simulation strategy.
2.1. Description of the Building
The studied building refers to a five-story multi-family building in Zaragoza, Aragon, Spain. The specific location is in Arrabal, Zaragoza, with 41.65° latitude and −0.88° longitude. The building has an East–West orientation with approximately zero azimuth on its South side. It is a privately owned building that was constructed in 1970 and consists of 40 apartments with 8 apartments on each floor. The examined building is one of the three demo sites of the InCUBE project (Horizon Europe) [
30], where multiple solutions will be demonstrated and validated.
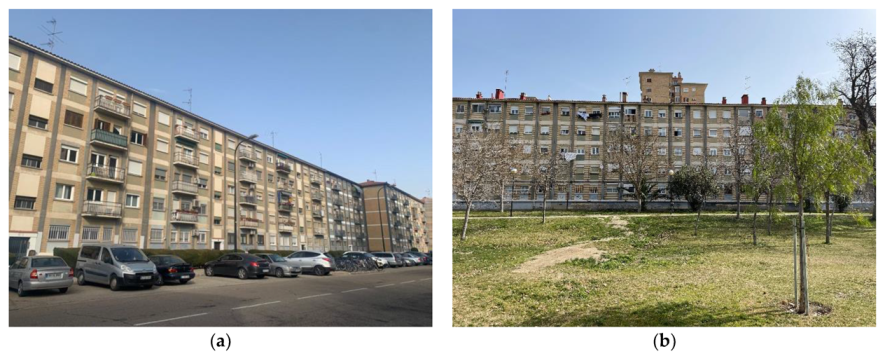
Figure 1 illustrates the building’s front and back sides, while
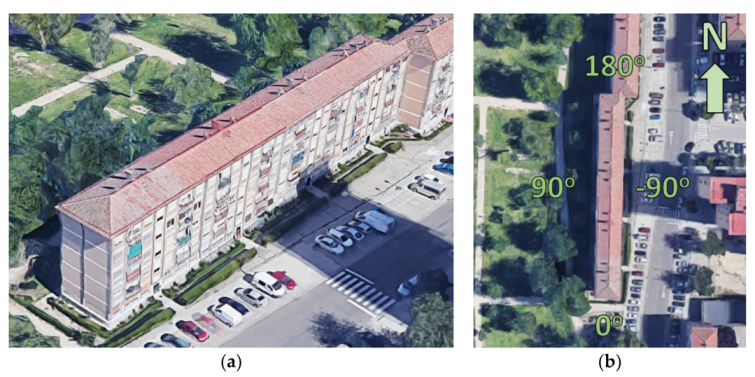
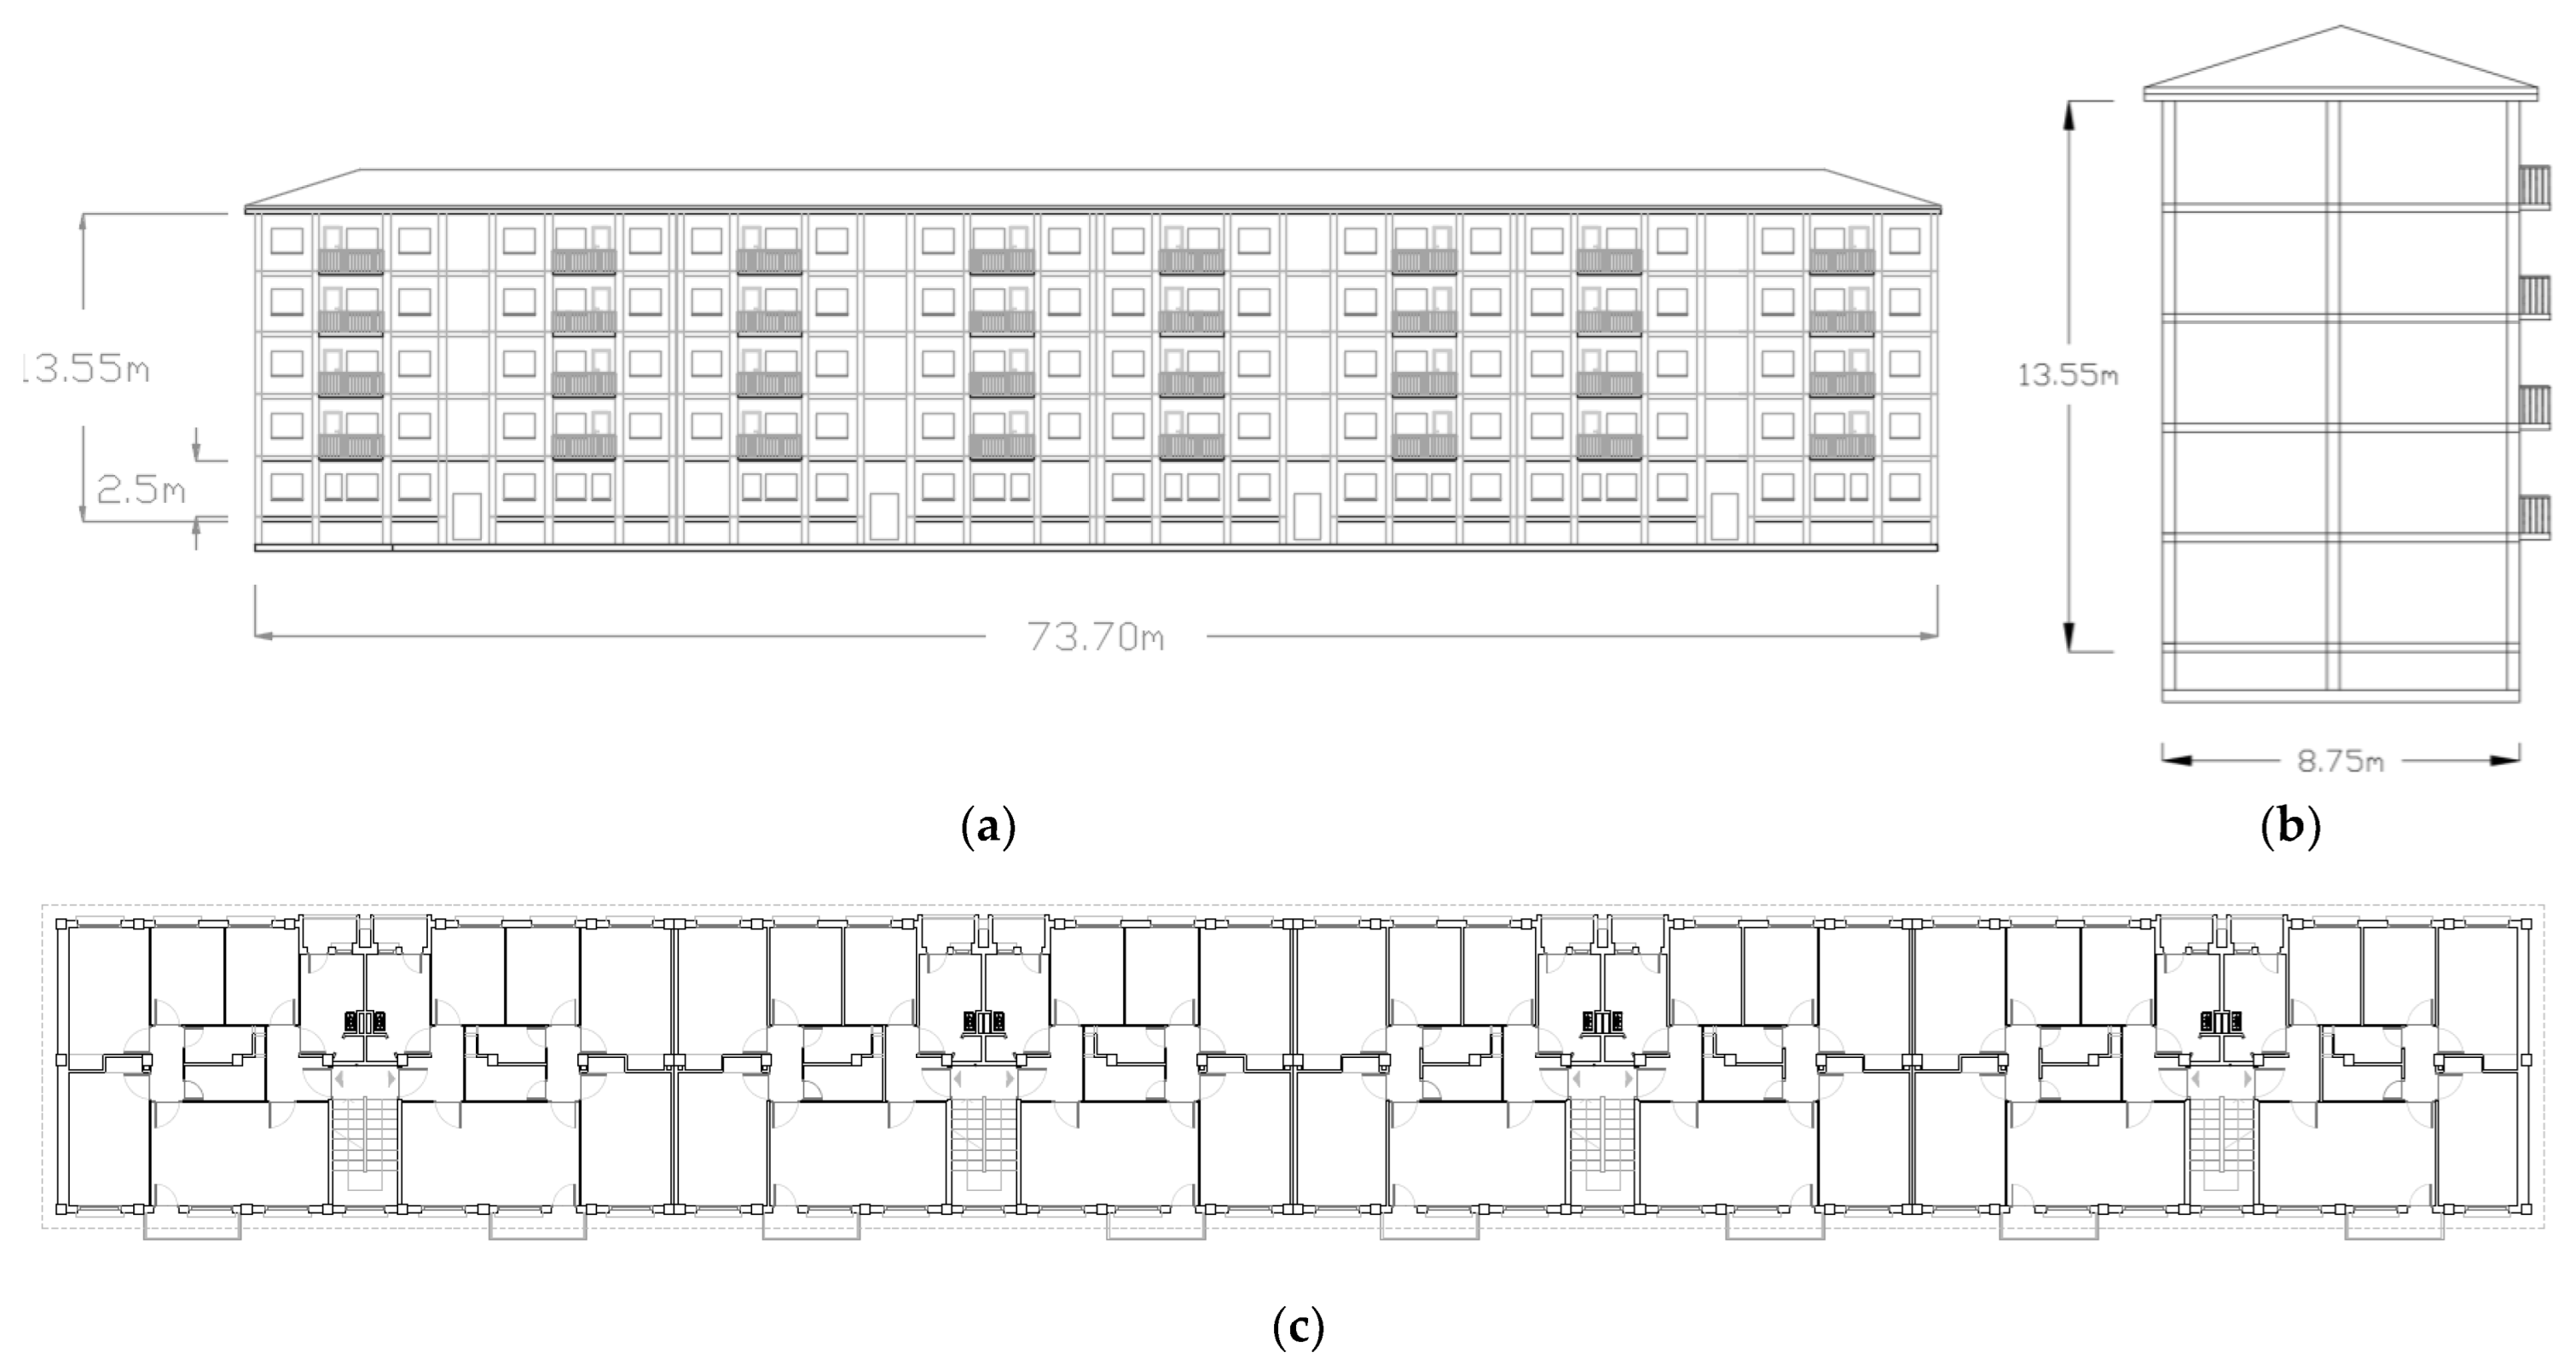
Figure 2 shows the roof of the examined building and the orientation of its external walls by providing the azimuth angles (satellite photographs sourced from Google Earth). Design drawings, BIM models, and construction plans of the building were used as a basis for the estimation of the building’s geometrical dimensions. The east and south elevations of the building, as well as the floor plan of the building’s ground and 1st–4th floor, are demonstrated in
Figure 3a–c, respectively.
Table 1 summarizes the basic structural components of the examined building and their thermal properties. These data have been provided by the consortium of the InCUBE EU project [
30]. The thermal envelope of the building consists of the slab, which is in contact with the ventilated chamber and has a nominal thermal transmittance (U-value) of 1.49 W/m
2K; the horizontal roof slab, which is in contact with the unheated attic and has a nominal U-value of 2.85 W/m
2K; and all the external walls, which have a nominal U-value of 1.47 W/m
2K. The building has no basement, and the ventilated chamber, as well as the area between the horizontal and inclined roofs, are not included in the thermal analysis calculation. The current glazing system of the building consists of single-pane windows (30% of the building openings) with a U-value of 4.5 W/m
2K and double-pane windows (70% of the building openings) with a U-value of 2.5 W/m
2K. Thus, the mean U-value of the windows is considered to be 3.1 W/m
2K, proportionally to relevant areas. These U-values include the glazing, frame, and thermal bridging effects.
In order to appropriately describe the boundary conditions for the simulation of the building envelope, an adjustment in the U-values of the structural components that are not in direct contact with the ambiance has been made. Firstly, for the roof slab, the equivalent U-value of the horizontal roof slab is considered to be lower than the nominal U-value of 2.85 W/m
2K and equal to 1.7 W/m
2K, due to the fact that the space between the horizontal and the tilted roof slab is unconditioned. Similarly, for the case of the slab that is in contact with the ventilated chamber, the equivalent (U) decreased from 1.49 to 1.25 W/m
2K. The aforementioned assumptions have been made in accordance with Spanish legislation and the tool CE3x for the Energy Performance Certificate in Spain [
31]. As far as the external walls are concerned, the equivalent (U) of the external walls is increased by 0.2 W/m
2K to 1.67 W/m
2K to include the thermal bridge effects caused by the building’s multiple balconies. This assumption is a reasonable one, according to Ref. [
32].
It is important to clarify that for simulation and calculation purposes, if the zone neighbors the ambient (outdoor conditions) environment, the thermal losses are high, and the heat transfer coefficient (U) of the relevant border is multiplied by a reducing coefficient (b) equal to unity. If the neighboring space is non-heated, the reducing coefficient (b) is set equal to 0.5, whilst the (b) coefficient is equal to zero if the neighboring space is heated since, for such conditions, no thermal flux is calculated [
32]. For the north external walls case that is in contact with a neighbor building, to ensure conservative calculations, the building is considered unheated and, therefore, the (b) coefficient is equal to 0.5.
Table 2 includes additional information regarding the detailed description of the examined building envelope. The absorbance of the opaque structural elements was estimated to be 60% with an emittance of 80%, which are typical values according to Ref. [
32]. Regarding windows, the emittance value is estimated at 90% and the total solar energy transmittance (g-value) at 82%. In
Table 3, the areas of the external surfaces of the building are given for every orientation. The external walls are in contact with the ambient air, with the exception of a part on the north side that is managed as per the discussed methodology. Moreover, the current building has windows only in the walls in the east and west directions. The next stage is the description of extra parameters, which are correlated with the operation of the building and play a significant role in its thermal behavior.
Table 4 includes the parameters associated with the internal loads and the infiltration/ventilation loads of the building. It is important to highlight that the specific loads are given per conditioned area, which covers a total of 2563 m
2. The mean operating factors were estimated according to the usual occupancy of the building. Specifically, the selected values for specific loads and mean operation factors have been adjusted properly so that the yearly electricity consumption of the total building matches the building electricity bill record. Moreover, the daily operating profile of the building follows the profile proposed in Ref. [
33], which has also been considered in a previous work with the INTEMA.building tool [
34]. The infiltration rate was selected at 0.4 air changes per hour (ACH), while the natural ventilation rate was at 0.4 ACH; these are typical values for a residential building. The temperature setpoint for the heating period is set to 20 °C.
2.2. The Examined Heat Pump Systems
In this work, the various examined heat pump heating systems aim to cover the heating needs of the building. Any given HP configuration presented in this paper is coupled with a fan coil system, producing hot air for heat generation. Different sources are examined for the heat pumps to determine the most effective one in terms of energy efficiency without disregarding cost-related aspects. The working fluid of the heat pumps is R1234ze, which is an environmentally friendly working medium without ozone depletion potential and with an extremely low global warming potential of around 6 [
35].
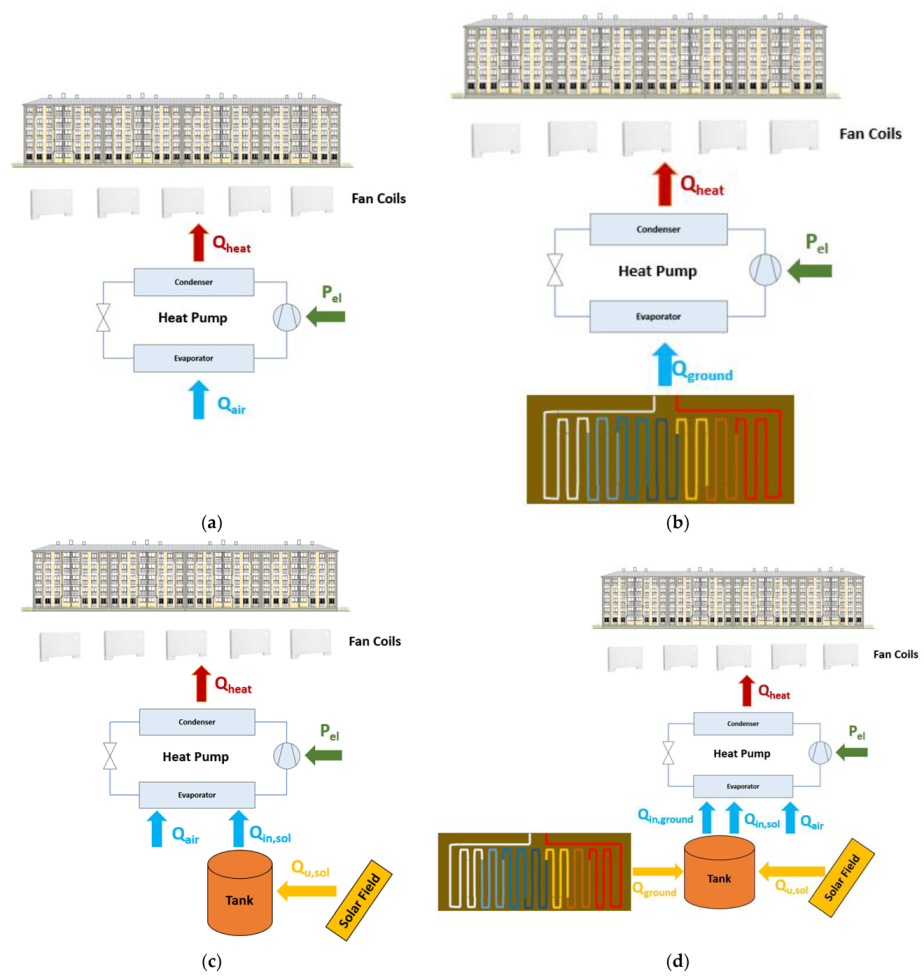
Four different heat pump configurations are studied in this work, presented comprehensively in
Figure 4. The first examined case is the use of an ASHP that exploits only the ambient source for feeding the evaporator of the HP with heat input. The second examined case is a GSHP, which exploits only the ground source for proving the heat input in the HP’s evaporator, while the third system is a dual-source heat pump that uses both air source and solar sources to feed the evaporator of the heat pump. In this last case, there is a thermal storage tank for properly managing the heat produced from the solar thermal collectors and then feeding the evaporator when there is adequate stored thermal energy. In cases without solar irradiation, the air is the only source feeding the heat pump, while the control system also includes cases with simultaneous feeding of the evaporator with both sources. Finally, the fourth system includes solar, ground, and air heat sinks for feeding the heat pump. Specifically, the solar thermal collectors and the ground source charge the tank with thermal energy, which can feed the evaporator with heat input. In this scenario, the air-source sink provides extra flexibility in the present configuration. This scenario practically tries to improve the dual-source HP by giving extra heat input by the geothermal field. Thus, the storage tank remained as the storage mechanism in this scenario as well.
For the SAHP configurations, selective flat plate collectors (FPC) of adequate efficiency have been selected for feeding the heat pumps. The decision to use this technology is driven by the need for hot water production in relatively low-temperature levels (approximately in the range of 20–30 °C), eliminating the need for more advanced solar technologies. The collecting area is separated in half (east/west), with an inclination of 18.5° in both cases following the roof’s slope.
A thermal tank is used in cases where solar thermal collectors are used for storing thermal energy. In the case of the triple-source HP, the tank stores energy from both solar collectors and the ground. The selected thermal tank is an insulated tank for reducing thermal losses on cold days. The proper operation control is applied to avoid freezing inside the storage tank and operating in very low temperatures, which leads to a reduction in the performance of the heat pump. For this reason, the tank’s contribution stops when its mean temperature is lower than 16 °C. This temperature level was adjusted after conducting a sensitivity analysis for a threshold that avoids significant water subcooling and also leads to satisfying system performance.
The geothermal field Is horizontal, with pipes buried in the ground. Note that the design of the horizontal ground heat exchanger (GHE) system is the most crucial factor affecting the overall GSHP thermal performance. The main design components/parameters are the piping system (i.e., dimensions, materials, configuration), working fluid, ground temperature profile, and installation depth. The pipe material should be corrosion-resistant and chemically stable, while piping system geometry (i.e., the length and diameter) is determined based on the coverage of the heating demand. In this work, polyethylene pipes are selected with a depth in the range of 1 to 3 m.
2.3. Mathematical Formulation
This part presents the core equations of the developed models (in regard to energy balances and efficiency definitions), which are essential for a proper explanation of the obtained results.
2.3.1. Energy Balances of Heat Pump Systems
The general energy balance in the HP indicates that the heat production of the HP (Q
heat) is the sum of the heat input by the ambient/geothermal/solar sources (Q
in) and of the compressor’s electricity demand (P
el):
In the case of the ASHP, the thermal input is provided only on the ambient heat sink:
In the case of the GSHP, the thermal input is provided only on the ground heat sink:
In the case of the dual-solar–air source HP, the thermal input is provided by the solar and ambient heat sinks:
In the case of the triple-source HP, the thermal input is provided by the solar, ground, and ambient heat sinks:
The coefficient of performance (COP) of the HP is the ratio of the produced heating load (Q
heat) to the electrical demand (P
el) [
36]:
The seasonal coefficient of performance (SCOP) of the HP is defined by using the total energy for heating (E
heat) to the total electrical energy demand (E
el) [
37]:
2.3.2. Thermodynamic Modeling of the Heat Pump Cycle
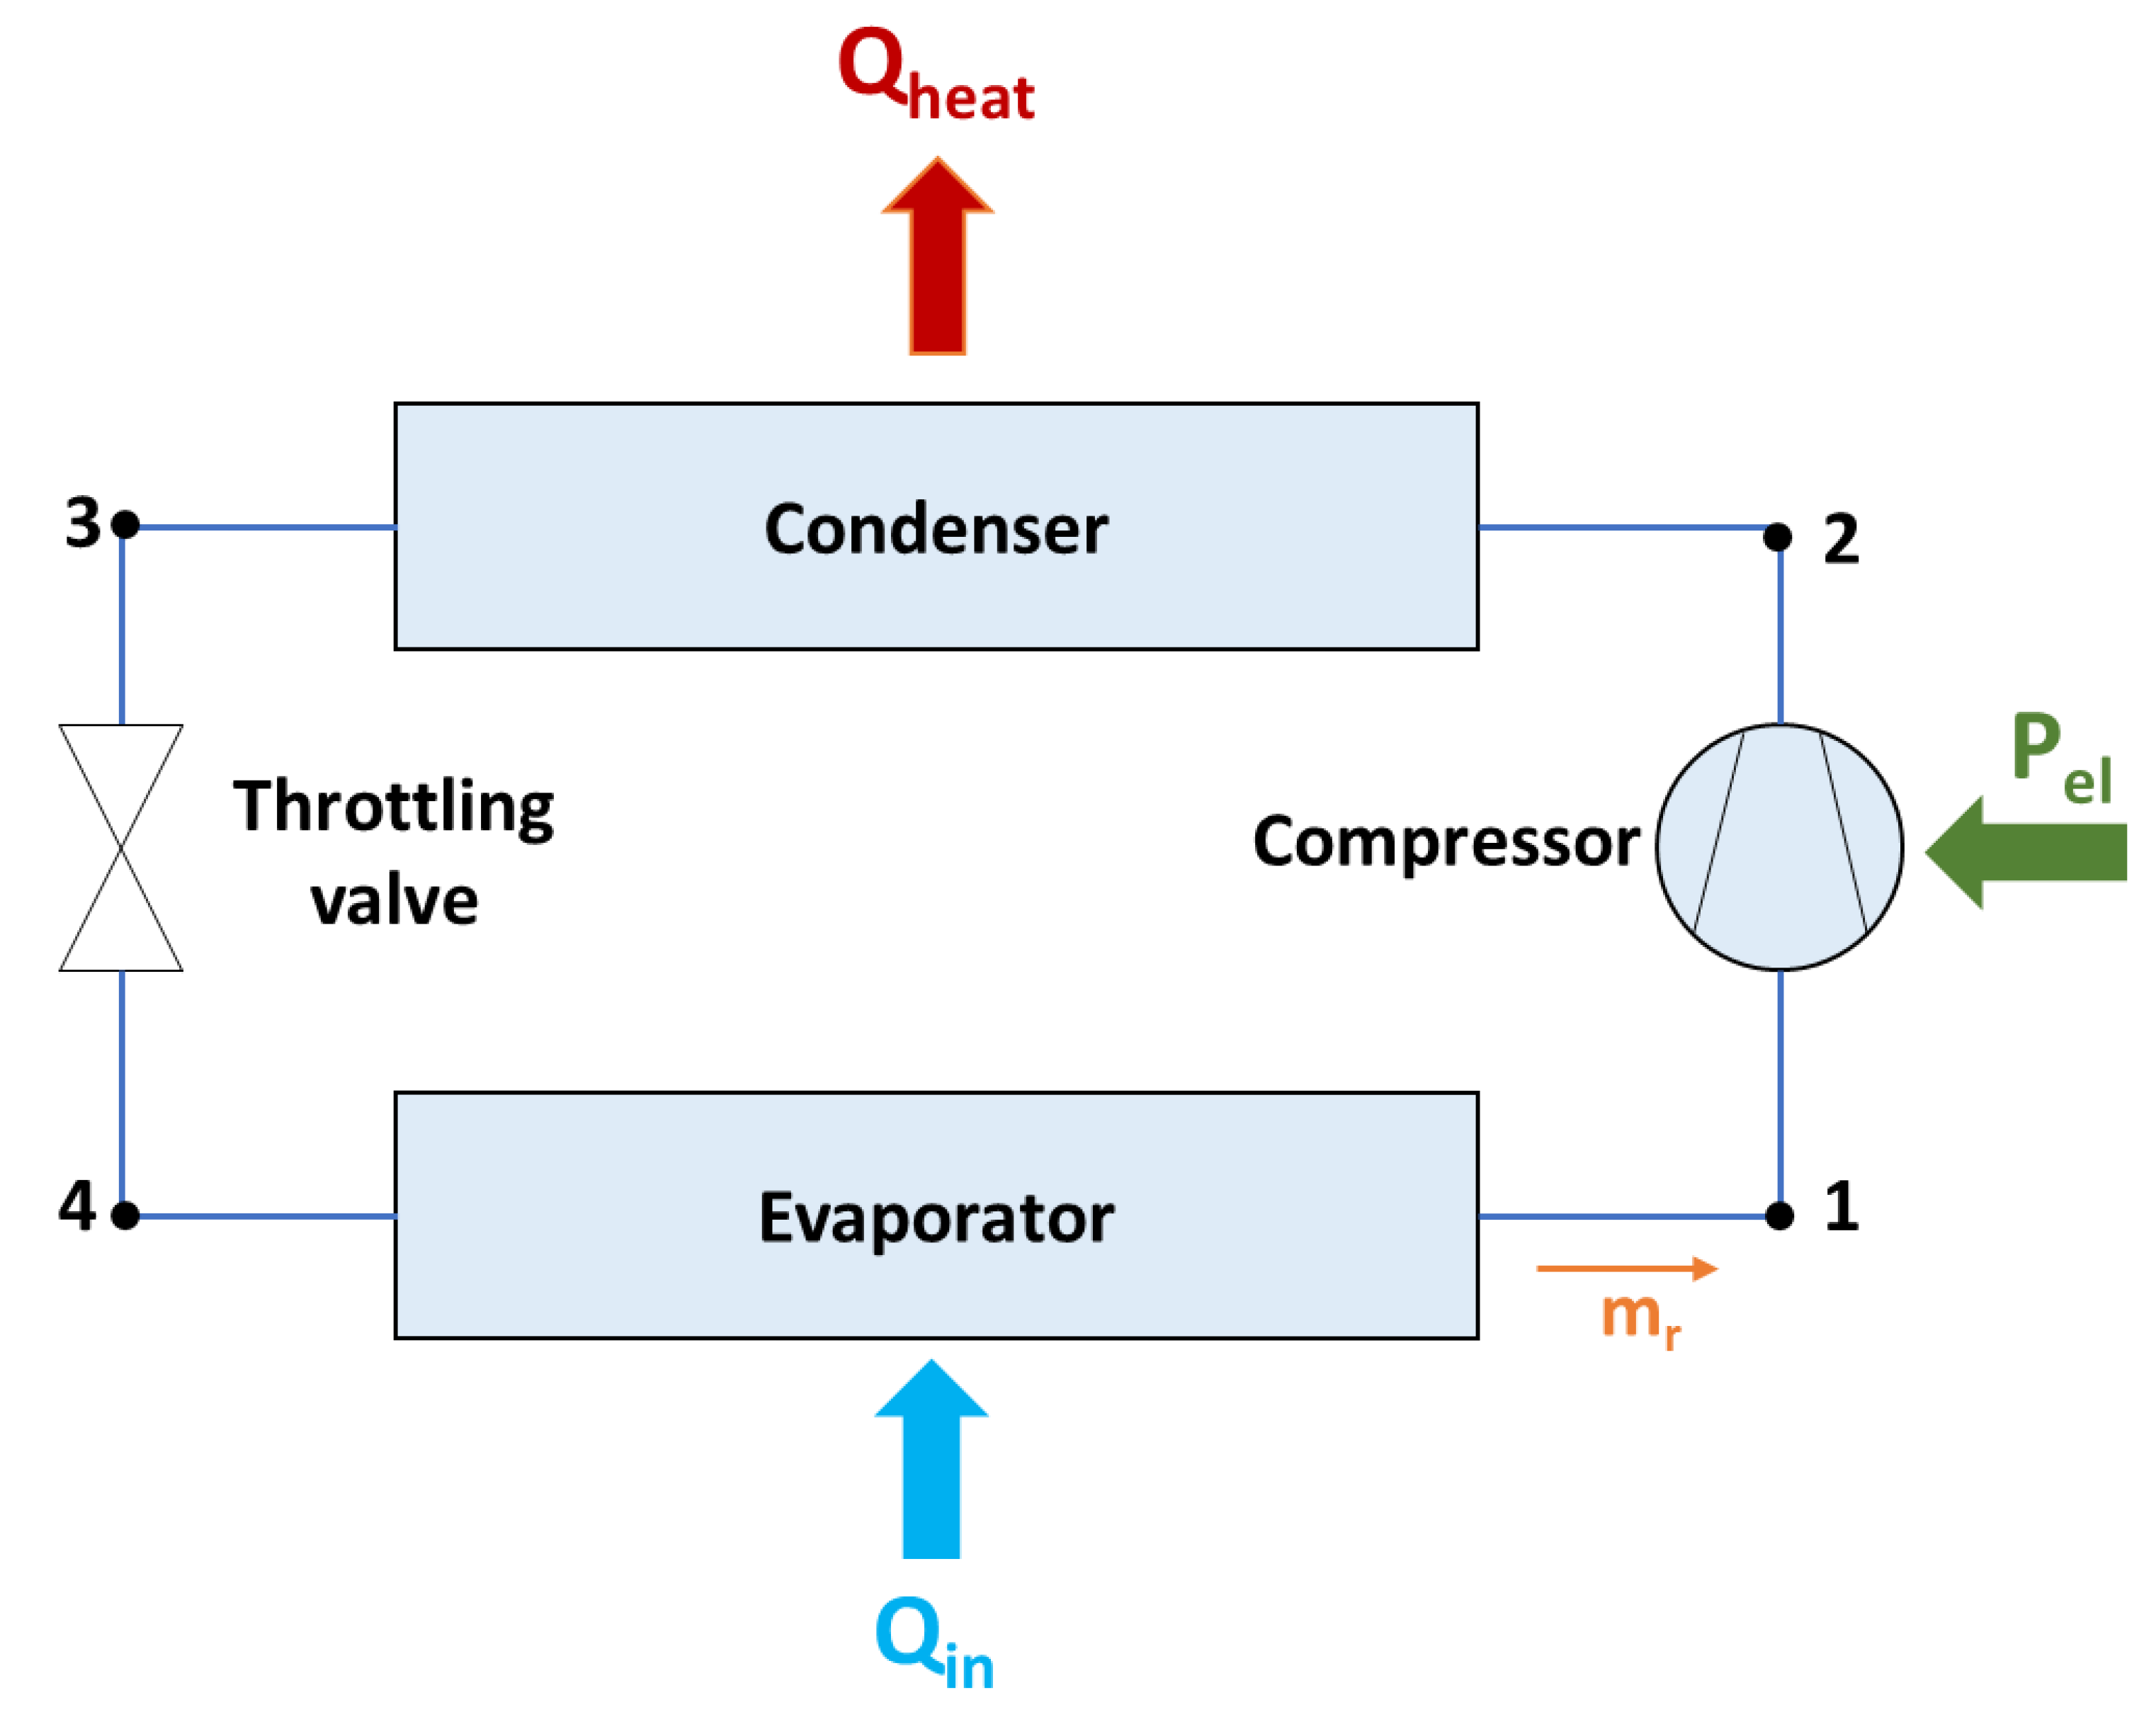
The thermodynamic cycle of the HP is schematically depicted in
Figure 5. The heat pump configuration includes an evaporator that receives heat inputs from the energy sources (ambient, solar, geothermal), a compressor, a condenser where the heat is given in the indoor space and a throttling valve. The present modeling of the HP cycle uses R1234ze, the thermodynamic properties of which have been taken by the library CoolProp/ExternalMedia [
38]. In the remaining, the main equations that are required for the simulation of the cycle are provided.
The thermal input in the system (Q
in) is given as [
36]:
The electricity consumption in the compressor (P
el) is given as [
36]:
The heat production to the building (Q
heat) is given as [
36]:
The compressor’s global isentropic efficiency (η
is) is given as [
36]:
where point “2,is” has the specific entropy of the state point 1 and it has the pressure of state point 2.
In this work, the compressor’s isentropic efficiency is approximated using a usual formula as that used as a function of the pressure ratio (π
c = P
high/P
low) as below [
39]:
It is assumed that there are no losses in the expansion of the throttling valve [
36]:
Moreover, the examined cycle has no superheating in the evaporator outlet and no subcooling in the condenser’s outlet. The coupling of the evaporator with the input heat sources is conducted by applying a temperature difference between the fluids at around 5 K which is a reasonable assumption [
40].
2.3.3. Solar Field
The thermal collector efficiency (η
th) is the ratio of the useful heat product (Q
u,sol) to the solar energy on the collectors’ aperture (Q
sol):
The thermal efficiency is calculated using the following formula, which corresponds to an advanced selective flat-plate collector [
32]:
where the mean operating fluid temperature (T
col,m) is calculated as the average value of the inlet and outlet temperature levels of the solar device.
The incident angle modifier of the solar collector (K) is a function of the incident angle (θ) on the collector surface, and it is estimated as below [
41]:
The aforementioned formula assumes that the (K) is 0.88 for an angle of θ = 50°, which is a typical assumption for an efficient FPC [
42].
The solar irradiation on the collector surface (G
T) multiplied with the solar collector area (A
col) yields the solar energy on the collectors’ aperture (Q
sol):
The useful thermal output (Q
u,sol) can be expressed as below:
The nominal specific mass flow rate of the solar collector (m
col/A
col) is chosen at 0.02 kg/sm
2 as it is usually selected according to the literature [
41]:
2.3.4. Storage Tank
The global expression for the energy balance in the thermal tank is described below by considering the useful heat input by the solar field (Q
u,sol) and the geothermal field (Q
ground), respectively, the thermal losses to the ambient (Q
loss), the heat input by the tank to the heat pump (Q
in), and the stored energy in the tank (Q
st).
The stored energy (Q
st) is given below [
43]:
Depending on the examined scenario, the (Q
ground) term is neglected for the dual-source case. The thermal losses of the tank are calculated by using the tank’s outer area (A
T) and the tank’s overall thermal loss coefficient (U
T) [
44]:
The present modeling separates the storage tank into different thermal zones and applies the energy balance and heat exchange among them.
2.3.5. Ground Geothermal Field
In this work, a horizontal piping geothermal loop is selected. This loop is modeled by using segments to achieve higher accuracy. Specifically, the respective model of the Buildings library [
45] is used, which has been developed by the Berkeley Lab [
46]. It considers the heat transfer between the buried tubes and the ground, with the aim of properly describing the phenomenon. The detailed physical model of the examined component can be found in the study of Kusuda [
47].
For tube “i” of the field, the heat transfer is described by the following matrix equation taking into consideration the impact of all the tubes.
and
where the length of the pipe (L), the ground thermal conductivity (k
ground), the geometric factor (P), the heat transfer rate (Q), the external mean temperature of the tube (T) and the ground temperature (T
ground) are used. Moreover, the geometric factor (P) depends on the following parameters: horizontal position of the pipe (a
i), depth of the piping (d
i) and outer radius of the pipe (r
i).
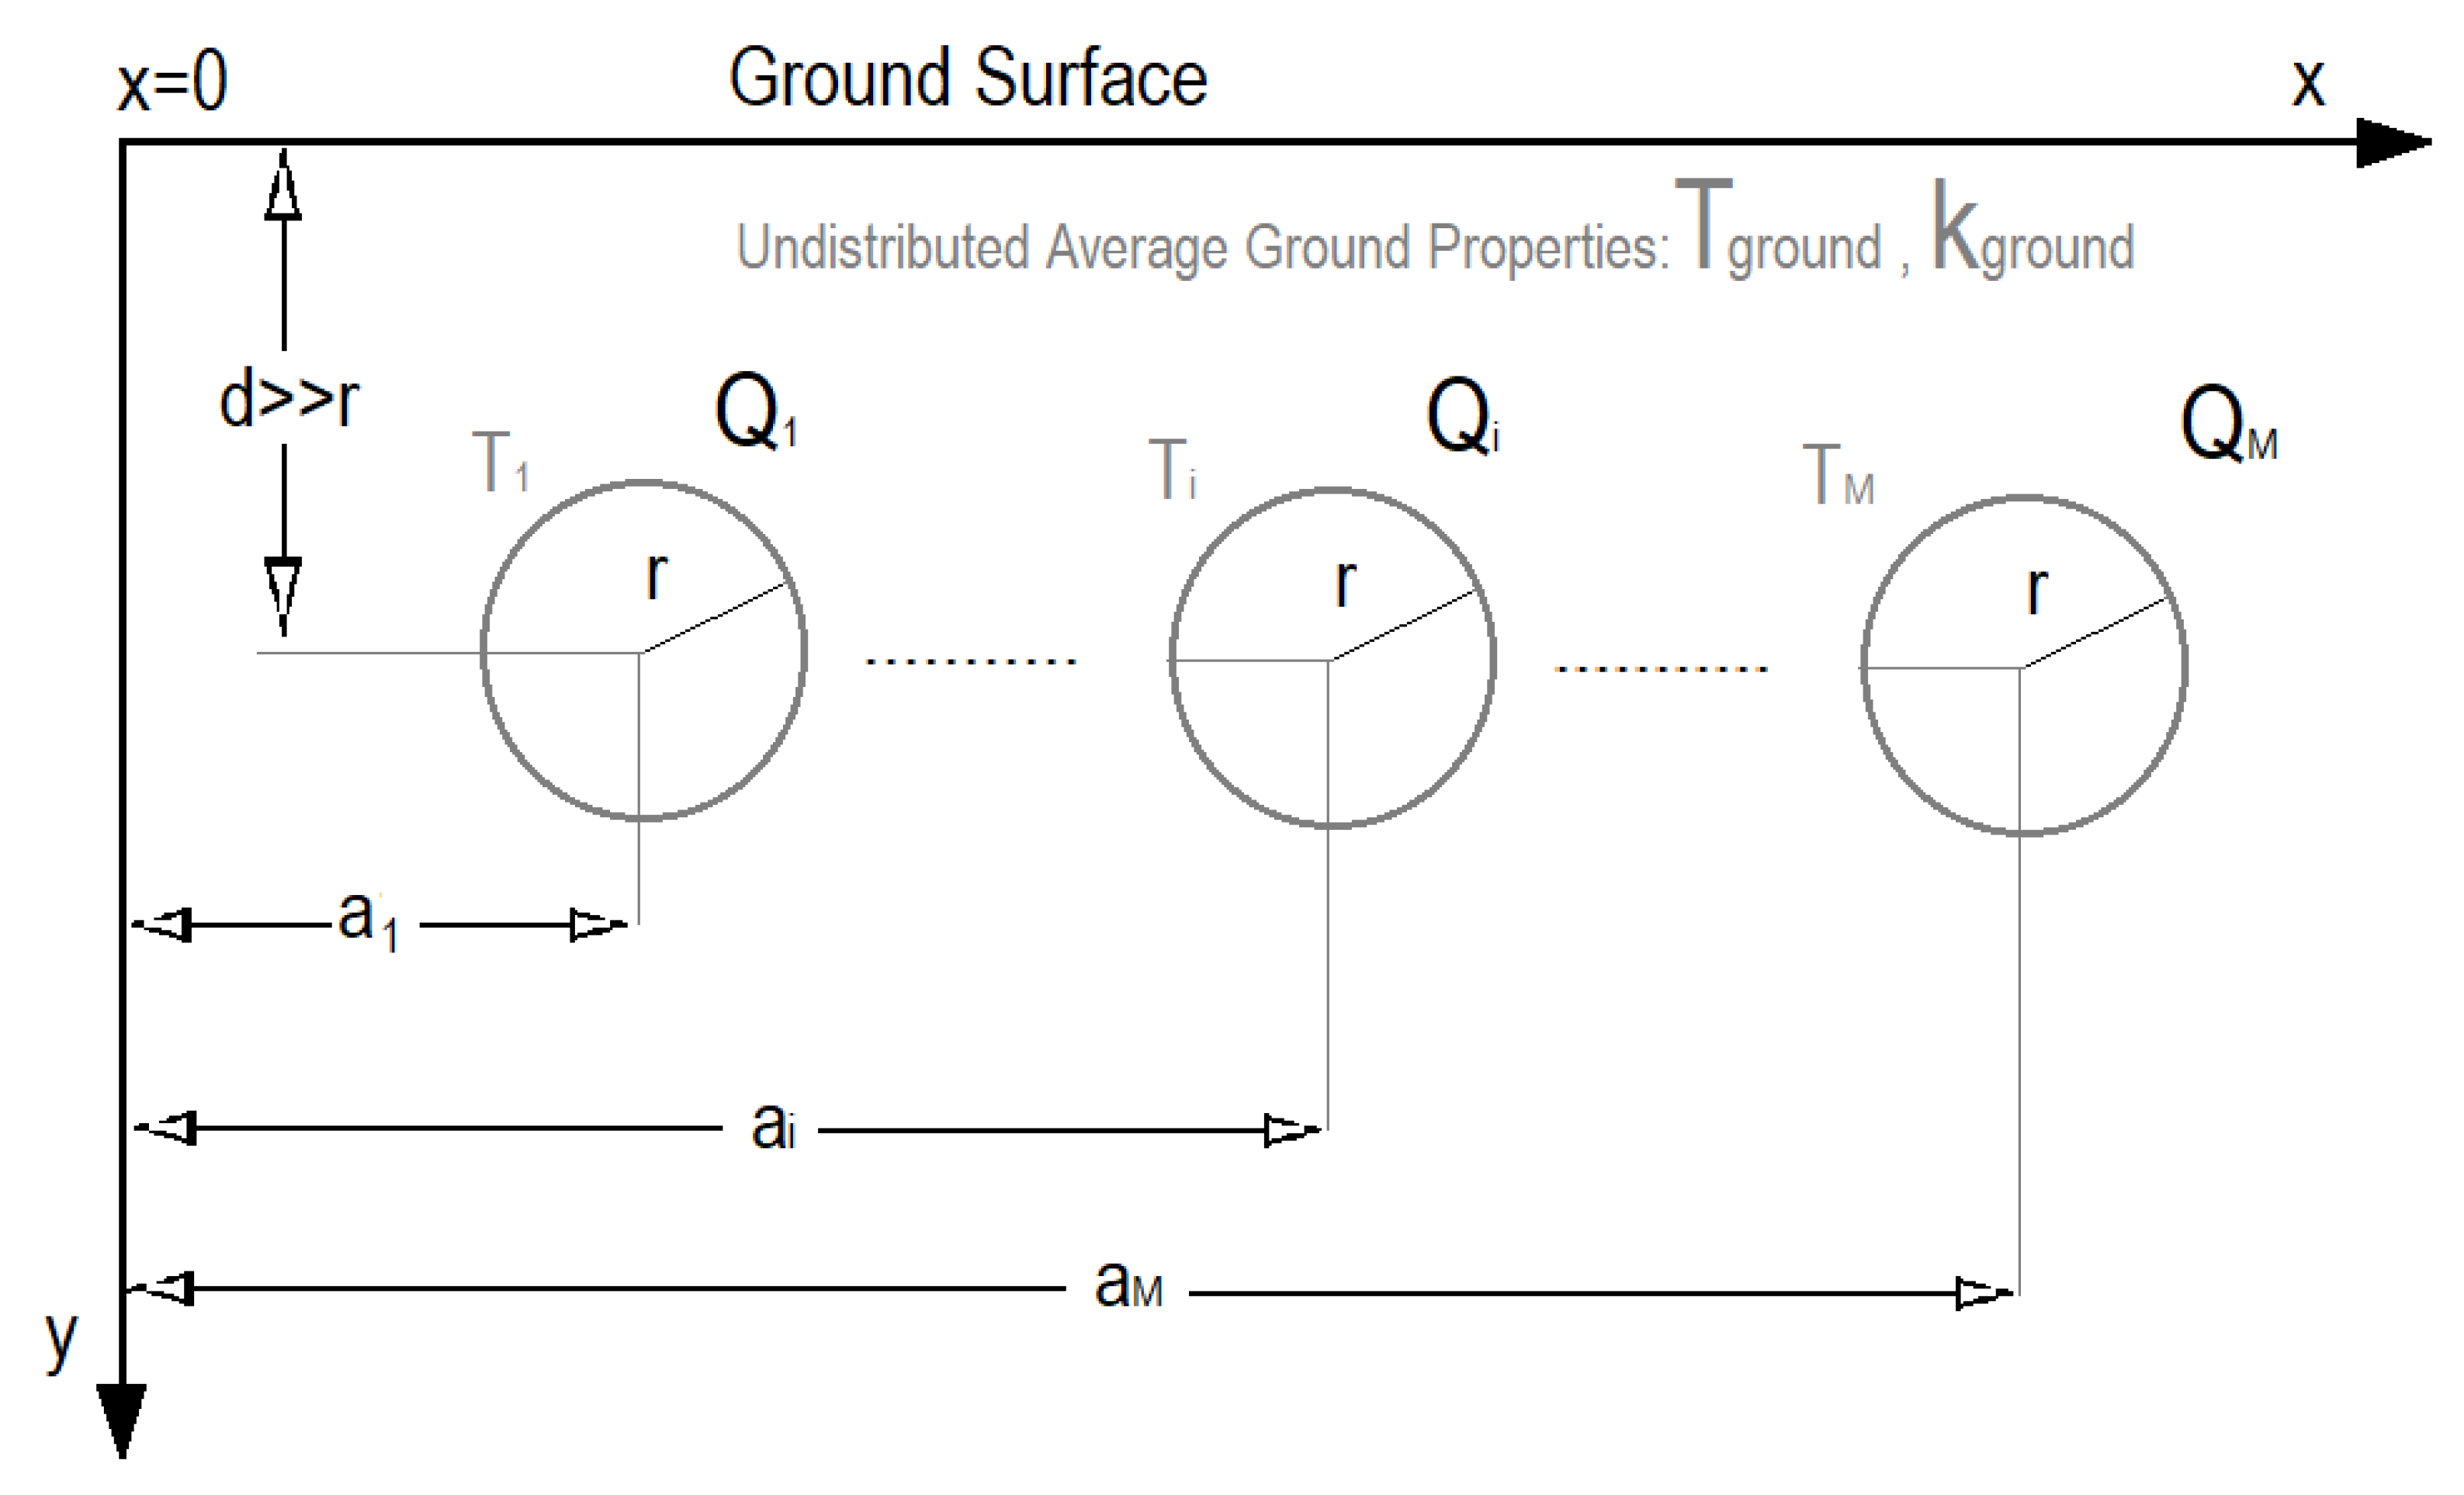
Figure 6 shows a vertical cross-section of the piping system in the horizontal geothermal field. A valuable note is that the presented methodology is valid for pipe radius significantly lower than the depth (d >> r). Considering that the linear loop pipe system is buried up to 3 m below the ground, the temperature of the working medium inside the HP and the pipe loop is affected significantly by the distribution of the ground temperature. The respective distribution of the ground temperature is given as a function of the depth and the time period, based on Labs’s theory [
48]:
where (T
m) is the mean annual surface temperature in [°C], (z) the depth of the buried pipes in [m], (a
d) the thermal diffusion coefficient of the ground expressed in [m
2 per day], (T
amp) the surface temperature amplitude in [°C], (t) is the number of the day (1 to 365) and the (t
0) is the day the minimum year ground temperature. In the present work, the (T
m) is 15.5 °C, the (T
amp) is 8 °C and the (t
0) is at 5, according to Ref. [
49], while the thermal diffusion coefficient was selected at 0.094 m
2/day which is a reasonable value [
50].
Additionally,
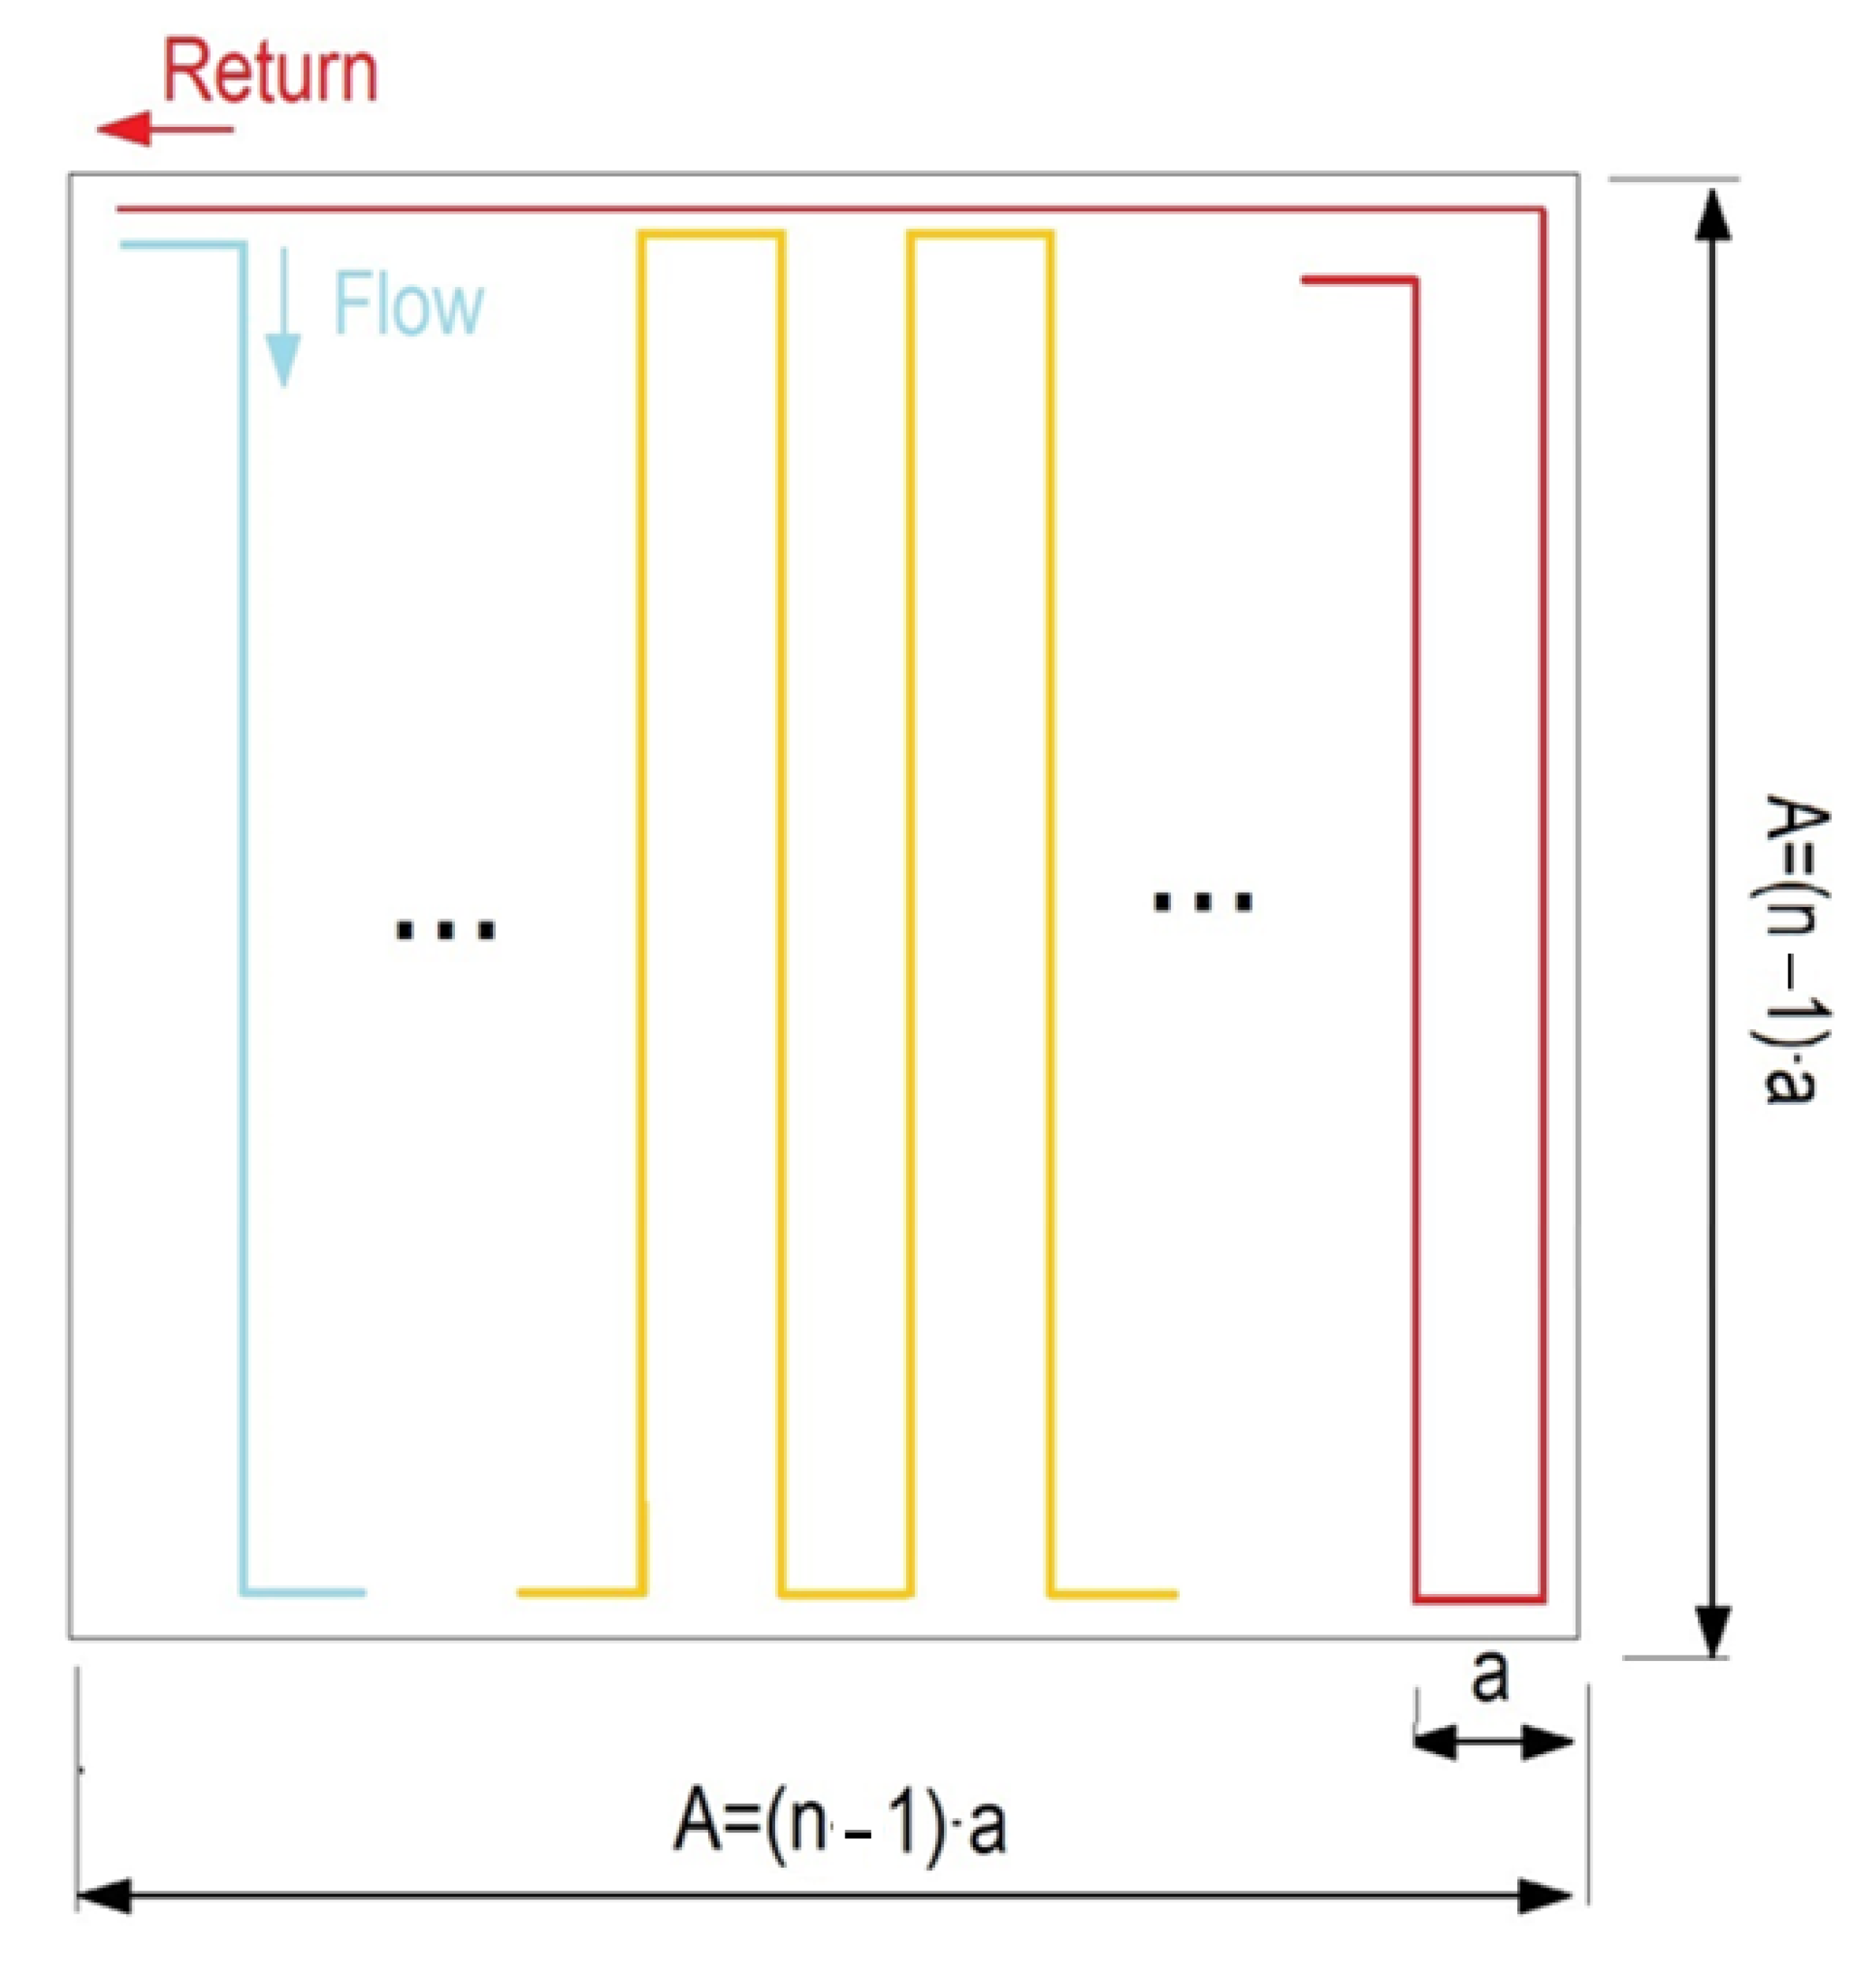
Figure 7 shows the design principle of the geothermal horizontal field, which is assumed to be a square field with a side (A) and with a distance between the tubes of (a = 0.5 m). The total GHE has a length (L), which is connected with the number of tubes (n) with the next expression:
2.3.6. Fan Coil Modeling
The energy balance in the water stream (subscript “w” symbolizes water stream) is formally described by:
while the corresponding energy balance in the air stream (subscript “a” symbolizes air stream) is given by:
The heat transfer between the two streams is modeled by using the logarithmic mean temperature difference (ΔΤ
lm) as below [
51]:
The total heat transfer coefficient (UA)FC in [W/K] is the product of the thermal transmittance (U) in [W/m2K] and of the heat exchanging area (A) in [m2]. This is a characteristic parameter of the fan coil unit.
The logarithmic mean temperature difference (ΔΤ
lm) is defined below:
The fan coil is properly designed to operate with hot water (T
w,in = 45 °C) [
52]. For this reason, the condenser temperature of the HP was selected to be 50 °C to have an approach temperature of about 5 K to achieve proper heat transfer [
53].
2.3.7. Net Present Cost
The economic analysis is conducted via the use of the net present cost (NPC) parameter, which is an index for evaluating the economic performance of the unit for its lifetime. This index takes into consideration both the initial investment cost and the operating cost of the system during its lifetime in order to provide the needed heating demand. The cost of the heat pump is not taken into account because it is assumed to be the same in all the examined cases.
The net present cost of the geothermal field case (NPC)
ground can be calculated by using the pipe length (L) and the excavated soil volume of the trench (V
tr). In this work, the distance between the pipes is selected to be 0.5 m, and the field was assumed to be a square one. More specifically:
The specific cost for the piping was chosen to be (k
pipe = 0.5 EUR /m) [
54], and the specific cost for the excavated soil volume of the trench was selected at (k
trench = 20 EUR /m
3) [
55].
The net present cost of the solar thermal system (NPC)
sol is found by using the investment cost of the solar field, storage tank and the variable cost for the electricity consumption. More specifically:
The specific cost for the solar thermal collectors was taken at (k
col = 130 EUR /m
2) [
56] and the specific cost of the storage tank at (k
tank = 500 EUR /m
3) [
57].
The net present cost of the triple-source HP with the solar system and geothermal field (NPC)
triple can be calculated as:
For the ASHP, only the operating cost for covering the space-heating demand was considered, while no initial investment costs were taken into account. Additionally, in the economic analysis, the electricity cost was considered to be (k
el = 0.25 EUR /kWh
el) [
34]. The lifetime project is chosen to be (N = 25 years) [
40] and the discount factor was (r
0 = 2%) [
58].
2.4. Simulation Input Data
For the cases of the dual-source HP and the triple-source HP, a control strategy is implemented for the simultaneous contribution of air and water in the heat input at the evaporator of the HP.
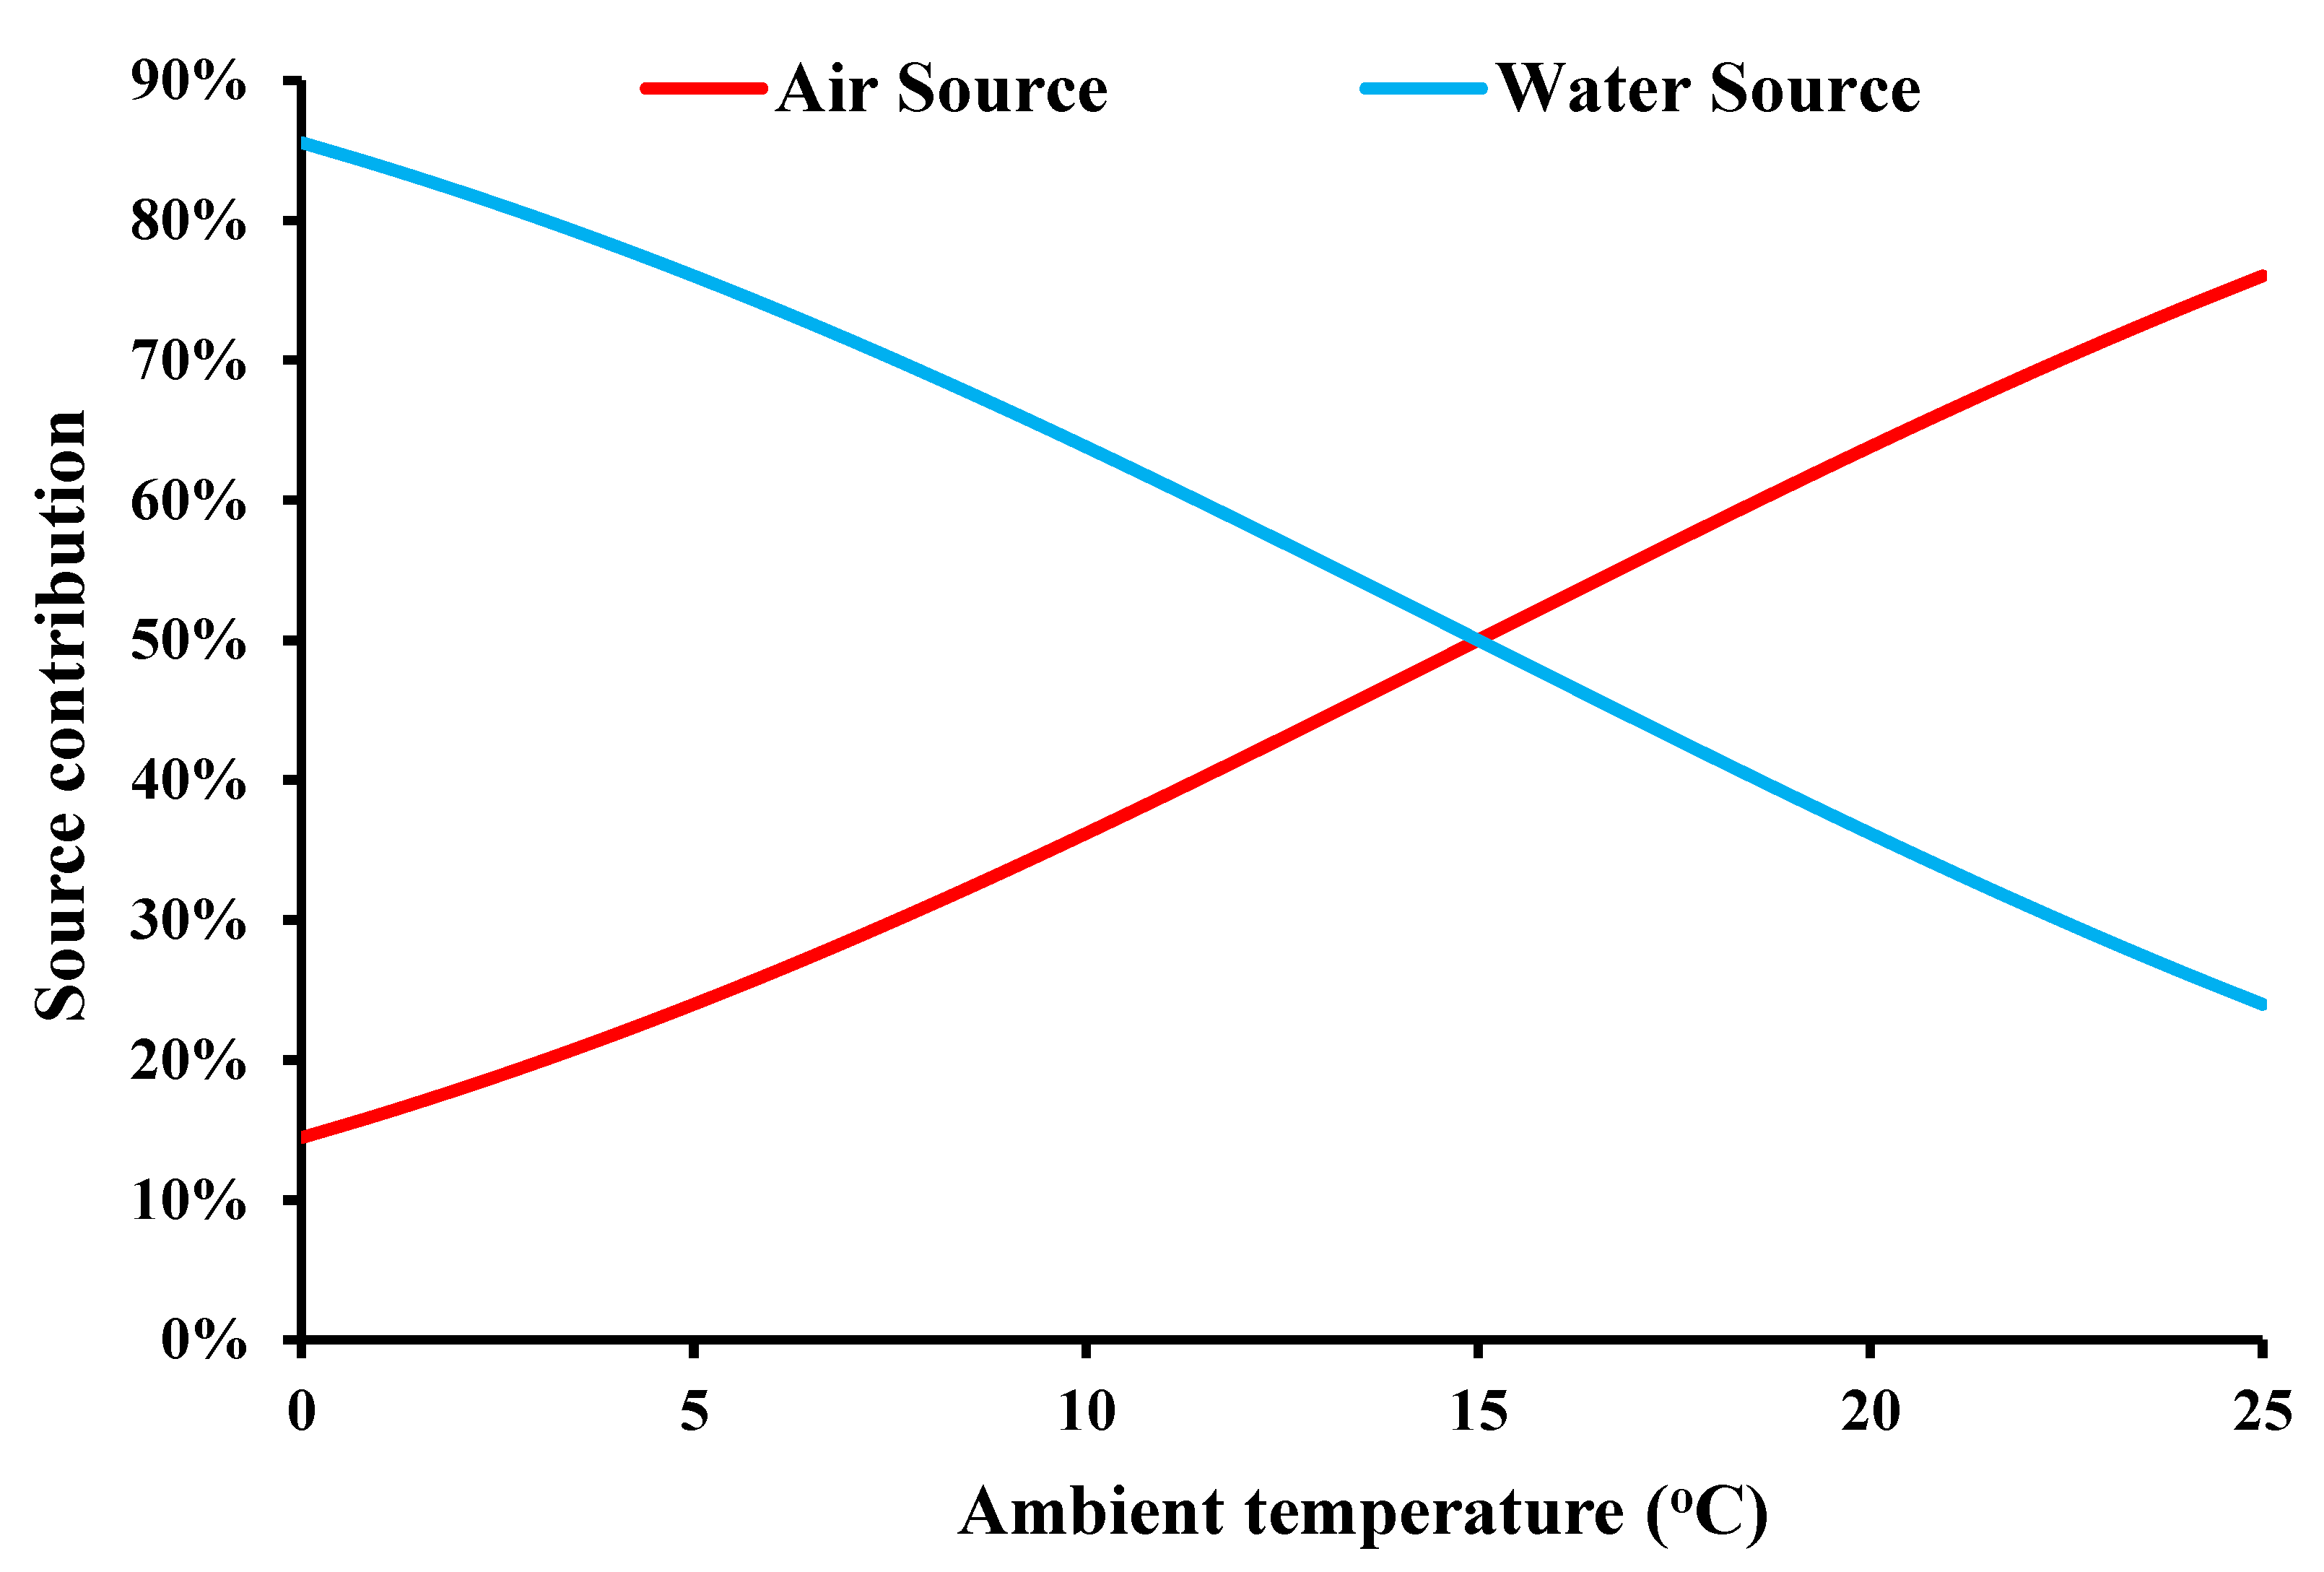
Figure 8 illustrates the contribution of the water and air source for different ambient temperatures. Practically, this control strategy aims to reduce the air source contribution when there are lower ambient temperatures than around 15 °C for increasing the COP. An extra control strategy of this work is based on the exploitation of the water tank heat sink only when it has a mean temperature over 16 °C, a strategy that is followed for safety reasons (e.g., avoid frosting on very cold days without solar potential).
In the present work, the library ExternalMedia [
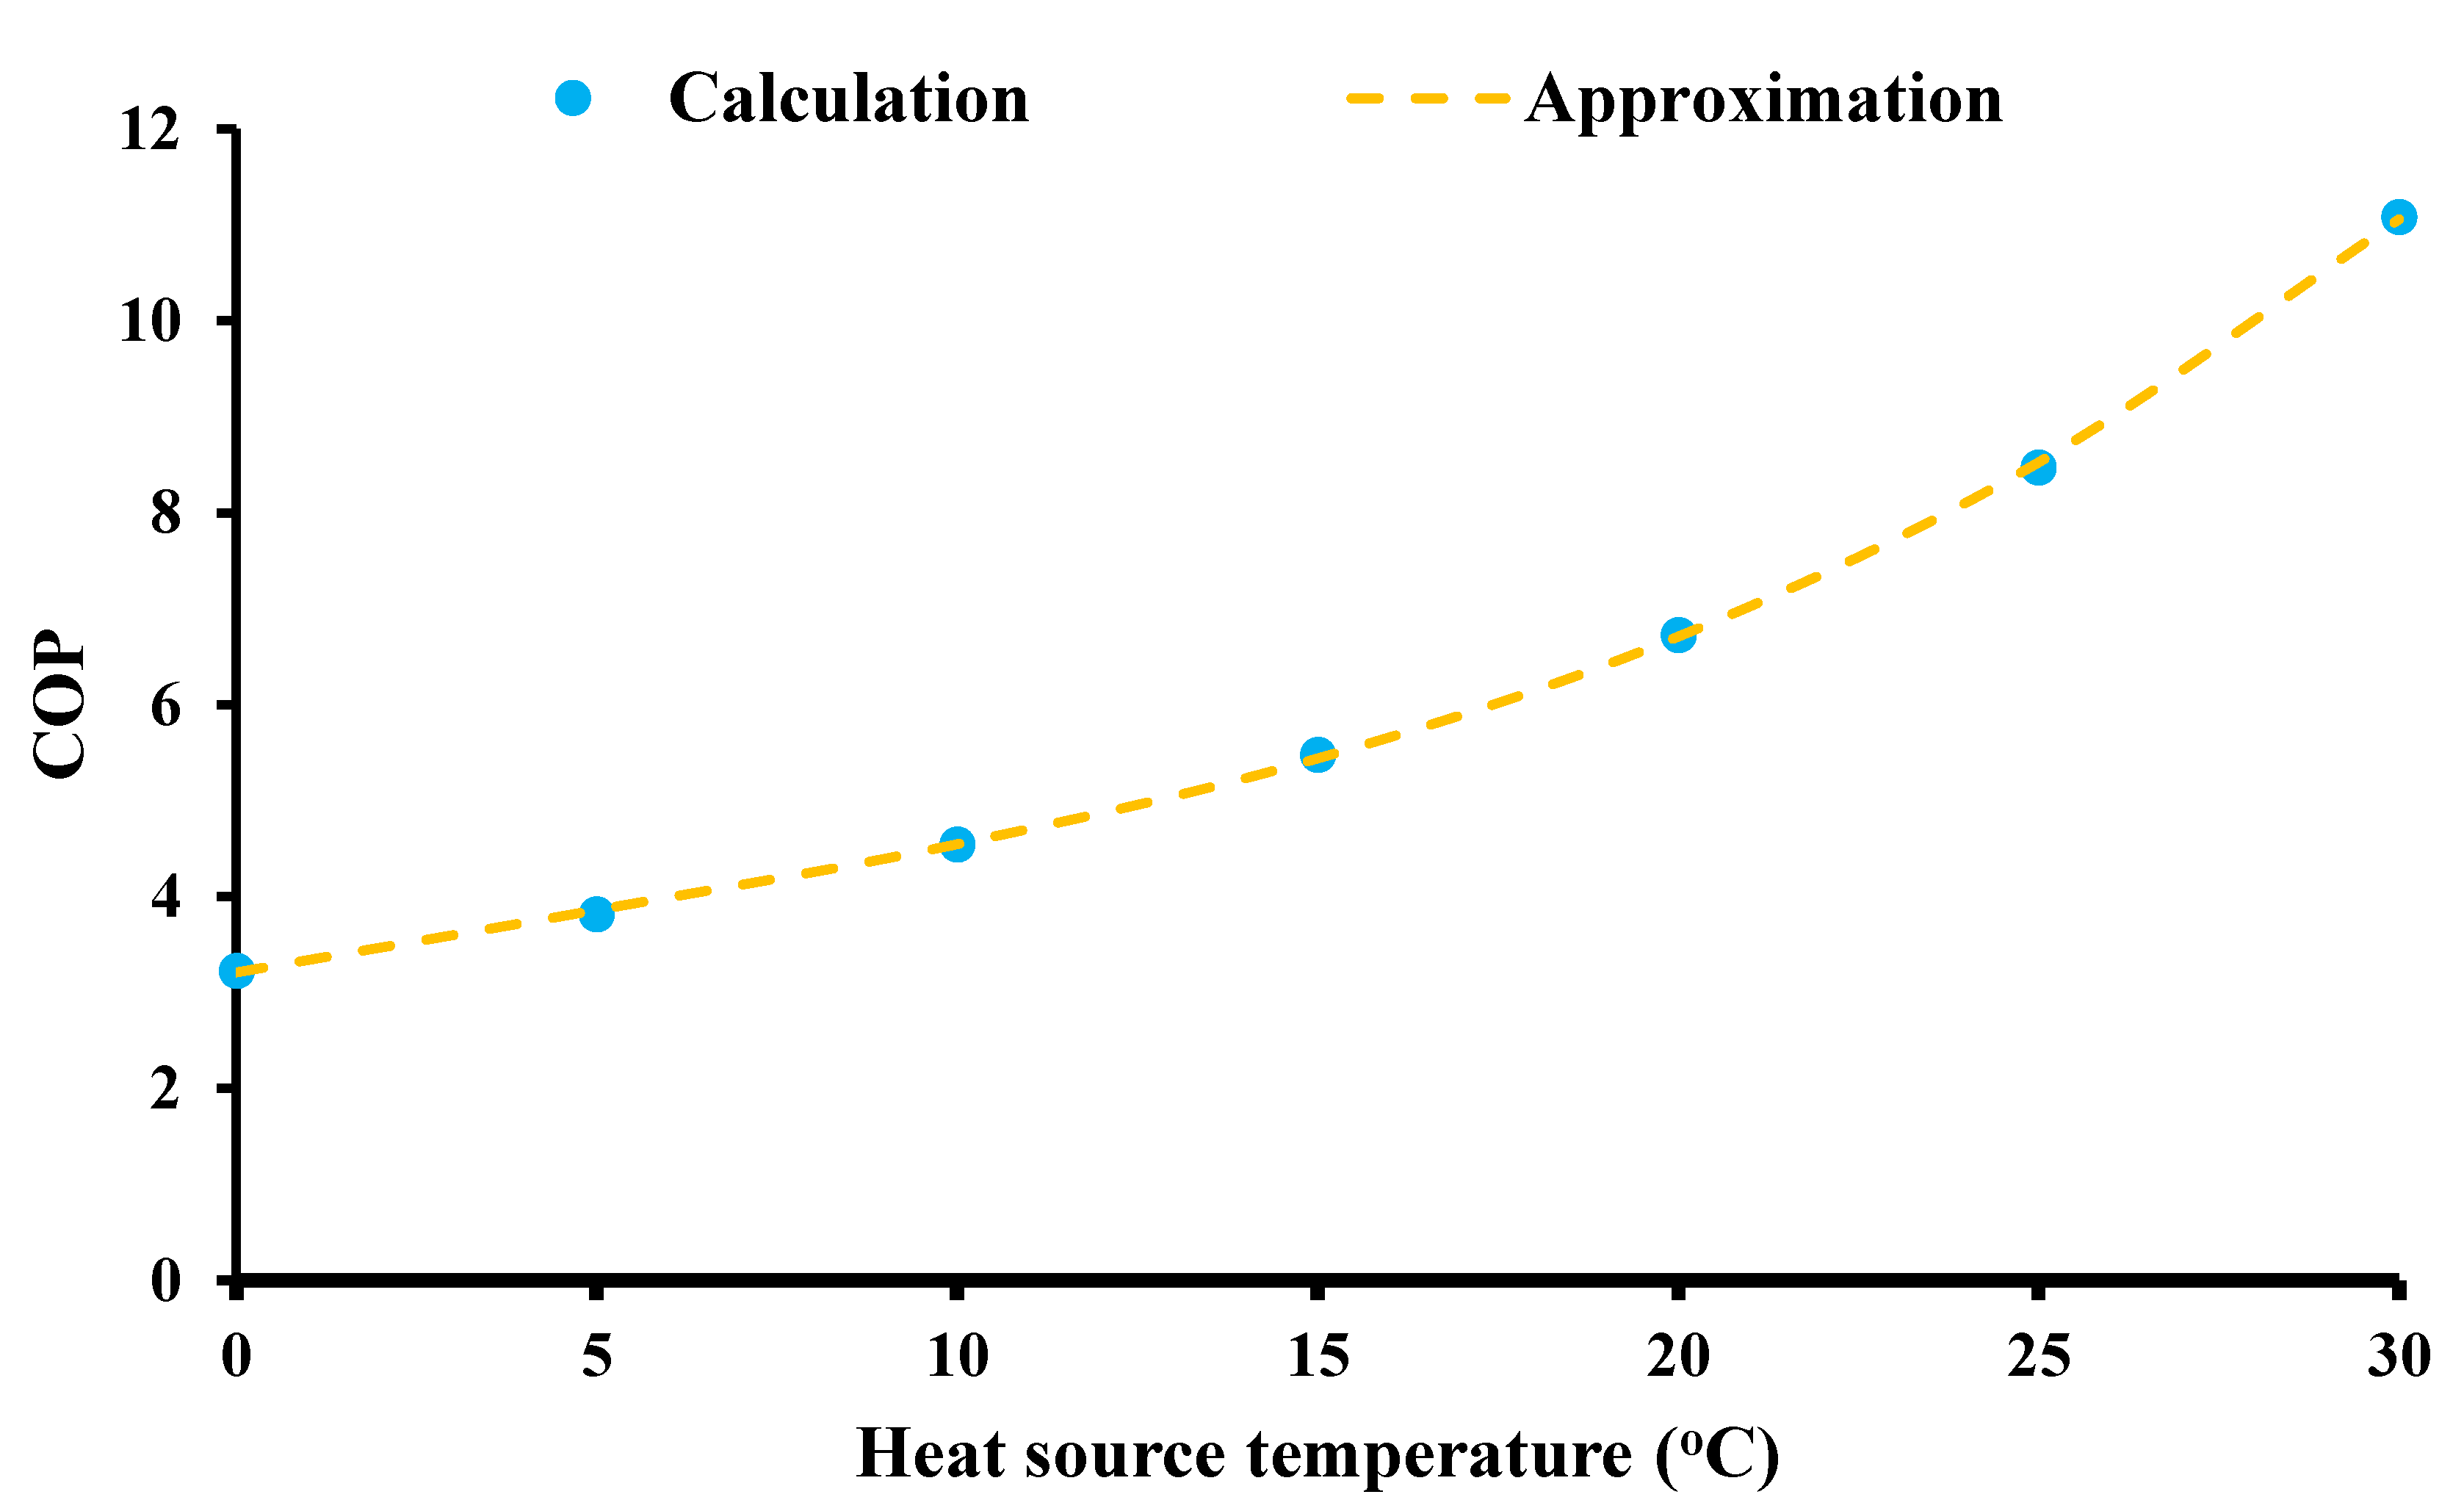
38] was used for the thermodynamic properties of the working fluid and the system performance for different operating cases. The thermodynamic HP model was developed for seven heat source temperatures individually, as depicted in
Figure 9. The COP was approximated for different heat source input temperatures, aiming to decrease the computational time of the simulations. Then, a regression formula of high accuracy was used as input in the heat pump models. This strategy leads to accurate calculations with extremely high accuracy.
Figure 9 depicts the calculated and approximated data for the COP for different heat source temperature levels in the HP. For this analysis, the condenser temperature was selected at 50 °C in order to have a suitable operation in terms of the fan coil (hot water inlet temperature at 45 °C). The following formula is a polynomial approximation of the COP for different heat source temperature parameters (T
hs):
The fitted equation presents an R
2 of 99.9%, and so this expression is an accurate one, as it is also obvious in
Figure 9.
Table 5 summarizes the main input data of the present work, as well as the range of the variables in the present analysis. At this point, it is useful to state that the INTEMA.building tool has been validated, and the validation evidence for the building loads and the energy systems can be found in previously published works [
34,
59,
60].
2.5. Simulation Strategy
This study was realized with the simulation tool INTEMA.building, i.e., a program that conducts dynamic simulations of energy systems and buildings. INTEMA.building is based on the Modelica programming language [
28], and it uses Dymola solver [
29]. This tool has also been used in previous recent studies in the domain of energy simulations [
34,
59,
60]. Moreover, INTEMA.building presents some important advantages, which makes it a flexible and accurate tool. Specifically, it uses adjustable and variable time steps to properly simulate the abrupt phenomena of the simulation (e.g., opening/closing of a valve). Moreover, it uses detailed components that are based on previous subcomponents, thereby offering great flexibility and the increased level of detail in the used models. Another advantage of this tool is the possibility to develop detailed control systems for controlling suitably the energy systems, a functionality that makes the optimization of total configurations possible. Practically, INTEMA.building can simulate any possible energy system coupled to a building with a great level of detail and high accuracy. In the present work, except for the in-house developed components, additional models have been used from other libraries, namely the Buildings [
61], BuildingSystems [
62], and ExternalMedia [
38] libraries.
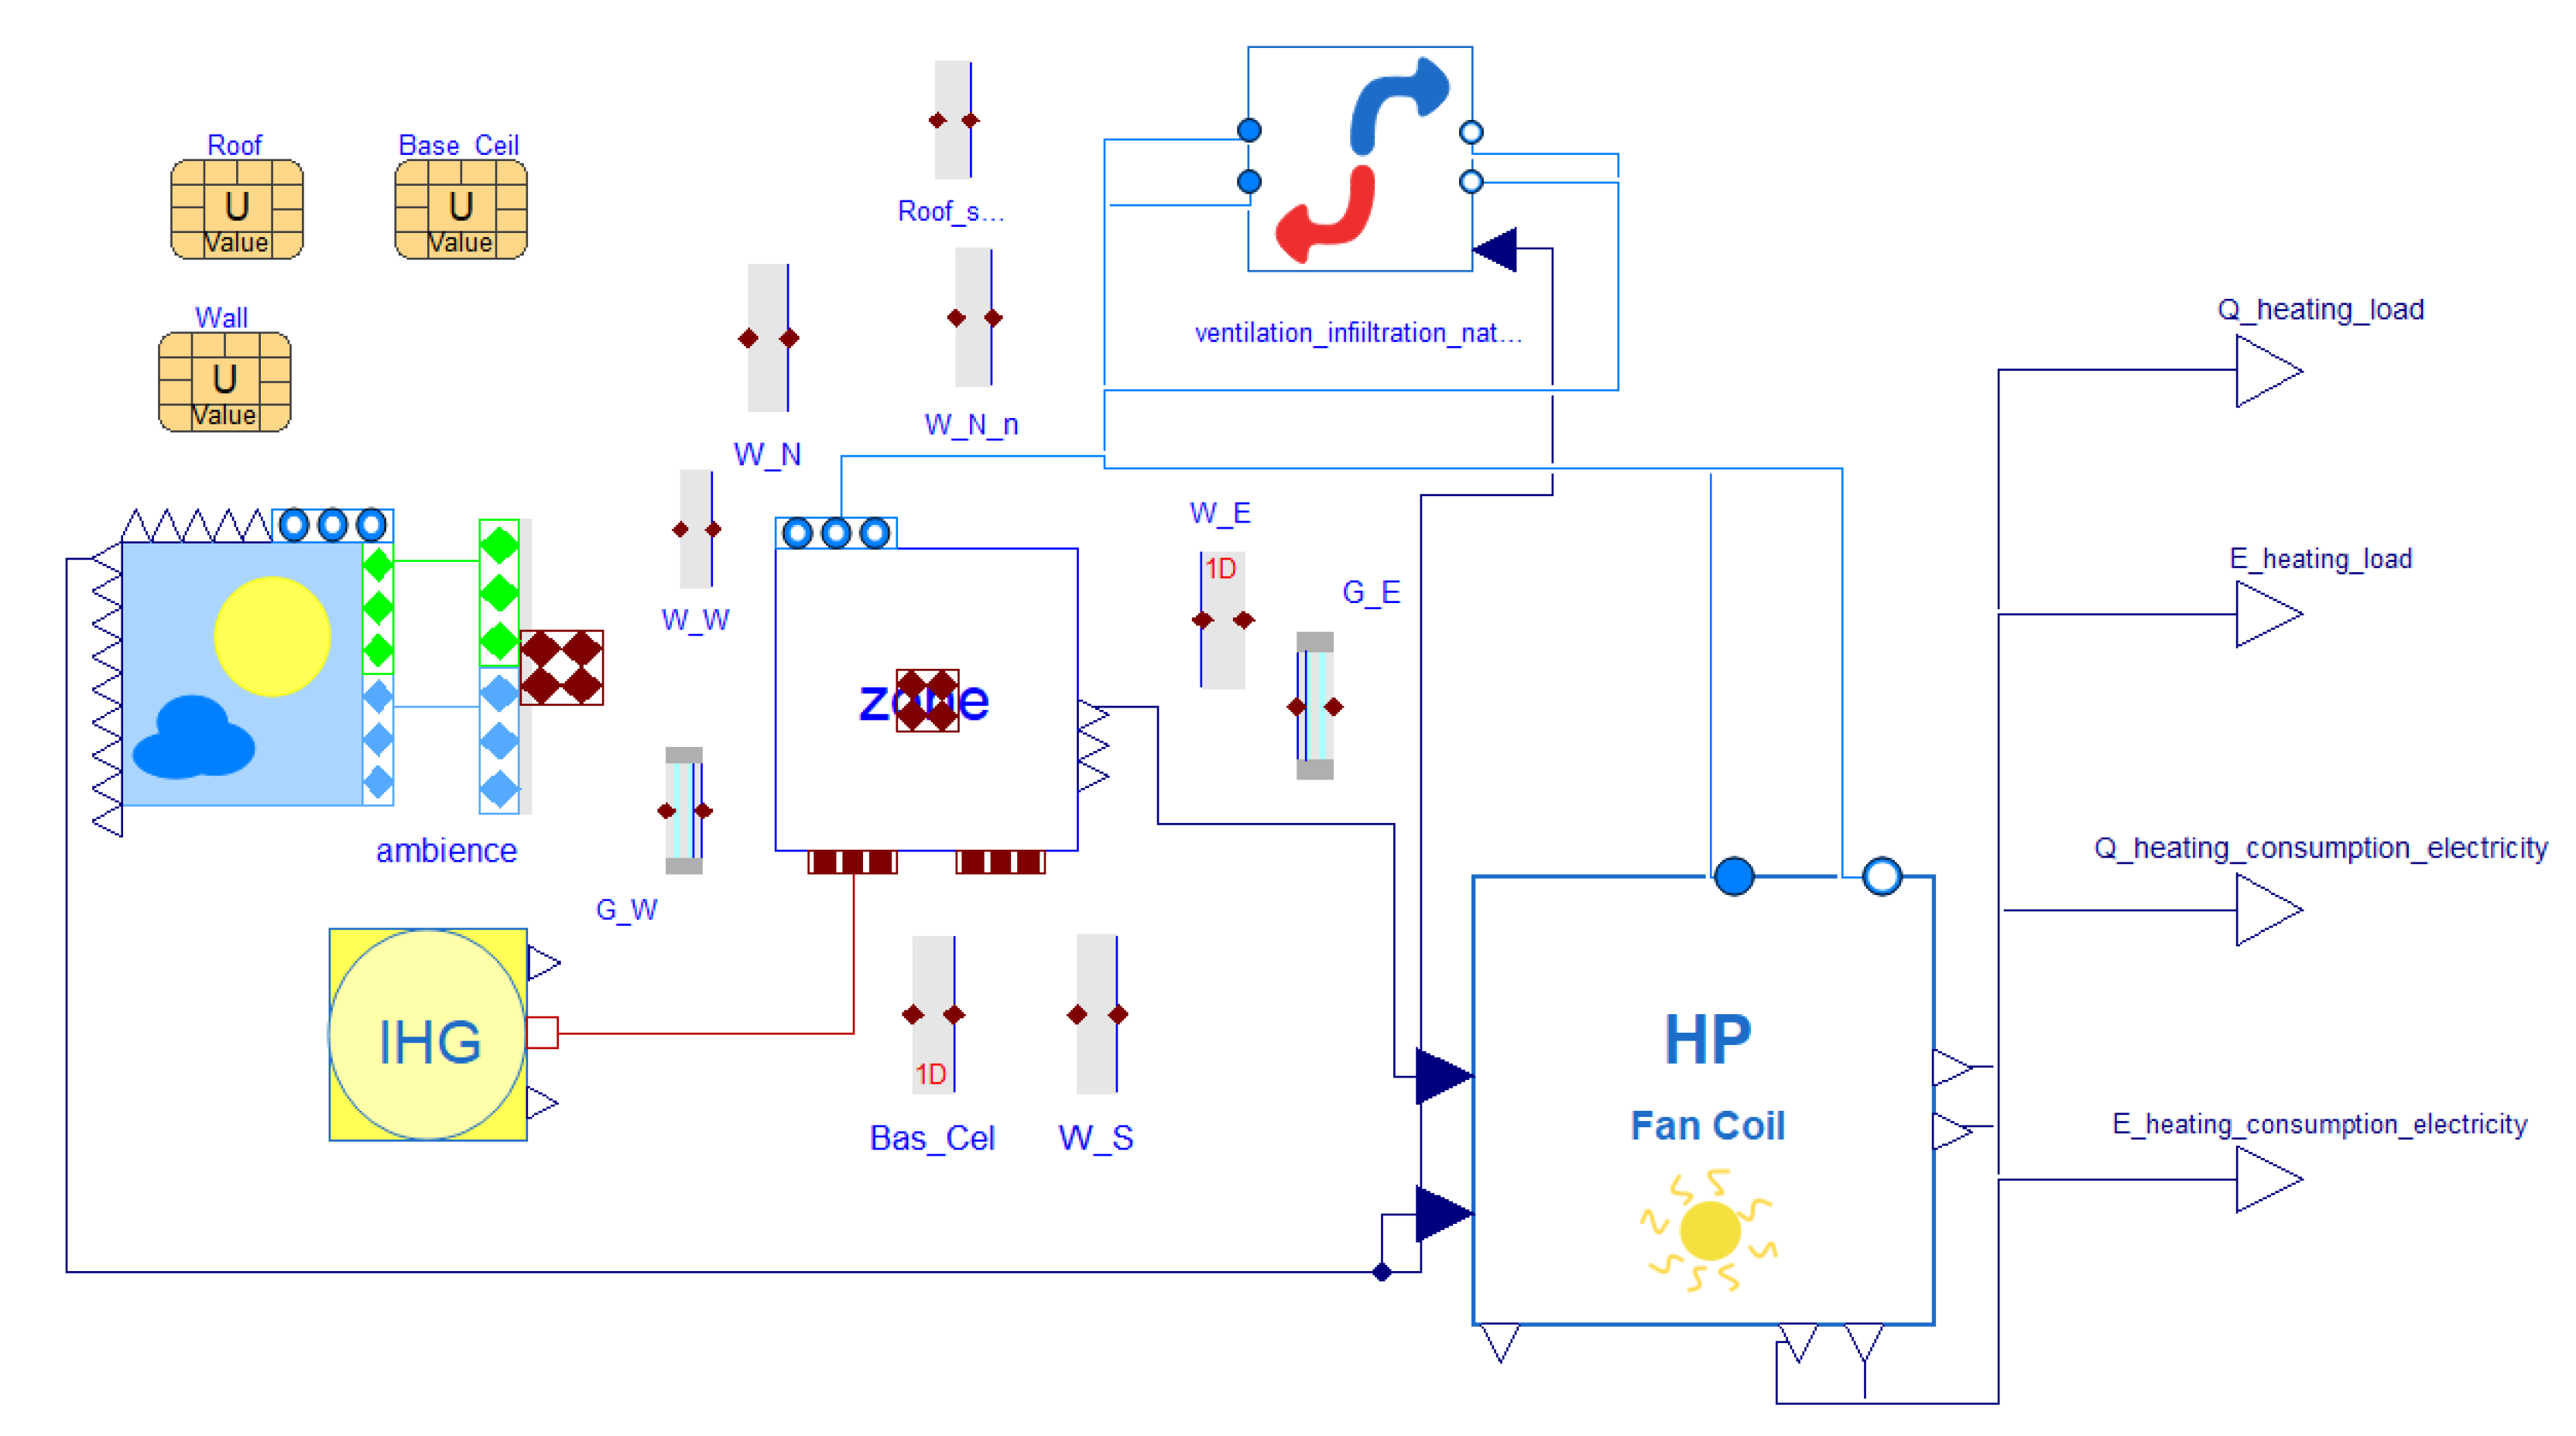
The developed models include numerous components to accurately simulate the building and the active energy systems. The building is examined by using the proper components for the external structural components (i.e., walls, windows, roof, ground slab). Furthermore, the respective internal gains for occupants, lighting and appliances are considered. Infiltration and natural ventilation rates are also taken into account in the present study. The heat pump is connected to a model of fan coils, which provides hot air in the building. The heating system is controlled with a PID controller, which adjusts the mass flow rates to achieve the desired indoor conditions.
Figure 10 shows a typical image of an air-source heat pump system from the simulation tool where different components are used.
The first step in the simulation is the examination of the air source HP, which can be considered to be the benchmark scenario as it does not exploit any thermal renewable energy source (solar and/or geothermal), it depends solely on electricity for driving the HP, and it is the most commonly used among the examined ones. The next step concerns the parametric investigation of the other HP systems. Moreover, the NPC of solar and ground-driven technologies is calculated to determine the optimal scenario by applying both energy and economic criteria. The last part concerns the final energy comparison among the various optimal cases for estimating electricity savings via the incorporation of renewable energies in the system.
In the multi-objective optimization of the studied cases in the parametric analysis of every HP case, two criteria are used: the yearly electricity demand of the HP and the NPC. Both criteria have to be minimized, and thus, the proper dimensionless geometric criterion is used as below:
where the subscripts (max) and (min) indicate the global maximum and minimum values, respectively, among the pool of the examined design cases. The goal is to minimize the function (F) in every case. Practically, this criterion calculates the distance from the ideal design point (which has the global minimum values of the criteria parameters). The design case that presents the minimum dimensionless geometric distance from the ideal point is selected as the optimum one.
3. Results and Discussion
The present section presents the simulation results of the four examined heat pump heating systems as well as a comparative investigation of these cases.
3.1. Case 1: Air-Source Heat Pump
The first case is the ASHP, in which only the ambient source is exploited to feed the evaporator of the heat pump with the necessary driving heat input.
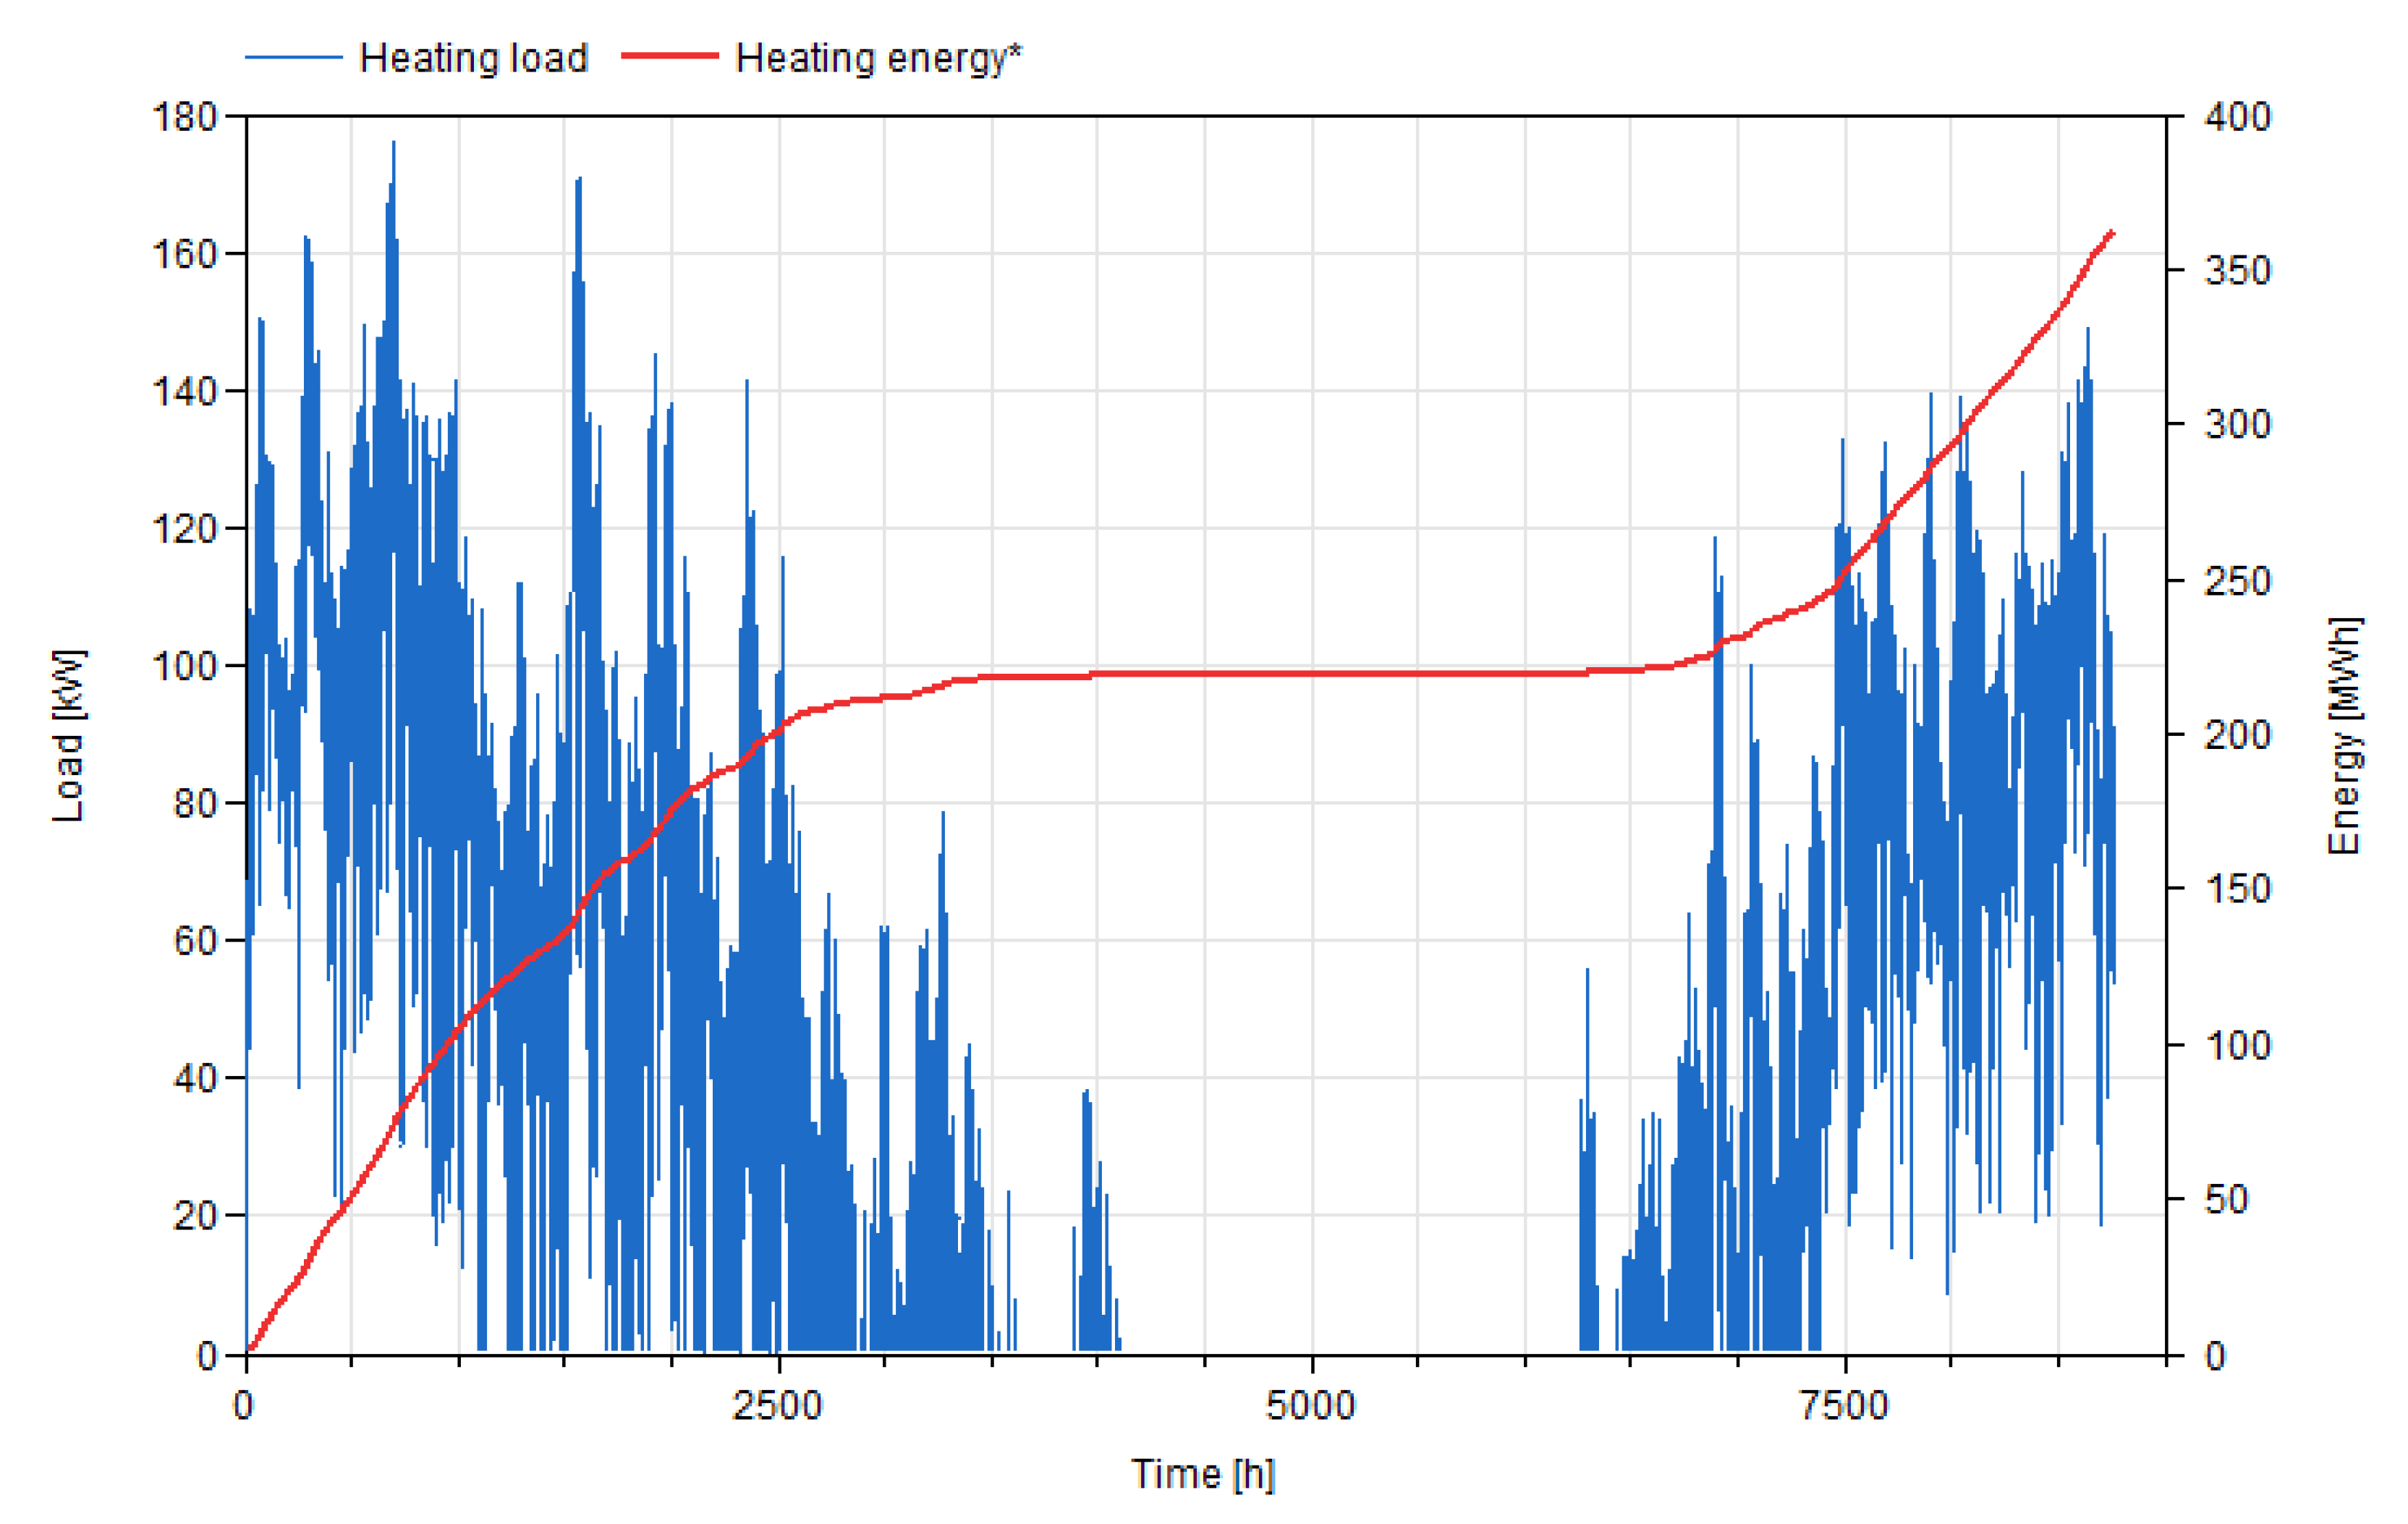
Figure 11 depicts the variation in the heating load in order to preserve the indoor temperature at 20 °C during the heating period, as well as the cumulative energy demand of the building. During the summer months (middle period of the year), there is no space-heating demand, as shown in
Figure 11. The maximum heating load of the examined building is calculated at 176 kW, and the yearly heating demand is calculated to be 362,440 kWh, corresponding to a specific energy demand of 141.4 kWh/m
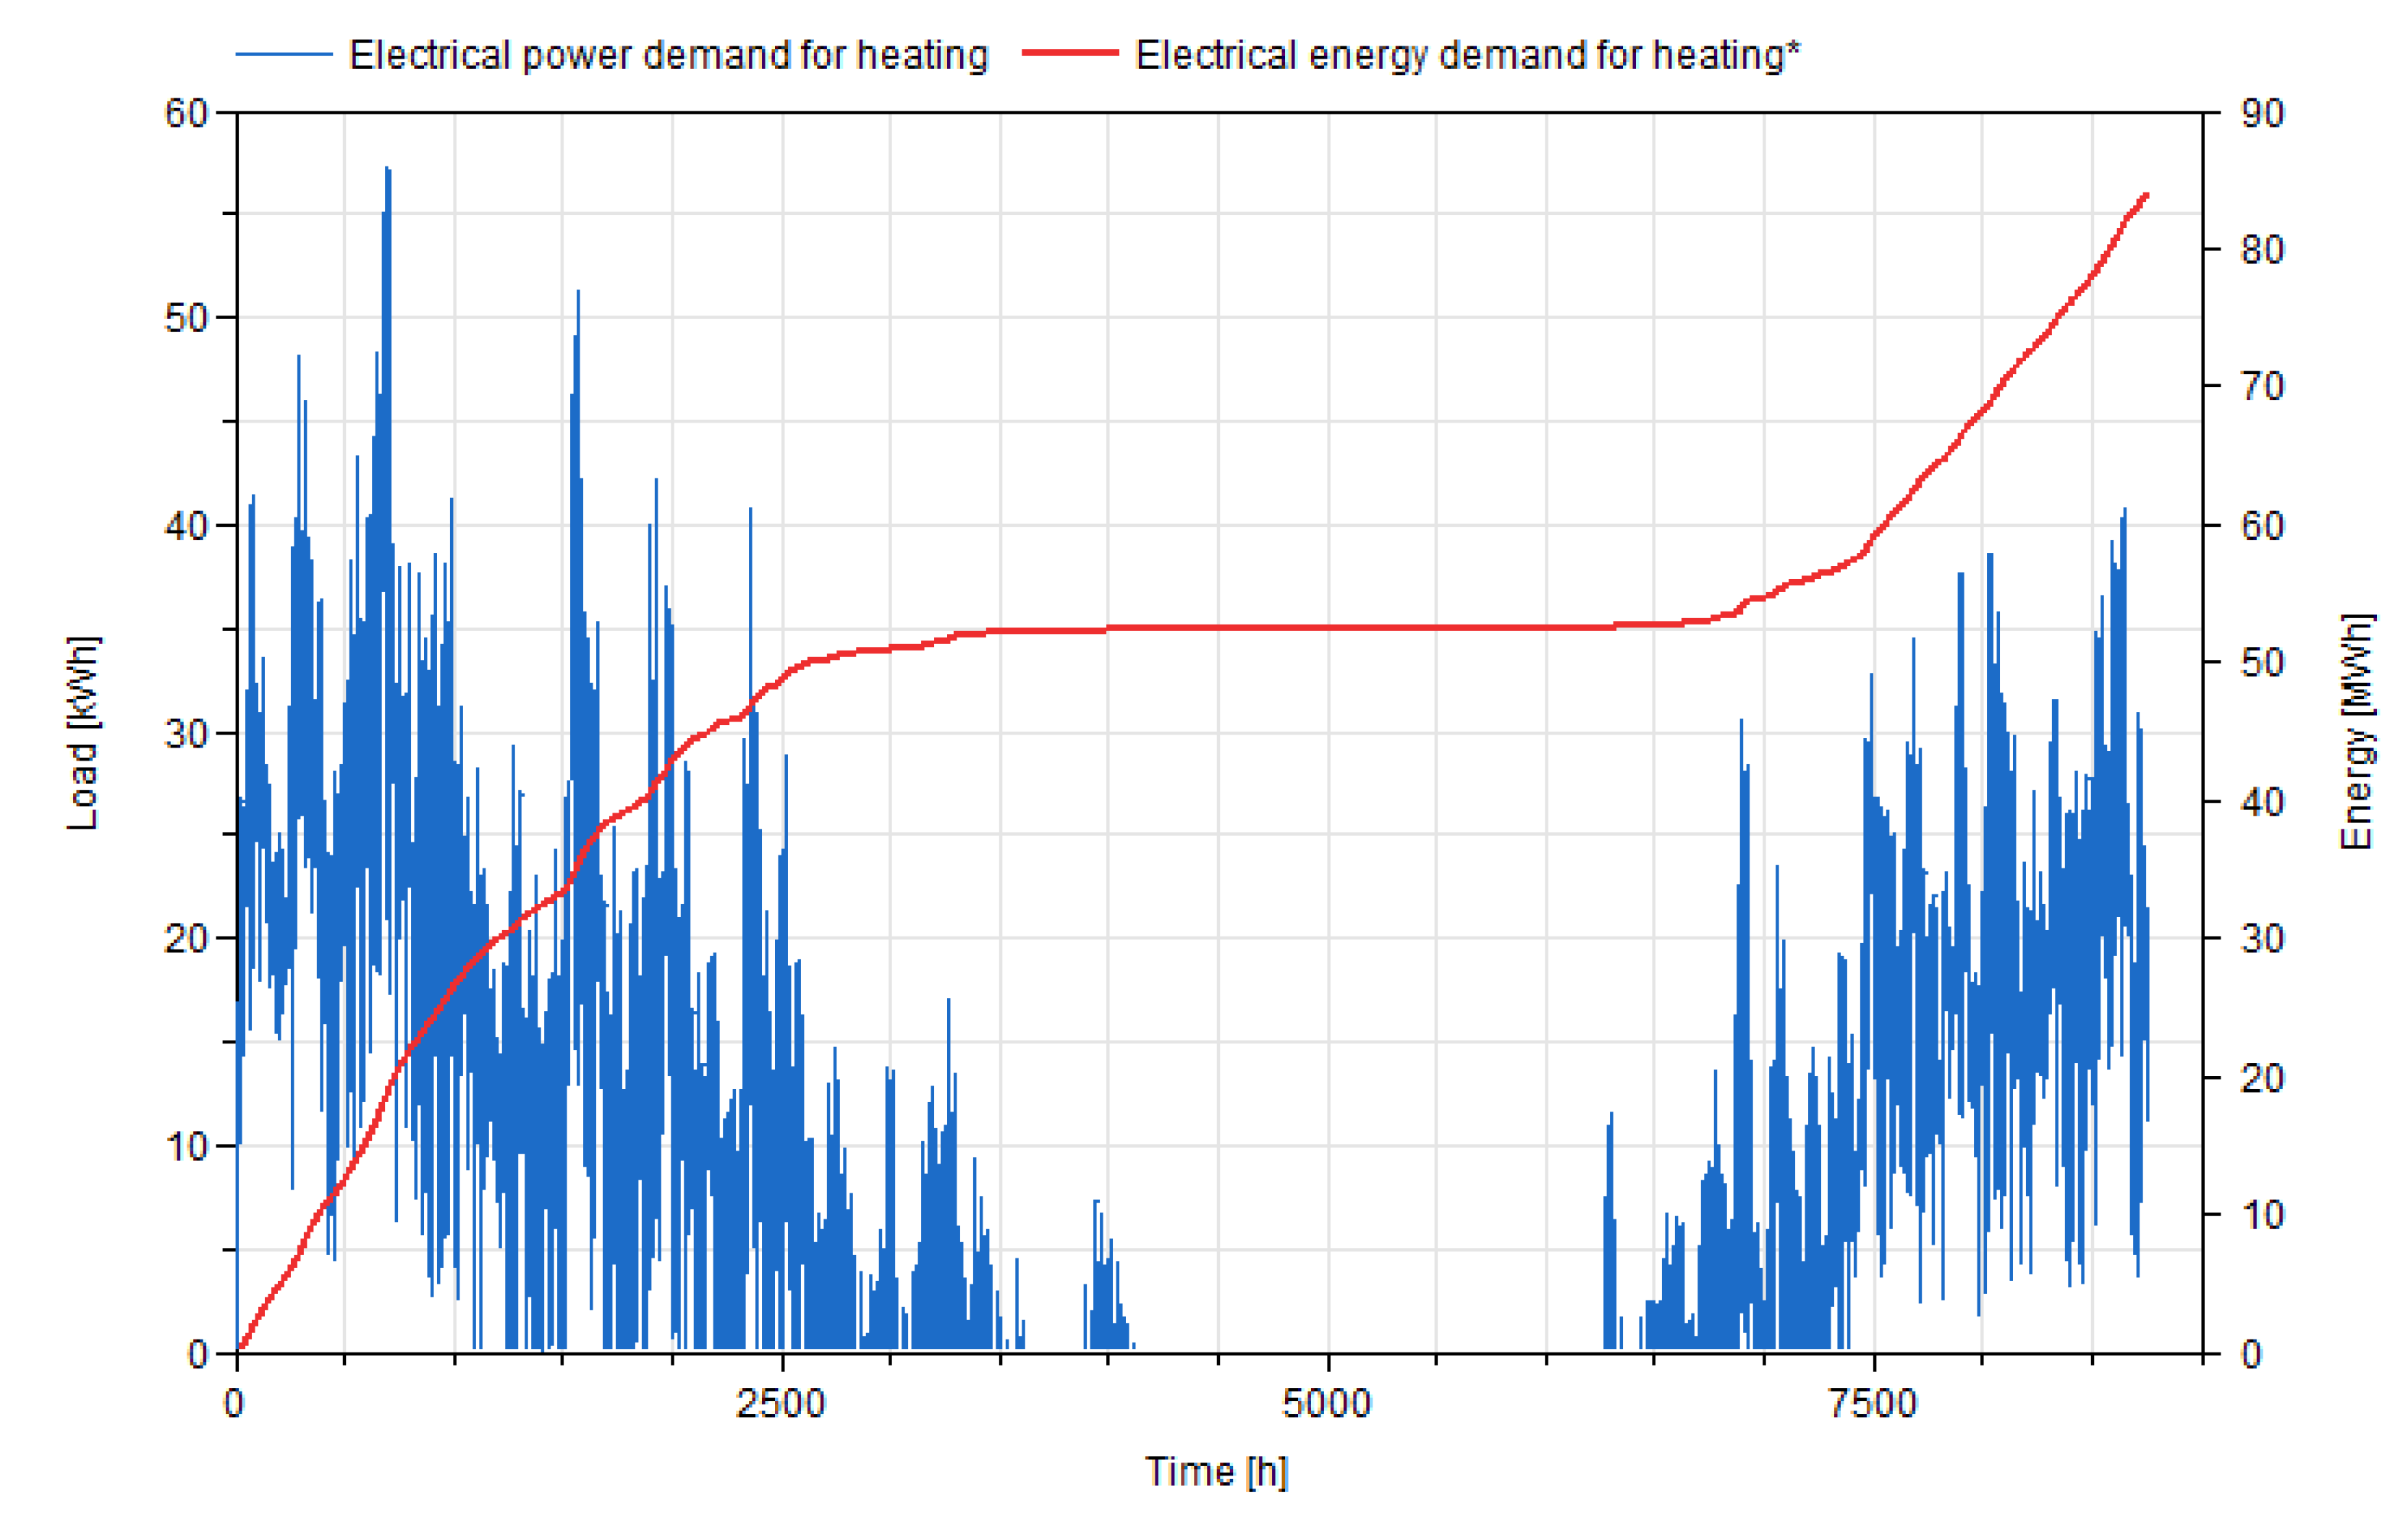
2, indicating significant thermal losses due to insufficient insulation. The respective electricity consumption of the HP is shown in
Figure 12. It can be concluded that the electricity demand has similar trends with the heating load. The maximum electricity demand is approximately 57 kW, and the annual electricity demand is calculated to be 84,097 kWh.
The COP of the HP is shown in
Figure 13. The instantaneous COP reaches up to 8.2, while the seasonal efficiency is calculated to have a SCOP of 4.31. In the winter period, the COP is characterized by lower values compared to the spring and autumn periods. This is reasonable due to the lower temperature levels during the winter, which result in a diminished thermodynamic performance for the system. Note that the NPC, in this case, includes the operating cost for electricity only, and it was found to be 410 kEUR.
The operating temperature levels of the water and air streams of the fan coil are illustrated in
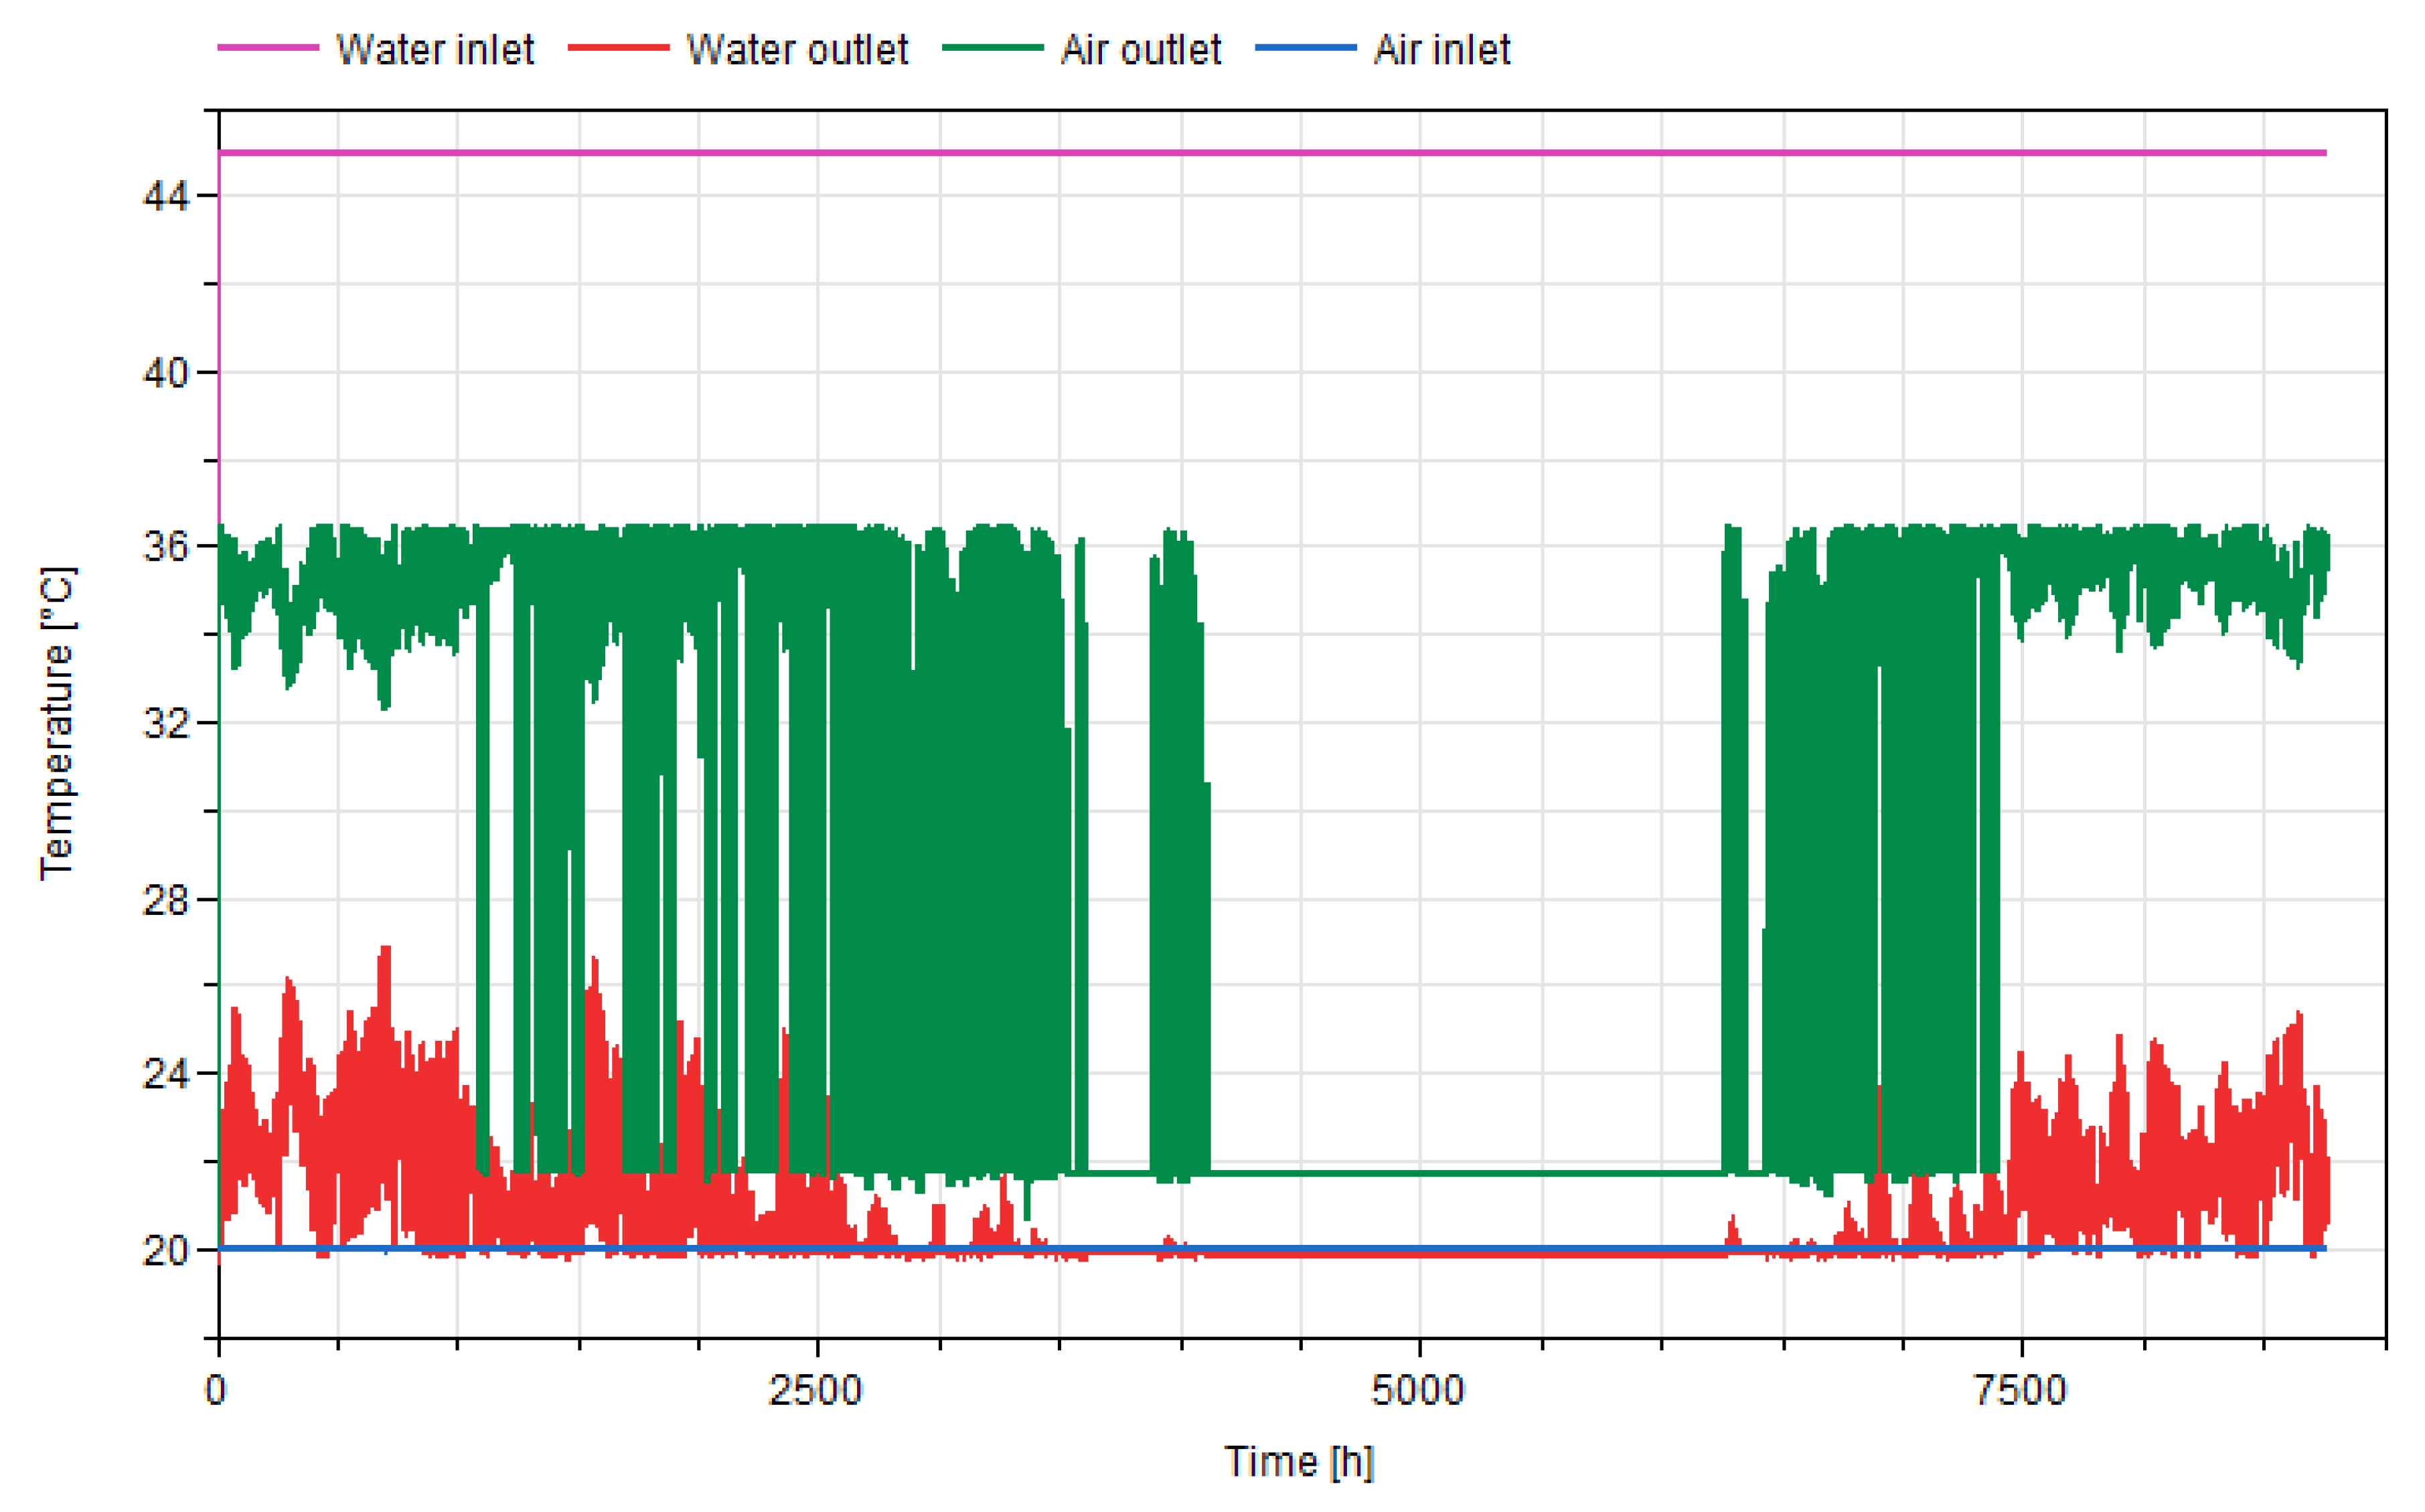
Figure 14 for the ASHP. The water inlet temperature is set at 45 °C in all cases, while the inlet air temperature is 20 °C (set-point temperature). The outlet temperatures of these streams are variable throughout the year due to the dynamic character of the examined phenomenon. Specifically, the hot air outlet reaches up to 36 °C, while the cold water outlet reaches up to 23–24 °C. These results indicate suitable heat transfer flows in the fan coil, with relatively low but acceptable temperature differences between the streams. The variation in the temperature levels is created by the suitable control system, which properly adjusts the streams’ mass flow rates to provide the necessary heating demand to the building. The variation in the temperature levels is a result of the variation in the mass flow rates in the fan coil.
3.2. Case 2: Ground-Source Heat Pump
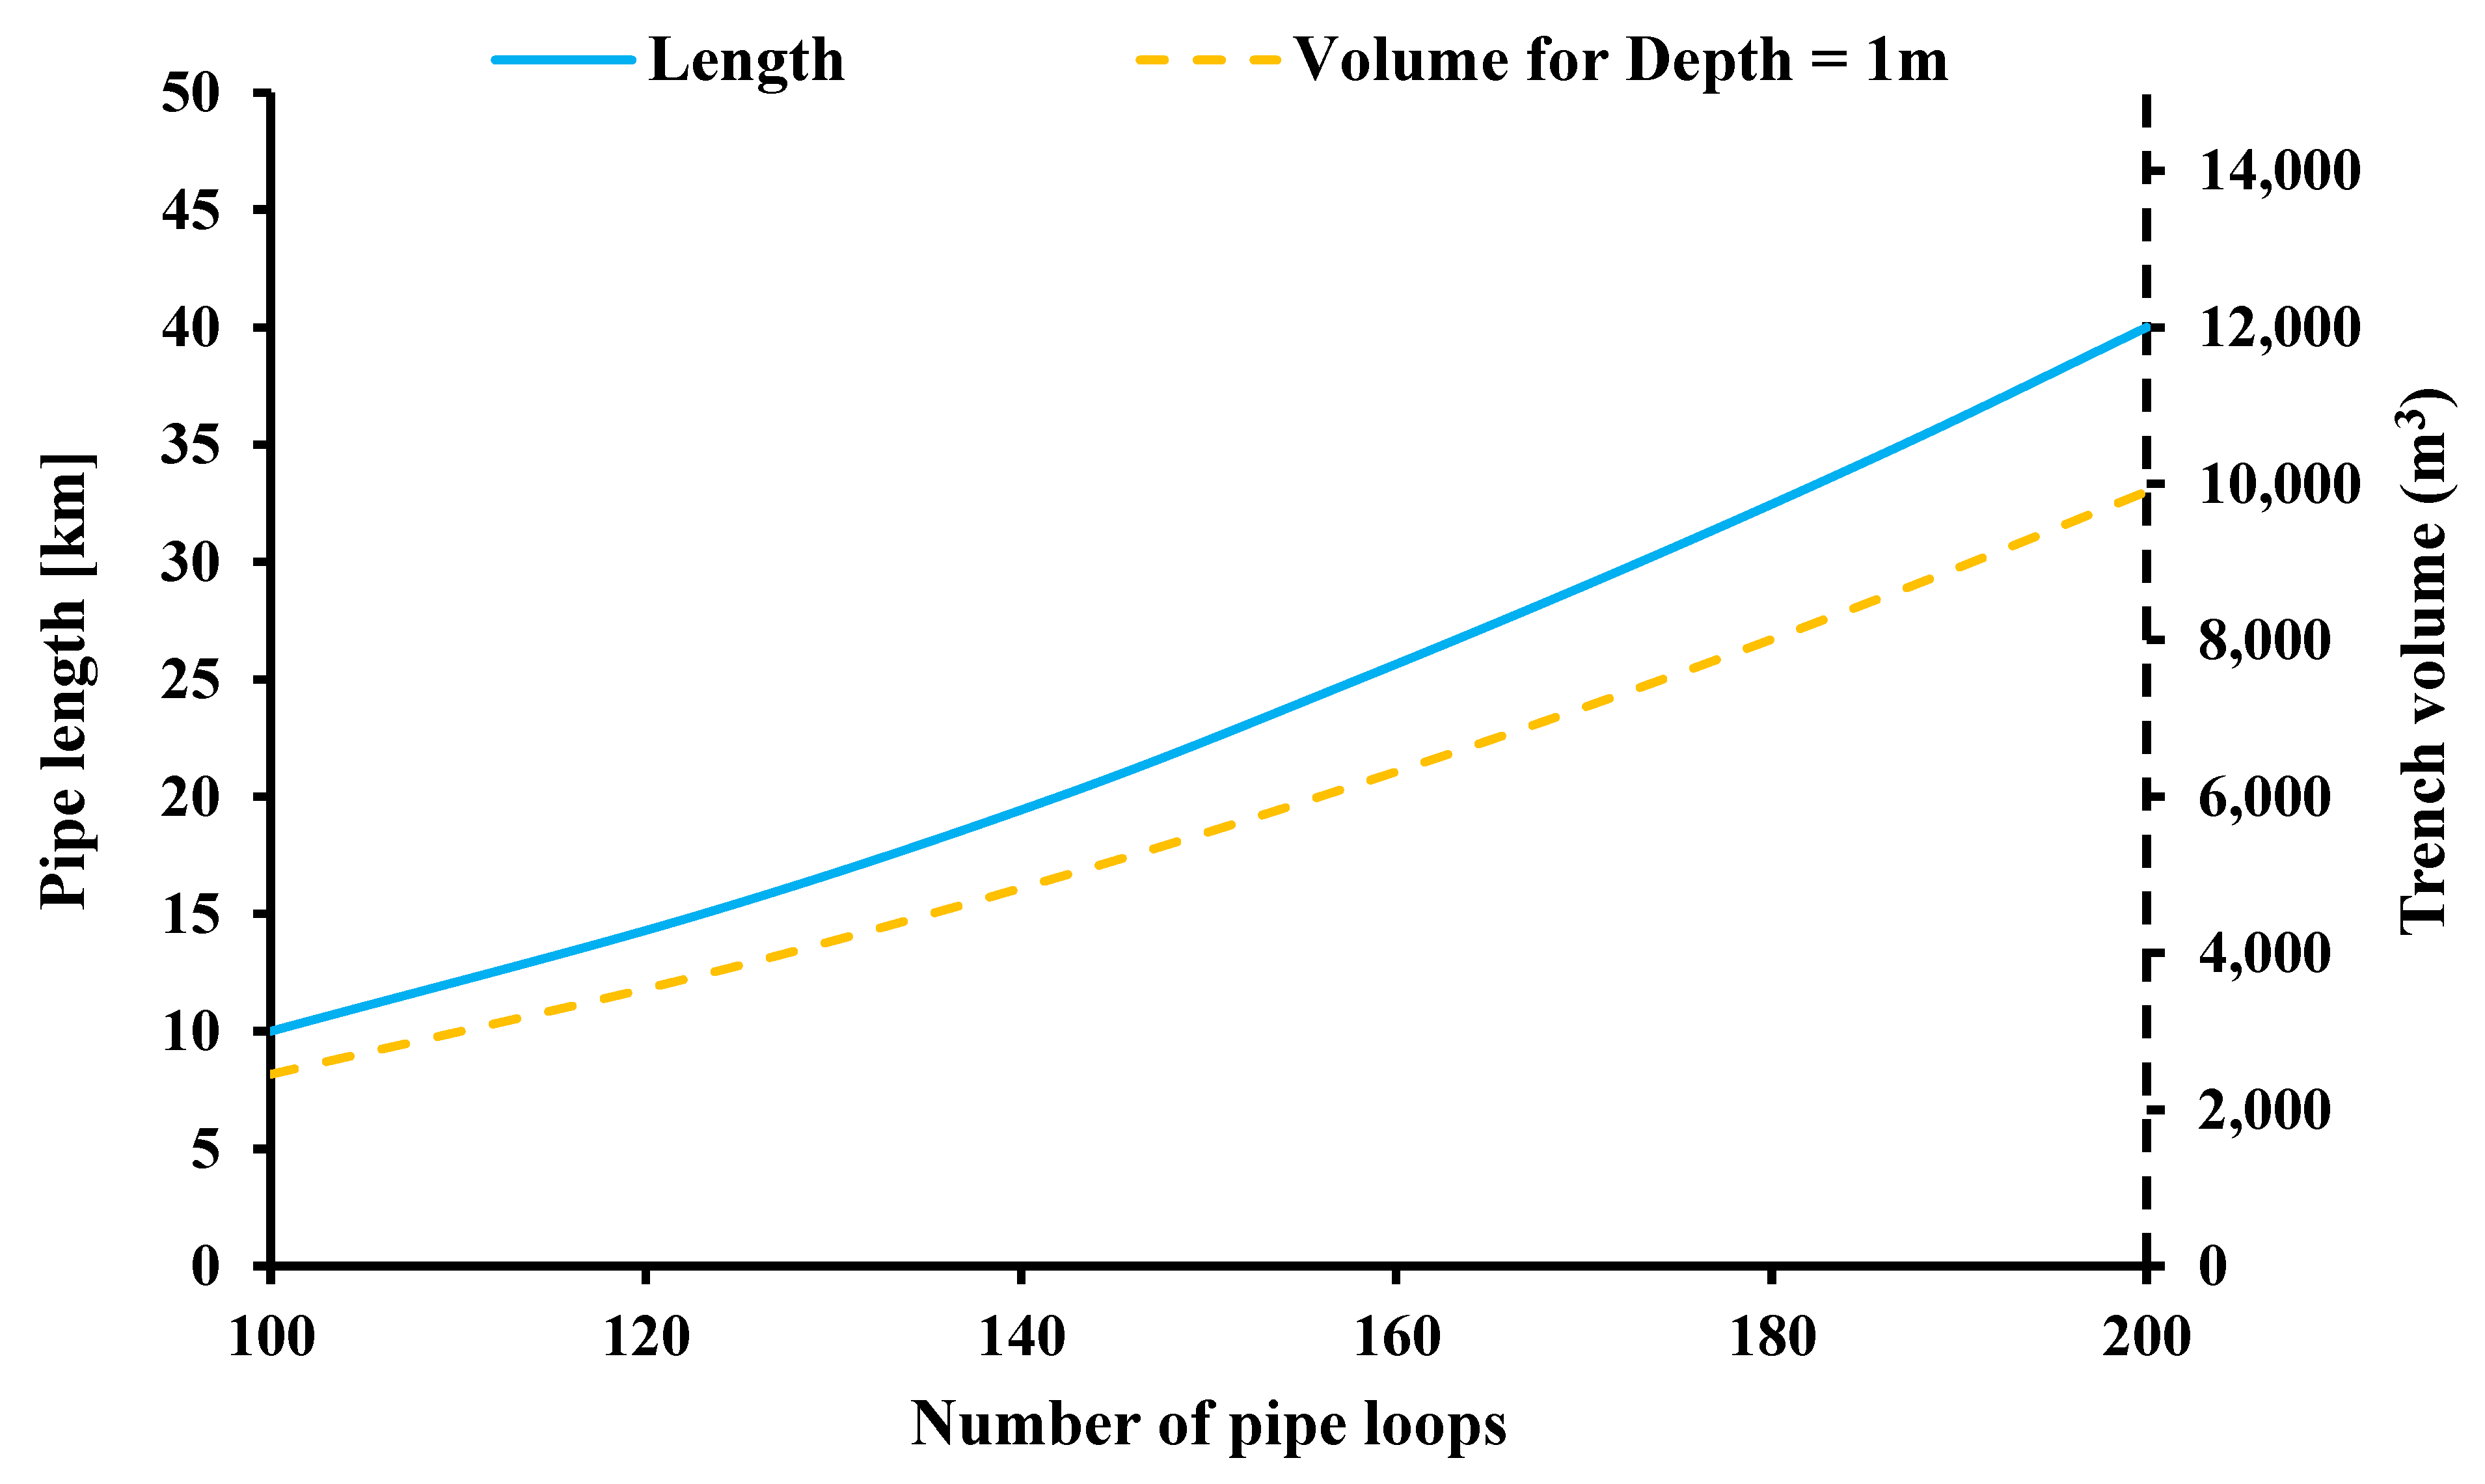
The GSHP exploits the ground temperature to feed the evaporator of the HP with a relatively higher temperature compared to the ambient source. In this analysis, different GHE lengths and piping depths are examined. The parameterization of the piping system is conducted by selecting a different number of pipe loops between 100 and 200, as
Figure 15 indicates. Moreover, this figure shows the variation in the soil volume that is removed for the installation of the respective piping system (referring to a depth of approximately 1 m). It is worth mentioning that an increase in the pipe loops from 100 to 200 leads to a corresponding increase in the total pipe length from 10 km to 40 km, respectively.
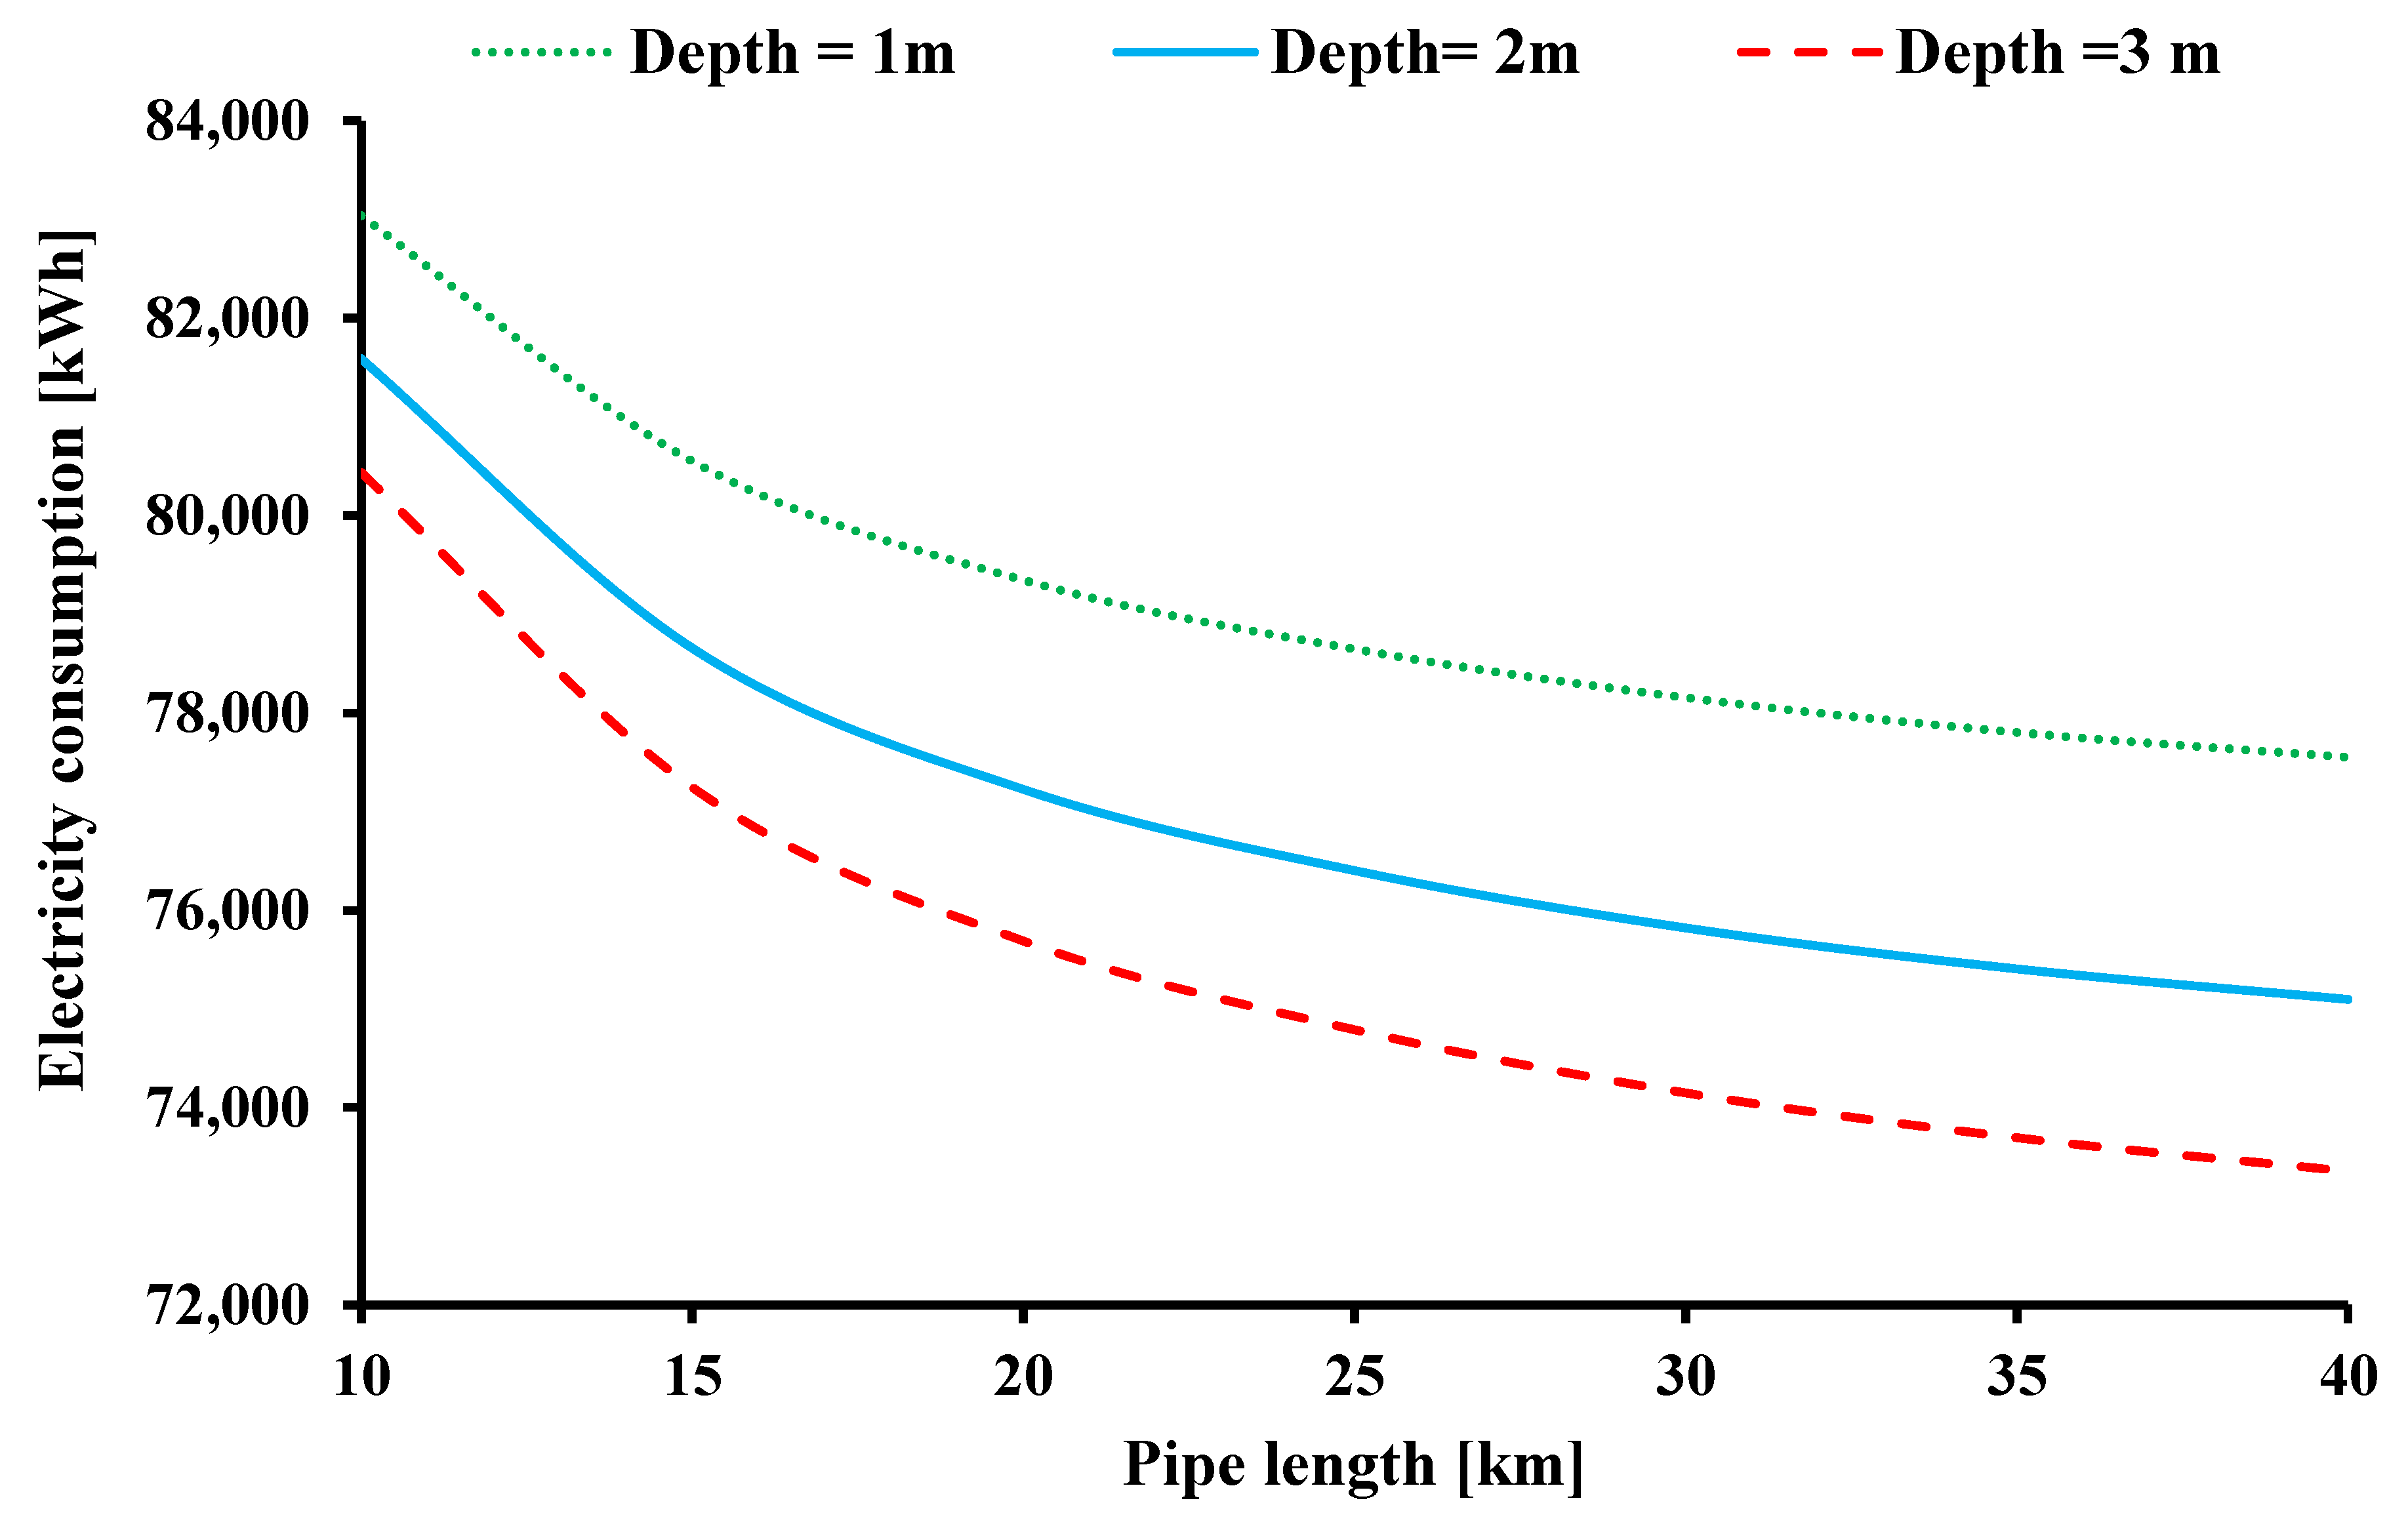
Figure 16 depicts the annual electricity demand of the HP for different design scenarios of the GHE. The increase in the piping length and depth leads to lower electricity demand. Specifically, for Depth = 1 m, the electricity consumption varies from 77,550 to 83,039 kWh, for Depth = 2 m from 75,096 to 81,588 kWh and for Depth = 3 m from 73,354 to 80,436 kWh.
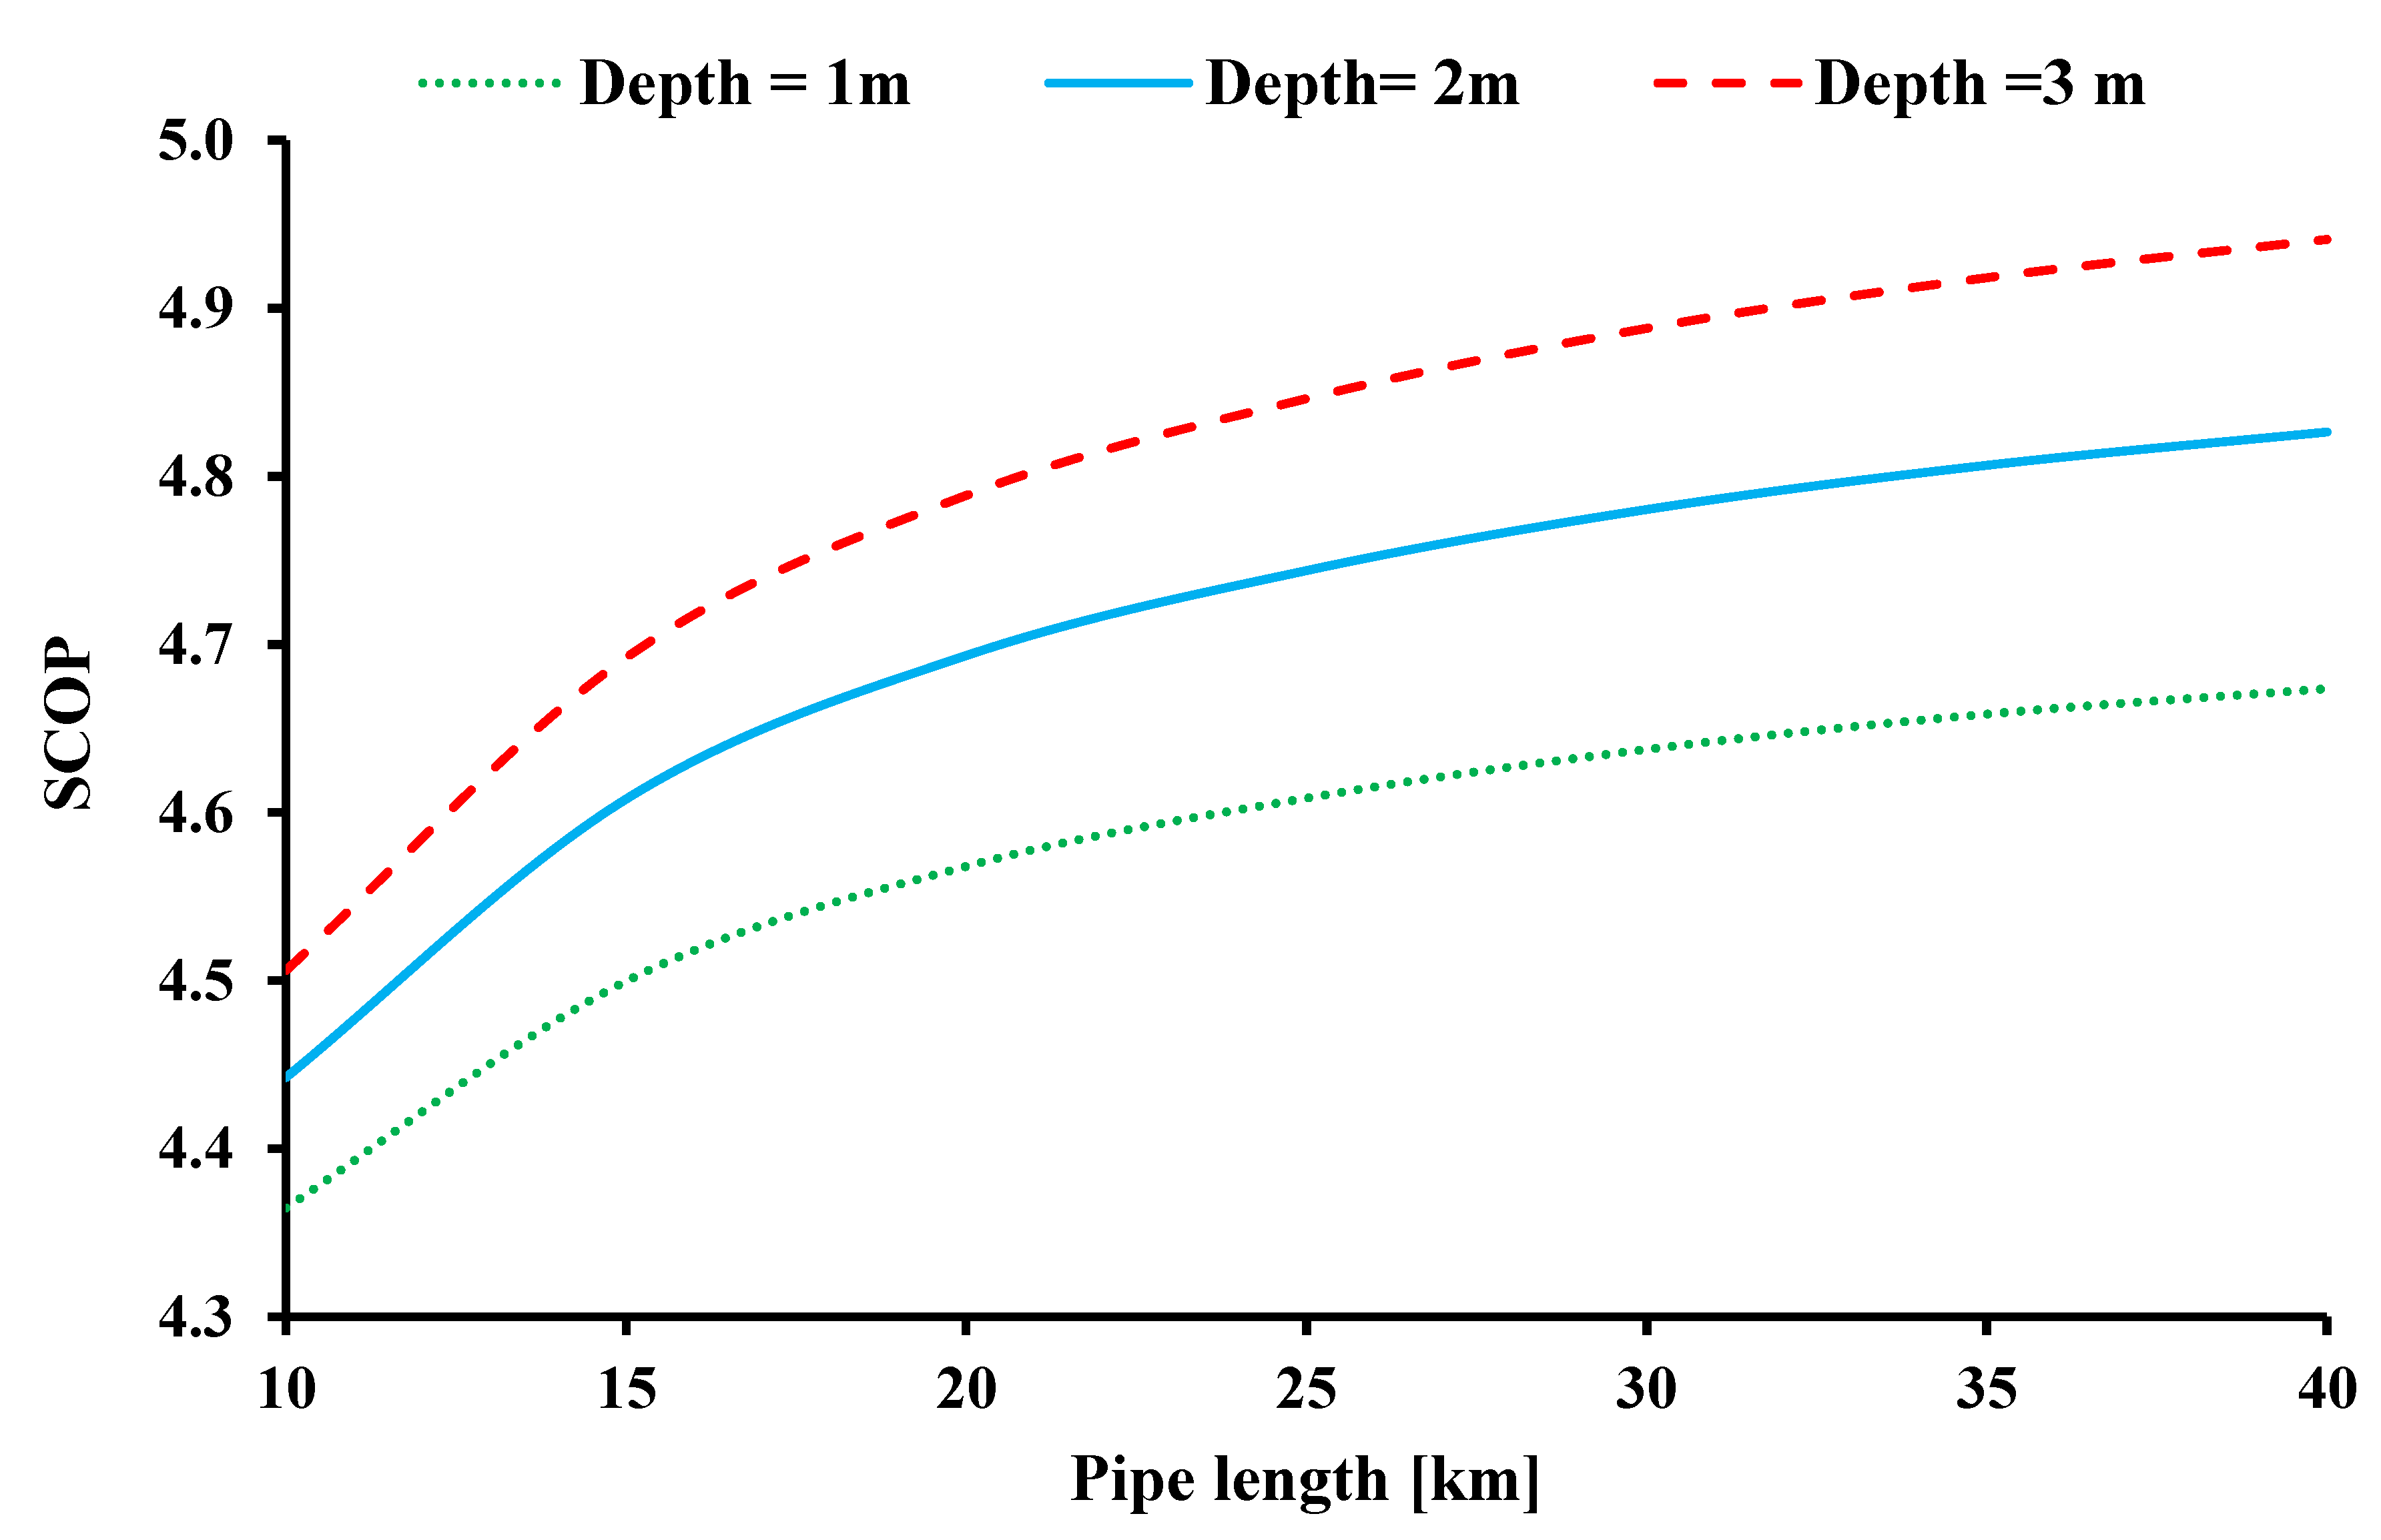
Figure 17 illustrates the impact of the GHE design on the SCOP. Specifically, the GHE configuration is characterized by its piping length and depth. According to this figure, the increase in depth and piping length led to higher SCOP due to the decrease in the respective annual electricity demand. Practically, the greater depths and piping lengths enable a more efficient heat pump performance. This can be explained by the fact that the ground is warmer during the winter period in greater depths, while the increase in the piping system’s length augments the effective exploitation of the ground source by the heat transfer medium.
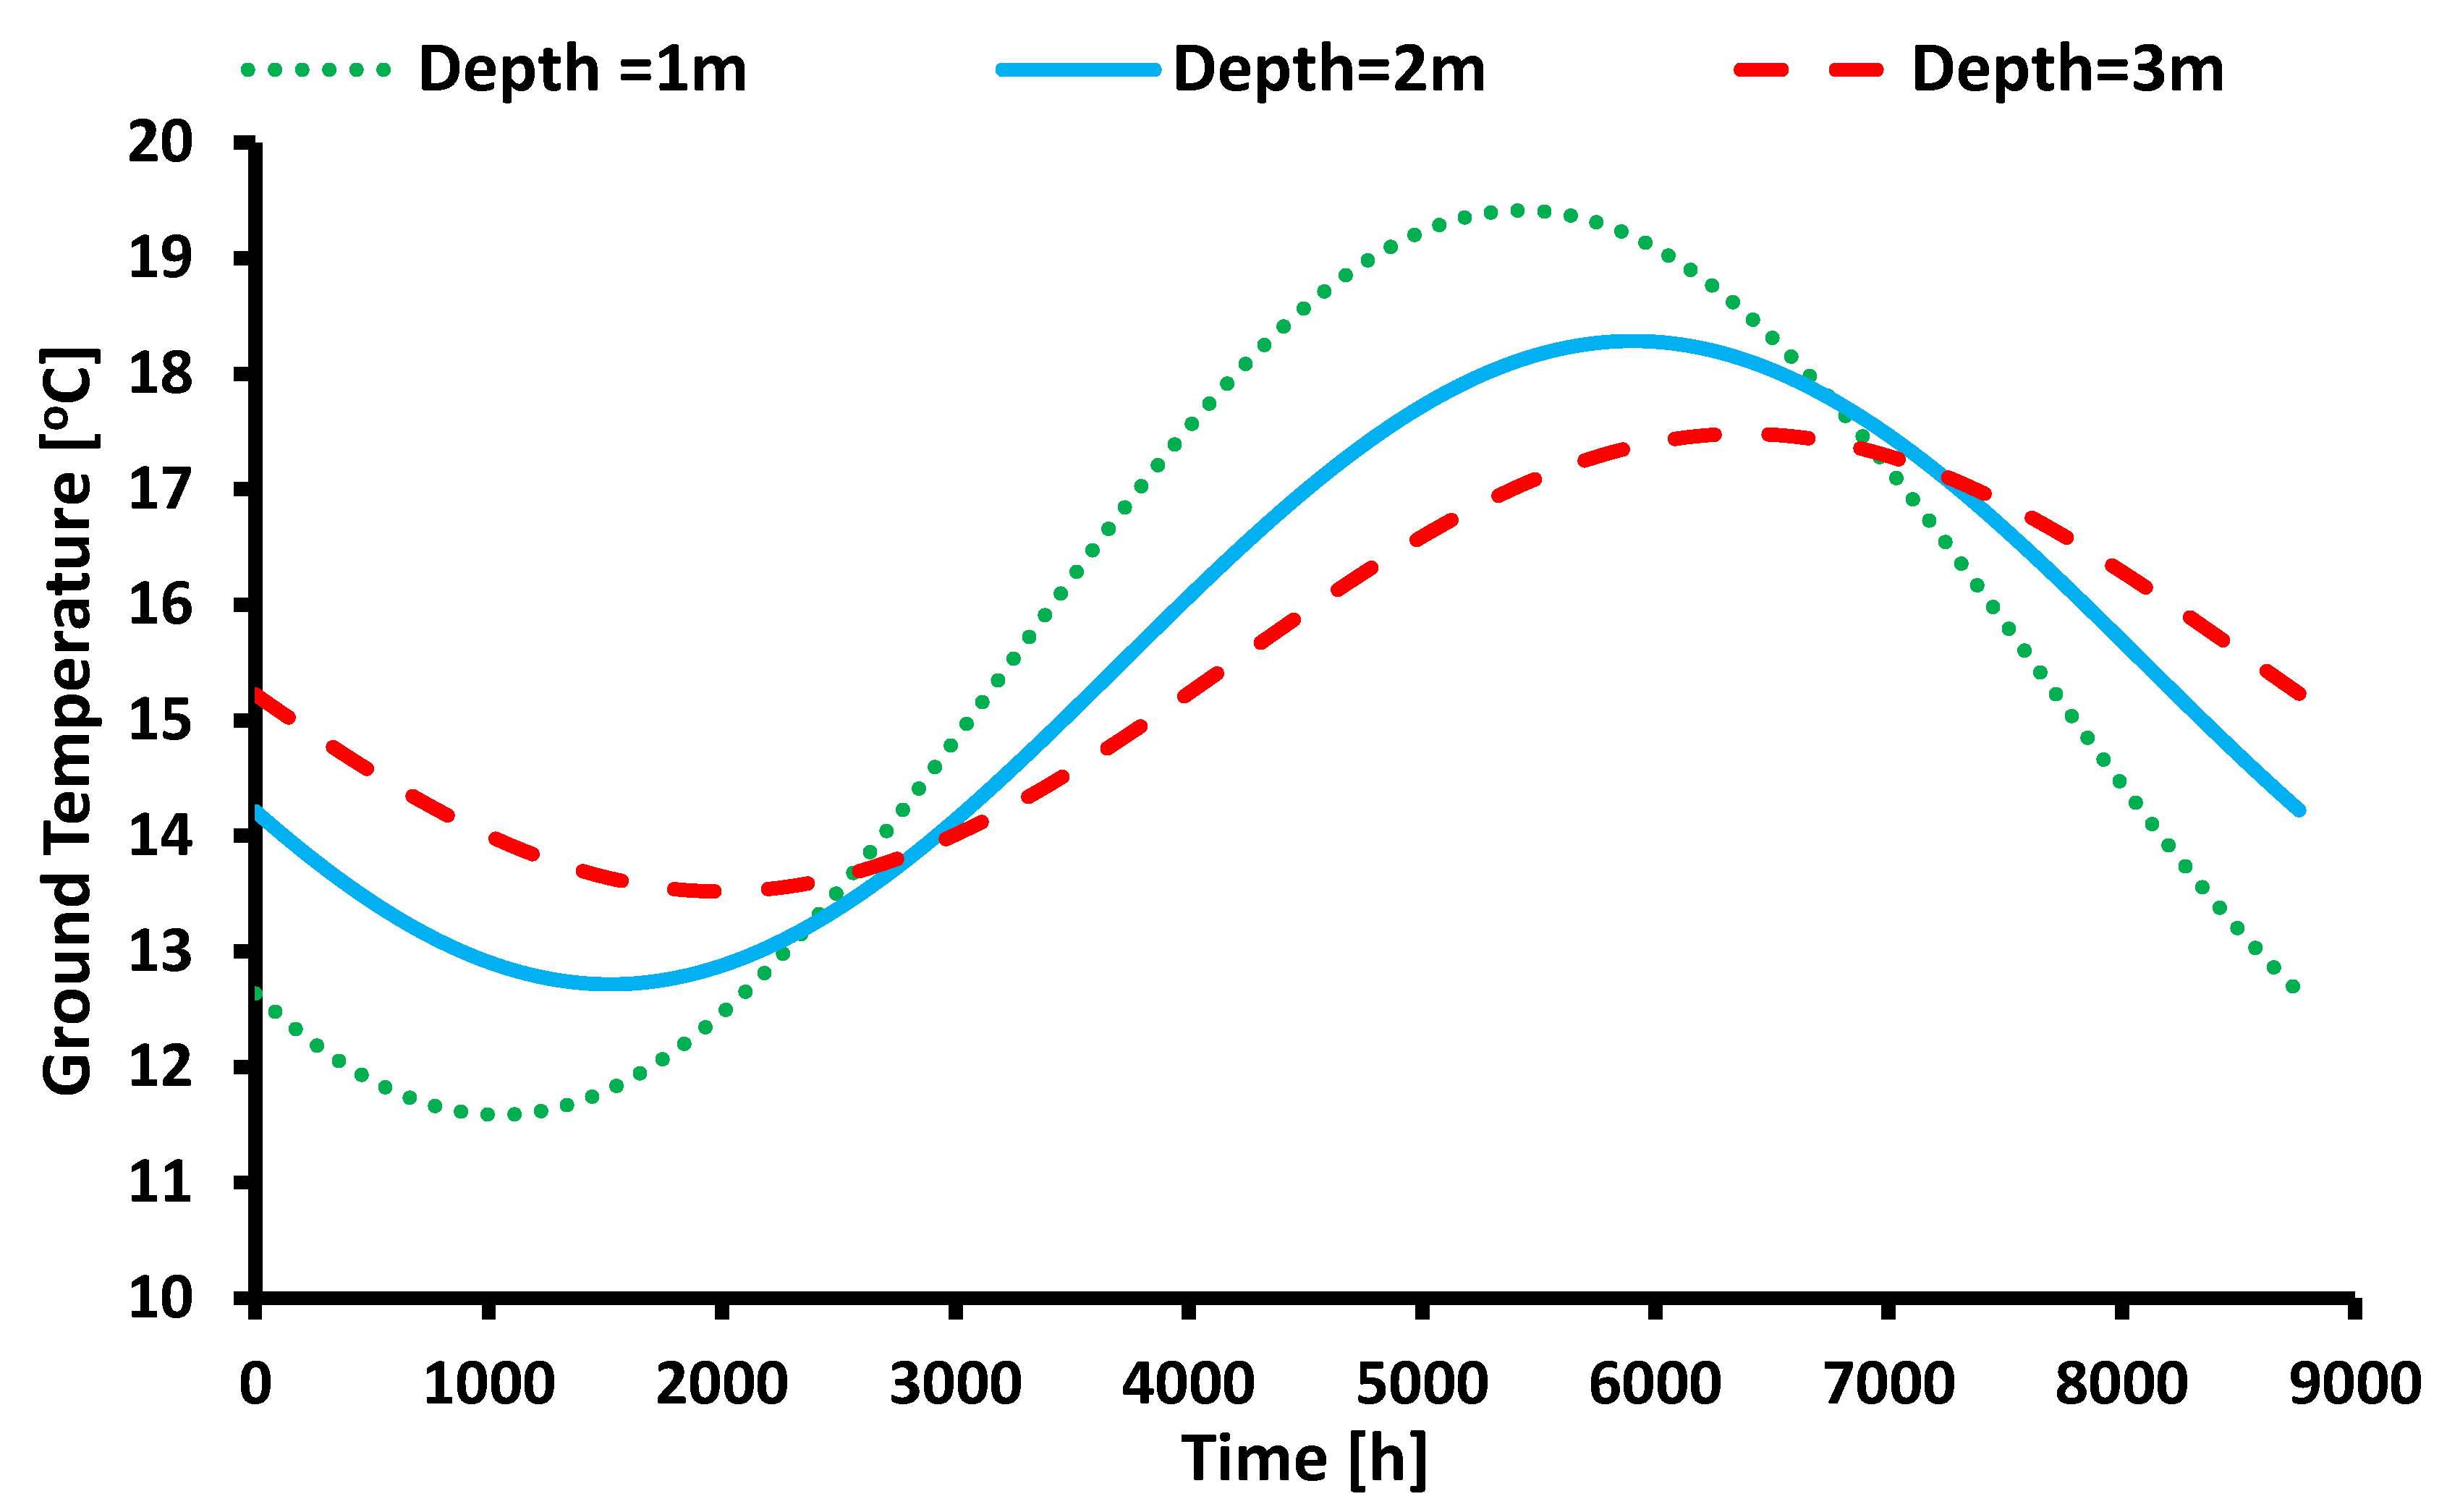
Figure 18 depicts the variation in the ground temperature throughout the year for every examined depth. At this point, it is important to mention that Equation (25) is used for the calculation of the ground temperature level as a function of the depth and time.
Figure 18 indicates that the increase in depth leads to higher minimum ground temperature during winter, which allows for system operation in generally higher temperatures in the winter. Furthermore, greater depths lead to smoother temperature profiles due to the decreased impact of the ambient. More specifically, the minimum ground temperature for a 1 m depth is 11.6 °C, while for a 2 m depth it is 12.7 °C and for a 3 m depth it is 13.5 °C. On the other hand, the mean ground temperature presents similar values for all the depths, but this information is not of high importance because the mean yearly temperature value includes the summer period, which is not an effective period for the heating demand. Therefore, in the cases with greater depth and piping length, the heat transfer fluids present higher temperature levels, which results in the improvement of the system’s performance. Specifically, according to
Figure 17, the SCOP varies from 4.36 up to 4.67 for Depth = 1 m, the SCOP varies from 4.44 up to 4.83 for Depth = 2 m, and the SCOP varies from 4.51 up to 4.94 for Depth = 3 m.
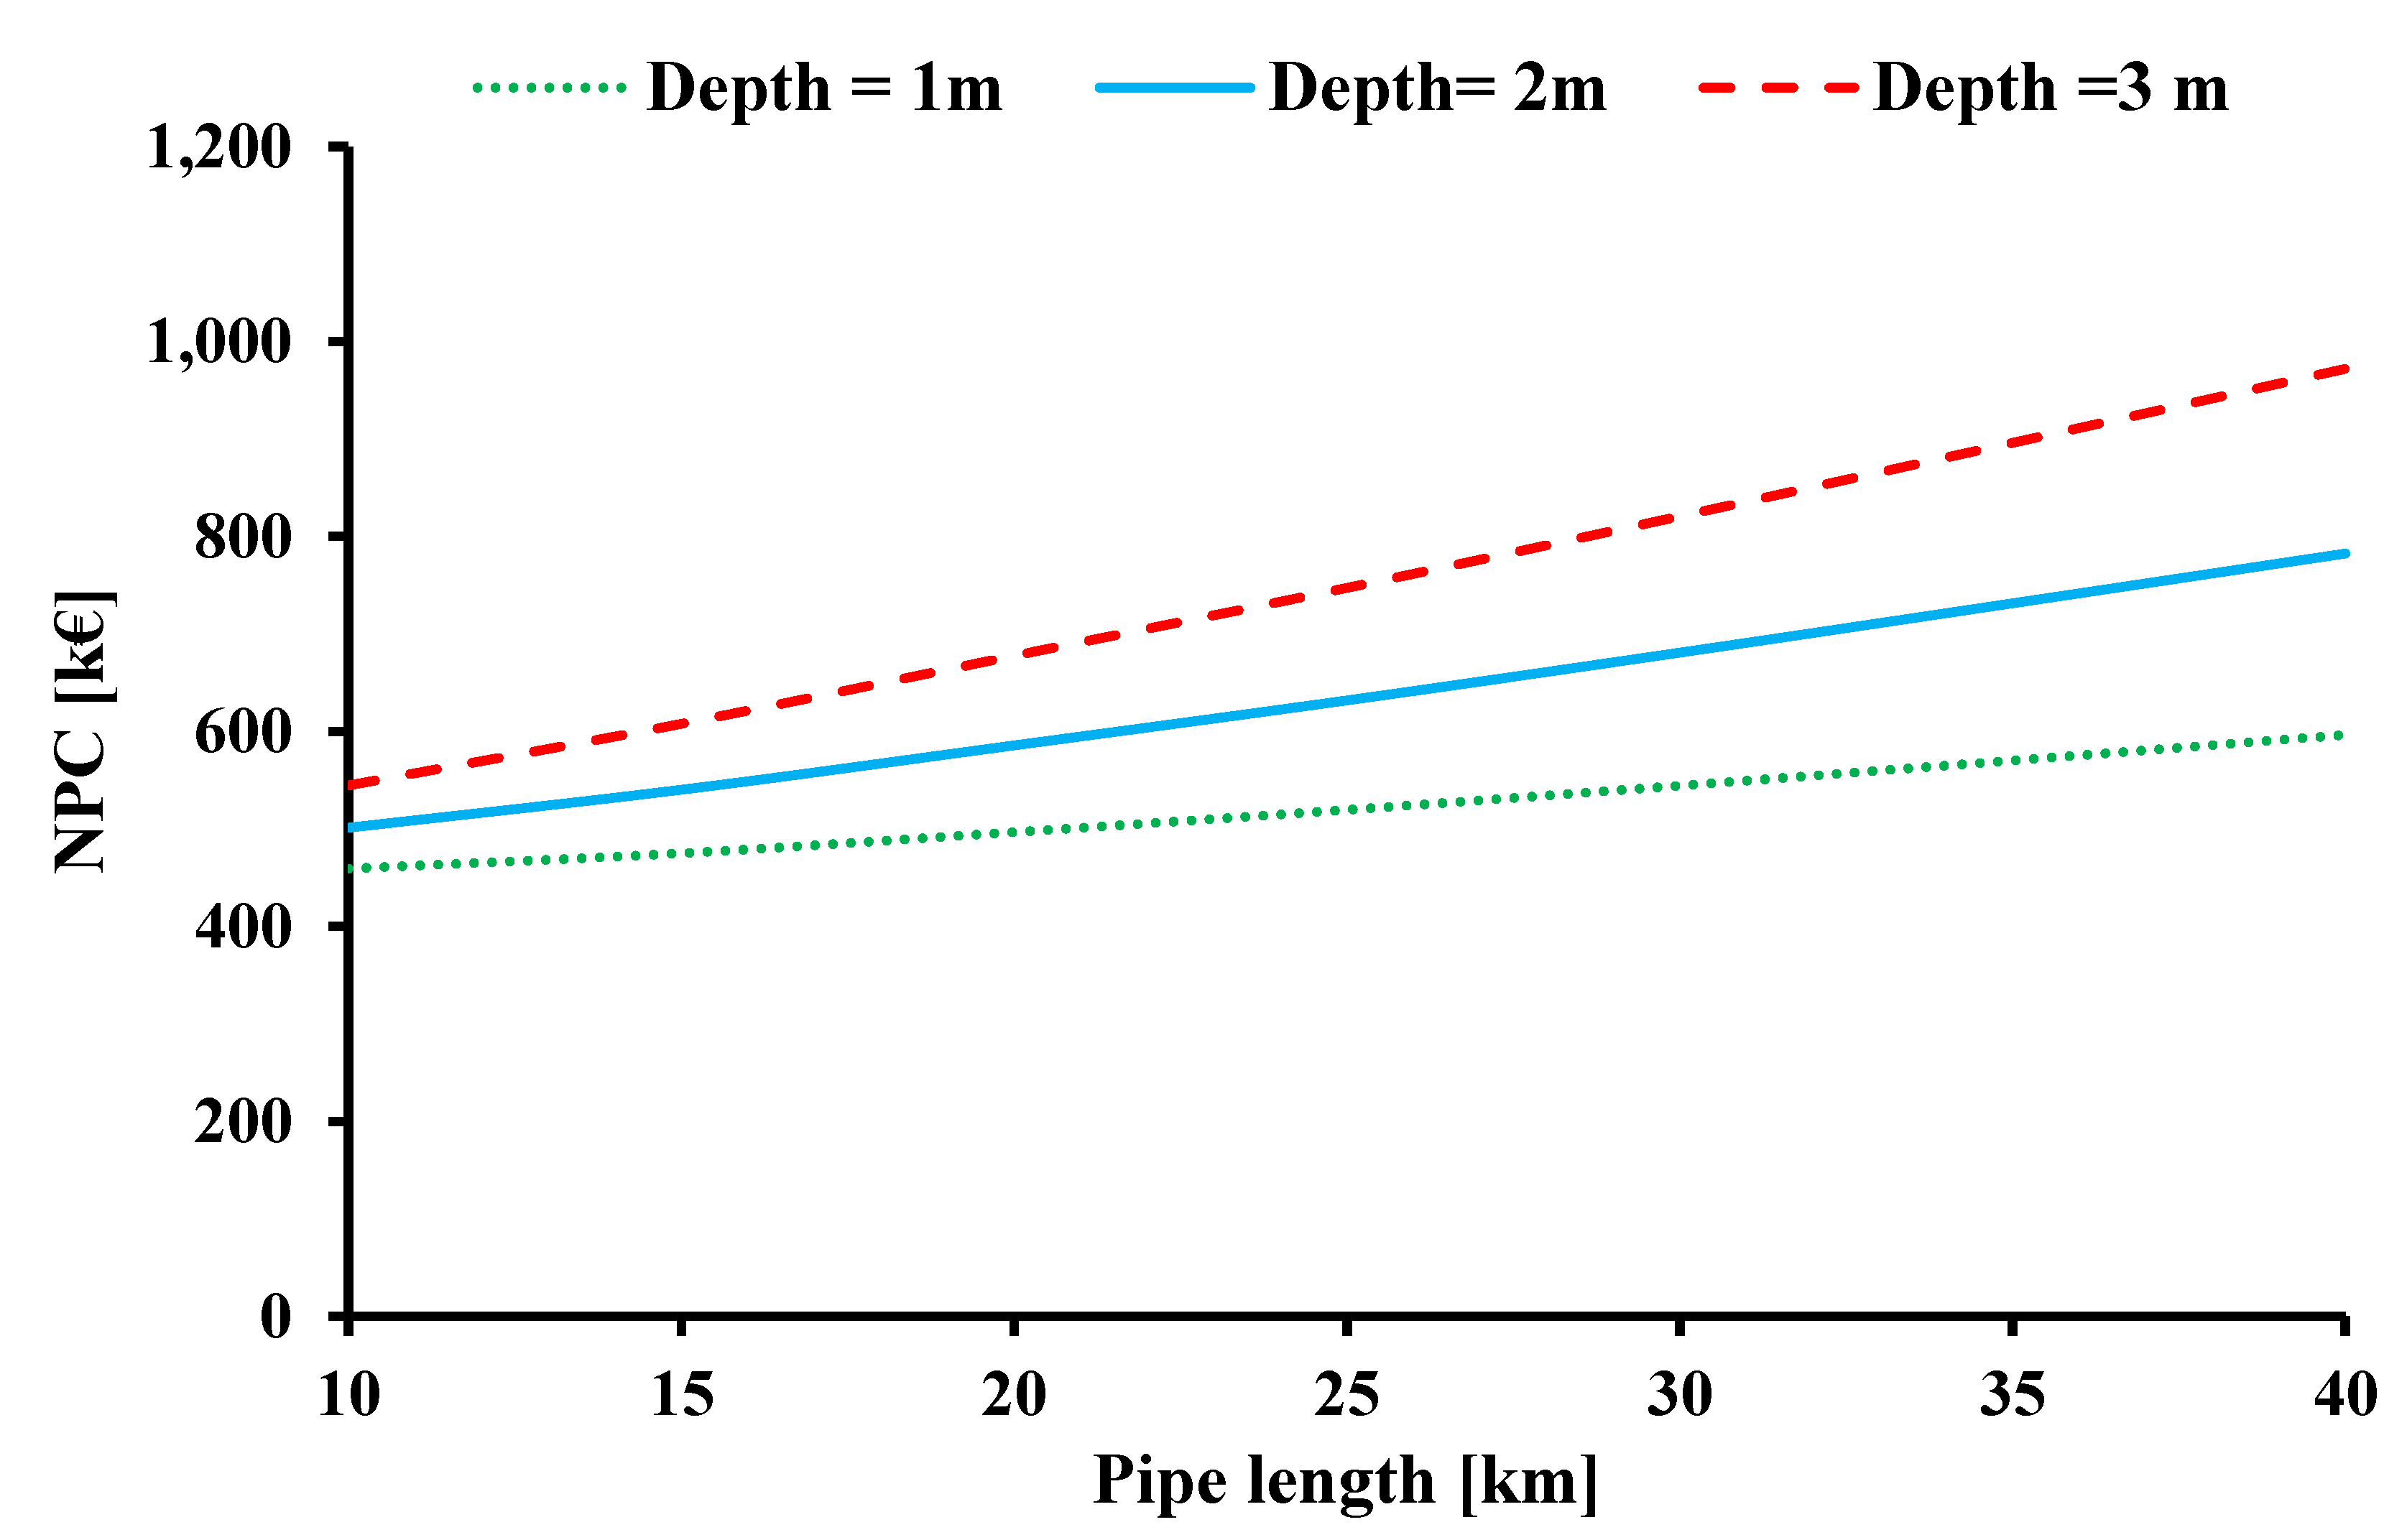
Figure 19 shows the NPC of the examined cases for the ground-source case. The increase in the piping length and depth results in the increase in NPC. This result indicates that the design configuration that reduces the electricity demand leads to higher NPC. Therefore, the definition of an extra factor for the determination of the global optimum design is needed. The results of a multi-objective optimization procedure are given in
Figure 20, where the annual electricity demand and the NPC are presented for each examined case. The global optimum scenario will derive from the minimization of these indexes. According to the results, the global optimum design is characterized by L = 25 km and Depth = 2 m, which leads to a yearly electricity demand of 76,401 kWh and a SCOP of 4.74. Moreover, in this case, the NPC is calculated as being 632 kEUR.
3.3. Case 3: Dual-Source Heat Pump (Solar and Air)
The dual-source HP is fed by solar thermal collectors and ambient sources. Solar thermal collectors produce hot water, which is stored in an insulated thermal tank, and if the mean water temperature reaches over 16 °C, the water is then also exploited as a heat source in the HP. The special characteristic of the present analysis is the simultaneous feeding of the HP with the air and water source by introducing a contribution criterion regulated by the environmental temperature. Specifically, the higher ambient temperature allows for a more targeted exploitation of the ambient (
Figure 8 provides more details for such a control strategy).
Different design scenarios are considered, involving various combinations of the two design variables, i.e., the collecting area (Acol) and the ratio of area-to-tank volume (Acol/V). The collecting area is investigated within the range of 100 to 600 m2, while the ratio ranges from 10 up to 30 m2/m3. Therefore, the studied storage tank volume for every collecting area varies in order to examine more suitable design cases, avoiding the investigation of non-realistic scenarios (e.g., a small collecting area with a huge storage tank).
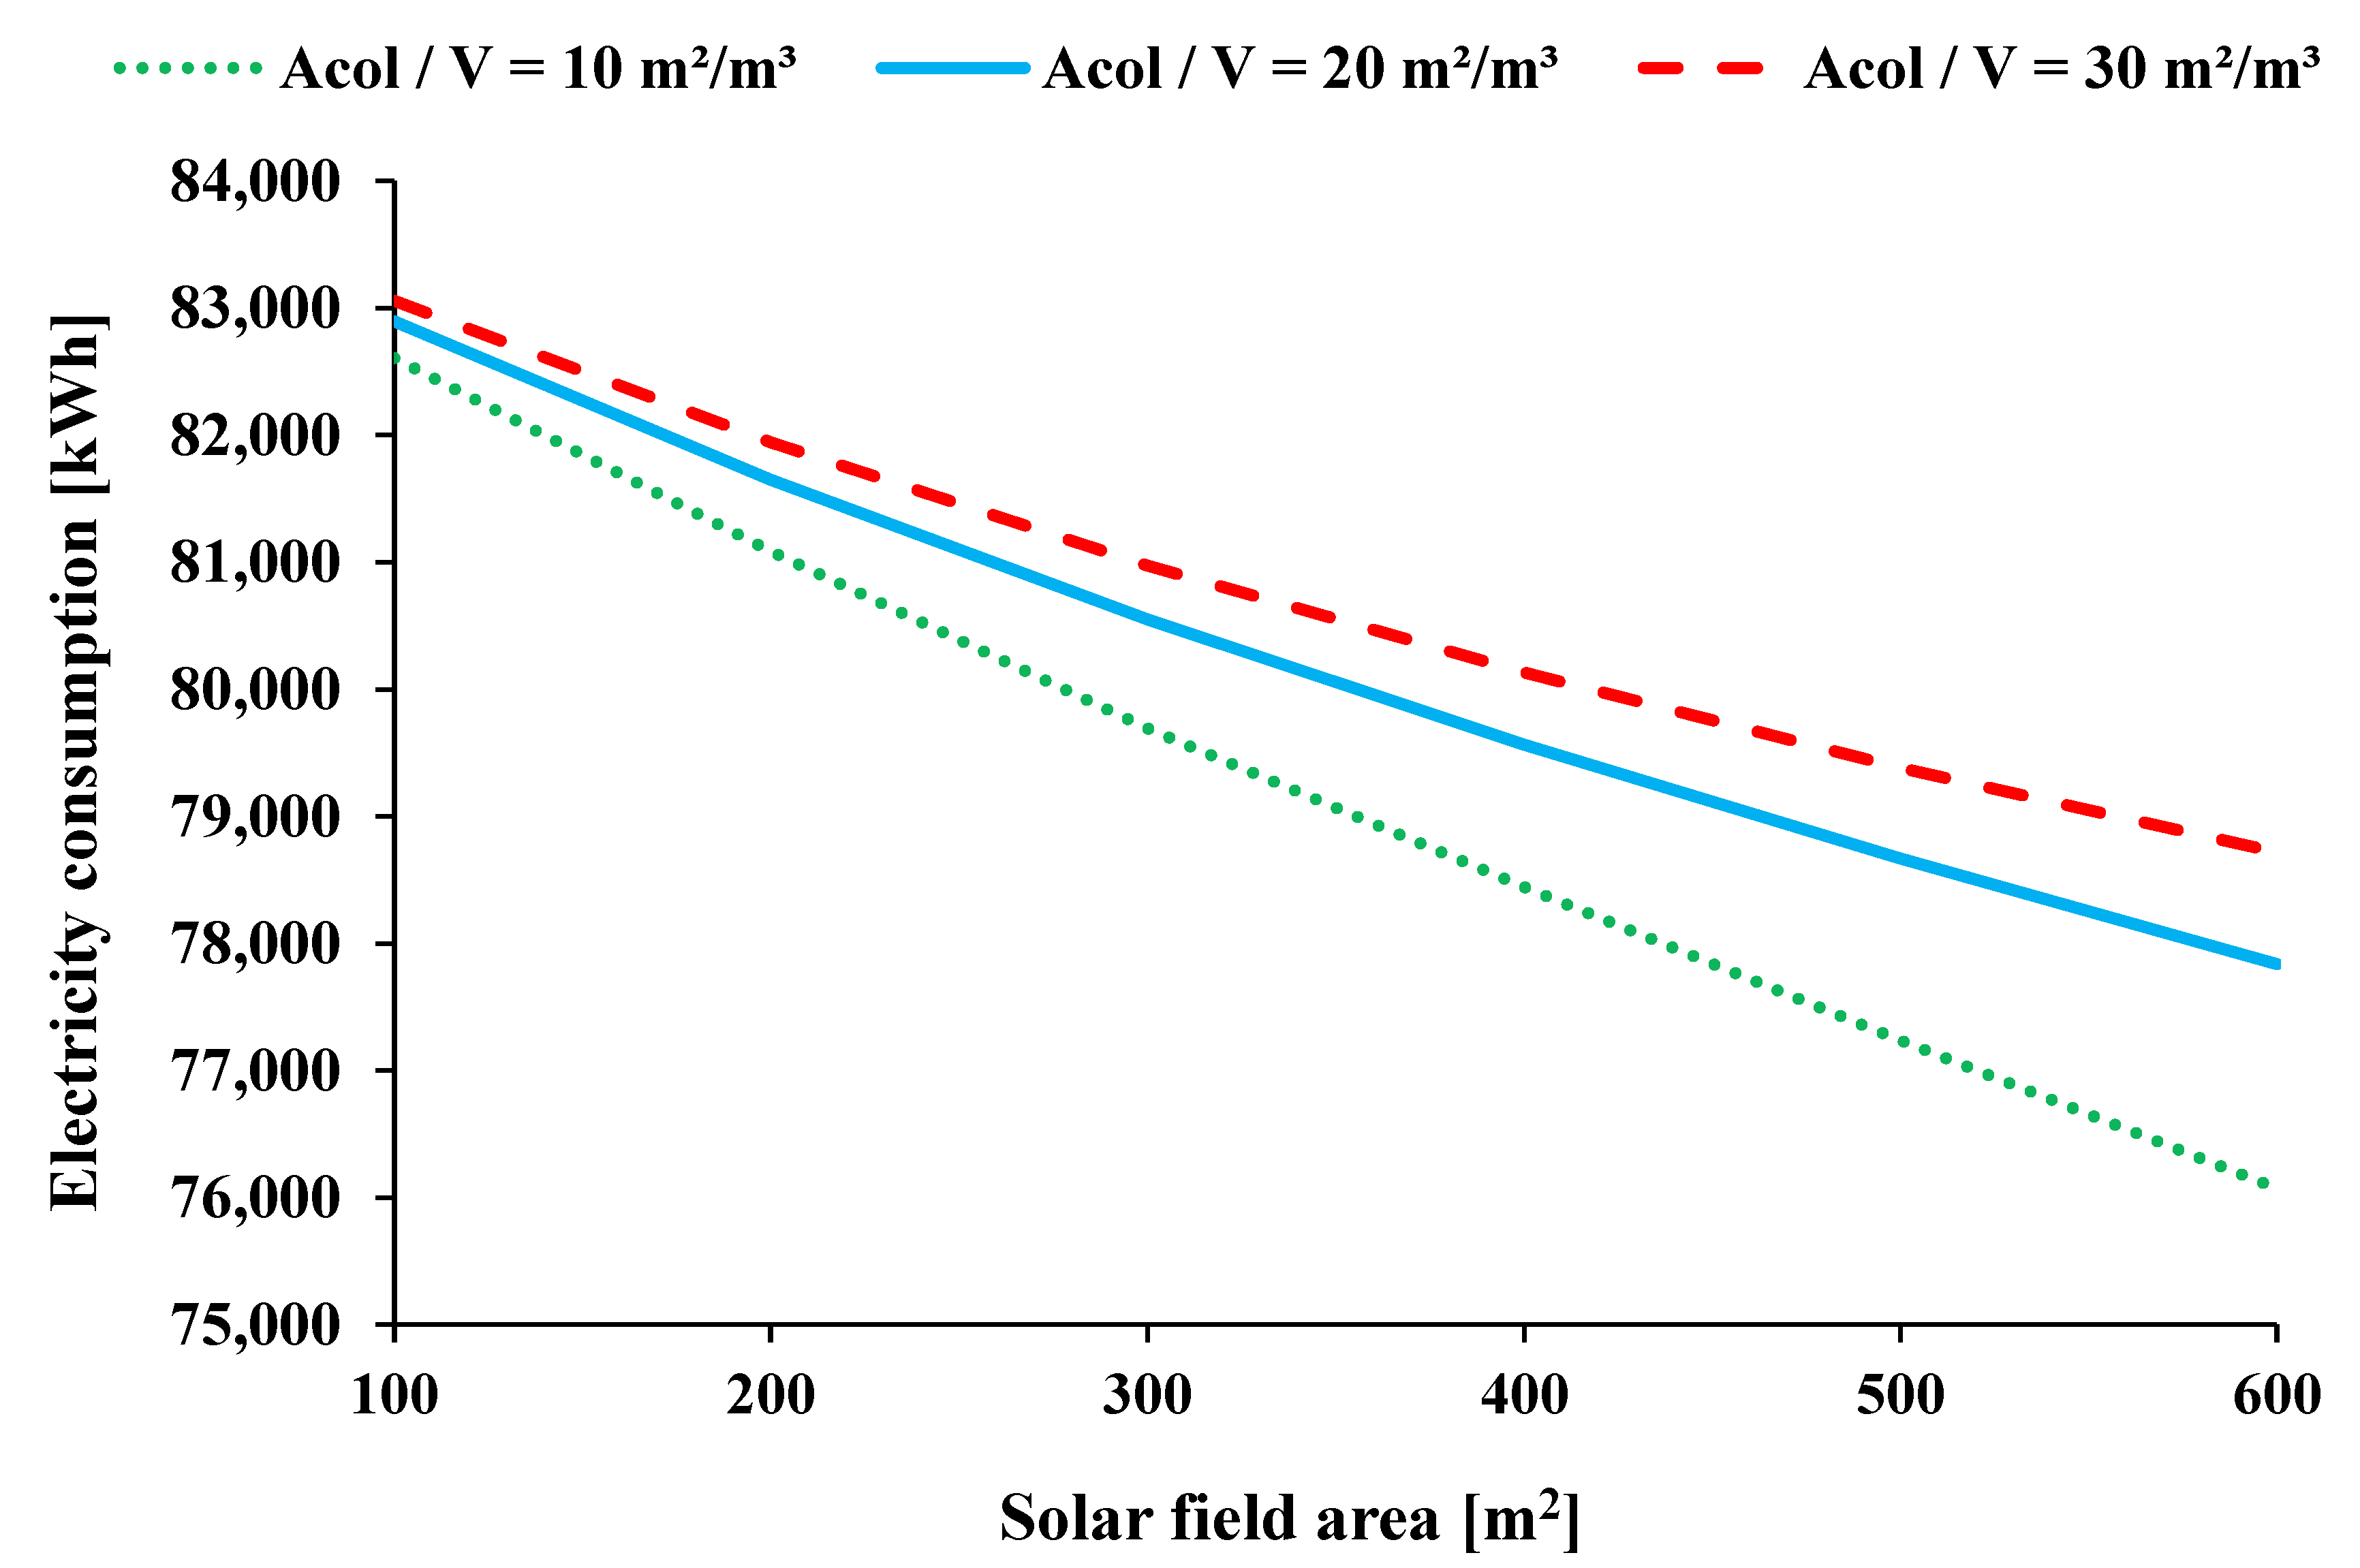
Figure 21 illustrates the impact of the collecting area on the electricity consumption of the heat pump on an annual basis for different ratios (A
col/V). It was found that the increase in the collecting area leads to a lower electricity demand, which is a reasonable result as the greater collecting area increases the mean water tank temperature and, consequently, the HP’s COP. Practically, higher water temperatures enable the rise in evaporator temperature, and therefore, the compressor of the HP has a lower pressure lift, and the COP increases. Moreover, this figure indicates that the lower ratio (A
col/V) and greater tank volume result in a decreased electricity demand. This is, in general, justified by the fact that a greater thermal storage capacity may enable the storage of larger hot water quantities when there is an adequate amount of solar irradiation available. According to such results, the annual electricity consumption ranges from 76,072 up to 82,606 kWh for (A
col/V = 10 m
2/m
3), from 77,836 up to 82,895 kWh for (A
col/V = 20 m
2/m
3) and from 78,717 up to 83,057 kWh for (A
col/V = 30 m
2/m
3).
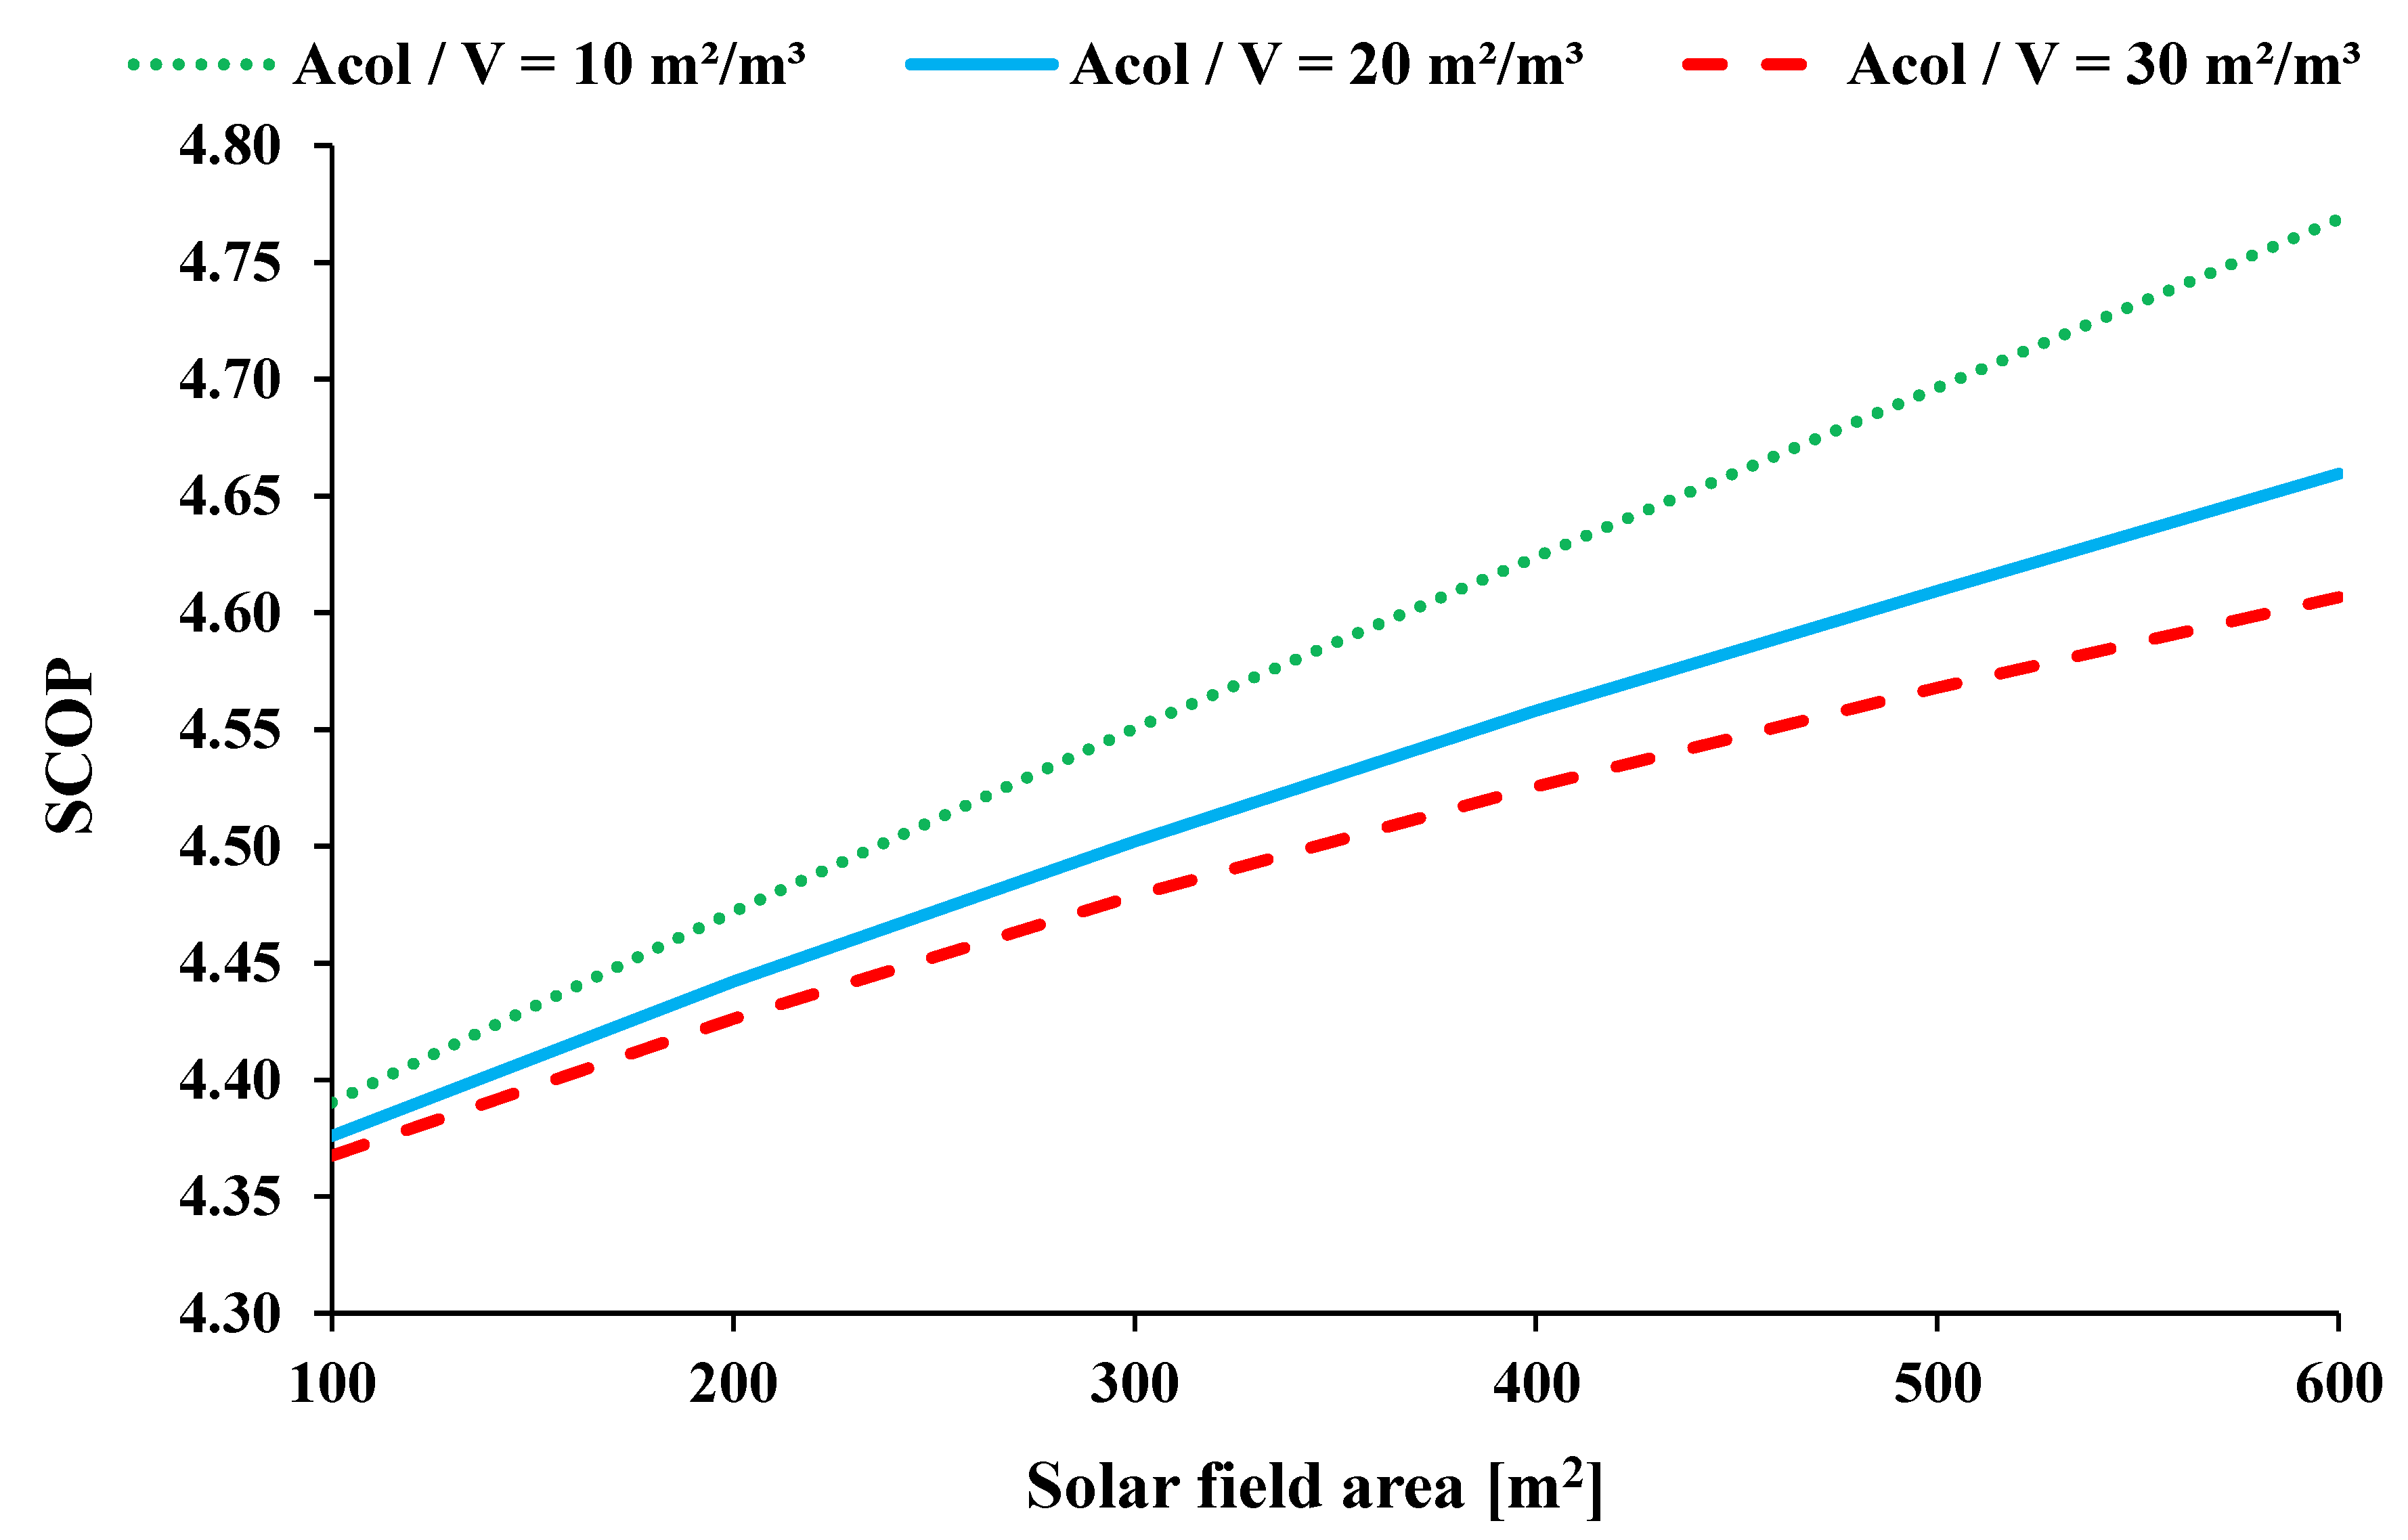
Figure 22 shows the SCOP, which increases in proportion to the collecting area and the ratio (A
col/Vc). Practically, the SCOP has a reverse behavior relative to the annual electricity consumption. This is reasonable based on the definition of SCOP, which is the ratio of the heating energy load (constant for all cases) to the annual electricity demand. Specifically, the SCOP ranges from 4.39 up to 4.77 for (A
col/V = 10 m
2/m
3), from 4.38 up to 4.66 (A
col/V = 20 m
2/m
3), and from 4.37 up to 4.61 for (A
col/V = 30 m
2/m
3).
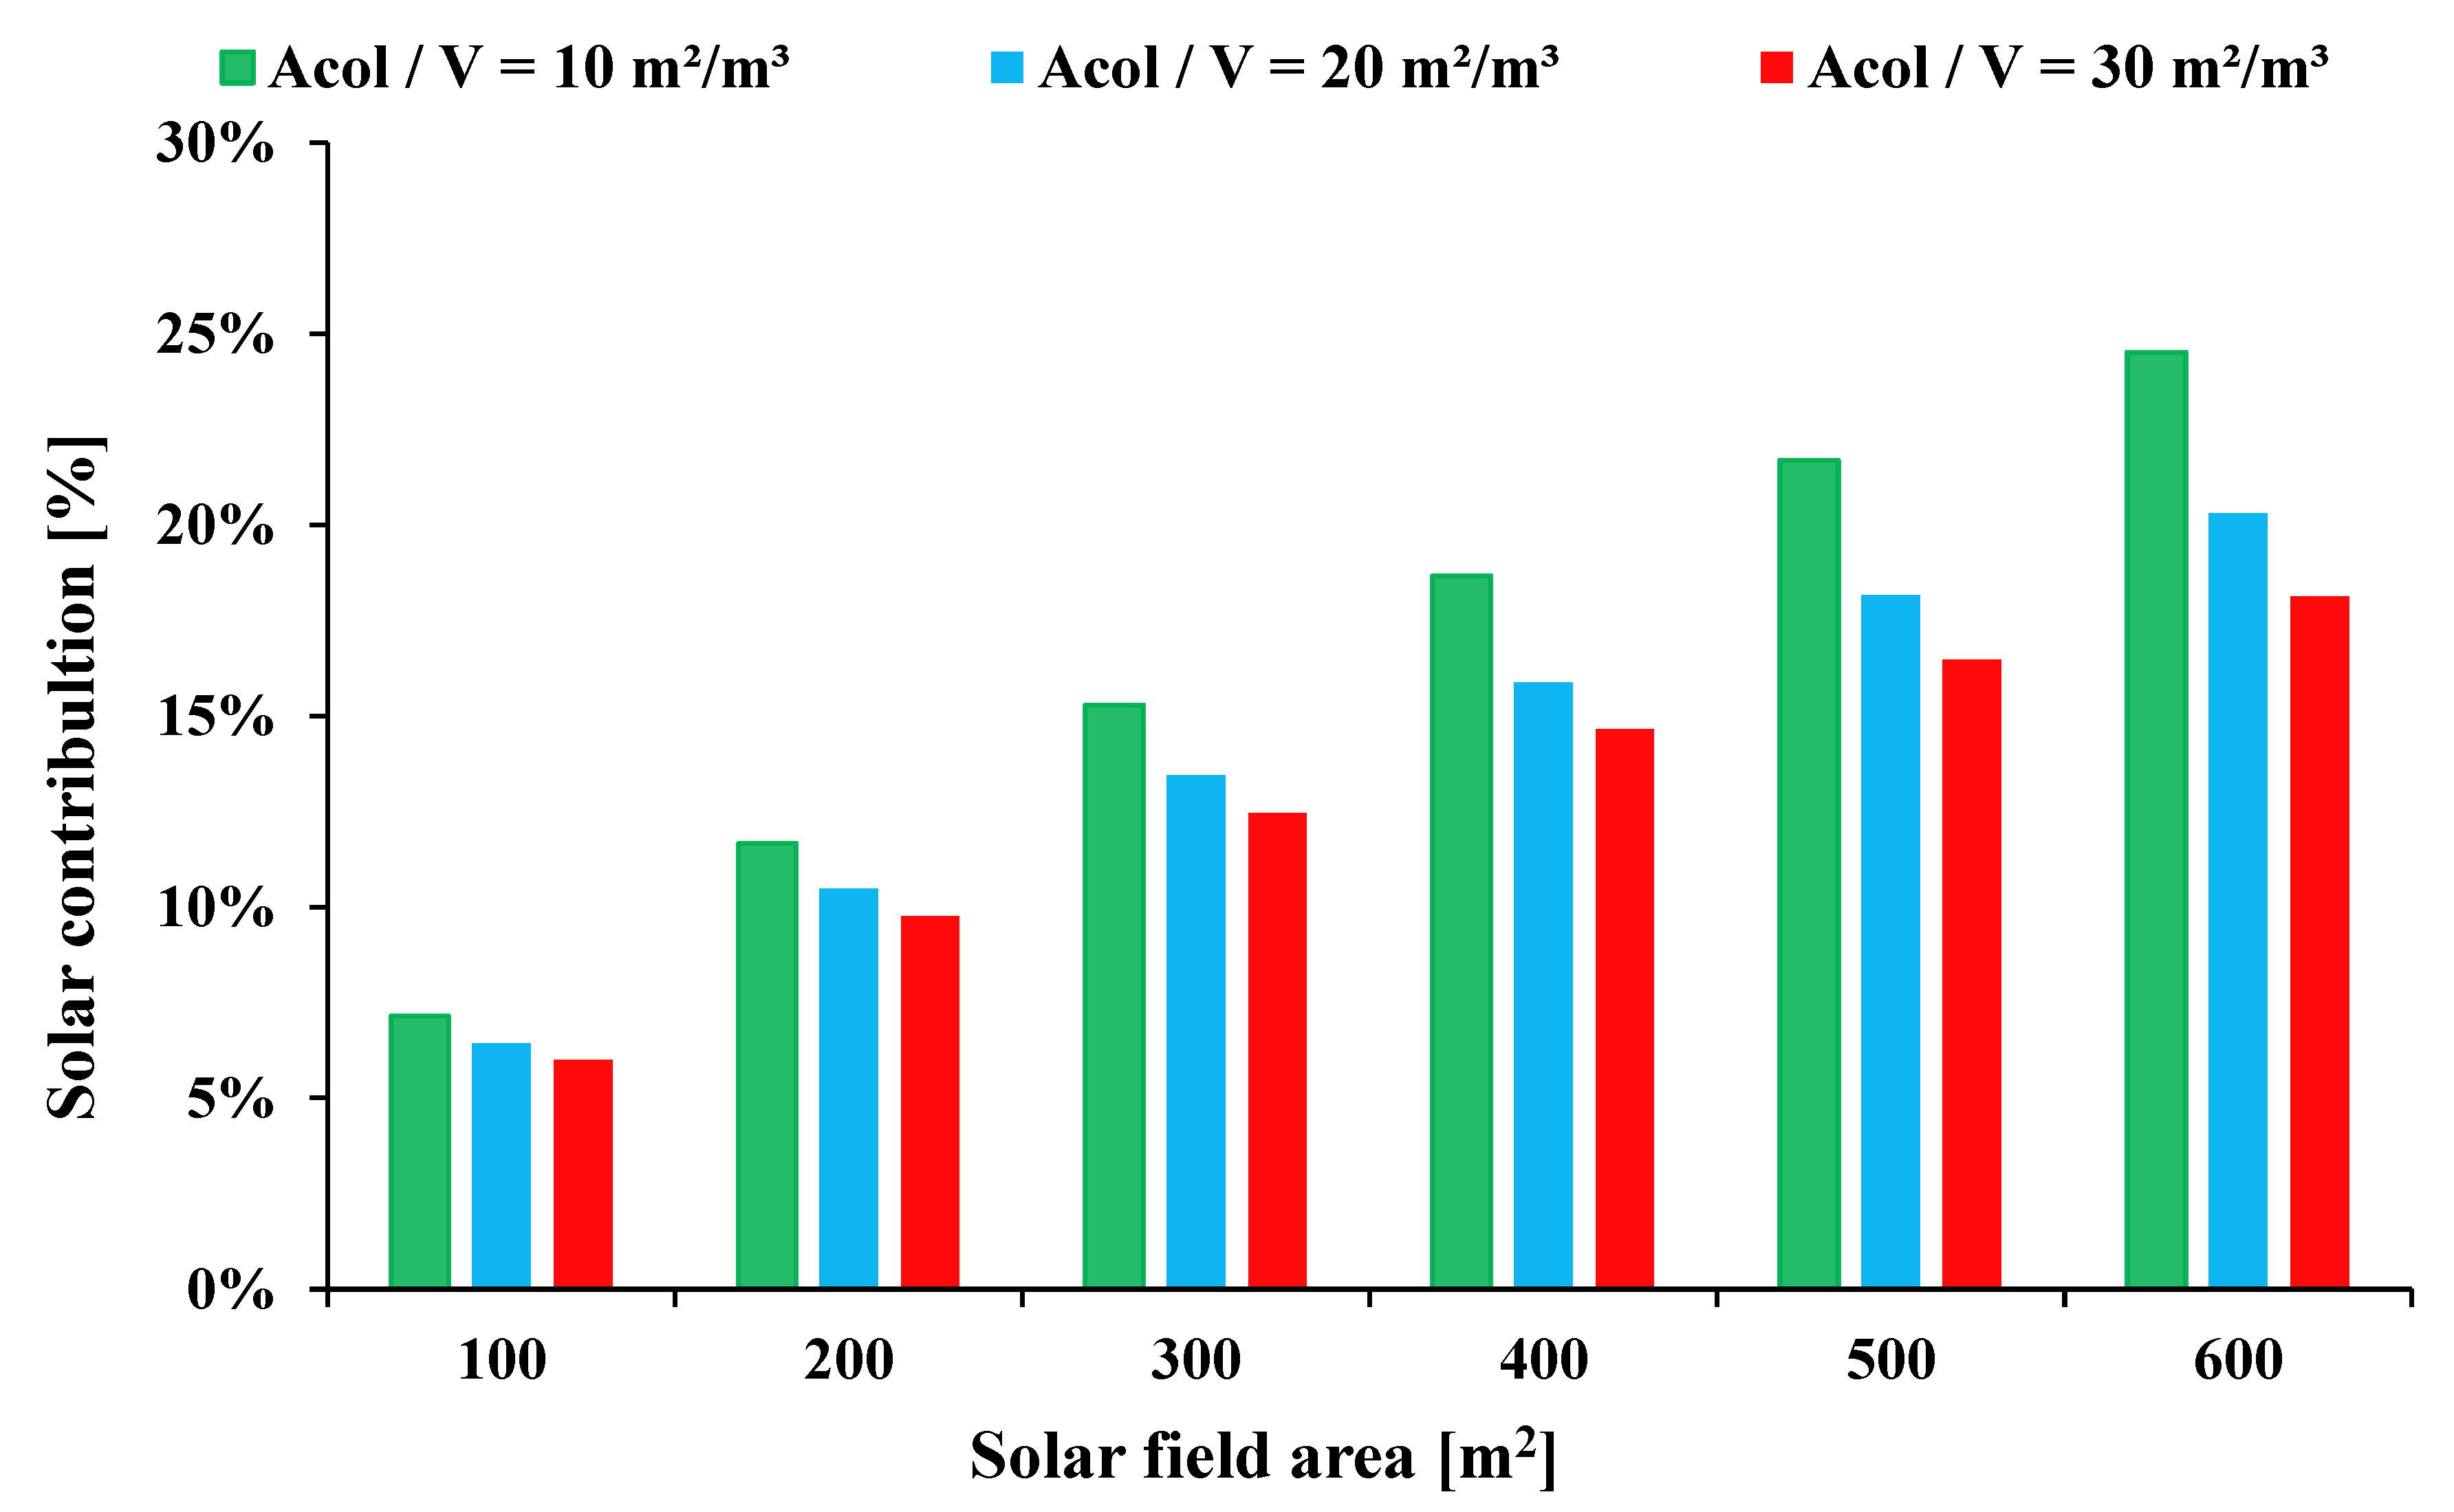
Figure 23 depicts the contribution of the solar system to the HP’s driving heat input. The reported numbers are influenced by the examined scenario (collecting area and tank volume) as well as by the selected control strategy, which is presented in the methodology section. The solar contribution increases when the collecting area increases and a lower ratio (A
col/V) is used. The results indicate that a greater storage tank volume enables a more effective exploitation of solar thermal energy. According to the reported results, the solar contribution varies from 7.16% to 24.52% for (A
col/V = 10 m
2/m
3), from 6.42% to 20.30% for (A
col/V = 20 m
2/m
3), and from 6.00% to 18.13% for (A
col/V = 30 m
2/m
3).
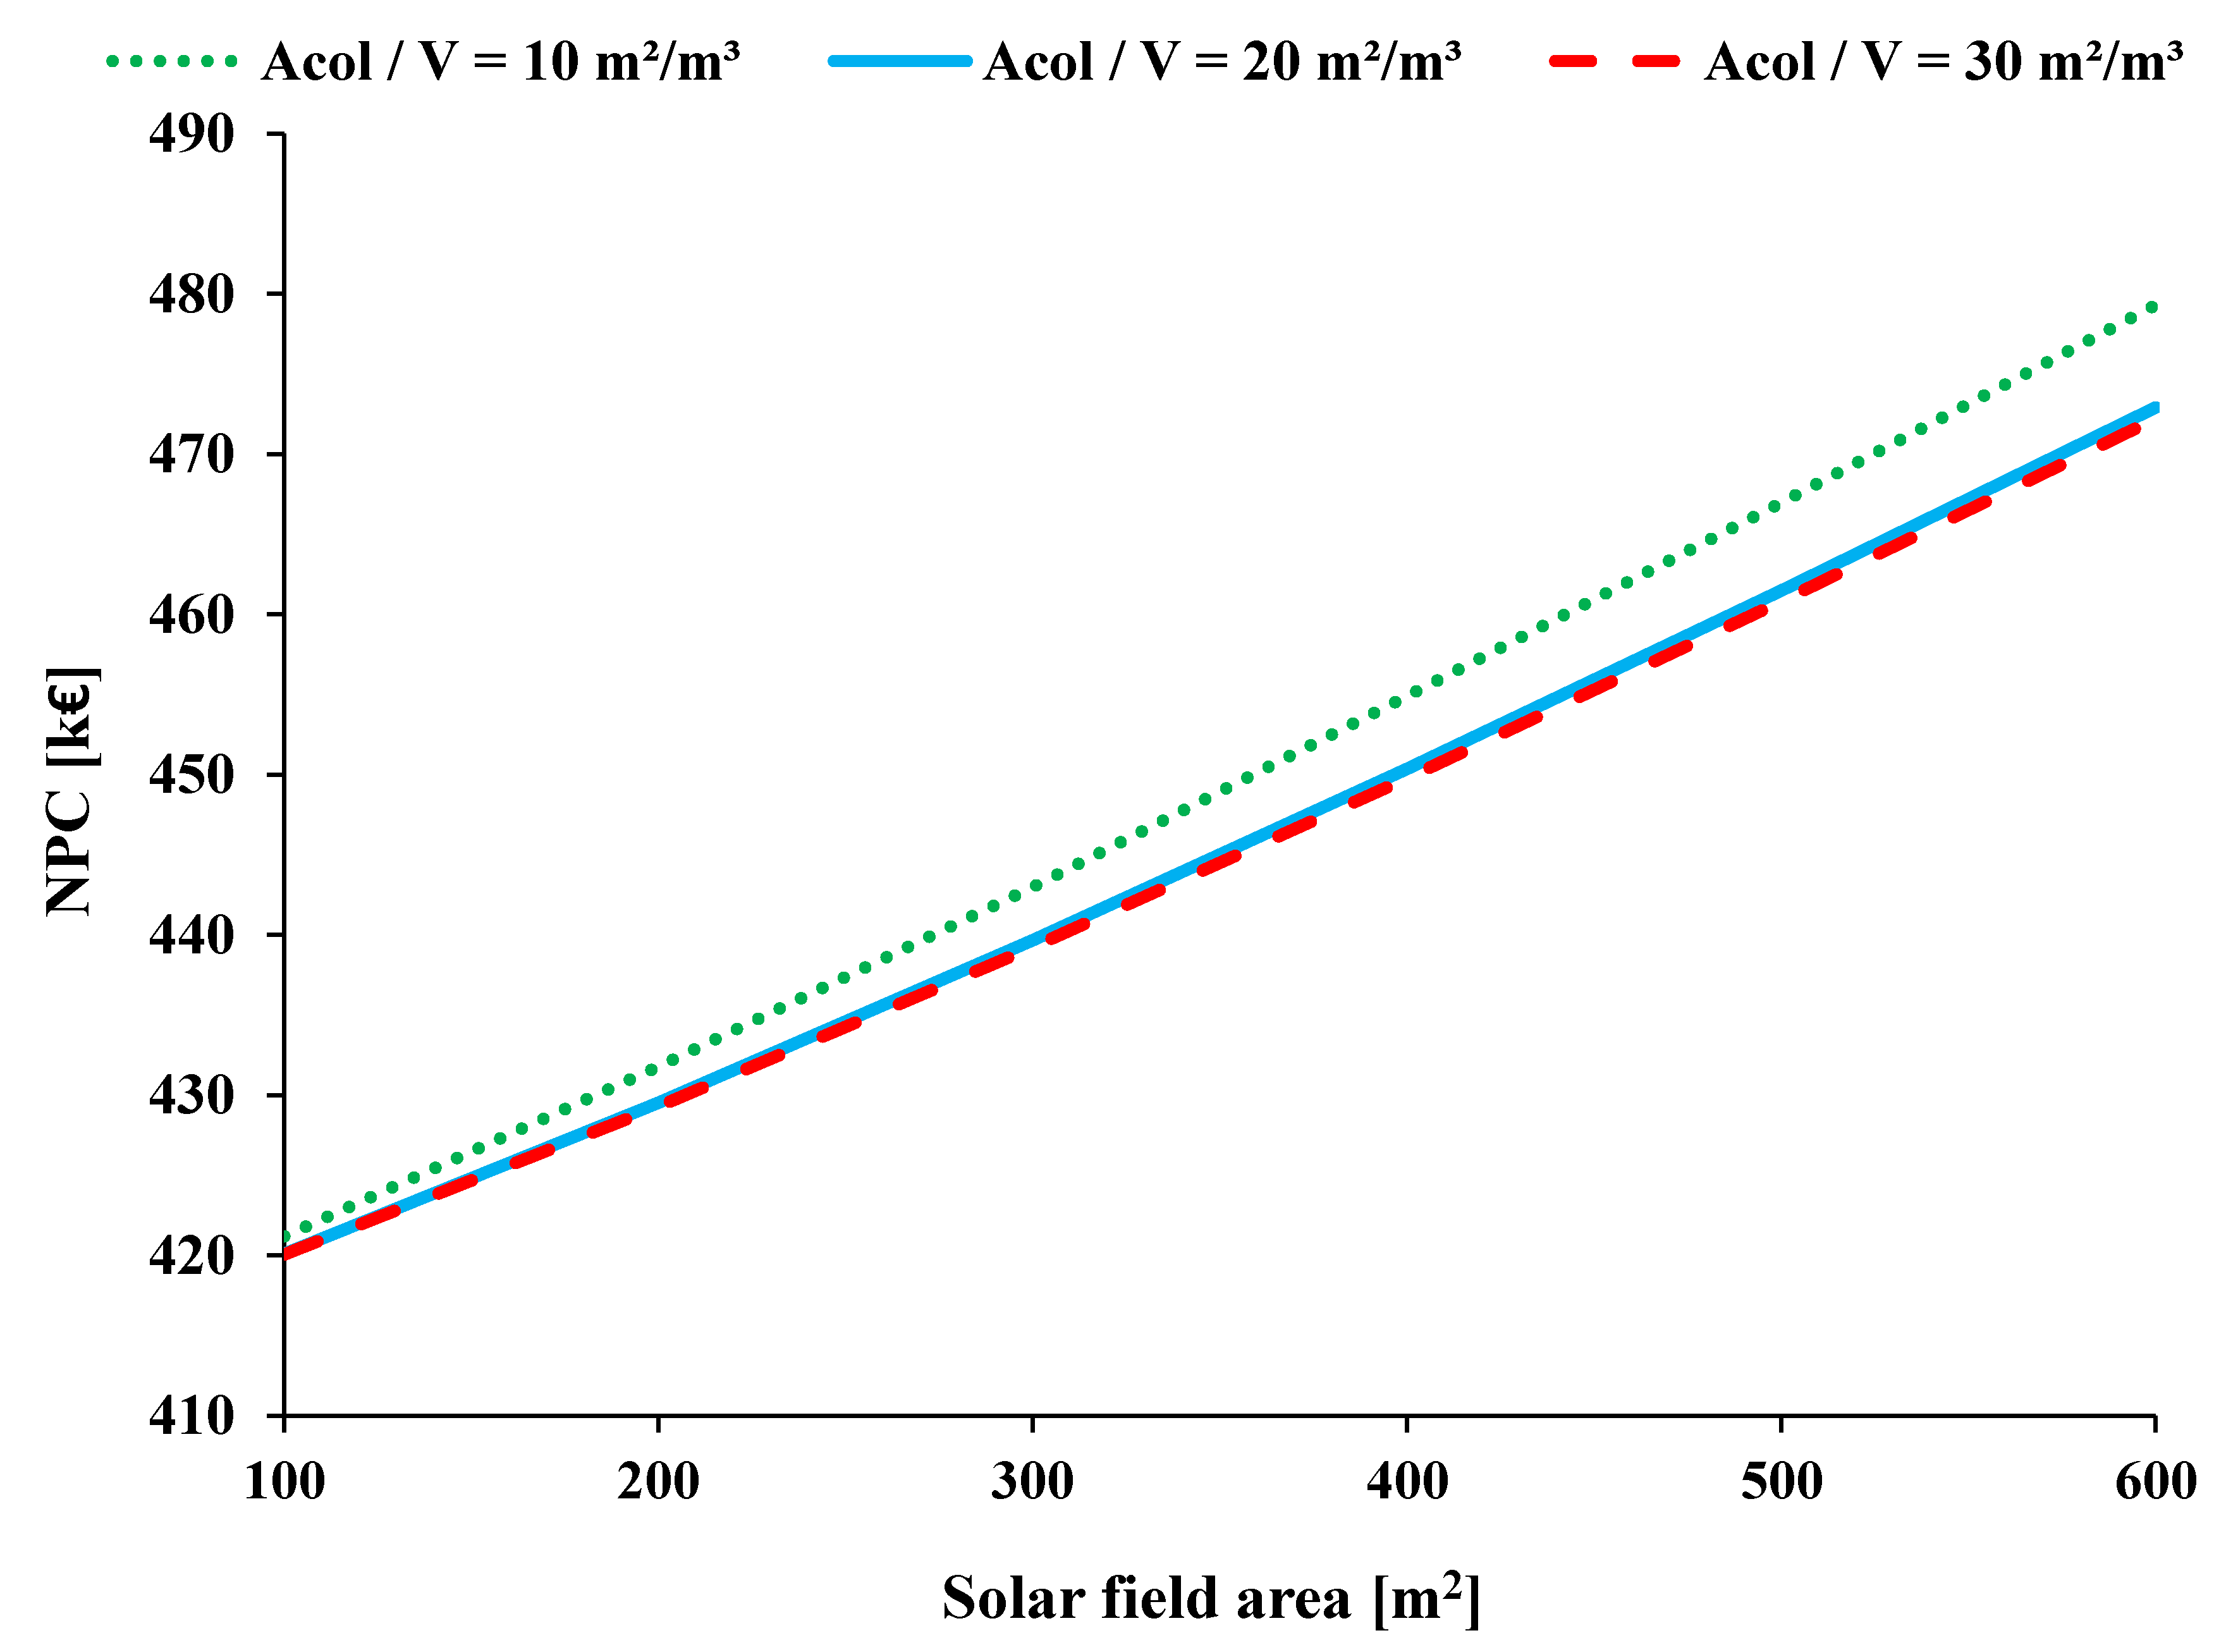
The NPC considers both the initial investment cost of the solar field and storage tank, as well as the operating cost of the HP over its lifetime.
Figure 24 depicts the NPC for the examined cases. The increase in (A
col) leads to a significant increase in the NPC, whereas the increase in the ratio (A
col/V) leads to a slight reduction in the NPC. Therefore, the rise in the (A
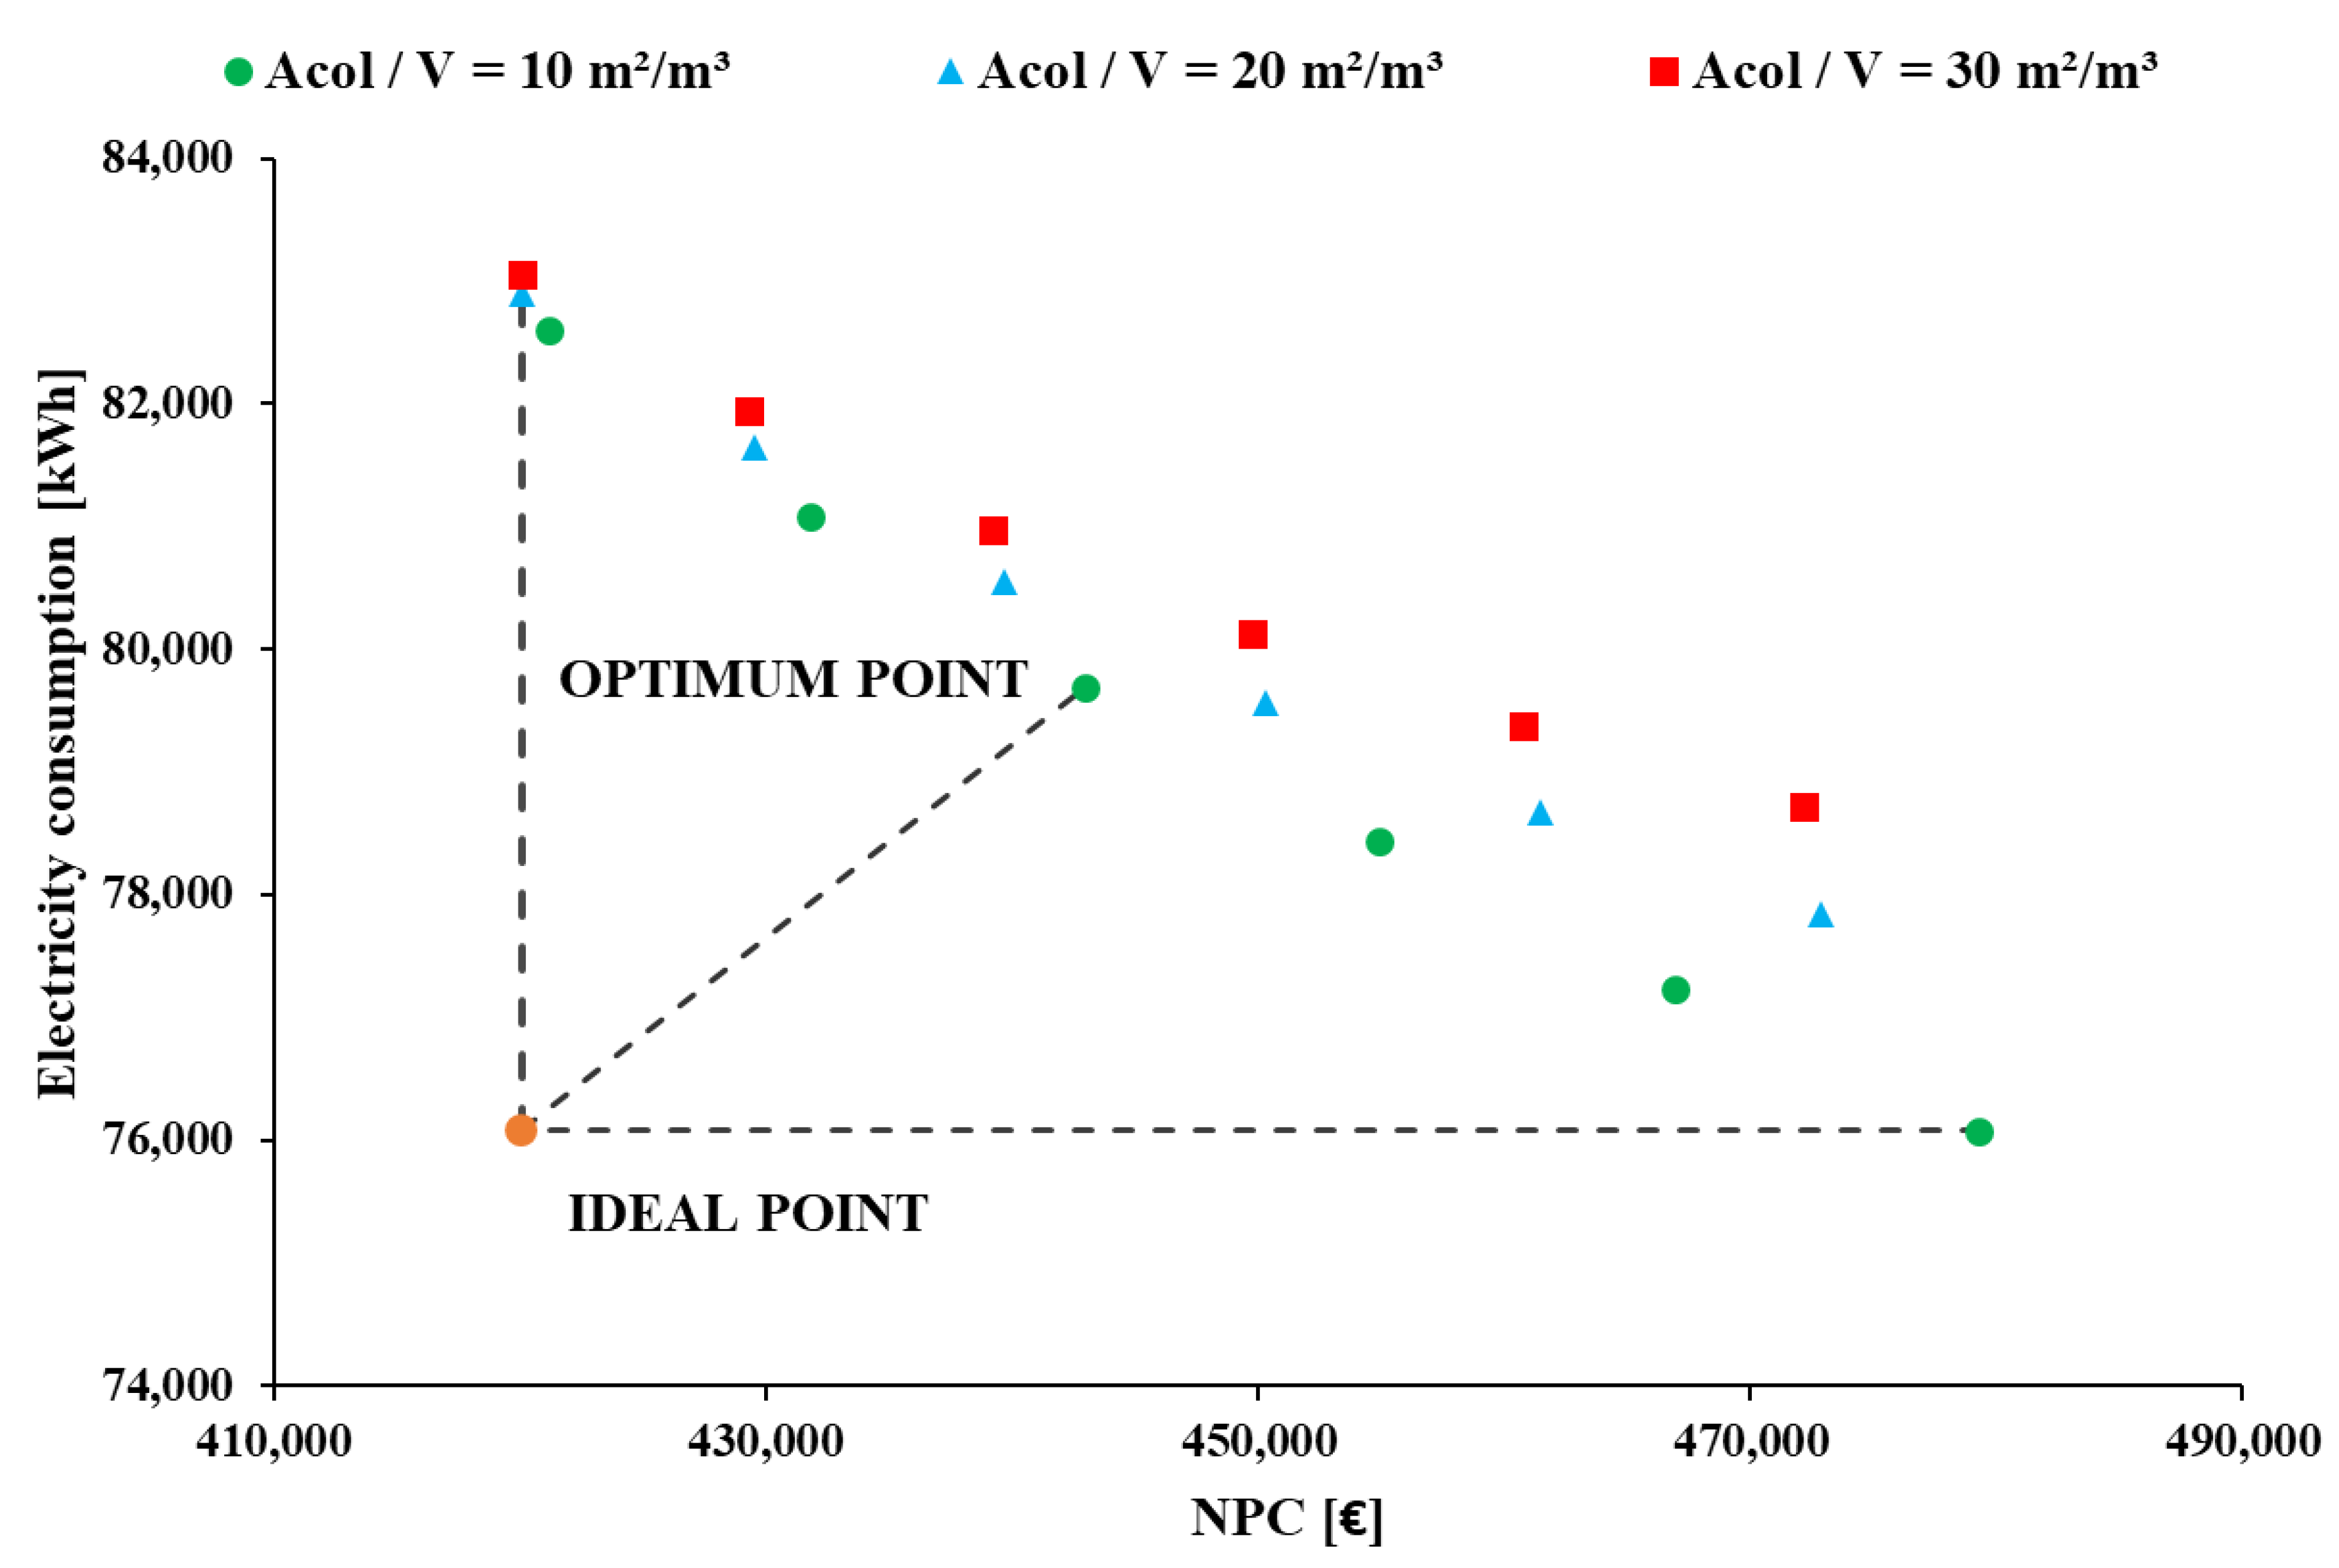
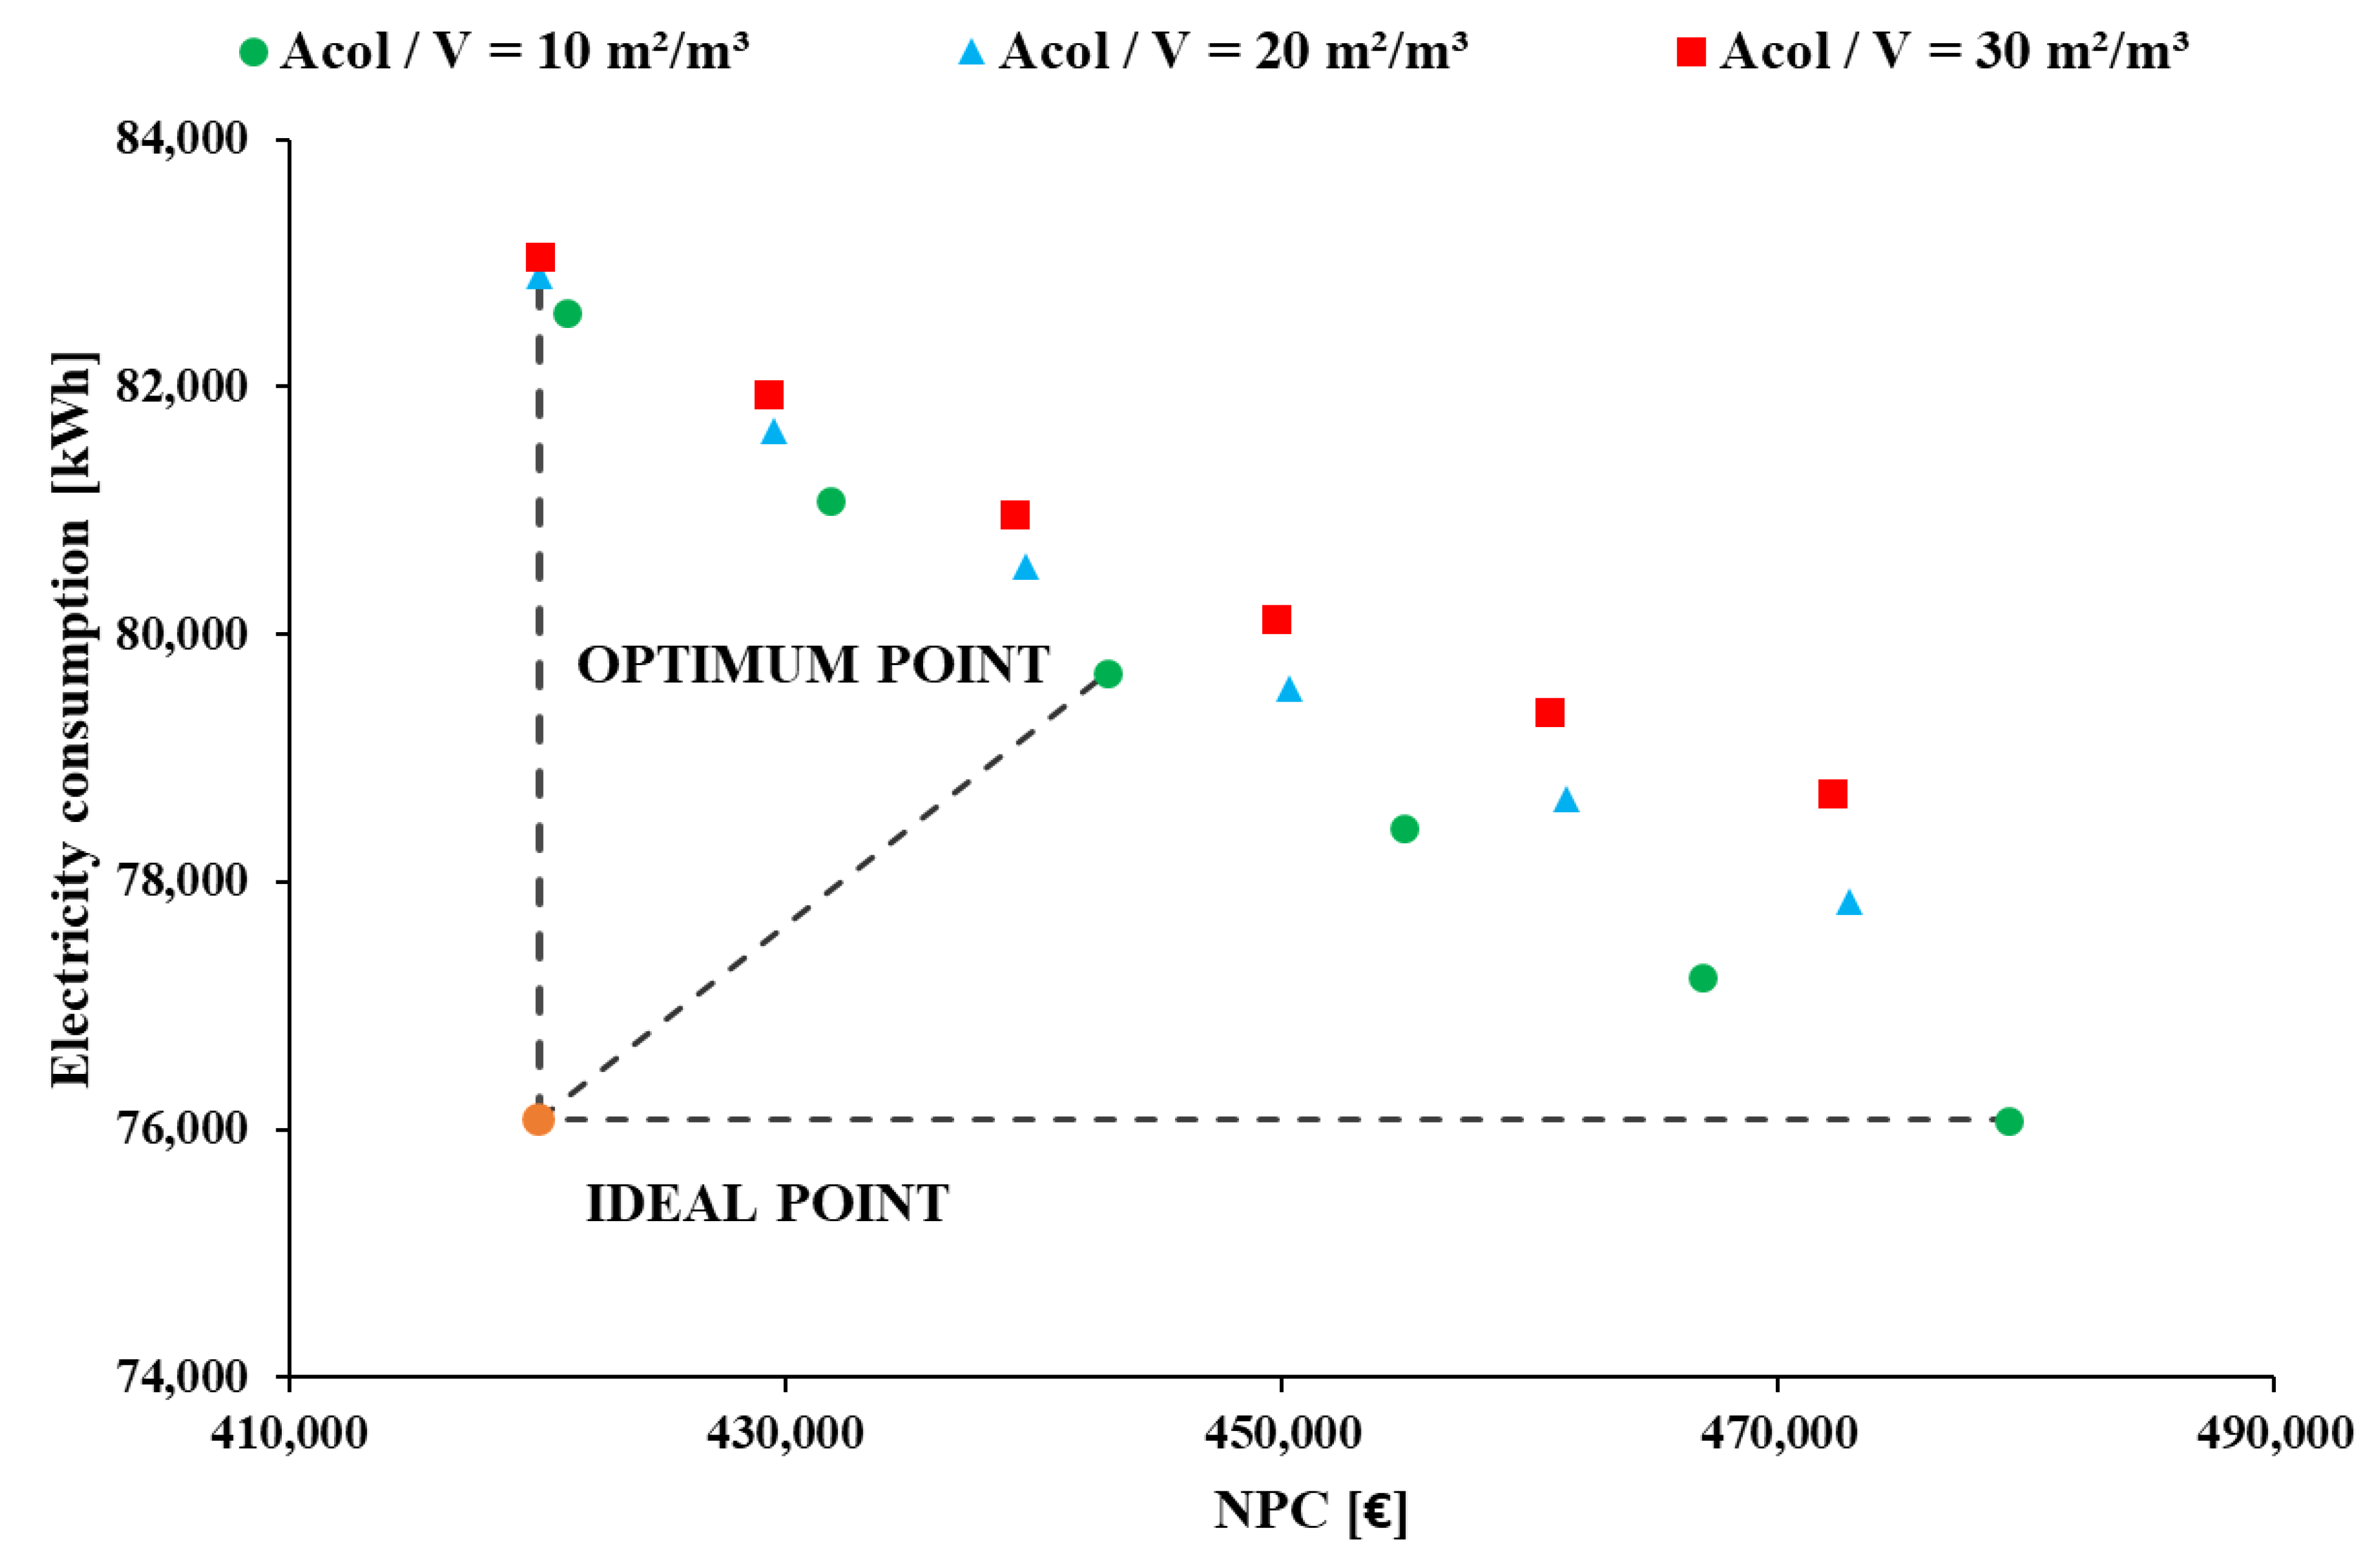
col) leads to higher NPC and simultaneously to lower annual electricity consumption. Moreover, according to the energy analysis, the optimum ratio is the lowest one, while the economic analysis indicates the maximum one is the best choice. Thus, there is a need for a more detailed analysis that takes into consideration both energy and economic criteria to determine the global optimum design. In this direction, a multi-objective evaluation process is performed, as depicted in
Figure 25. In this analysis, the dimensionless electricity demand and the dimensionless NPC are desired to be minimum. The global optimum design is the one with the lowest dimensionless distance from the “ideal point”. The minimization procedure indicates that the design with A
col = 300 m
2 and A
col/V = 10 m
2/m
3 (or V = 30 m
3) is the optimum. In this scenario, the annual electricity demand is calculated as being 79,692 kWh, the SCOP as being 4.55, the solar contribution as being 15.29% and the NPC as being 443 kEUR.
3.4. Case 4: Triple-Source Heat Pump (Solar, Ground and Air)
The triple-source HP extends the idea of the dual-source HP (solar and air) by adding the geothermal heat source into the water storage tank. This concept aims to enhance the quality of water’s heat contribution to the evaporator by exploiting the geothermal heat input in the water tank when the solar potential is not sufficient. In this case, the contribution of the air source is reduced, the mean heat input temperature is increased, and the COP is enhanced. This unit is examined here parametrically and optimized by using four different variables; namely, (i) the collecting area (Acol), (ii) the ratio of the collecting area to the tank volume (Acol/V), (iii) geothermal piping length (L), and (iv) the depth of the geothermal field. Practically, the four parameters are the two parameters of the dual-source HP design and the two parameters of the ground-source HP design. Therefore, the triple-source design is the most complex among those examined here because it is characterized by a greater degree of optimization freedom. Parametric figures are given to determine the impact of the different design parameters on the results. For simplicity reasons, the ratio (Acol/V) was selected to be 10 m2/m3 in the parametric analysis.
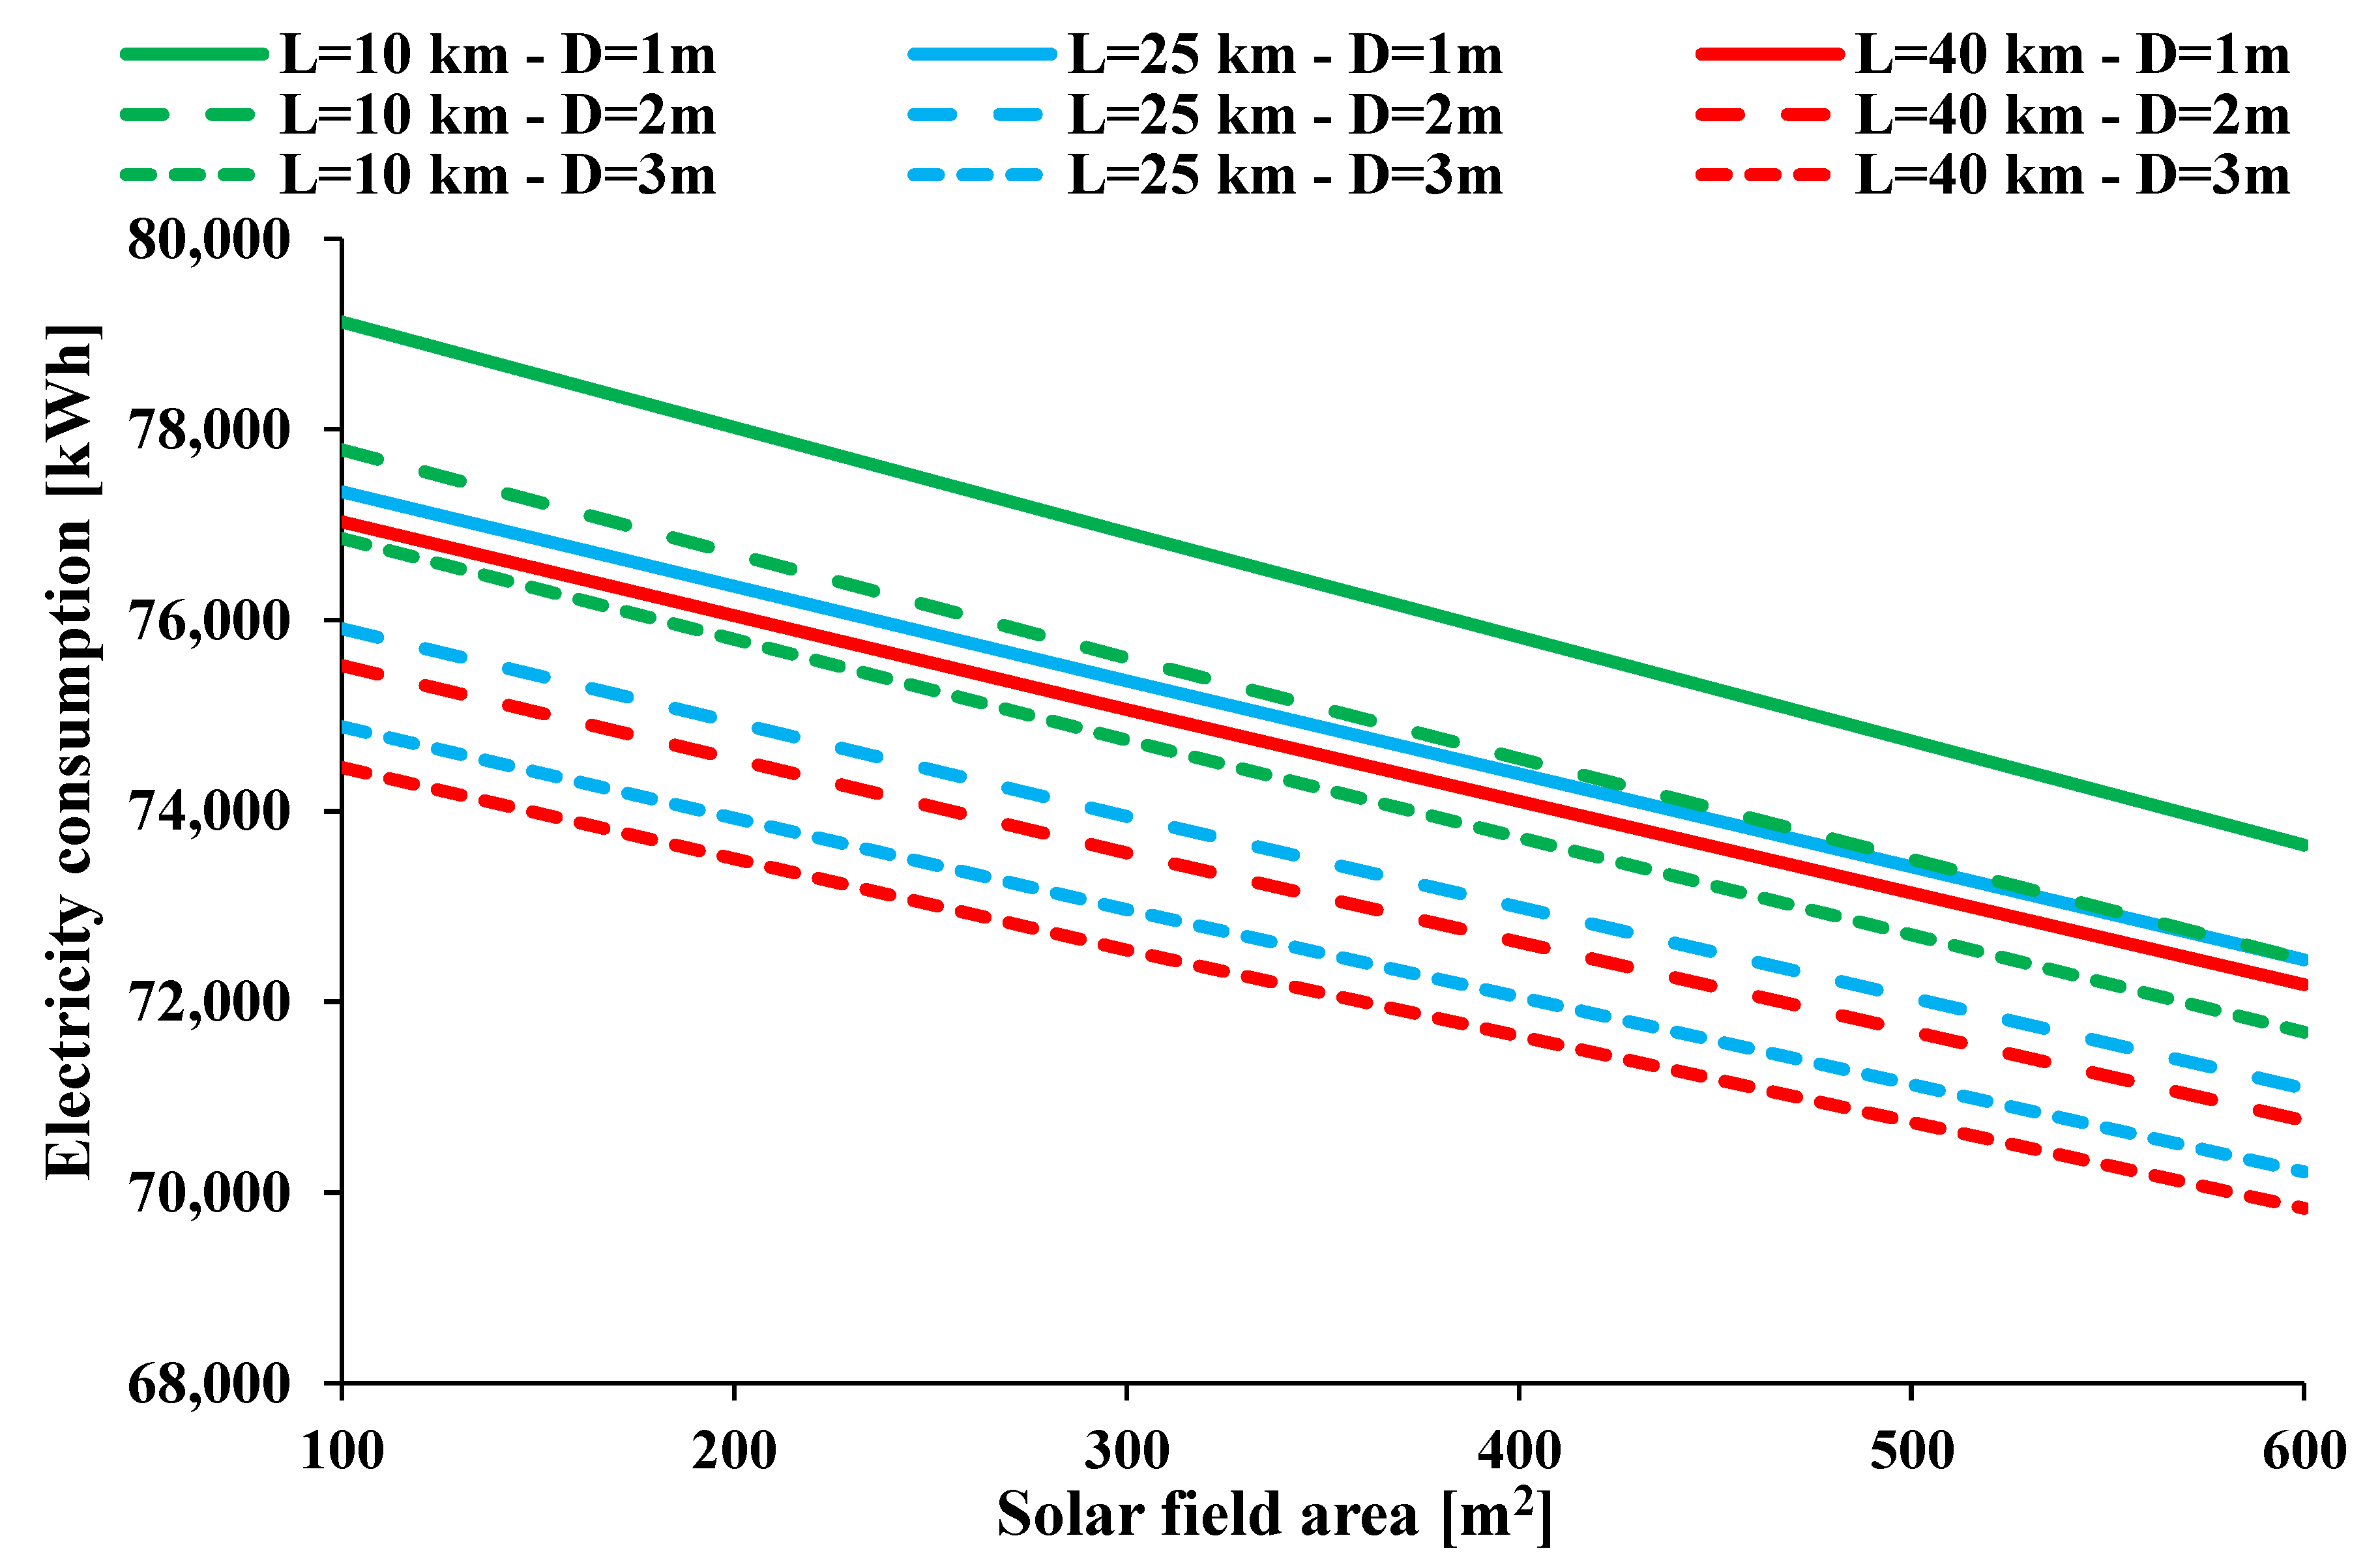
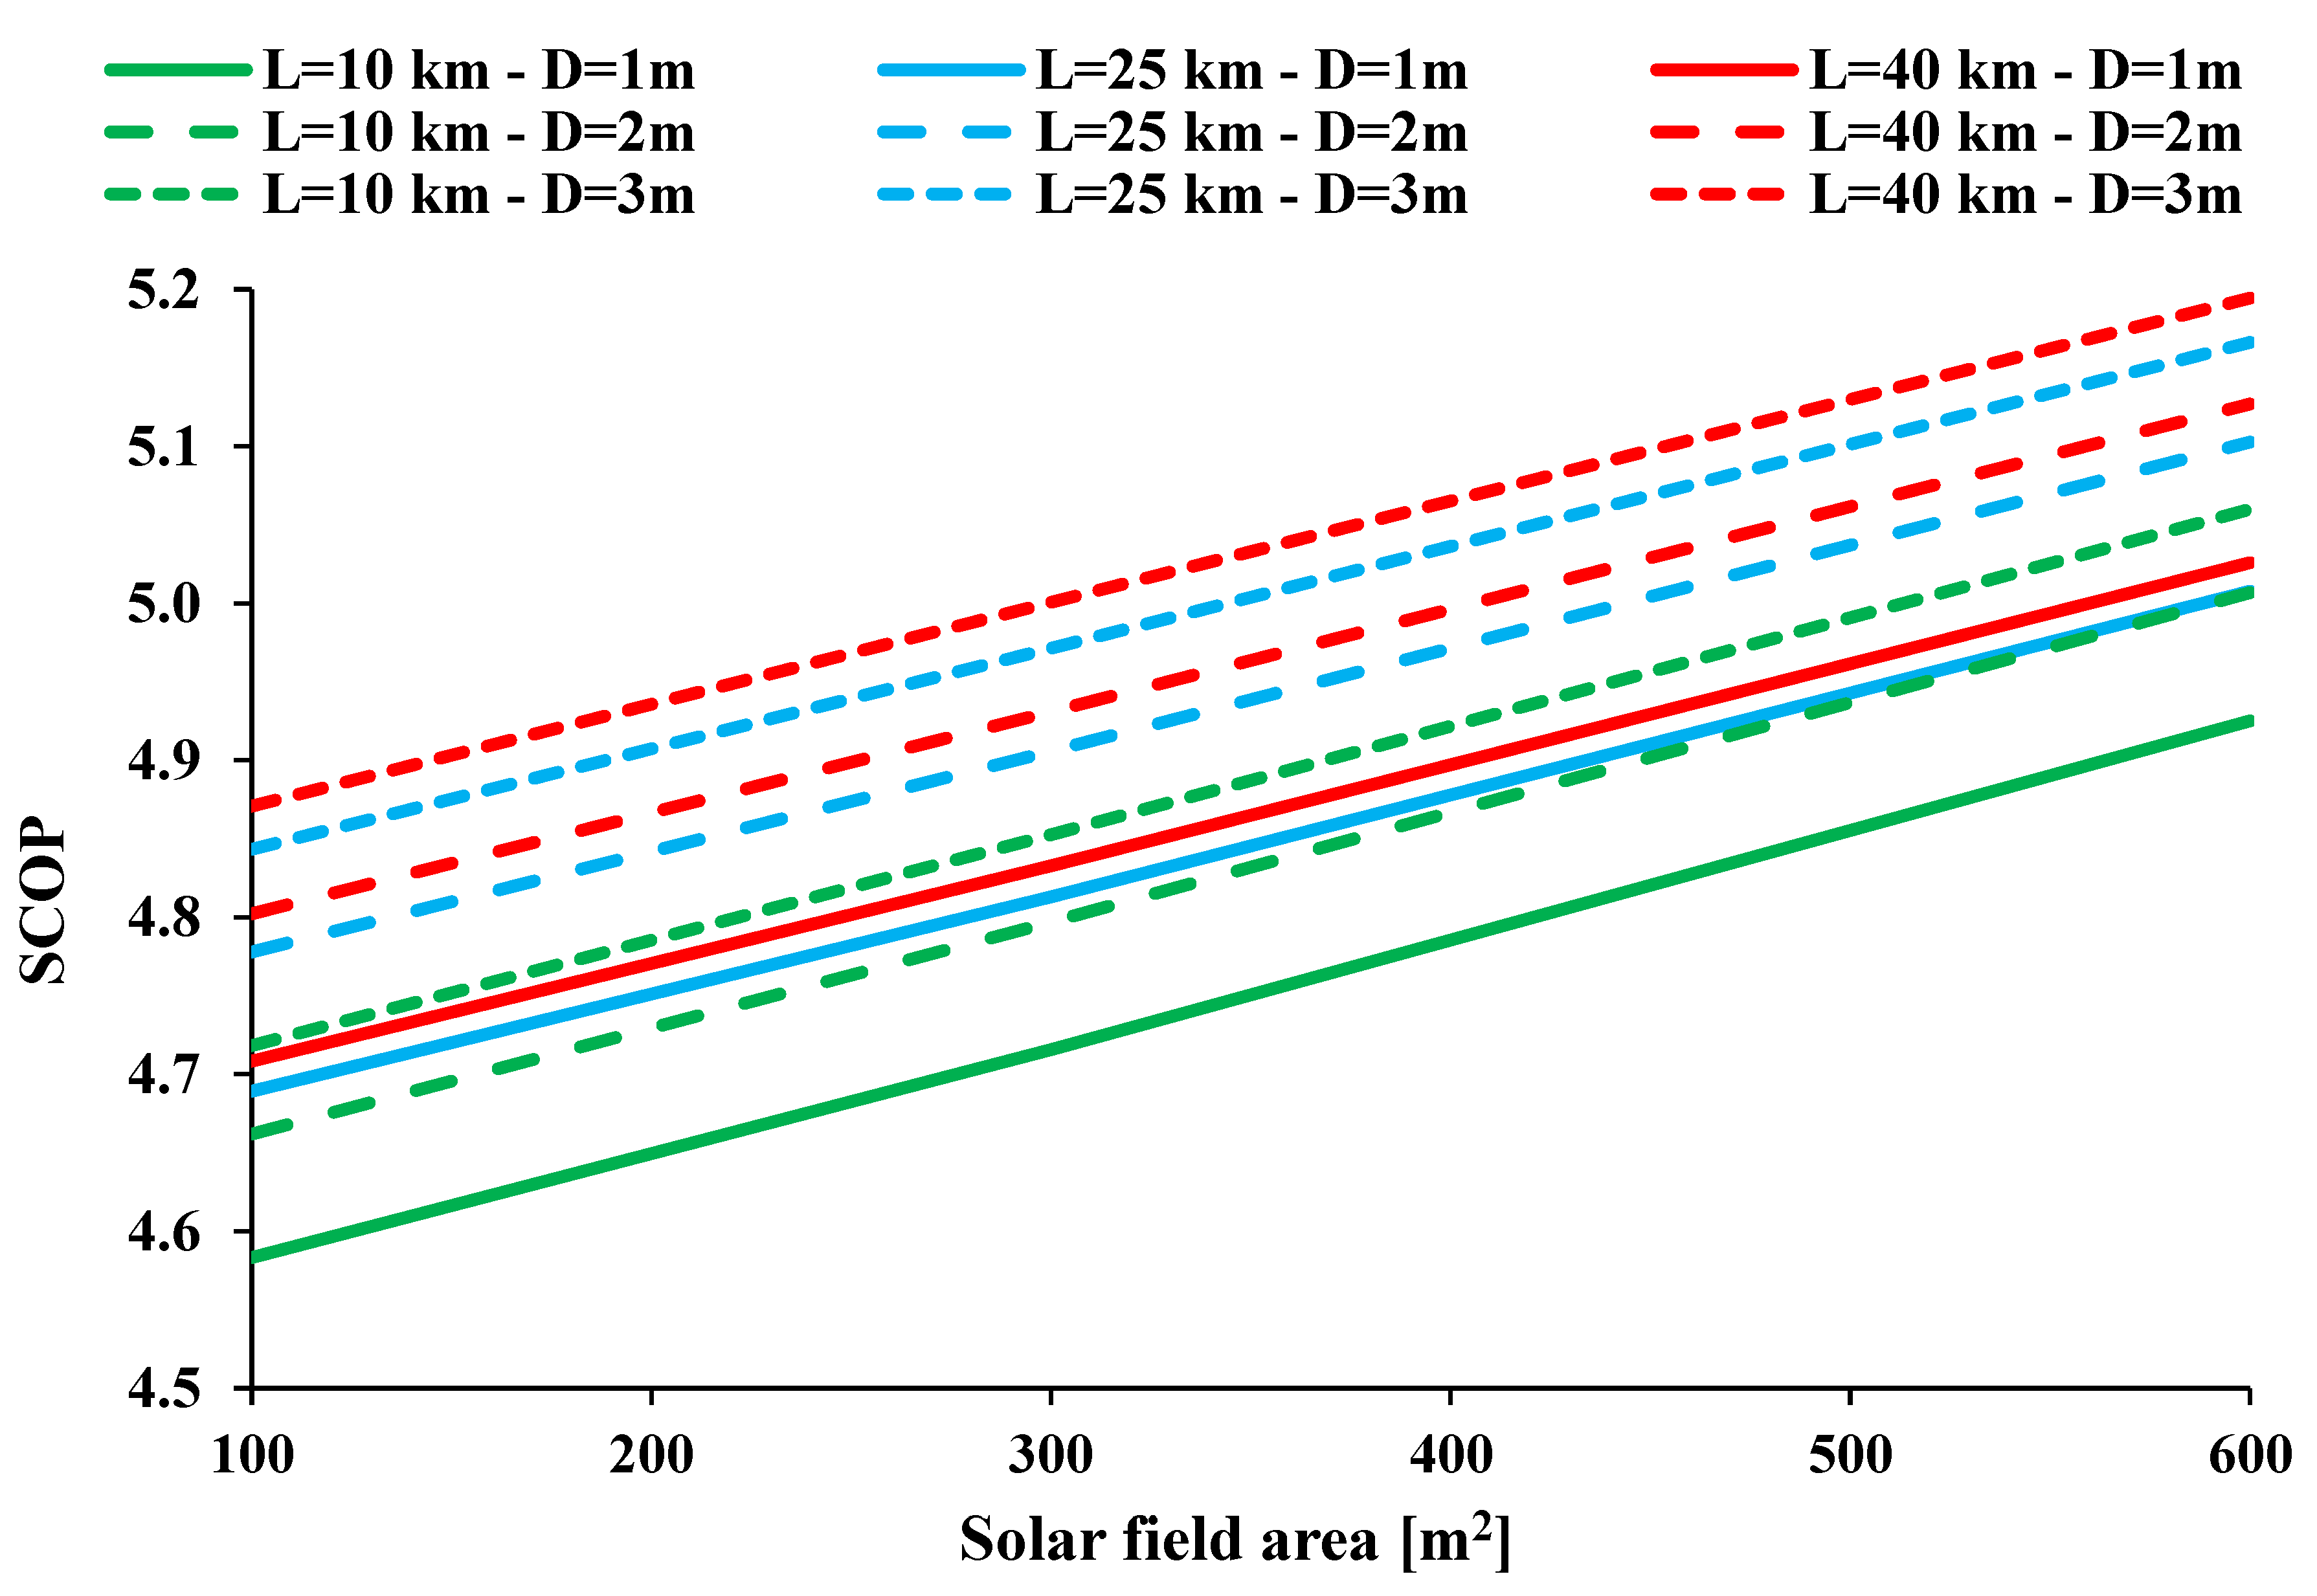
Figure 26 shows the annual electricity demand for the triple-source HP system. It is obvious that a higher collecting area, higher piping length and higher depth lead to lower electricity demand, which is reasonable given the higher heat input in the thermal tank. Consequently, the SCOP increases, as illustrated in
Figure 27.
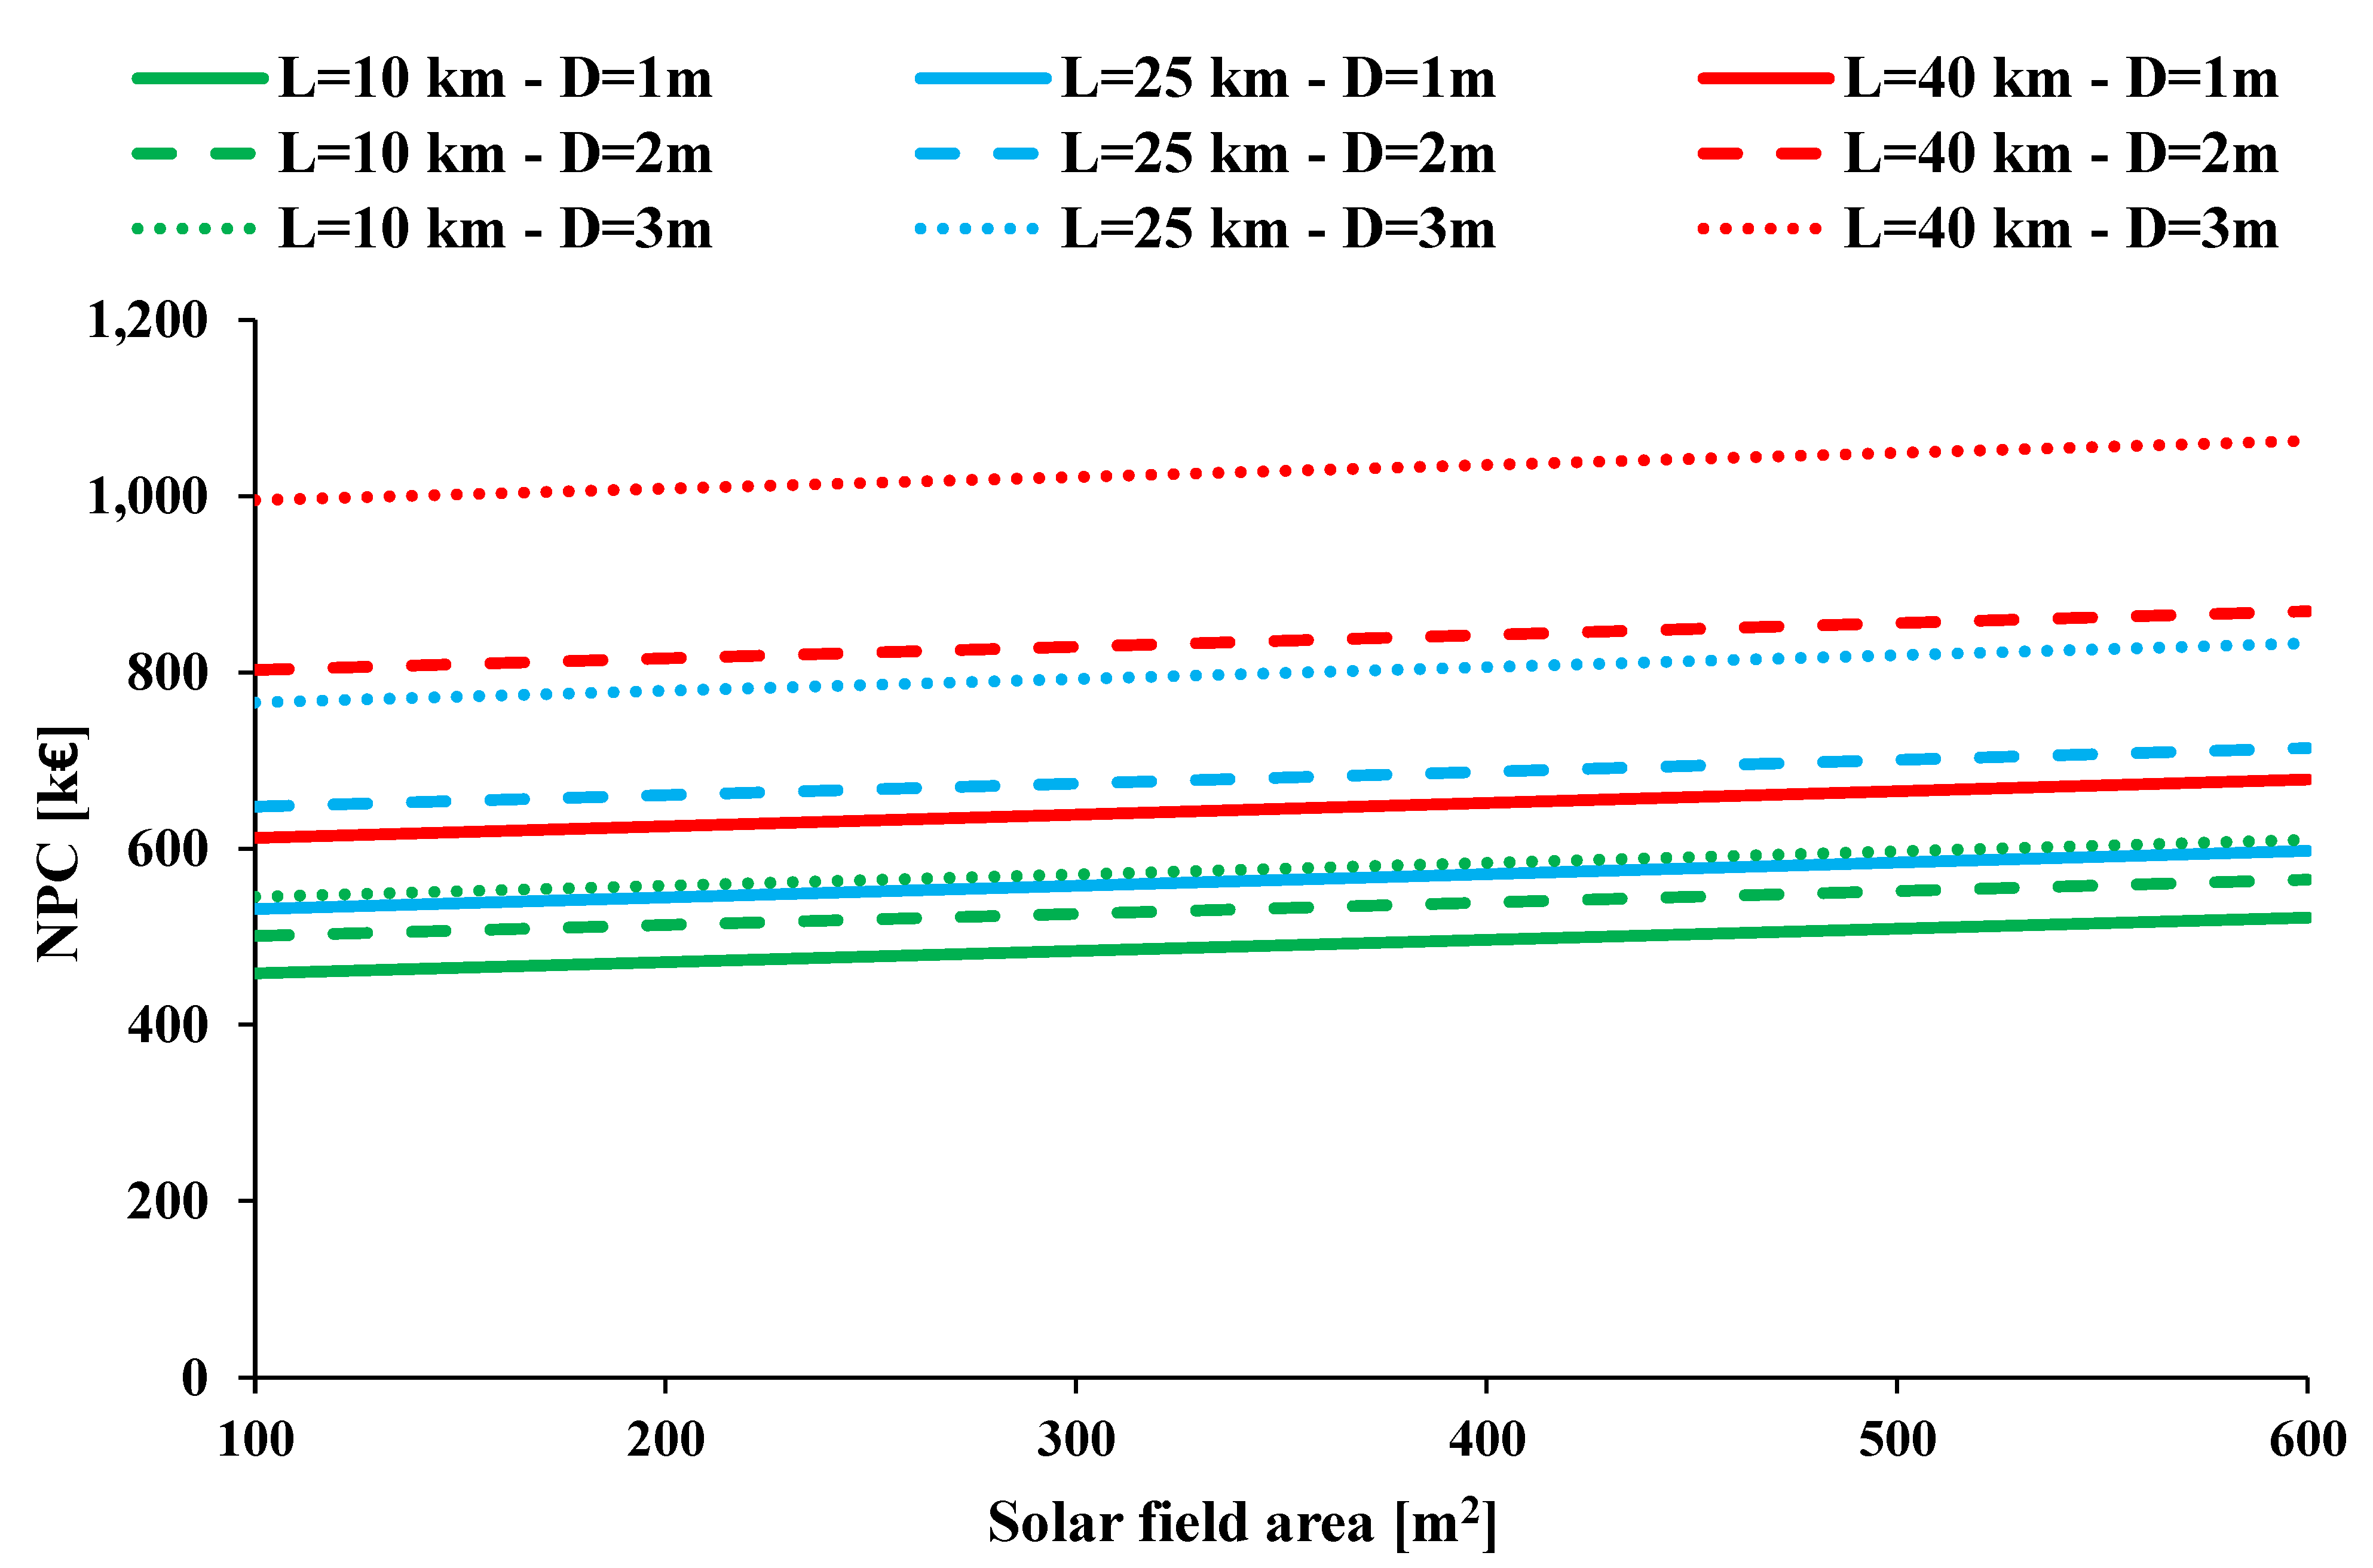
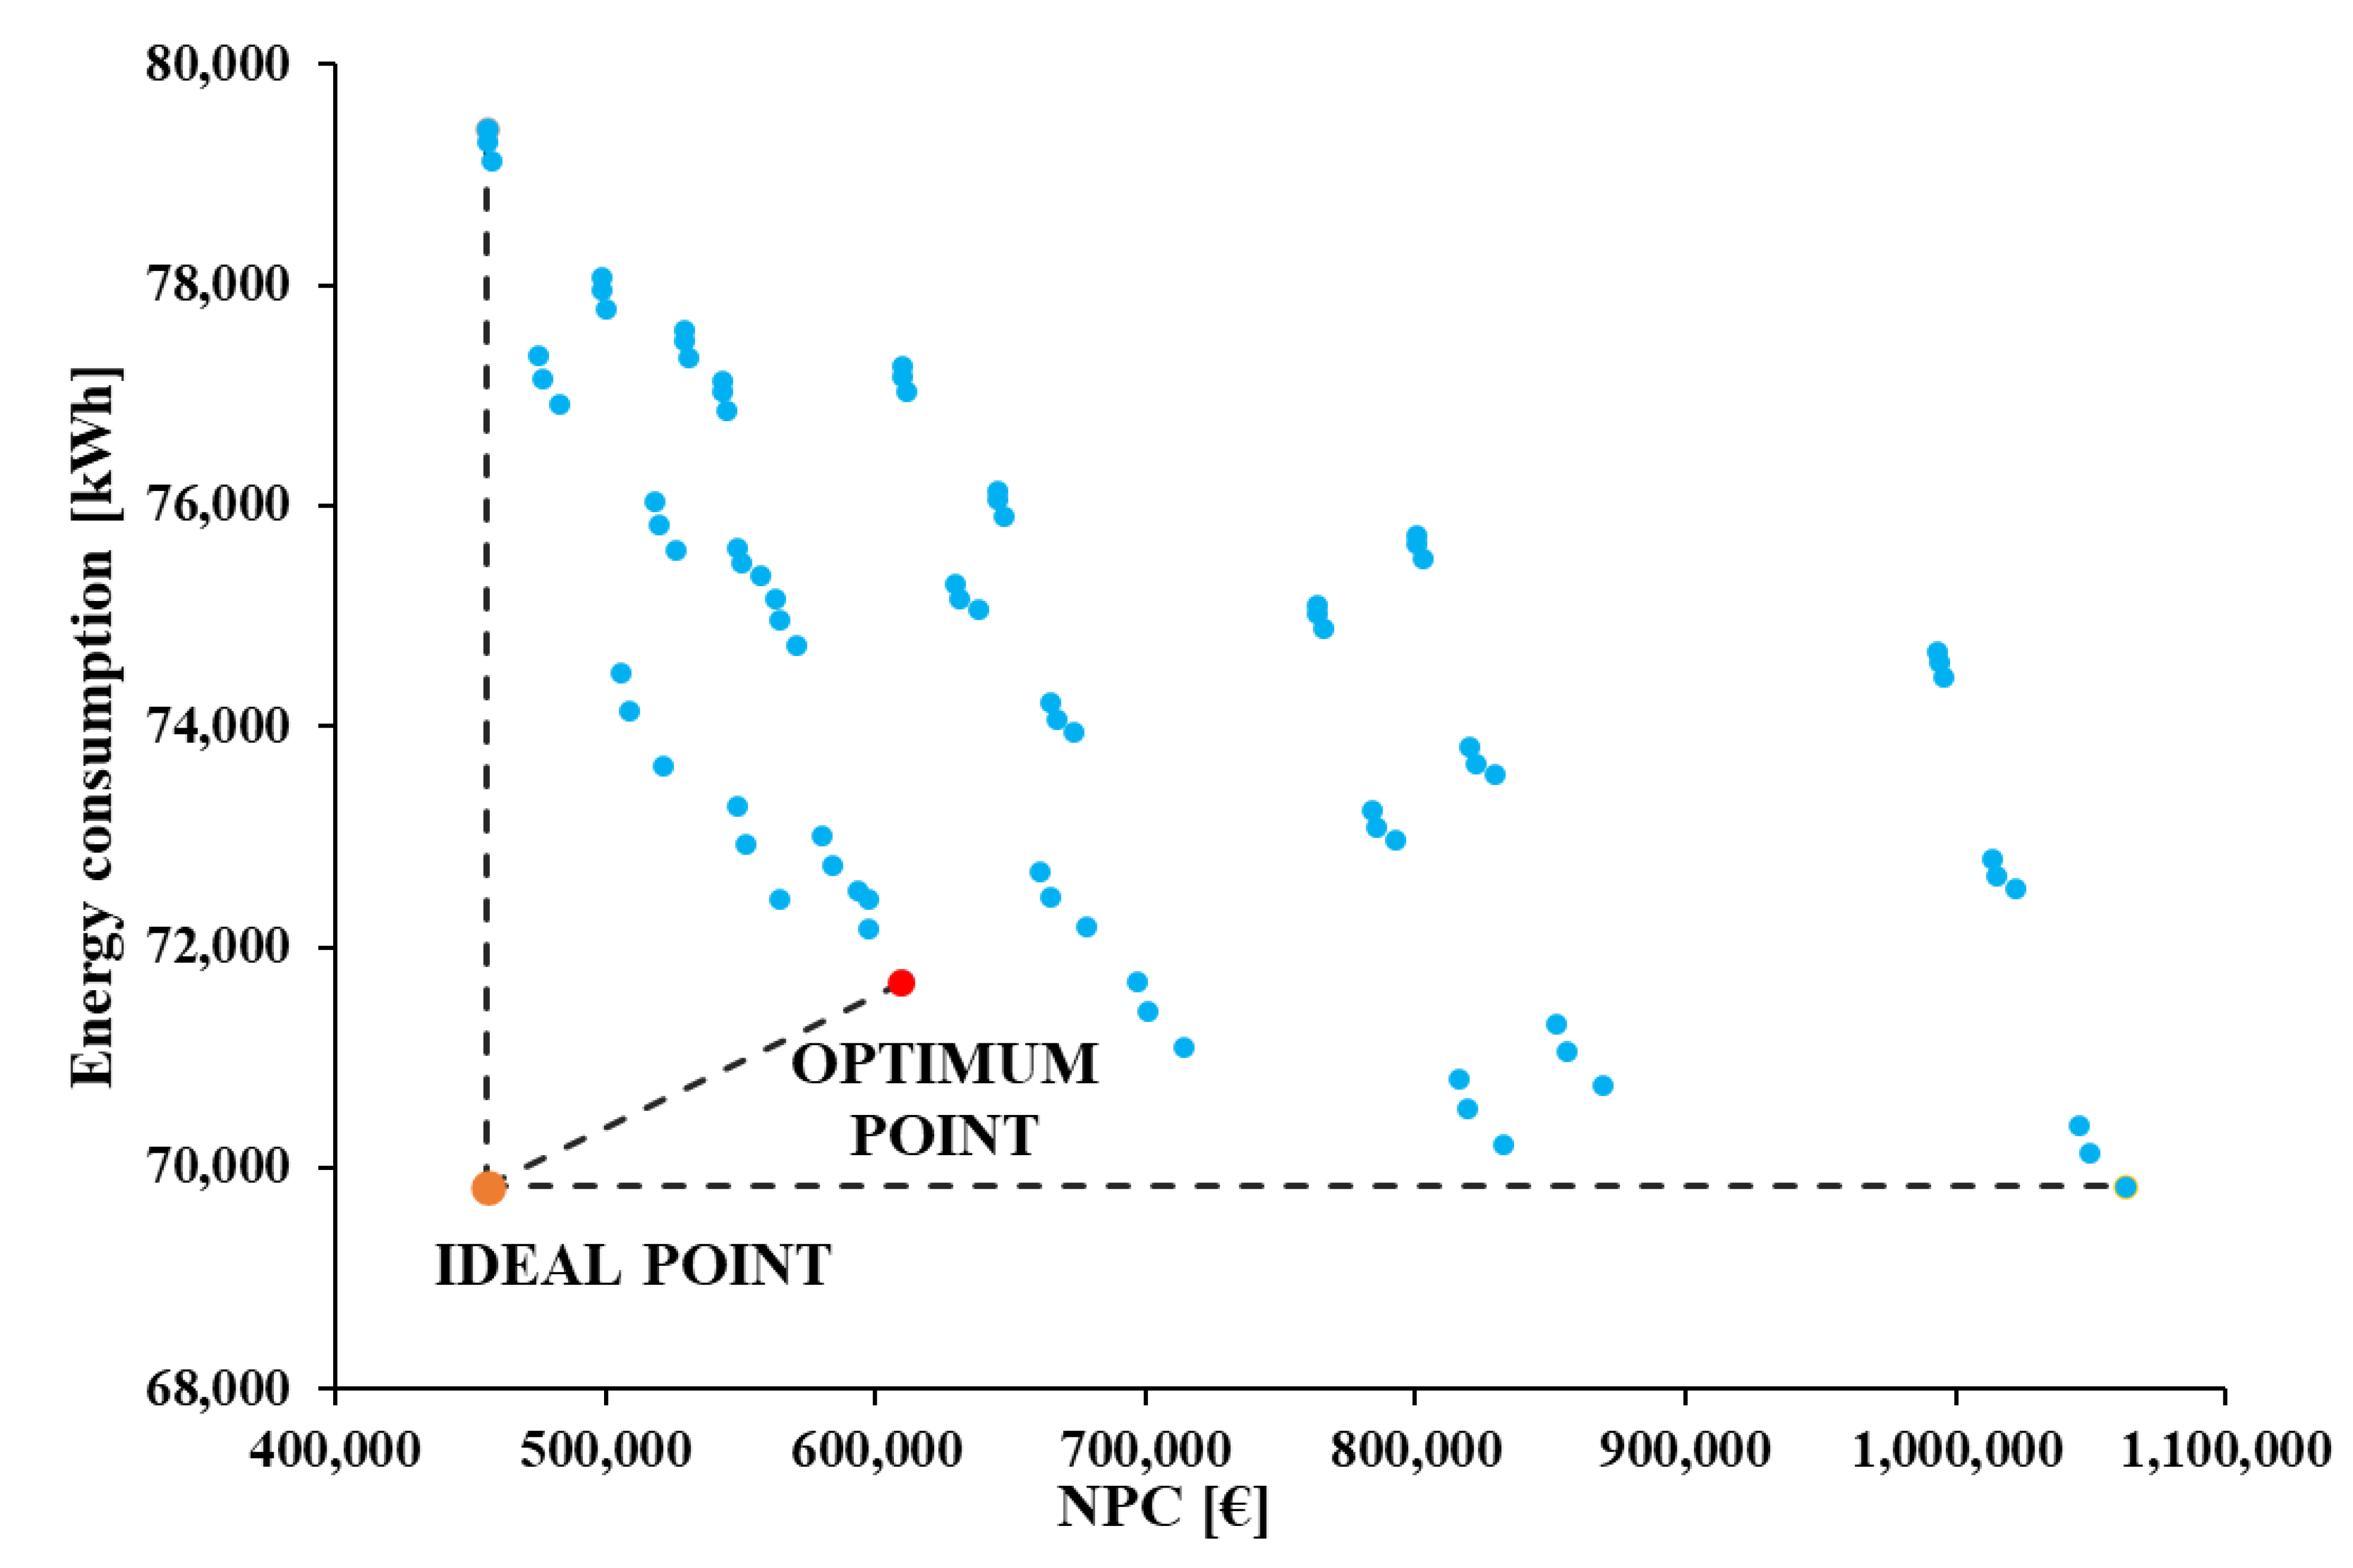
Figure 28 shows the NPC for the examined scenarios. The increases in the collecting area, piping length, and depth lead to a higher NPC due to the more advanced renewable energy installation in these cases. Therefore, the trends on the electricity demand and the NPC are different, indicating the need to develop more sophisticated techniques for the estimation of the global optimum choice. In this direction,
Figure 29 presents the design points in a two-dimensional depiction aiming to determine the optimal design. Finally, the multi-objective optimization has led to the conclusion that the optimal design is the one with A
col = 600 m
2, A
col/V = 10 m
2/m
3, L = 10 km and depth = 3 m. In this case, the SCOP is 5.06, the E
el = 71,680 kWh and the NPC = 610 kEUR. The water-source contribution in the evaporator, including solar and ground sources, is 66.69%, while the air contribution is 33.31%. Therefore, it is clear that the contribution of the air is restricted in this case, compared to the air contribution in the dual-source system, which was 84.71%. This critical observation suggests that the triple-source system has a relatively higher heat source temperature in the HP, and thus, the SCOP is significantly increased in this scenario.
3.5. Comparison of the Examined Cases
The last part of this section summarizes the basic results of the examined heat pump configurations and compares the optimum designs of the different cases. The main goal of this subsection is to compare the different optimum designs in energy and financial terms.
Table 6 summarizes the optimum designs, the values of the design parameters and the most important evaluation indexes. Furthermore,
Table 7 includes the comparative results of the GSHP, DUAL and TRIPLE compared to the baseline scenario of the ASHP.
According to our findings, all the solar and ground-driven systems lead to higher SCOP and lower annual electricity consumption compared to the baseline scenario (i.e., ASHP). Specifically, the ASHP presents a SCOP of 4.31, while the GSHP has a SCOP of 4.74. The dual-source HP, which exploits solar and air potential, leads to a SCOP of 4.55 (i.e., an increase of 5.57% compared to the baseline scenario), which is nevertheless smaller than the respective percentage increase associated with the GSHP. The triple-source system leads to a global maximum SCOP of 5.06, leading to a performance enhancement of 17.40%. Similarly, the annual electricity savings of the GSHP are calculated as being 7696 kWh, for the dual-source as being 4405 kWh and for the triple-source as being 12,417 kWh. Therefore, in terms of energy efficiency, the triple-source HP is discerned as the best choice, with the ground-source and the dual-source following.
An analysis of system economics based on the NPC criterion indicates the dual-source HP as being the best case, with an NPC increase of 33 kEUR in comparison with the ASHP case. On the other hand, the more energetically effective designs are also the more expensive, leading to an NPC increase of 222 kEUR for the GSHP and 200 kEUR for the triple-source HP. These results prove that the triple-source HP outperforms the GSHP energetically and economically, and therefore the GSHP cannot be characterized as the best case. Nevertheless, the dual-source HP is less efficient than the others but leads to the lowest NPC, presenting economic benefits. Thus, the assessment of the three designs indicates the triple-source HP as the best design energetically and the dual-source as the best design economically.
In the present work, the limited performance enhancements are attributed to the baseline scenario’s already high efficiency. However, the energy enhancements in the optimized, studied cases were calculated up to 17.40%, which indicates a sufficient improvement in the performance of the building’s energy system. Indicatively, in the literature, Hengel et al. [
19] have found a 4.1% performance increase with the use of thermal photovoltaics for feeding a heat pump, which is a lower enhancement than the present work. Moreover, Campi et al. [
23] have found a 3.2% reduction in primary energy consumption by combining solar thermal and geothermal boreholes in a heat pump system. Moreover, they found that the investment is not economically affordable due to high payback periods. Higher enhancements of 42% have been reported by Rosato et al. [
24] for a configuration with solar and geothermally driven heat pumps. Therefore, the reported data of the present work are reasonable, lying within the performance enhancement margins reported in the literature. Nonetheless, the value of the present study lies in the performance of multi-objective optimization procedures, which yields global optimal choices in terms of energy and economic criteria.
