Article

Maximizing Annual Energy Yield in a Grid-Connected PV Solar Power Plant: Analysis of Seasonal Tilt Angle and Solar Tracking Strategies

1
Department of Electrical and Electronics Engineering, Faculty of Engineering, University of the Ryukyus, 1 Senbaru, Okinawa 903-0213, Japan
2
Department of Energy Engineering, Faculty of Engineering, Kabul University, Kabul 1006, Afghanistan
3
Renewable Energy and Energy Efficiency Department, Da Afghanistan Breshna Sherkat (DABS), Kabul 1009, Afghanistan
4
Research Promotion Unit, Co-Creation Management Department, University of the Ryukyus, Okinawa 903-0213, Japan
*
Authors to whom correspondence should be addressed.
Sustainability 2023, 15(14), 11053; https://doi.org/10.3390/su151411053
Submission received: 20 June 2023 / Revised: 10 July 2023 / Accepted: 12 July 2023 / Published: 14 July 2023

Abstract

:
Harnessing the abundant solar resources holds great potential for sustainable energy generation. This research paper delves into a comprehensive analysis of seasonal tilt and solar tracking strategy scenarios for a 15 MW grid-connected PV solar power plant situated in Kandahar province, Afghanistan. The study investigates the impact of fixed tilt, seasonal tilt, SAHST (single-axis horizontal solar tracking), and SAVST (single-axis vertical solar tracking) on energy yield, considering technical, economic, and environmental aspects. In the first scenario, a fixed tilt angle of 31 degrees was employed. The second scenario explored the use of seasonal tilt angles, with a summer tilt angle of 15 degrees and a winter tilt angle of 30 degrees. The third scenario analyzed SAHST. Finally, the fourth scenario focused on implementing SAVST. SAVST proved to be an exceptional solution, showcasing a remarkable increase in annual energy yield, and generating an additional 6680 MWh/year, 6336 MWh/year, and 5084 MWh/year compared to fixed, seasonal, and SAHST scenarios, respectively. As a result, surplus energy yielded an income of USD 554,440.00 per year compared to fixed tilt. However, the investment cost for the solar tracking system amounted to USD 1,451,932, accompanied by an annual operation and maintenance cost of 0.007 USD/W/year. The analysis revealed a promising payback period of 3 years, confirming the economic feasibility of this investment. The findings underscore the effectiveness of different strategies for optimizing solar power generation in the Kandahar region. Notably, the installation of SAVST emerged as an influential solution, significantly increasing power production. These research outcomes bear practical implications for solar tracking strategies for addressing the load challenges faced by Kandahar province and offer valuable insights for the operators and operation of solar power plants in similar regions.

1. Introduction

Imagine a world where PV solar power plants can harness the maximum amount of the sun’s energy throughout the year, supplying an abundant and sustainable supply of electricity. What if we could optimize the performance of these PV solar power plants by dynamically adjusting the tilt angle of PV solar panels and implementing advanced solar tracking strategies? Such advancements have the potential to revolutionize the efficiency and energy yield of PV solar power plants [1].
Solar energy has emerged as a promising solution to meet the ever-increasing global demand for electricity while reducing dependence on fossil fuels. PV solar power plants convert sunlight directly into electricity and their use has grown rapidly in recent years [2]. However, despite their numerous benefits, including minimal environmental impact and long-term cost savings, PV solar power plants still face challenges in maximizing their annual energy yield [1,3,4].
To optimize the energy output of PV solar power plants, it is essential to consider various factors, such as the tilt angle of solar panels and solar tracking strategies. The tilt angle determines how inclined the solar panels are relative to the horizontal plane, affecting the amount of solar radiation captured during the year [5]. Solar tracking, on the other hand, involves aligning solar panels with the sun’s position to maximize solar exposure during daylight hours [6].
While extensive research has been conducted on PV solar power plant optimization using solar tracking systems, a significant research gap persists in understanding the impact of seasonal tilt angle adjustments and solar tracking strategies on annual energy yield. Although previous studies have explored some of these aspects individually, there is lack of comprehensive research that analyzes their effect on energy generation. This research gap necessitates a comprehensive inquiry of the interaction between seasonal tilt angle and solar tracking strategies, with the goal of identifying the most efficient method for increasing annual energy yield [7,8,9].
The primary objective of this study is to analyze the influence of seasonal tilt angle adjustments and solar tracking strategies on the annual energy yield. Simultaneously, it also aims to evaluate the economic, environmental, and energy yield impacts of the seasonal tilt angle, SAVST, and SAHST in grid-connected PV solar power plants; the impact of the seasonal tilt angle, SAVST, and SAHST in grid-connected PV solar power plants in an arid continental climate; how the excess energy yield obtained from the seasonal tilt angle, SAVST, and SAHST can help meet the partial demand of the grid load; and how the studied adjustments and strategies can help preserve the environment by contributing further to reducing CO2. To achieve this, the study will address the following research questions:
  • How does the seasonal tilt angle throughout the year impact the annual energy yield of a grid-connected PV solar power plant?
  • How do SAVST and SAHST impact the annual energy yield of a grid-connected PV solar power plant?
  • How can seasonal tilt angle and solar tracking strategies preserve the environment in a grid-connected PV solar power plant?
  • Are the implications of seasonal tilt angle and solar tracking strategies economically feasible?
  • Can the excess energy obtained from the solar tracking strategies help meet partial demand?
This research focuses on analyzing the impact of seasonal tilt angle adjustments and solar tracking strategies in the context of a grid-connected PV solar power plant. The study is limited to this specific context, even though the findings may have broader implications for solar energy applications. Additionally, the research does not delve into the design and engineering aspects of solar panels, but rather emphasizes the operational and performance optimization aspects.
The findings of this research will significantly contribute to the fields of solar energy optimization, performance, and economic consideration of grid-connected PV solar power plants and environment preservation, and address the existing research gap regarding the impact of seasonal tilt angle adjustments and solar tracking strategies on the annual energy yield. By understanding the optimal configuration of these parameters, PV solar power plant operators can maximize their energy generation potential, improve cost effectiveness, and enhance the overall sustainability of renewable energy systems.
To achieve the research objectives, a combination of theoretical analysis and simulation modeling using PVsyst was employed. The study analyzed historical weather data, solar irradiance patterns, and energy generation data from the supervisory control and data acquisition (SCADA) system of an existing 15 MW grid-connected PV solar power plant. Simulation tools and mathematical models were utilized to assess the impact of seasonal tilt angle and solar tracking strategies on annual energy yield, preserving the environment, and economic feasibility.
This research paper is organized into several sections to provide a comprehensive analysis of the subject matter. Following this introduction, Section 2 presents site information and Section 3 highlights the methodology undertaken to carry out this research. Section 4 outlines the economic and environmental analysis techniques employed. After presenting the study’s results and findings in Section 5, Section 6 presents a conclusion, which summarizes the key findings and suggests areas for future research.

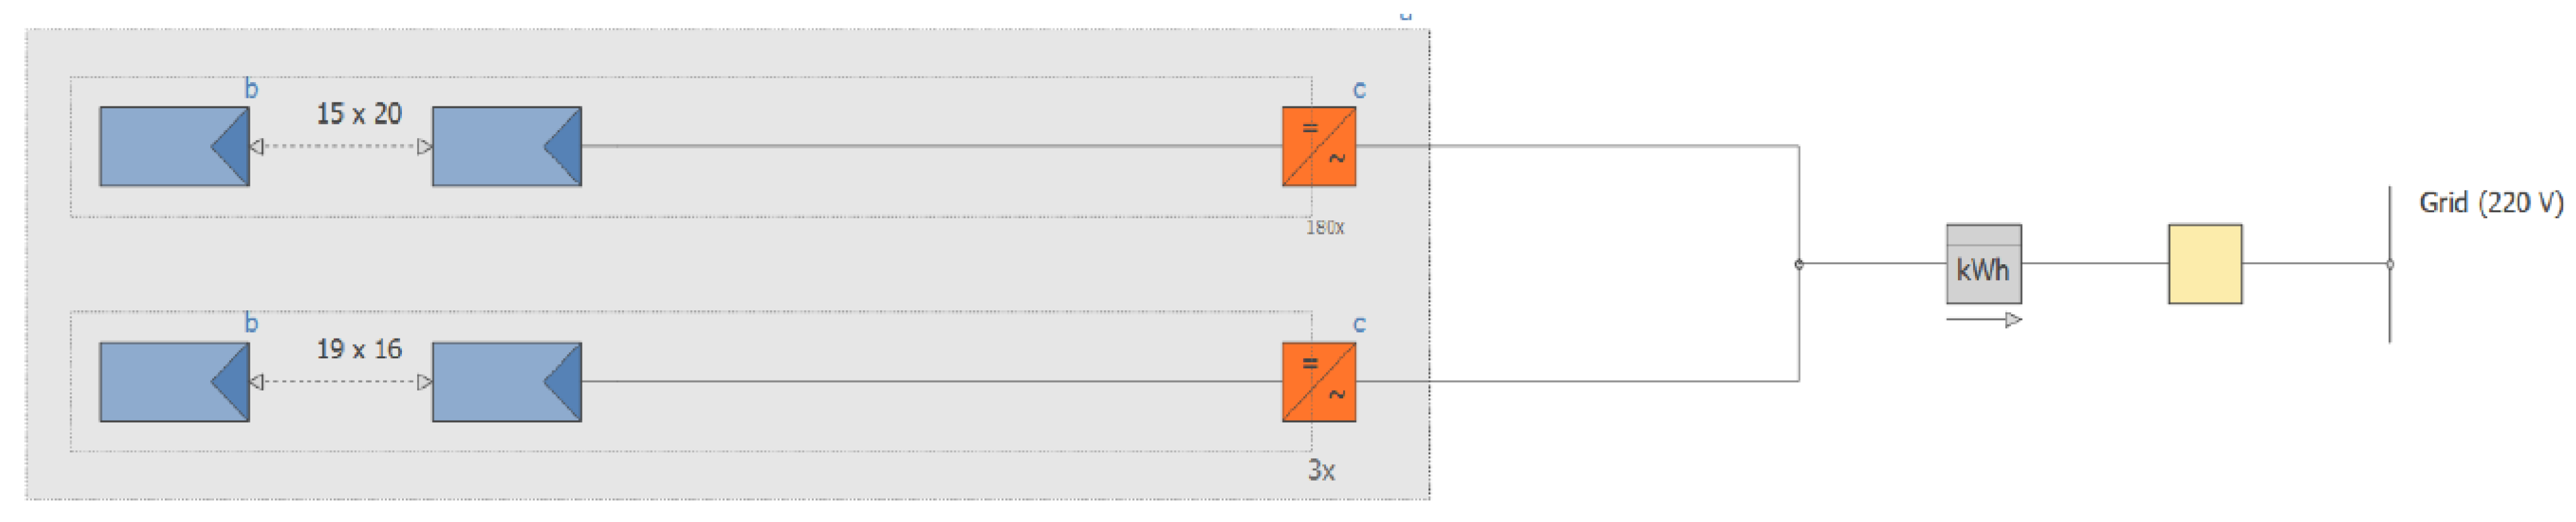
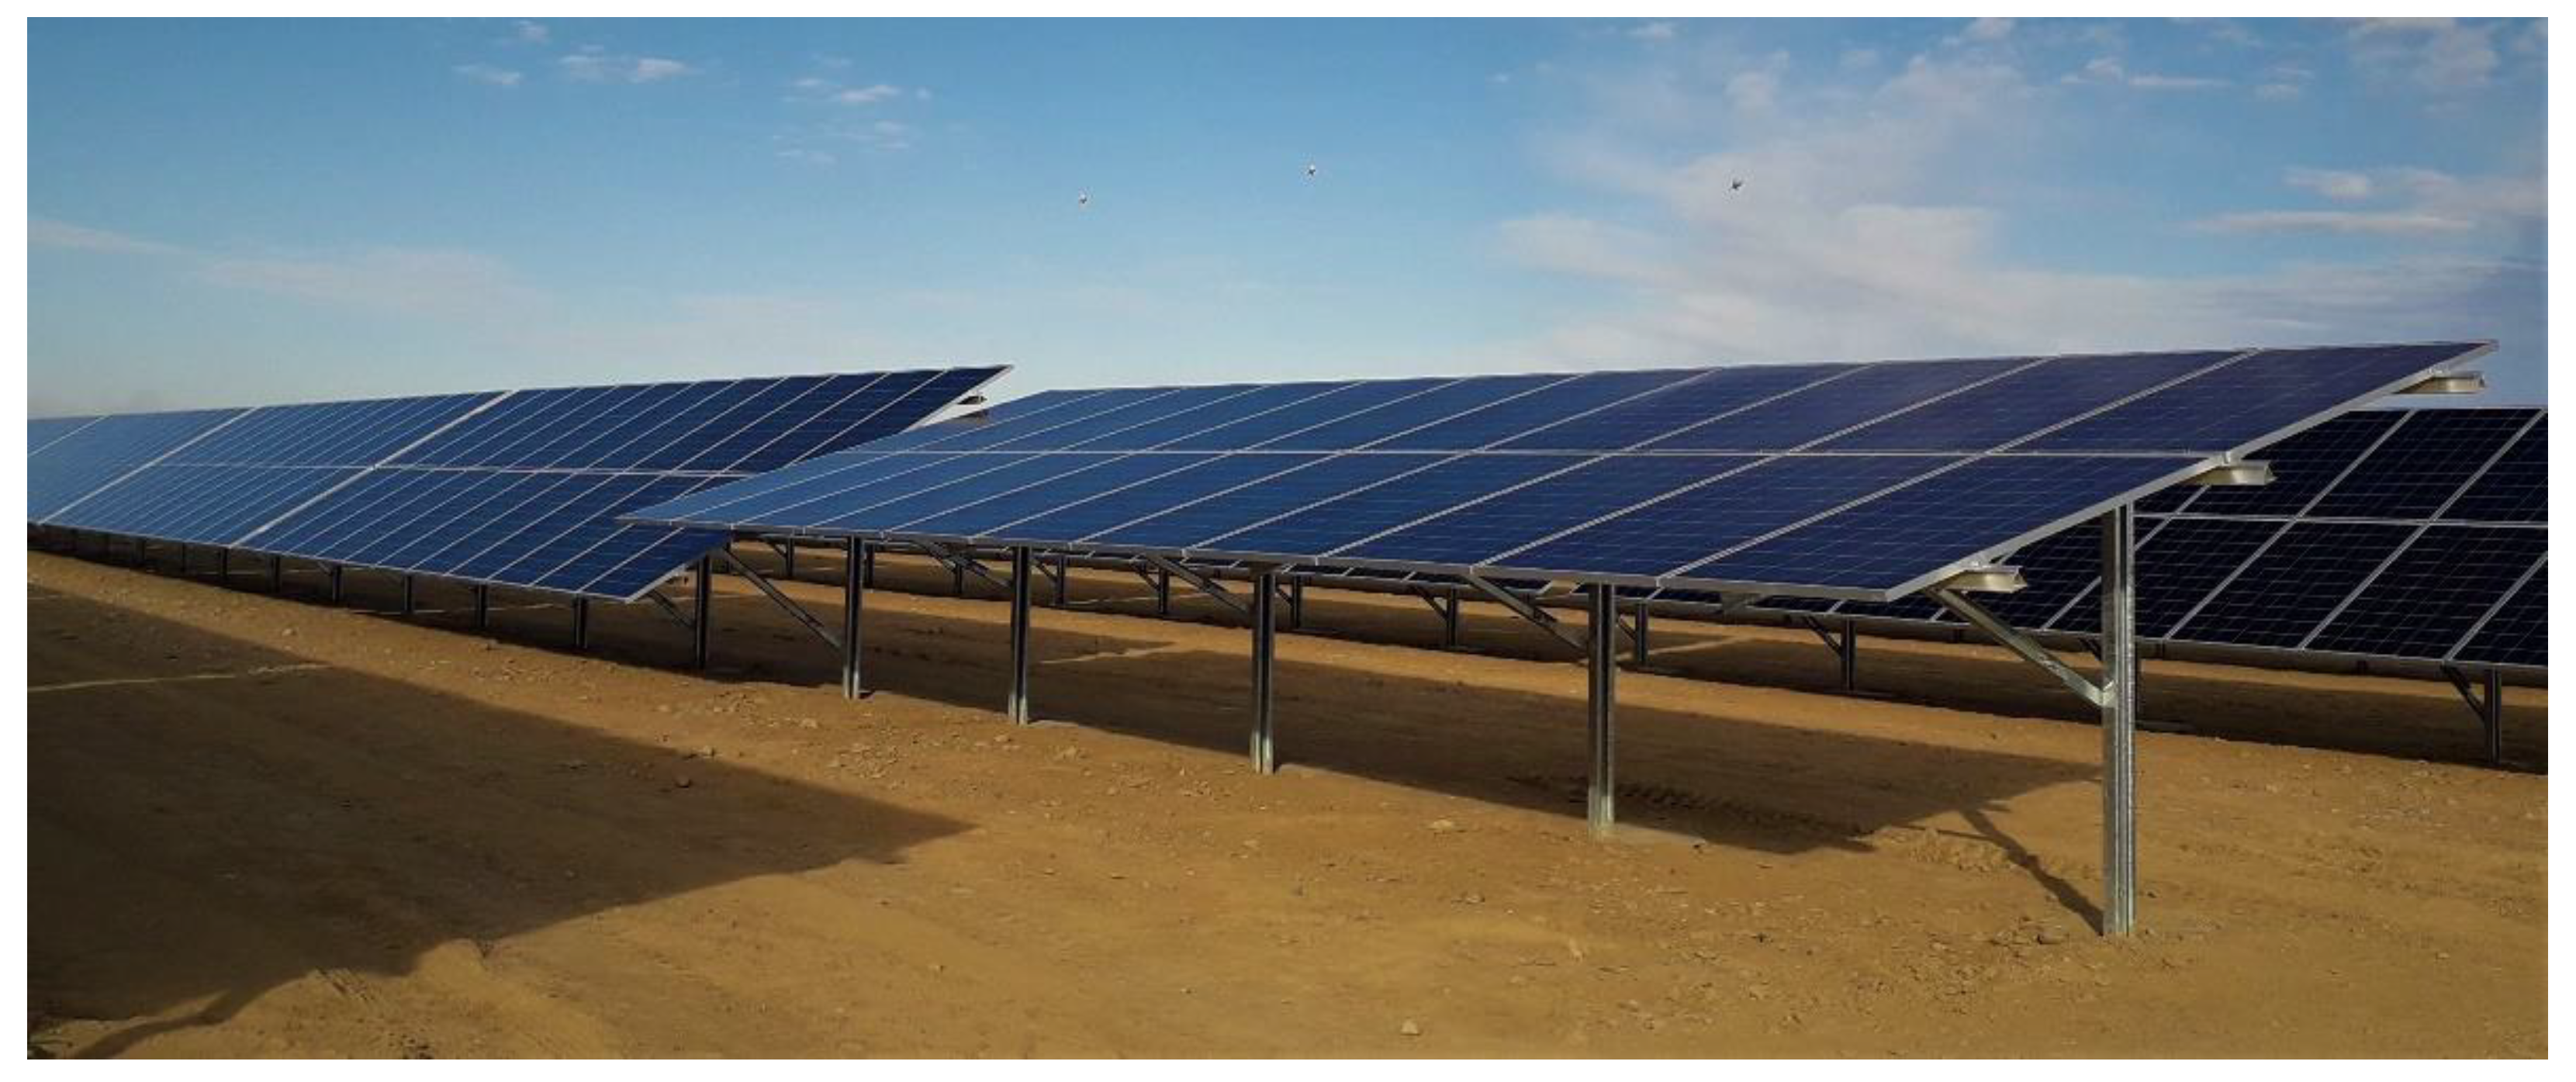
2. Presentation of Site
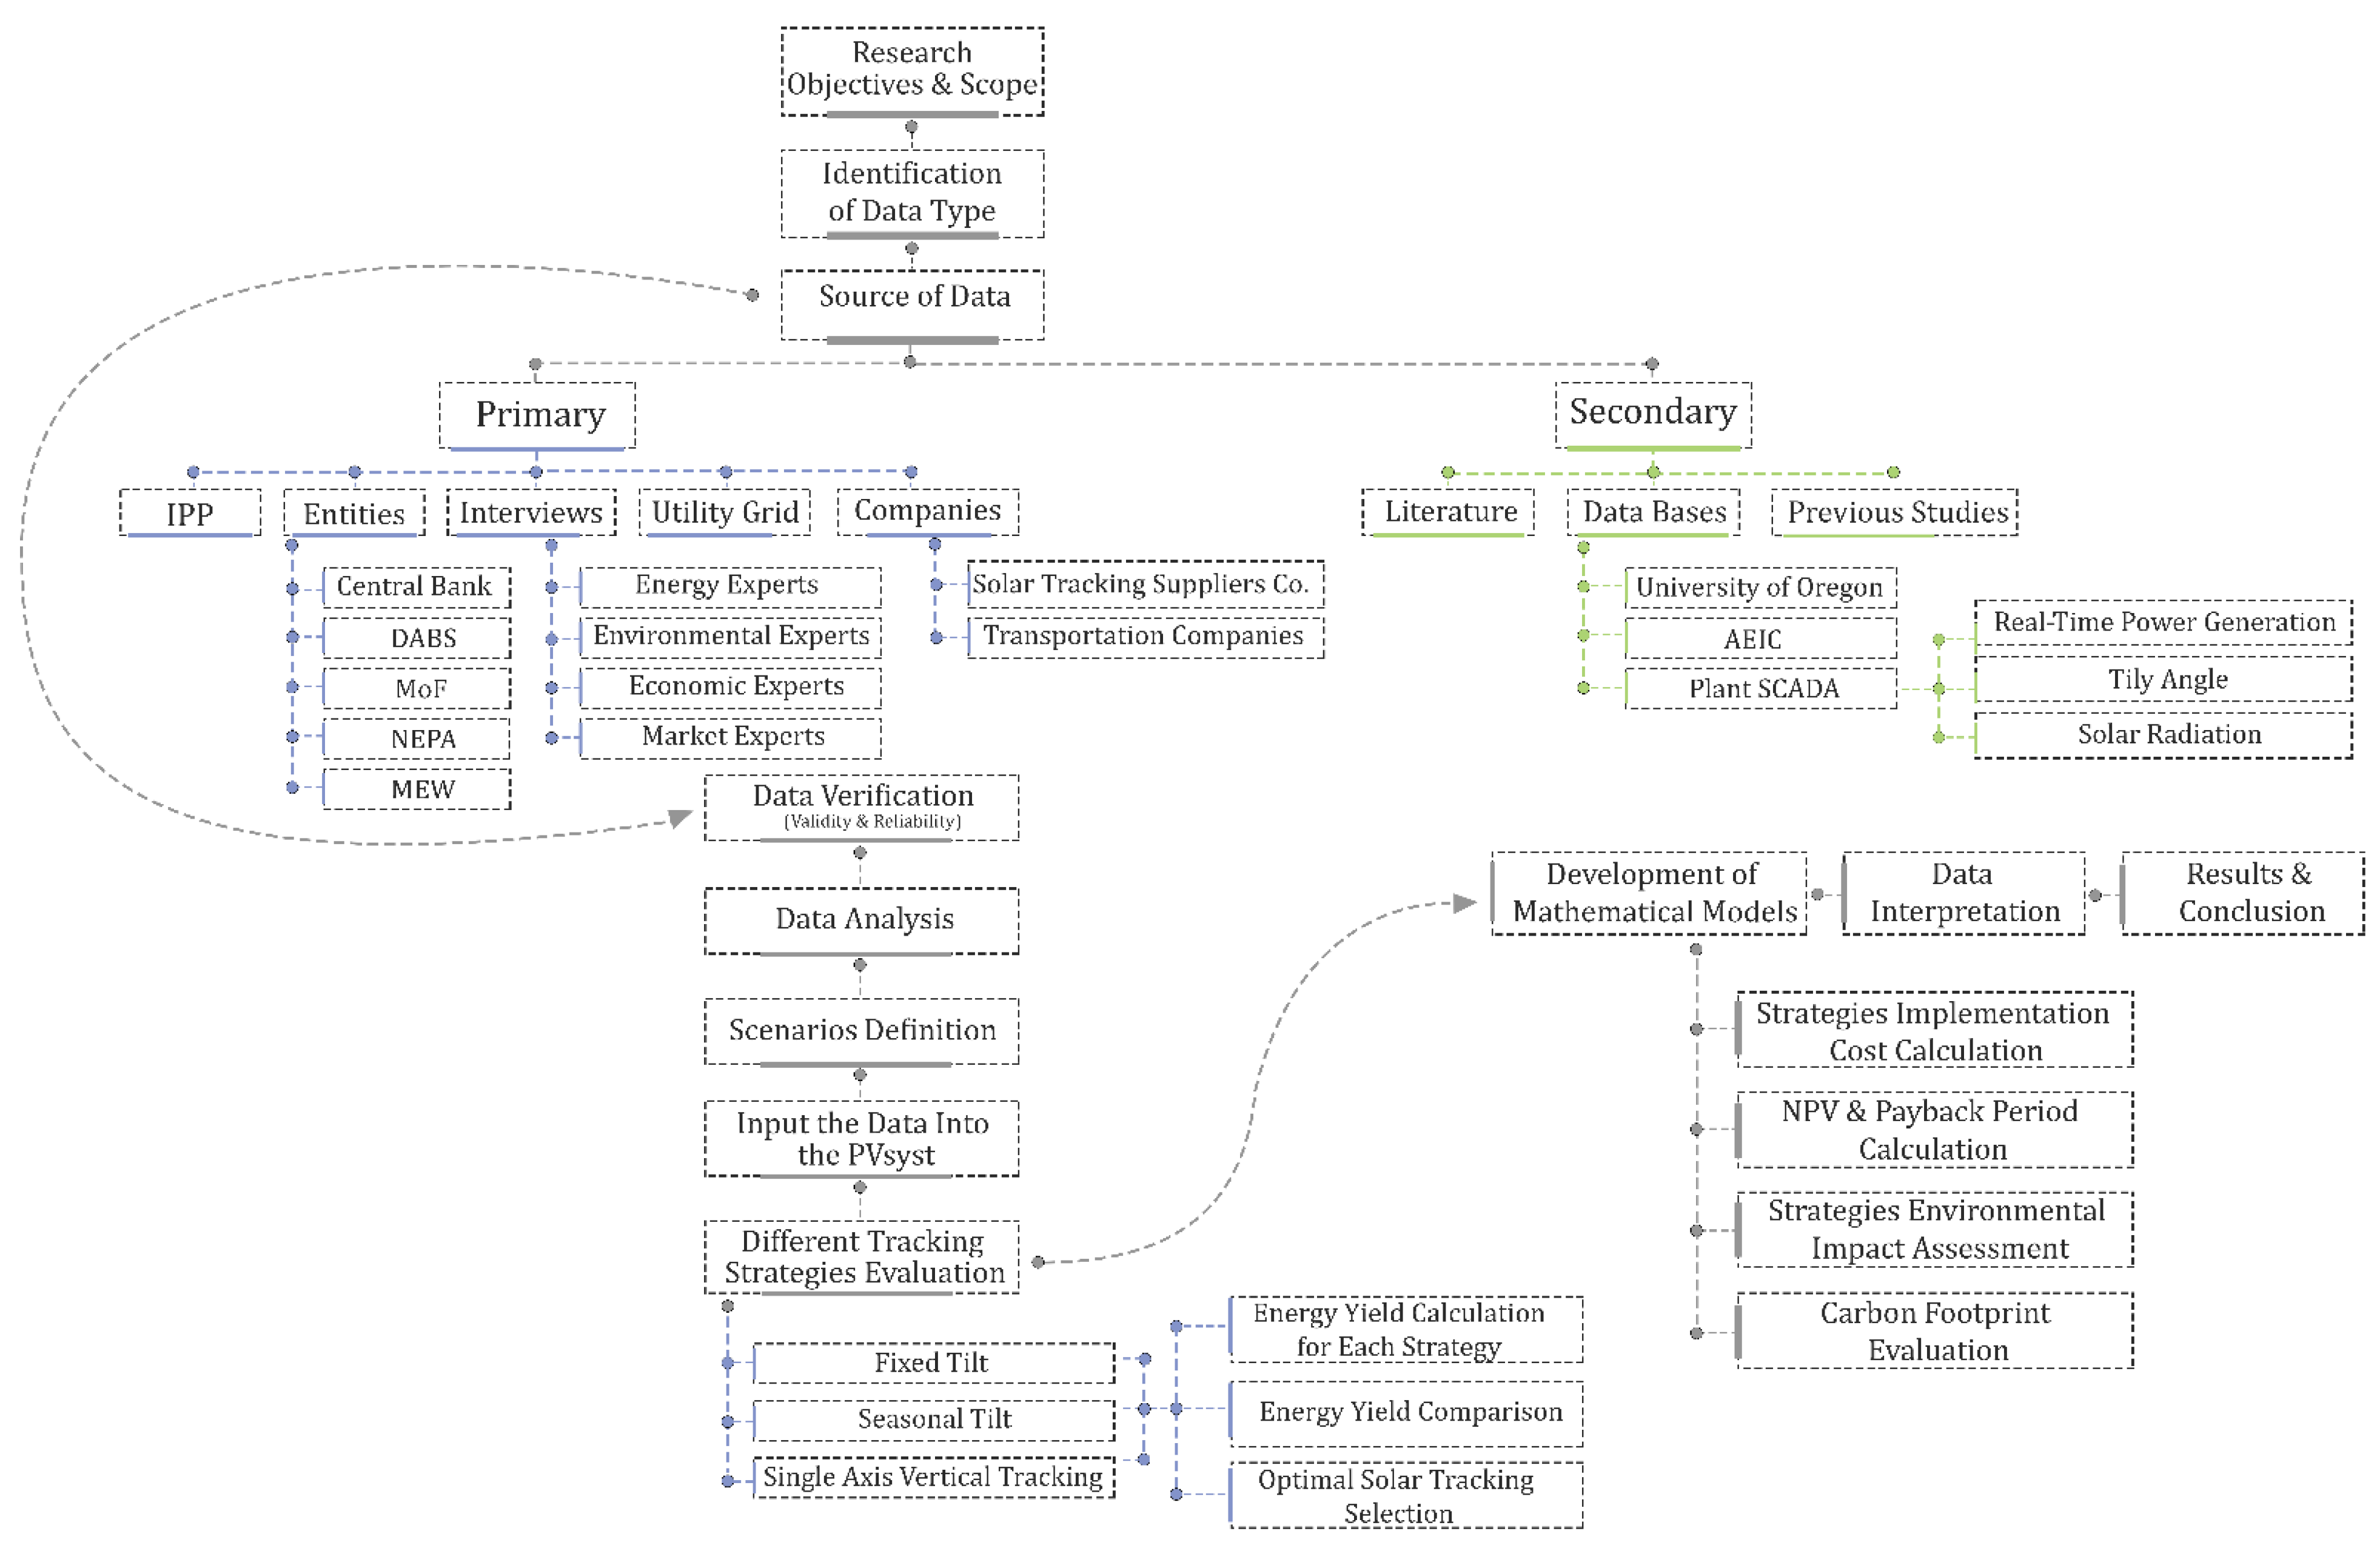
Kandahar province in southern Afghanistan (31.46° N latitude, 65.86° E longitude, and 1009 m altitude) is home to the 15 MW grid-connected PV solar power plant studied here. It was the country’s first “build-operate-transfer” (BOT) investment project. The plant took 10 months to build and cost USD 19,250,000. The investor will run it for 20 years and the project’s effective life is 25 years. Located on a plot of land measuring 89,789 m2, the installation has a nominal power output of 12,480 kWac and comprises 54,912 modules with individual 275 Wp capacities and 104 inverters each with 120 kW capacity. Detailed information of the power plant is indicated in Table 1. Twenty-four strings of modules are connected to one inverter. There are 13 transformers, each with a 1250 kVA rating; 8 inverters are connected to each transformer. The plant is connected to the medium-voltage distribution system of the Southeast Power System (SEPS); the block diagram is indicated in Figure 1.

3. Methodology

3.1. Data Collection and Analysis

To collect the needed data for the simulation and mathematical analysis, a comprehensive data collection procedure was implemented. Real-time data from the grid-connected PV solar power plant were collected using cutting-edge monitoring systems installed on-site, interviews with entities, the utility grid, companies, databases, and previous studies [10,11,12,13]. These data include measurements of solar irradiance, ambient temperature, module temperature, and electrical parameters such as current, power, and voltage. Additionally, weather data from local meteorological stations and the PV solar power plant SCADA system were obtained to capture variations in solar irradiance and environmental conditions throughout the year [14,15,16]. A detailed description of the data collection process is presented in Figure 2. PVsyst software was used to calculate the annual energy yield and analyze seasonal tilt and solar tracking strategies for the PV solar power plant (see Figure 2). PVsyst is a well-known and industry-standard software application for modeling and simulating the operation and performance of photovoltaic (PV) systems [17,18]. It allowed us to produce a detailed virtual model of the solar power plant, considering elements such as system setup, shading, and geographic location [19]. The software considers site-specific meteorological data and system parameters, allowing for correct simulations and forecasts of energy yield. PVsyst provides comprehensive performance metrics such as hourly, monthly, and yearly energy production, performance ratios, normalized productions, annual production probability, and system losses. These metrics serve as valuable indices for comparing different tilt angle configurations and solar tracking strategies [19,20]. The collected real-time data, including solar irradiance measurements and electrical parameters, are integrated into the PVsyst software for calibration and validation of the model. This ensures that the simulation results align closely with the actual performance of the solar power plant. The software also enables the analysis of different scenarios by varying tilt angles and solar tracking configurations, providing valuable insights into the impact of these factors on energy generation [21,22,23,24]. Furthermore, mathematical analysis was employed to analyze the data collected from real-time monitoring and the simulations performed using PVsyst. These analyses include evaluations of the energy yield of seasonal tilt and solar tracking strategies, the annual cost of surplus energy for different scenarios, the annual reduction in CO2, the net present value (NPV), and the payback period. The results obtained from these analyses are crucial in drawing meaningful conclusions and providing reliable recommendations for maximizing annual energy yield, NPV, payback period, and further CO2 reduction [25,26].
In summary, the methodology involves a combination of PVsyst simulations using the virtual model of the PV solar power plant and the mathematical analysis of real-time data collected from different resources and PVsyst. The PVsyst software serves as a powerful tool for modeling, simulating, and analyzing the performance of the PV solar power plant, while the real-time data add an empirical aspect to the analysis. By combining these approaches, this research ensures a comprehensive and accurate evaluation of the impact of seasonal tilt angle and solar tracking strategies on maximizing annual energy yield.

3.2. Scenarios Explanations

3.2.1. Fixed Tilt

The tilt angle of solar panels is crucial in determining how much energy they can capture from the sun. In this scenario, the fixed tilt angle of 31° was used for the 15 MW grid-connected PV solar power plant in Kandahar province. This tilt angle aligns with the latitude of the region, following the common practice of matching the panel’s tilt to maximize solar energy capture [27].
The selection of this tilt angle considers the local solar radiation patterns as well as the qualities of the PV modules used. Kandahar province, at a latitude of 31.46° N, experiences seasonal fluctuations in the sun’s angle throughout the year due to the tilt of the Earth’s axis and its elliptical orbit [28]. By fixing the tilt angle equal to the latitude, the solar panels can successfully and effectively capture solar energy throughout the year, despite seasonal fluctuations [29].
During the winter, when the sun is lower in the sky, tilting the solar panels at a latitude angle helps capture more sunlight, compensating for the lower solar angle. This maximizes energy yield during the winter months [30,31]. In contrast, during the summer months, when the sun is higher in the sky, the tilt angle ensures that the solar panels are not positioned too steeply. This minimizes excessive shadowing and maximizes energy capture, balancing energy yield throughout the warmer months [32].
Given the local solar radiation patterns in Kandahar province, where sunlight is abundant all year, and the unique properties of the PV modules utilized in the solar power plant, the selected tilt angle of 31° is projected to result in a good average annual energy output. While it may not be the perfect angle in all situations, it is a practical rule of thumb that helps achieve an optimal balance of solar energy capture over the course of a year [33].

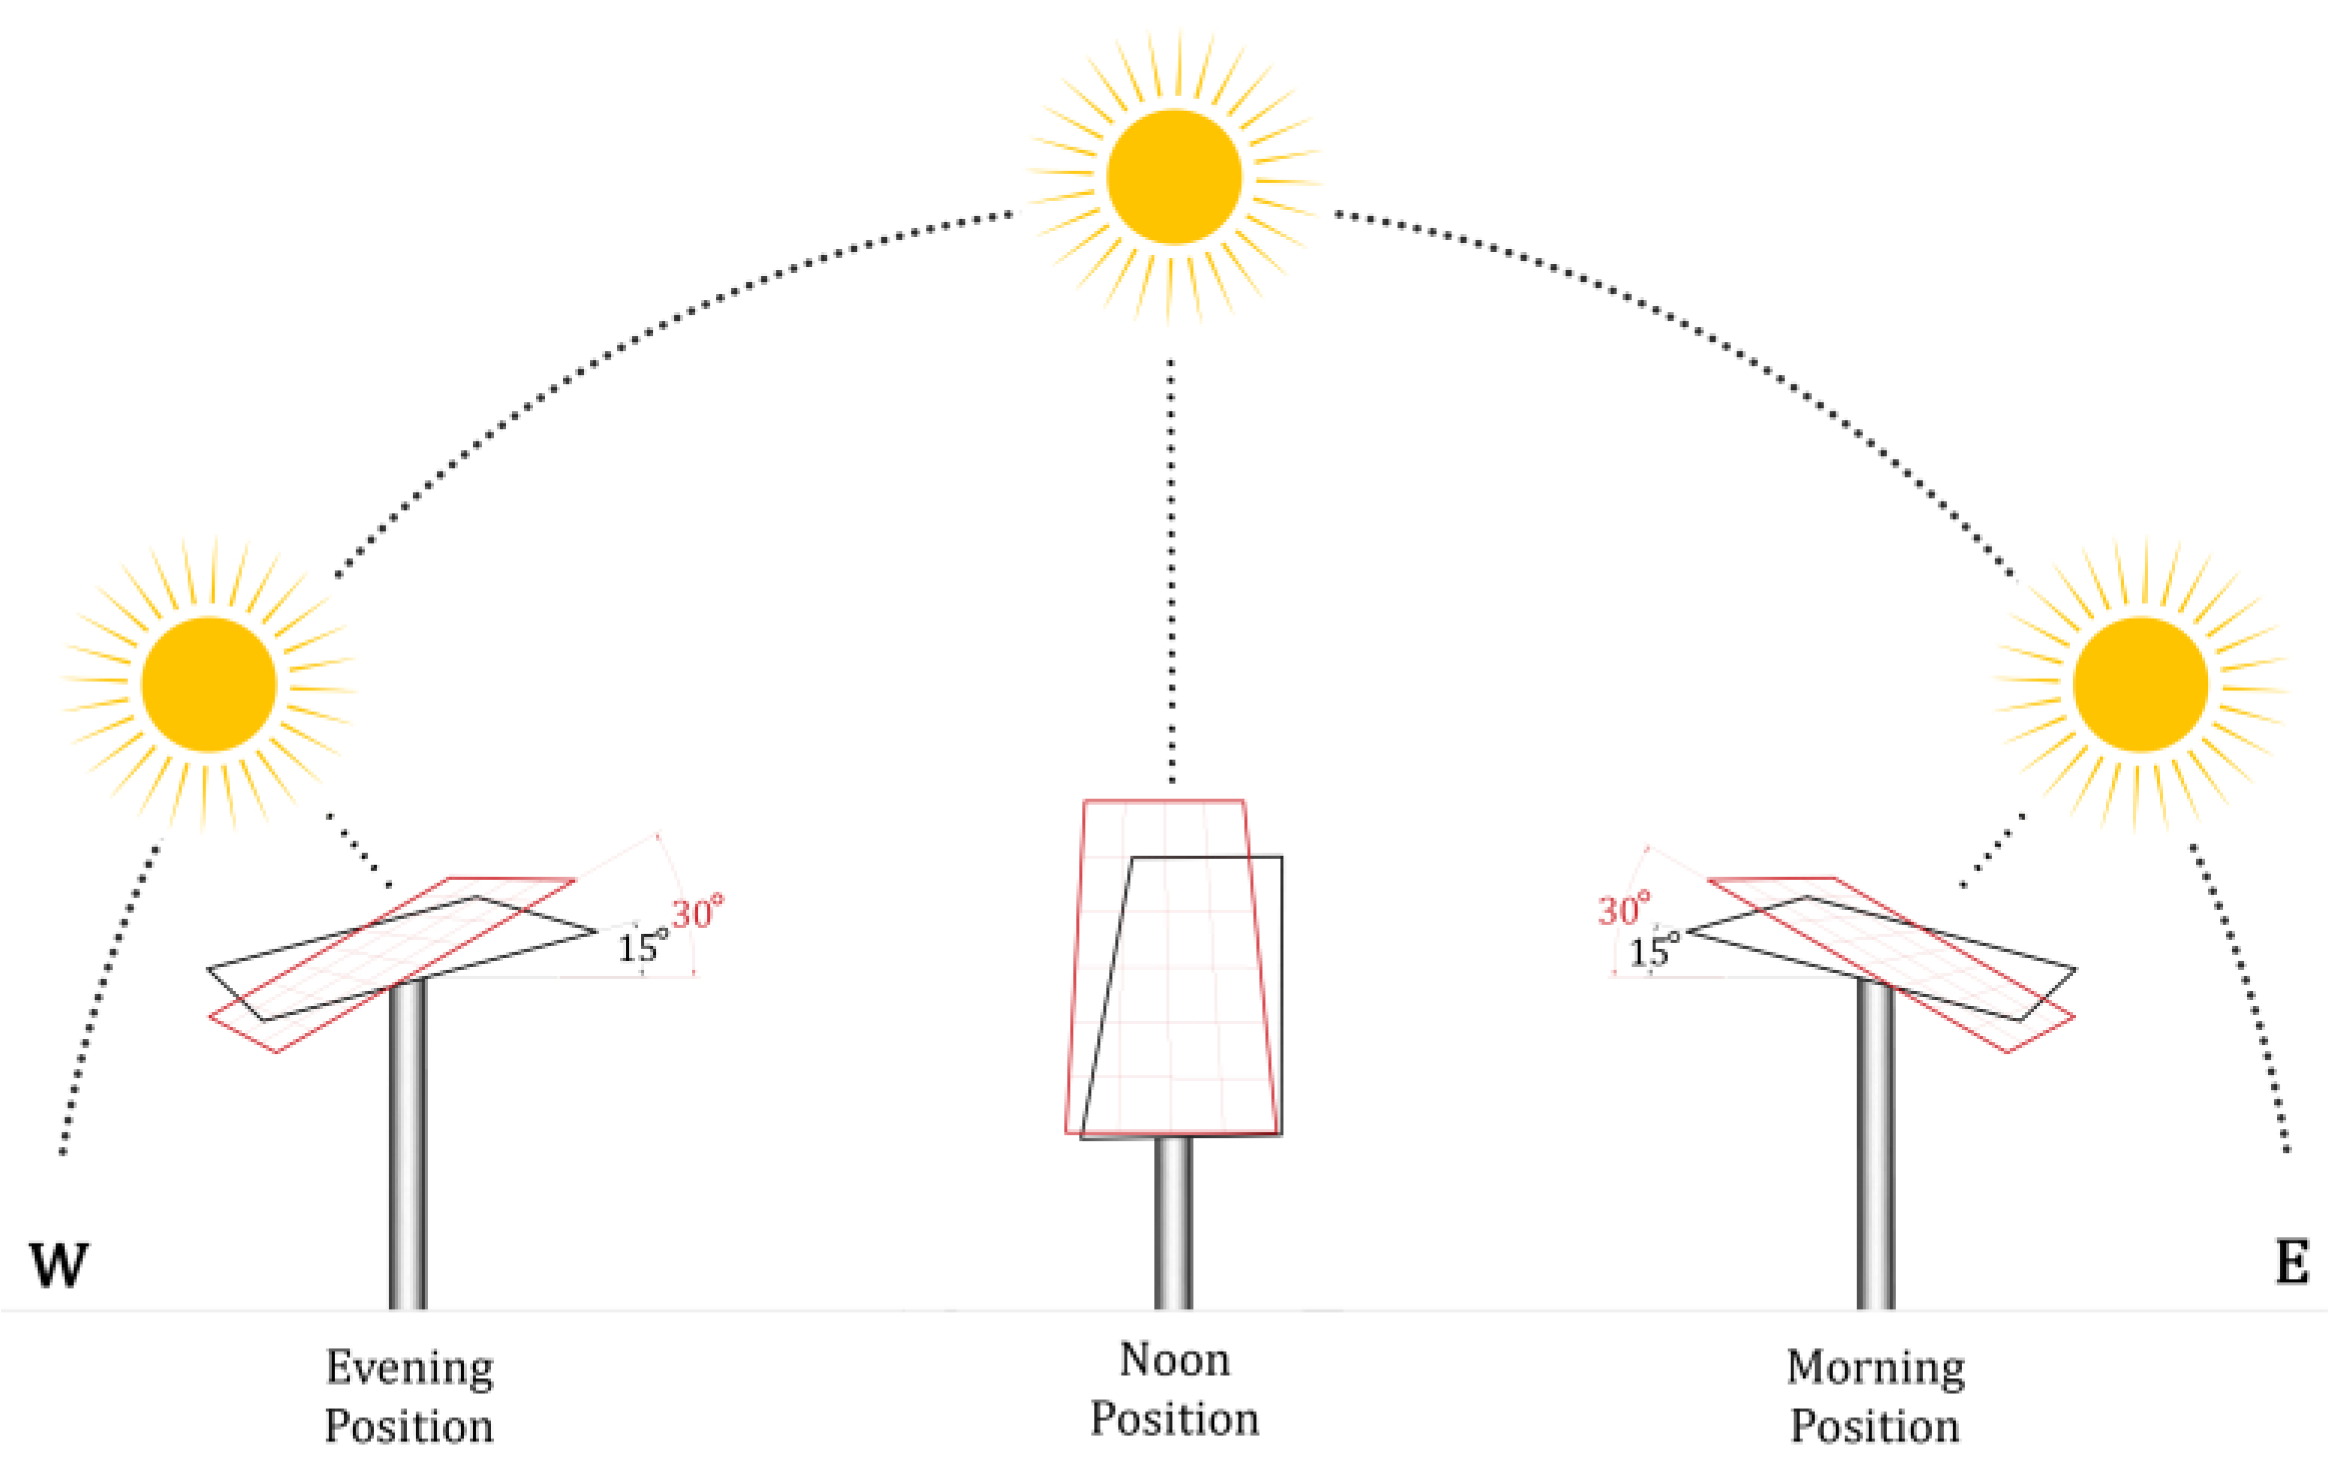
3.2.2. Seasonal Tilt Adjustment

Seasonal tilt angle adjustment involves optimizing the tilt angle of solar panels based on the sun’s position throughout the year. The tilt angle is adjusted to maximize solar energy capture. In this scenario, the 15 MW grid-connected PV solar power plant in Kandahar province, Afghanistan, is tilted at 15 degrees (summer tilt) from March to September and at 30 degrees (winter tilt) from September to March (Figure 3). The rationale behind seasonal tilt angle adjustment is to optimize solar energy capture throughout the year. To maximize energy yield, solar panels must align their tilt angle with the sun’s position. In periods of lower sun position and shorter days, this approach allows the solar power plant to harness more sunlight. Increased energy yield, improved efficiency, a reduced carbon footprint by reducing CO2, and increased performance are the potential benefits.

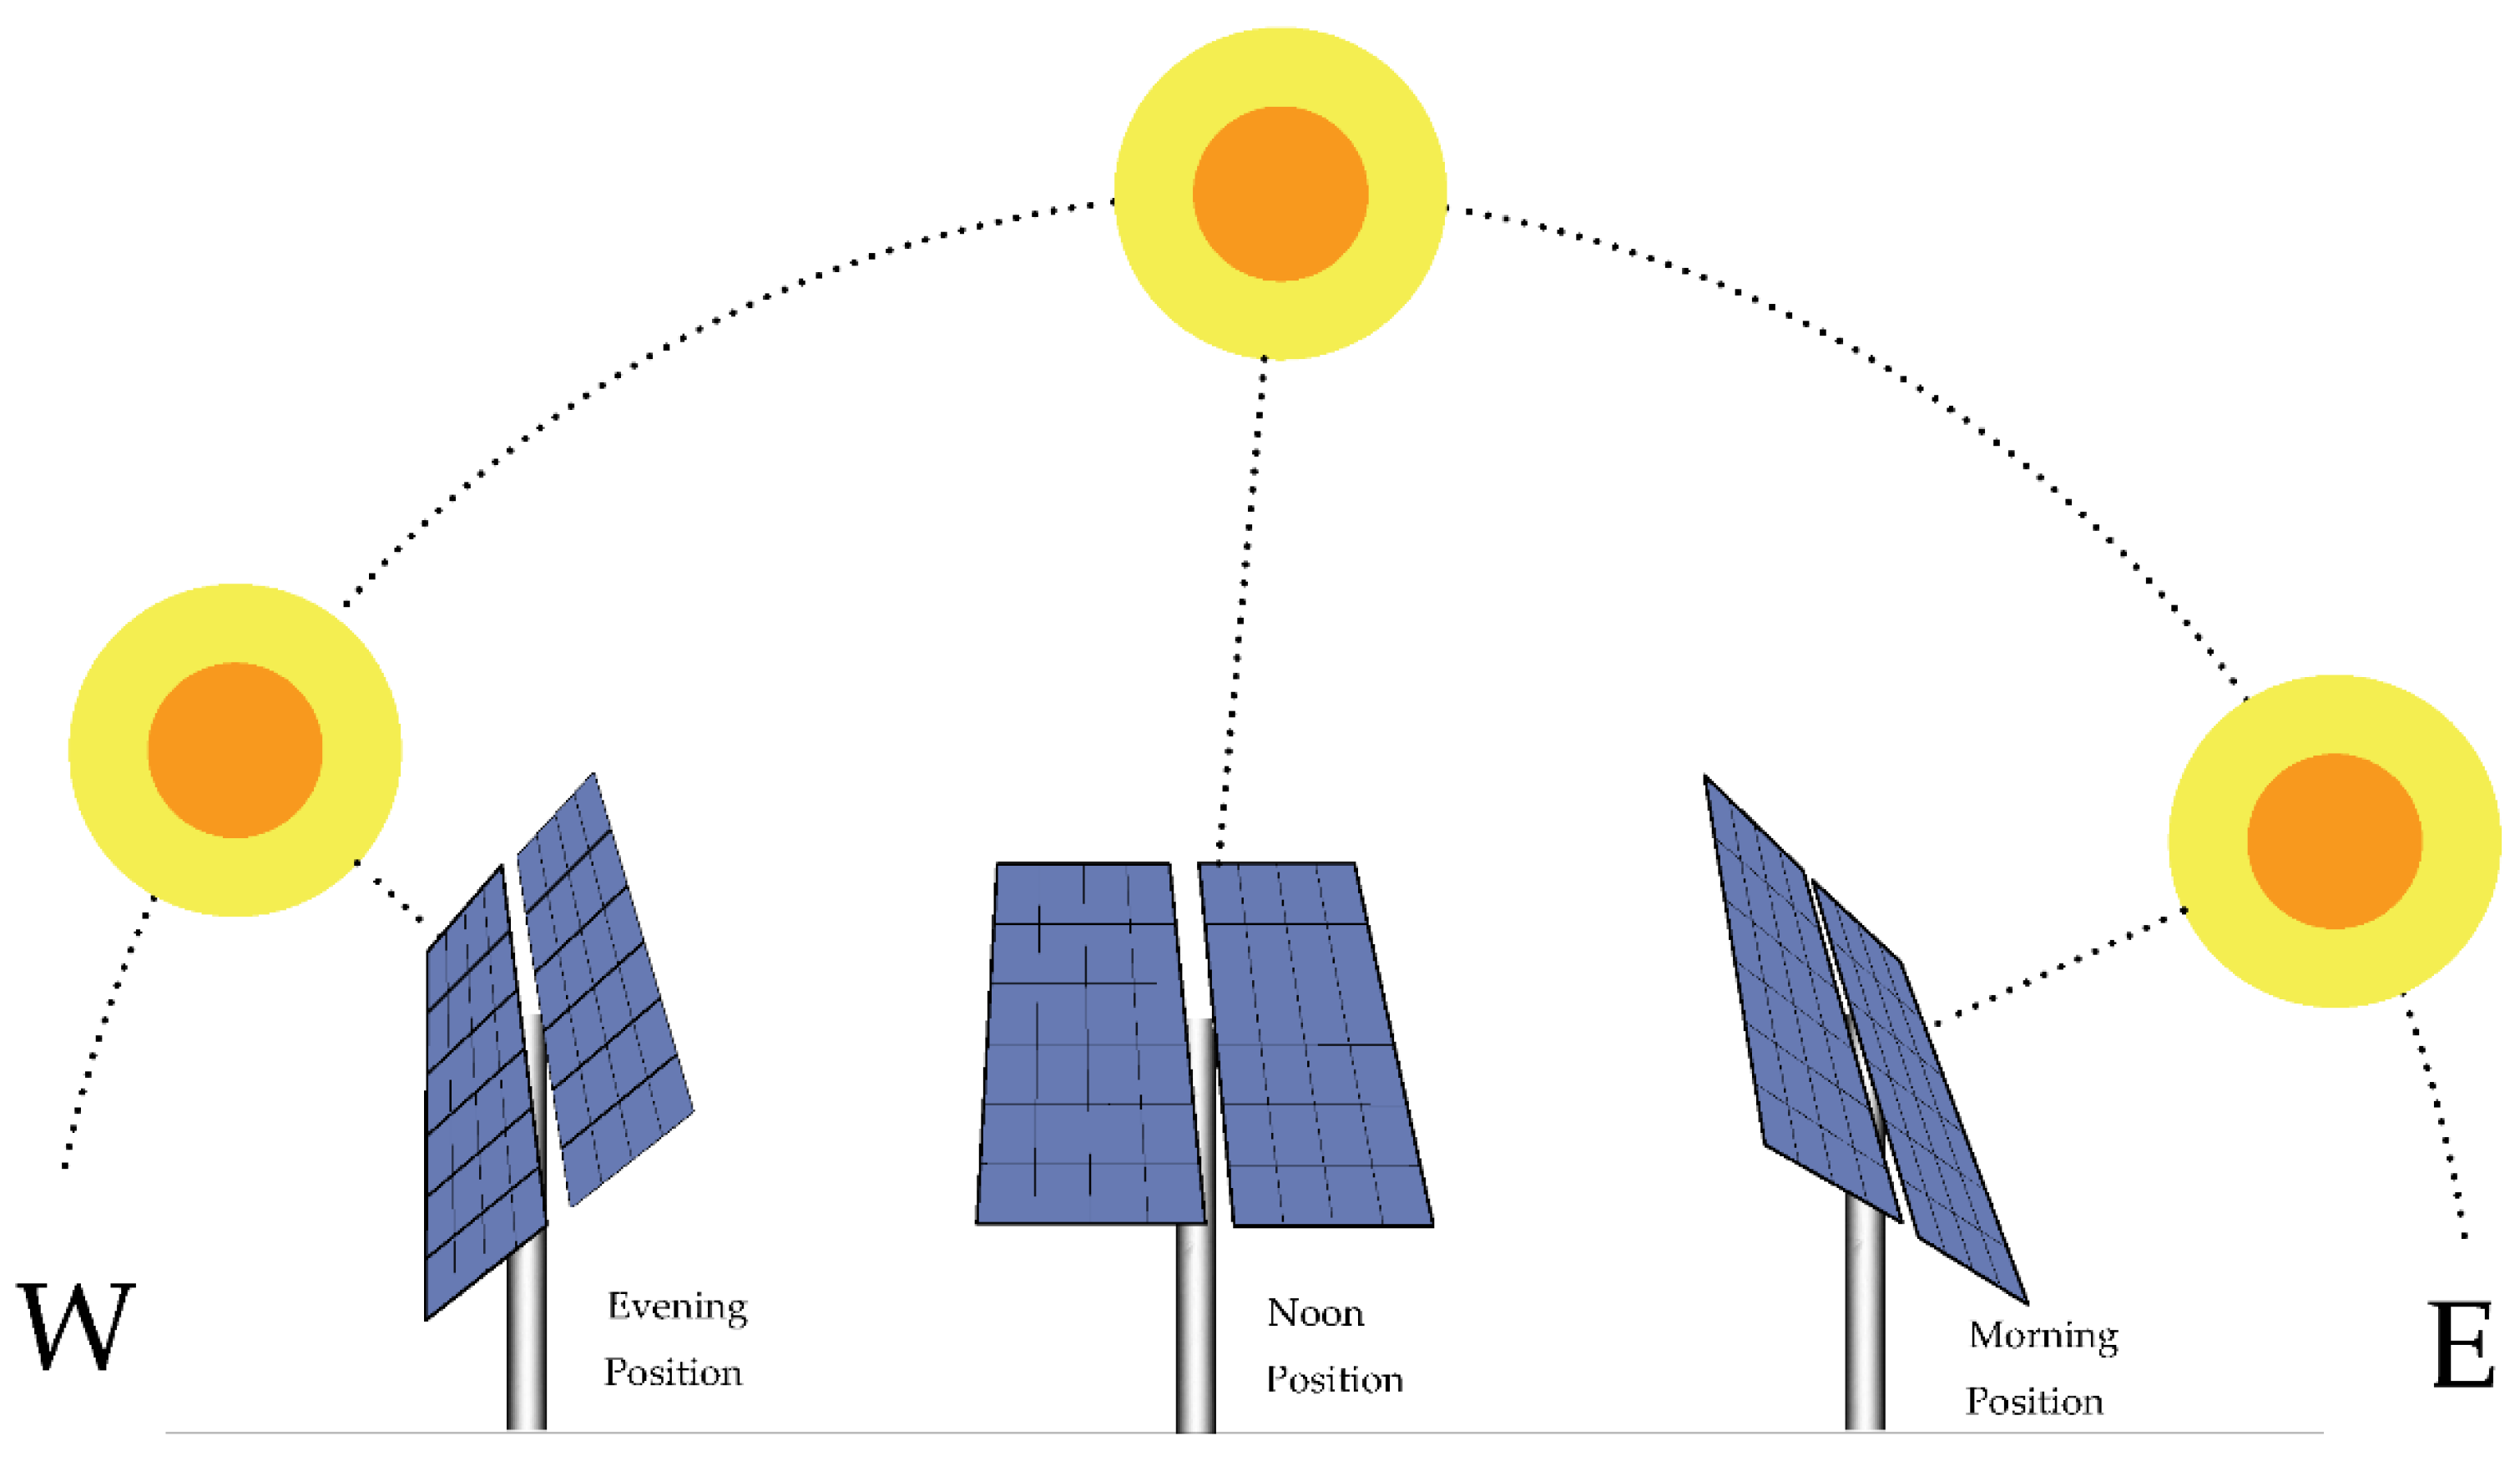
3.2.3. Single-Axis Horizontal Solar Tracking

SAHST has gained significant attention in the field of grid-connected PV solar power plant systems. This approach involves dynamically adjusting the tilt angle of PV modules to align them with the sun’s position throughout the day. By adjusting the tilt angle of PV modules, SAHST optimizes their orientation relative to the sun’s position. In this scenario, the tilt angle will rotate from a minimum tilt of 15 to a maximum tilt of 60 degrees [34]. This dynamic adjustment ensures that the PV modules receive maximum sunlight exposure throughout the day, resulting in a higher energy yield compared to fixed tilt and seasonal tilt. The increased energy yield can contribute to improved financial returns and a more efficient utilization of the PV plant’s capacity. SAHST allows the PV modules to operate at their peak power output for a longer duration during the day. By continually aligning the modules with the sun’s position, the system can capture a higher proportion of the available solar radiation. This leads to a more consistent and sustained generation of electricity at or near the system’s maximum power point, maximizing the overall energy yield of the PV plant. By dynamically adjusting the tilt angle of the PV modules to align with the sun’s position, this tracking strategy ensures maximum sunlight exposure throughout the day, resulting in improved energy yield [29,35,36]. After careful evaluation and consideration of economic viability and technical feasibility factors, the adoption of SAHST can significantly enhance the performance and efficiency of grid-connected PV solar power plants, maximizing annual energy yield, improving the performance and operation of grid-connected PV solar power plants, and preserving the environment through the reduction in CO2 [37,38,39].

3.2.4. Single-Axis Vertical Solar Tracking

SAVST is a technique used in solar power plants where the tilt angle of PV modules is laboriously adjusted to align with the sun’s position throughout the day, week, month, season, and year, as shown in Figure 4. This tracking system typically rotates the PV modules around a single axis (the north–south axis) to maximize their exposure to sunlight [40,41,42]. A SAVST system maintains a constant tilt angle of the panels while tracking the sun’s movement east to west, following the sun throughout the day, as shown in Figure 5. SAVST offers several advantages: PV modules can capture more sunlight throughout the day than fixed tilt and seasonal tilt systems, The modules generate more energy by tracking the sun continuously, ensuring a near-optimal angle of incidence, and further reducing their carbon footprint by reducing CO [43,44,45]. Lastly, the benefits of SAVST may vary depending on the specific location and climate conditions. Regions with high solar irradiance and clear skies may experience greater energy production gains compared to areas with frequent cloud cover or shading. In the case of the 15 MW grid-connected PV solar power plant in Kandahar province, Afghanistan, implementing SAVST could potentially increase energy production by continuously optimizing the orientation of the PV modules throughout the day. It is essential to assess the local solar resource, its economic viability, and its technical feasibility before implementing such a tracking strategy.

3.2.5. Difference between SAVST and SAHST

SAVST and SAHST are two vital methods employed to increase the energy yield of PV solar power plants. SAVST involves panels rotating vertically around a central axis, capturing more sunlight during the morning and evening hours. SAVST is beneficial in areas with significant east–west sun movement. On the other hand, SAHST features panels rotating horizontally along a single axis, maximizing sunlight capture during midday when the sun is at its highest point. SAHST is most effective in locations with a predominant movement of the sun along the horizon. Both SAVST and SAHST optimize energy generation compared to fixed and seasonal tilts, but the choice between them depends on different actors such as geographical location, available space, and solar irradiation patterns. The main differences between SAVST and SAHST are illustrated in Table 2.

4. Economic and Environmental Analysis

4.1. Economic Analysis

4.1.1. NPV

The methodology employed here aims to determine the NPV of implementing solar tracking strategies in a 15 MW grid-connected PV solar power plant. The NPV analysis serves as a crucial financial evaluation tool, considering the time value of money to assess the profitability of investment projects [25,46].
Calculating cash inflows from selling the solar power plant’s electricity is the first step in the NPV calculation. These inflows are projected over the expected lifetime of the project. To accurately assess the financial implications, the study incorporates various cash outflows associated with the implementation of the solar tracking strategies [47].
The cash outflows include several components, including the power-based investment cost of the solar tracking itself (0.068 USD/watt), import tax rates provided by the custom financial department of the Ministry of Finance (assumed to be 14% of the tracking system cost), transportation costs imposed by transportation companies (USD 175,595), and O&M costs imposed by solar tracking supplier companies (0.007 USD/watt/year). By considering these expenses, the methodology captures a comprehensive view of the financial requirements and implications of implementing the solar tracking [48].
It is important to note that this analysis does not incorporate inflation or a discount rate. This decision assumes that the SAVST and SAHST is a one-time investment with no need for replacement during its lifetime. Hence, future inflation and the discounting of cash flows are not considered in the NPV calculation [49].
P s p p = 15,101   k W p
P p b c = P s p p × $ 0.068   / w a t t
P p b c = 15,101,000   w a t t × $ 0.068 w a t t
P p b c = $ 1,026,868
P t x c = $ 1,026,868 + T - R a t e
P t x c = $ 1,026,868 + 14 % = $ 1,170,630
P t r c = $ 1,346,225
O & M   c o s t = P s p p × $ 0.007 w a t t / y e a r
O & M   c o s t = 15,101,000   w a t t × $ 0.007 w a t t y e a r = $ 105,707
P o & m c = $ 1,346,225 + $ 105,707 = $ 1,451,932
S T t c = P p b c + T - R a t e + t r c + O & M   c o s t
S T t c = $ 1,026,868 + $ 143,762 + $ 175,595 + $ 105,707
S T t c = $ 1,451,932
where Pspp is the solar power plant power, Ppbc is the solar tracking power-based cost, Ptx-c is the post-tax cost, Ptr-c is the post transportation cost, Po&m-c is the post O&M cost, T-Rate is the tax rate, tr-c is the transportation cost, and STtc the solar tracking total cost.
X = P × ( 1 + d ) n
X = $ 1,451,932 × ( 1 + 0.05 ) 3
X = $ 1,680,793
where X is the amount of money at the end of “n” years, P is the amount of money deposited, d is the interest rate, and n is the number of years. Here, the 5% interest rate is the standard value determined by the Afghanistan central bank.
The calculated NPV of USD 1,680,793 indicates a positive value, suggesting that the implementation of the SAVST or SAHST in the 15 MW grid-connected PV solar power plant is expected to generate a profit after considering the time value of money. This positive NPV signifies that the returns from the investment are anticipated to exceed the initial investment cost and operational expenses throughout the project’s lifetime.
By utilizing this methodology, stakeholders in the solar power industry can make informed decisions regarding the adoption of SAVST or SAHST. The financial implications derived from the NPV analysis contribute to a comprehensive understanding of the viability and profitability of incorporating such technologies into grid-connected PV solar power plants.

4.1.2. Payback Period

The payback period analysis is a crucial financial metric used to assess the time required to recover the initial capital investment.
To calculate the payback period, the solar tracking total cost based on the NPV analysis was utilized [48,50,51]. This cost represents the investment required for the implementation of SAVST or SAHST. Additionally, we considered the savings in electricity per year compared to two alternative scenarios: fixed tilt and seasonal tilt.
T = C S
where T is the payback period in years, C is the net initial capital cost based on the NPV, and S is the saving cost of electricity per year.

SAVST Payback Period

T c f t = C S c f t
where Tc-ft is the payback period compared to fixed tilt, Sc-ft is the saving cost of electricity compared to the fixed tilt scenario, the SAVST surplus annual energy yield compared to fixed tilt is 6680 MWh/year, and the defined energy tariff is 0.083 USD/kWh.
S c f t = 6,680,000 k W h y e a r × $ 0.083 k W h = 554,440 $ y e a r
T c f t = $ 1,680,793 554,440 $ y e a r = 3   y e a r s
where Tc-st is the payback period compared to the seasonal tilt, Sc-st is the saving cost of electricity compared to seasonal tilt, the SAVST surplus annual energy yield compared to seasonal tilt is 6336 MWh/year, and the defined energy tariff is 0.083 USD/kWh.
T c s t = C S c s t
S c s t = 6,336,000   k W h y e a r × $ 0.083 k W h = 525,888 $ y e a r
T c s t = $ 1,680,793 525,888 $ y e a r = 3.2   y e a r s

SAHST Payback Period

To calculate the SAHST payback period, the same procedure that was utilized for the SAVST payback period calculation is also utilized here, since the solar tracking total cost based on the NPV is the same, and the only difference is the savings in electricity per year compared to two alternative scenarios: fixed tilt and seasonal tilt. The surplus annual energy yield compared to fixed tilt and seasonal tilt is 1596 MWh/year and 1252 MWh/year, respectively, and the defined energy tariff is 0.083 USD/kWh.
T c f t = C S c f t
S c f t = 1,596,000 k W h y e a r × $ 0.083 k W h = 132,468 $ y e a r
T c f t = $ 1,680,793 132,468 $ y e a r = 12.7   y e a r s
T c s t = C S c s t
S c s t = 1,252,000 k W h y e a r × $ 0.083 k W h = 103,916 $ y e a r
T c s t = $ 1,680,793 103,916 $ y e a r = 16.2   y e a r s
Based on the calculations, the SAVST payback period for our investment compared to the fixed and seasonal tilt scenarios is projected to be 3 years. This means that it will take 3 years for the project to recover the initial capital investment and start generating positive returns, whereas the SAHST payback period for our investment compared to the fixed and seasonal tilt scenarios is 12.2 and 16.2 years, respectively.
Comparing the payback period results for the SAVST and SAHST scenarios is essential for evaluating project feasibility and financial viability. The shorter payback period of 3 years in the case of SAVST compared to SAHST suggests that the investment in SAVST is financially advantageous. It indicates a quicker recovery of the initial capital investment and a faster generation of positive returns.
Furthermore, the shorter payback period of SAVST compared to SAHST indicates that the implementation of SAHST requires a much longer duration to recoup the initial investment.
The significance of these payback period results lies in their implications for project feasibility and financial viability. The shorter payback period in the case of SAVST compared to the SAHST scenario strengthens the case for adopting the tracking technology. It signifies a higher potential for profitability and indicates that the investment can generate positive returns at a faster rate.
These findings provide valuable insights for stakeholders in the solar power industry, helping them make informed decisions regarding the implementation of SAVST. The payback period analysis contributes to a comprehensive understanding of the project’s financial feasibility and viability, enabling stakeholders to evaluate the profitability and potential risks associated with their investments.

4.2. Environmental Impact Analysis

After interviewing environmental, renewable energy, and market experts, and collecting natural gas CO2 emissions per kWh of electricity production as a reference from the National Environmental Protection Agency (NEPA), DABS, and the Ministry of Energy and Water (MeW), according to NEPA strategies and regulatory frameworks and internationally accepted statistics, it was estimated that the production of 1 kWh of electricity from natural gas results in approximately 0.5 kg of CO2 emissions.
F T a r C O 2 = F T a e y ( k W h y e a r ) × 0.5   k g   C O 2 k W h
F T a r C O 2 = 28,824 × 1000 k W h y e a r × 0.5   k g   C O 2 k W h = 14,412 t C O 2 y e a r
where FTar-CO2 is the fixed tilt annual reduction in CO2 and FTaey is fixed tilt annual energy yield.
S T a r C O 2 = S T a e y ( k W h y e a r ) × 0.5   k g   C O 2 k W h
S T a r C O 2 = 29,168 × 1000 k W h y e a r × 0.5   k g   C O 2 k W h = 14,584 t C O 2 y e a r
S T s a r C O 2 f t = 29,168 28,824 × 1000 k W h y e a r × 0.5   k g   C O 2 k W h = 172 t C O 2 y e a r
where STar-CO2 is the seasonal tilt annual reduction in CO2, STaey is seasonal tilt annual energy yield, and STsar-CO2-ft is the seasonal tilt surplus annual reduction in CO2 compared to fixed tilt.
S A H S T a r C O 2 = S A H S T a e y ( k W h y e a r ) × 0.5   k g   C O 2 k W h
S A H S T a r C O 2 = 30,420 × 1000 k W h y e a r × 0.5   k g   C O 2 k W h = 15,210 t C O 2 y e a r
S A H S T s a r C O 2 f t = 30,420 28,824 × 1000 k W h y e a r × 0.5   k g   C O 2 k W h = 798 t C O 2 y e a r
S A H S T s a r C O 2 s t = ( 30,420 29,168 ) × 1000 k W h y e a r × 0.5   k g   C O 2 k W h = 626 t C O 2 y e a r
where SAHSTar-CO2 is the SAHST annual reduction in CO2, SAHSTaey is SAHST annual energy yield, SAHSTsar-CO2-ft is the SAHST surplus annual reduction in CO2 compared to fixed tilt, and SAHSTsar-CO2-st is the SAHST surplus annual reduction in CO2 compared to seasonal tilt.
S A V S T a r C O 2 = S A V S T a e y ( k W h y e a r ) × 0.5   k g   C O 2 k W h
S A V S T a r C O 2 = 35,504 × 1000 k W h y e a r × 0.5   k g   C O 2 k W h = 17,752 t C O 2 y e a r
S A V S T s a r C O 2 f t = ( 35,504 28,824 ) × 1000 k W h y e a r × 0.5   k g   C O 2 k W h = 3340 t C O 2 y e a r
S A V S T s a r C O 2 s t = ( 35,504 29,168 ) × 1000 k W h y e a r × 0.5   k g   C O 2 k W h = 3168 t C O 2 y e a r
where SAVSTar-CO2 is the SAVST annual reduction in CO2, SAVSTaey is the SAVST annual energy yield, SAVSTsar-CO2-ft is the SAVST surplus annual reduction in CO2 compared to fixed tilt, and SAVSTsar-CO2-st is the SAVST surplus annual reduction in CO2 compared to seasonal tilt.
As a reference scenario, fixed tilt reduces CO2 emissions by 14,412 tCO2/year. The seasonal tilt scenario reduces CO2 emissions by 14,584 tCO2/year and SAHST reduces CO2 emissions by 15,210 tCO2/year. On the other hand, the SAVST scenario reduces CO2 emissions by 17,752 tCO2/per year; it reduces emissions by 3340 tCO2/year compared to the fixed tilt scenario, 3168 tCO2/year compared to the seasonal tilt scenario, and 2542 tCO2/year compared to the SAHST scenario.
The CO2 reduction analysis for each scenario shows significant environmental implications. The fixed tilt scenario already contributes to a substantial reduction of 14,412 tCO2/year emissions per year. The seasonal tilt scenario provides additional benefits, reducing CO2 emissions by 14,584 tCO2/year, and SAHST reduces CO2 emissions by 15,210 tCO2/year. However, the SAVST scenario surpasses all the scenarios in terms of CO2 reduction and financial savings, with a decrease of 3340 tCO2/year compared to the fixed tilt scenario, 3168 tCO2/year compared to the seasonal tilt scenario, and 2542 tCO2/year compared to the SAHST.
Comparing the four scenarios, it is evident that SAVST demonstrates the highest potential for CO2 reduction. This approach significantly contributes to mitigating climate change and promoting sustainable energy practices by reducing the reliance on fossil-fuel-based electricity generation.
The broader environmental impact and sustainability aspects of implementing these scenarios are substantial. By reducing CO2 emissions, these renewable energy solutions help combat climate change and promote a greener energy mix. The adoption of SAVST, with its significant CO2 reduction potential, represents a sustainable and forward-thinking approach to renewable energy generation. These findings underscore the importance of investing in renewable energy technologies to achieve a more sustainable and environmentally friendly energy future.

5. Results

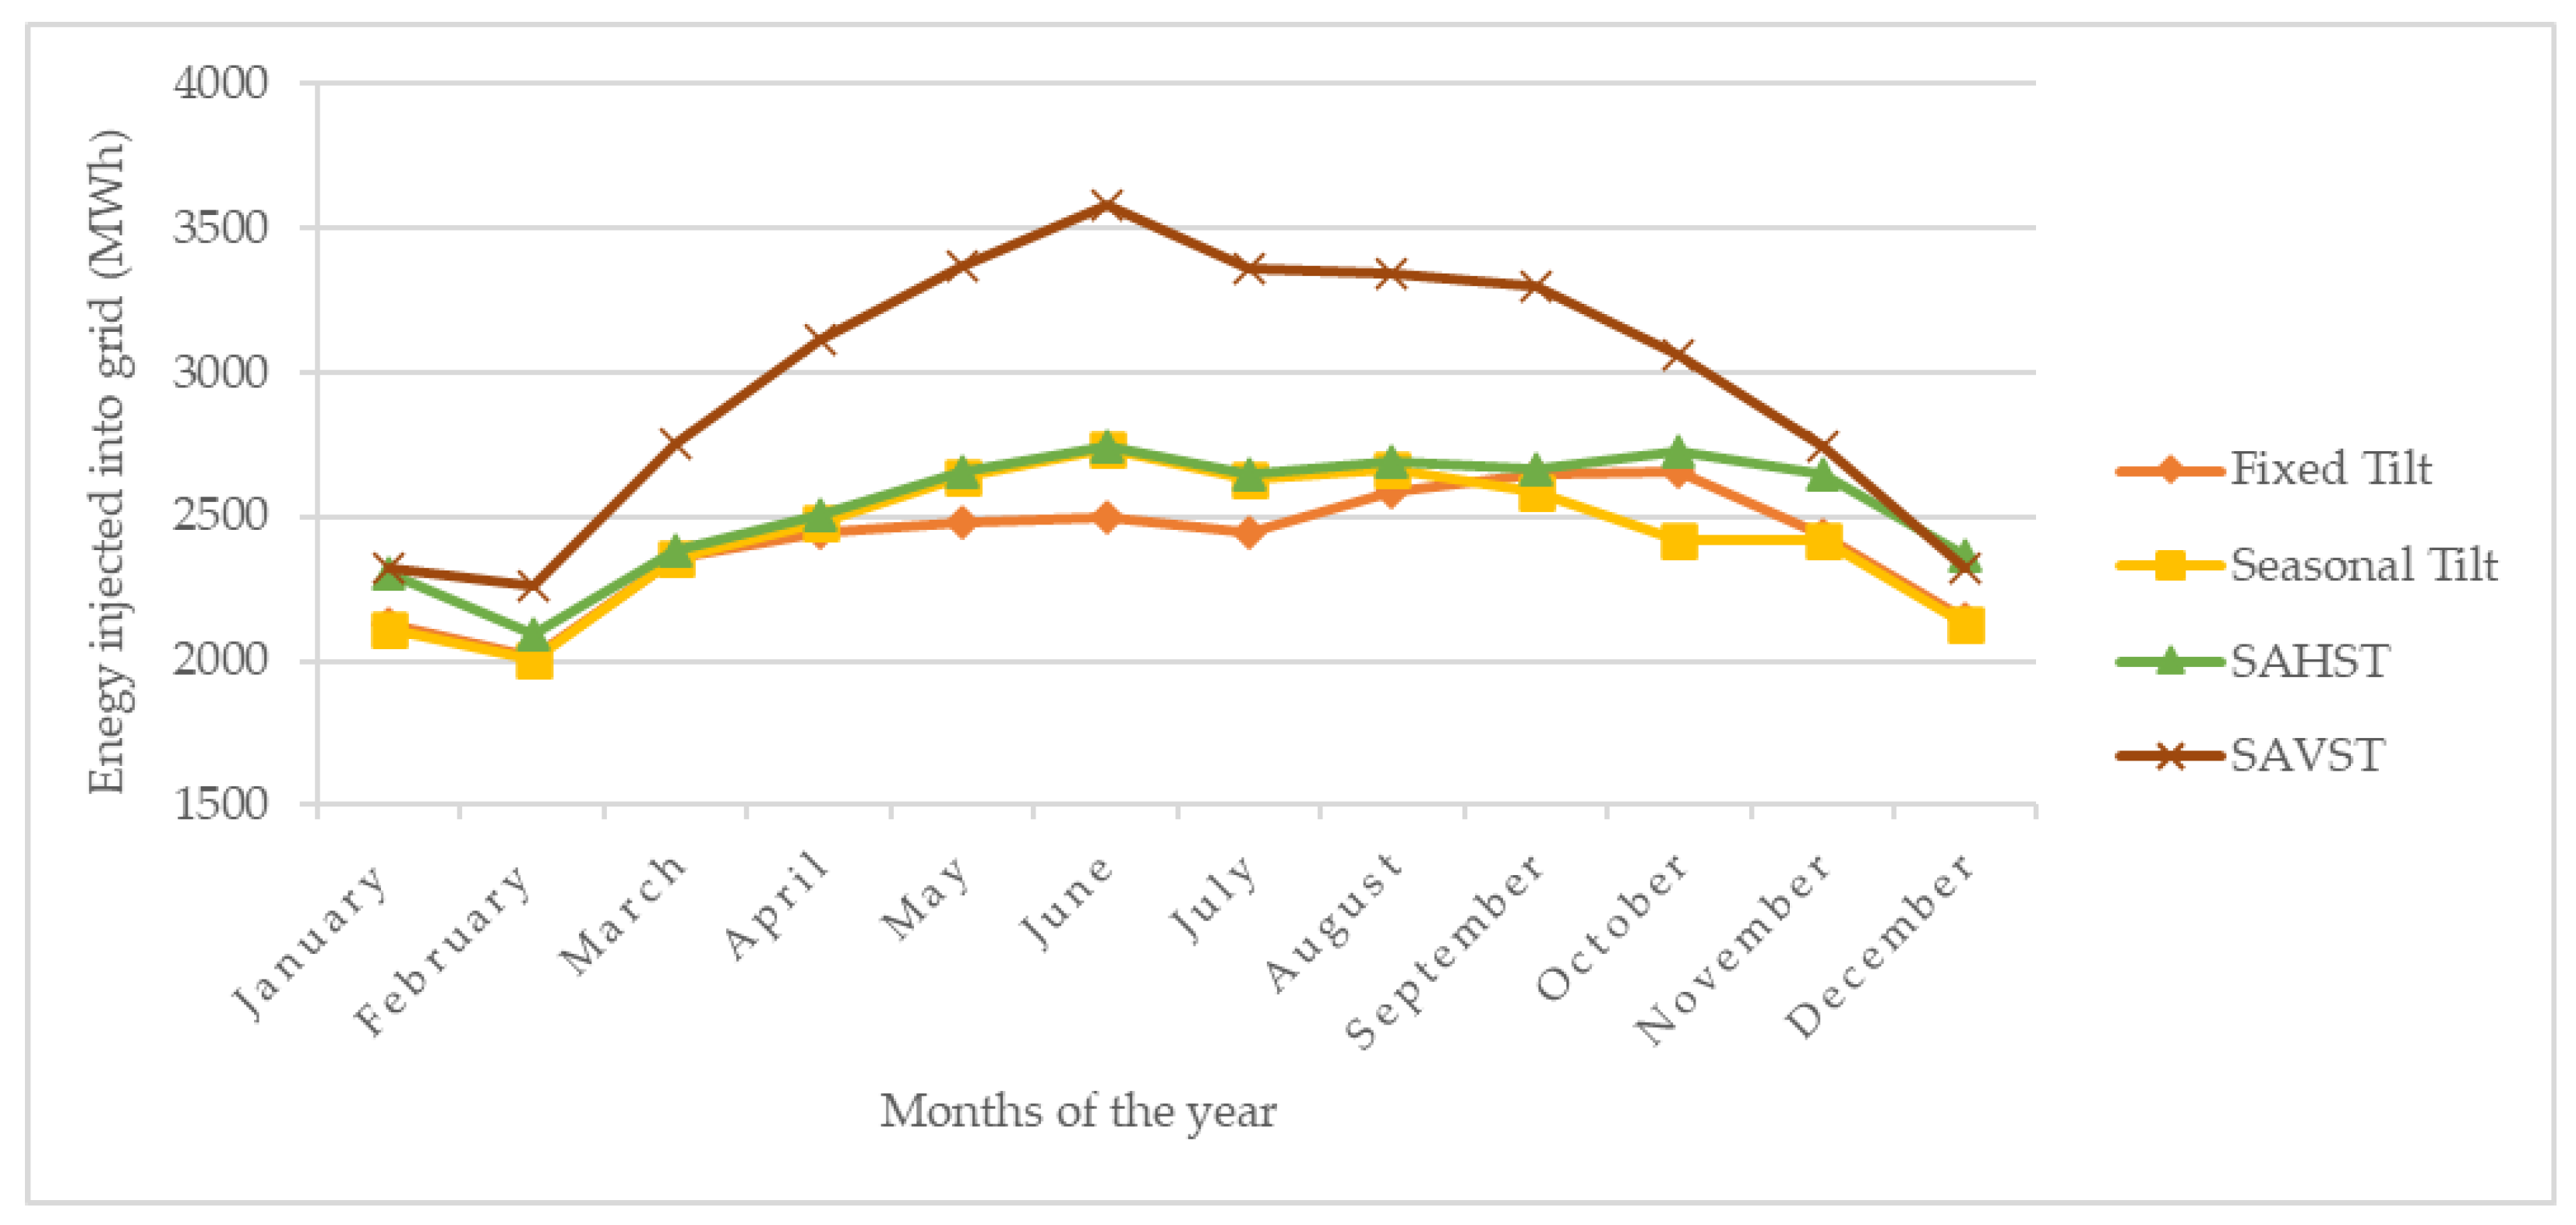
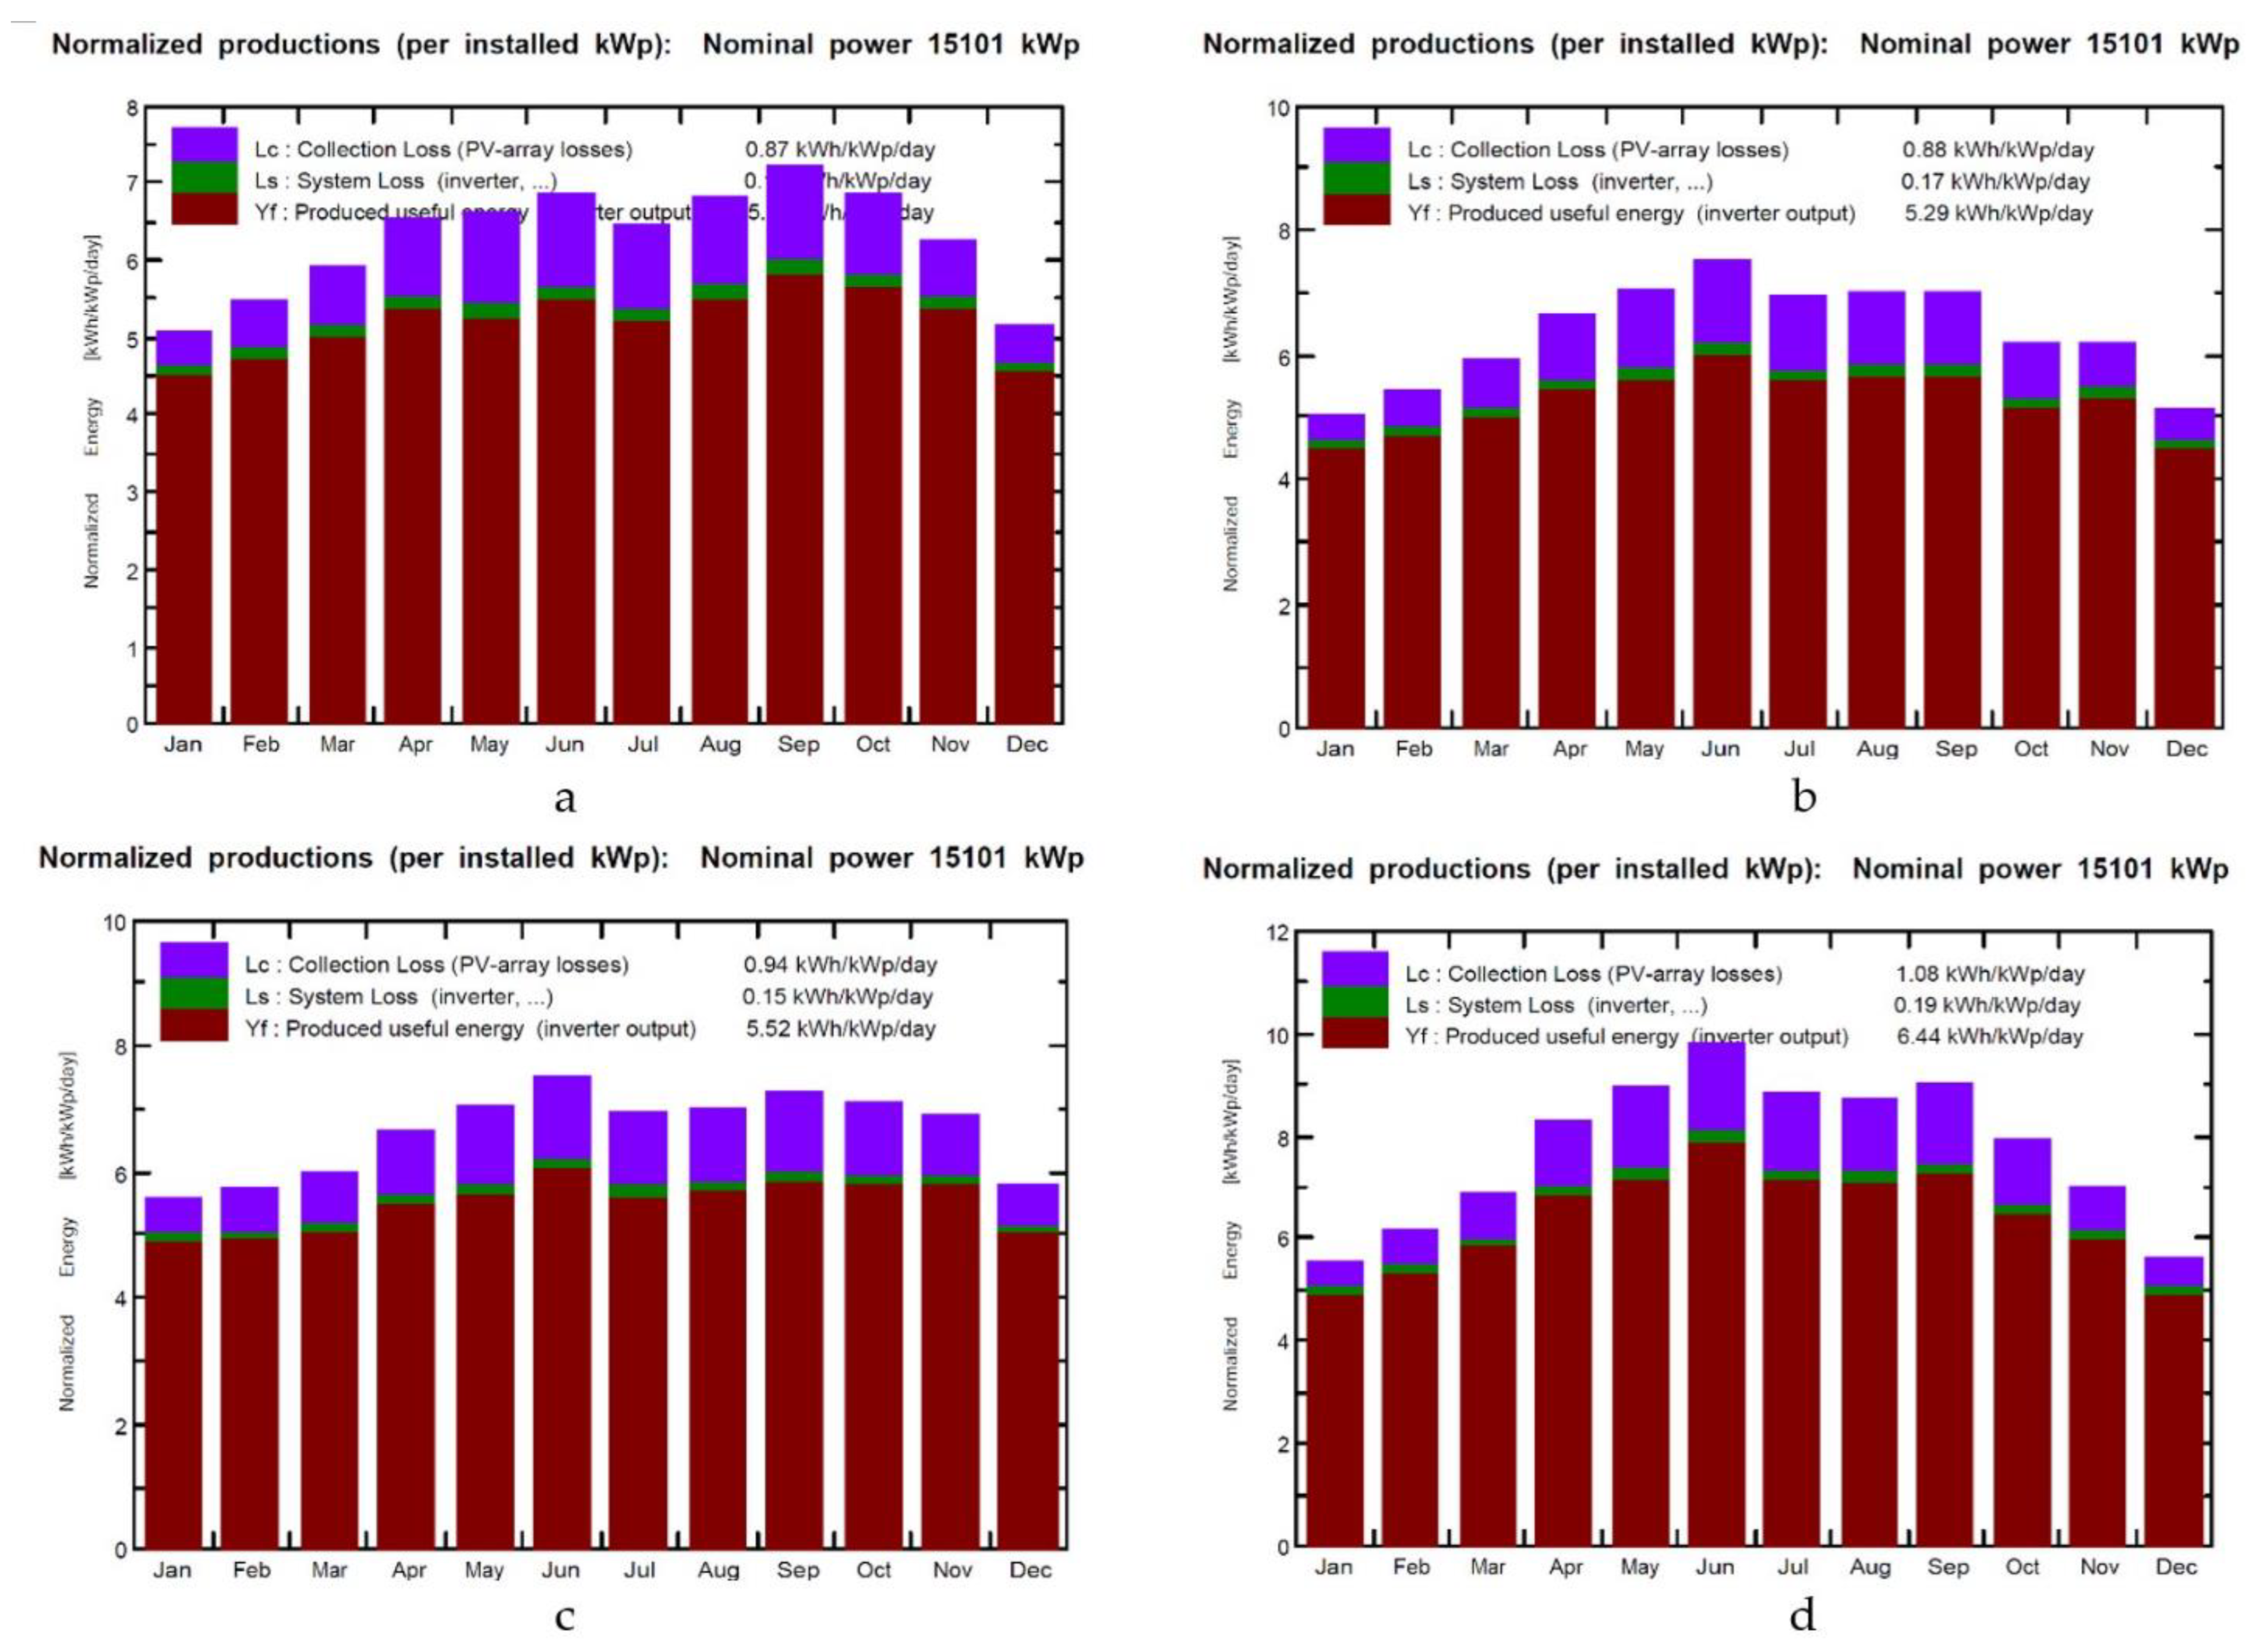
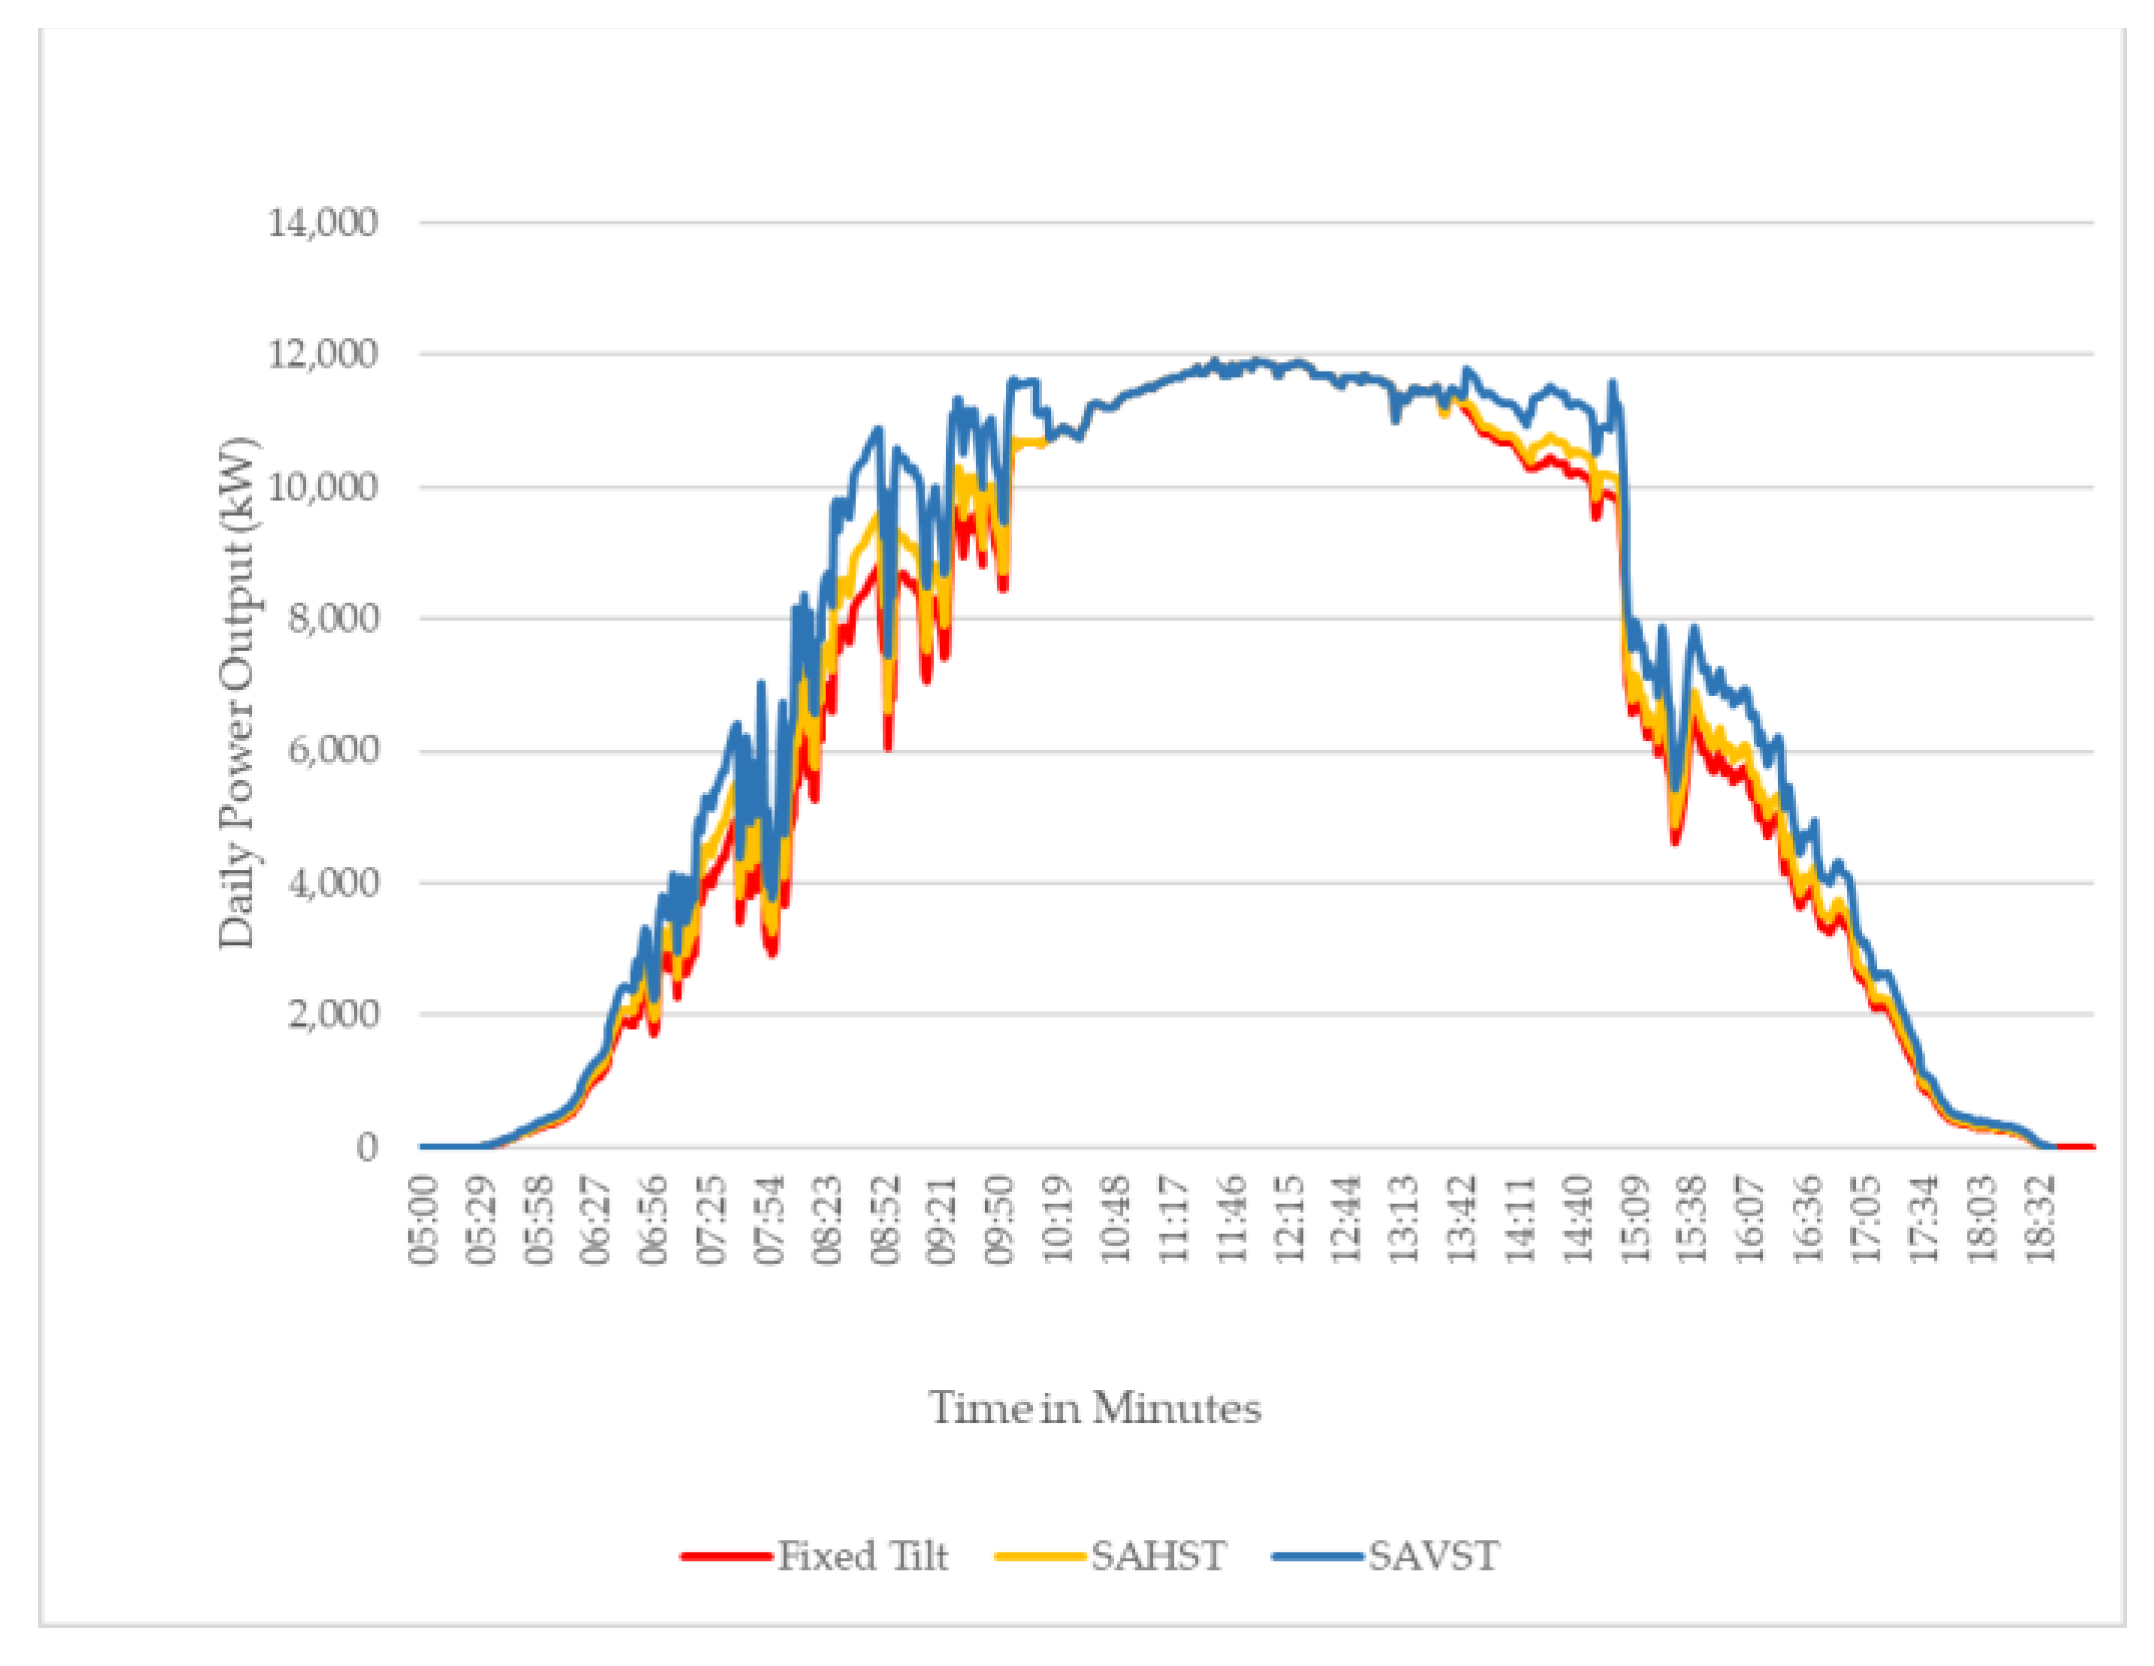
5.1. Energy Yield for Each Scenario

The formulas used to calculate specific yield (SY) and performance ratio (PR) using the PVsyst software are written below.
S p e c i f i c   Y i e l d ( S Y ) = E A C P D C
where EAC is the system’s annual energy yield and PDC is the installed rated PV array power (power at STC before losses).
P e r f o r m a n c e   R a t i o ( P R ) = E A C T h e o r i t i c a l   M a x i m u m   E n e r g y   Y i e l d
The analysis of energy yield results using PVSYST and mathematical models provided valuable information about the performance of the scenarios. As a reference, fixed tilt exhibits an annual energy yield of 28,824 MWh/year, a performance ratio (PR) of 83.43%, and a specific yield of 1909 kWh/kWp/year. In comparison, the seasonal tilt scenario demonstrates a slightly higher annual energy yield of 29,168 MWh/year, a PR of 83.51%, and a specific yield of 1932 kWh/kWp/year; meanwhile, SAHST illustrates an annual energy yield of 30420 MWh/year, a PR of 83.39%, and a specific yield of 2014 kWh/kWp/year. However, the SAVST scenario truly stands out, boasting an impressive annual energy yield of 35,504 MWh/year, a PR of 83.54%, and a specific yield of 2352 kWh/kWp/year. These findings, supported by the energy injected into the grid, normalize the energy production of the scenarios, as indicated in Figure 6 and Figure 7.
To provide a clearer understanding of how different scenarios affect energy generation, Figure 8 presents a graph that represents the power output throughout a standard day, spanning 24 h. This graph highlights the fluctuations in power production for each scenario. By comparing these power output graphs, we can identify differences in energy production and evaluate the effectiveness of the different scenarios. Furthermore, this analysis aids in assessing the economic aspects and visually showcasing the differences in power output across each scenario.

5.2. Comparison of Energy Yield and Financial Performance

A detailed comparison of the annual energy yield results among the scenarios sheds light on their respective abilities to maximize the annual energy yield. While seasonal tilt outperforms fixed tilt by generating an additional 344 MWh/year, and the SAHST outperforms fixed tilt and seasonal tilt by generating an additional 1596 MWh/year and 1250 MWh/year, respectively, it is the SAVST that truly shines. The SAVST surpasses all the scenarios, producing an extra 6680 MWh/year compared to the fixed tilt, an impressive 6336 MWh/year compared to the seasonal tilt, and an outstanding 5084 MWh/year compared to SAHST. These comparisons highlight the significant energy production potential of SAVAST, indicating its superiority in meeting the growing energy demand.
In addition to energy yield, financial performance indicators play a crucial role in evaluating project profitability. The calculated NPV of USD 1,680,793 indicates a positive value, signifying that the implementation of the SAVST is expected to generate a profit, considering the time value of money. Moreover, the shorter payback period of 3 years compared to SAHST reinforces the favorable investment return timeframe of SAVST. Despite the 3-year payback period, the financial advantages associated with the tracking system significantly outweigh any concerns, solidifying its attractiveness from both financial and operational perspectives.
S T s a e y f t = ( S T a e y F T a e y ) M W h y e a r
S T s a e y f t = ( 29,168 28,824 ) M W h y e a r = 344 M W h y e a r
S T s a e y c o s t f t = 344 × 1000 k W h y e a r × $ 0.083 k W h = 28,552 $ y e a r
where STsaey-ft is the seasonal tilt surplus annual energy yield compared to fixed tilt and STsaey-cost-ft is the seasonal tilt surplus annual energy yield cost compared to fixed tilt.
S A H S T s a e y f t = ( S A H S T a e y F T a e y ) M W h y e a r
S A H S T s a e y f t = ( 30,420 28,824 ) M W h y e a r = 1596 M W h y e a r
S A H S T s a e y c o s t f t = 1596 × 1000 k W h y e a r × $ 0.083 k W h = 132,468 $ y e a r
where SAHSTsaey-ft is the SAHST surplus annual energy yield compared to fixed tilt and SAHSTsaey-cost-ft is the SAHST surplus annual energy yield cost compared to fixed tilt.
S A H S T s a e y s t = ( S A H S T a e y S T a e y ) M W h y e a r
S A H S T s a e y s t = ( 30,420 29,168 ) M W h y e a r = 1252 M W h y e a r
S A H S T s a e y c o s t s t = 1252 × 1000 k W h y e a r × $ 0.083 k W h = 103,916 $ y e a r
where SAHSTsaey-st is the SAHST surplus annual energy yield compared to seasonal tilt and SAHSTsaey-cost-st is the SAHST surplus annual energy yield cost compared to seasonal tilt.
S A V S T s a e y f t = ( S A V S T a e y F T a e y ) M W h y e a r
S A V S T s a e y f t = ( 35,504 28,824 ) M W h y e a r = 6680 M W h y e a r
S A V S T s a e y c o s t f t = 6680 × 1000 k W h y e a r × $ 0.083 k W h = 554,440 $ y e a r
where SAVSTsaey-ft is the SAVST surplus annual energy yield compared to fixed tilt and SAVSTsaey-cost-ft is the SAVST surplus annual energy yield cost compared to fixed tilt.
S A V S T s a e y s t = ( S A V S T a e y S T a e y ) M W h y e a r
S A V S T s a e y s t = ( 35,504 29,168 ) M W h y e a r = 6336 M W h y e a r
S A V S T s a e y c o s t s t = 6336 × 1000 k W h y e a r × $ 0.083 k W h = 525,888 $ y e a r
where SAVSTsaey-st is the SAVST surplus annual energy yield compared to seasonal tilt and SAVSTsaey-cost-st is the SAVST surplus annual energy yield cost compared to seasonal tilt.
S A V S T s a e y S A H S T = ( S A V S T a e y S A H S T a e y ) M W h y e a r
SAVST s a e y S A H S T = ( 35,504 30,420 ) M W h y e a r = 5084 M W h y e a r
S A V S T s a e y c o s t S A H S T = 5084 × 1000 k W h y e a r × $ 0.083 k W h = 421,972 $ y e a r
where SAVSTsaey-SAHST is the SAVST surplus annual energy yield compared to SAHST, and SAVSTsaey-cost-SAHST is the SAVST surplus annual energy yield cost compared to SAHST.

5.3. Environmental Impact and Sustainability Aspects

The analysis of environmental impact focuses on the crucial aspect of reduction in CO2 emissions associated with each scenario. The fixed tilt scenario already contributes to a substantial reduction of 14,412 tCO2 emissions per year. Building upon this achievement, seasonal tilt takes this a step further, reducing CO2 emissions by 14,584 tCO2/year. The SAHST takes a much larger step, reducing CO2 emissions by 15,210 tCO2/year. However, it is the SAVST that surpasses all in terms of CO2 reduction, achieving a remarkable decrease of 3340 tCO2/year compared to fixed tilt, 3168 tCO2/year compared to seasonal tilt, and 2542 tCO2/year compared to SAHST. These results highlight the significant environmental implications and sustainability benefits associated with the implementation of SAVST.
By effectively reducing CO2 emissions, these grid-connected PV solar power plants make a substantial contribution to global efforts to combat climate change and promote a greener energy mix. The adoption of SAVST, with its noteworthy CO2 reduction potential, represents a forward-thinking and sustainable approach to renewable energy generation. It is imperative to emphasize not only the positive financial outcomes but also the environmental advantages that can be achieved through investments in grid-connected PV solar power plant tracking systems. The findings of this study underscore the critical importance of such investments in facilitating a successful transition towards a more sustainable and environmentally friendly energy future.
The comprehensive analysis of energy yield, financial performance, and environmental impact across the analyzed scenarios solidifies the superiority of SAVST in terms of energy production, financial returns, and CO2 emissions reduction. These results provide strong evidence to support the significance of investing in SAVST and highlight the potential benefits it offers for achieving a sustainable and greener future. Further research and analysis in this field can provide additional insights into optimizing renewable energy systems and maximizing their environmental and economic advantages, thus driving the global transition towards a more sustainable energy landscape.

6. Conclusions

This study analyzed and compared seasonal tilt angles and solar tracking strategies for maximizing annual energy yield, financial viability, and their environmental impact in a 15 MW grid-connected PV solar power plant. The key findings shed light on the performance of these scenarios in terms of energy yield, financial viability, and environmental impact. The fixed tilt scenario exhibited an annual energy yield of 28,824 MWh/year, while the seasonal tilt scenario demonstrated a slightly higher yield of 29,168 MWh/year. The SAHST scenario illustrated an annual energy yield of 30,420 MWh/year; however, it was the SAVST scenario that truly stood out, boasting an impressive annual energy yield of 35,504 MWh/year, which is 23% more than that of fixed tilt, 22% more than that of seasonal tilt, and 17% more than that of SAHST. SAVST outperformed all others and produced additional energy yields of 6680 MWh/year, 6336 MWh/year, and 5084 MWh/year compared to fixed tilt, seasonal tilt, and SAHST, respectively. In terms of environmental impact, SAVST also excelled, achieving remarkable reductions in CO2 emissions of 17,752 tCO2/year. Compared to fixed tilt, seasonal tilt, and SAHST, SAVST reduced CO2 emissions by 3340 tCO2/year, 3168 tCO2/year, and 2542 tCO2/year, respectively. It is worth mentioning that it will take 3 years for SAVST to recover the initial capital investment and start generating positive returns. These findings highlight the significant energy yield, environmental implications, and economic viability potential of SAVST.
In conclusion, this study demonstrated that SAVST with seasonal tilt adjustment has the fastest return on investment (ROI), highest annual energy yield, greatest CO2 emissions reduction, and optimal solar tracking strategy for installation in high-altitude and mountainous locations. By exploring and assessing these optimization strategies, this study contributes to the growing body of knowledge in renewable energy systems, fostering sustainable development and energy resilience.
For future studies and investigations, this study has established a strong foundation. Integration of energy storage with different tilt angles; concurrent analysis of seasonal tilt along with SAVST and SAHST; analysis of the effect of microclimatic factors, such as shading from nearby buildings or plants, on the energy yield of the solar power plant; comparative studies across different geographic regions with different solar radiation patterns and environmental factors; and analysis and control of solar power plants with the help of artificial intelligence could be potential topics for future extension of this manuscript.

Author Contributions

Conceptualization, H.Z. and M.A.; methodology, H.Z. and H.A.; software, H.A. and S.A.; validation, H.F. and M.A.; formal analysis, H.Z. and A.Y.; investigation, H.A. and A.Y..; resources, H.Z. and M.A.; data curation, S.A. and H.F.; writing—original draft preparation, H.Z. and H.A.; writing—review and editing, M.A. and A.Y.; visualization, H.F. and S.A.; supervision, A.Y. and M.A.; project administration, H.Z. All authors have read and agreed to the published version of the manuscript.

Funding

This research received no external funding.

Institutional Review Board Statement

Not applicable.

Informed Consent Statement

Not applicable.

Data Availability Statement

The corresponding author will provide the data upon request.

Acknowledgments

We would like to express our sincere gratitude to 77 Construction Company for their invaluable contribution to this research. Their generous provision of real-time data played a crucial role in enhancing the quality and accuracy of our study. The support and cooperation extended by their team were instrumental in enabling us to gather relevant information and analyze it effectively. We are truly thankful to 77 Construction Company for their assistance, which significantly enriched our research findings.

Conflicts of Interest

The authors declare no conflict of interest.

Abbreviations

AEICAfghanistan Energy Information Center
BOTBuilt-operate-transfer.
CoCompany
DABSDa Afghanistan Breshna Sherkat
IPPsIndependent power producers
MEWMinistry of Energy and Water
MoFMinistry of Finance
MWMegawatt
MWpMegawatt peak
NEPANational Environmental Protection Agency
NEPSNortheast power system
NPVNet present value
O&MOperation and maintenance
PRPerformance ratio
PsppSolar power plant power
ROIReturn on investment
SAHSTSingle axis horizontal solar tracking
SAVSTSingle axis vertical solar tracking
SCADASupervisory control and data acquisition
SEPSSoutheast Power System
SPSpecific yield
T-RateTax rate
WPSWest power system

References

  1. Carballo, J.A.; Bonilla, J.; Roca, L.; Berenguel, M. New low-cost solar tracking system based on open source hardware for educational purposes. Sol. Energy 2018, 174, 826–836. [Google Scholar] [CrossRef]
  2. Ge, L.; Du, T.; Li, C.; Li, Y.; Yan, J.; Rafiq, M.U. Virtual Collection for Distributed Photovoltaic Data: Challenges, Methodologies, and Applications. Energies 2022, 15, 8783. [Google Scholar] [CrossRef]
  3. Obara, S.; Matsumura, K.; Aizawa, S.; Kobayashi, H.; Hamada, Y.; Suda, T. Development of a solar tracking system of a nonelectric power source by using a metal hydride actuator. Sol. Energy 2017, 158, 1016–1025. [Google Scholar] [CrossRef]
  4. Khadidja, B.; Dris, K.; Boubeker, A.; Noureddine, S. Optimisation of a Solar Tracker System for Photovoltaic Power Plants in Saharian Region, Example of Ouargla. Energy Procedia 2014, 50, 610–618. [Google Scholar] [CrossRef] [Green Version]
  5. Zhu, Y.; Liu, J.; Yang, X. Design and performance analysis of a solar tracking system with a novel single-axis tracking structure to maximize energy collection. Appl. Energy 2020, 264, 114647. [Google Scholar] [CrossRef]
  6. Sidek, M.; Azis, N.; Hasan, W.; Ab Kadir, M.; Shafie, S.; Radzi, M. Automated positioning dual-axis solar tracking system with precision elevation and azimuth angle control. Energy 2017, 124, 160–170. [Google Scholar] [CrossRef]
  7. Naval, N.; Yusta, J.M. Comparative assessment of different solar tracking systems in the optimal management of PV-operated pumping stations. Renew. Energy 2022, 200, 931–941. [Google Scholar] [CrossRef]
  8. Al-Rousan, N.; Isa, N.A.M.; Desa, M.K.M. Advances in solar photovoltaic tracking systems: A review. Renew. Sustain. Energy Rev. 2018, 82, 2548–2569. [Google Scholar] [CrossRef]
  9. Hafez, A.Z.; Yousef, A.M.; Harag, N.M. Solar tracking systems: Technologies and trackers drive types—A review. Renew. Sustain. Energy Rev. 2018, 91, 754–782. [Google Scholar] [CrossRef]
  10. Rad, M.A.V.; Toopshekan, A.; Rahdan, P.; Kasaeian, A.; Mahian, O. A comprehensive study of techno-economic and environmental features of different solar tracking systems for residential photovoltaic installations. Renew. Sustain. Energy Rev. 2020, 129, 109923. [Google Scholar] [CrossRef]
  11. Abhilash, P.; Kumar, R.N.; Kumar, R.P. Solar powered water pump with single axis tracking system for irrigation purpose. Mater. Today Proc. 2020, 39, 553–557. [Google Scholar] [CrossRef]
  12. Awasthi, A.; Shukla, A.K.; Murali Manohar, S.R.; Dondariya, C.; Shukla, K.N.; Porwal, D.; Richhariya, G. Review on sun tracking technology in solar PV system. Energy Rep. 2020, 6, 392–405. [Google Scholar] [CrossRef]
  13. Dekkiche, M.; Tahri, T.; Denai, M. Techno-economic comparative study of grid-connected PV/reformer/FC hybrid systems with distinct solar tracking systems. Energy Convers. Manag. X 2023, 18, 100360. [Google Scholar] [CrossRef]
  14. Tarigan, E. Comparison of Energy Production Between Fixed-Mount and Tracking Systems of Solar PV Systems in Jakarta, Indonesia. Futur. Cities Environ. 2023, 9, 1–8. [Google Scholar] [CrossRef]
  15. Li, M.; Yang, M.; Yu, Y.; Lee, W.-J. A Wind Speed Correction Method Based on Modified Hidden Markov Model for Enhancing Wind Power Forecast. IEEE Trans. Ind. Appl. 2022, 58, 656–666. [Google Scholar] [CrossRef]
  16. Sun, B.; Li, Y.; Zeng, Y.; Chen, J.; Shi, J. Optimization planning method of distributed generation based on steady-state security region of distribution network. Energy Rep. 2022, 8, 4209–4222. [Google Scholar] [CrossRef]
  17. Hohne, P.A.; Kusakana, K.; Numbi, B.P. Model Development and Validation of a Dual-Axis PV Tracking System: A Case of South Africa. Int. J. Electr. Electron. Eng. Telecommun. 2021, 10, 288–293. [Google Scholar] [CrossRef]
  18. Chen, J.; Sun, B.; Li, Y.; Jing, R.; Zeng, Y.; Li, M. Credible capacity calculation method of distributed generation based on equal power supply reliability criterion. Renew. Energy 2022, 201, 534–547. [Google Scholar] [CrossRef]
  19. Sekyere, C.K.; Davis, F.; Opoku, R.; Otoo, E.; Takyi, G.; Atepor, L. Performance evaluation of a 20 MW grid-coupled solar park located in the southern oceanic environment of Ghana. Clean. Eng. Technol. 2021, 5, 100273. [Google Scholar] [CrossRef]
  20. Ngo, X.C.; Nguyen, T.H.; Do, N.Y.; Nguyen, D.M.; Vo, D.-V.N.; Lam, S.S.; Heo, D.; Shokouhimehr, M.; Nguyen, V.-H.; Varma, R.S.; et al. Grid-Connected Photovoltaic Systems with Single-Axis Sun Tracker: Case Study for Central Vietnam. Energies 2020, 13, 1457. [Google Scholar] [CrossRef] [Green Version]
  21. Dang, W.; Liao, S.; Yang, B.; Yin, Z.; Liu, M.; Yin, L.; Zheng, W. An encoder-decoder fusion battery life prediction method based on Gaussian process regression and improvement. J. Energy Storage 2023, 59, 106469. [Google Scholar] [CrossRef]
  22. Liang, J.; Kato, B.; Wang, Y. Constructing simplified models for dynamic analysis of monopile-supported offshore wind turbines. Ocean Eng. 2023, 271, 113785. [Google Scholar] [CrossRef]
  23. Cheng, F.; Li, J.; Zhou, L.; Lin, G. Fragility analysis of nuclear power plant structure under real and spectrum-compatible seismic waves considering soil-structure interaction effect. Eng. Struct. 2023, 280, 115684. [Google Scholar] [CrossRef]
  24. Sun, S.; Liu, Y.; Li, Q.; Wang, T.; Chu, F. Short-term multi-step wind power forecasting based on spatio-temporal correlations and transformer neural networks. Energy Convers. Manag. 2023, 283, 116916. [Google Scholar] [CrossRef]
  25. Asiabanpour, B.; Almusaied, Z.; Aslan, S.; Mitchell, M.; Leake, E.; Lee, H.; Fuentes, J.; Rainosek, K.; Hawkes, N.; Bland, A. Fixed versus sun tracking solar panels: An economic analysis. Clean Technol. Environ. Policy 2017, 19, 1195–1203. [Google Scholar] [CrossRef]
  26. Liu, Q.; Wan, X. LCOE Analysis of Solar Tracker Application in China. Comput. Water Energy Environ. Eng. 2020, 9, 87–100. [Google Scholar] [CrossRef]
  27. Bazyari, S.; Keypour, R.; Farhangi, S.; Ghaedi, A.; Bazyari, K. A Study on the Effects of Solar Tracking Systems on the Performance of Photovoltaic Power Plants. J. Power Energy Eng. 2014, 2, 718–728. [Google Scholar] [CrossRef]
  28. Alktranee, M.H.; Al-Yasiri, Q.; Sahib, M.M. Power output enhancement of grid-connected PV system using dual-axis tracking. Renew. Energy Environ. Sustain. 2020, 5, 8. [Google Scholar] [CrossRef]
  29. Baouche, F.Z.; Abderezzak, B.; Ladmi, A.; Arbaoui, K.; Suciu, G.; Mihaltan, T.C.; Raboaca, M.S.; Hudișteanu, S.V.; Țurcanu, F.E. Design and Simulation of a Solar Tracking System for PV. Appl. Sci. 2022, 12, 9682. [Google Scholar] [CrossRef]
  30. Alkaff, S.A.; Shamdasania, N.H.; Ii, G.Y.; Venkiteswaran, V.K. A Study on Implementation of PV Tracking for Sites Proximate and Away from the Equator. Process. Integr. Optim. Sustain. 2019, 3, 375–382. [Google Scholar] [CrossRef]
  31. Chowdhury, M.E.H.; Khandakar, A.; Hossain, B.; Abouhasera, R. A Low-Cost Closed-Loop Solar Tracking System Based on the Sun Position Algorithm. J. Sens. 2019, 2019, 3681031. [Google Scholar] [CrossRef] [Green Version]
  32. Gutierrez, S.; Rodrigo, P.M.; Alvarez, J.; Acero, A.; Montoya, A. Development and testing of a single-axis photovoltaic sun tracker through the internet of things. Energies 2020, 13, 10. [Google Scholar] [CrossRef]
  33. Wibowo, H.; Bow, Y.; Sitompul, C.R. Performance Comparison Analysis of Fixed and Solar-Tracker Installed Panel at PV System. IOP Conf. Ser. Earth Environ. Sci. 2021, 709, 012003. [Google Scholar] [CrossRef]
  34. Huang, B.; Huang, J.; Xing, K.; Liao, L.; Xie, P.; Xiao, M.; Zhao, W. Development of a Solar-Tracking System for Horizontal Single-Axis PV Arrays Using Spatial Projection Analysis. Energies 2023, 16, 4008. [Google Scholar] [CrossRef]
  35. Wang, J.; Tian, J.; Zhang, X.; Yang, B.; Liu, S.; Yin, L.; Zheng, W. Control of Time Delay Force Feedback Teleoperation System With Finite Time Convergence. Front. Neurorobotics 2022, 16, 877069. [Google Scholar] [CrossRef]
  36. Gu, Q.; Tian, J.; Yang, B.; Liu, M.; Gu, B.; Yin, Z.; Yin, L.; Zheng, W. A Novel Architecture of a Six Degrees of Freedom Parallel Platform. Electronics 2023, 12, 1774. [Google Scholar] [CrossRef]
  37. Ponniran, A.; Hashim, A.; Munir, H.A. A design of single axis sun tracking system. In Proceedings of the 2011 5th International Power Engineering and Optimization Conference, Shah Alam, Malaysia, 6–7 June 2011; pp. 107–110. [Google Scholar] [CrossRef] [Green Version]
  38. Lin, X.; Yu, R.; Yu, J.; Wen, H. Constant-Coupling-Effect-Based PLL for Synchronization Stability Enhancement of Grid-Connected Converter Under Weak Grids. IEEE Trans. Ind. Electron. 2022, 70, 11310–11323. [Google Scholar] [CrossRef]
  39. Zhang, X.; Wang, Y.; Yuan, X.; Shen, Y.; Lu, Z.; Wang, Z. Adaptive Dynamic Surface Control with Disturbance Observers for Battery/Supercapacitor-based Hybrid Energy Sources in Electric Vehicles. IEEE Trans. Transp. Electrif. 2022, 1. [Google Scholar] [CrossRef]
  40. Li, Z.; Liu, X.; Tang, R. Optical performance of inclined south-north single-axis tracked solar panels. Energy 2010, 35, 2511–2516. [Google Scholar] [CrossRef]
  41. Huang, X.-M.; Chen, N.; Ye, D.-N.; Zhong, A.-G.; Liu, H.; Li, Z.; Liu, S.-Y. Structurally Complementary Star-Shaped Unfused Ring Electron Acceptors with Simultaneously Enhanced Device Parameters for Ternary Organic Solar Cells. Sol. RRL 2023, 7, 2300143. [Google Scholar] [CrossRef]
  42. Lin, X.; Wen, Y.; Yu, R.; Yu, J.; Wen, H. Improved Weak Grids Synchronization Unit for Passivity Enhancement of Grid-Connected Inverter. IEEE J. Emerg. Sel. Top. Power Electron. 2022, 10, 7084–7097. [Google Scholar] [CrossRef]
  43. Liu, Y.; Gong, M.; Liang, L.; Liu, Q.; Gao, Y. Research and design of low-power grid-connected PV power generation system based on automatic solar tracking. Syst. Sci. Control. Eng. 2018, 6, 278–288. [Google Scholar] [CrossRef]
  44. Zhang, W.; Zheng, Z.; Liu, H. A novel droop control method to achieve maximum power output of photovoltaic for parallel inverter system. CSEE J. Power Energy Syst. 2022, 8, 1636–1645. [Google Scholar] [CrossRef]
  45. Zhao, P.; Ma, K.; Yang, J.; Yang, B.; Guerrero, J.M.; Dou, C.; Guan, X. Distributed Power Sharing Control Based on Adaptive Virtual Impedance in Seaport Microgrids With Cold Ironing. IEEE Trans. Transp. Electrif. 2022, 9, 2472–2485. [Google Scholar] [CrossRef]
  46. Axaopoulos, P.J.; Fylladitakis, E.D. Energy and economic comparative study of a tracking vs. a fixed photovoltaic system in the northern hemisphere. Int. J. Energy Environ. Econ. 2013, 21, 1–20. [Google Scholar]
  47. Qader, V.S.; Ali, O.M.; Hasan, N.I. Technical, Economic and Environmental Comparison of Three Different Grid-Connected PV Tracking Systems Power Plant Under Kurdistan Region/Iraq Climate Condition. Eurasia Proc. Sci. Technol. Eng. Math. 2022, 17, 102–119. [Google Scholar] [CrossRef]
  48. Vermaak, H. Techno-economic Analysis of Solar Tracking Systems in South Africa. Energy Procedia 2014, 61, 2435–2438. [Google Scholar] [CrossRef] [Green Version]
  49. Wang, P.; Yu, P.; Huang, L.; Zhang, Y. An integrated technical, economic, and environmental framework for evaluating the rooftop photovoltaic potential of old residential buildings. J. Environ. Manag. 2022, 317, 115296. [Google Scholar] [CrossRef]
  50. Huang, N.; Zhao, X.; Guo, Y.; Cai, G.; Wang, R. Distribution network expansion planning considering a distributed hydrogen-thermal storage system based on photovoltaic development of the Whole County of China. Energy 2023, 278, 127761. [Google Scholar] [CrossRef]
  51. Jiang, J.; Zhang, L.; Wen, X.; Valipour, E.; Nojavan, S. Risk-based performance of power-to-gas storage technology integrated with energy hub system regarding downside risk constrained approach. Int. J. Hydrogen Energy 2022, 47, 39429–39442. [Google Scholar] [CrossRef]
Figure 1. Block diagram of the 15 MW grid-connected PV solar power plant (b stands for DC and c c stands for AC).
Sustainability 15 11053 g001
Figure 2. Detailed data collection and simulation process flow chart.
Sustainability 15 11053 g002
Figure 3. Actual photo of the 15 MW grid-connected PV solar power plant with 15- and 30-degree seasonal tilt, Kandahar, Afghanistan.
Sustainability 15 11053 g003
Figure 4. SAVST with seasonal tilt adjustment.
Sustainability 15 11053 g004
Figure 5. Schematic diagram of SAVST.
Sustainability 15 11053 g005
Figure 6. Energy injected into the grid.
Sustainability 15 11053 g006
Figure 7. Scenarios’ normalized energy productions: (a) fixed tilt; (b) seasonal tilt; (c) SAHST; (d) SAVST.
Sustainability 15 11053 g007
Figure 8. Scenarios’ daily power output.
Sustainability 15 11053 g008
Table 1. Detailed parameters of the 15 MWp PV solar power plant.
15 MWp PV Solar Power Plant
Geographical Information
CountryProvince Time ZoneLatitudeLongitude
AfghanistanKandaharUT + 4.531.46° N65.86° E
PV Module
Type ModelPower (Wp) Manufacturer
Si-polyQ. POWER-G5 275275Hanwha Q Cells (Seoul, South Korea)
Total Number of PV Modules
Total PV ModuleIn Series In Parallel
54,91222 modules2496 strings
Array Global Power
Nominal (STC)At Operating Condition
15,101 kWp13,594 kWp (50 °C)
Array Operating Characteristics (50 ℃)
UmppImpp
618 V22,000 A
Total Area
Module AreaCell Area
89,789 m280,193 m2
Inverter
TypeModelUnit PowerTotal PowerOperating Voltage Manufacturers
MPPTPVS-120-TL120 kWac12,480 kWac360–1000 VABB
Table 2. The main differences between SAVST and SAHST.
Difference between SAVST and SAHST
SAVSTSAHST
Vertical axis of rotation (north–south direction)Horizontal axis of rotation (east–west direction)
Suitable for high-latitude locationsSuitable for low-latitude locations
Less maintenanceMore maintenance
Simple mechanical designComplex mechanical design
Aesthetics (more visually appealing)Aesthetics (less visually appealing)
Captures more sunlight during the morning and evening hours when the sun is lower in the skyCaptures more sunlight during the midday hours when the sun is at its highest point in the sky
No need for precise ground leveling More accurate ground leveling needed
Minimizes the shadowing effect between adjacent rows of panelsLead to potential shadowing between rows of panels
Disclaimer/Publisher’s Note: The statements, opinions and data contained in all publications are solely those of the individual author(s) and contributor(s) and not of MDPI and/or the editor(s). MDPI and/or the editor(s) disclaim responsibility for any injury to people or property resulting from any ideas, methods, instructions or products referred to in the content.

