Article

Accounting for the Logic and Spatiotemporal Evolution of the Comprehensive Value of Cultivated Land around Big Cities: Empirical Evidence Based on 35 Counties in the Hefei Metropolitan Area

1
School of Public Policy and Management, Anhui Jianzhu University, Hefei 230022, China
2
Anhui Urban Management Research Center, Hefei 230022, China
3
Jianghuai Key Laboratory of Cultivated Land Resources Protection and Ecological Restoration, Ministry of Natural Resources, Hefei 230601, China
*
Author to whom correspondence should be addressed.
Sustainability 2023, 15(14), 11048; https://doi.org/10.3390/su151411048
Submission received: 25 May 2023 / Revised: 30 June 2023 / Accepted: 12 July 2023 / Published: 14 July 2023

Abstract

:
Exploring the value of cultivated land resources around big cities is an important prerequisite for when realizing the “trinity” of cultivated land protection in terms of quantity, quality, and ecology. At present, the value of cultivated land resources faces the problem of having a low comparative efficiency of economic output, inadequate visualisation of asset value, and serious undervaluation. The manifestation of social, ecological, and cultural values in cultivated land plays an important role in accurately calculating the value of cultivated land. Therefore, this study attempted to clarify the composition and account for the logic of the comprehensive value of cultivated land around big cities. Taking the Hefei metropolitan area as an example, we used mathematical modeling and geostatistical analysis to measure the integrated value of cultivated land around big cities from 2010 to 2020 and analyse the spatial and temporal evolution characteristics and influencing factors. The results revealed a 2:7:1 ratio of economic, social, ecological, and cultural values for cultivated land in the metropolitan area. The comprehensive value of cultivated land was higher in 2020 than in 2010, was approximately 7.7 times the current compensation standard, and was significantly affected by the natural geography, economic development, cultivated land conditions, and protection policies. Furthermore, the comprehensive value showed spatial differentiation characteristics of ‘high in the east and south and low in the west and north’, and a spatial agglomeration effect was evident in some areas. A significant increase was observed in the social value of cultivated land, followed by an increase in the ecological and cultural values, whereas a slow downward trend was observed for the economic value. The economic value of cultivated land around big cities showed a downward trend, whereas the social, ecological, and cultural values showed upward trends. In the future, differentiated policy tools should be adopted based on the spatial heterogeneity of the comprehensive value of cultivated land in the Hefei metropolitan area to enhance their comprehensive value. In addition, scientific and reasonable compensation standards should be established, and high-quality agricultural development with the high-level protection of cultivated land should be promoted in metropolitan areas.

1. Introduction

As a basic material for agricultural production, cultivated land is essential for guaranteeing national food production, safeguarding ecological security, and promoting sustainable development [1,2]. The State of Food Security and Nutrition in the World 2022 report stated that 828 million people worldwide were affected by hunger, and an annual increase of 2.7–4.9 Mha in cultivated land was required on average to address population growth [3]. The United Nations Convention to Combat Desertification (UNCCD) assessment report stated that one-fifth of the world’s land (over 2 billion hectares) was degraded, with more than half accounted for by agricultural land, threatening the livelihoods of 3.2 billion people worldwide [1,4]. China has adopted the ‘world’s most stringent cultivated land protection policy’ and is dedicated to implementing strategies to improve the quantity and quality of cultivated land. It has effectively mitigated the rapid reduction in high-quality cultivated land resources. However, only limited changes have been observed in the trend of reducing cultivated land resources, with a net reduction of 7.53 million hectares in cultivated land observed between 2009 and 2019 and a net decrease of 2.27 million hectares observed around big cities [1]. Although the report of the 20th National Congress of the Communist Party of China (CPC) reiterated that ‘the boundary of 1.8 billion acres of cultivated land should be firmly guarded’, the constructed comprehensive value accounting system developed for cultivated land remains imperfect; furthermore, the social, ecological, and cultural values of cultivated land have not been clarified, which has led to a critical underestimation of the true value of cultivated land and the crude utilisation of the accounting system [5,6]. The National Fourteenth Five-Year Plan and the Outline of Vision 2035 were proposed to ‘improve the property rights system of natural resource assets and laws and regulations’. The comprehensive value accounting for cultivated land is an essential part of the reform of the property rights system of natural resource assets [4,6].
The comprehensive value accounting for cultivated land has originated from the System of Environmental-Economic Accounting (SEEA) in the United States, and several foreign scholars have subsequently studied the economic value of its resources using the production function, land market, and shadow value methods [1,7]. The gradual enrichment of theory and practice in the United States has prompted scholars to focus on various economic models to estimate the asset value of cultivated land, such as the hedonic pricing and crop yield models [8,9,10,11]. In Europe, scholars have adopted a more integrated approach, which has focused on understanding the environmental benefits of agriculture and developed sustainable land use policies which integrate socioeconomic, ecological, and political factors [3,12]. In Australia, social value accounting represents a trend for studying the valuation of agricultural land, exploring how cultivated land promotes regional development and rural livelihoods, and determining methods of how to reclaim cultivated land [13]. In China, earlier studies have primarily focused on the quantitative measurements of economic price assessments in cultivated land, whereas recent studies have diverged into accounting for cultivated land resources and their influencing factors, constraints, and enhancement measures [14,15,16]. Chinese scholars have reached a consensus that cultivated land has diverse values and multifunctional resources. Scholars have measured different regional values of cultivated land resources by constructing ‘economic-social-ecological’ value models. However, they have not reached a consensus on the accounting logic and calculation method [17,18]. In addition, based on other theoretical foundations, studies have explored the connotation of cultivated land resource values from additional perspectives, including combining labour and utility value theories and using a modified marginal utility model to measure the material and spiritual value of cultivated land [9,19,20,21]. A large number of empirical cases have been reported by Chinese scholars on the comprehensive values that account for cropland resources, and Table 1 lists the typical results obtained by Chinese cropland value accounting studies [6,8,17,18,19,20,21,22,23,24,25,26,27,28,29]. The calculation of cultivated land value at large scales has primarily been based on the average net income or output value of regional cultivated land and estimated using the income reduction method [24,25,26,27,28,29,30,31,32,33,34,35]. Microscale studies have focused on the multifunctionality of cultivated land and calculated the comprehensive value of cultivated land from three aspects: economy, society, and ecology. However, few explanations of the accounting logic have been provided, and the logical evolution and analytical framework of the comprehensive value of cultivated land has been partially constructed based on value theory.
Therefore, based on the functional value theory, this study explains the accounting logic behind the comprehensive value of cultivated land from ‘attribute→function→value’ aspects and constructs an accounting system and evaluation model. Thirty-five counties in the Hefei metropolitan area were taken as the study area, and the comprehensive value and spatiotemporal evolution characteristics of cultivated land in this area between 2010 and 2020 were calculated and analysed. This study provides a reference for the accounting of cultivated land resource assets, a compilation of balance sheets and land expropriation compensation, and an analysis of the balance between cultivated land occupation and compensation.

2. Materials and Methods

2.1. Selection of Study Area

The Hefei metropolitan area is located in the central part of Anhui Province. It represents an essential economic growth pole for the Yangtze River Delta urban agglomeration and is a leading demonstration area for agricultural modernisation. This region includes the cities of Hefei, Huainan, Lu’an, Chuzhou, Wuhu, Ma’anshan, and Tongcheng (county-level cities), with an additional 35 county-level districts (Figure 1). The land area is 634,000 hm2, which accounts for 45.27% of the total area of the province. The area is characterised by a mild subtropical monsoon climate and has four distinct seasons. Furthermore, the area is suitable for agricultural production and plant development and represents an essential commodity-, grain-, and oil-production base in China. In 2021, the urbanisation rate was 68%, and the regional gross domestic product (GDP), fiscal revenue, and total retail sales of social consumer goods values were 273.06, 211.11, and 1298.1 billion yuan, which accounted for 63.6%, 60.3%, and 60.5% of the total in this province, respectively. The cultivated land area was calculated to be approximately 279,000 hm2, accounting for 53% of the total in the Anhui Province. Cultivated land resources present prominent multifunctionality, thus providing grain production in agricultural land, ecological service functions as semi-natural habitats, and a unique cultural landscape and social service functions within a ‘metropolitan back garden’. Thus, the study area provided representative cultivated land areas for big cities.

2.2. Data Sources

This study mainly used land use and socio-economic data. Land use data were from the Resource and Environmental Science Data Center (RESDC) of the Chinese Academy of Sciences (http://www.resdc.cn) (accessed on 20 August 2022) and the results of the Third Land Survey of China. These data were mainly used for the extraction of the cultivated land area. Social statistics were mainly used to calculate the quantity and correction coefficient of the cultivated land value. The main categories and data sources were as follows: some data were derived from the Anhui Statistical Yearbook, the municipal statistical yearbook, and the county statistical bulletin (2011–2021), including the main crop yield and sown area, agricultural GDP, and agricultural population. National agricultural production data were from the China Statistical Yearbook (2011–2021). The net income per unit area of different agricultural products and the prices of major agricultural products came from a Compilation of Cost–benefit Data of Agricultural Products in China (2011–2021). All kinds of social security data were from the Statistical Bulletin of Human Resources and Social Security Development in Anhui Province, and the comprehensive land value level was derived from the China Urban Land Price Dynamic Monitoring Network (http://www.landvalue.com.cn) (accessed on 10 October 2022).

2.3. Research Methods

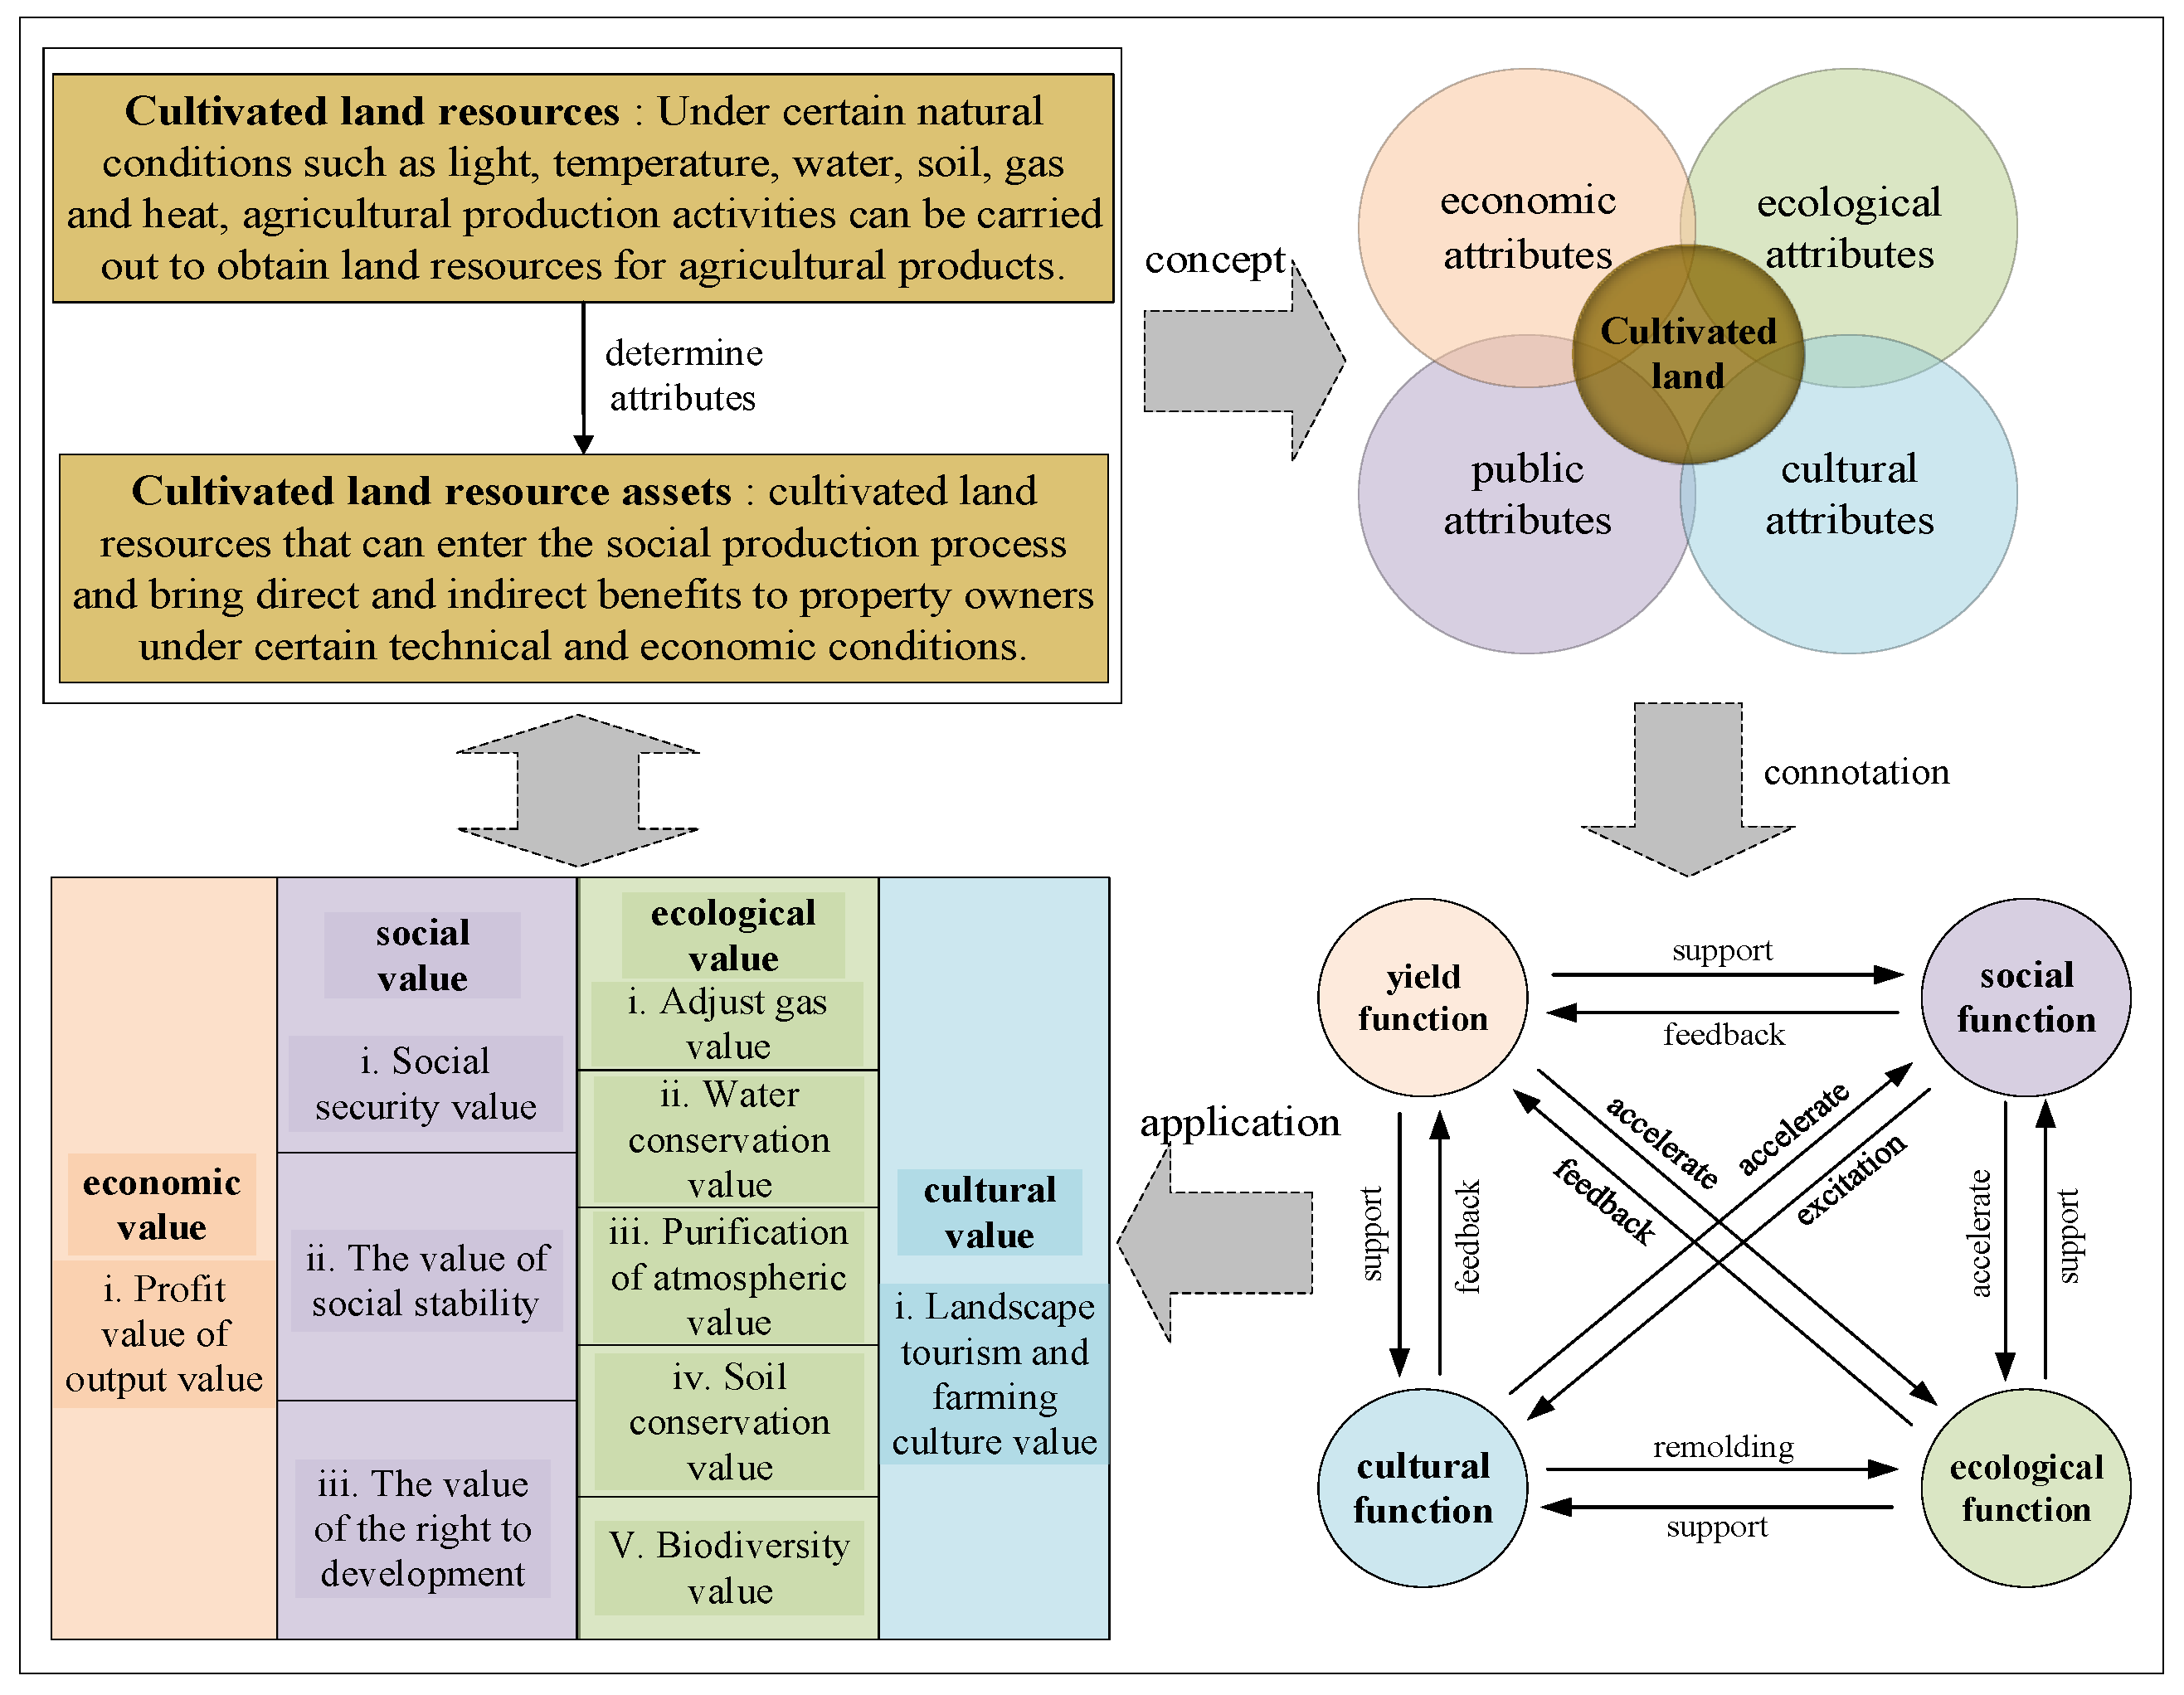
2.3.1. Analysis of Comprehensive Cultivated Land Value Accounting

Based on previous accounting logic, the comprehensive value of cultivated land in this study encompassed four aspects, economic, social, ecological, and cultural measures, which were divided into nine calculation index models. Thus, this study used mathematical methods, including revenue reduction, alternative market, and equivalent factor methods, to construct an analytical model that could measure and calculate the comprehensive value of cultivated land in the Hefei metropolitan area between 2010 and 2020.

Economic Values

  • Value of Output Benefits
Cultivated land was valued based on the upfront material, artificial inputs, and the economic returns generated by its inherent nurturing function over the agricultural production period [36]. The return reduction method was used to account for the unit output value of cultivated land. The formula is as follows:
T 1 = i = 1 n q i × p i i = 1 n c i × k i × α S × r ( i = 1 , 2 , 3 , , n )
In Equation (1): T1 represents the total value of the output of all kinds of agricultural products per unit of cultivated land (yuan/hm2), qi is the total output of the ith agricultural product (kg); pi is the average unit price of the ith agricultural product (yuan); ci is the production cost per unit cultivated area of i agricultural product (yuan); ki is the cultivated area of i agricultural product (hm2); S is the total cultivated area of agricultural products (hm2); α is the profit correction rate; r is the land restoration rate.

Social Values

In this study, the social function value of cultivated land resources, the function of livelihood security, the function of social stability, and the right to the development function of agricultural conversion were considered when accounting for the value of cultivated land resources [6,37,38]. The formula is as follows:
T 2 = T s + T z + T p
In Equation (2), T2 denotes the social value of unit cultivated land resources (yuan), Ts denotes the value of the livelihood security of cultivated land resources (yuan); Tz denotes the value of social stability for cultivated land resources (yuan); Tp denotes the value of development rights for cultivated land resources (yuan).
  • Life security values
Cultivated land provides an employment channel for unemployed rural residents and provides livelihood security. Thus, the life security value of cultivated land for farm households was measured using the alternative market method. The formula is as follows:
T s = E c s × r
In Equation (3), Ts is the value of the livelihood guarantee per unit of cultivated land resource; Ec is the minimum livelihood guarantee provided by the government for individual rural residents (yuan/year); s is the per capital area of cultivated land in each region of the province (hm2/person).
2.
Social stability values
The social stability value generated by cultivated land was indirectly reflected by its food provision, which is essential in stabilising society, using the alternative market approach, which was measured using the price of food produced per unit of cultivated land area. The formula is as follows:
T z = i = 1 n q i × p i S ( i = 1 , 2 , 3 , , n )
In Equation (4), Tz is the social stability value per unit of cultivated land resources.
3.
Development rights values
The development rights value generated by cultivated land was calculated using the difference between the market value of construction land after the change in its use and the previous land value when it was used for cultivated land. The formula is as follows:
T p = X h × 1 9 × r A r
In Formula (5), Tp is the social stability value of unit cultivated land resources; Xh is the value of the comprehensive land price level in Hefei (yuan/m2).

Ecological Values

The ecological value generated by cultivated land resources per unit area was determined based on a combination of existing studies and the situation of cultivated land in Anhui Province. The results showed that this value included five categories: gas regulation, water connotation, atmospheric purification, soil conservation, and biodiversity maintenance values. [22,23,24,25,39]. The formula is as follows:
T 3 = T o + T w + T p + T s + T b
In Equation (6), To is the gas regulation value of cultivated land resources per unit area (yuan/year); Tw is the water content value per unit area of the cultivated land resource; Tp is the value of purifying the atmosphere per unit area of cultivated land resources; Ts is the soil conservation value per unit area of cultivated land resources; Tb is the value of maintaining biodiversity per unit area of cultivated land resources.
  • Gas regulation values
The gas regulation value of cultivated land was based on the ability of vegetation to absorb CO2 and release O2 to regulate the atmosphere, and this was calculated by referencing the Chinese afforestation cost method per cultivated land unit area. The formula is as follows:
T o = 1.62 × Q × 0.2729 × P c + 1.2 × Q × P o S Q = i = 1 n q i × ( 1 R ) f
In Equation (7), Q is the net biomass of various crops of cultivated land resources (kg/m2); Pc and Po are the carbon sequestration cost and oxygen release cost of the afforestation cost method, respectively; R is the water content of the crops; and f is the economic coefficient of the crops.
2.
Water containment Values
The water containment value of cultivated land was based on its status as a natural ecosystem with water storage and drainage functions. The water balance method and shadow engineering method were used to calculate the asset value according to the cost of creating a reservoir with the same storage capacity [37]. The formula is as follows:
T w = S × L × d × ( 1 n ) × H
In Equation (8), n is the ratio of the annual crop transpiration to the total local rainfall, which could be taken as 84% according to existing studies, d is the unit water price of domestic water for first-stage residents in Anhui Province, L is the average annual precipitation of each county in Anhui Province (mm); H is the cost of reservoir unit water storage (yuan/m3).
3.
Purify atmospheric values
Specific data on the mitigation of individual air pollutants per unit area of cultivated land were difficult to obtain; therefore, this study applied an alternative engineering method to calculate the values of SO2, HF, NOx, and stagnant dust absorption by cultivated land. The formula is as follows:
T p = S × ( U 1 C 3 + U 2 C 4 + U 3 C 5 + U 4 C 6 )
In the Formula (9), S is the area of regional cultivated land (the value of the unit cultivated land was taken here as S = 1 hm2); U1, U2, U3, and U4 are the amounts of SO2, HF, NOx, and dust retention absorbed by cultivated land resources per unit area, respectively, which were taken as 45 kg/(hm2-a), 0.38 kg/(hm2-a), 33.8 kg/(hm2-a), 0.95 kg/(hm2-a); C3, C4, C5, C6 are the unit cost prices of the SO2, HF, NOx, and dust, respectively.
4.
Soil conservation values
The reduction in water erosion-induced soil erosion and the prevention of sedimentation in reservoirs, rivers, and lakes were estimated based on the opportunity cost, shadow price, and alternative engineering methods to maintain the value of topsoil on cultivated land and the direct economic value of preventing sedimentation. The formulas are as follows:
T s = T s 1 + T s 2 T s 1 = v x z × C t T s 2 = v × k × C r v = S × u
In Formula (10), Ts1 is the erosion reduction value of the cropland; Ts2 is the siltation reduction value of the cropland; v is the total soil erosion per unit of cropland t/(hm2-a) (taken as S = 1 hm2); x is the average density of the soil 1.3 kg/m3; z is the average thickness of the topsoil taken as 0.5 m; Ct is the average annual gain of the cropland in each place; k is the siltation ratio, which was counted as 24%; Cr is the price based on the domestic reservoir project cost. u is the erosion modulus of the cropland, which, according to the erosion modulus of effective forest land and the conversion factor of forest land into cropland, was 0.5, and we obtained the erosion modulus of the cropland u = 0.21.
5.
Maintaining biodiversity values
Cultivated land and the surrounding natural environment constantly carry out material circulation and energy flow to create a suitable environment for biological survival and reproduction and to retain rich genetic genes. In addition, the results of the ecosystem service value coefficient of Anhui province could be used for geographical correction. The formula is as follows:
T b = λ × j λ = m M
In Formula (11), λ is the regional revision coefficient of ecological service equivalents; j is the benchmark unit price for the biodiversity conservation of the cropland ecosystem service value; m is the regional cropland grain unit area yield (kg/hm2); M is the Anhui Province cropland grain unit area yield (kg/hm2).

Cultural Values

The value of cultivated land was obtained through the provision of agricultural culture, recreation, and leisure. Moreover, the travel and tourism value in this paper referred to the research results of Wang et al. [40], with the travel and tourism entertainment value of cultivated land and the comfort value provided to people by cultivated land at 225 yuan/hm2.

2.3.2. Analysis of the Spatial and Temporal Evolution of the Comprehensive Value of Cultivated Land

Analysis of Dynamic Attitude

The ground dynamic attitude of cultivated land represented a response to changes in the functional value of cultivated land within a certain time frame in the study area [29]. The calculation formula is as follows:
K = U b U a U a × 1 T × 100 %
In Equation (12), Ua denotes the functional value of cultivated land at the beginning of the study, Ub denotes the functional value of cultivated land at the end of the study; T is the study period; K is the dynamic degree of change in the functional value of cultivated land at time T.

Analysis of Kernel Density

The kernel density estimation method could effectively identify the spatial variability and continuity of the functional value of cultivated land [18]. The calculation formula is as follows:
f ( x ) = 1 n h i = 1 n K ( x X i h )
In Equation (13), f(x) is the kernel density estimate, n is the number of observations, (x − Xi) is the distance from the valuation point x to the ith observation Xi, and h is the bandwidth.

Analysis of Spatial Autocorrelation

The spatial weight matrix was used as a quantified measure of spatial proximity and represented the spatial relationships between different spatial objects [20]. In this study, the Queen weight method based on spatial adjacency was used.
  • Global autocorrelation
The global Moran’s I statistic was used to detect spatial differences across a region caused by spatial correlations.
I = i = 1 n j = 1 n w i j ( x i x ¯ ) ( x j x ¯ ) S 2 i = 1 n j = 1 n w i j
In Equation (14), n is the number of samples; S2 is the variance of the samples; xi is the attribute value of the region; x is the mean value of xi; wij is the spatial weight matrix; and the value of global Moran’s I is between −1 and 1, where greater than 0 is a positive correlation, the opposite is a negative correlation, and equal to 0 indicates that there is no correlation.
The ground standardized statistic of the global Moran’s I index test is:
Z ( I ) = I E ( I ) / V A R ( I )
In Equation (15), E(I) is the expected value; VAR(I) is the variance.
2.
Local autocorrelation
The local Moran’s I statistic represented the relationship between the observations at a particular location and the observations of the surrounding area cells [30].
For spatial unit i:
I i = x i x ¯ S 2 j = 1 n ( x i x ¯ )
The ground standardized statistic for the local Moran’s I test was:
Z ( I i ) = I i E ( I ) V A R ( I i )
It is usually represented by a Moran scatter plot and a Lisa plot to indicate the significance level of local Moran’s I on the spatial unit.

2.4. Accounting Logic of the Comprehensive Value of Cultivated Land

Clarifying the connotations of cultivated land resource assets is an essential prerequisite when accounting for the comprehensive value of cultivated land resources. Resource assets are considered economic resources that are owned or controlled by a specific economic entity that benefits the economy, including physical assets and intangible rights with certain economic value [31,41,42]. Accounting considers assets as resources that are formed by past transactions or events that are owned or controlled by the enterprise and are expected to provide economic benefits [24]. Cultivated land assets are closely related to the input of property owners, as Marx stated in his central concept of Capital, and a piece of cultivated land has greater value than a piece of uncultivated land with the same natural properties [37,43,44]. Therefore, cultivated land assets can be described as assets that enter the social production process, economically benefit property rights, and are subject to certain technical and economic conditions. Cultivated land assets are considered to possess certain attributes, namely, economic, ecological, public, and cultural attributes, which have production, ecological, social, and cultural functions based on their interactions with the surrounding environment and people. Capitalising on the functions and form values, i.e., the comprehensive value of cultivated land, represents the process of capitalising on its assets [45]. Therefore, the comprehensive value of cultivated land should include its economic, ecological, social, and cultural values. The analytical framework for this is shown in Figure 2.
The logical framework of ‘attribute-function-value’ accounting is constructed to address what the cultivated land resource value is. As shown in Figure 1, value is an essential and social attribute of commodities, and the resource-asset duality of cropland has gradually developed into natural, economic, public, ecological, and cultural attributes [46,47]. Among cultivated land resources, the essential attributes that reflect their characteristics are the basis and foundation for realising cultivated land functions and the material form of cultivated land’s value, including economic and ecological attributes. Economic attributes are primarily characterised by food production, and the level of cultivation income of cultivated land, which directly determines its economic value [41,48]. Ecological attributes are primarily characterised by maintaining ecological balance. Social attributes can be reflected by the function of cropland based on the interaction between its resources and human socio-economic activities [49]. These attributes are the relational representation of cropland value and include public and cultural attributes, with public attributes promoting human social development as the primary representation and cultural attributes promoting the farming and tourism culture as their primary representation [20,21,42]. The value of cultivated land is the shadow price of cultivated land’s attributes (individual) and functions (interrelationship). We analysed the attributes and functions of cultivated land around big cities based on the logical framework of ‘attributes-functions-values’ and classified the value types.
Cultivated land presents economic, ecological, public, and cultural values, which can be divided into nine leading values. Among them, the value of output gain is the core quantitative index of the economic value, which is reflected as the food production per unit of cultivated land area. To improve the accuracy of accounting for the economic value of cultivated land, this study focused on the actual production capacity of cultivated land, considered its human and material costs and regional profit differences, adopted the yield reduction method, and corrected regional profit rates to arrive at the annual net income of cultivated land. In terms of its social value, the economic development around big cities is increasingly rapid, the public infrastructure in suburban rural areas is relatively well developed, and the cost of living and quality of life experienced by farmers in such regions are higher than those in other areas, showing the characteristics of more outdoor working and the easier transfer of cultivated land. However, some farmers use the minimum subsistence allowance of the government as their living source. Therefore, this study adopted the minimum subsistence level to measure the social value of life security. The reconfiguration of agricultural products on cultivated land (‘rice bag’ and ‘vegetable basket’) solved the food ration demands and living needs of this populace while maintaining social stability; therefore, the value of food produced on cultivated land represents the value of social stability. The rapid economic development of big cities has caused the more comprehensive and focused development of its surrounding cultivated land, leading to a potential development rights value. Collective owners prefer to measure the development rights value of cultivated land based on the urban land price [6,13]. The ecological value of cultivated land is primarily reflected in climate regulation, water conservation, soil conservation, environmental purification, and biodiversity functions that maintain the ecosystem balance [28,49]. In this study, the ecological value of cropland was accounted for by using the equivalent factor, shadow price, and alternative engineering methods [34,35,36,38]. Cultural value can be understood as the value of cultivated land resources based on an integrated natural and human landscape that provides for recreation or influences the populace. The cultural value of cultivated land can be measured based on its level of induced comfort [6,37]. Farming tourism remains in its early construction stage and only accounts for a small proportion of cultivated lands value; moreover, the accounting results are primarily related to the cultivated area [12,13,14]. In this study, the value equivalent was used to account for previous research results. As this value was small and the annual change was insignificant, this function was combined with the ecological value during analysis.
Both production and ecological functions are prerequisites and natural foundations for forming a human society and supply social and cultural functions. Production and ecological functions complement each other. The production function represents economic output and provides the basis of the labour force. A good ecological environment has a positive effect on securing the labour force and providing raw materials for the production function to promote production. Social and cultural functions act as external functions that reflect social phenomena and provide feedback on production functions according to social development and spiritual and cultural needs. Cultural functions are primarily based on the ecological functions of tourism and farming and deepen the significance and plasticity of ecological functions. Social development is primarily based on ‘people-oriented’ functions, accelerating the demand for an ecological environment and promoting ecological functions. Moreover, social development promotes spiritual and cultural needs and stimulates the cultural functions of cultivated land. Cultural functions, as external attributes, enhance humanistic thought and social levels while promoting social development.

3. Results

3.1. Time Evolution Characteristics

As shown in Figure 3, the overall trend of the economic value change decreased from 2010 to 2020, and the changing trends in 35 regions could be divided into three types. The first type was a continuous slow-decrease type (Figure 3a), which was primarily observed in 17 regions, including Shou, Lujiang, Feixi, and Feidong counties. The rate of change decreased slowly, primarily because the above areas were the primary grain-producing areas. Thus, the cultivated land area accounted for a relatively high proportion of the total area of the metropolitan area, while the degree of intensive land use and the quality of cultivated land generally declined, and the output value of grain crops decreased, resulting in the decreased unit economic value of cultivated land. The second type was an initially decreasing before increasing type (Figure 3b), which was primarily observed in 13 regions representing better-performing areas. This was primarily because of the large number of municipal districts and county-level cities. The Chuzhou urban area had the highest reduction rate before 2017, and this turning point occurred primarily in 2015–2017. During this period, the Chinese Ministries of Agriculture and Finance successively issued specific policies to strengthen agriculture and benefit farmers. The policy promotion effect was more evident for areas with less per capita cultivated land. Among the abovementioned regions, urbanisation and population developed rapidly while the cultivated land per capita decreased, thus causing increased economic value. The third type was an initially increasing before decreasing type (Figure 3c), which was primarily observed in five regions. In these areas, the economic value showed a downward trend; however, the overall fluctuation was small. The deviation analysis showed that the highest mean economic value occurred in Fengtai County (155,800 yuan/hm2), and the lowest occurred in Jinzhai (17,700 yuan/hm2), as shown in Figure 4. An evident deviation was observed between the mean economic value of the Chuzhou City district and Changfeng County, indicating that their economic values changed significantly between 2010 and 2020. If a value preservation strategy is not implemented for cultivated land resources in these areas, the future economic value could continue to decrease.
An analysis of the characteristics of temporal change in social values (Figure 5) revealed that 35 regions uniformly showed a linear growth type with similar changes. Owing to the large total value per unit in each region, the comparison effect was insignificant. However, the mean social value during 2010–2020 differed slightly between the average values of the 35 regions, as shown in Figure 6, with a large change over the years and a large potential for increased social value. A recent continuous increase in the social value of cultivated land units in the Hefei metropolitan area was predicted in this study.
An analysis of the characteristics of temporal change in ecological and cultural values showed that these 35 districts could be divided into three types. As shown in Figure 7, 27 of the 35 regions showed an increasing trend in ecology and culture, while five municipal districts, including those of the Tongcheng, Chuzhou, and Wuhu cities, showed a decreasing and then an increasing trend. This overall trend was similar to the decrease observed for Nanling County, the Bengbu City district, and Quanjiao County (Figure 7c). This was primarily associated with the more severe industrial pollution in the municipal districts with high economic development and the lower efficiency of the economic and intensive use of cultivated land, which caused an overall decrease in ecological and cultural values. As shown in Figure 8, the highest and lowest mean ecological and cultural values were in Wuhu County (25,100,000 yuan/hm2) and Mingguang (14,500,000 yuan/hm2), respectively. Moreover, the mean ecological and cultural values in the Wuhu and Bengbu city districts deviated and changed significantly.

3.2. Spatial Evolution Characteristics

A trend surface analysis of the spatial distribution of the comprehensive value of cultivated land revealed minor spatial variations at each interval between 2010 and 2020. Therefore, in this study, data from 2010, 2015, and 2020 were selected for the spatial analysis to identify significant characteristics. The results of the trend surface analysis are shown in Figure 9, where the X, Y, and Z axes indicate the value of cultivated land resources in the due east direction, and the due north direction, respectively. The results showed that during the study period, the economic value was ‘high in the east and north and low in the west and south’, while the social value was ‘low in the east and north and high in the west and south’. Thus, evident spatial directional characteristics were observed, primarily owing to the economically developed southern areas. The social value of development was higher in the south owing to more economically developed areas, and the economic value of crops was higher in the north owing to large food production areas. These ecological and cultural values showed a trend of ‘high in the east and north and low in the west and south’. Regarding the change in this comprehensive value, the integrated land value in the central region was significantly lower, with higher values in the east and south and lower values in the west and north. The trend line changes differed in different directions, with the steeper transition of the trend surface in the north–south direction and the flatter transition of the trend surface in the east–west direction. This finding indicated that the functional value of cultivated land resources in the north–south direction had more evident and stronger divergent characteristics.

3.2.1. Analysis of Dynamic Attitudes

An analysis of the dynamic attitude of cultivated land’s economic value (Figure 10a) showed that most regions had a negative dynamic attitude between 2010 and 2015 over a wide range of values, which primarily concentrated from −10.00 to 0.00%. Only a small number of regions showed growth during this period. The economic value declined, further characterising the annual decrease in the output value of cultivated land for food crops and scarcity on the scale of the cultivated land area, particularly in the Hefei urban area, Chuzhou urban area, and the Wuhu urban area, where the economic value of cultivated land had the lowest dynamic attitude between 2010 and 2015. This was possibly due to the internal restructuring of agricultural land in economically developed areas, such as municipal districts, occupation by construction land, and the remediation of land types, which decreased the cultivation rate of crops, thereby decreasing the production value.
The dynamic attitude of the social value had a smaller value than that of the economic value, and this figure changed more rapidly (Figure 10b). Most of the evaluation units had positive values between 12% and 13%, with the highest value at 13.8% in the Chuzhou urban area. Positive changes in the social value of cultivated land were predominantly observed in the central region, whereas relatively limited positive changes were observed in the northeast. This could be because the distribution of cultivated land in the Hefei metropolitan area was more dispersed, and the regional natural resource endowment and productivity of cultivated land varied greatly, resulting in a large gap between the social and economic value of cultivated land, followed by the difference between economic development and urbanisation rate.
Compared with economic and social values, a relatively obvious degree of change was observed in the dynamic attitude of the ecological and cultural values of cropland (Figure 10c), and nearly half of the dynamic attitude evaluation units of cropland resources were concentrated in the range of 10.00–30.00%, followed by a larger proportion in the range of 5.00–10.00%, primarily in the central region. The degree of dynamic attitude change was more concentrated in these three periods showing negative or low values, which were primarily concentrated in urban and other areas with a higher GDP. This finding might have been because economically developed areas tend to show greater cultivated land use development compared with other areas, which hinders the development of ecological functions. Thus, the magnitude of dynamic attitude change was shown to be more moderate.

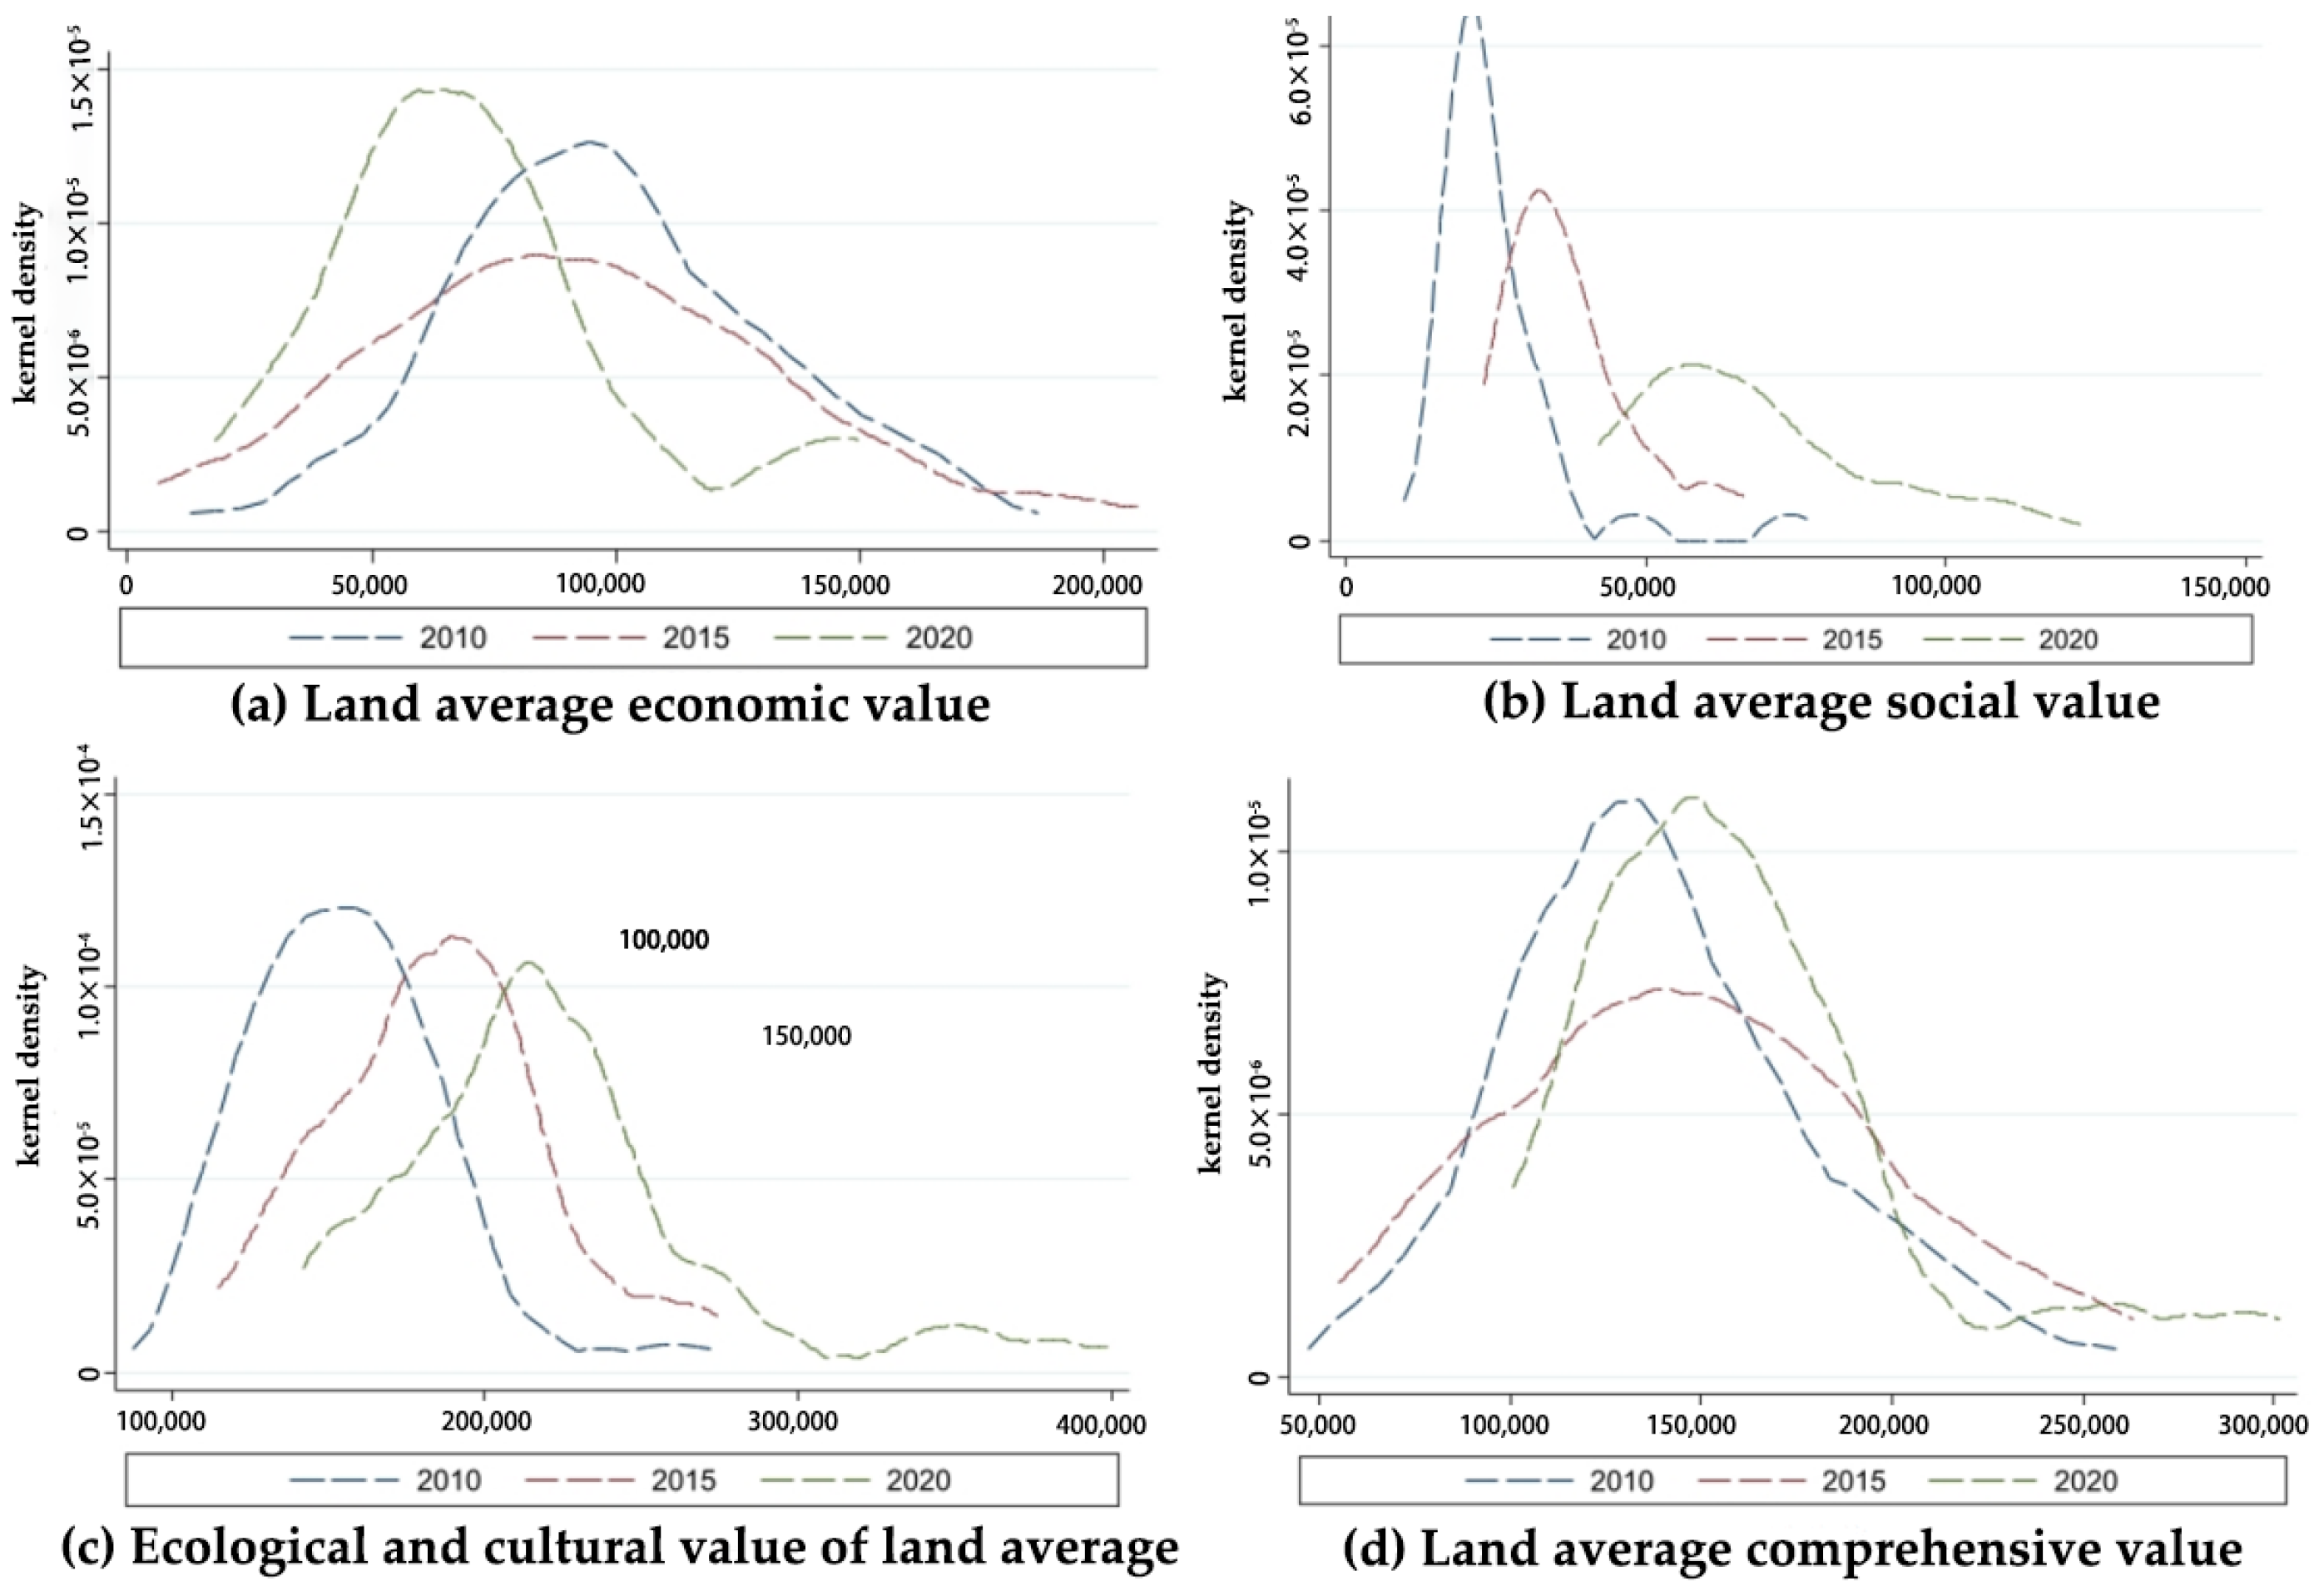
3.2.2. Analysis of Kernel Density

As shown in Figure 11, considering the average values of cultivated land and kernel density as the horizontal coordinate and vertical coordinates, respectively, the kernel density curves of economic, social, ecological, and cultural values of cultivated land in the Hefei metropolitan showed significantly different trends, while the peak of the economic value tended to move to the left and that of social, ecological, and cultural function values tended moved to the right.
From the wave peak, the kernel density curves between 2010 and 2020 showed fluctuating changes. The peak of the economic value curve initially declined before rising and showed large fluctuations, while the peaks of social, ecological, and cultural values were generally similar and showed a downward trend. The social value peaked at 6 × 10⁻⁵ in 2010 and declined to 2 × 10⁻⁵ in 2020, while the waveforms of ecological and cultural values were gentler and showed a weaker performance between 1 × 10⁻⁴ and 15 × 10−4. The highest kernel density wave peak in the comprehensive value kernel density curve was 1 × 10⁻⁵ in 2020. The kernel density curves in 2010 and 2015 had no evident secondary wave peaks, and the single peak in 2020 showed a low-peak secondary wave peak; however, the difference between these peaks was significant. The comprehensive results show that the comprehensive value of cultivated land in the Hefei metropolitan area was more clustered, and the difference between the highest and lowest values was further enlarged. This finding reveals that there were more evident regional differences, providing a theoretical basis for regional type classification and differentiated spatial control implementation.

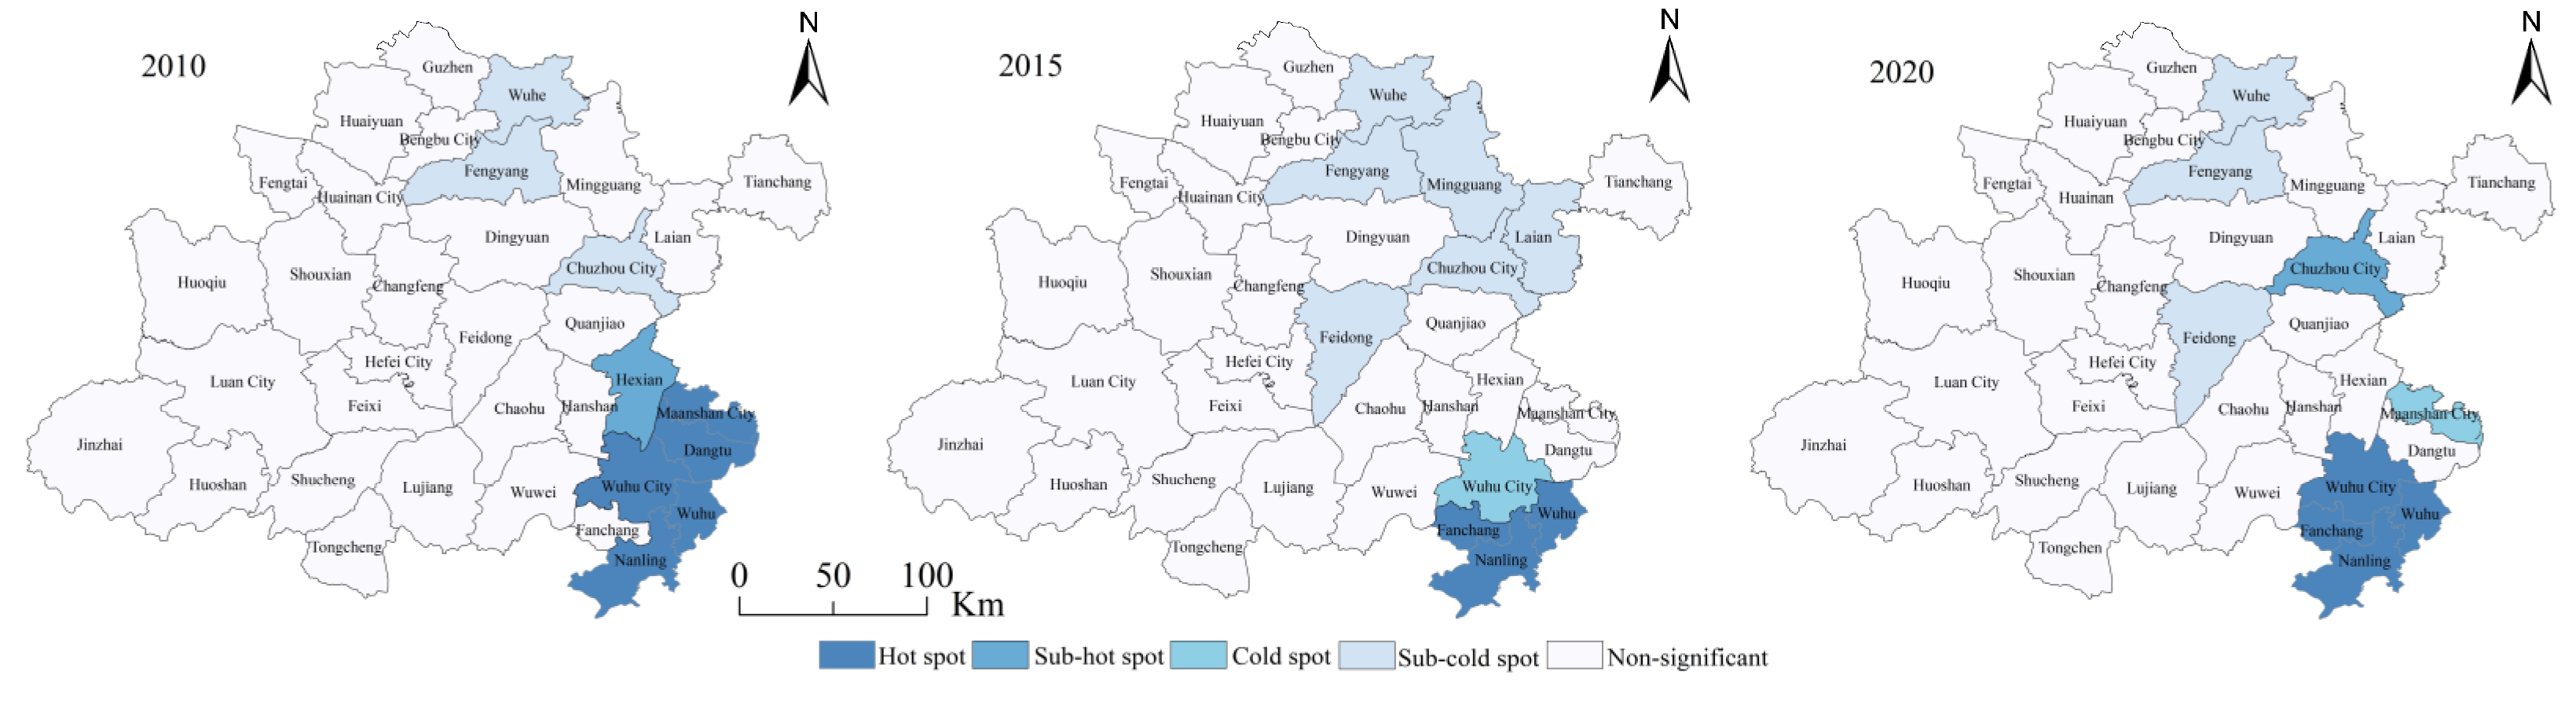
3.2.3. Analysis of Spatial Autocorrelation

The global Moran’s index of the distribution of the integrated land value of cultivated land was measured, the significance of the p-value was tested, and the results were analysed. The results are shown in Figure 12. Moran’s index of the value accounting results between 2010 and 2020 was between 0.2421 and 0.4797, which was greater than 0 and passed the significance test at the 1% level. Thus, the comprehensive value of cultivated land resources in the metropolitan area showed evident spatial clustering. The high- and low-value areas showed evident clustering, and the changes in the global index fluctuated over the years, indicating that the spatial positive correlation of the comprehensive value of cultivated land changed continuously. Similarly, Figure 12 shows that the Moran’s index of the Hefei metropolitan area between 2010 and 2020 exhibited an ‘M’-shaped change and a 5-year cycle from 2011 to 2015 and 2015 to 2019. A turn was observed in the middle of the cycle primarily because 2011 and 2015 corresponded to the metropolitan area and represented vital turning points in administrative zoning or cultivated land policies. Moreover, China implemented various policies or regulations during these 5-year periods, and a 5-year fluctuation trend after 2019 was predicted if no corresponding measures were taken.
A local spatial autocorrelation analysis of the comprehensive value of cultivated land and the corresponding local indicators of the spatial association (LISA) clustering map could more intuitively show the spatial clustering location and distribution characteristics of the comprehensive value of cultivated land. The results (Figure 13) show how spatial clustering characteristics have become increasingly evident. The cold and hot spots of integrated cultivated land value in the Hefei metropolitan area changed significantly in 2010, 2015, and 2020, and the spatial layout gradually became more concentrated. In 2010, most of the areas were insignificant, and cold and sub-cold spots were only observed in the Chuzhou City district and Wuhe, Fengyang, and He counties. In 2015, the difference in the distribution of cold and hot spots became larger than that in 2010, with cold spots covering a greater area, including Feidong and Lai’an counties and the Mingguang and Chuzhou cities. The second cold spot area was only in Wuhu City. The hot spots decreased in 2020 compared with those in 2010, although this change was insignificant. Most of the Hefei metropolitan area presented insignificant changes compared with that in 2015. Cold spot areas were reduced in Feidong, Wuhe, and Fengyang counties, and four hot spots in the Wuhu urban area, Fanchang County, Nanling County, and Wuhu County, were observed. An increase in one sub-hot spot area in the Chuzhou City district was also observed.

3.2.4. Analysis of Influencing Factors

The analysis of these characteristics of the above spatiotemporal results shows that the comprehensive value of the Hefei metropolitan area has recently increased, and the economic, social, ecological, and cultural values and changes in different regions and cities in the metropolitan area have shown greater differences. Through field research and research results analyses in combination with relevant government plans and policies, this study found that chances for improvements in the comprehensive value and cultivated land value of the Hefei metropolitan area were affected by factors such as government support, rapid urbanisation development level, and resource endowment.
(1)
The output value of grain production is a prerequisite for improving the economic value of cultivated land assets. Guzhen, Dingyuan, Wuwei, Shucheng, Lujiang, Fengyang counties, and other areas along the Yangtze and Huaihe rivers presented earlier agricultural development relative to the other areas. The government has supported policy, capital, science, and technology changes and vigorously promoted farmland construction. The quality of cultivated land has increased its output value. Therefore, the economic value of cultivated land resources increased earlier, while the agricultural development of the metropolitan area started slightly later. With decreased cultivated land, the overall trend declined.
(2)
Urbanisation is a crucial factor in changing the social value of cultivated land resource assets. Owing to the differences in the level of economic development in various regions of the Hefei metropolitan area, the level of urban economic development in this central region was relatively high, the population was large, and the level of new urbanisation was relatively high. Similarly, as cultivated land gradually decreased in the Hefei metropolitan area, the phenomenon of ‘non-agricultural’ and ‘non-grain’ development was common. Therefore, the minimum living security value and development rights value of cultivated land were relatively high in the metropolitan area, followed by those in areas along the Yangtze and Huaihe rivers and the Dabie Mountains.
(3)
Resource endowment and economic development were the primary causes of changes in the ecological and cultural values of cultivated land resource assets. The districts and counties along the Yangtze and Huaihe Rivers demonstrated superior natural conditions and high resource endowments in the Hefei metropolitan area. Owing to the constraints of natural and social conditions, the resource endowments of the districts and counties near northern Anhui were less than those along the Yangtze River.

4. Discussion

Currently, as the global cultivated land per capita declines (from 0.25 to 0.18 hectares per capita in 1990 to 2020, respectively), the global demand for food and crops is increasing, which puts pressure on cultivated land. In the context of the “Big food view”, the increased demand for protein and bioenergy crops and rapid urbanisation have reduced the scale of agricultural land previously used for food production. Thus, cultivated land around big cities faces a contradiction between the improvement of urban quality functions and the restrictive imbalance of arable-land conservation. Therefore, synergistic management based on the multifunctional integration of cultivated land and its value gain to promote conservation and sustainable use around big cities deserves an in-depth study and consideration. By analysing the multifunctional integrated value-volume accounting of cultivated land, a reference could be provided for the development of the resource asset value on the scale that metropolitan areas can be provided with.
Most scholars have focused on the value of cultivated land resources in rural areas [19,24,28], while only a few have studied them in metropolitan areas to analyse spatial distribution patterns and influencing factors [11,28,40]. Su [30] assessed the cultivated land resources in Keshan County, Heilongjiang Province, and found that the economic, social, and ecological values of the cropland were 38.01, 107.53, and 13.5 thousand yuan/hm2, respectively, and the comprehensive value was 146.89 yuan/m2; moreover, the economic and ecological value of the cropland presented decreasing values. In addition, Zhu [29] found that the economic, social, and ecological values of different quality grades of cultivated land in Y City were 4.60–215,900/hm2, 30.35–1.346,700/hm2, and 0.43–2.27 million/hm2, respectively. The results of this study show that the economic, social, ecological, cultural, and comprehensive values of cultivated land assets in the Hefei metropolitan area are on the same order of magnitude as those of existing studies, and the proportional composition of each value is similar. This study redefined the functional value of the Hefei metropolitan area based on the characteristics and attributes of cultivated land resources and aimed to realize the transformation from an ‘output value-service-value’ to an ‘attribute-function-value’ according to the accounting logic. This change reflects the basic role of different functions in value formation. Simultaneously, the connotation of cultural value was proposed. As an accounting method is not available for cultural value, we referred to Wang’s [24] comfort value of agricultural land instead. However, an appropriate accounting method for cultural value should be developed to provide a reference for policies on economic and intensive land use under cultivated land expropriation standards.
The economic, social, ecological, and cultural value of cultivated land gradually increased from 2010 to 2020 and showed a ratio of 2:7:1. This economic value slowly decreased due to the decline in the food production value and cultivated land quality. Therefore, we should ‘hide food in the land’, implement soil restoration and the comprehensive management of degraded cultivated land in an orderly manner to effectively improve the production capacity of cultivated land, and designate high-quality cultivated land in regions as basic farmland for permanent protection. The value of development rights brought about by urbanisation has the potential to induce a large linear increase, although it might also cause a loss of cultivated land and the phenomenon of ‘non-agriculturalisation’. Therefore, we should ‘store food in agriculture’, explore and improve the compensation mechanism via the protection of cultivators ‘interests at the core, carry out cultivators’ compensation assessments, establish compensation standards and targets for land power enhancement, select flexible compensation methods, and build a long-term mechanism to compensate cultivated land development rights values. The changes in ecological and cultural values were mainly due to the differences in resource endowment and economic development in cropland for different regions. These values showed an evenly rising trend with the development of urban ecological civilisation and the improvement of resource endowment and the natural ecological conditions of cropland over time; however, this process is slow and accounts for the smallest proportion of the comprehensive value. Therefore, we should ‘hide food in the best areas’, implement a protection strategy to optimise high-quality permanent basic farmland in the metropolitan area, reduce the space of green belts designed for construction planning along transportation routes, and strengthen the protection of high-quality cultivated land around the city. Moreover, we should anticipate the impact of future climate change on China’s cultivated land, explore climate change adaptation strategies, and decelerate the deterioration of the ‘southern flooding and northern drought’ pattern.

5. Conclusions and Deficiencies

The accounting of cultivated land assets and connotation of cultivated land value were summarized in an attempt to explain the composition and accounting logic of the cultivated land value around big cities according to its ‘attribute-function-value’ aspects and to preliminarily construct an analysis framework. Considering the Hefei metropolitan area as an example, the economic, social, ecological, cultural, and comprehensive values of cultivated land were calculated, and the spatiotemporal evolution characteristics were analysed. The conclusions were as follows.
(1)
As the measurement standards of the social, ecological, and cultural value have not yet been unified, a better accounting system for the multifunctional values of cultivated land should be established. Monetising the social, ecological, and cultural value of cultivated land to incorporate compensation standards for expropriation, including an increase in agricultural compensation and further improving the compensation mechanisms of the Hefei metropolitan area, could help to realize these multifunctional values. Moreover, the implementation of policies and measures for the protection of cultivated land, the construction of a green national economic accounting system, and the realisation of the coordinated development of the human–land relationship must be considered.
(2)
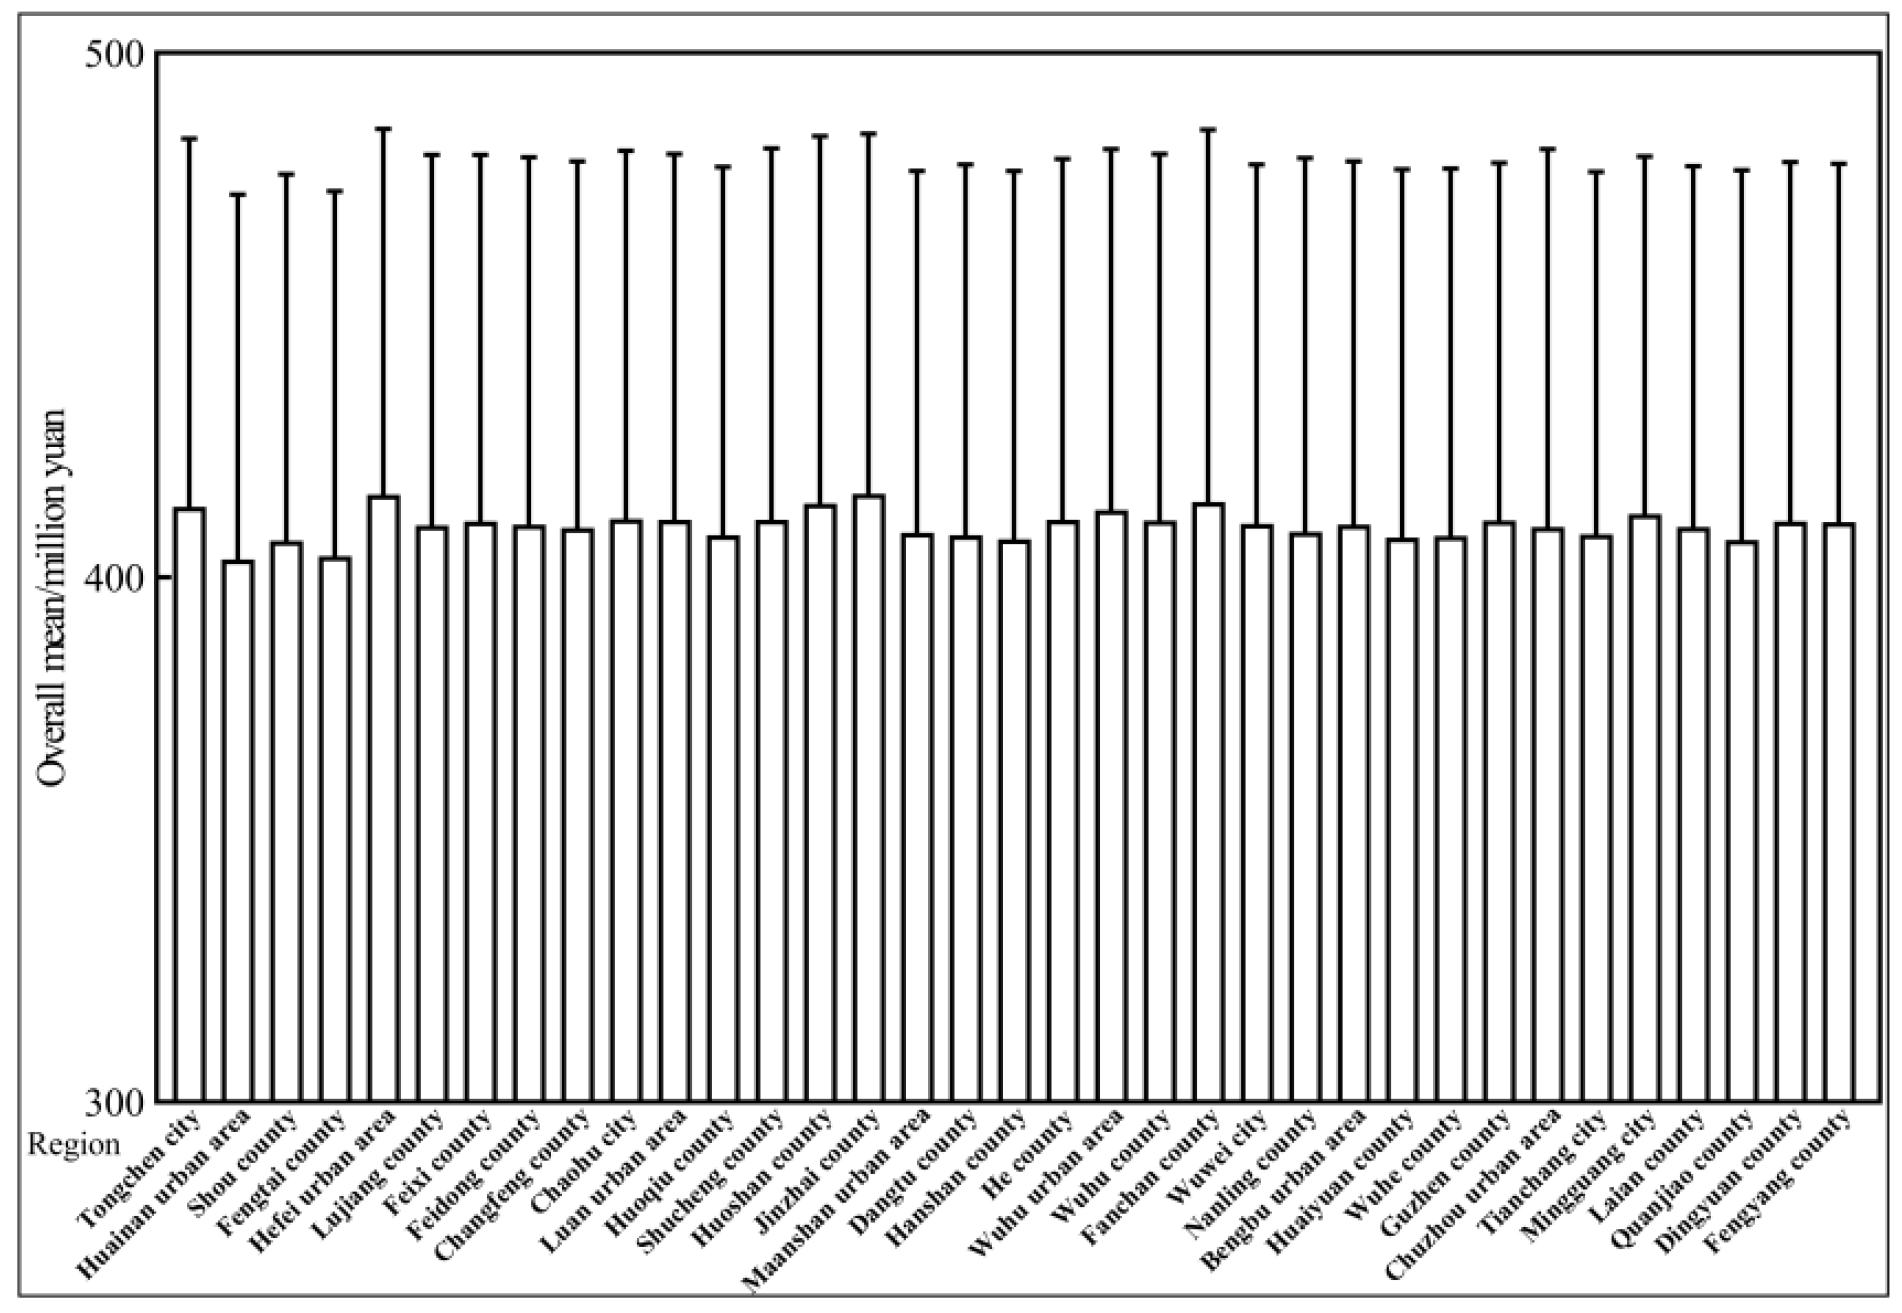
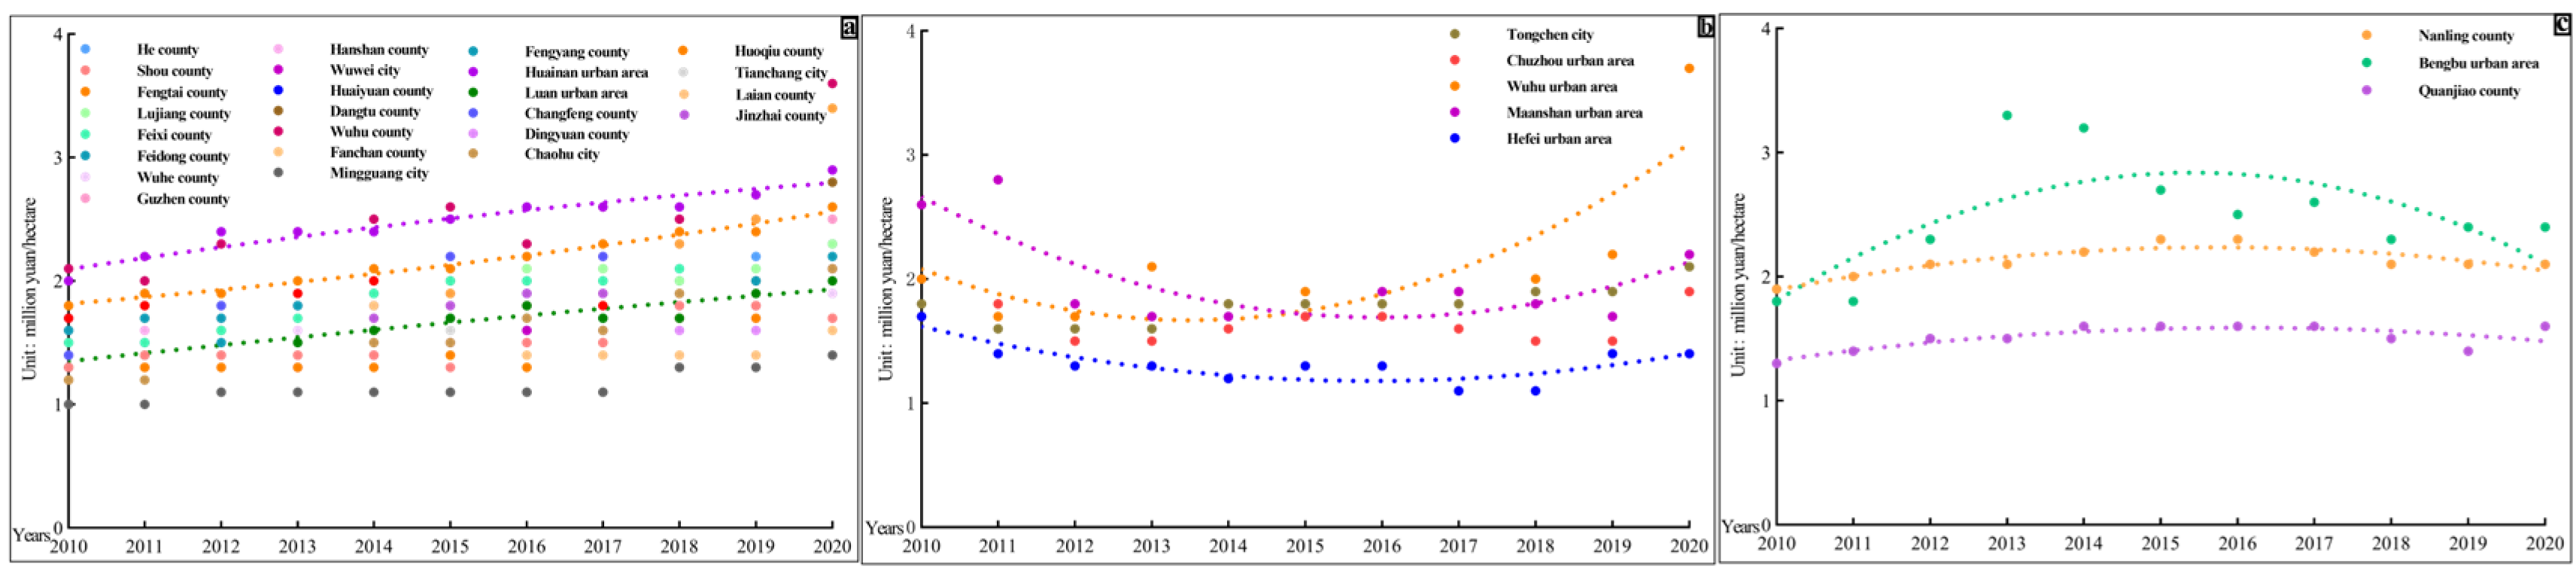
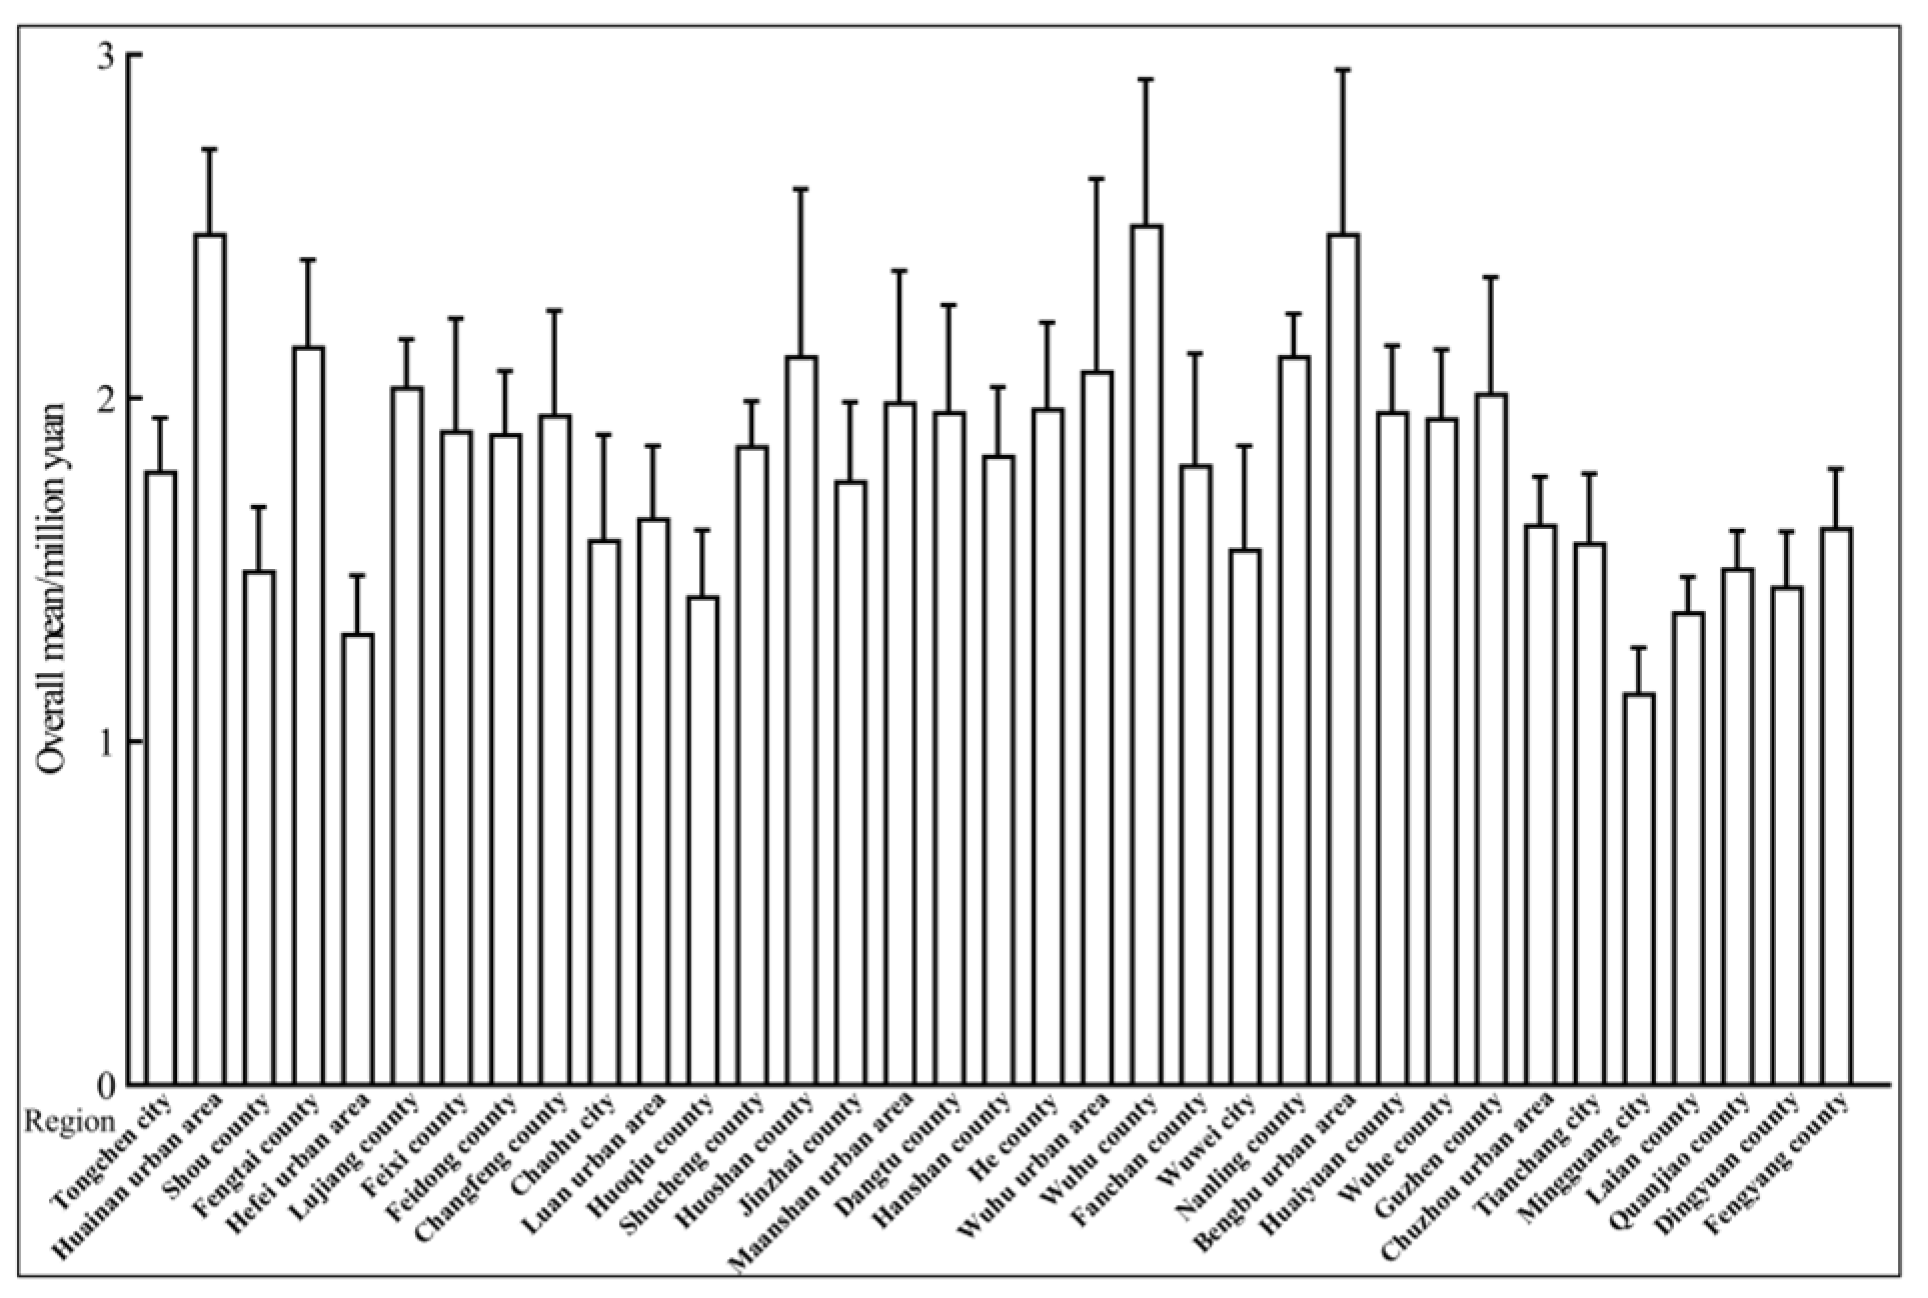
The comprehensive value of cultivated land in the Hefei metropolitan area showed a steady upward trend between 2010 and 2020, with a dynamic range of 57.03–61.44%. The social, ecological, and cultural values of cultivated land showed an increasing trend, while the economic value showed a decline. The economic value was high in the east and north and low in the west and south. This social value accounted for the highest proportion of the comprehensive value at approximately 87%, and it showed opposite spatial values that were relative to the economic value, which was low in the east and north and high in the west and south. The right to development value accounted for the largest proportion of social value (approximately 93%). Ecological and cultural values accounted for the smallest proportion of this comprehensive value, and the spatial distribution trend was similar to that of the economic value. The largest proportion of ecological and cultural values corresponded to the soil conservation value at approximately 67%.
(3)
The social value of cultivated land dominated the comprehensive value of cultivated land around big cities, and its value distribution was consistent with that of social and economic development. The social value of cultivated land showed that economically developed areas are hot spots in space, and the development rights and social security values of these areas were higher than those in other areas. The distribution of the economic value of cultivated land was highly consistent with the natural geographical conditions. Hotspots were located in the northeastern part of the study area in the Jianghuai Plain area. The soil conditions of the cultivated land were good and suitable for food crop production; thus, these areas produced high yields. The change in the ecological value of cultivated land was significantly affected by government policies and showed obvious upward trends in vital ecological protection areas along the Yangtze River (Wuhu urban area), Huaihe River (Bengbu urban area), and Dabie Mountain area (Huoshan County).
Different from the traditional cultivated land area with grain production as the main function, the cultivated land around big cities had the characteristics of a high social value, strong ecological function, and diverse cultural functions. Therefore, explaining the logic underlying comprehensive cultivated land value accounting in terms of social, economic, ecological, and cultural values using the ‘attribute-function-value’ framework is of practical significance. However, owing to limitations in the data collection and sample size in this study area, individual data in this study were calculated using the substitution value, which may have introduced errors. Moreover, the correlation between elements, structures, and values within the cropland system was highly complex and multidimensional, with couplings and interactions between different cropland values. Therefore, future analyses should be performed with larger datasets and sample sizes.

Author Contributions

Conceptualization, methodology, and writing—original draft, T.C.; funding acquisition, B.W.; project administration and supervision, B.W.; data curation, resources, software, and visualisation, T.C., B.W. and W.L.; writing—review and editing, T.C. and B.W. All authors have read and agreed to the published version of the manuscript.

Funding

This research was funded by the “Anhui Social Sciences and Innovative Development Project” (grant number: 2023CXZ017); the “Anhui Natural Resources Science and Technology Foundation” (grant number: 2021-k-2; 2021-k-3); the “Anhui Jianzhu University PhD Launch fund project” (grant number: 2020QDZ22); the “Hefei Philosophy and Social Science Planning Project” (grant number: HFSKQN202339); and the “Anhui New Era Education Quality Engineering Project (Graduate Education)” (grant number: 2023cxcysj114).

Institutional Review Board Statement

Not applicable.

Informed Consent Statement

Not applicable.

Data Availability Statement

The data presented in this study are available on request from the first author.

Conflicts of Interest

The authors declare no conflict of interest.

References

  1. Zhang, R.; Li, P.; Xu, L.; Zhong, S.; Wei, H. An integrated accounting system of quantity, quality and value for assessing cultivated land resource assets: A case study in Xinjiang, China. Glob. Ecol. Conserv. 2022, 36, e02104. [Google Scholar] [CrossRef]
  2. Jin, J.; He, R.; Wang, W.; Gong, H. Valuing cultivated land protection: A contingent valuation and choice experiment study in China. Land Use Policy 2018, 74, 214–219. [Google Scholar] [CrossRef]
  3. Gao, F.; Cui, J.; Zhang, S.; Xin, X.; Zhang, S.; Zhou, J.; Zhang, Y. Spatio-Temporal Distribution and Driving Factors of Ecosystem Service Value in a Fragile Hilly Area of North China. Land 2022, 11, 2242. [Google Scholar] [CrossRef]
  4. McMillen, D.; Singh, R. Land value estimation using teardowns. Hous. Econ. 2022, 58, 101874. [Google Scholar] [CrossRef]
  5. Öhlund, E.; Malmaeus, M.; Fauré, E. The significance of different realms of value for agricultural land in Sweden. Land Use Policy 2020, 96, 104714. [Google Scholar] [CrossRef]
  6. Chen, Y.; Wang, X.; Xie, Z. Land cover diversity: Reshaping the socioeconomic value of land. Environ. Manag. 2023, 332, 117404. [Google Scholar] [CrossRef]
  7. Hu, R.; Qiu, D.; Xie, D.; Wang, X.; Mo, Y. Asset accounting methods for arable land resources: A case of China. J. Southwest. Univ. 2013, 35, 127–132. [Google Scholar] [CrossRef]
  8. Qin, S.; Yin, H.; Xiong, Y. Evaluation of cultivated land resource value based on different value composition—Take Hunan province as an example. Resour. Environ. Yangtze Basin 2012, 21, 466–471. [Google Scholar]
  9. Wu, Z.; Ding, S.; Wei, C.; Gao, L. Estimation of social stability function value of cultivated land and its increments at plot scale in hill-mountain region. Res. Soil Water Conser. 2015, 22, 245–252. [Google Scholar] [CrossRef]
  10. Costanza, R. Valuing natural capital and ecosystem services toward the goals of efficiency, fairness, and sustainability. Ecosyst. Serv. 2020, 43, 101096. [Google Scholar] [CrossRef]
  11. Peng, J.; Zhao, Z.; Yin, G. Evaluation of urban land resource value based on sustainable environment space governance. Alex. Eng. J. 2022, 61, 5585–5593. [Google Scholar] [CrossRef]
  12. Craig, L.A.; Palmquist, R.B.; Weiss, T. Transportation Improvements and Land Values in the Antebellum United States: A Hedonic Approach. J. Real Estate Finance Econ. 1998, 16, 173–189. [Google Scholar] [CrossRef]
  13. Yaagoubi, R.; Faisal, K.; Miky, Y. Land value assessment based on an integrated Voronoi-geographically weighted regression approach in Makkah, Saudi Arabia. J. King Saud Univ.-Sci. 2021, 33, 101557. [Google Scholar] [CrossRef]
  14. Vitaliano, D.F.; Hill, C. Agricultural districts and farmland prices. J. Real Estate Finance Econ. 1994, 8, 213–223. [Google Scholar] [CrossRef]
  15. Awasthi, M. Socioeconomic determinants of farmland value in India. Land Use Policy 2014, 39, 78–83. [Google Scholar] [CrossRef]
  16. Li, M.; Li, L.; Yin, S. Estimation of Farmland Resources’ Value Loss in Process of Farmland Expropriation—Taking Hunan Province as an Example. Econ. Geogr. 2015, 35, 184–188. [Google Scholar] [CrossRef]
  17. Sandhu, H.S.; Wratten, S.D.; Cullen, R.; Case, B. The future of farming: The value of ecosystem services in conventional and organic arable land, An experimental approach. Ecol. Econ. 2008, 64, 835–848. [Google Scholar] [CrossRef]
  18. Wang, Y.; Li, X.; He, H.; Xin, L.; Tan, M. How reliable are cultivated land assets as social security for Chinese farmers? Land Use Policy 2020, 90, 104318. [Google Scholar] [CrossRef]
  19. Huang, X. A study on the technical procedure and methods for evaluating arable land—A case studying evaluation of cultivated land in Nanjing. J. Nanjing Agric. Univ. 1997, 20, 104–108. [Google Scholar]
  20. Zhu, C.; Li, W.; Du, Y.; Xu, H.; Wang, K. Spatial and temporal variation in the multifunctional value of cropland and trade-off-synergy relationships in Zhejiang Province. Trans. Chin. Soc. Agric. Eng. 2020, 36, 263–272. [Google Scholar]
  21. Huang, X. Study on the accounting value of cultivated land resources in Jiangsu Province. Jiangsu Soc. Sci. 1999, 4, 55–60. [Google Scholar]
  22. Cai, Y.; Huo, Y. Reevaluating Cultivated Land in China: Method and Case Studies. Acta Geogr. Sin. 2006, 10, 1084–1092. [Google Scholar]
  23. Xie, L.; Bai, Z.; Yang, B.; Du, X.; Yang, K.; Fu, S. Resources evaluation and spatial pattern analysis of the cultivated land in Xiangyuan County. J. China Agric. Univ. 2022, 27, 204–214. [Google Scholar]
  24. Zhu, D.; Du, T. Accounting Method and Result Analysis of Cultivated Land Resource Asset in China. China Land Sci. 2017, 31, 23–31+2+97. [Google Scholar]
  25. Wang, X.; Hu, S.; Tong, L. The value and spatial distribution of cultivated land resources in Tuanfeng County. Resour Sci. 2016, 38, 206–216. [Google Scholar]
  26. Ye, S.; Li, S. Study on the Social Value of Cultivated Land Resources in Xi’an Based on CVM. Chin. J. Agric. Resour. Reg. Plan. 2013, 34, 27–32. [Google Scholar]
  27. Zhang, H.; Jin, Y.; Wang, B.; Feng, S.; Qu, F. Compensation for cultivated land protection of Shanxi province based on the calculation of cultivated land development rights. Trans. Chin. Soc. Agric. Eng. 2018, 34, 256–266. [Google Scholar] [CrossRef]
  28. Xie, G.; Xiao, Y.; Zhen, L.; Lu, C. Study on ecosystem services value of food production in China. Chin. J. Eco-Agric. 2005, 13, 10–13. [Google Scholar]
  29. Wu, Y.; Huang, Z.; Han, D.; Qiu, X.; Pan, Y. Evolution of Urban Ecosystem Service Value and a Scenario Analysis Based on Land Utilization Changes: A Case Study of Hangzhou, China. Sustainability 2023, 15, 8274. [Google Scholar] [CrossRef]
  30. Su, H.; Wu, C. Analysis of the Influencing Factors of the Cultivated Land Resources Value in Black Soil Region Based on the Production-Living-Ecological Functions: A Case Study in Keshan County, Heilongjiang Province. China Land Sci. 2020, 34, 77–85. [Google Scholar] [CrossRef]
  31. Xie, G.; Zhang, C.; Zhang, L.; Chen, W.H.; Li, S.M. Improvement of the Evaluation Method for Ecosystem Service Value Based on Per Unit Area. J. Nat. Resour. 2015, 30, 1243–1254. [Google Scholar]
  32. Zhong, X.; Li, H. Exploration of the accounting path of cultivated land resource value in China. China Land. 2021, 2, 41–43. [Google Scholar] [CrossRef]
  33. Lautrup, M.; Panduro, T.E.; Olsen, J.V.; Pedersen, M.F.; Jacobsen, J.B. Is there more to trees than timber? Estimating the private amenity value of forests using a hedonic land model for combined agricultural properties. For. Policy Econ. 2023, 146, 102867. [Google Scholar] [CrossRef]
  34. Carolyn, N.M.; DeLoyde, W.E.; Mabee. Ecosystem service values as an ecological indicator for land management decisions: A case study in southern Ontario, Canada. Ecol. Indic. 2023, 151, 110344. [Google Scholar]
  35. Fikrey, T.; Solomon, A.T.; Yitea, S.G.; Estifanos, L.; Abrha, Y.G. Evaluating the impact of land use land cover changes on the values of ecosystem services in the Chacha Watershed, Ethiopia’s central highland. Environ. Sustain. Indic. 2023, 18, 100256. [Google Scholar] [CrossRef]
  36. Tang, X.; Pan, Y.; Liu, Y. Assessment of ecological value and spatial and temporal change of cultivated land in Beijing. Chin. J. Agric. Resour. Reg. Plan. 2018, 39, 132–140. [Google Scholar]
  37. Shang, Q.; Song, G.; Xiang, C. Estimation of Cultivated Land Value of Bayan County, Heilongjiang Province. Res. Soil Water Conserv. 2012, 19, 231–236. [Google Scholar]
  38. King, R.; Burton, S. Land ownership values and rural structural change in Cyprus. J. Rural Stud. 1989, 5, 267–277. [Google Scholar] [CrossRef]
  39. Costanza, R.; D’Arge, R.; DeGroot, R.; Farber, S.; Grasso, M.; Hannon, B.; Limburg, K.; Naeem, S.; O’Neill, R.V.; Paruelo, J.; et al. The value of the world’s ecosystem services and natural capital. Nature 1997, 387, 253–260. [Google Scholar] [CrossRef]
  40. Wang, S.; Tan, R.; Wu, L. Assessing the amenity value of agricultural land: A case study in Jiangsu Province. Resour. Environ. Yangtze Basin 2005, 06, 48–52. [Google Scholar]
  41. Wang, W.; Huang, X. Regional division and evaluation on arable land value in mainland China. Resour. Sci. 1997, 04, 3–10. [Google Scholar]
  42. Clauretie, T.M.; Li, H. Land Values: Size Matters. J. Real Estate Finance Econ. 2019, 58, 80–110. [Google Scholar] [CrossRef]
  43. Barr, J.; Smith, F.H.; Kulkarni, S. What’s Manhattan worth? A land values index from 1950 to 2014. Reg. Sci. Urban Econ. 2018, 70, 1–19. [Google Scholar] [CrossRef]
  44. McDonald, J.; McMillen, D. Land Values, Land Use, and the First Chicago Zoning Ordinance. J. Real Estate Finance Econ. 1998, 16, 135–150. [Google Scholar] [CrossRef]
  45. Wang, F.; Fu, W.; Chen, J. Spatial–Temporal Evolution of Ecosystem Service Value in Yunnan Based on Land Use. Land 2022, 11, 2217. [Google Scholar] [CrossRef]
  46. Han, J.; Hu, Z.; Wang, P.; Yan, Z.; Li, G.; Zhang, Y.; Zhou, T. Spatio-temporal evolution and optimization analysis of ecosystem service value—A case study of coal resource-based city group in Shandong, China. J. Clean. Prod. 2022, 363, 132602. [Google Scholar] [CrossRef]
  47. Xin, X.; Zhang, T.; He, F.; Zhang, W.; Chen, K. Assessing and simulating changes in ecosystem service value based on land use/cover change in coastal cities: A case study of Shanghai, China. Ocean Coast. Manag. 2023, 39, 106591. [Google Scholar] [CrossRef]
  48. Dashtbozorgi, F.; Hedayatiaghmashhadi, A.; Dashtbozorgi, A.; Ruiz-Agudelo, C.A.; Fürst, C.; Cirella, G.T.; Naderi, M. Ecosystem services valuation using InVEST modeling: Case from southern Iranian mangrove forests. Reg. Stud. Mar. Sci. 2023, 60, 102813. [Google Scholar] [CrossRef]
  49. Pu, L.; Huang, X.; Zhou, F. Study on the arable land protection in developed regions—A case study in the Yangtze River Delta. Econ. Geogr. 2002, S1, 76–78. [Google Scholar]
Figure 1. The study area.
Sustainability 15 11048 g001
Figure 2. Value accounting logic framework.
Sustainability 15 11048 g002
Figure 3. Change in cultivated land economic value in the Hefei metropolitan area from 2010 to 2020 (a) Continuous decline type; (b) First decrease then increase type; (c) First increase then decrease type.
Sustainability 15 11048 g003
Figure 4. The mean value and positive deviation of cultivated land’s economic value in the Hefei metropolitan area from 2010 to 2020.
Sustainability 15 11048 g004
Figure 5. Change in social value of cultivated land in the Hefei metropolitan area from 2010 to 2020.
Sustainability 15 11048 g005
Figure 6. The average social value of cultivated land and positive deviation in the Hefei metropolitan area from 2010 to 2020.
Sustainability 15 11048 g006
Figure 7. Changes in the ecological and cultural value of cultivated land in the Hefei metropolitan area from 2010 to 2020; (a) Continuously rising type; (b) First decrease then increase type; (c) First increase then decrease type.
Sustainability 15 11048 g007
Figure 8. The mean value and positive deviation of cultivated land with ecological and cultural value in the Hefei metropolitan area from 2010 to 2020.
Sustainability 15 11048 g008
Figure 9. Spatial trend analysis of cultivated land value in the Hefei metropolitan area in 2010, 2015, and 2020 (a) Economic value of 2010, 2015, and 2020; (b) Social value of 2010, 2015, and 2020; (c) Ecological and cultural value of 2010, 2015, and 2020; (d) Comprehensive value of 2010, 2015, and 2020.
Sustainability 15 11048 g009
Figure 10. Spatial evolution pattern of cultivated land’s comprehensive values dynamics in the Hefei metropolitan area from 2010 to 2020 (a) Economic value of 2010–2015, 2015–2020, and 2010–2020; (b) Social value of 2010–2015, 2015–2020, and 2010–2020; (c) Ecological and cultural value of 2010–2015, 2015–2020, and 2010–2020.
Sustainability 15 11048 g010
Figure 11. Kernel density estimation curve of comprehensive value of cultivated land resources in the Hefei metropolitan area from 2010 to 2020.
Sustainability 15 11048 g011
Figure 12. Global Moran’s I value of cultivated land’s comprehensive value in Hefei metropolitan area from 2010 to 2020.
Sustainability 15 11048 g012
Figure 13. LISA clustering map for the comprehensive value of cultivated land in the Hefei metropolitan area from 2010 to 2020 (Hot spot represents p value < 0.001; Sub-hot spot represents p value < 0.01; cold spot represents p value < 0.05; non-significant represents space is not correlated).
Sustainability 15 11048 g013
Table 1. Cultivated land value accounting research review in China.
AuthorScale of StudyTheory or MethodResearch Content
Huang, X. et al. (1997) [19]ChinaAgricultural area correction coefficient method.The average unit price of cultivated land resources and the asset prices of 30 agricultural regions in 1993 were calculated.
Hu, R. et al.
(2013) [7]
ChinaIncome reduction method.Based on estimating the net income of cultivated land in China, the total amount of cultivated land resources in 1998 and 2008 was calculated.
Chen, H.
(2003) [6]
ProvincialIncome multiple methods.The economic value of cultivated land resources in Shandong Province was calculated using fuzzy mathematics and the grey system theory.
Cai, Z.
(2009) [24]
WatershedMarket value method.
Opportunity cost method et al.
Comprehensive value accounting for cultivated land resources in the Huang-Huai-Hai region.
Li, J. et al. (2010) [7]ProvincialIncome reduction method. Equivalent factor method et al.The economic, social, and ecological values of cultivated land resources in Shanxi Province in 2007 were estimated, and these solutions were put forward.
Qin, S. et al.
(2012) [8]
ProvincialIncome approach.Based on survey data on the net income of agricultural products, the economic value of cultivated land resources in Hunan Province was calculated.
Wu, Z. et al.
(2013) [9]
Land massIncome reduction method. Shadow price method et al.The social security function value of cultivated land in hilly and mountainous areas was measured at the plot scale, and the influence mechanism of the social security value was identified.
Zhu, D. et al.
(2017) [24]
ProvincialAgricultural land valuation theory.Based on the data of cultivated land transfer rent and the national survey data, the economic value of cultivated land in 2016 was calculated.
Li, J. et al.(2009) [24]CityMarket value method. Results reference method et al.Based on the statistical data of 2002, the total economic, social, and ecological value of cultivated land resources in Qingdao was calculated.
Wang, X. et al.
(2016) [25]
CountyThe alternative market approaches. Social development coefficient correction method et al.The economic, social, and ecological comprehensive values of cultivated land resources in Tuanfeng County in 2013 were calculated, and their spatial distribution characteristics were analysed.
Xie, L.et al. (2022) [23]CountyIncome reduction method. Equivalent factor method et al.The comprehensive value of cultivated land resources in Xiangyuan County in 2017 was calculated, and its spatial distribution was analysed.
Zhong, X. (2021) [32]GridIncome reduction method. Carbon tax law. Production cost method et al.Based on the theory of production capacity, the economic and ecological value of cultivated land resources in Jiangxi Province in 1980 and 2010 was calculated, and its spatial distribution pattern was analysed.
Daniel McMillen; Ruchi Singh
(2022) [4]
City, CountySimilar to the Stein method and non-teardown sales.Used data from Chicago and Maricopa County demonstrated the ability of these two approaches to estimate land value.
Lautrup. et al.
(2023) [32]
IslandPleasant value model.Took the Danish peninsula of Jutland as a case through the land-value model estimate of landowners’ private amenity value of forests; the value of an additional hectare of forest was predicted using the hedonic model and compared with the forest’s expectation value based on accounting statistics for forest income.
Carolyn N. M. DeLoyde, W. E. Mabee
(2023) [34]
ProvincialEcological service value.This research quantified the economic value of ecosystem services by land cover type, using a case study approach and data localized to southern Ontario, Canada.
Fikrey Tesfay. et al.
(2023) [35]
WatershedThe maximum likelihood classifier.This paper used Chacha Watershed as a case to assess the impact of LULC changes on the value of ecosystem services for the sensitivity of display ecosystem services.
Disclaimer/Publisher’s Note: The statements, opinions and data contained in all publications are solely those of the individual author(s) and contributor(s) and not of MDPI and/or the editor(s). MDPI and/or the editor(s) disclaim responsibility for any injury to people or property resulting from any ideas, methods, instructions or products referred to in the content.

