
Quality Properties and Torrefaction Characteristics of Pellets: Rose Oil Distillation Solid Waste and Red Pine Sawdust

 , and
, and
Abstract
1. Introduction
2. Materials and Methods
2.1. Pelletization of the Samples
2.2. Torrefaction of the Pellets
2.3. Calculation of Mass Yield, Energy Yield, and Energy Density Ratio of the Pellets
2.4. Determination of Tensile Strength, Impact, and Water Intake Resistance of the Pellets
3. Results and Discussion
3.1. Proximate Analysis of the Raw and Torrefied RPS and RDW Pellets
3.2. Fuel Properties of the Raw and Torrefied RPS and RDW Pellets
3.3. Abrasive Resistance and Tensile Strength of the Raw and Torrefied RPS and RDW Pellets
3.4. Mass Yield, Energy Yield, and Energy Density Ratios of the Torrefied RPS and RDW Pellets
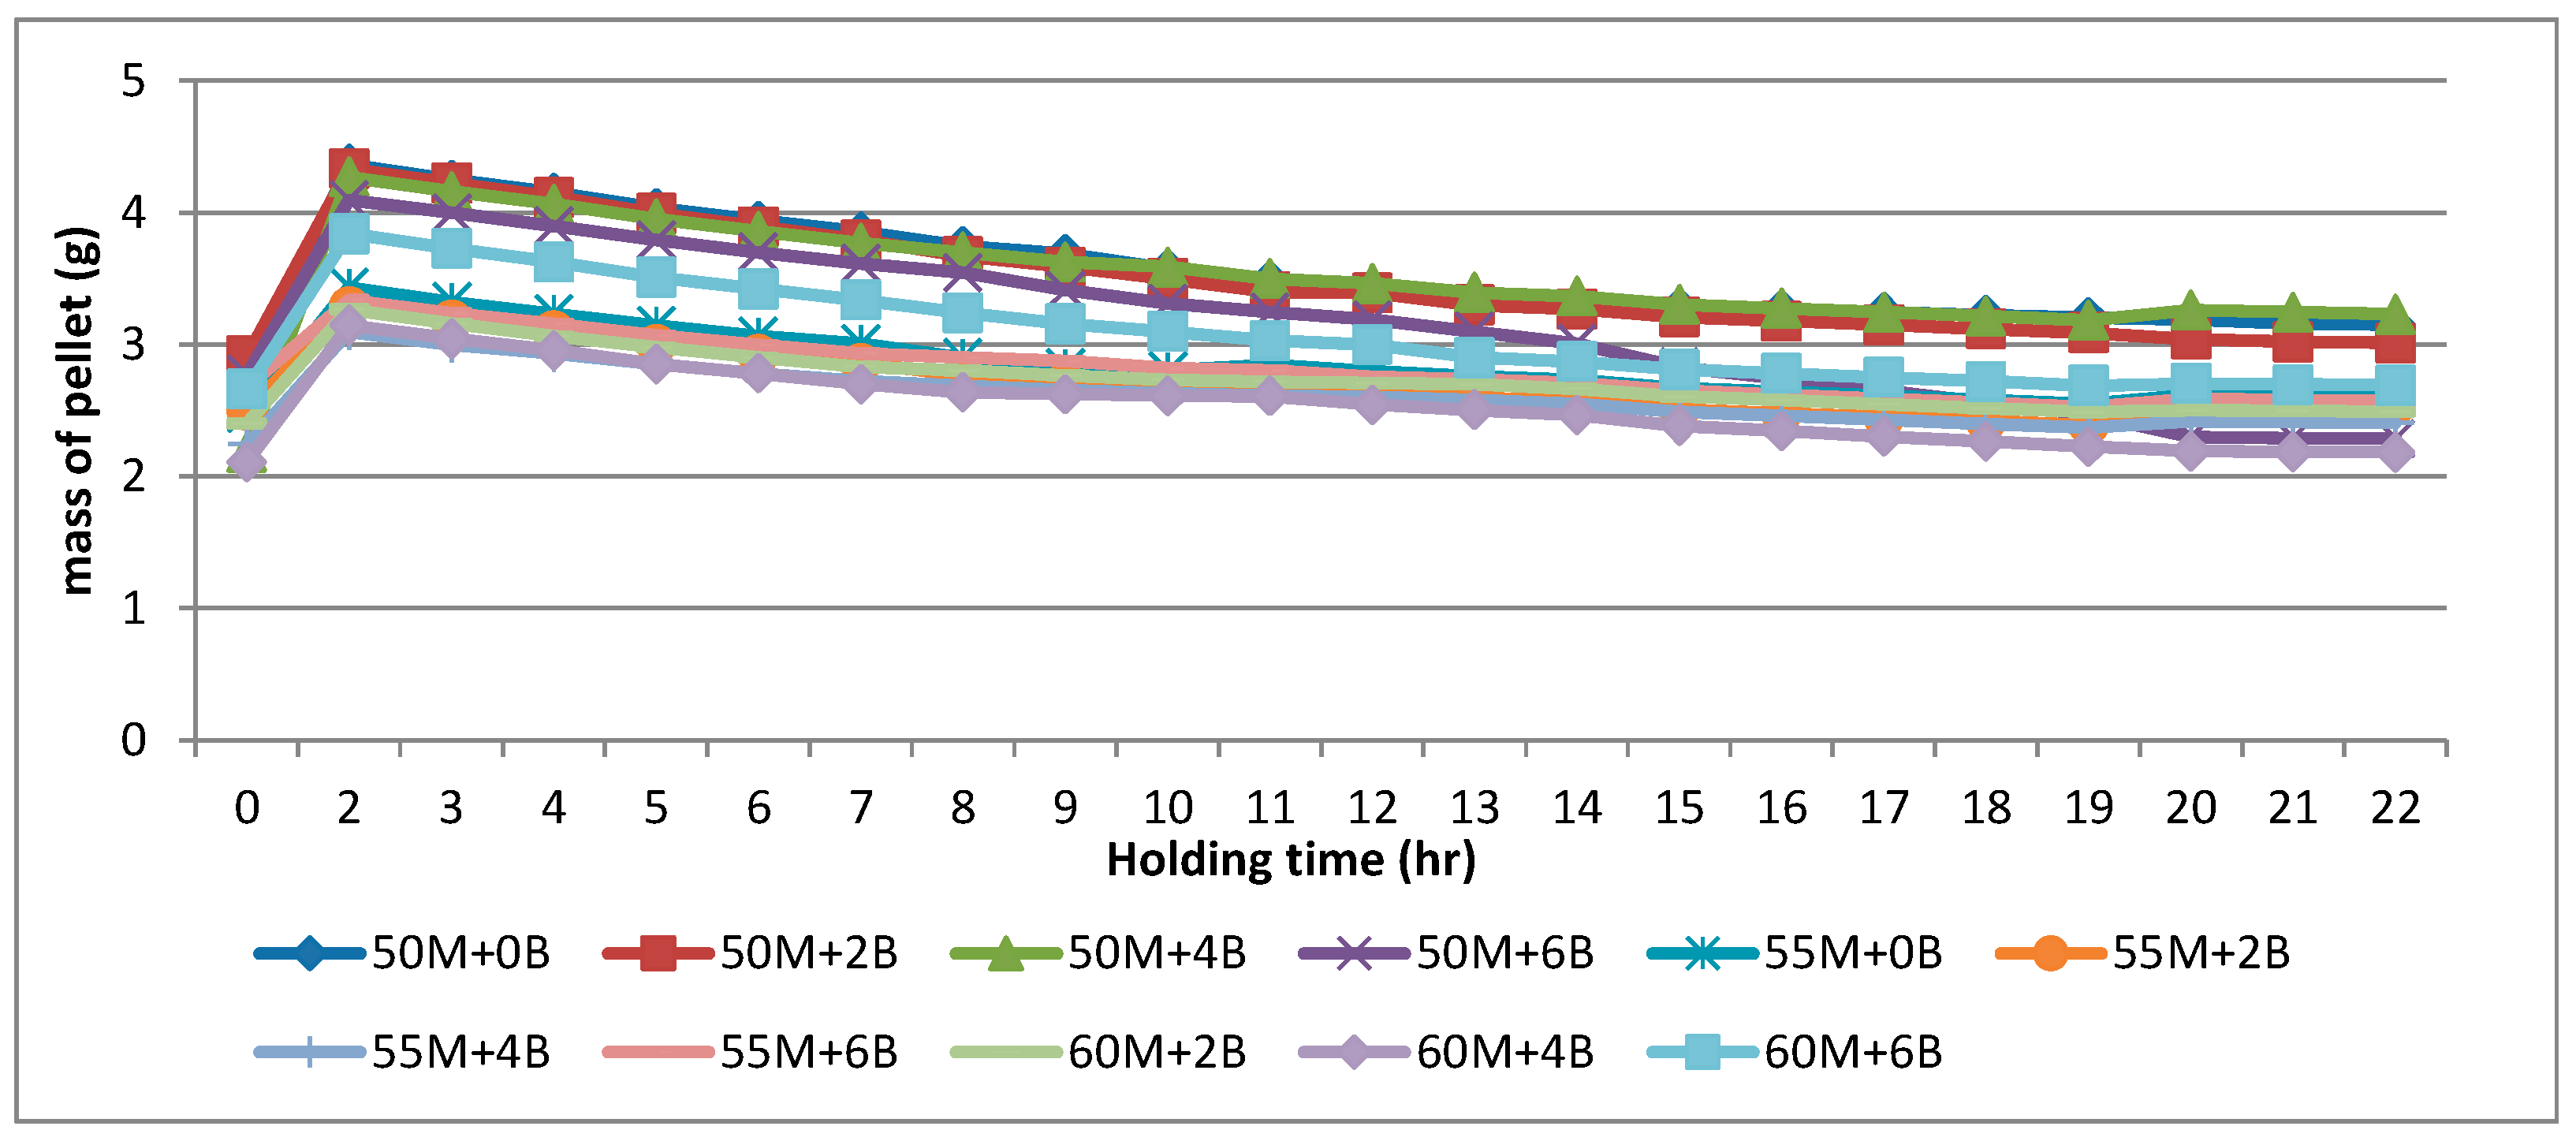
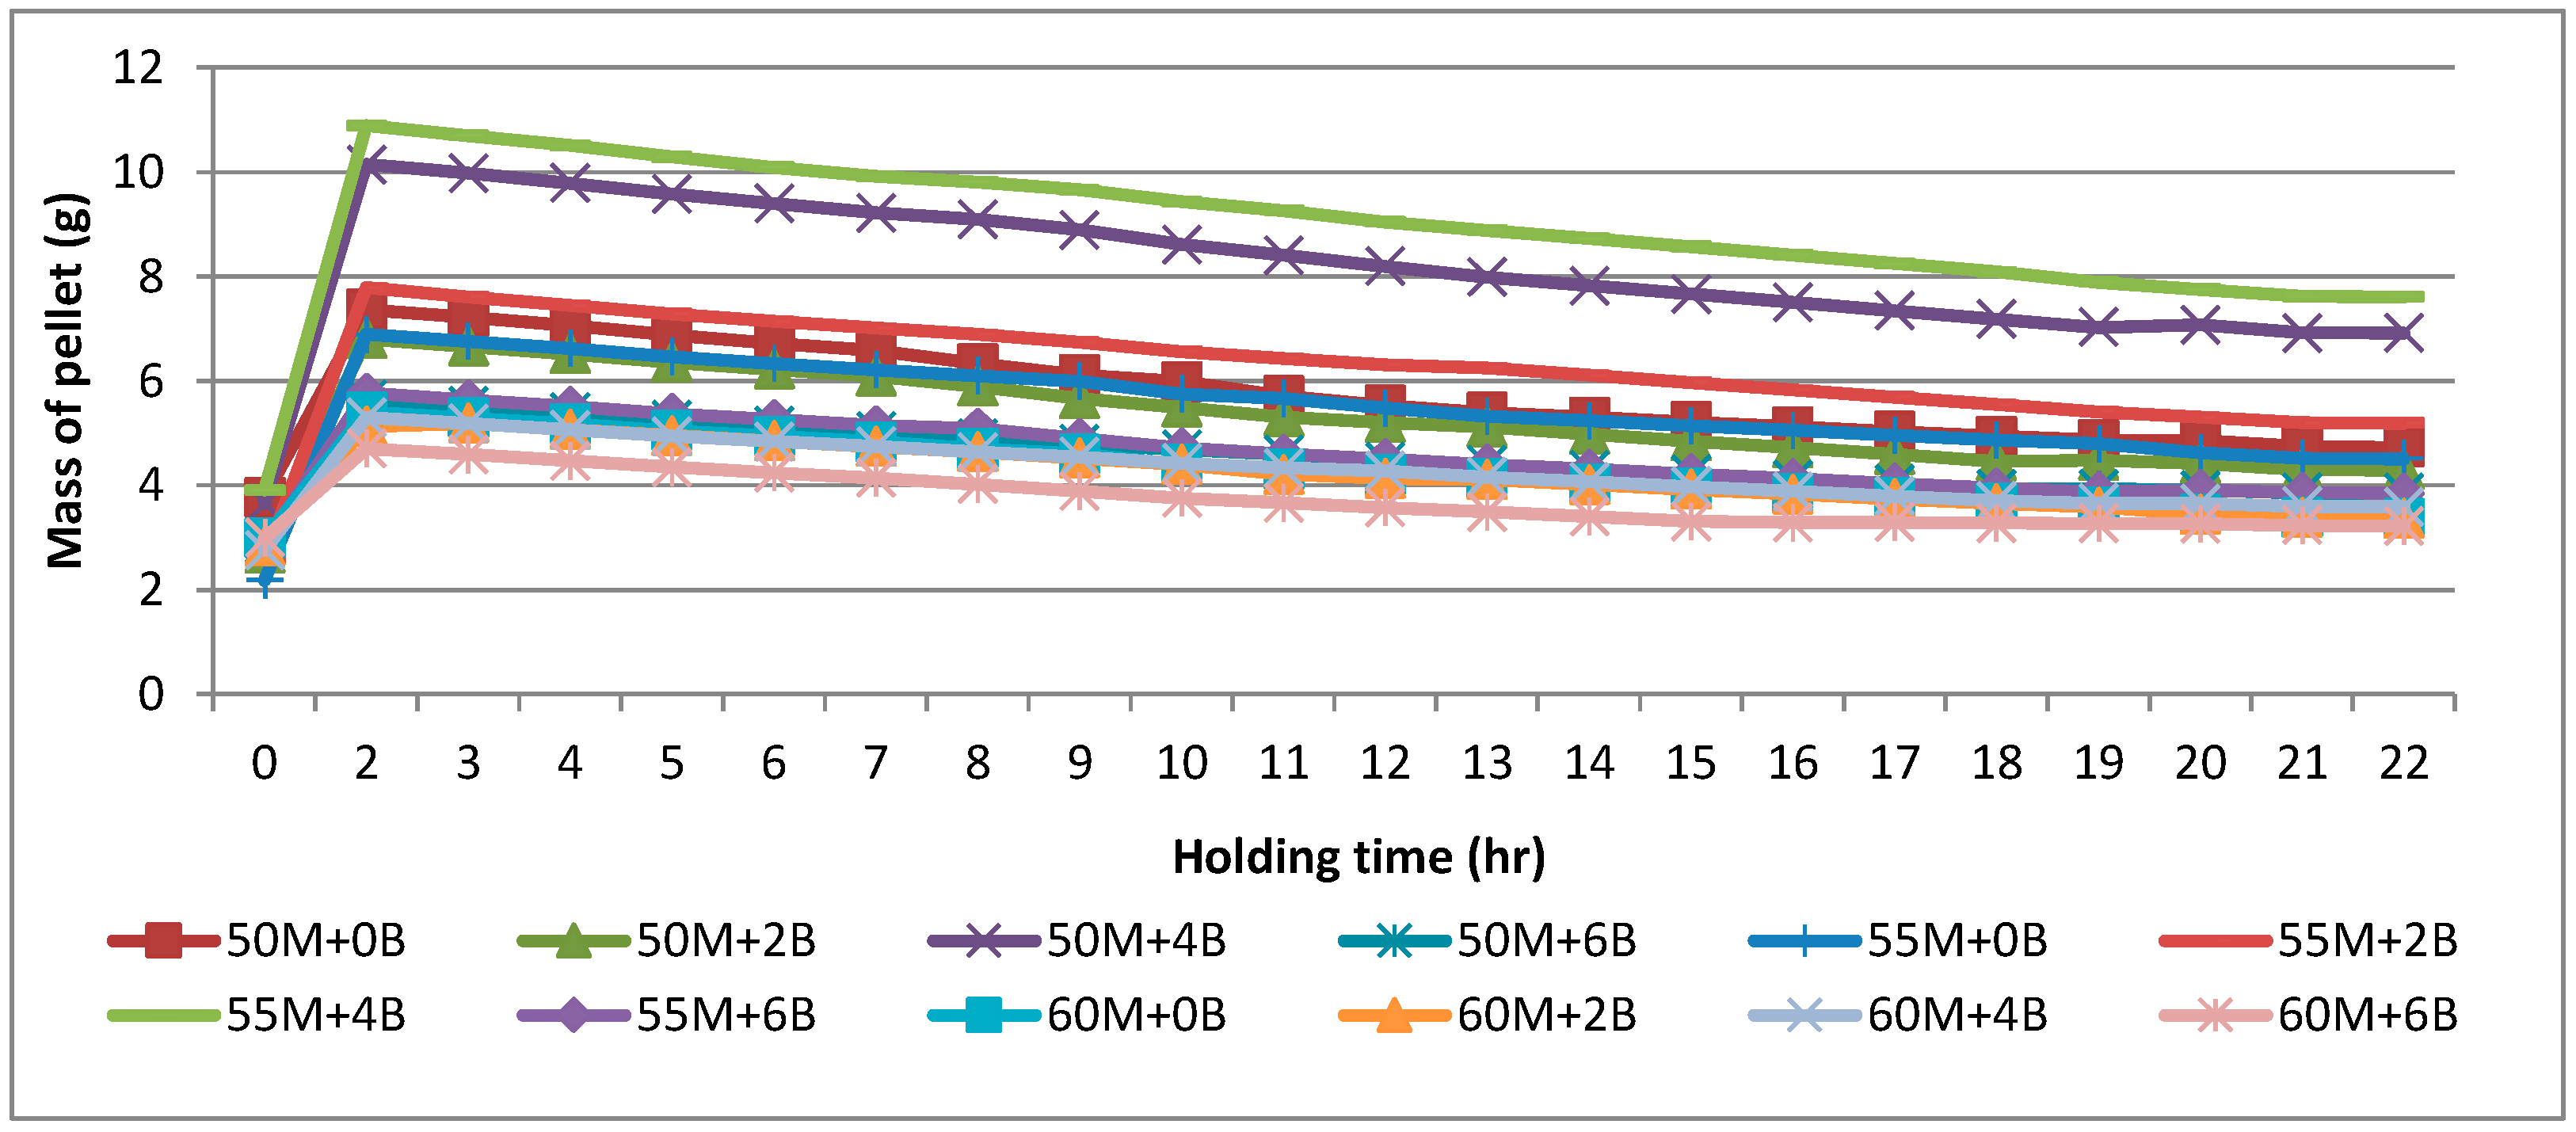
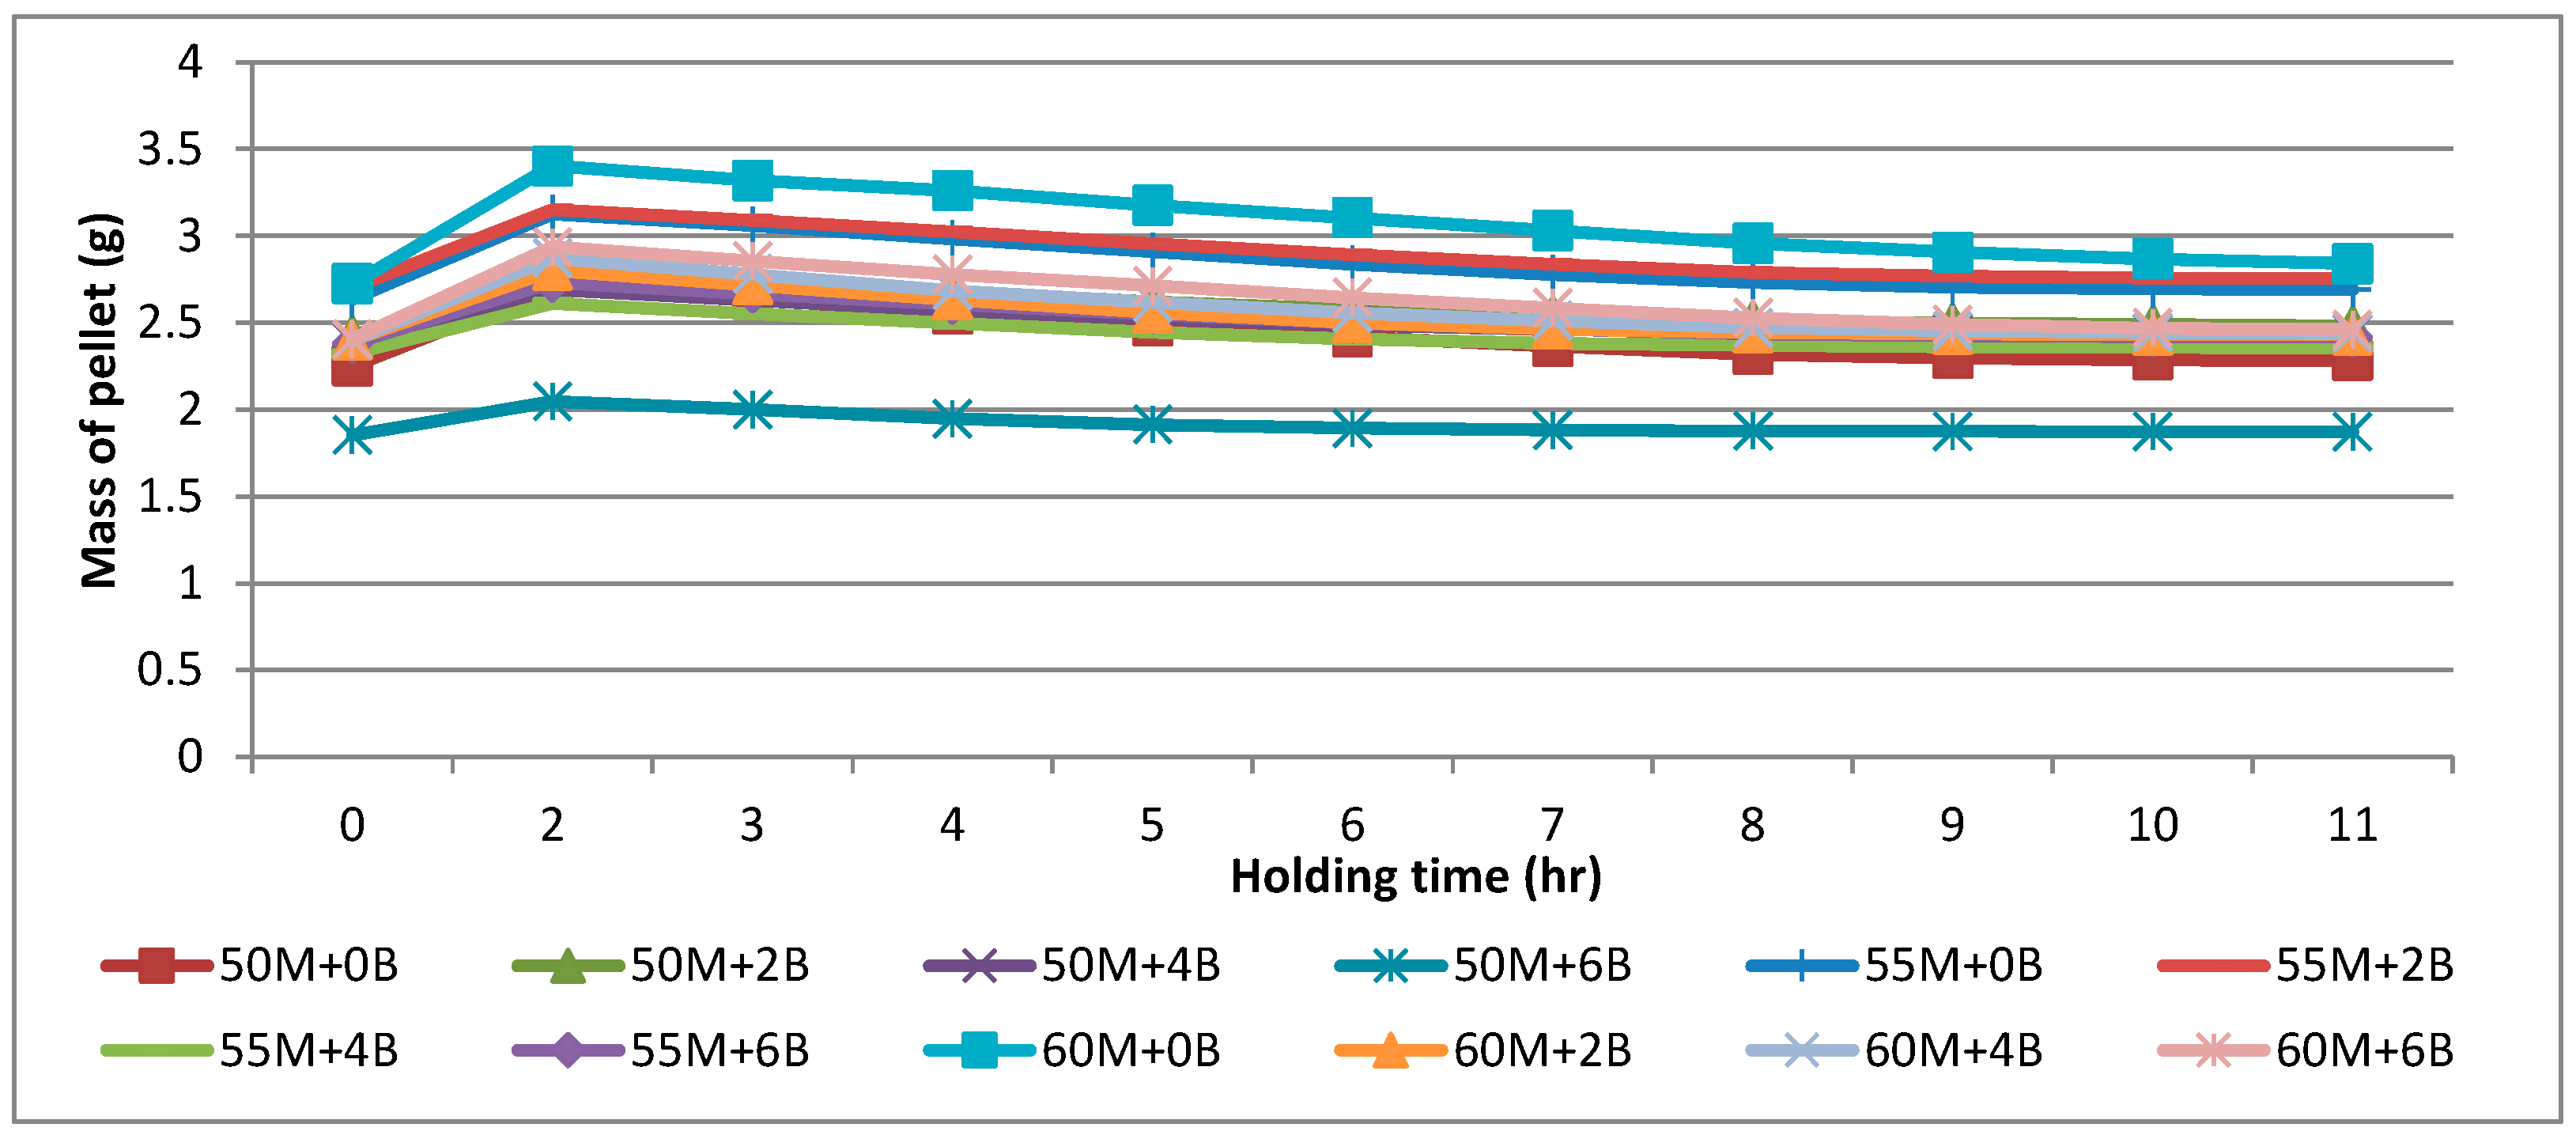
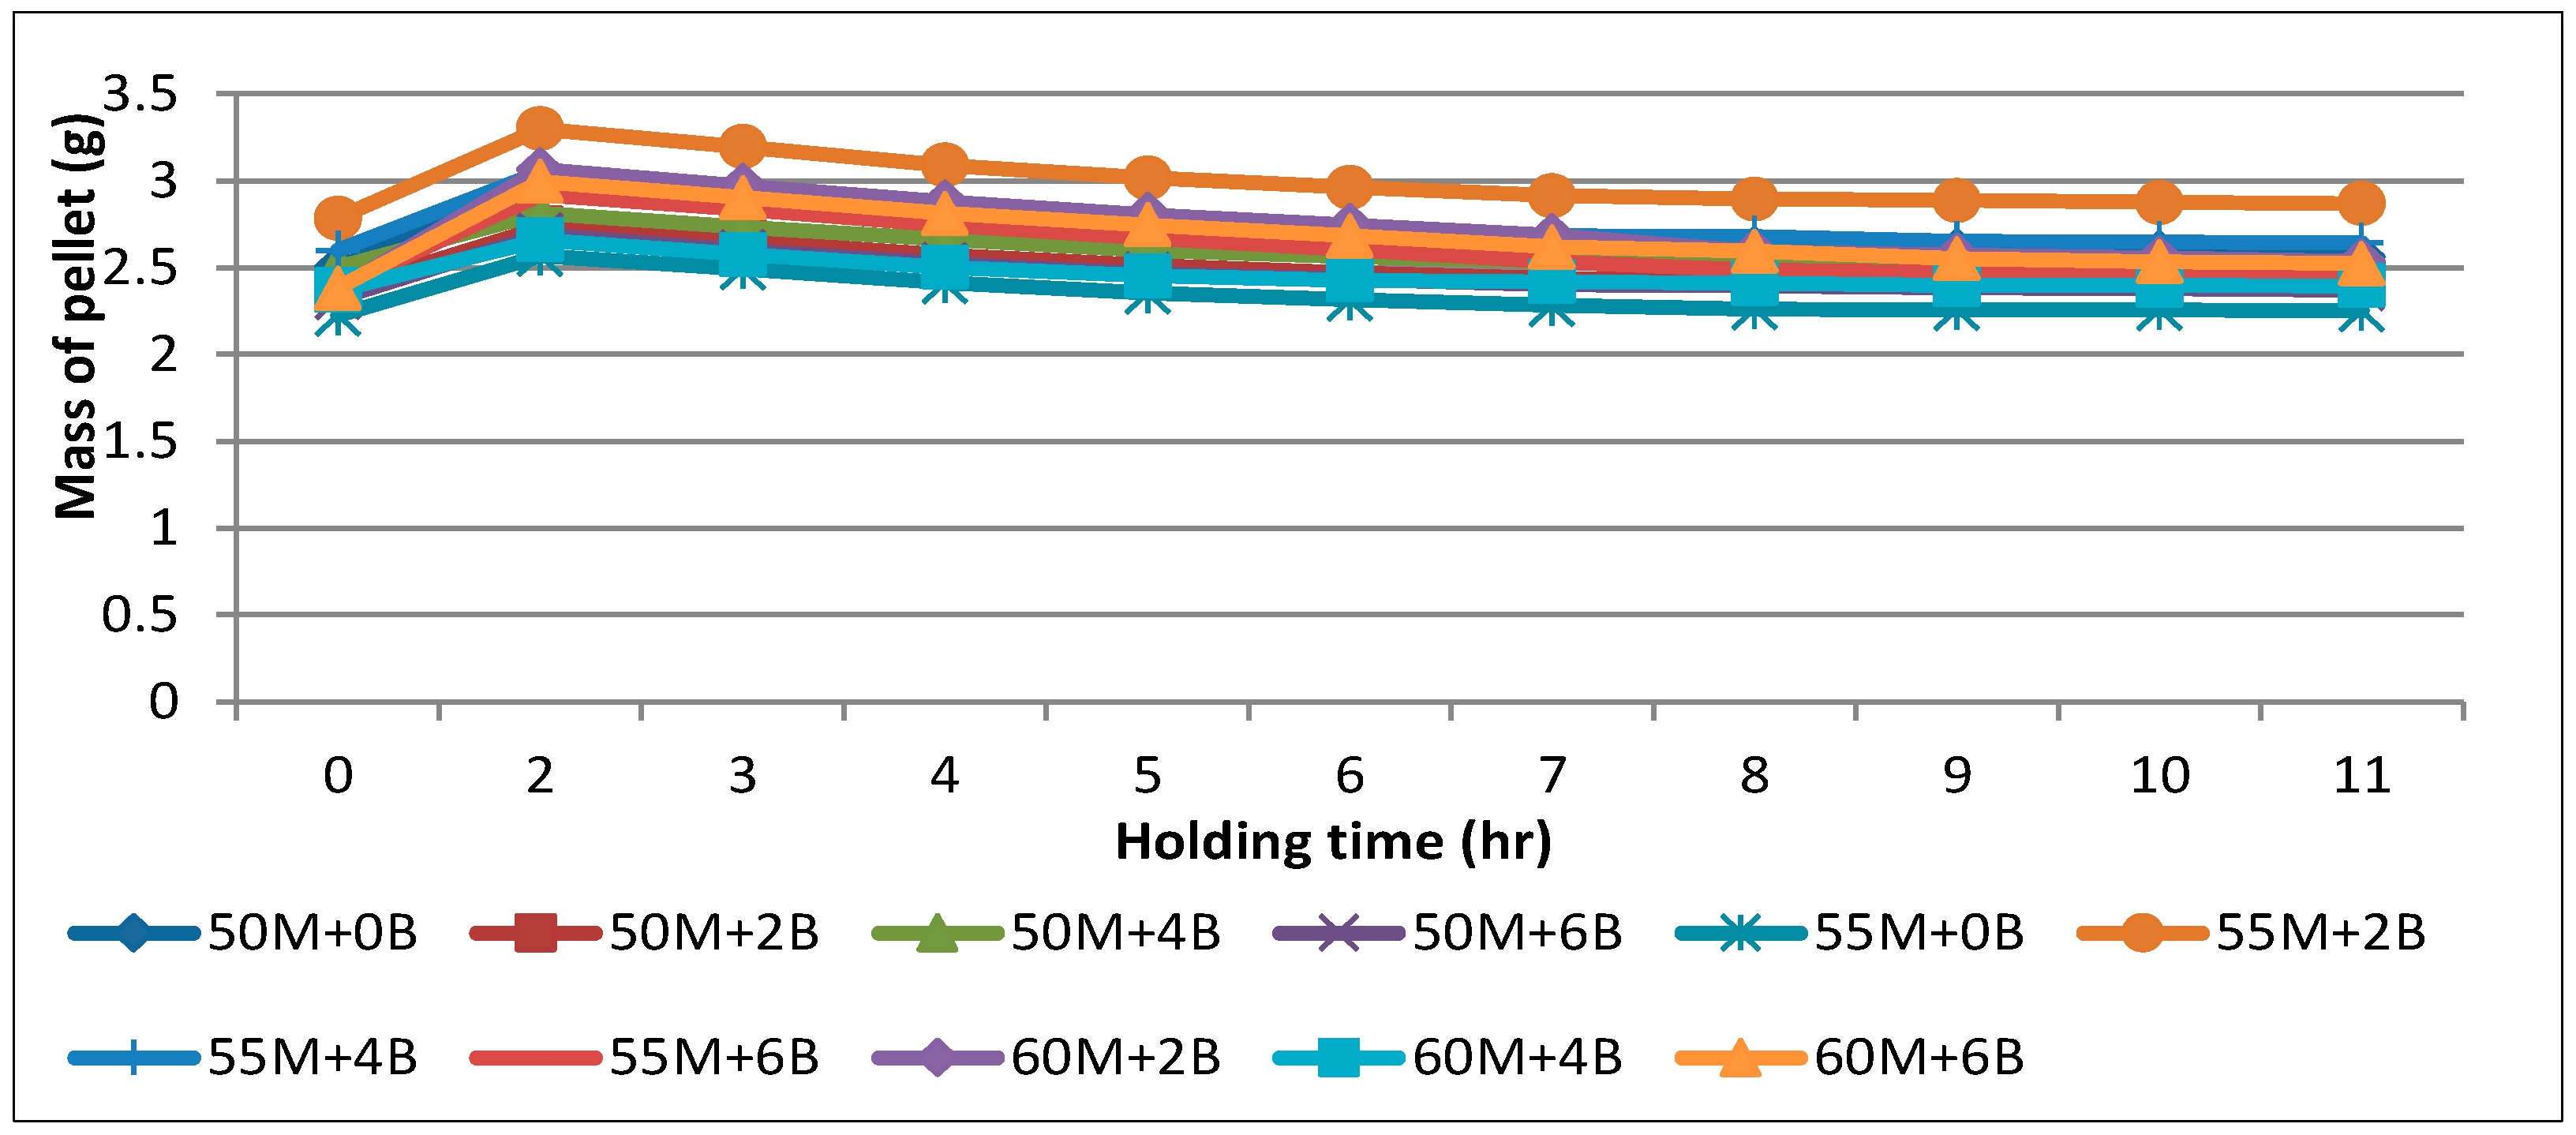
3.5. Water Intake Resistance of the Raw and Torrefied RPS and RDW Pellets
4. Conclusions
- ✓
- The contrary of findings in the literature, the ash content, fixed carbon, and higher heating values of the torrefied pellets were generally higher than their raw form. However, their moisture and volatile matter content were lower. In line with the increase in the fixed carbon content as a result of torrefaction, the higher heating values of the RPS and RDW pellets increased.
- ✓
- Although the initial moisture content of the pellets did not show a significant variation in the particle density, the particle density of both the RPS and RDW pellets decreased after the torrefaction process.
- ✓
- The tensile strength of the raw RPS increased with increases in the binder content, but there was no significant increase in the tensile strength of the RDW pellets with the binder content. Furthermore, the average decreases in the tensile strength of both the torrefied RPS and RDW were found to be close.
- ✓
- The average energy density ratios of the RPS and RDW pellets were above one, while the torrefied RPS and RDW pellets were just below one, but their values improved significantly with the increasing binder content of the mixture.
- ✓
- The relationship between average mass yield and average energy yield regardless of binder ratios was significant for RPS but not RDW. For the torrefied RPS and RDW pellets, there was no statistically significant difference between moisture content and energy efficiency, energy density, or mass yield.
- ✓
- As a result of torrefaction, the increase in the higher heating values of the RPS pellets was higher than the RDW value.
- ✓
- The RPS pellets were found to be more prone to breakage and chipping at the same moisture content than the RDW pellets at rates ranging from 2.4 to 6 times. Furthermore, the torrefaction process increased the breakage of the pellets, causing them to crumble.
- ✓
- Both the raw and torrefied RDW pellets had higher water intake resistance than the RPS pellets. The torrefaction process increased the water intake resistance of the biopellets, resulting in the torrefied RPS and RDW pellets resisting water uptake and further degrading. Accordingly, torrefied pellets were more stable in moisture absorption than the raw pellets, and they can be stored in the open air longer than the raw pellets.
Author Contributions
Funding
Data Availability Statement
Conflicts of Interest
References
- González-Torres, M.; Pérez-Lombard, L.; Coronel, J.F.; Maestre, I.R.; Yan, D. A review on buildings energy information: Trends, end-uses, fuels and drivers. Energy Rep. 2022, 8, 626–637. [Google Scholar] [CrossRef]
- Angulo-Mosquera, L.S.; Alvarado-Alvarado, A.A.; Rivas-Arrieta, M.J.; Cattaneo, C.R.; Rene, E.R.; García-Depraect, O. Production of solid biofuels from organic waste in developing countries: A review from sustainability and economic feasibility perspectives. Sci. Total Environ. 2021, 795, 148816. [Google Scholar] [CrossRef]
- IEA. World Energy Balances: Overview. 2023. Available online: https://www.iea.org/reports/world-energy-balances-overview/world (accessed on 31 January 2023).
- McGlade, C.; Ekins, P. The geographical distribution of fossil fuels unused when limiting global warming to 2 °C. Nature 2015, 517, 187–190. [Google Scholar] [CrossRef] [PubMed]
- Knapczyk, A.; Francik, S.; Jewiarz, M.; Zawiślak, A.; Francik, R. Thermal Treatment of Biomass: A Bibliometric Analysis-The Torrefaction Case. Energies 2020, 14, 162. [Google Scholar] [CrossRef]
- Gil, M.V.; Oulego, P.; Casal, M.D.; Pevida, C.; Pis, J.J.; Rubiera, F. Mechanical durability and combustion characteristics of pellets from biomass blends. Bioresour. Technol. 2010, 101, 8859–8867. [Google Scholar] [CrossRef] [PubMed]
- Zamorano, M.; Popov, V.; Rodríguez, M.L.; García-Maraver, A. A comparative study of quality properties of pelletized agricultural and forestry lopping residues. Renew. Energy 2011, 36, 3133–3140. [Google Scholar] [CrossRef]
- Moscicki, K.J.; Niedzwiecki, Ł.; Owczarek, P.; Wnukowski, M. Commoditization of biomass: Dry torrefaction and pelletization-a review. J. Power Technol. 2014, 94, 233–249. [Google Scholar]
- Atay, O.A.; Ekinci, K. Characterization of pellets made from rose oil processing solid wastes/coal powder/pine bark. Renew. Energy 2020, 149, 933–939. [Google Scholar] [CrossRef]
- Kang, K.; Qiu, L.; Sun, G.; Zhu, M.; Yang, X.; Yao, Y.; Sun, R. Codensification technology as a critical strategy for energy recovery from biomass and other resources—A review. Renew. Sustain. Energy Rev. 2019, 116, 109414. [Google Scholar] [CrossRef]
- Park, S.W.; Jang, C.H.; Baek, K.R.; Yang, J.K. Torrefaction and low-temperature carbonization of woody biomass: Evaluation of fuel characteristics of the products. Energy 2012, 45, 676–685. [Google Scholar] [CrossRef]
- Dhungana, A.; Basu, P.; Dutta, A. Effects of Reactor Design on the Torrefaction of Biomass. J. Energy Resour. Technol. 2012, 134, 04180. [Google Scholar] [CrossRef]
- Chen, Y.; Syed-Hassan, S.S.A.; Xiong, Z.; Li, Q.; Hu, X.; Xu, J.; Ren, Q.; Deng, Z.; Wang, X.; Su, S.; et al. Temporal and spatial evolution of biochar chemical structure during biomass pellet pyrolysis from the insights of micro-Raman spectroscopy. Fuel Process. Technol. 2021, 218, 106839. [Google Scholar] [CrossRef]
- TÜİK. 2023. Available online: https://data.tuik.gov.tr/Bulten/Index?p=Bitkisel-Uretim-2.Tahmini-2022-45503 (accessed on 6 April 2023).
- Tosun, İ.; Gönüllü, M.T.; Arslankaya, E. Determination of Rose Oil Industry Process Wastes Characteristics. In Proceedings of the First National Environmental Problems Symposium, Atatürk University, Environmental Problems Research Center Directorate, Erzurum, Türkiye, 2002; pp. 864–873. [Google Scholar]
- Baydar, H.; Erbaş, S.; Şanli, A.; Kara, N. A Research on the Element Concentration and Evaluation Possibilities of Distillation Residue in Oil-bearing Rose (Rosa damascena Mill.). Turk. J. Sci. Eng. 2020, 1, 1–4. [Google Scholar]
- Ok, K. Turkish Forestry. In The Foresters’ Association of Turkey; Kuban Printing and Publishing: Ankara, Türkiye, 2019; p. 16. ISBN 978-975-93478-4-0. [Google Scholar]
- FAOSTAT. 2022. Available online: https://www.fao.org/faostat/en/ (accessed on 26 April 2023).
- Armakan, S.; Civan, M.; Yurdakul, S. Determining co-combustion characteristics, kinetics and synergy behaviors of raw and torrefied forms of two distinct types of biomass and their blends with lignite. J. Therm. Anal. Calorim. 2022, 147, 12855–12869. [Google Scholar] [CrossRef]
- Baysal, E.; Yalinkilic, M.K.; Çolak, M.; Göktaş, O. Combustion properties of Calabrian pine (Pinus brutia Ten.) wood treated with vegetable tanning extracts and boron compounds. Turk. J. Agric. For. 2003, 27, 245–252. [Google Scholar]
- Şensöz, S.; Can, M. Pyrolysis of pine (Pinus brutia Ten.) chips: 1. Effect of pyrolysis temperature and heating rate on the product yields. Energy Source 2002, 24, 347–355. [Google Scholar] [CrossRef]
- Şensöz, S. Slow pyrolysis of wood barks from Pinus brutia Ten. and product compositions. Bioresour. Technol. 2003, 89, 307–311. [Google Scholar] [CrossRef]
- Şensöz, S.; Can, M. Pyrolysis of pine (Pinus brutia Ten.) chips: 2. Structural analysis of bio-oil. Energy Source 2002, 24, 357–364. [Google Scholar] [CrossRef]
- Kaya, S. Catalytically Pyrolysis of Red Pine Bark (Pinus brutia Ten.). Master’s Thesis, Bursa Technical University, Bursa, Türkiye, 2017. [Google Scholar]
- Gökoğlu, C. Determination of Fuel Properties of the Wood Pellet’s Made from Turkish Red Pine (Pinus brutia L.) Forests Harvesting Residues. Master’s Thesis, Muğla Sıtkı Koçman University, Muğla, Türkiye, 2016. [Google Scholar]
- Yalinkiliç, M.K.; Baysal, E.; Demirci, Z. Fire resistance of Calabrian pine (Pinus brutia Ten.) wood treated with some boron compounds and/or water repellents. Turk. J. Agric. For. 1997, 21, 423–431. [Google Scholar] [CrossRef]
- Slavov, A.; Vasileva, I.; Stefanov, L.; Stoyanova, A. Valorization of wastes from the rose oil industry. Rev. Environ. Sci. Biotechnol. 2017, 16, 309–325. [Google Scholar] [CrossRef]
- Qian, X.; Lee, S.; Soto, A.; Chen, G. Regression Model to Predict the Higher Heating Value of Poultry Waste from Proximate Analysis. Resources 2018, 7, 39. [Google Scholar] [CrossRef]
- Nhuchhen, D.; Afzal, M. HHV Predicting Correlations for Torrefied Biomass Using Proximate and Ultimate Analyses. Bioengineering 2017, 4, 7. [Google Scholar] [CrossRef] [PubMed]
- Bada, S.O.; Falcon, R.M.S.; Falcon, L.M. Investigation of combustion and co-combustion characteristics of raw and thermal treated bamboo with thermal gravimetric analysis. Thermochim. Acta 2014, 589, 207–214. [Google Scholar] [CrossRef]
- Toptas, A.; Yildirim, Y.; Duman, G.; Yanik, J. Combustion behavior of different kinds of torrefied biomass and their blends with lignite. Bioresour. Technol. 2015, 177, 328–336. [Google Scholar] [CrossRef] [PubMed]
- Szufa, S.; Piersa, P.; Adrian, Ł.; Czerwińska, J.; Lewandowski, A.; Lewandowska, W.; Sielski, J.; Dzikuć, M.; Wróbel, M.; Jewiarz, M.; et al. Sustainable Drying and Torrefaction Processes of Miscanthus for Use as a Pelletized Solid Biofuel and Biocarbon-Carrier for Fertilizers. Molecules 2021, 26, 1014. [Google Scholar] [CrossRef] [PubMed]
- Yurdakul, S. Determination of co-combustion properties and thermal kinetics of poultry litter/coal blends using thermogravimetry. Renew. Energy 2016, 89, 215–223. [Google Scholar] [CrossRef]
- Kim, S.J.; Park, S.; Oh, K.C.; Ju, Y.M.; Hoon Cho, L.; Kim, D.H. Development of surface torrefaction process to utilize agro-byproducts as an energy source. Energy 2021, 233, 121192. [Google Scholar] [CrossRef]
- Fraga, L.G.; Silva, J.; Teixeira, J.C.; Ferreira, M.E.C.; Teixeira, S.F.; Vilarinho, C.; Gonçalves, M.M. Study of Mass Loss and Elemental Analysis of Pine Wood Pellets in a Small-Scale Reactor. Energies 2022, 15, 5253. [Google Scholar] [CrossRef]
- Ozturk, H.H.; Ayhan, B.; Turgut, K. An assessment of the energetic properties of fuel pellets made by agricultural wastes. Sci. Pap. Ser. E Land Reclam. Earth Obs. Surv. Environ. Eng. 2019, 8, 9–16. [Google Scholar]
- Tumuluru, J.S.; Ghiasi, B.; Soelberg, N.R.; Sokhansanj, S. Biomass Torrefaction Process, Product Properties, Reactor Types, and Moving Bed Reactor Design Concepts. Front. Energy Res. 2021, 9, 728140. [Google Scholar] [CrossRef]
- ISO 17225-1; Solid Biofuels–Fuel Specifications and Classes—Part 1: General Requirements. International Organization for Standardization: Geneva, Switzerland, 2021.
- ISO 17225-8; Solid Biofuels—Fuel Specifications and Classes—Part 8: Graded Thermally Treated and Densified Biomass Fuels. International Organization for Standardization: Geneva, Switzerland, 2016.
- Lu, Z.; Jian, J.; Jensen, P.A.; Wu, H.; Glarborg, P. Influence of Torrefaction on Single Particle Combustion of Wood. Energy Fuel 2016, 30, 5772–5778. [Google Scholar] [CrossRef]
- Botelho, T.; Costa, M.; Wilk, M.; Magdziarz, A. Evaluation of the combustion characteristics of raw and torrefied grape pomace in a thermogravimetric analyzer and in a drop tube furnace. Fuel 2018, 212, 95–100. [Google Scholar] [CrossRef]
- Nhuchhen, D.; Basu, P.; Acharya, B. A Comprehensive Review on Biomass Torrefaction. Int. J. Renew. Energy Biofuels 2014, 1–56. [Google Scholar] [CrossRef]
- Ahmed, I.; Ali, A.; Ali, B.; Hassan, M.; Hussain, S.; Hashmi, H.; Ali, Z.; Soomro, A. Pelletization of Biomass Feedstocks: Effect of Moisture Content, Particle Size and a Binder on Characteristics of Biomass Pellets. 2021. Available online: https://www.researchsquare.com/article/rs-163994/v1 (accessed on 31 January 2023).
- Soponpongpipat, N.; Comsawang, P.; Nanetoe, S. Quality Properties and Pyrolysis Characteristics of Cassava Rhizome Pellets Produced by Alternating between Pelletizing and Torrefaction. Processes 2019, 7, 930. [Google Scholar] [CrossRef]
- Rabier, F.; Temmerman, M.; Böhm, T.; Hartmann, H.; Jensen, P.D.; Rathbauer, J.; Carrasco, J.; Fernández, M. Particle density determination of pellets and briquettes. Biomass Bioenergy 2006, 30, 954–963. [Google Scholar] [CrossRef]
- Tumuluru, J.S.; Tabil, L.; Opoku, A.; Mosqueda, M.R.; Fadeyi, O. Effect of process variables on the quality characteristics of pelleted wheat distiller’s dried grains with solubles. Biosyst. Eng. 2010, 105, 466–475. [Google Scholar] [CrossRef]
- Nguyen, Q.N.; Cloutier, A.; Achim, A.; Stevanovic, T. Effect of process parameters and raw material characteristics on physical and mechanical properties of wood pellets made from sugar maple particles. Biomass Bioenergy 2015, 80, 338–349. [Google Scholar] [CrossRef]
- Lisowski, A.; Matkowski, P.; Dąbrowska, M.; Piątek, M.; Świętochowski, A.; Klonowski, J.; Mieszkalski, L.; Reshetiuk, V. Particle Size Distribution and Physicochemical Properties of Pellets Made of Straw, Hay, and Their Blends. Waste Biomass Valoriz. 2020, 11, 63–75. [Google Scholar] [CrossRef]
- Wistara, N.J.; Diputra, P.; Hendra, D. Biopellet from demineralized oil palm trunk. IOP Conf. Ser. Earth Environ. Sci. 2021, 891, 012022. [Google Scholar] [CrossRef]
- Wang, L.; Riva, L.; Skreiberg, Ø.; Khalil, R.; Bartocci, P.; Yang, Q.; Yang, H.; Wang, X.; Chen, D.; Rudolfsson, M.; et al. Effect of Torrefaction on Properties of Pellets Produced from Woody Biomass. Energy Fuels 2020, 34, 15343–15354. [Google Scholar] [CrossRef]
- Picchio, R.; Latterini, F.; Venanzi, R.; Stefanoni, W.; Suardi, A.; Tocci, D.; Pari, L. Pellet Production from Woody and Non-Woody Feedstocks: A Review on Biomass Quality Evaluation. Energies 2020, 13, 2937. [Google Scholar] [CrossRef]
- Arias, B.; Pevida, C.; Fermoso, J.; Plaza, M.G.; Rubiera, F.; Pis, J.J. Influence of torrefaction on the grindability and reactivity of woody biomass. Fuel Process. Technol. 2008, 89, 169–175. [Google Scholar] [CrossRef]
- Wang, G.; Luo, Y.; Deng, J.; Kuang, J.; Zhang, Y. Pretreatment of biomass by torrefaction. Chin. Sci. Bull. 2011, 56, 1442–1448. [Google Scholar] [CrossRef]
- Ciolkosz, D.; Wallace, R. A review of torrefaction for bioenergy feedstock production. Biofuels Bioprod. Biorefining 2011, 5, 317–329. [Google Scholar] [CrossRef]
- Yılmaz, H.; Çanakcı, M.; Topakcı, M.; Karayel, D. The effect of raw material moisture and particle size on agri-pellet production parameters and physical properties: A case study for greenhouse melon residues. Biomass Bioenergy 2021, 150, 106125. [Google Scholar] [CrossRef]
- Bridgeman, T.G.; Jones, J.M.; Shield, I.; Williams, P.T. Torrefaction of reed canary grass, wheat straw and willow to enhance solid fuel qualities and combustion properties. Fuel 2008, 87, 844–856. [Google Scholar] [CrossRef]
- Preradovic, M.; Papuga, S.; Kolundžija, A. Torrefaction: Process Review. Period. Polytech. Chem. Eng. 2023, 67, 49–61. [Google Scholar] [CrossRef]
- Pahla, G.; Mamvura, T.A.; Muzenda, E. Torrefaction of waste biomass for application in energy production in South Africa. S. Afr. J. Chem. Eng. 2018, 25, 1–12. [Google Scholar] [CrossRef]
- Chen, Z.; Wang, M.; Ren, Y.; Jiang, E.; Jiang, Y.; Li, W. Biomass torrefaction: A promising pretreatment technology for biomass utilization. IOP Conf. Ser. Earth Environ. Sci. 2018, 113, 012201. [Google Scholar] [CrossRef]
- Phanphanich, M.; Mani, S. Impact of torrefaction on the grindability and fuel characteristics of forest biomass. Bioresour. Technol. 2011, 102, 1246–1253. [Google Scholar] [CrossRef]
- Chowdhury, Z.Z.; Pal, K.; Johan, R.B.; Dabdawb, W.A.Y.; Ali, M.E.; Rafique, R.F. Comparative Evaluation of Physiochemical Properties of a Solid Fuel Derived from Adansonia digitata Trunk using Torrefaction. BioResources 2017, 12, 3816–3833. [Google Scholar] [CrossRef]
- Pimchuai, A.; Dutta, A.; Basu, P. Torrefaction of Agriculture Residue To Enhance Combustible Properties. Energy Fuels 2010, 24, 4638–4645. [Google Scholar] [CrossRef]
- Niu, Y.; Lv, Y.; Lei, Y.; Liu, S.; Liang, Y.; Wang, D. Biomass torrefaction: Properties, applications, challenges, and economy. Renew. Sustain. Energy Rev. 2019, 115, 109395. [Google Scholar] [CrossRef]
- Chen, W.H.; Kuo, P.C. Torrefaction and co-torrefaction characterization of hemicellulose, cellulose and lignin as well as torrefaction of some basic constituents in biomass. Energy 2011, 36, 803–811. [Google Scholar] [CrossRef]
- Duncan, A.; Pollard, A.; Fellouah, H. Torrefied, spherical biomass pellets through the use of experimental design. Appl. Energy 2013, 101, 237–243. [Google Scholar] [CrossRef]
- Li, H.; Liu, X.; Legros, R.; Bi, X.T.; Jim Lim, C.; Sokhansanj, S. Pelletization of torrefied sawdust and properties of torrefied pellets. Appl. Energy 2012, 93, 680–685. [Google Scholar] [CrossRef]
- Sule, I. Torrefaction Behavior of Agricultural Biomass. Master’s Thesis, School of Engineering, University of Guelph, Guelph, ON, Canada, 2012. [Google Scholar]
- Ghiasisis, B. Steam-Assisted Pelletization and Torrefaction of Lignocellulosic Biomass. Ph.D. Thesis, University of British Columbia, Vancouver, BC, Canada, 2020. [Google Scholar]


| Moisture (%) | Volatile Matter (%) | Fixed Carbon (%) | Ash (%) | HHV (kcal/kg) | |
|---|---|---|---|---|---|
| RPS * | 8.20 | 85.15 | 5.45 | 1.20 | 4261.47 |
| RDW ** | 6.25 | 77.45 | 9.56 | 6.75 | 4153.91 |
| C% | H% | N% | S% | O% *** | |
| RPS | 48.18 | 6.40 | - | - | 44.22 |
| RDW | 45.58 | 6.02 | 4.14 | 0.29 | 37.22 |
| Ranges | RDW (g) | RPS (g) |
|---|---|---|
| 2 mm | 0.00 | 0.00 |
| 1.7 mm | 36.35 | 103.91 |
| 1.18 mm | 49.90 | 40.60 |
| 850 µm | 31.36 | 28.34 |
| 600 µm | 42.07 | 9.41 |
| 425 µm | 18.23 | 3.03 |
| 250 µm | 16.19 | 11.64 |
| <250 µm | 5.54 | 5.22 |
| Mixes | MC (%) | VM (%) | FC (%) | AC (%) | HHV (MJ/kg) | |||||
|---|---|---|---|---|---|---|---|---|---|---|
| RPS | RDW | RPS | RDW | RPS | RDW | RPS | RDW | RPS | RDW | |
| 50M + 0B | 6.92 ± 0.07 | 8.51 ± 0.37 | 83.58 ± 4.23 | 67.05 ± 6.45 | 7.48 ± 1.03 | 17.49 ± 2.67 | 2.03 ± 0.15 | 6.96 ± 0.67 | 18.07 ± 0.45 | 18.54 ± 1.13 |
| 50M + 2B | 10.56 ± 0.59 | 8.94 ± 0.58 | 77.50 ± 5.54 | 66.16 ± 3.32 | 10.75 ± 2.56 | 17.53 ± 1.98 | 1.18 ± 0.11 | 7.38 ± 0.56 | 18.10 ± 0.34 | 18.39 ± 0.20 |
| 50M + 4B | 9.18 ± 0.67 | 9.14 ± 0.45 | 76.46 ± 3.24 | 68.74 ± 2.26 | 12.29 ± 1.95 | 15.76 ± 0.67 | 2.07 ± 0.09 | 6.36 ± 0.72 | 18.45 ± 1.06 | 18.24 ± 0.35 |
| 50M + 6B | 11.62 ± 0.89 | 9.10 ± 0.23 | 76.38 ± 7.34 | 68.06 ± 5.56 | 9.82 ± 0.89 | 16.05 ± 0.34 | 2.19 ± 0.19 | 6.89 ± 0.86 | 17.56 ± 1.79 | 18.22 ± 0.19 |
| 55M + 0B | 10.04 ± 1.01 | 8.61 ± 0.45 | 77.17 ± 2.23 | 65.32 ± 6.34 | 11.12 ± 1.19 | 18.36 ± 2.23 | 1.67 ± 0.09 | 7.71 ± 0.82 | 17.81 ± 0.06 | 18.53 ± 1.01 |
| 55M + 2B | 10.13 ± 0.94 | 9.18 ± 0.38 | 79.01 ± 5.56 | 68.74 ± 0.98 | 10.10 ± 1.63 | 14.09 ± 0.79 | 0.75 ± 0.06 | 7.99 ± 1.09 | 18.15 ± 0.02 | 17.66 ± 0.05 |
| 55M + 4B | 10.80 ± 0.56 | 8.10 ± 1.10 | 77.51 ± 6.34 | 69.39 ± 1.14 | 10.97 ± 1.39 | 15.20 ± 0.15 | 0.72 ± 0.02 | 7.40 ± 0.06 | 18.18 ± 0.45 | 18.17 ± 0.34 |
| 55M + 6B | 10.53 ± 0.23 | 10.83 ± 0.97 | 77.59 ± 6.78 | 66.61 ± 0.56 | 11.29 ± 1.17 | 15.57 ± 1.01 | 0.71 ± 0.02 | 7.00 ± 0.67 | 17.75 ± 0.37 | 17.78 ± 0.13 |
| 60M + 0B | 9.56 ± 0.45 | - | 75.28 ± 7.23 | - | 10.26 ± 1.04 | - | 4.90 ± 1.12 | - | 17.51 ± 0.57 | - |
| 60M + 2B | 9.85 ± 0.56 | 7.38 ± 0.07 | 81.40 ± 4.14 | 65.84 ± 2.95 | 8.17 ± 0.67 | 19.31 ± 0.89 | 0.58 ± 0.01 | 7.47 ± 0.45 | 17.91 ± 0.23 | 18.96 ± 1.12 |
| 60M + 4B | 9.28 ± 0.34 | 8.32 ± 0.23 | 77.98 ± 5.56 | 65.91 ± 3.34 | 11.19 ± 0.39 | 18.20 ± 2.24 | 1.55 ± 0.04 | 7.57 ± 0.96 | 18.34 ± 0.15 | 18.58 ± 0.45 |
| 60M + 6B | 9.29 ± 0.23 | 12.63 ± 1.19 | 76.57 ± 4.32 | 65.04 ± 4.68 | 13.23 ± 0.49 | 15.35 ± 0.19 | 0.91 ± 0.02 | 6.98 ± 0.37 | 18.80 ± 1.09 | 17.42 ± 0.23 |
| Mixes | MC (%) | VM (%) | FC (%) | AC (%) | HHV (MJ/kg) | |||||
|---|---|---|---|---|---|---|---|---|---|---|
| RPS | RDW | RPS | RDW | RPS | RDW | RPS | RDW | RPS | RDW | |
| 50M + 0B | 1.37 ± 0.31 | 0.05 ± 0.01 | 80.24 ± 2.26 | 65.86 ± 6.04 | 16.73 ± 1.41 | 24.55 ± 7.94 | 1.66 ± 0.26 | 9.54 ± 0.42 | 20.71 ± 0.32 | 20.81 ± 1.68 |
| 50M + 2B | 0.86 ± 0.28 | 0.76 ± 0.23 | 77.09 ± 5.46 | 65.20 ± 8.2 | 20.98 ± 4.91 | 24.6 ± 7.90 | 1.08 ± 0.07 | 9.44 ± 1.21 | 21.63 ± 0.13 | 20.71 ± 1.25 |
| 50M + 4B | 0.55 ± 0.52 | 0.03 ± 0.12 | 77.74 ± 10.2 | 65.18 ± 7.15 | 18.95 ± 5.78 | 25.2 ± 7.65 | 2.76 ± 0.99 | 9.59 ± 0.67 | 21.03 ± 0.15 | 20.92 ± 1.37 |
| 50M + 6B | 1.02 ± 0.63 | 0.48 ± 0.43 | 75.81 ± 7.02 | 64.17 ± 7.15 | 17.60 ± 6.66 | 25.48 ± 8.21 | 1.57 ± 0.17 | 9.87 ± 0.18 | 20.20 ± 1.12 | 20.83 ± 1.57 |
| 55M + 0B | 0.35 ± 0.08 | 0.37 ± 0.01 | 77.22 ± 8.30 | 65.06 ± 1.38 | 21.21 ± 5.12 | 22.42 ± 1.00 | 1.22 ± 0.36 | 12.14 ± 1.32 | 21.73 ± 1.21 | 19.91 ± 0.13 |
| 55M + 2B | 1.24 ± 0.72 | 0.51 ± 0.18 | 75.65 ± 8.5 | 65.72 ± 0.21 | 21.89 ± 5.51 | 22.82 ± 1.36 | 1.22 ± 0.12 | 10.96 ± 0.67 | 21.68 ± 0.12 | 20.18 ± 0.52 |
| 55M + 4B | 0.81 ± 0.19 | 0.25 ± 0.05 | 77.91 ± 0.60 | 66.20 ± 9.35 | 20.33 ± 2.18 | 22.57 ± 3.18 | 0.95 ± 0.11 | 10.97 ± 7.30 | 21.55 ± 0.34 | 20.18 ± 0.60 |
| 55M + 6B | 1.02 ± 0.18 | 0.70 ± 0.07 | 76.41 ± 8.02 | 67.82 ± 5.28 | 20.70 ± 7.52 | 18.74 ± 2.86 | 1.88 ± 0.57 | 11.74 ± 2.48 | 21.40 ± 0.42 | 19.13 ± 0.38 |
| 60M + 0B | 0.94 ± 0.26 | - | 75.94 ± 3.30 | - | 21.59 ± 3.81 | - | 1.13 ± 0.11 | - | 21.63 ± 0.26 | - |
| 60M + 2B | 0.97 ± 0.03 | 0.55 ± 0.08 | 79.28 ± 4.92 | 65.3 ± 1.86 | 18.26 ± 2.10 | 23.08 ± 2.09 | 1.49 ± 0.21 | 10.57 ± 0.99 | 21.07 ± 0.24 | 20.19 ± 0.39 |
| 60M + 4B | 0.95 ± 0.12 | 0.55 ± 0.01 | 75.60 ± 2.27 | 65.92 ± 0.57 | 20.99 ± 1.30 | 21.14 ± 1.36 | 2.06 ± 0.12 | 12.40 ± 0.87 | 21.35 ± 0.14 | 19.62 ± 0.42 |
| 60M + 6B | 0.97 ± 0.05 | 0.06 ± 0.01 | 78.93 ± 3.30 | 65.17 ± 1.64 | 19.25 ± 3.93 | 22.61 ± 1.86 | 0.85 ± 0.11 | 12.16 ± 0.56 | 21.36 ± 0.15 | 20.00 ± 0.70 |
| Mixes | Mass (g) | Diameter (mm) | Length (cm) | Particle Density (kg/m3) | ||||
|---|---|---|---|---|---|---|---|---|
| RPS | RDW | RPS | RDW | RPS | RDW | RPS | RDW | |
| 50M + 0B | 0.518 ± 0.02 | 0.591 ± 0.04 | 6.6 ± 0.51 | 4.20 ± 0.42 | 2.06 ± 0.13 | 5.00 ± 0.00 | 938 ± 169 | 2127 ± 398 |
| 50M + 2B | 0.663 ± 0.05 | 0.571 ± 0.03 | 6.7 ± 0.48 | 4.60 ± 0.51 | 2.40 ± 0.13 | 2.45 ± 0.09 | 996 ± 177 | 1812 ± 402 |
| 50M + 4B | 0.631 ± 0.07 | 0.626 ± 0.04 | 6.00 ± 0.00 | 5.10 ± 0.31 | 2.62 ± 0.12 | 2.59 ± 0.13 | 1402 ± 73 | 1623 ± 247 |
| 50M + 6B | 0.643 ± 0.02 | 0.625 ± 0.04 | 6.00 ± 0.00 | 5.05 ± 0.51 | 2.31 ± 0.12 | 2.60 ± 0.13 | 1234 ± 44 | 2045 ± 440 |
| 55M + 0B | 0.620 ± 0.05 | 0.539 ± 0.04 | 7.00 ± 0.00 | 5.00 ± 0.00 | 2.4 ± 0.15 | 2.61 ± 0.19 | 825 ± 32 | 1316 ± 43 |
| 55M + 2B | 0.736 ± 0.03 | 0.539 ± 0.01 | 6.60 ± 0.51 | 5.01 ± 0.42 | 2.64 ± 0.15 | 2.68 ± 0.07 | 1037 ± 168 | 1431 ± 328 |
| 55M + 4B | 0.721 ± 0.06 | 0.519 ± 0.05 | 6.00 ± 0.00 | 5.00 ± 0.00 | 2.66 ± 0.14 | 2.71 ± 0.23 | 1198 ± 81 | 1221 ± 47 |
| 55M + 6B | 0.671 ± 0.07 | 0.504 ± 0.05 | 6.00 ± 0.00 | 5.00 ± 0.00 | 2.5 ± 0.6 | 2.59 ± 0.22 | 1186 ± 57 | 1241 ± 62 |
| 60M + 0B | 0.643 ± 0.03 | - | 6.40 ± 0.51 | - | 2.52 ± 0.13 | - | 1015 ± 186 | - |
| 60M + 2B | 0.634 ± 0.04 | 0.446 ± 0.04 | 6.80 ± 0.42 | 5.00 ± 0.42 | 2.46 ± 0.15 | 2.67 ± 0.24 | 896 ± 114 | 1176 ± 209 |
| 60M + 4B | 0.576 ± 0.07 | 0.420 ± 0.03 | 6.50 ± 0.52 | 5.00 ± 0.00 | 2.45 ± 0.25 | 2.58 ± 0.23 | 901 ± 151 | 1038 ± 30 |
| 60M + 6B | 0.591 ± 0.05 | 0.509 ± 0.04 | 6.80 ± 0.42 | 5.00 ± 0.00 | 2.48 ± 0.20 | 2.84 ± 0.31 | 830 ± 122 | 1145 ± 47 |
| Mixes | Mass (g) | Diameter (mm) | Length (cm) | Particle Density (kg/m3) | ||||
|---|---|---|---|---|---|---|---|---|
| RPS | RDW | RPS | RDW | RPS | RDW | RPS | RDW | |
| 50M + 0B | 0.398 ± 0.02 | 0.420 ± 0.02 | 6.00 ± 0.00 | 4.20 ± 0.42 | 2.15 ± 0.10 | 2.50 ± 0.14 | 822 ± 53 | 1555 ± 277 |
| 50M + 2B | 0.541 ± 0.04 | 0.412 ± 0.02 | 5.70 ± 0.48 | 4.00 ± 0.00 | 2.42 ± 0.18 | 2.39 ± 0.15 | 1116 ± 188 | 1719 ± 779 |
| 50M + 4B | 0.637 ± 0.02 | 0.479 ± 0.03 | 5.00 ± 0.00 | 4.40 ± 0.51 | 2.70 ± 0.04 | 2.67 ± 0.18 | 1404 ± 45 | 1532 ± 346 |
| 50M + 6B | 0.455 ± 0.02 | 0.446 ± 0.02 | 5.00 ± 0.00 | 4.00 ± 0.00 | 2.35 ± 0.15 | 2.57 ± 0.09 | 1236 ± 54 | 1731 ± 95 |
| 55M + 0B | 0.456 ± 0.06 | 0.389 ± 0.03 | 5.30 ± 0.48 | 4.10 ± 0.31 | 2.5 ± 0.30 | 2.41 ± 0.17 | 1054 ± 167 | 1551 ± 206 |
| 55M + 2B | 0.433 ± 0.02 | 0.365 ± 0.02 | 5.90 ± 0.31 | 4.00 ± 0.00 | 2.35 ± 0.15 | 2.43 ± 0.18 | 852 ± 123 | 1496 ± 45 |
| 55M + 4B | 0.479 ± 0.02 | 0.359 ± 0.02 | 5.70 ± 0.48 | 4.50 ± 0.42 | 2.35 ± 0.16 | 2.47 ± 0.15 | 1021 ± 185 | 1345 ± 221 |
| 55M + 6B | 0.554 ± 0.05 | 0.414 ± 0.02 | 6.00 ± 0.00 | 4.20 ± 0.42 | 2.58 ± 0.12 | 2.5 ± 0.14 | 951 ± 87 | 1532 ± 252 |
| 60M + 0B | 0.492 ± 0.03 | - | 5.90 ± 0.31 | - | 2.44 ± 0.18 | - | 936 ± 173 | - |
| 60M + 2B | 0.463 ± 0.03 | 0.351 ± 0.03 | 5.90 ± 0.31 | 4.10 ± 0.31 | 2.53 ± 0.11 | 2.45 ± 0.21 | 845 ± 117 | 1374 ± 154 |
| 60M + 4B | 0.517 ± 0.02 | 0.305 ± 0.01 | 6.00 ± 0.47 | 4.60 ± 0.51 | 2.45 ± 0.13 | 2.42 ± 0.12 | 950 ± 158 | 986 ± 236 |
| 60M + 6B | 0.446 ± 0.03 | 0.308 ± 0.01 | 5.90 ± 0.31 | 4.30 ± 0.48 | 2.55 ± 0.17 | 2.44 ± 0.14 | 811 ± 122 | 1121 ± 209 |
| Mixes | RPS | RDW | Torrefied RPS | Torrefied RDW |
|---|---|---|---|---|
| 50M + 0B | 1.12 ± 0.05 | 1.27 ± 0.05 | 0.30 ± 0.02 | 0.54 ± 0.05 |
| 50M + 2B | 1.16 ± 0.05 | 1.23 ± 0.03 | 0.83 ± 0.05 | 0.75 ± 0.03 |
| 50M + 4B | 1.19 ± 0.02 | 1.29 ± 0.01 | 1.09 ± 0.04 | 0.83 ± 0.01 |
| 50M + 6B | 1.53 ± 0.04 | 1.31 ± 0.02 | 1.21 ± 0.05 | 1.18 ± 0.02 |
| 55M + 0B | 1.00 ± 0.01 | 1.01 ± 0.01 | 0.46 ± 0.01 | 0.56 ± 0.01 |
| 55M + 2B | 1.04 ± 0.01 | 0.98 ± 0.01 | 0.89 ± 0.04 | 0.59 ± 0.01 |
| 55M + 4B | 1.88 ± 0.04 | 0.99 ± 0.04 | 1.21 ± 0.03 | 0.53 ± 0.04 |
| 55M + 6B | 2.63 ± 0.05 | 1.29 ± 0.04 | 1.90 ± 0.01 | 0.75 ± 0.04 |
| 60M + 0B | 0.76 ± 0.01 | - | 0.45 ± 0.05 | - |
| 60M + 2B | 0.93 ± 0.03 | 0.54 ± 0.01 | 0.46 ± 0.04 | 0.46 ± 0.01 |
| 60M + 4B | 1.03 ± 0.01 | 0.58 ± 0.01 | 0.62 ± 0.01 | 0.40 ± 0.01 |
| 60M + 6B | 1.07 ± 0.01 | 0.59 ± 0.01 | 0.67 ± 0.01 | 0.44 ± 0.01 |
| Mixes | RPS | RDW | Torrefied RPS | Torrefied RDW |
|---|---|---|---|---|
| 50M + 0B | 0.08 ± 0.03 | 0.01 ± 0.02 | 0.25 ± 0.20 | 0.29 ± 0.12 |
| 50M + 2B | 0.13 ± 0.08 | 0.03 ± 0.03 | 0.26 ± 0.16 | 0.27 ± 0.11 |
| 50M + 4B | 0.13 ± 0.17 | 0.04 ± 0.01 | 0.24 ± 0.01 | 0.25 ± 0.11 |
| 50M + 6B | 0.08 ± 0.07 | 0.02 ± 0.03 | 0.26 ± 0.02 | 0.17 ± 0.13 |
| 55M + 0B | 0.08 ± 0.07 | 0.01 ± 0.08 | 0.38 ± 0.33 | 0.28 ± 0.01 |
| 55M + 2B | 0.11 ± 0.18 | 0.04 ± 0.03 | 0.38 ± 0.01 | 0.19 ± 0.09 |
| 55M + 4B | 0.04 ± 0.03 | 0.02 ± 0.02 | 0.36 ± 0.35 | 0.21 ± 0.06 |
| 55M + 6B | 0.04 ± 0.05 | 0.03 ± 0.03 | 0.22 ± 0.19 | 0.20 ± 0.06 |
| 60M + 0B | 0.12 ± 0.03 | - | 0.24 ± 0.02 | - |
| 60M + 2B | 0.10 ± 0.08 | 0.06 ± 0.04 | 0.20 ± 0.04 | 0.32 ± 0.14 |
| 60M + 4B | 0.11 ± 2.80 | 0.07 ± 0.48 | 0.28 ± 0.01 | 0.37 ± 0.15 |
| 60M + 6B | 0.14 ± 0.03 | 0.04 ± 0.02 | 0.23 ± 0.07 | 0.27 ± 0.49 |
| Mixes | Mass Yield | Energy Yield | Energy Density Ratio | |||
|---|---|---|---|---|---|---|
| RPS | RDW | RPS | RDW | RPS | RDW | |
| 50M + 0B | 0.75 ± 0.01 | 0.75 ± 0.03 | 0.81 ± 0.04 | 0.75 ± 0.10 | 1.08 ± 0.04 | 1.00 ± 0.09 |
| 50M + 2B | 0.79 ± 0.01 | 0.72 ± 0.02 | 0.89 ± 0.08 | 0.76 ± 0.08 | 1.13 ± 0.09 | 1.01 ± 0.08 |
| 50M + 4B | 0.71 ± 0.01 | 0.71 ± 0.02 | 0.81 ± 0.04 | 0.73 ± 0.04 | 1.14 ± 0.06 | 1.03 ± 0.08 |
| 50M + 6B | 0.67 ± 0.00 | 0.73 ± 0.03 | 0.78 ± 0.07 | 0.75 ± 0.09 | 1.16 ± 0.11 | 1.02 ± 0.09 |
| 55M + 0B | 0.78 ± 0.01 | 0.68 ± 0.05 | 0.85 ± 0.04 | 0.61 ± 0.04 | 1.09 ± 0.06 | 0.89 ± 0.01 |
| 55M + 2B | 0.69 ± 0.01 | 0.68 ± 0.01 | 0.79 ± 0.06 | 0.64 ± 0.01 | 1.14 ± 0.01 | 0.94 ± 0.03 |
| 55M + 4B | 0.71 ± 0.03 | 0.68 ± 0.02 | 0.80 ± 0.03 | 0.64 ± 0.04 | 1.14 ± 0.04 | 0.94 ± 0.03 |
| 55M + 6B | 0.71 ± 0.03 | 0.67 ± 0.02 | 0.81 ± 0.10 | 0.65 ± 0.00 | 1.13 ± 0.00 | 0.96 ± 0.02 |
| 60M + 0B | 0.71 ± 0.07 | - | 0.83 ± 0.10 | - | 1.15 ± 0.04 | - |
| 60M + 2B | 0.77 ± 0.02 | 0.70 ± 0.05 | 0.87 ± 0.03 | 0.69 ± 0.03 | 1.12 ± 0.07 | 0.98 ± 0.02 |
| 60M + 4B | 0.66 ± 0.01 | 0.73 ± 0.01 | 0.75 ± 0.01 | 0.69 ± 0.01 | 1.14 ± 0.03 | 1.00 ± 0.00 |
| 60M + 6B | 0.70 ± 0.03 | 0.71 ± 0.01 | 0.81 ± 0.11 | 0.72 ± 0.05 | 1.15 ± 0.11 | 1.01 ± 0.05 |
Disclaimer/Publisher’s Note: The statements, opinions and data contained in all publications are solely those of the individual author(s) and contributor(s) and not of MDPI and/or the editor(s). MDPI and/or the editor(s) disclaim responsibility for any injury to people or property resulting from any ideas, methods, instructions or products referred to in the content. |
© 2023 by the authors. Licensee MDPI, Basel, Switzerland. This article is an open access article distributed under the terms and conditions of the Creative Commons Attribution (CC BY) license (https://creativecommons.org/licenses/by/4.0/).
Share and Cite
Önür, M.E.; Ekinci, K.; Civan, M.; Bilgili, M.E.; Yurdakul, S. Quality Properties and Torrefaction Characteristics of Pellets: Rose Oil Distillation Solid Waste and Red Pine Sawdust. Sustainability 2023, 15, 10971. https://doi.org/10.3390/su151410971
Önür ME, Ekinci K, Civan M, Bilgili ME, Yurdakul S. Quality Properties and Torrefaction Characteristics of Pellets: Rose Oil Distillation Solid Waste and Red Pine Sawdust. Sustainability. 2023; 15(14):10971. https://doi.org/10.3390/su151410971
Chicago/Turabian StyleÖnür, Muhammet Enes, Kamil Ekinci, Mihriban Civan, Mehmet Emin Bilgili, and Sema Yurdakul. 2023. "Quality Properties and Torrefaction Characteristics of Pellets: Rose Oil Distillation Solid Waste and Red Pine Sawdust" Sustainability 15, no. 14: 10971. https://doi.org/10.3390/su151410971
APA StyleÖnür, M. E., Ekinci, K., Civan, M., Bilgili, M. E., & Yurdakul, S. (2023). Quality Properties and Torrefaction Characteristics of Pellets: Rose Oil Distillation Solid Waste and Red Pine Sawdust. Sustainability, 15(14), 10971. https://doi.org/10.3390/su151410971