Article

The Impact of the Green Economy on Carbon Emission Intensity: Comparisons, Challenges, and Mitigating Strategies

1
College of Mathematics and Physics, Chengdu University of Technology, Chengdu 610059, China
2
College of Management Science, Chengdu University of Technology, Chengdu 610059, China
*
Author to whom correspondence should be addressed.
Sustainability 2023, 15(14), 10965; https://doi.org/10.3390/su151410965
Submission received: 13 June 2023 / Revised: 4 July 2023 / Accepted: 10 July 2023 / Published: 13 July 2023

Abstract

:
Global warming, driven primarily by the substantial discharge of greenhouse gases such as carbon dioxide, presents a progressively intensifying concern. To curtail these emissions, the international community is persistently exerting efforts. Traditional economic paradigms have contributed to resource exhaustion and severe pollution, as well as other issues. The green economy, characterized by “eco-friendly”, “low carbon”, and “intensive development” principles, proposes strategies to counter global warming. The current study considers 30 Chinese provinces and cities, assessing coal, coke, and diesel consumption data from 2004 to 2020. Using the carbon emission factor method to quantify carbon emissions, spatial autocorrelation of emissions across various regions is evaluated by employing Moran’s I. The Geographically and Temporally Weighted Regression (GTWR) of carbon emissions and green economy is formulated to scrutinize the contributing factors to carbon emissions, focusing on spatial–temporal evolution and spatial heterogeneity. According to the analysis results, the corresponding suggestions are put forward. This also facilitates analysis of the green economy’s impact on China’s carbon peak and carbon neutrality targets. The findings suggest the following: (1) Over the study period, China’s aggregate carbon emissions exhibited an upward trend, although the growth rate notably decelerated after 2011, and significant spatial clustering of carbon emissions was discerned across the regions. (2) Overall, both economic and social development markedly augmented carbon emission intensity. (3) Spatially, the green economy’s effect on carbon emissions demonstrated significant spatial differentiation. By constructing a GTWR model of the green economy–carbon emission relationship, this study provides a trajectory for regional green sustainability and offers empirical guidance for developing countries grappling with global warming.

1. Introduction

Global warming, with its negative impact on human existence, is one of the paramount environmental quandaries confronting our world today [1]. China, owing to its vast populace and substantial energy consumption, has ascended to the undesirable position of the world’s largest carbon emitter [2]. This predicament stems largely from the country’s extensive and expansive economic growth paradigm. In pursuit of a harmonious interplay between economy, environment, humanity, and nature, the United Nations Environment Programme, in 2011, formulated a novel economic framework—the green economy. This model strives to bolster human welfare and social equity while considerably mitigating environmental risks and ecological scarcities, essentially constituting a sustainable economy predicated on ecological and economic synergistic progression [3]. Exploring the mechanistic impact of green economic growth on energy-related carbon emission intensity offers potential pathways towards accomplishing China’s aspirational targets of carbon peaking and neutrality. Furthermore, it provides insightful references for developing nations grappling with the global warming crisis.
Anthropogenic carbon dioxide emissions, primarily attributed to the combustion of fossil fuels, constitute the largest source of greenhouse gases. In 2020, such emissions related to energy production represented approximately 87% of total global carbon dioxide output. Not only does this excessive production of carbon dioxide exacerbate climate change, but it also impedes the progression towards sustainable economic development [4]. Presently, nations worldwide are endeavoring to align their economic growth with sustainability objectives [5]. Consequently, establishing a green economy that minimizes carbon dioxide emissions has emerged as a focal point in academic discourse [6].
Under prevailing technological capabilities, energy requirements, and the stage of economic development, China is confronted with formidable challenges in reducing future carbon emissions. In response to these challenges, this study employs the carbon emission coefficient method to quantify the carbon emissions from 30 Chinese provinces and cities and utilizes Moran’s I to assess spatial autocorrelation across these regions. We establish a green economy indicator system and construct a Geographically and Temporally Weighted Regression (GTWR) to investigate the spatiotemporal trends and spatial heterogeneity of the impact of green economy development on carbon emissions. Our analysis further evaluates the role of green economy development in facilitating China’s carbon neutrality ambitions. We advocate for China to adopt differentiated regional management of carbon emissions and devise carbon reduction strategies that are attuned to its unique circumstances. Particular attention should be paid to monitoring high-emission provinces and regions. Increased investment in scientific research and technological innovation is encouraged, with the goal of optimizing the industrial structure. Additionally, China ought to augment its commitment to green economy development, establishing a comprehensive legal framework that ensures the systematic and sustainable progression of this green economy. The remainder of this article is structured as follows: The first section delineates the research background and its significance; the second section reviews the extant literature on carbon emissions and the green economy, highlighting the unique contributions of the current study; the third section introduces the data and methods utilized in this study and elaborates on the construction of a green economy indicator system, using the 30 provinces and cities in China as the focal points of analysis; the fourth section employs the carbon emission coefficient method to calculate carbon emissions of the target provinces and cities, employing Moran’s I to measure spatial autocorrelation of carbon emissions. We construct a GTWR model to examine the temporal trends and spatial heterogeneity of green economy impacts on carbon emissions, analyzing the role of green economy development in achieving China’s carbon peaking and neutrality goals. The fifth and sixth sections present this study’s discussion and conclusions, respectively.

2. Literature Review

Determining the intensity of carbon dioxide emissions presents a substantial challenge. Currently, three principal methods are utilized for quantifying carbon emissions: the carbon emission factor method, the measured method, and the material balance method [7]. The carbon emission factor method estimates carbon emissions based on the consumption of various energy sources and their respective carbon emission coefficients. This method is widely recognized for its simplicity and ease of data acquisition [8]. Given the variations in energy consumption and energy quality across different countries, differing carbon emission coefficient standards have been published by various institutions for distinct energy types. Among these, the standards published by the IPCC are the most universally adopted [9].
Existing research primarily attributes carbon emissions to salient factors such as economic growth, energy intensity, population size, and the level of urbanization. Sharma [10] identified per capita GDP and urbanization as pivotal determinants of global carbon emissions. Murshed [11] posited that trade in Information and Communication Technology (ICT) reduces energy intensity, enhances energy efficiency, and thereby curtails carbon dioxide emissions. Yeh and Liao [12] argued that population expansion has escalated energy consumption in production and daily life, exerting immense pressure on the ecological environment. According to Shao [13], a balanced level of urbanization can ameliorate environmental conditions and bolster energy efficiency. Unraveling the influencers of carbon emissions is critical to addressing this concern. At present, four key research models are utilized to analyze carbon emission influencers. The first is the Logarithmic Mean Division Index (LMDI) decomposition model, lauded for its distinct analysis pathway, lack of residual, and excellent zero-value processing capacity; hence, it is extensively employed in carbon emission driver decomposition research across multiple fields [14]. The second model is the STIRPAT model, appreciated for its scalability and stochasticity, which has found broad application in energy carbon emission prediction and assessment research [15]. The third method is the Grey Relational Analysis (GRA), a tool used within grey system theory to measure the similarity or heterogeneity among various factors [16]. The fourth model, Vector Autoregression (VAR), treats all variables as endogenous and conducts regression analysis on the lag value of these endogenous variables [17,18].
The economic growth process inevitably coincides with carbon emission release, and the interrelationship between these two phenomena has consistently been a focal point for scholarly research [19]. Wang et al. [20] demonstrated that the level of economic development has a significantly positive impact on carbon emissions. Studies exploring the link between economic growth and carbon emissions primarily employ two methodologies: firstly, the analysis of the decoupling relationship between carbon emissions and eco-nomic growth [21], and secondly, the testing of the environmental Kuznets curve of carbon emissions [22,23]. The environmental Kuznets curve model, often utilized to explain the relationship between economic growth and carbon emissions, suggests an inverted U shape. This model indicates that the environment undergoes severe degradation during the initial stages of economic development. However, once a certain economic development threshold is surpassed, carbon emissions reach a growth inflection point and begin to decline. This indicates that despite initial environmental degradation, the long-term prospects involve improved environmental conditions, ultimately leading to the achievement of carbon reduction targets [24].
The concept of the green economy was first introduced in the Green Economy Blue-book in 1989 [25], endorsing the establishment of a ‘sustainable economy’ with regards to societal perspectives and conditions. The United Nations Conference on Sustainable Development in 2012 expanded this concept, advocating for inclusive growth and trans-forming the notion of a green economy from output-driven to a low-carbon, environmentally friendly, and equitable economic model [26]. Munitlak et al. [27] suggest that this concept of inclusive green development represents an approach that harmonizes eco-nomic development with environmental protection. Yu et al. [28] pointed out and emphasized that the low-carbon transformation of economic development is conducive to achieving coordinated development between economic development and carbon emissions. Jiang [29] proposed that energy efficiency and structural changes have played a role in reducing per capita carbon emissions. Gan, Kai, Wang and Voda [30] believe that the decoupling between carbon emissions and the economic development of the tertiary sector of the economy is conducive to promoting sustainable development. With the gradual attention paid to the development mode of green economy, various authoritative institutions and professional scholars are actively exploring the construction of a green economy evaluation system to quantify the green economy. Currently, the construction of such a system is centered around four key factors: (1) Economic development: recognizing that a green economy is fundamentally rooted in economic growth, which serves as the primary impetus and foundation for ecological transition [31]. (2) Social development: this represents the capacity to fulfill human life needs and embodies the green economy’s pursuit of sustainable growth [32]. (3) Ecological environment: The green economy exemplifies a socioeconomic model that acknowledges the symbiotic relationship between the socioeconomic system and the ecological environment. Thus, ecological improvement constitutes a crucial aspect of the green economy [33]. (4) Government policies: Policy direction is an essential guide for the specific progression of green economic development. The extent of regional investment in the ecological environment serves as a valuable indicator of green economy development [34].
At present, the resilience and sustainability of global economic development have significantly increased. New energy industries characterized by intelligence and greenery are gradually replacing old energy industries characterized by resource factor consumption and becoming new engines supporting future economic growth. Can the green economy development approach significantly reduce carbon emissions?
As indicated by the research overview, scholars have striven to examine the determinants of carbon emissions from assorted viewpoints, albeit with three notable limitations. Firstly, much of the existing research restricts its analysis of carbon emission influencers to the traditional economy, including GDP and per capita income levels, while studies exploring the influence of the green economy on carbon emission intensity remain sparse. Secondly, many scholars, while constructing green economy indicators, have not incorporated the dimension of government policy, a factor that plays an irreplaceable role in fostering green economy development. Lastly, given China’s vast territorial expanse, the impacts of driving factors on energy carbon emissions present remarkable regional disparities. Nevertheless, a majority of the literature engages in discourse on the relationship between the economy and carbon emissions through decoupling relationship analysis and the Kuznets curve, which lacks sufficient consideration for the heterogeneity of economic impacts on energy carbon emissions. To address these shortcomings, this article establishes a green economy indicator system from four dimensions: economic development, social development, ecological environment, and government policies. It then proposes a theoretical framework for the influence of green economy development on energy carbon emissions, constructs a spatiotemporal and the GTWR model to analyze the temporal trends and spatial heterogeneity of the impact of the green economy on carbon emissions, and underscores the pivotal role of green economy development in achieving China’s carbon neutrality goal.

3. Study Area and Methodology

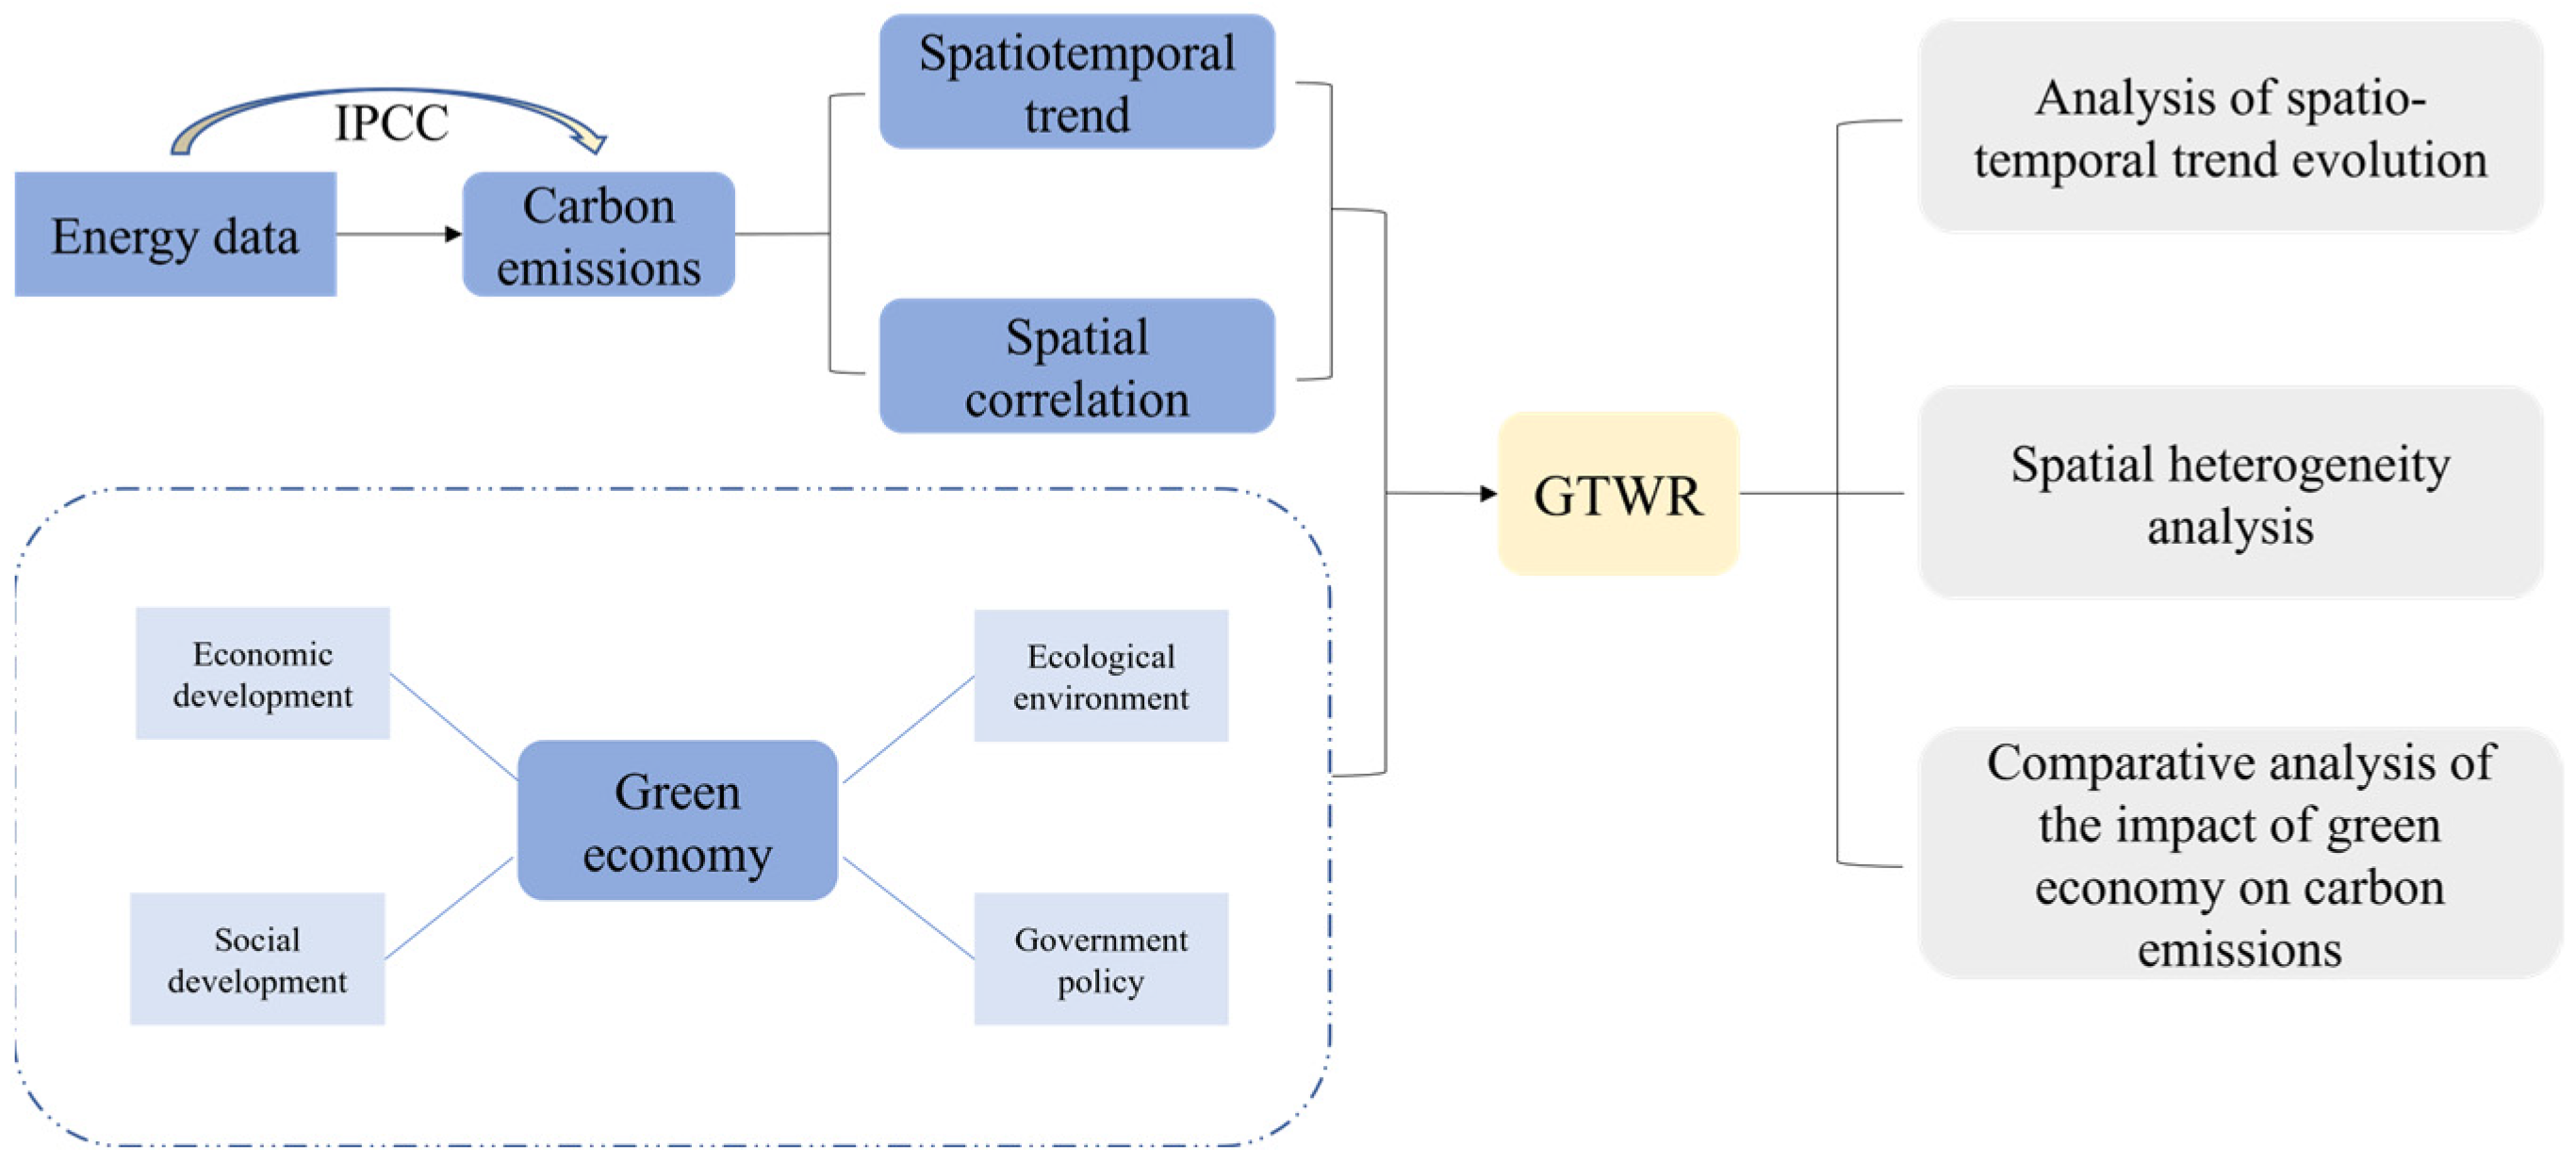
This study adopts a time-series approach spanning from 2004 to 2020. It is founded on data gathered from 30 provinces and cities in China. It creates a green economy index system predicated on the research framework of economic development, social development, ecological environment, and government policies. The Geographically and Temporally Weighted Regression is utilized to examine the effects of the green economy on carbon emissions from both temporal and spatial perspectives. The specific research framework is shown in Figure 1. The research process includes five steps:
Step 1: construction of the green economic development index system and the theoretical framework from four dimensions: economic development, social development, ecological environment, and government policy;
Step 2: collection of pertinent data concerning green economic indicators and primary energy consumption across 30 provinces and cities in China, ranging from 2004 to 2020;
Step 3: computation of the carbon emissions for each region during the study period based on the IPCC factor, alongside the employment of Moran’s I to measure the spatial autocorrelation of carbon emissions in each region, laying the theoretical groundwork for model selection in the analysis of influential factors;
Step 4: development of the Geographically and Temporally Weighted Regression model to analyze the spatiotemporal dynamic characteristics of the green economy’s impact on carbon emissions, subsequently elucidating the varied effects of distinct driving factors on carbon emissions in different regions via spatial heterogeneity;
Step 5: Comparative analysis of alterations in the impact of various dimension indicators on carbon emissions pre and post the United Nations Environment Programme’s definition of the green economy, alongside a discussion of whether the advancement of the green economy is conducive to the realization of China’s carbon peak and carbon-neutral development objectives. According to the analysis results, the corresponding suggestions are put forward.

3.1. Study Area

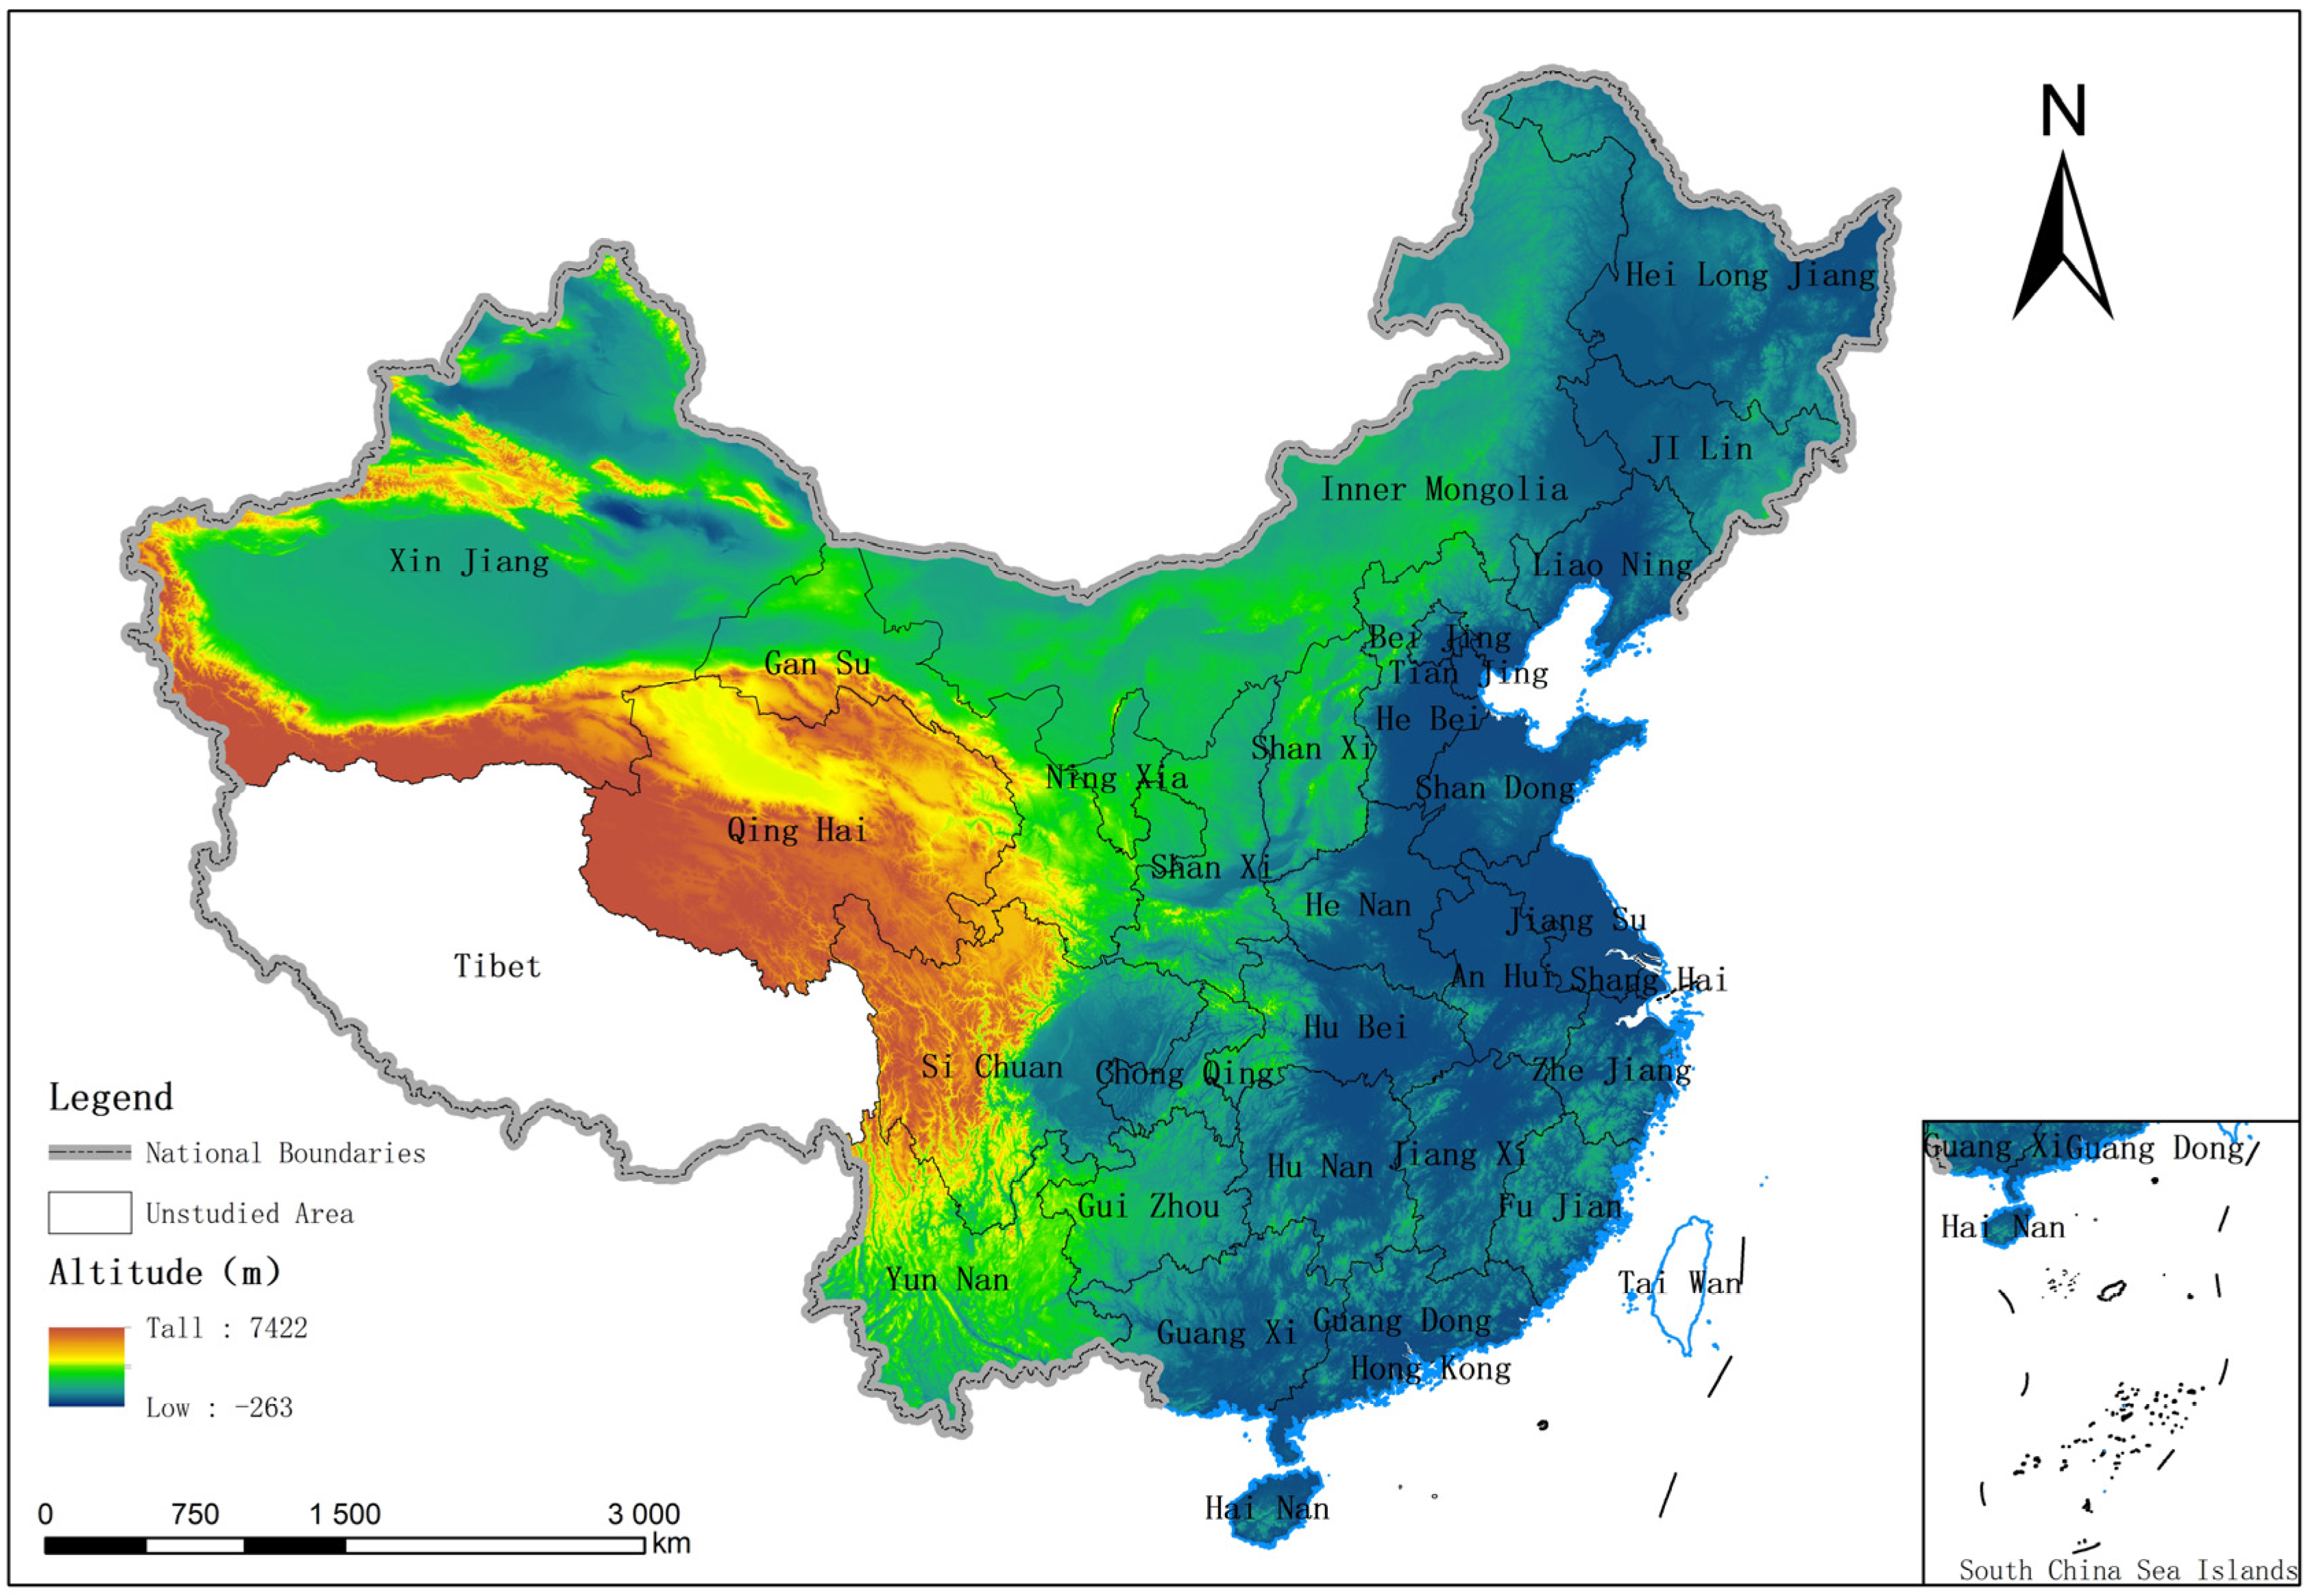
China has 34 primary administrative regions, excluding the Tibet Autonomous Region, Hong Kong, Taiwan, and Macao due to data constraints. Consequently, this study selects 30 provinces and cities, including Beijing, Tianjin, Hebei, Hubei, Hunan, Jilin, and Guangdong, as the research objects. The specific research area is shown in Figure 2.

3.2. Data Source

Consistent with principles of data comprehensiveness, accessibility, and reliability, and considering the concrete circumstances of the various provinces and cities in China, relevant data from 2004 to 2020 is collected in a time series format. Recognizing that the emissions of carbon dioxide from energy consumption activities predominantly arise from the combustion of fossil fuels, this study selects data on primary energy consumption in China’s provinces, including coal, coke, diesel, and natural gas consumption, for carbon emission calculations. A literature review and comparative analysis reveal that while scholars choose different dimensions, all reflect the coordination and integration of economic, social, and ecological environments. The balanced progression of the economy, society, and ecological environment relies on the backing and guidance of government policies, particularly in the domain of green development, where the government’s role is irreplaceable. Hence, this study establishes a green economy system from four dimensions: economic development, social development, ecological environment, and government policies. The data are obtained from the ‘China Statistical Yearbook’ and provincial statistical yearbooks ranging from 2005 to 2021. Missing values in individual indicators are addressed using mean and regression imputation methods. The specific indicators for each reference are detailed in Table 1:

3.3. Methodology

This study applies the emission factor method to quantify the energy carbon emissions of 30 provinces and cities in China and analyzes the temporal trend and spatial autocorrelation of each region. By employing the Geographically and Temporally Weighted Regression, this study dissects the impact of the green economy on carbon emissions from two facets—spatiotemporal trend and spatial heterogeneity, comparing whether the green economy aids in accomplishing China’s development objectives of reaching peak carbon and achieving carbon neutrality. The process of method application is depicted in Figure 3.

3.3.1. Calculation Method of Total Carbon Emissions

The carbon emission factor methodology, colloquially known as the emission coefficient method, stands as the most widely utilized means of measuring carbon emissions. The reference method, outlined in the IPCC Guidelines for National Greenhouse Gas Inventories, permits direct estimation of carbon emissions via the multiplication of energy consumption and carbon emission factors within the study area [45]. The specific formula is delineated below:
C i t = i = 1 n E n i t ε i
In Equation (1), C represents the carbon emissions (in 10,000 tons); ε represents the carbon emission coefficient; E n represents the main energy consumption in each region, calculated in 10,000 tons of standard coal; i represents the type of energy; and t represents time.

3.3.2. Moran’s I

Moran’s I constitutes a correlation coefficient used for investigating spatial relationships. It bifurcates into global Moran’s I and local Moran’s I. The global Moran’s I delivers an integrative measure of spatial autocorrelation within the study area [46]. While it offers insight into the aggregation degree of spatially similar attributes, it fails to precisely define the spatial location of the aggregation area. The local Moran’s I serves to rectify this shortcoming, with its calculation formula presented below:
I = ( X i X ¯ ) s 2 j = 1 n W i j ( X j X ¯ )
I i = n ( X i X ¯ ) j = 1 n W i j ( X j X ¯ ) i ( X i X ¯ ) 2 = Z i i W i j Z j
In Equation (3), X i and X j denote the attribute values of the space elements i ; j represents the spatial weight coefficient matrix; W i j represents the proximity of each spatial unit; and Z i and Z j represent the observation values standardized by standard deviation.
When I i > 0, the regional spatial unit exhibits strong positive spatial autocorrelation and local spatial aggregation with adjacent space. Conversely, when I i < 0, the regional spatial unit manifests strong negative spatial autocorrelation with adjacent space, indicative of local spatial dispersion.

3.3.3. Geographically and Temporally Weighted Regression

GTWR is a proficient spatial analysis technique that identifies spatio-temporal non-stationary attributes. It employs the spatio-temporal weight matrix to evaluate the space and time impacts on phenomena, subsequently calculating the regression coefficients for each explanatory variable. The GTWR model considers the non-stationarity of time, providing a reflection of the evolving relationships between variables in space–time scenarios, thereby rendering the regression results more congruous with reality [47]. Given the heterogeneity of explanatory variables across spatial locations, the GTWR can be formulated as follows:
y i = β 0 ( u i , v i , t i ) + k = 1 p β k ( u i , v i , t i ) x i k + ε i
In Equation (4), ( y i , x i 1 , x i 2 , x i d ) represent the n sets of observations of the dependent variable y and the independent variables ( x 1 , x 2 , x p ) at the observation point ( u i , v i , t i ) . ( k = 1 , 2 , 3 , p ) represents the unknown parameter at the i th observation point ( u i , v i , t i ) , and ε i ( i = 1 , 2 , 3 , , n ) represents an independently and identically distributed error term, which is generally assumed to be subject to an N ( 0 , δ 2 ) distribution.

4. Results

4.1. Calculation Results of Energy Carbon Emissions

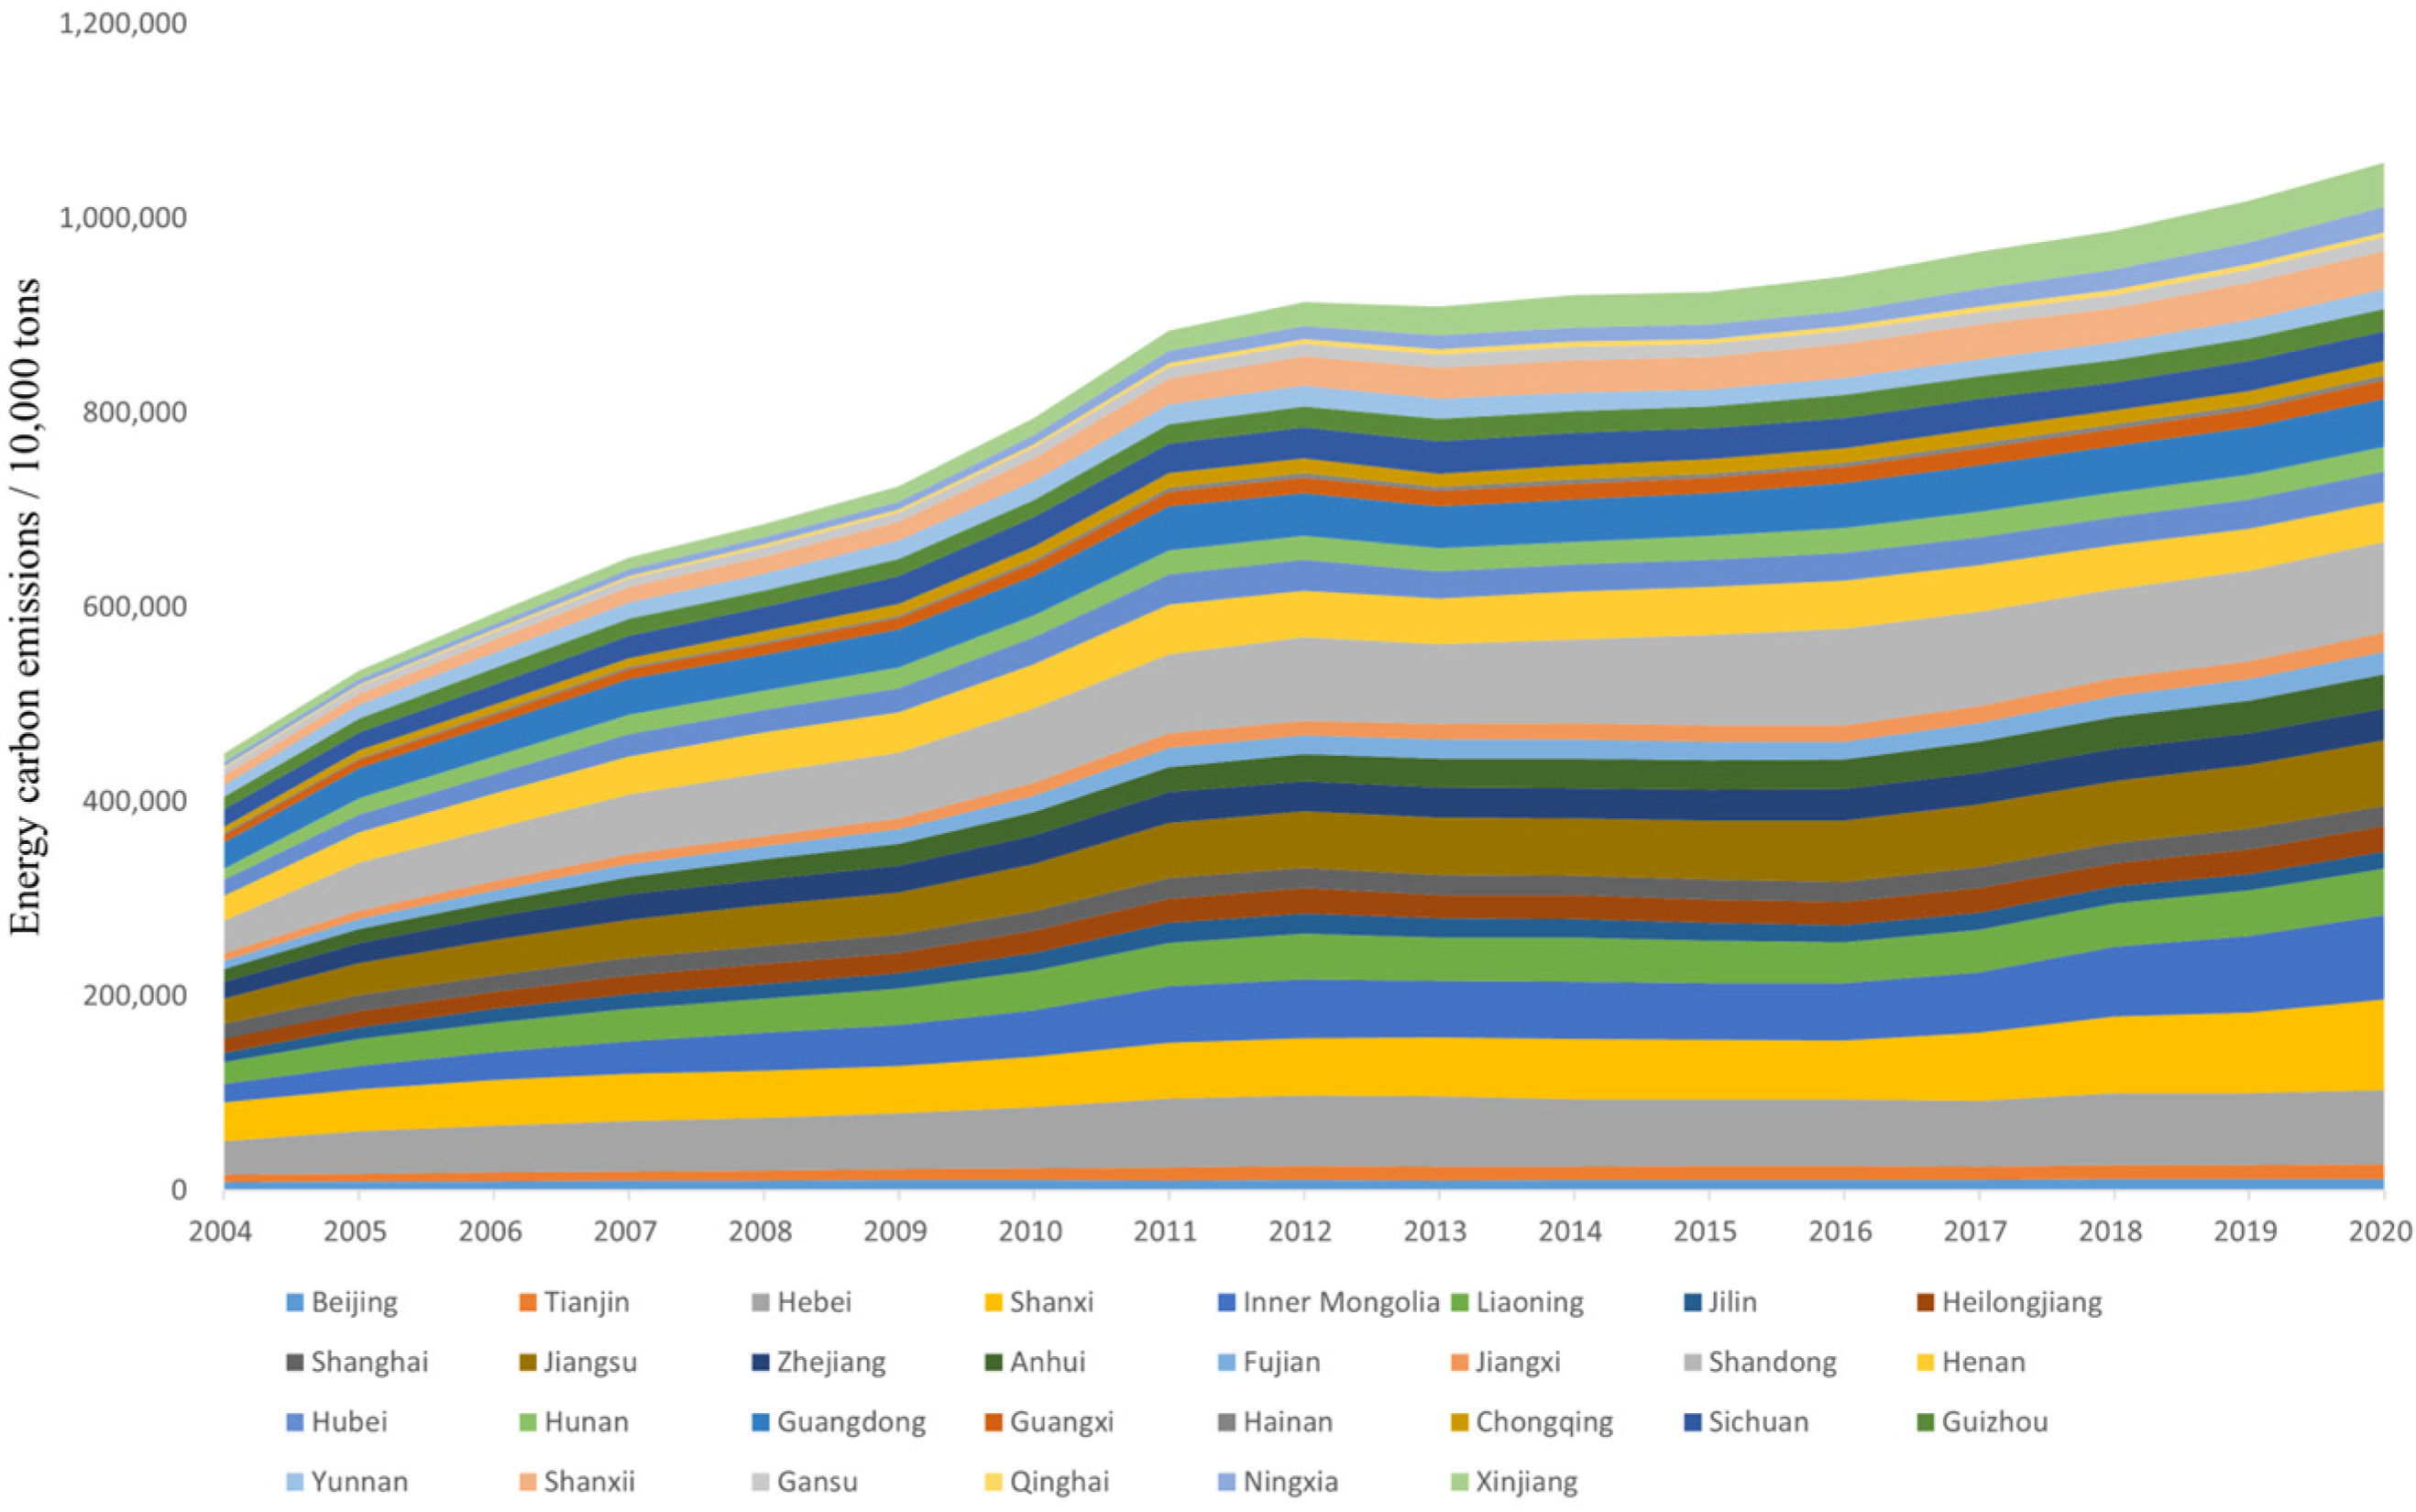
This article employs the primary energy consumption data from various regions in China and employs the carbon emission factor method to calculate the carbon emissions from 2004 to 2020 for thirty provinces and cities in China from a temporal perspective. As depicted in Figure 4, the overall fluctuation is relatively obvious, revealing substantial differences in carbon emission intensity across the regions.
Figure 4 indicates the following: ① From 2004 to 2020, the carbon emissions of China’s 30 provinces and cities augmented progressively. Total carbon emissions ascended from 449,470.14 million tons in 2004 to 1,057,492.36 million tons in 2020, presenting an annual growth rate of 5.1%. ② With respect to the spatio-temporal evolutionary characteristics, and using the ‘green economy’ as a pivot, energy carbon emissions manifested a swift upward trajectory from 2004 to 2011, boasting a growth rate of 96.87%. However, the growth rate decelerated to 6.23% during 2011–2016, before slightly recovering to 12.46% during 2016–2020. ③ The carbon emissions from Northwesternnorthwestern regions, such as the Ningxia Hui Autonomous Region, Qinghai Province, and Xinjiang Uygur Autonomous Region, exhibited a relatively subdued growth. In contrast, Northnorth China and Centralcentral China provinces such as Shandong, Shanxi, Hebei, Henan, and Inner Mongolia Autonomous Region displayed elevated carbon emissions. Notably, the growth rate began to decline after 2011, with certain areas, including Henan Province and Shandong Province, witnessing a decrease in carbon emissions.
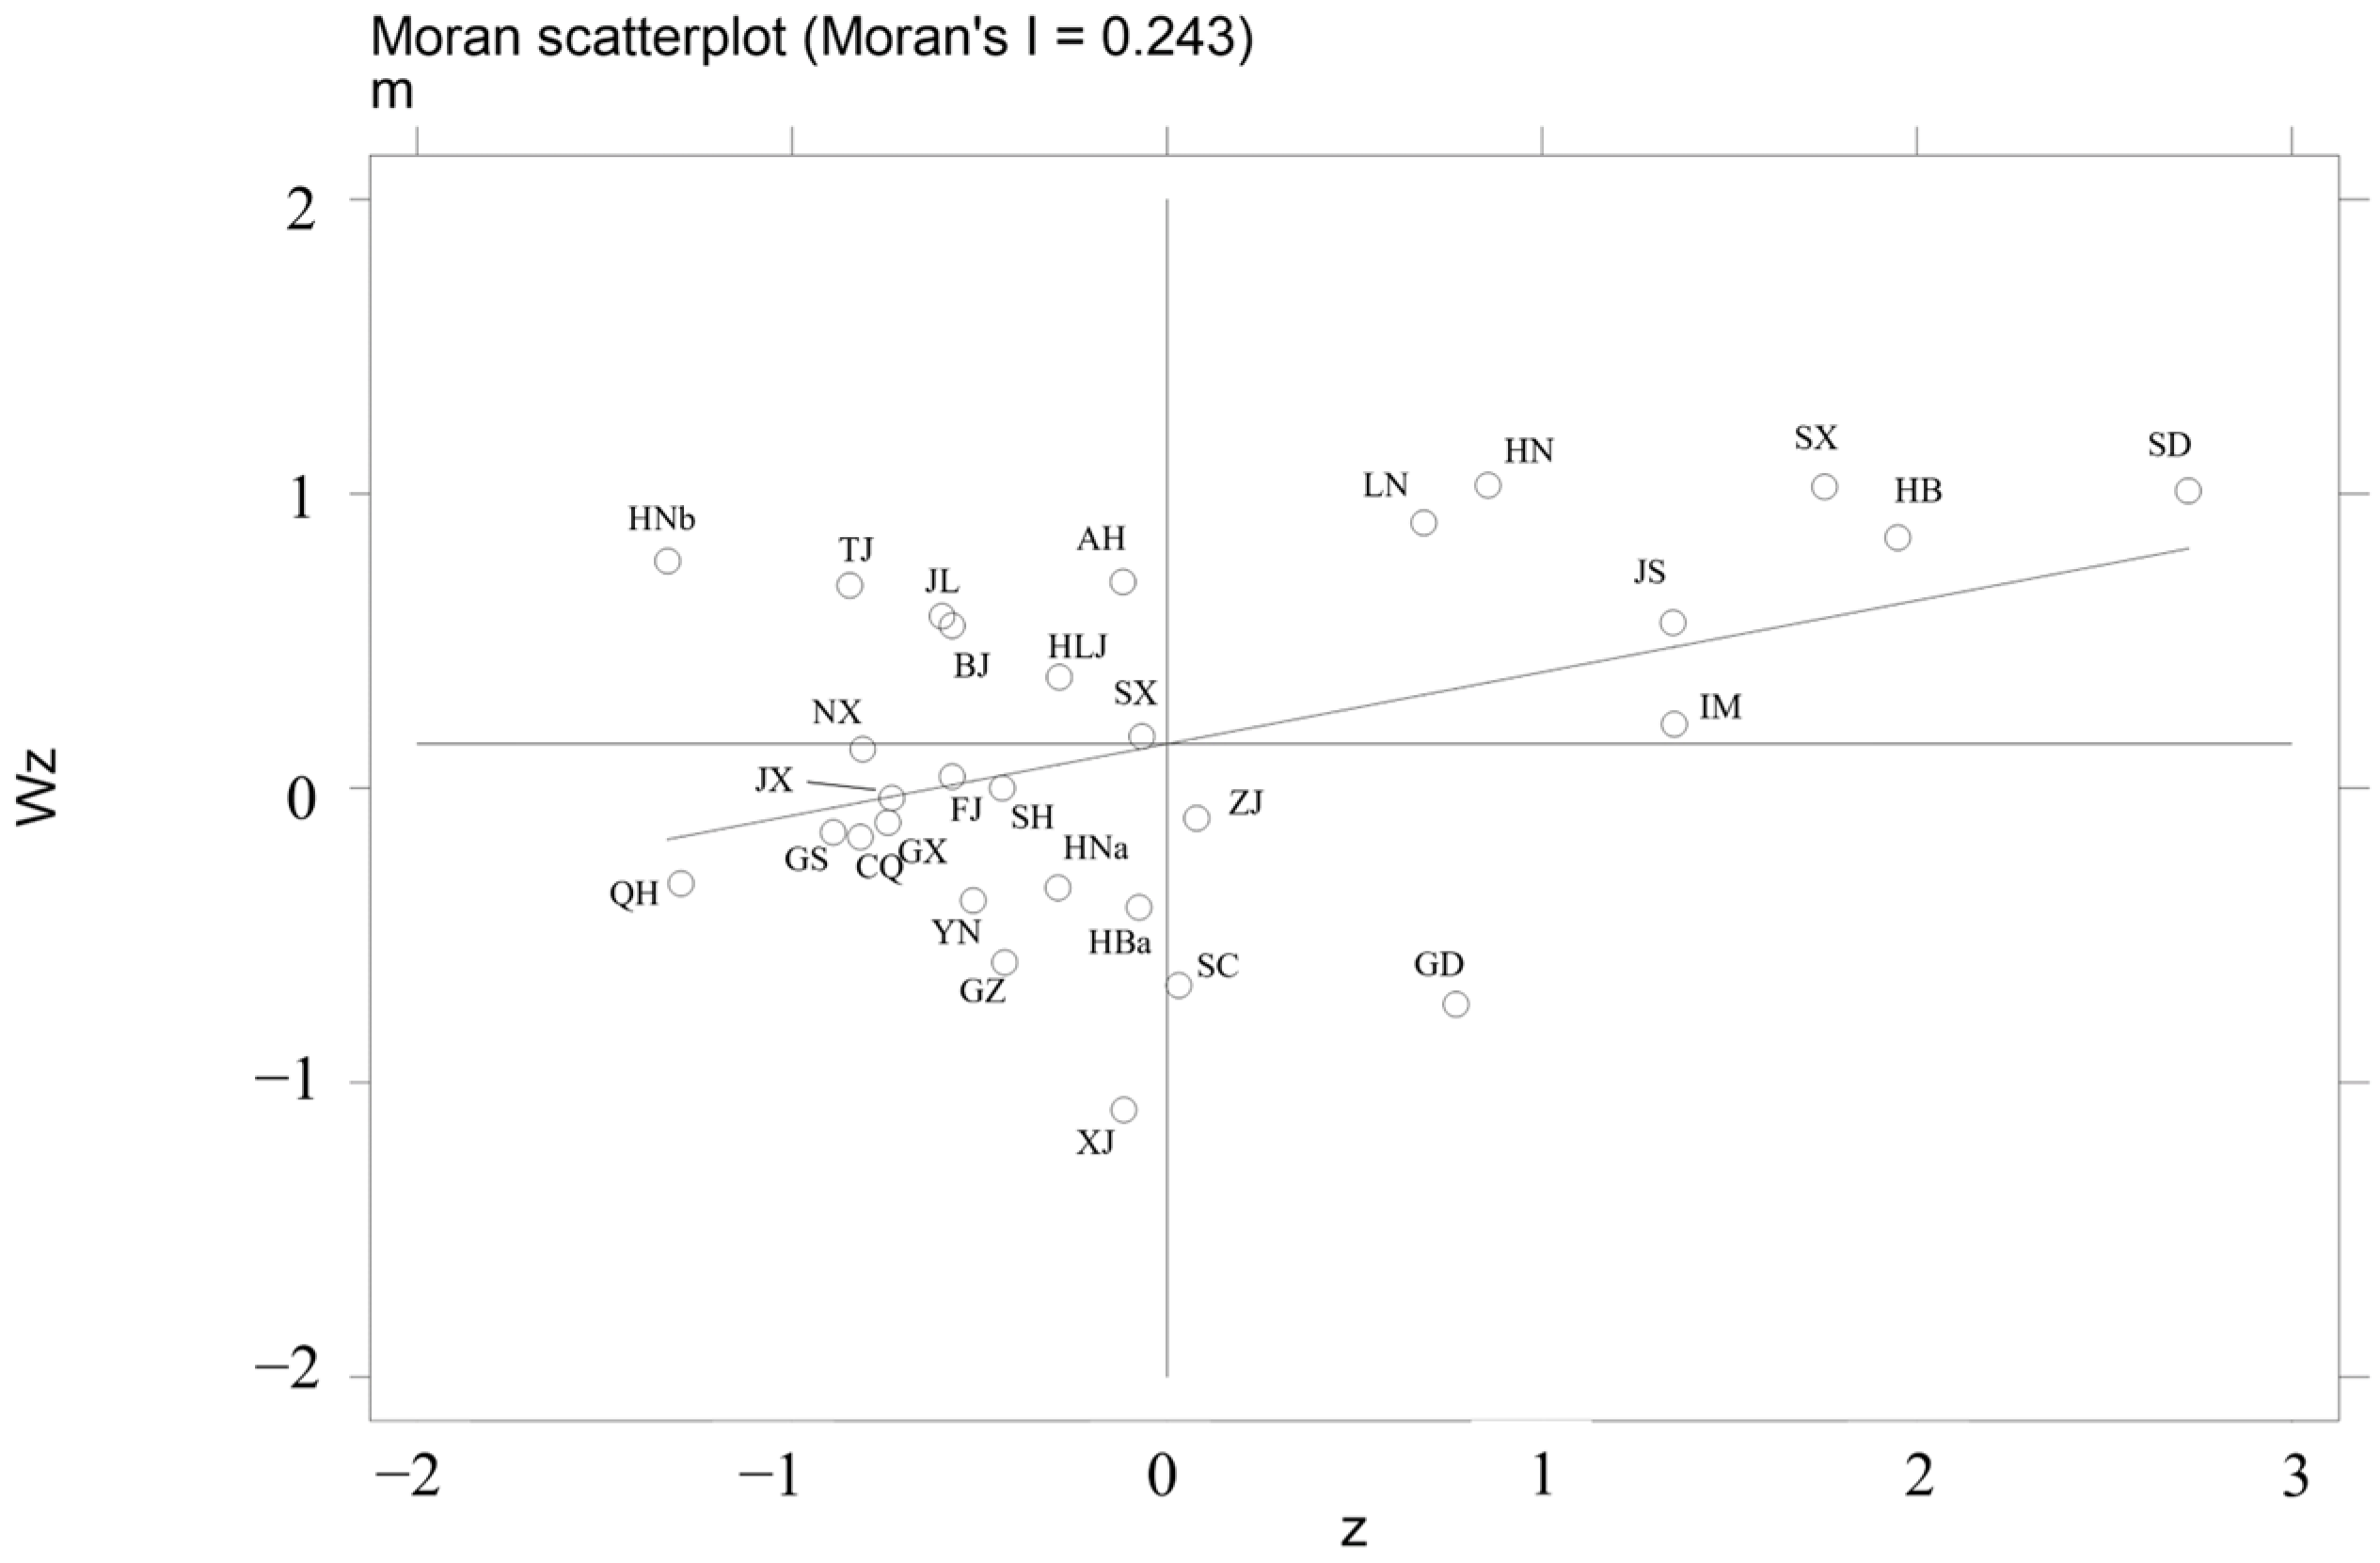
In order to further analyze the spatial autocorrelation of carbon emissions in various provinces and cities, this paper calculates the Moran’s I through Stata, and the results are shown in Figure 5.
① The Global Moran’s I encapsulates the comprehensive alterations in China’s energy carbon emission distribution over time. Calculated at 0.243, the Global Moran’s I of the average carbon emissions in each region for the years 2001 through 2020 manifests significant spatial aggregation. With positive values at the 1% significance level, it is implied that carbon emissions exhibit a generally positive spatial autocorrelation. ② Analyzing provinces at a regional level, such as Henan (HN), Shandong (SD), Jiangsu (JS), Hebei (HB), and Shanxi (SX), which are situated in Northnorth and Centralcentral China, demonstrates high-high value agglomerations, thus exhibiting pronounced diffusion impacts. These provinces not only have elevated carbon emissions but also impact neighboring provinces by amplifying their carbon emissions. Conversely, provinces such as Yunnan (YN), Qinghai (QH), Guizhou (GZ), and Sichuan (SC), which are identified as low-low value clusters, present low-carbon emissions and are enveloped by provinces with similar low emission rates.

4.2. Analysis of Influencing Factors

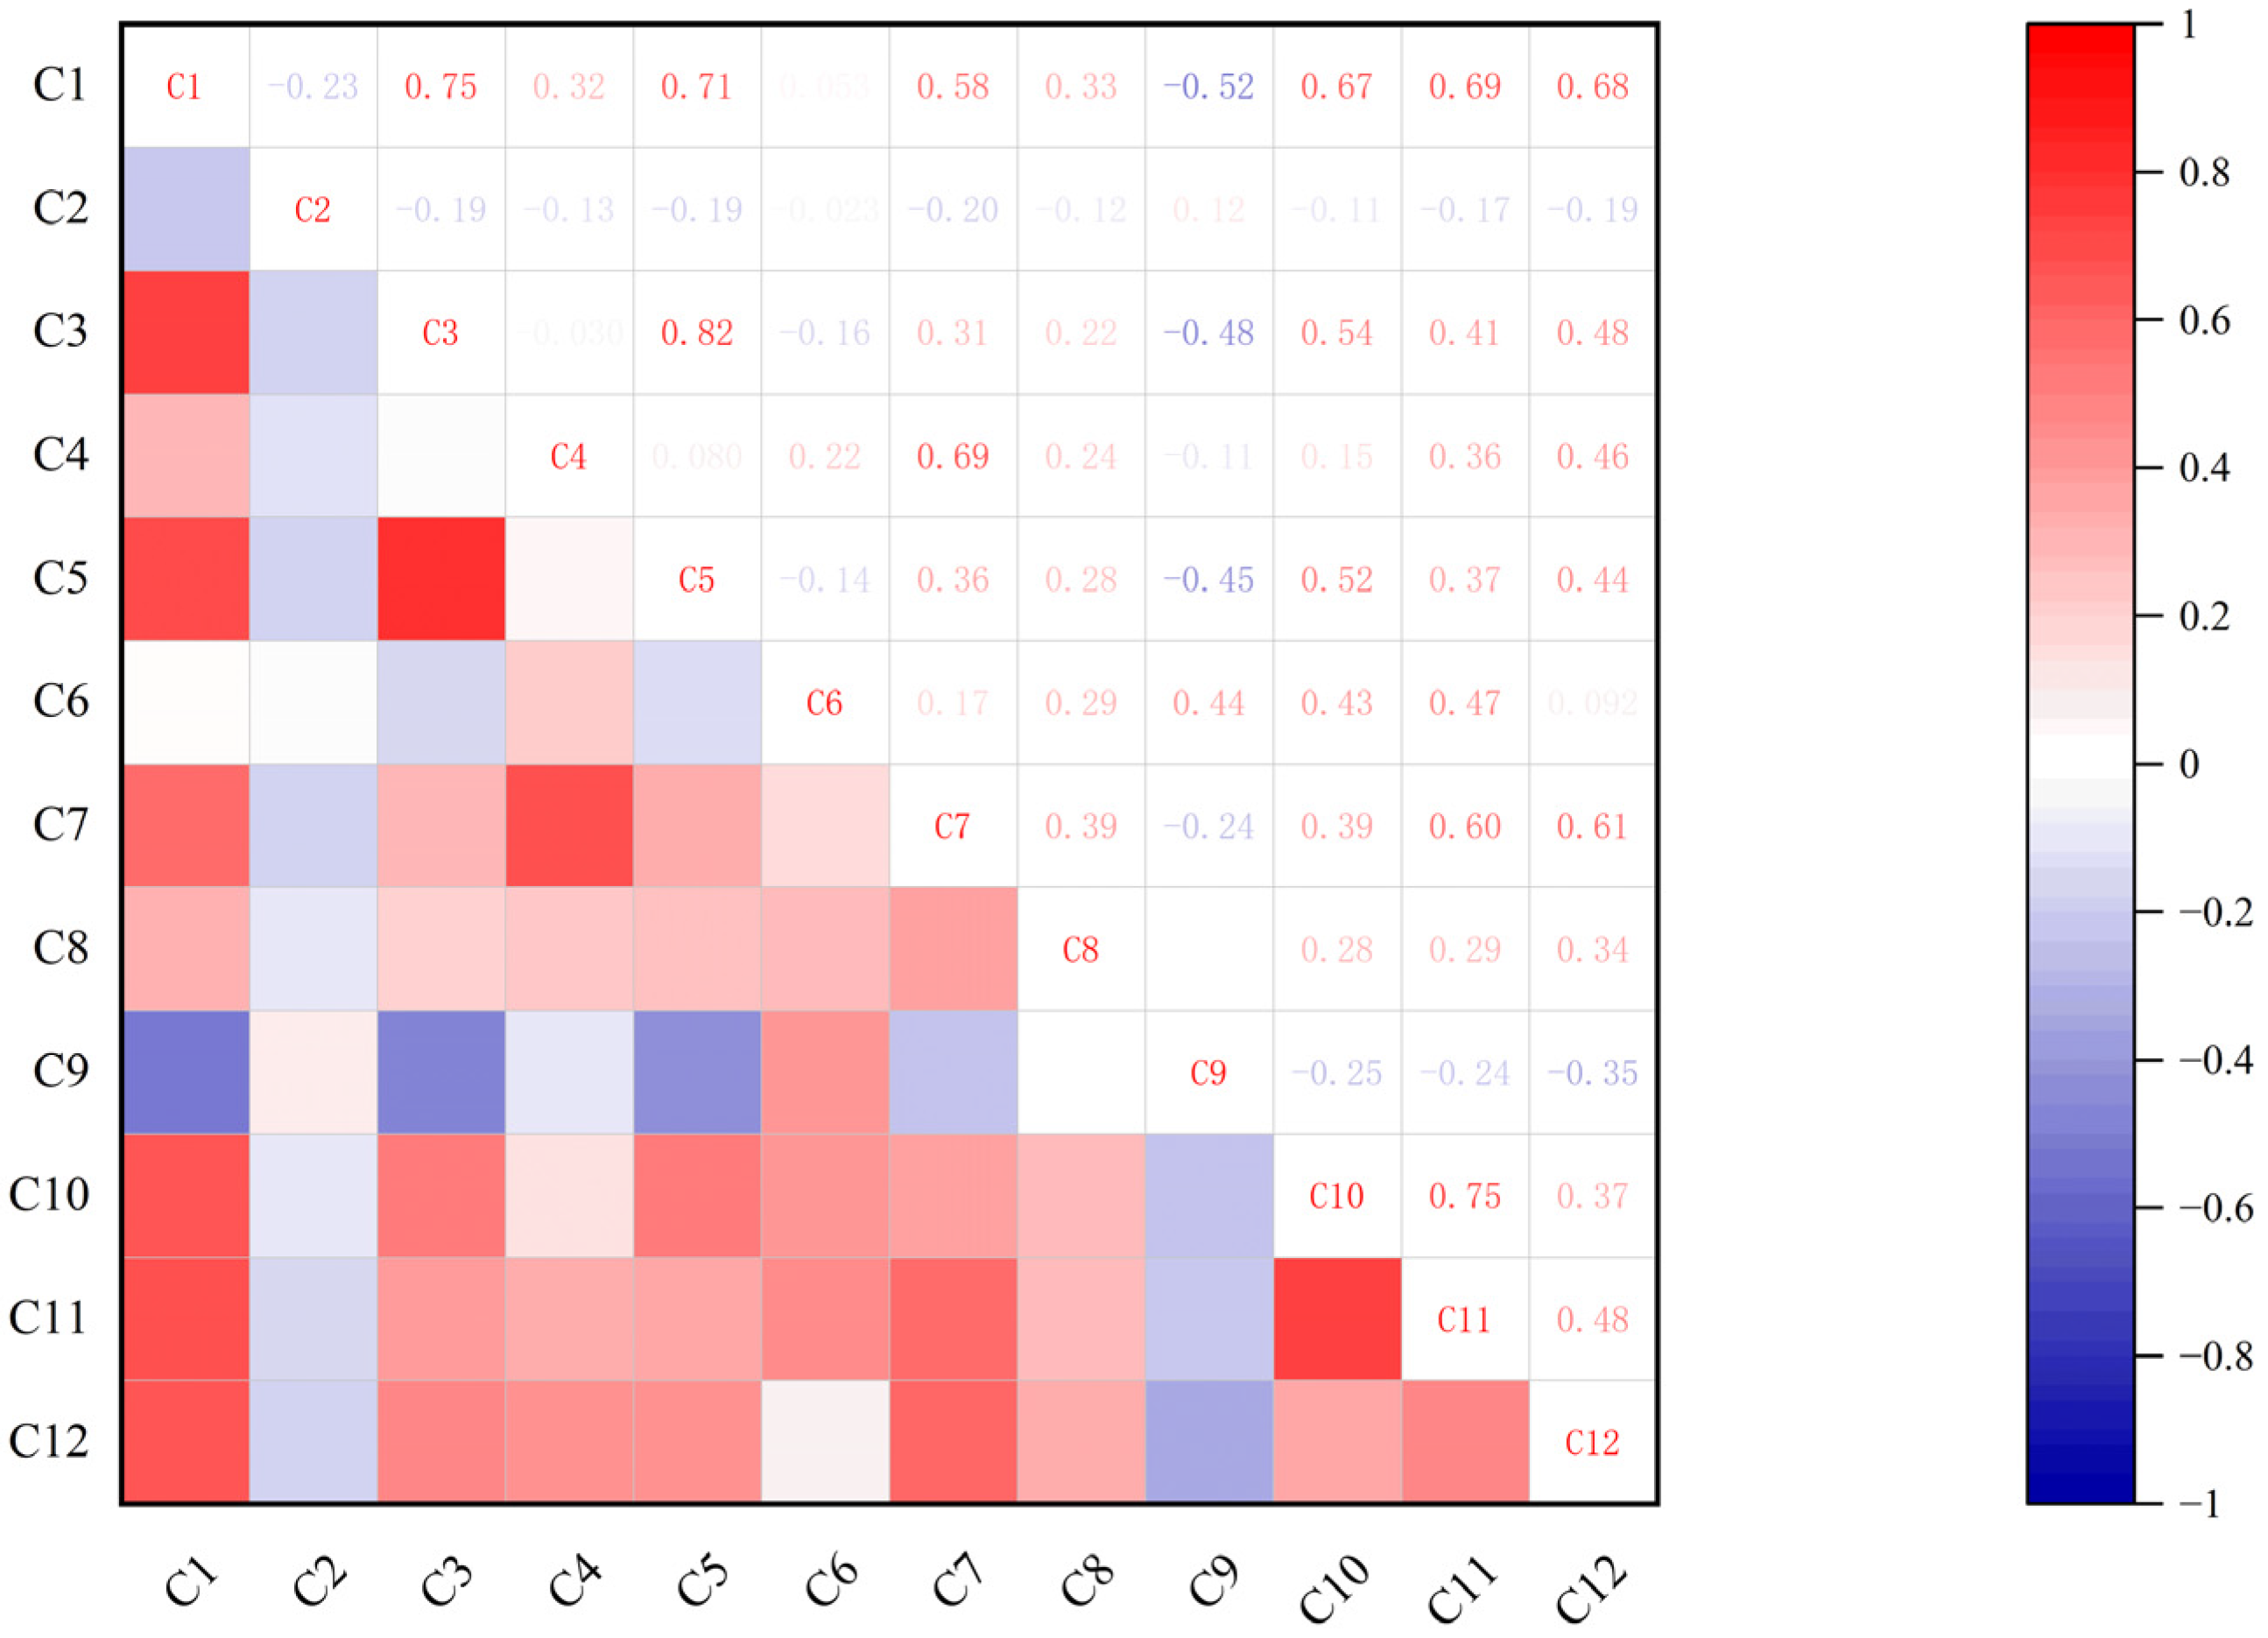
In order to examine the degree of correlation among the explanatory variables in the model, preliminary measures involved executing a correlation analysis and a multicollinearity test of each explanatory variable, prior to the application of the GTWR model. Figure 6 illustrates the correlation matrix of the explanatory variables used in this study. Except for a 0.82 correlation between C3 and C5, the correlation coefficients among the remaining explanatory variables are less than 0.8. Furthermore, all variables exhibit Variance Inflation Factor (VIF) values of less than 10, indicating the absence of severe multicollinearity.
In order to explore the key influencing factors and heterogeneity of carbon emissions amid green economic development, this study incorporates 12 indicators including the consumer price index, industrial structure upgrading coefficient, urbanization rate, green coverage rate of built-up areas, and local fiscal environmental protection expenditure. These indicators, sourced from four dimensions, encompassing economic development, social development, ecological environment, and governmental policies, are employed to construct the GTWR model. The model aims to elucidate from the perspectives of spatio-temporal change trends and spatial heterogeneity.

4.2.1. Spatio-Temporal Trend Analysis

Leveraging the green economic development index system, founded on four dimensions—economic development, social development, ecological environment, and governmental policies—this study employs the Geographically and Temporally Weighted Regression (GTWR) model. The objective is to ascertain the impact of the green economy on carbon emissions, and to scrutinize temporal fluctuations of varied contributing factors spanning the years 2004 to 2020. The detailed outcomes are illustrated in Figure 7.
As interpreted from Figure 7: ① Under ① under the economic development dimension, the consumer price index (CPI) wields the most substantial impact on carbon emissions, demonstrating a trend of initial decline followed by an ascent from 2004 to 2020. The per capita disposable income exhibited minimal fluctuations between 2004 and 2006, followed by a swift decrease during 2007–2020. The overall industrial structure upgrading coefficient exhibits a trend of initial decline followed by an increase. ② In the social development dimension, three indices exhibit an upward trend in carbon emission intensity over the research period, with population size being the most influential and experiencing the highest growth rate. This aspect results in a significant positive effect on carbon emissions. ③ Within the ecological environment dimension, sulfur dioxide emissions significantly impact carbon emissions. The green coverage rate of built-up areas showcases a trend of initial growth followed by a decline, whereas the impact of the per capita park green area exhibits a decreasing trend. ④ Pertaining to government policy, environmental protection expenditure exerts a pronounced impact on carbon emissions, demonstrating a declining trend annually. The harmless treatment rate of domestic waste presents feeble fluctuations and consistently maintains a negative impact on carbon emissions. Lastly, expenditure on science and technology depicts a trend of initial increase, followed by a decrease, transitioning from positive to negative impact on carbon emissions in 2007.

4.2.2. Spatial Heterogeneity Analysis

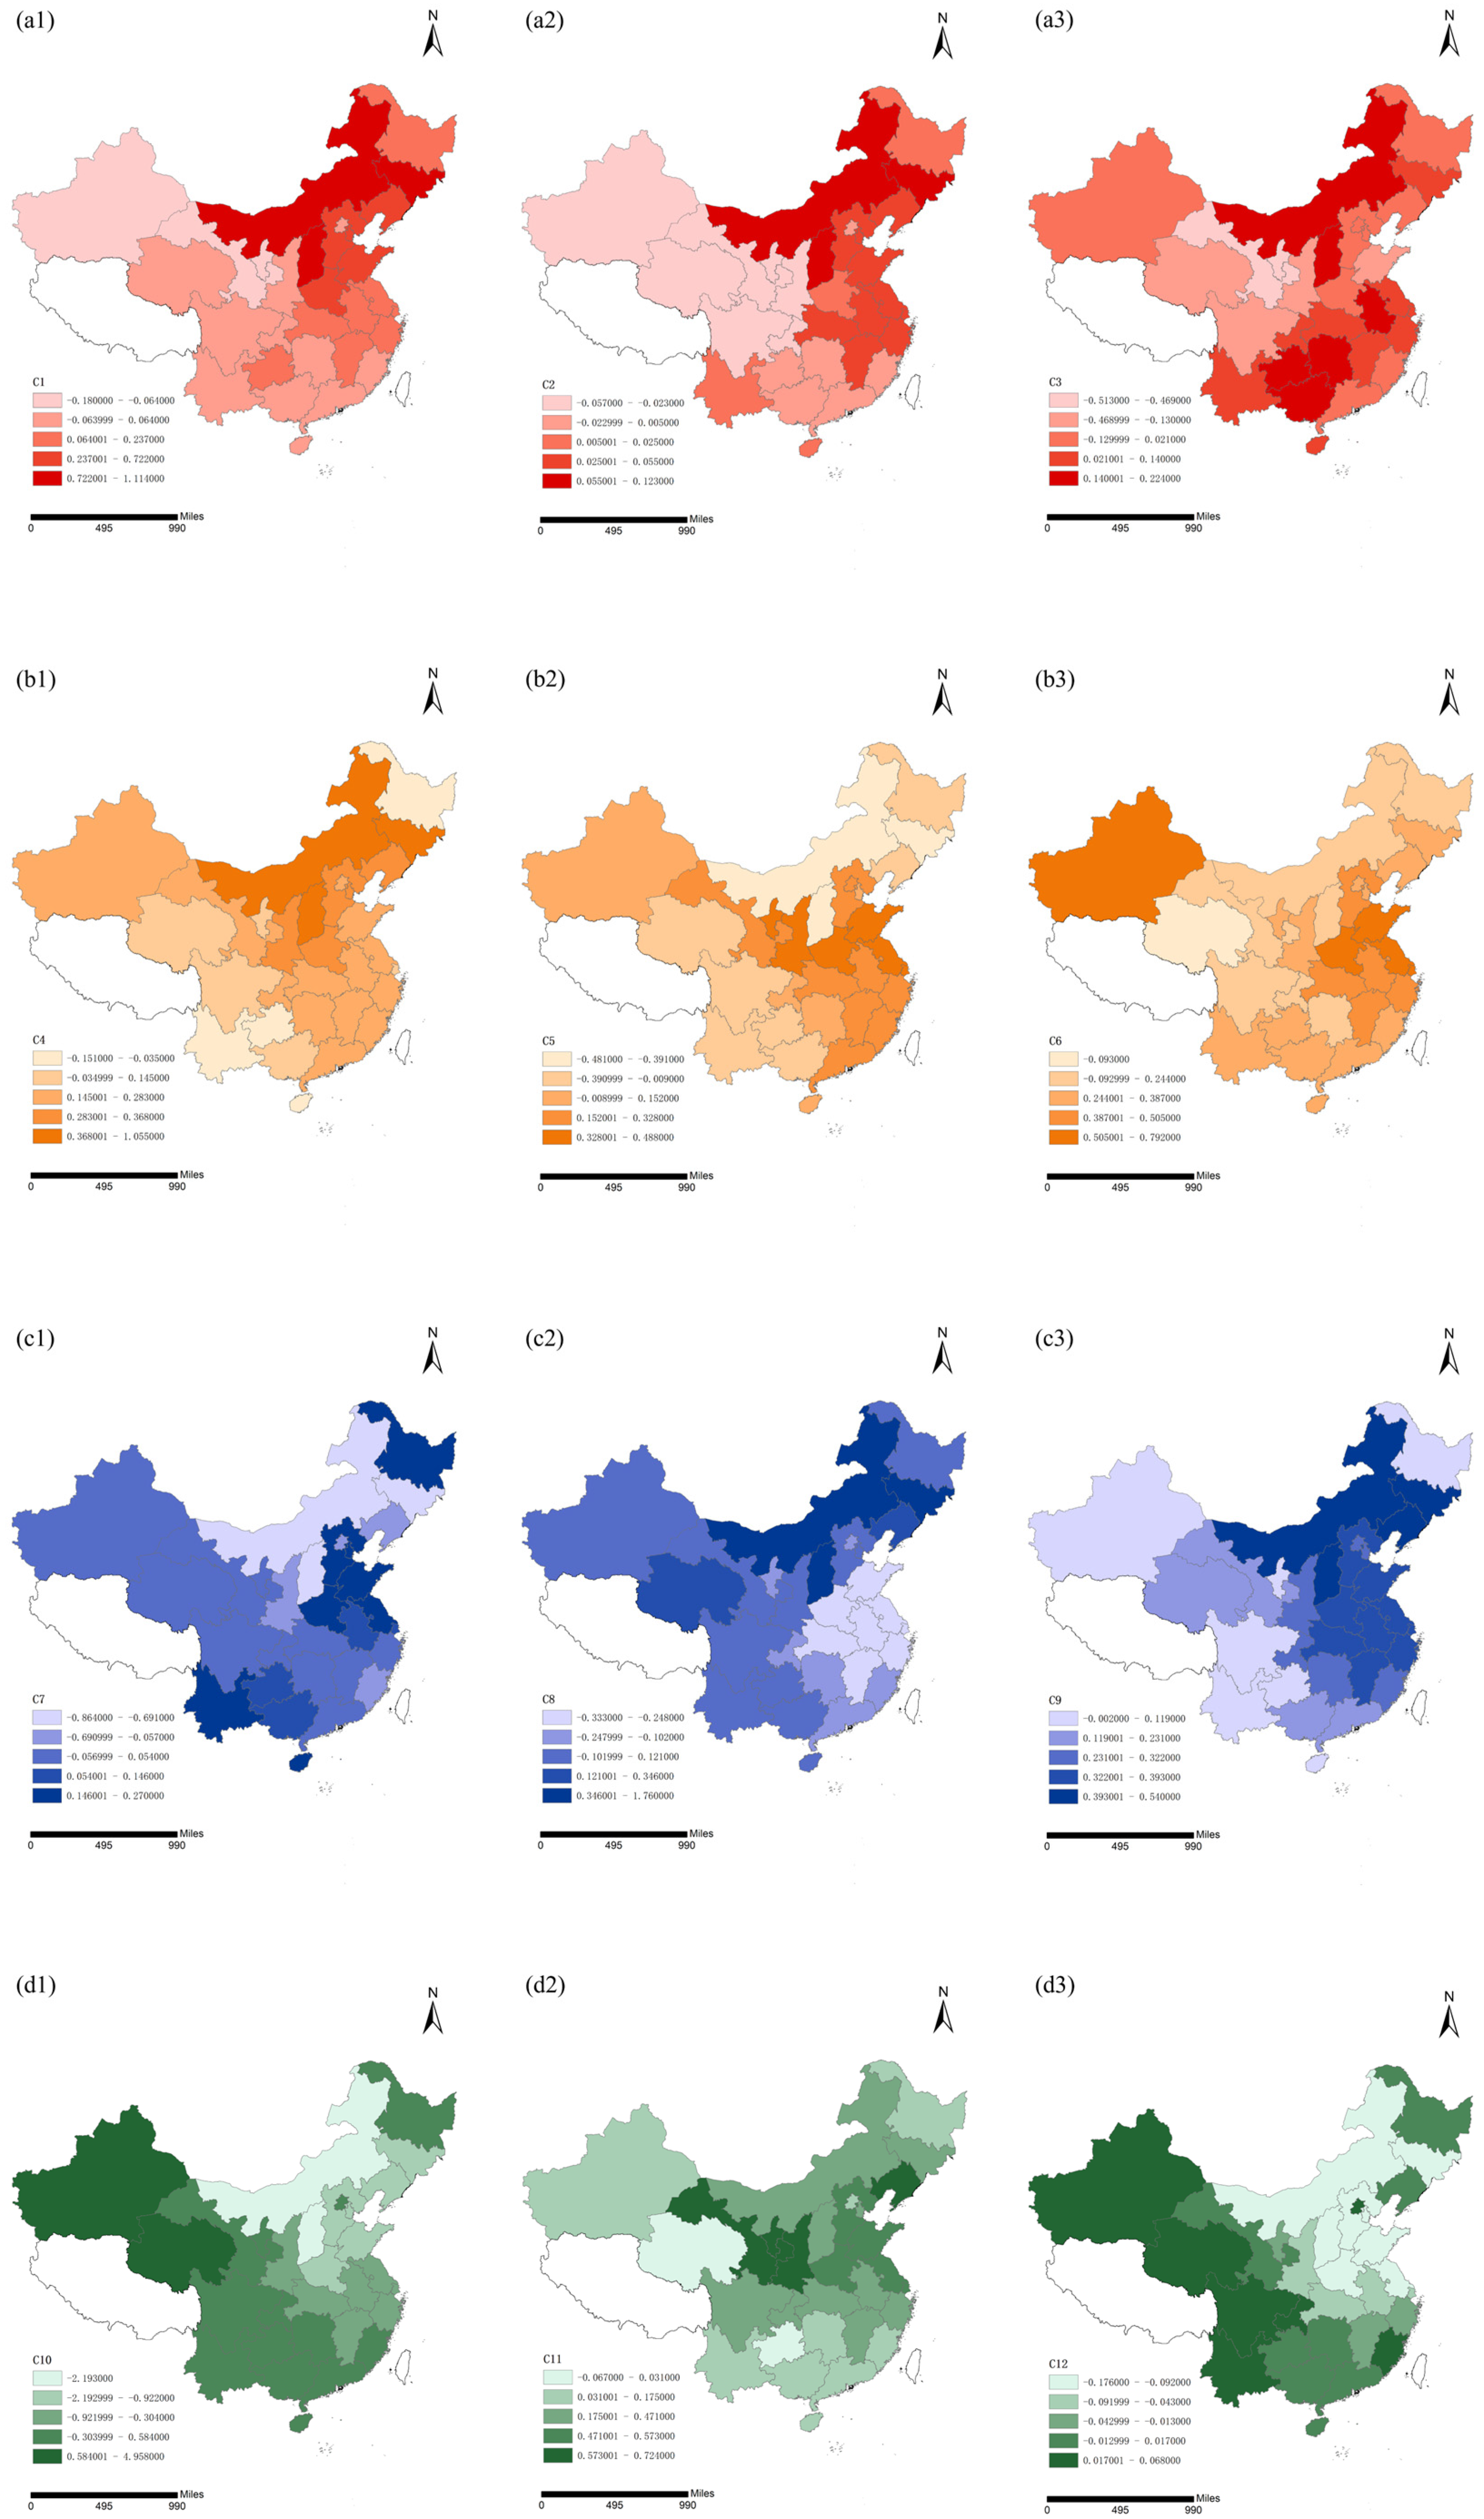
The aforementioned results solely represent the cross-sectional conditions across different time periods. To extend the analysis to comprehend the regional differences in the impact of various driving factors on carbon emissions, spatial heterogeneity is evaluated. This is conducted via examination of the coefficient mean of each index across the four dimensions. The results are demonstrated in Figure 8.
As interpreted from Figure 8: ① Within, ① within the realm of economic development, high-value areas of the CPI and per capita disposable income are predominantly concentrated in Northnorth China. In contrast, high-value regions of the industrial structure upgrading coefficient are primarily focused in Northnorth China, Guangxi Zhuang Autonomous Region, Guizhou Province, and Hunan Province. This suggests that economic development indicators exert a significant positive impact on carbon emissions in these regions. In contrast, the coefficients for the northwest and southwest regions are notably lower, implying that economic development positively influences emission reduction in these two regions. ② In the social development dimension, high-value areas of the per capita urban road area are centralized in Northnorth China, with low-value regions focused in Southwestsouthwest China. East China and Northnorth China, respectively, harbor the high-value and low-value areas of urbanization rate and population size. Aside from Qinghai Province, the population size has a positive effect on carbon emissions in all other regions. ③ The ecological environment dimension exhibits considerable spatial heterogeneity. High-value regions of the per capita park green area are scattered, predominantly in Heilongjiang, Shandong, Jiangsu, Henan, and Yunnan, with low-value areas concentrated in Northnorth China. North China has the primary concentration of high-value regions for green coverage rate of built-up areas and Sulfur dioxide emissions, while the low-value areas are concentrated in Easteast China and Southwestsouthwest China, respectively. ④ Under government policy, high-value areas of science and technology expenditure and domestic waste harmless treatment rate are primarily located in northwest and southwest regions, with low-value regions mostly concentrated in the north and east. Few regions, specifically Gansu Province, Ningxia Hui Autonomous Region, Shaanxi Province, and Liaoning Province, display high values of environmental protection expenditure. This indicates that, during the study period, only a select few regions demonstrated a significant impact of environmental protection expenditure on carbon emissions.

4.3. Analysis of the Impact of Green Economic Development on Carbon Emissions

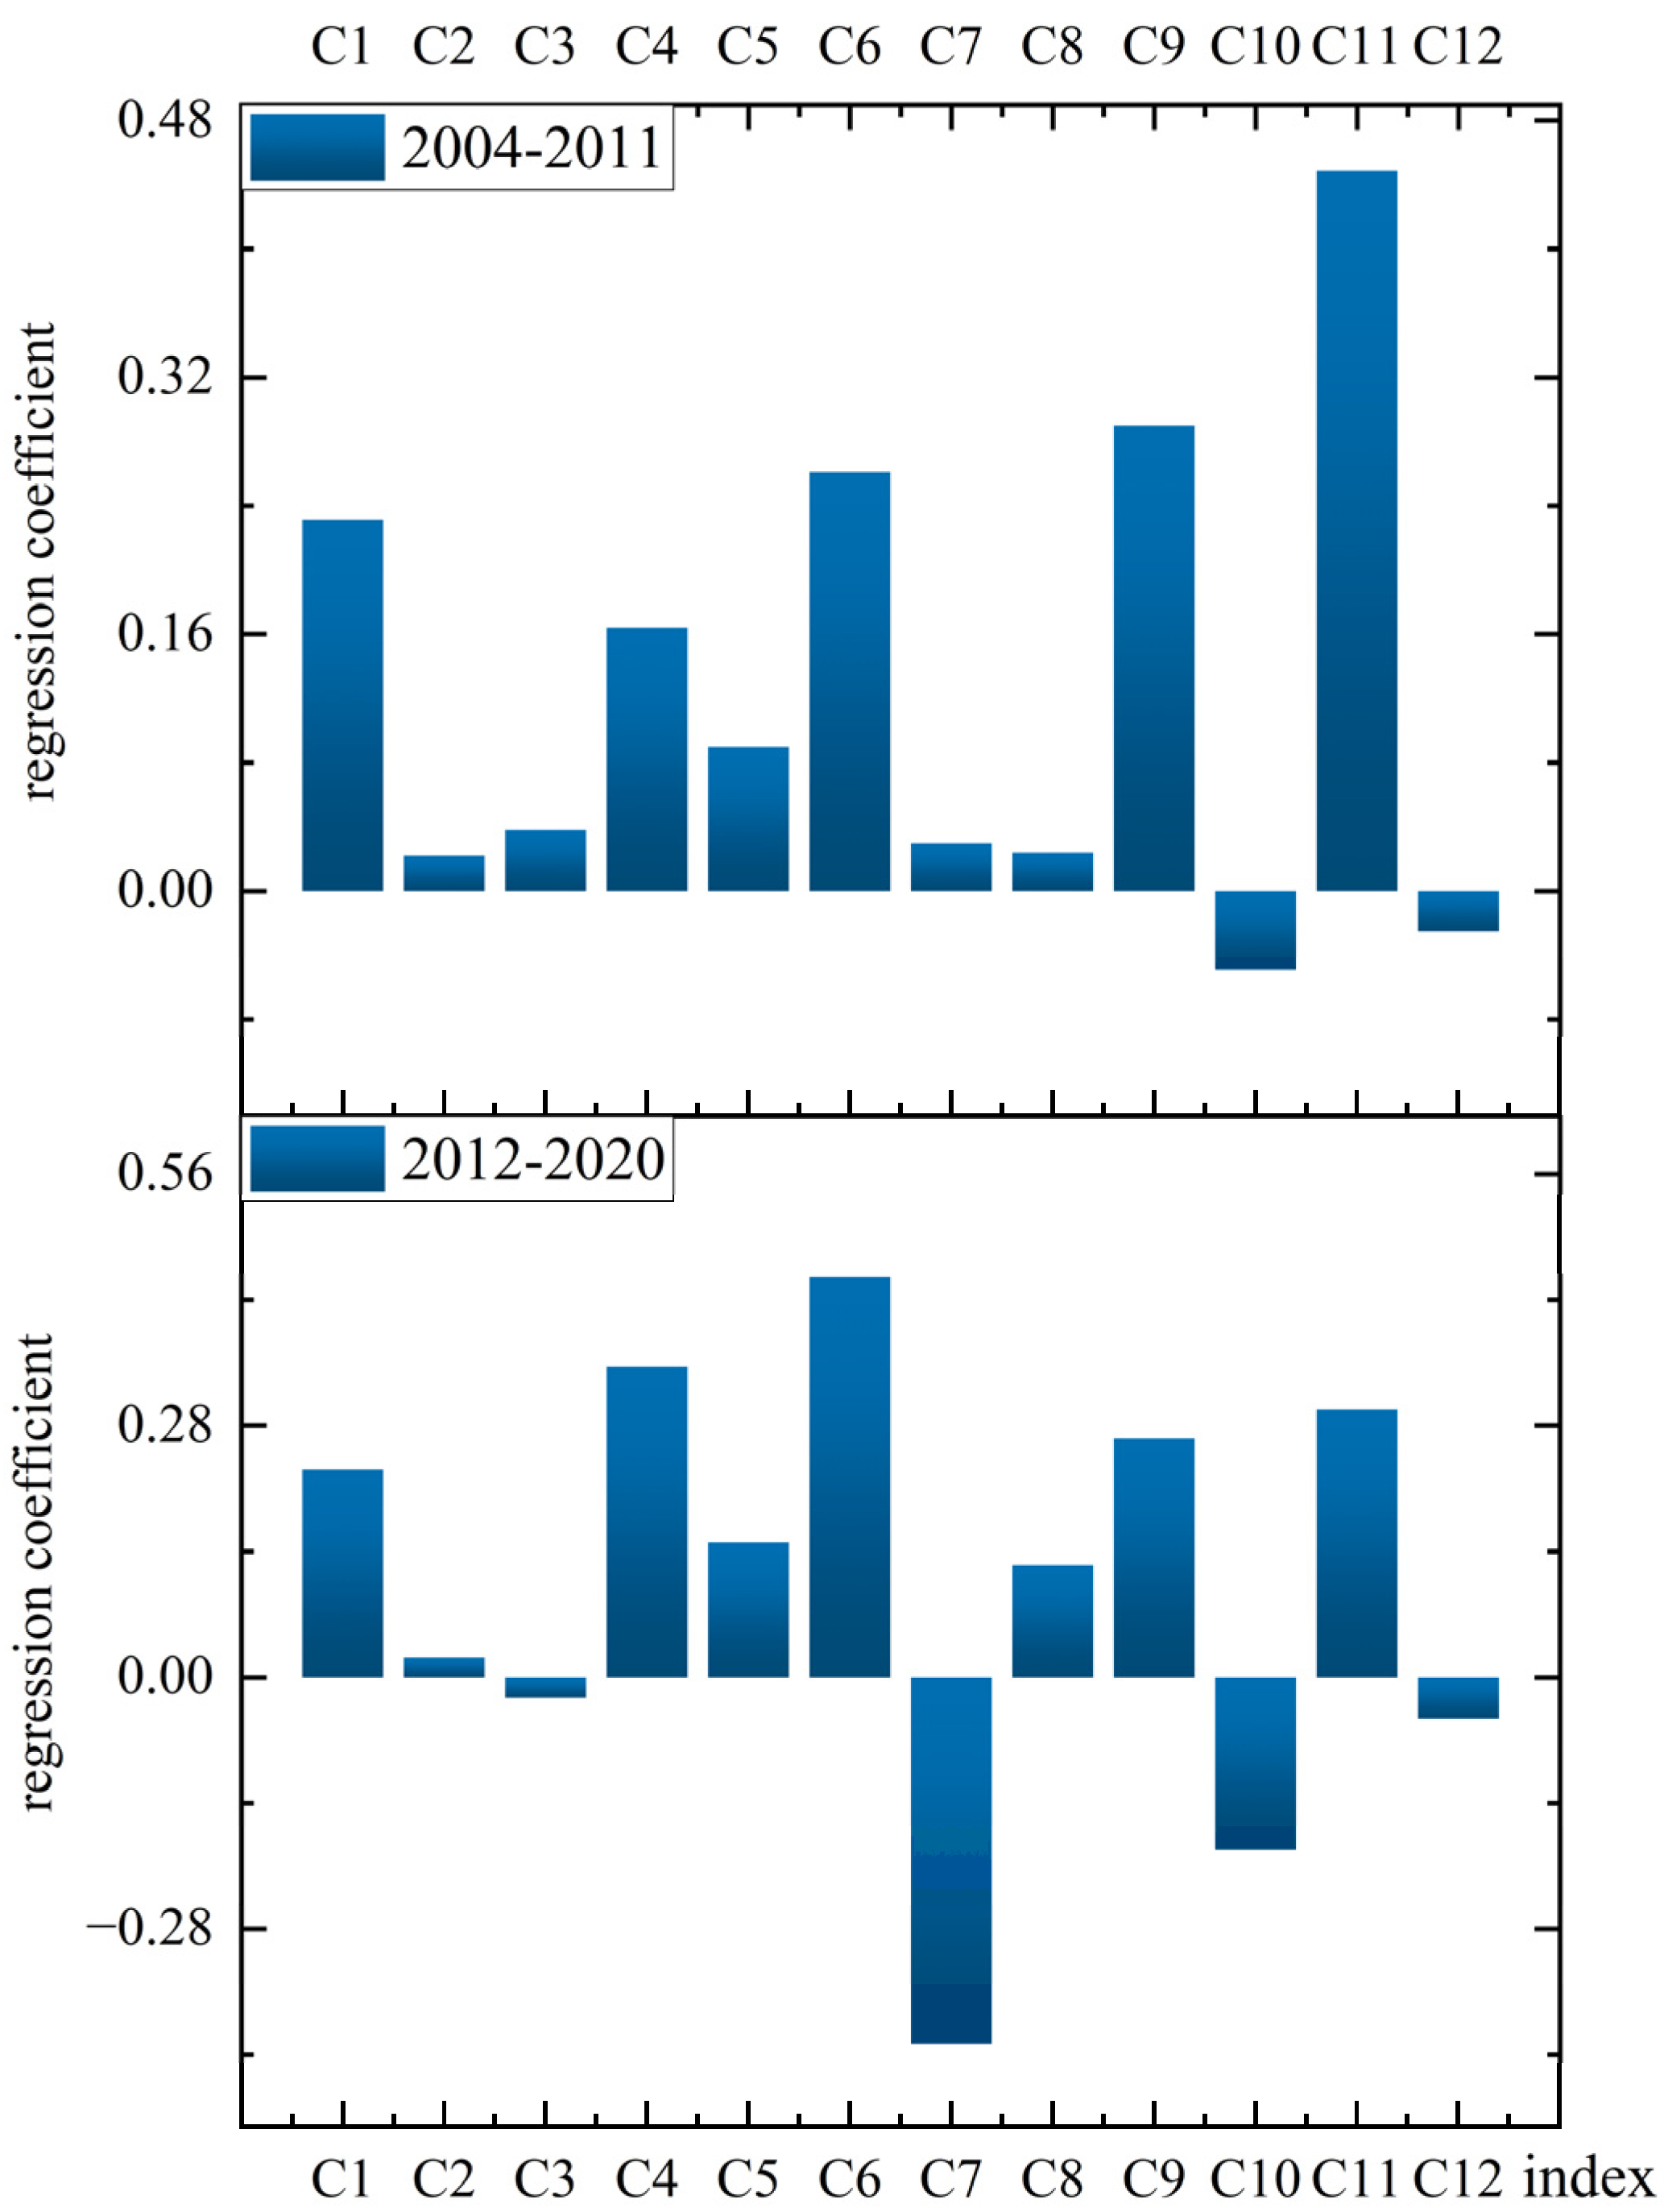
Utilizing the coefficients derived from the GTWR, this section examines the impact of various driving factors on energy carbon emissions at different stages and from diverse dimensions. It does this by marking the moment when the United Nations Environment Programme defined the green economy as a pivotal point. The intention is to explore the extent to which green economic development fosters the achievement of China’s carbon peak and neutrality goals. The specific findings are presented in Figure 9, Figure 10 and Figure 11.
According to the empirical results of these crucial factors impacting energy carbon emissions across various stages within the context of green economic advancement (Figure 9), a comparison with the pre-green economic development stage (2004–2011) reveals that the impact of the CPI and per capita disposable income on carbon emissions within the economic development dimension has remained constant post-green economic development (2012–2020). Meanwhile, the industrial structure upgrading coefficient has transitioned from having a negative to a positive impact on carbon dioxide emission reduction. The social development dimension has witnessed an increase in carbon emission intensity. The most notable change in the ecological environment dimension is the per capita park green area, which now exerts a significant positive effect on emission reduction. Regarding government policy post-green economic development, all three indicators have manifested a substantial positive impact on carbon dioxide emission reduction. This result indicates that the effective measures of government policies have a significant effect on carbon reduction. In the future, China should increase its investment in science, technology, and environmental protection, and further implement the “Opinions on Financial Support for Carbon Peak and Carbon Neutrality Work”.
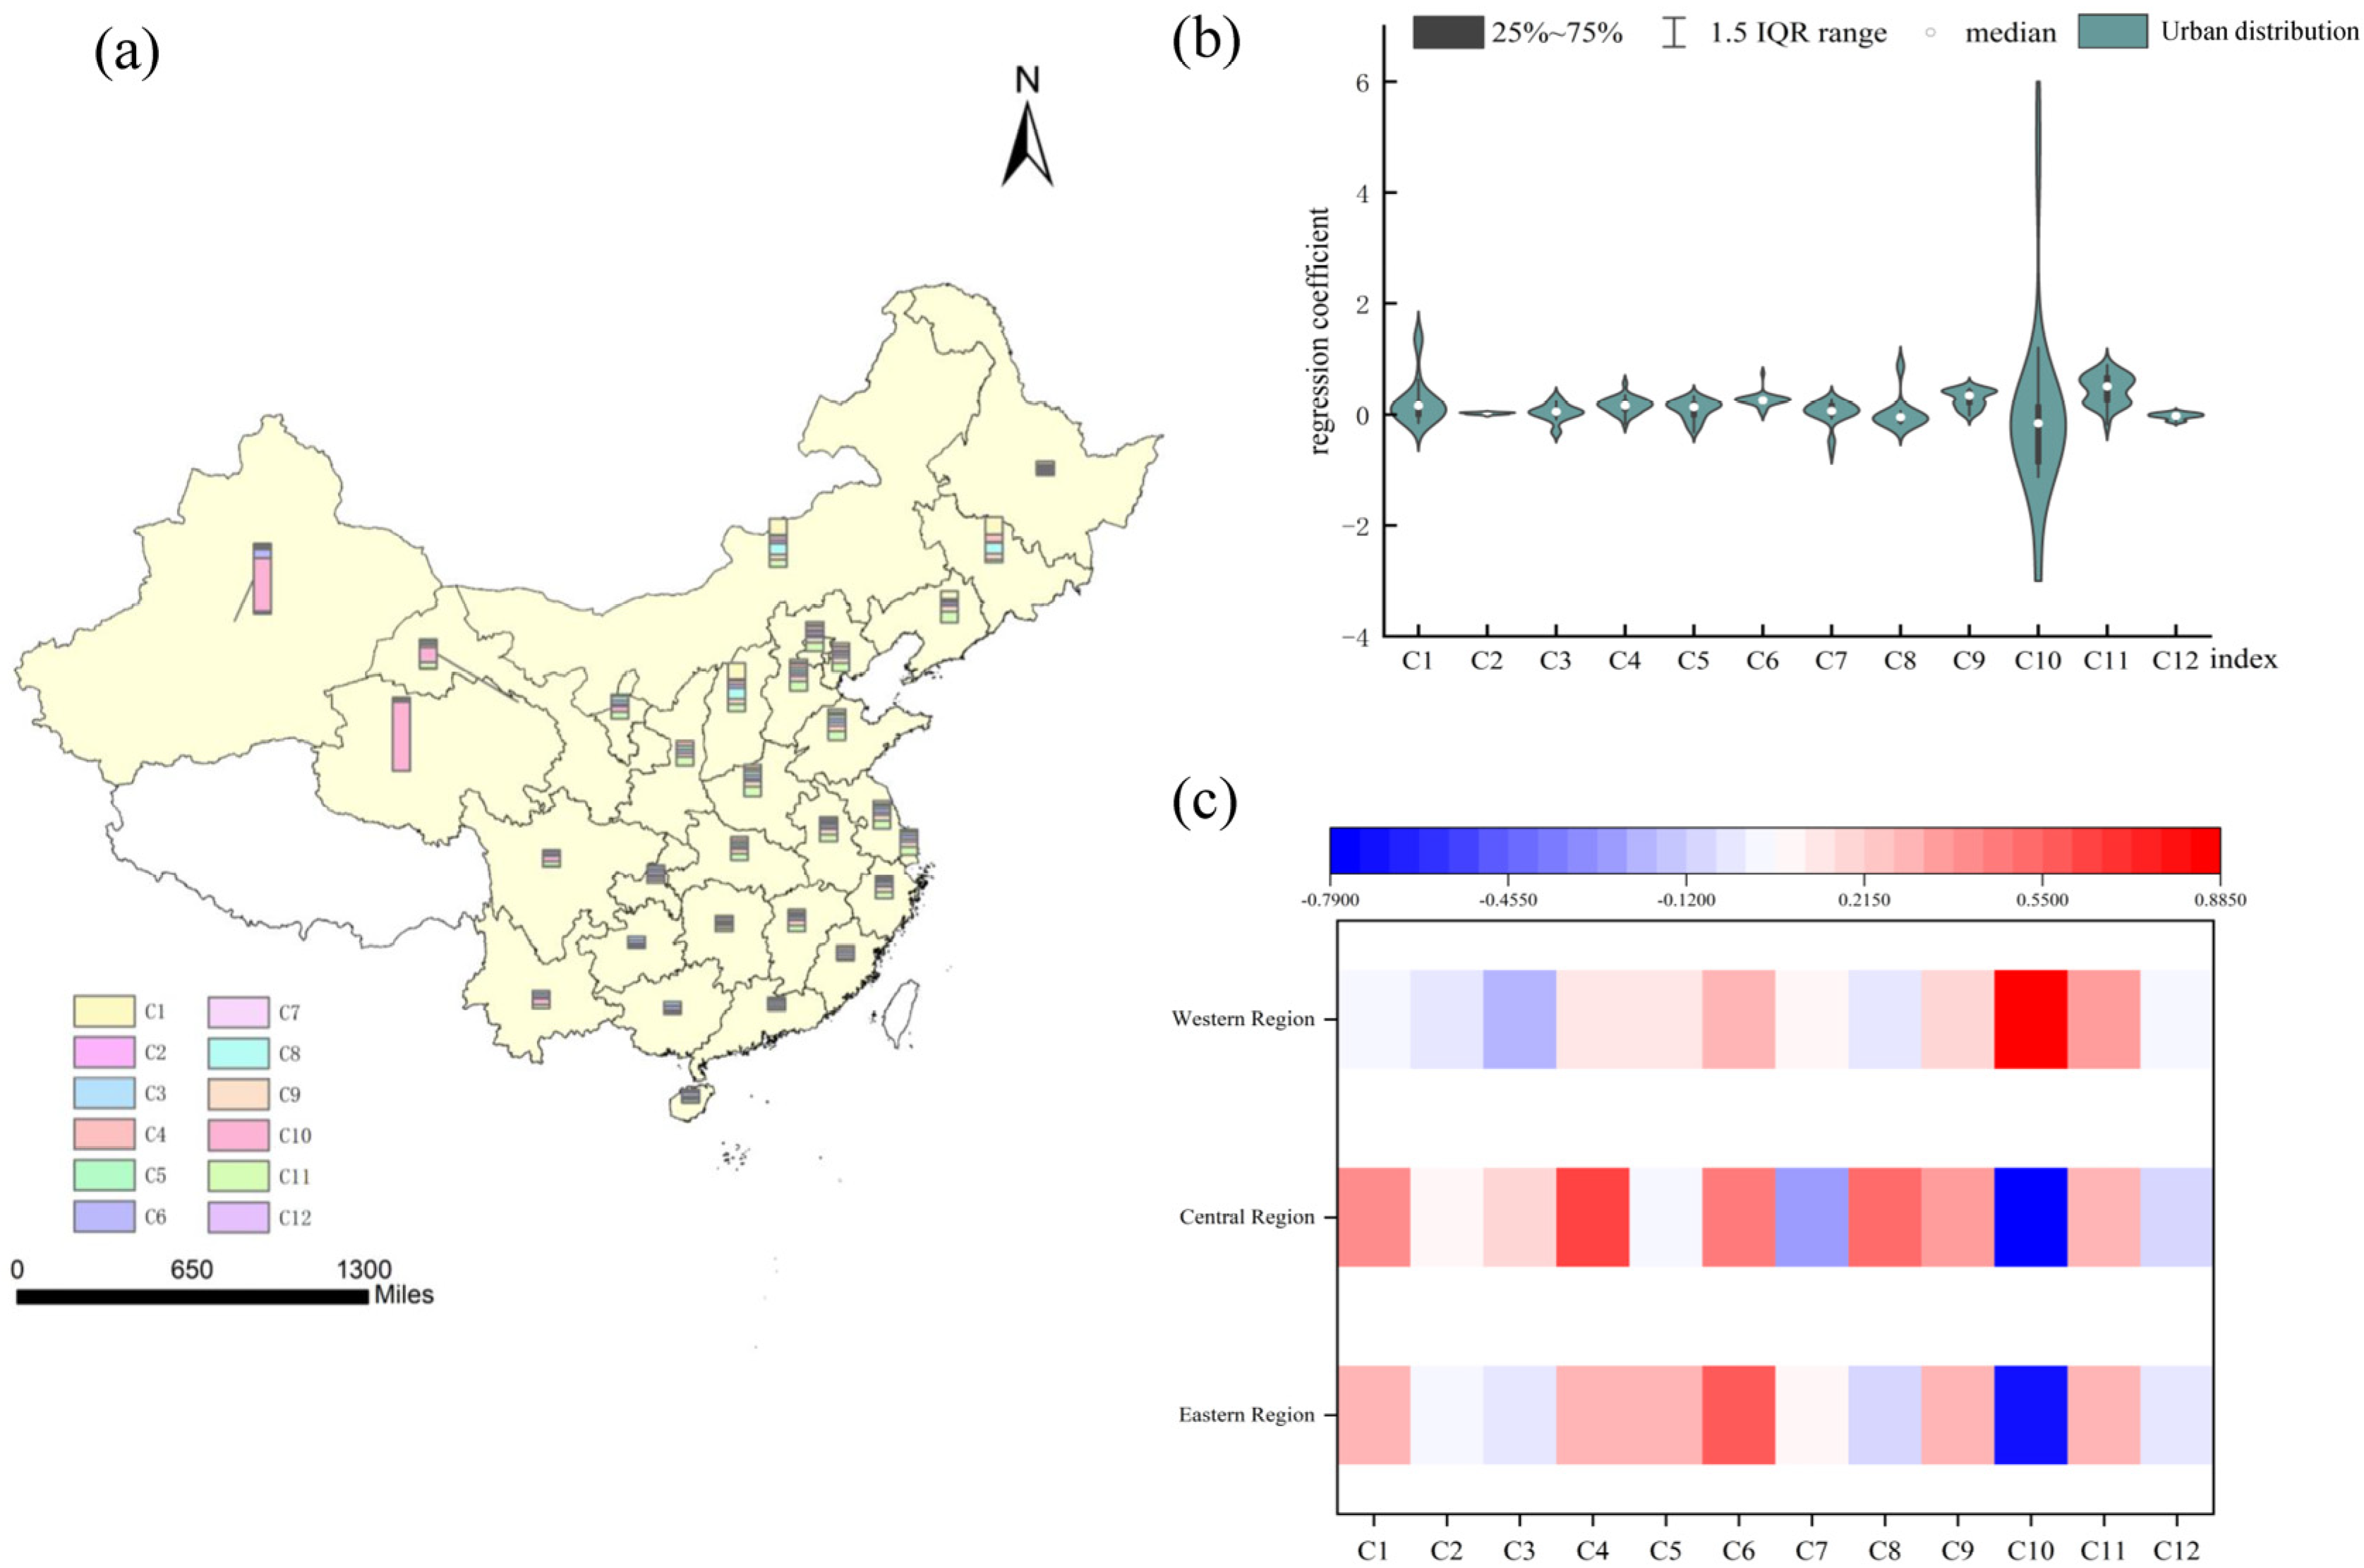
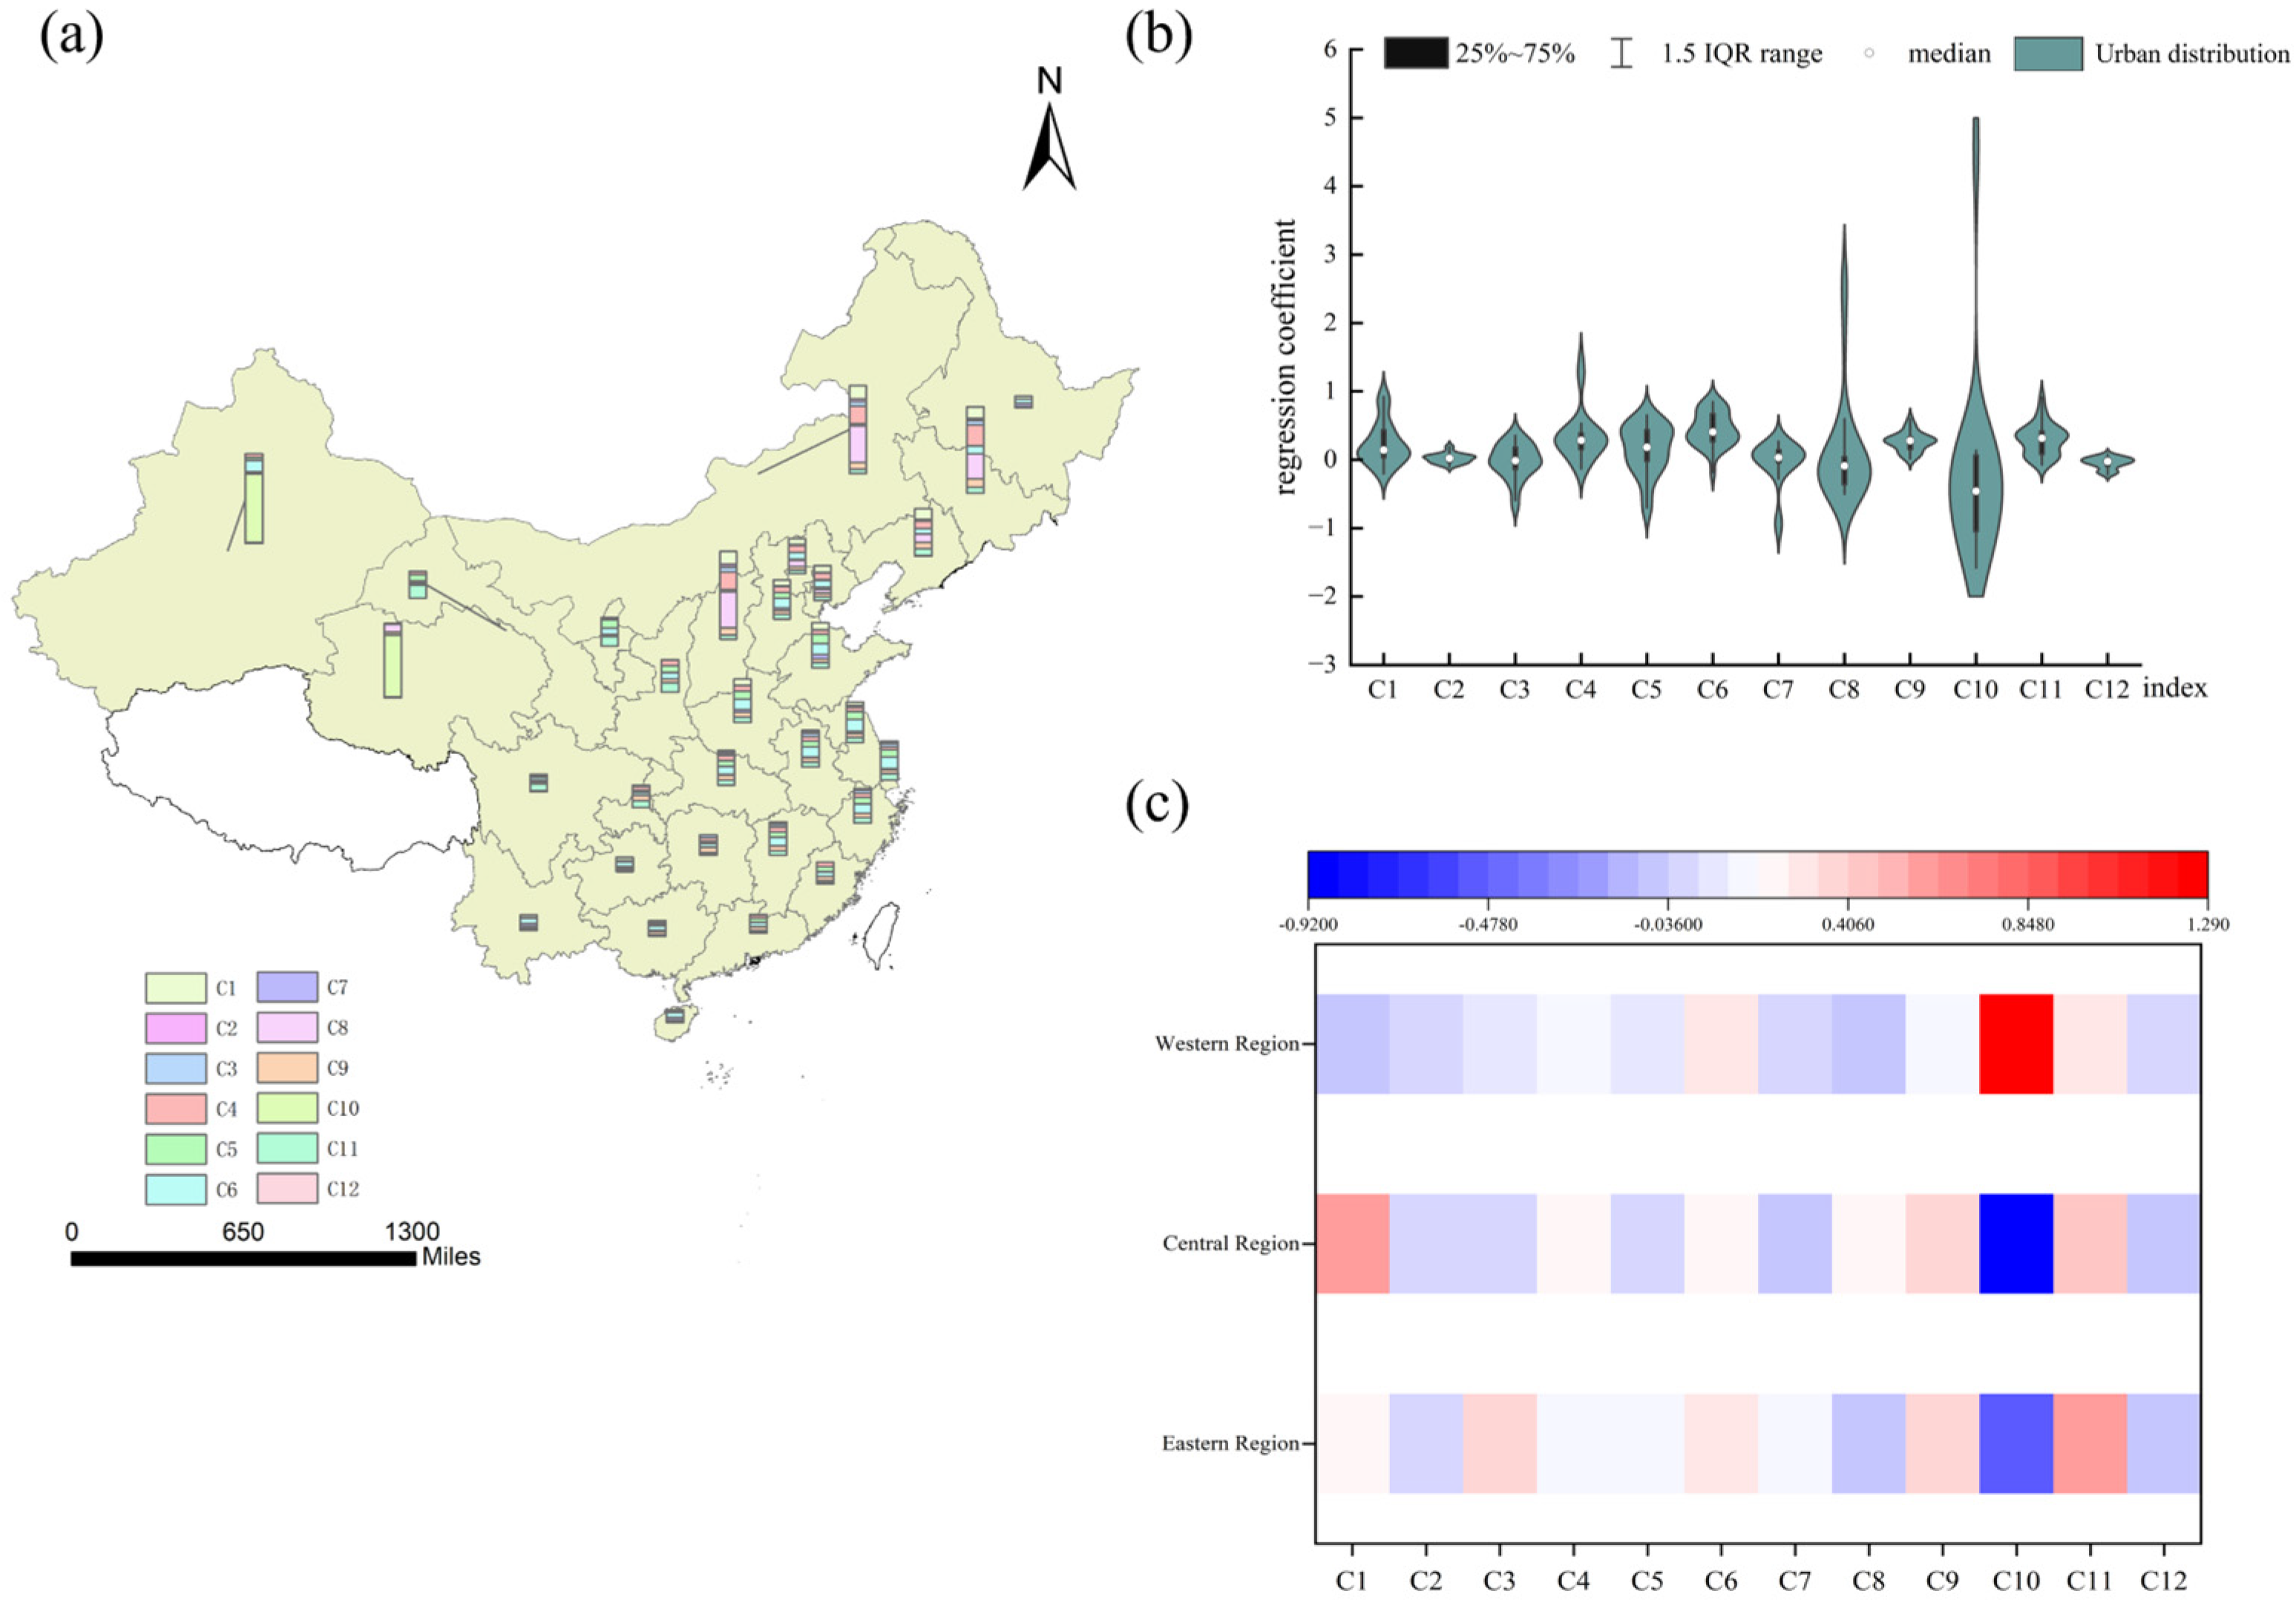
In relation to the heterogeneity estimation results for factors influencing energy carbon emissions prior to green economy development (2004–2011) (Figure 10), it is discernible that the coefficients marking the impact of various indicators on carbon emissions during this phase demonstrate notable regional disparities across the eastern, central, and western areas. Specifically, the following can be inferred: ① Within economic development, per capita disposable income displays no significant influence on energy carbon emissions in the eastern, central, and western regions. While the coefficient of industrial structure advancement impacts neither the central nor the western areas, it does manifest a positive effect in the eastern region with a coefficient of 0.376. The consumer price index exerts a positive effect on carbon emission intensity in the eastern and central regions, with coefficients of 0.197 and 0.571, respectively, while it imposes a restraining effect in the western region with a coefficient of −0.037. ② In terms of social development, the urbanization rate has no significant impact on carbon emissions in the central and western regions, yet it exerts a positive impact in the eastern region, indicated by a coefficient of 0.184. A surge in per capita urban road area and population size significantly escalates carbon emissions across the eastern, central, and western regions. ③ The per capita park green space area within the ecological environment does not notably affect carbon emission intensity in the western region but presents a potent positive impact in the eastern region and a strong inhibitory effect in the central region. The green space coverage rate in built-up areas imposes a mild inhibitory effect in the eastern and western regions, while stimulating the central region. The volume of sulfur dioxide emissions considerably intensifies carbon emission intensity across the eastern, central, and western regions. ④ Science and technology expenditures, within government policies, significantly curtail carbon emissions in the eastern and central regions. Yet, for the relatively underdeveloped western regions, with an action coefficient of 1.283, it exhibits a profound stimulating effect. As reported by Li and Zong [48], an inverted U-shaped correlation exists between environmental protection expenditures and carbon emissions. Given that China currently resides on the left side of the inflection point, environmental protection expenditure exerts a significant positive effect across the eastern, central, and western regions. The harmless treatment rate of household waste represses carbon emission intensity in the eastern and central regions, but slightly augments it in the western regions.
Upon reviewing the heterogeneity estimation results for principal factors influencing energy carbon emissions following the development of the green economy (2012–2020) (Figure 11), a close examination of various indicators’ coefficients during this period reveals that all four dimensions incite an increase in carbon emissions in the eastern region. In contrast, government policies broadly suppress carbon emissions in the central region. The coefficients for several indicators affecting carbon emissions in the western region are comparatively low. Specifically, the following conclusions can be drawn: ① The consumer price index within economic development exhibits no significant influence on carbon emissions in the western region, while it elicits a robust positive effect in the eastern and central regions, denoted by coefficients of 0.289 and 0.408, respectively. The per capita disposable income shows no significant impact across all regions. The upgrade coefficient of industrial structure exerts a negative effect in the eastern and western regions, indicative of its inhibitory influence on carbon emission intensity, yet stimulates the central region with a coefficient of 0.177. ② The effect coefficients of per capita urban road area on carbon emissions in the eastern, central, and western regions are 0.314, 0.612, and 0.142, respectively, all of which yield a significant promoting effect. The urbanization rate presents a strong positive impact in the eastern and western regions but remains inconsequential in the central region. Similarly, population size has a significant positive effect across all regions. ③ Within the ecological environment, the per capita park green space area shows no significant impact on carbon emissions in the eastern and western regions, but exerts a potent inhibitory effect in the central region. The built-up areas’ green coverage rate does not notably influence the eastern and western regions but significantly enhances the central region. Sulfur dioxide positively affects the eastern, central, and western regions, with action coefficients of 0.271, 0.369, and 0.167, respectively. This effect is particularly significant in the eastern and central regions. ④ Most of China’s research funding derives from independent investments by local enterprises, supplemented by government actions. The distinct advantages of the eastern and central regions in terms of enterprise activities and industrial structure, result in a substantial inhibitory effect of scientific and technological expenditures on the carbon emission intensity of these regions, while promoting the western region. Beyond pollution reduction, environmental protection expenditure encompasses ancient woodland protection project expenditure, grain for green expenditure, and sand desert control expenditure. As the technology and energy usage inherent to these projects can lead to unavoidable pollution emissions, environmental protection expenditure continues to exert a positive effect on the eastern, central, and western regions. The harmless treatment rate of household waste remains inconsequential to carbon emissions.

5. Discussion

This article calculates the carbon emissions of 30 Chinese provinces and cities, derived from their primary energy consumption, and formulates a comprehensive, four-dimensional framework for green economy development. Employing a GTWR model, this study scrutinizes the influence of green economy advancement on carbon emissions. In examining spatiotemporal evolutionary trends and spatial heterogeneity, the research discerns whether the growth of the green economy can indeed diminish carbon emissions. Consequently, this paper contributes to the achievement of developmental objectives, including carbon peaking, energy conservation, and emission reduction.
Despite its strengths, this study acknowledges potential avenues for improvement:
  • Data: Constrained by the logistics of data collection, this research omits certain provinces and special administrative regions in China (Tibet, Hong Kong Special Administrative Region, Taiwan Province, and Macao Special Administrative Region). Furthermore, given the lack of consensus on the meaning of a green economy, the indicator system employed for green economy development may lack exhaustive coverage and require further enhancement. The augmentation of indicators in subsequent investigations will therefore serve as a focal point of future research [49].
  • Data processing: Research methods: In assessing the factors influencing carbon emissions across regions, this study employs the regression coefficient computed via the GTWR model to ascertain the impact of each driving component. This model proficiently quantifies the effects of spatial location and temporal instances, vividly illuminating the interplay among various factors within the model. However, the centroid determination of each region during the sample point selection could influence the choice of spatial distance weighting parameters. Future investigations could incorporate complementary methodologies to facilitate a comprehensive analysis, aiming to measure the influence of diverse factors on carbon emissions from a multidimensional standpoint [50]. Moreover, the spatiotemporal geographic weighted regression model employed in this study overlooks the cross-sectional correlation of panel data and falls short of pinpointing the spatial effect of green economy development on carbon emissions across different regions. Subsequent research will seek to expand our understanding of the effects of green economy development on carbon emissions, considering a wider range of perspectives aligned with the green economy concept.
  • Research perspective: There are many types of energy consumption in China, with a complex composition. This paper used the main energy consumption, such as coal consumption, coke consumption, and diesel consumption, while ignoring the differences in energy consumption types among the 30 provinces and cities in China. In future research, energy carbon emissions should be considered from multiple perspectives [51].
  • Research methods: The GTWR model used in the empirical analysis of this paper is a single model, and other parameter optimization methods will be added in subsequent research to improve the accuracy of the model and combined with other models for more comprehensive analyses [52].

6. Conclusions

The present study utilizes pertinent data collected from 30 provinces and cities in China spanning the years of 2004 to 2020, aimed at probing the influence of green economy development on energy carbon emissions from a multifaceted perspective. This article constructs a theoretical mechanism for assessing the effects of green economy development on energy carbon emissions, thus addressing the limitations of existing research on carbon emissions reduction across various provinces and cities from multiple standpoints.

6.1. Main Conclusion

  • Overall, China’s carbon emissions have displayed an upward trajectory; however, the rate of growth has noticeably decelerated since 2011. Carbon emissions in the northwest are comparatively minimal with a marginal growth rate. Central and Northernnorthern China exhibit high carbon emission intensity, yet the growth rate from 2012 to 2020 is inferior to that from 2004 to 2011, with some regions even demonstrating a declining trend in emissions. With the maturation of the green economy development model, the surge in carbon emissions has decelerated. Throughout the study period, significant spatial clustering of carbon emissions has been observed in various regions, with most areas residing in high-value and low-value regions.
  • An analysis of the influencing factors on carbon emissions in 30 Chinese provinces and cities from 2004 to 2020 reveals that the overall impact of economic development indicators on carbon emissions presents a pattern of initial decrease followed by increase. Although China’s economic growth is steadily transitioning from extensive to intensive, striving for high-quality economic growth, the effectiveness of environmental protection remains unproven, and economic development continues to rely on the utilization of fossil fuels, thereby perpetuating carbon emissions growth. The coefficient of social development has seen an annual increase. Human production and lifestyle are irrevocably tied to energy consumption, particularly the consumption of fossil fuels, which yield substantial carbon emissions. Given that rural residents currently consume less energy than urban residents in their daily lives, transportation, and other areas, an increase in urbanization rate incites a rise in energy consumption, thereby augmenting energy carbon emissions. The green coverage rate in built-up areas within the ecological environment follows a pattern of initial increase and subsequent decrease, and the influence of per capita park green space area shows a downward trend. The overall effect of government policies on carbon dioxide emissions reduction exhibits a significant upward trend.
  • Spatial heterogeneity analysis conducted on the research subjects concludes that distinct driving factors exert varied degrees of impact across different regions. Overall, economic development significantly contributes to emission reduction in the northwest and southwest of China, while social development escalates carbon emissions in all areas, particularly in Northernnorthern and Easterneastern China. The ecological environment fosters carbon emissions in Northernnorthern and Easterneastern China. Government policies, on the whole, play a critical role in carbon dioxide emissions reduction, especially in Northernnorthern China. These findings illuminate some fundamental realities of China’s rapid development process: the majority of provinces and cities are preoccupied with bolstering their economic prowess and expediting social development while placing less emphasis on environmental protection. Consequently, economic and social development instigates an increase in carbon emissions in such areas.
  • A comparative analysis before and after the definition of the green economy by the United Nations Environment Programme reveals a significant change in the upgrading coefficient of the industrial structure from an economic development perspective. Compared to the primary and secondary sectors, the tertiary sector consumes less energy per unit of output. Thus, the upgrading of the industrial structure curtails energy consumption, thereby reducing carbon emissions. The coefficients of the three indicators in social development have all seen an increase, and the per capita urban road area in the ecological environment has transitioned from positive to negative, significantly aiding carbon dioxide emissions reduction. Both the scientific and technological expenditure of government policies and the harmless treatment rate of household waste are negative and have increased in absolute terms, suggesting an enhanced contribution to carbon dioxide emissions reduction.

6.2. Countermeasure Suggestions

  • Given the temporal lag in carbon emissions, the quality of early environmental governance critically influences the execution of current low-carbon emission reduction initiatives. Therefore, to achieve the objective of sustainable green and low-carbon development, it is imperative to focus not only on national-level carbon emission control and total emission management in each phase but also from a local perspective. This involves intensive monitoring of provinces and regions with high emissions, coupled with prompt elimination of peripheral pollution radiation.
  • Within the sphere of carbon dioxide emission reduction, on the one hand, the share of the tertiary sector in the economy should be augmented through industrial structure optimization and the advancement of high-tech industries. On the other hand, the commitment to scientific and technological investment needs to be heightened, thereby accelerating technological innovation, transforming the structure of energy utilization, and expanding the proportion of clean and renewable energy use. As China is a high energy-consuming nation, enhancing the conversion rate of primary energy consumption can drastically decrease overall carbon emissions. An improvement in energy utilization rate will have a profound positive impact on carbon emissions.
  • All regions within China need to enact differentiated carbon emissions management, tailored to local conditions. Various regions must implement divergent carbon emission management policies and develop carbon reduction strategies compatible with their unique realities. For instance, the northwestern region requires an intensification of governmental efforts, an increase in scientific and technological expenditure, and further advancements in energy-saving and emission-reduction technologies. Simultaneously, Northnorth China, while fostering economic growth, must reinforce environmental protection measures and balance the interface between economy and environment. This approach to differential management of carbon emissions can create a conducive environment for regional emission reduction and facilitate autonomous emission reduction in each jurisdiction.
  • The progression of the green economy can not only elevate the standards of environmental protection technology and capabilities but also stimulate the development of renewable energy, catalyze the transformation and upgrading of the energy industry, and effectively mitigate carbon emissions. China should fortify its commitment to the development of the green economy, enhance environmental law enforcement, progressively construct a comprehensive and efficient legal framework for the green economy, and provide systematic institutional guarantees for the development of the green economy.

Author Contributions

Conceptualization, J.P. and X.H.; methodology, H.G. and K.W.; software, Xinyue Fan and X.H.; data curation, J.P. and K.W.; writing—original draft preparation, X.F. and J.P.; writing—review and editing, H.G.; visualization, J.P. All authors have read and agreed to the published version of the manuscript.

Funding

This work was supported by Sichuan Science and Technology Program (2023NSFSC0807), Opening Fund of Sichuan Mineral Resources Research Center (SCKCZY2022-YB017), and the General Program of Sichuan Center for Disaster Economy Research (ZHJJ2022-YB002).

Institutional Review Board Statement

Not applicable.

Informed Consent Statement

Not applicable.

Data Availability Statement

Some or all data, models, or code that support the findings of this study are available from the corresponding author upon reasonable request.

Conflicts of Interest

The authors declare no conflict of interest.

References

  1. Zhai, S.Y.; Wang, Z.; Ma, X.Z.; Huang, R.; Liu, C.X.; Zhu, Y.B. Calculation of regional carbon emission: A case of Guangdong Province. Yingyong Sheng Tai Xue Bao 2011, 22, 1543–1551. [Google Scholar]
  2. Li, S.; Lan, Y.W.; Guo, L.J. Analysis of Carbon Emission and Its Temporal and Spatial Distribution in County-Level: A Case Study of Henan Province, China. Nat. Environ. Pollut. Technol. 2022, 21, 447–456. [Google Scholar] [CrossRef]
  3. Wang, X.; Wang, Z.; Wang, R. Does green economy contribute towards COP26 ambitions? Exploring the influence of natural resource endowment and technological innovation on the growth efficiency of China’s regional green economy. Resour. Policy 2023, 80, 103189. [Google Scholar] [CrossRef]
  4. Yang, Y.L.; Zhang, X.; Wu, T. Does Public Participation Reduce Regional Carbon Emissions? A Quasi-Natural Experiment from Environmental Information Disclosure in China. Pol. J. Environ. Stud. 2023, 2, 1899–1917. [Google Scholar] [CrossRef]
  5. Imansyah, M.H.; Hartono, D.; Putranti, T.; Muzdalifah, M. The Impacts of Digital Economy on Green Economy: The Indonesian Miyazawa Model. Pol. J. Environ. Stud. 2023, 32, 1609–1619. [Google Scholar] [CrossRef]
  6. Feng, M.; Lan, L.; Chen, C.; Zhu, Y.Q. Spatial Effect Research on the Impact of Technological Innovation on Carbon Dioxide Emission Intensity. Pol. J. Environ. Stud. 2022, 31, 5675–5682. [Google Scholar] [CrossRef]
  7. Hu, X.; Zhang, X.; Dong, L.; Li, H.; He, Z.; Chen, H. Carbon Emission Factors Identification and Measurement Model Construction for Railway Construction Projects. Int. J. Environ. Res. Public Health 2022, 19, 11379. [Google Scholar] [CrossRef]
  8. Xiao, Y.; Huang, H.; Qian, X.M.; Zhang, L.Y.; An, B.W. Can new-type urbanization reduce urban building carbon emissions? New evidence from China. Sustain. Cities Soc. 2023, 90, 2210–6707. [Google Scholar] [CrossRef]
  9. Wang, G.Y.; Zhou, J.S. Energy endowment, energy capacity aggregation and carbon emissions in China-empirical analysis based on spatial Durbin model. Front. Environ. Sci. 2022, 10, 1769. [Google Scholar] [CrossRef]
  10. Sharma, S.S. Determinants of carbon dioxide emissions: Empirical evidence from 69countries. Appl. Energy 2011, 88, 376–382. [Google Scholar] [CrossRef]
  11. Murshed, M. An empirical analysis of the non-linear impacts of ICT-trade openness on renewable energy transition, energy efficiency, clean cooking fuel access and environmental sustainability in South Asia. Environ. Sci. Pollut. Res. 2020, 27, 36254–36281. [Google Scholar] [CrossRef] [PubMed]
  12. Yeh, J.; Liao, C. Impact of population and economic growth on carbon emissions in Taiwan using an analytic tool STIRPAT. Sustain. Environ. Res. 2017, 27, 41–48. [Google Scholar] [CrossRef] [Green Version]
  13. Shao, Y. Does FDI affect carbon intensity? New evidence from dynamic panel analysis. Int. J. Clim. Chang. Strateg. Manag. 2017, 10, 27–42. [Google Scholar] [CrossRef] [Green Version]
  14. Fan, J.Q.; Hu, W.R.; Wu, Y.G.; Zhou, R.P. Analysis of Characteristics and Factors Influencing Urban Carbon Emissions Based on Decoupling Index and LMDI, Using Ordos City in Inner Mongolia as an Example. Pol. J. Environ. Stud. 2022, 31, 5649–5660. [Google Scholar] [CrossRef]
  15. Guo, F.P.; Zhang, L.J.; Wang, Z.F.; Ji, S.B. Research on Determining the Critical Influencing Factors of Carbon Emission Integrating GRA with an Improved STIRPAT Model: Taking the Yangtze River Delta as an Example. Int. J. Environ. Res. Public Health 2022, 19, 8791. [Google Scholar] [CrossRef]
  16. Wang, L.H.; Yin, K.D.; Cao, Y.; Li, X.M. A New Grey Relational Analysis Model Based on the Characteristic of Inscribed Core (IC-GRA) and Its Application on Seven-Pilot Carbon Trading Markets of China. Int. J. Environ. Res. Public Health 2018, 16, 99. [Google Scholar] [CrossRef] [PubMed] [Green Version]
  17. Shahbaz, M.; Adnan, H.Q.M.; Kumar, T.A.; Leitao, N.C. Economic growth, energy consumption, financial development, international trade and CO2 emissions in Indonesia. Renew. Sustain. Energy Rev. 2013, 25, 231–242. [Google Scholar] [CrossRef] [Green Version]
  18. Zeng, S.; Wang, M. Theoretical and empirical analyses on the factors affecting carbon emissions: Case of Zhejiang Province, China. Environ. Dev. Sustain. 2023, 25, 2522–2549. [Google Scholar] [CrossRef]
  19. Tao, A.X. Study on the path of coordinated development between carbon emission reduction and economy in Guangdong Province. Energy Rep. 2022, 6, 477–481. [Google Scholar] [CrossRef]
  20. Wang, Z.; Yin, F.; Zhang, Y.; Zhang, X. An empirical research on the influencing factors of regional CO2 emissions: Evidence from Beijing city, China. Appl. Energy 2012, 100, 277–284. [Google Scholar] [CrossRef]
  21. Hardt, L.; Owen, A.; Brockway, P.; Heun, M.K.; Barrett, J.; Taylor, P.G.; Foxon, T.J. Untangling the drivers of energy reduction in the UK productive sectors: Efficiency or offshoring? Appl. Energy 2018, 223, 124–133. [Google Scholar] [CrossRef]
  22. Guo, M.Y.; Chen, S.L.; Zhang, J.; Meng, J. Environment Kuznets Curve in transport sector’s carbon emission: Evidence from China. J. Clean. Prod. 2022, 371, 133504. [Google Scholar] [CrossRef]
  23. Wen, M.; Li, M.X.; Erum, N.; Hussain, A.; Xie, H.Y.; Khan, H.S. Revisiting Environmental Kuznets Curve in Relation to Economic Development and Energy Carbon Emission Efficiency: Evidence from Suzhou, China. Energies 2022, 15, 62. [Google Scholar] [CrossRef]
  24. Grossman, G.M.; Krueger, A.B. Environmental Impacts of a North American Free trade Agreement. Soc. Sci. Electron. Publ. 1991, 8, 223–250. [Google Scholar] [CrossRef]
  25. Frank, B.; Philipp, P. Global Environmental Governance: Taking Stock, Moving Forward. Annu. Rev. Environ. Resour. 2008, 33, 277–294. [Google Scholar] [CrossRef]
  26. Nourhane, H.; Dalia, M.I.; Sanhita, S.; Khadiga, M.E.; Rehab, R.E.; Narayan, S. Assessing the role of green economy on sustainable development in developing countries. Heliyon 2023, 6, 2405–8440. [Google Scholar] [CrossRef]
  27. Munitlak, I.O.; Zubovic, J.; Mitic, P. Relationship Between Sustainable Development and Green Economy-emphasis on Green Finance and Banking. Ekon. Poljopr.-Econ. Agric. 2017, 4, 1467–1482. [Google Scholar] [CrossRef] [Green Version]
  28. Yu, B.; Fang, D.; Kleit, A.N.; Xiao, K. Exploring the Driving Mechanism and the Evolution of the Low-Carbon Economy Transition: Lessons from OECD developed Countries. World Econ. 2022, 45, 1. [Google Scholar] [CrossRef]
  29. Jiang, J.H. The decomposition and policy meaning of China’s carbon emission intensity. Evol. Institutional Econ. Rev. 2017, 14, 295–310. [Google Scholar] [CrossRef]
  30. Gan, C.; Wang, K.; Voda, M. Decoupling relationship between carbon emission and economic development in the service sector: Case of 30 provinces in China. Environ. Sci. Pollut. Res. 2022, 29, 63846–63858. [Google Scholar] [CrossRef]
  31. Wu, X.; Liao, H. A gained and lost dominance score method with conflict analysis for green economy development evaluation. Ann. Oper. Res. 2022, 316, 623–655. [Google Scholar] [CrossRef]
  32. Zheng, W.D.; Zhang, L.N.; Hu, J.B. Green credit, carbon emission and high quality development of green economy in China. Energy Rep. 2022, 8, 12215–12226. [Google Scholar] [CrossRef]
  33. Hou, C.; Chen, H.; Long, R. Coupling and coordination of China’s economy, ecological environment and health from a green production perspective. Int. J. Environ. Sci. Technol. 2022, 19, 4087–4106. [Google Scholar] [CrossRef]
  34. Zhang, F.; Qi, Y. Research on the Performance Evaluation Index System Construction and Countermeasure of Low-carbon Economic Development in China. IOP Conf. Ser. Earth Environ. Sci. 2020, 440, 042058. [Google Scholar] [CrossRef]
  35. Dou, C.B.; Zheng, L.; Wang, W.J.; Shabaz, M. Evaluation of Urban Environmental and Economic Coordination Based on Discrete Mathematical Model. Math. Probl. Eng. 2021, 2021, 1566538. [Google Scholar] [CrossRef]
  36. Wang, M.; Zhao, X.L.; Gong, Q.X.; Ji, Z.G. Measurement of Regional Green Economy Sustainable Development Ability Based on Entropy Weight-Topsis-Coupling Coordination Degree—A Case Study in Shandong Province, China. Sustainability 2019, 11, 280. [Google Scholar] [CrossRef] [Green Version]
  37. Rao, C.J.; Gao, Y. Evaluation Mechanism Design for the Development Level of Urban-Rural Integration Based on an Improved TOPSIS Method. Mathematics 2022, 10, 380. [Google Scholar] [CrossRef]
  38. Shi, B.F.; Yang, H.F.; Wang, J.; Zhao, J.X. City Green Economy Evaluation: Empirical Evidence from 15 Sub-Provincial Cities in China. Sustainability 2016, 8, 551. [Google Scholar] [CrossRef] [Green Version]
  39. Meng, B.; Chi, G.T. Evaluation index system of green industry based on maximum information content. Singap. Econ. Rev. 2018, 63, 229–248. [Google Scholar] [CrossRef]
  40. Zhang, F.; Wang, X.; Liu, X. Research on Functional Value Estimation and Development Mode of Green Infrastructure Based on Multi-Dimensional Evaluation Model: A Case Study of China. Land 2022, 11, 1603. [Google Scholar] [CrossRef]
  41. Wang, S.; Wang, X.; Lu, B. Is resource abundance a curse for green economic growth? evidence from developing countries. Resour. Policy 2022, 75, 102533. [Google Scholar] [CrossRef]
  42. Taedong, L.; Jeroen, V.D.H. Does the knowledge economy advance the green economy? an evaluation of green jobs in the 100 largest metropolitan regions in the United States. Energy Environ. 2019, 30, 141–155. [Google Scholar] [CrossRef]
  43. Alan, B.; Pawel, D.; Sebastian, B.; Krzysztof, S.; Szymon, C. Efficiency of Environmental Protection Expenditures in EU Countries. Energies 2021, 14, 8443. [Google Scholar] [CrossRef]
  44. Shen, J.; Sun, Y. Index System for the Evaluation of Regional Green GDP Based on DPSIR Model. Hohai Univ. J. Hohai Univ. 2016, 61–66, 100–101. Available online: https://kns.cnki.net/KCMS/detail/detail.aspx?dbname=cjfd2016&filename=hhzx201606010&dbcode=cjfq (accessed on 12 June 2023).
  45. Liu, X.; Pei, T.; Zhou, C.; Du, Y.; Ma, T.; Xie, C.; Xu, J. A systems dynamic model of a coal-based city with multiple adaptive scenarios: A case study of ordos, China. Sci. China Earth Sci. 2018, 61, 15. [Google Scholar] [CrossRef]
  46. Huang, H.; Zhou, J. Study on the Spatial and Temporal Differentiation Pattern of Carbon Emission and Carbon Compensation in China’s Provincial Areas. Sustainability 2022, 14, 7627. [Google Scholar] [CrossRef]
  47. Huang, B.; Wu, B.; Barry, M. Geographically and temporally weighted regression for modeling spatiotemporal variation in house prices. Int. J. Geogr. Inf. Sci. 2010, 24, 383–401. [Google Scholar] [CrossRef]
  48. Li, G.l.; Zong, J. Research on the Impact of Energy Conservation and Environmental Protection Expenditures on Carbon Emissions from the Perspective of Fiscal Decentralization. J. Lanzhou Univ. Financ. Econ. 2021, 1, 83–94. (In Chinese). Available online: https://kns.cnki.net/KCMS/detail/detail.aspx?dbname=cjfd2021&filename=sxgz202101008&dbcode=cjfq (accessed on 12 June 2023).
  49. Jaruwan, C. Driving forces of energy-related co 2 emissions based on expanded IPAT decomposition analysis: Evidence from ASENA and four selected countries. Energies 2019, 12, 764. [Google Scholar] [CrossRef] [Green Version]
  50. Nasir, M.A.; Canh, N.P.; Lan, T.N. Environmental degradation & role of financialisation, economic development, industrialisation and trade liberalisation. J. Environ. Manag. 2021, 277, 111471. [Google Scholar] [CrossRef]
  51. Huang, J.H.; Duan, W.Y.; Zhou, Q.; Zeng, H. Methodology for carbon emission flow calculation of integrated energy systems. Energy Rep. 2022, 8, 1090–1097. [Google Scholar] [CrossRef]
  52. Xu, R.F.; Gao, J.Z. Evolutionary Trends, Regional Differences and Influencing Factors of the Green Efficiency of Agricultural Water Use in China Based on WF-GTWR Model. Int. J. Environ. Res. Public Health 2023, 20, 1946. [Google Scholar] [CrossRef] [PubMed]
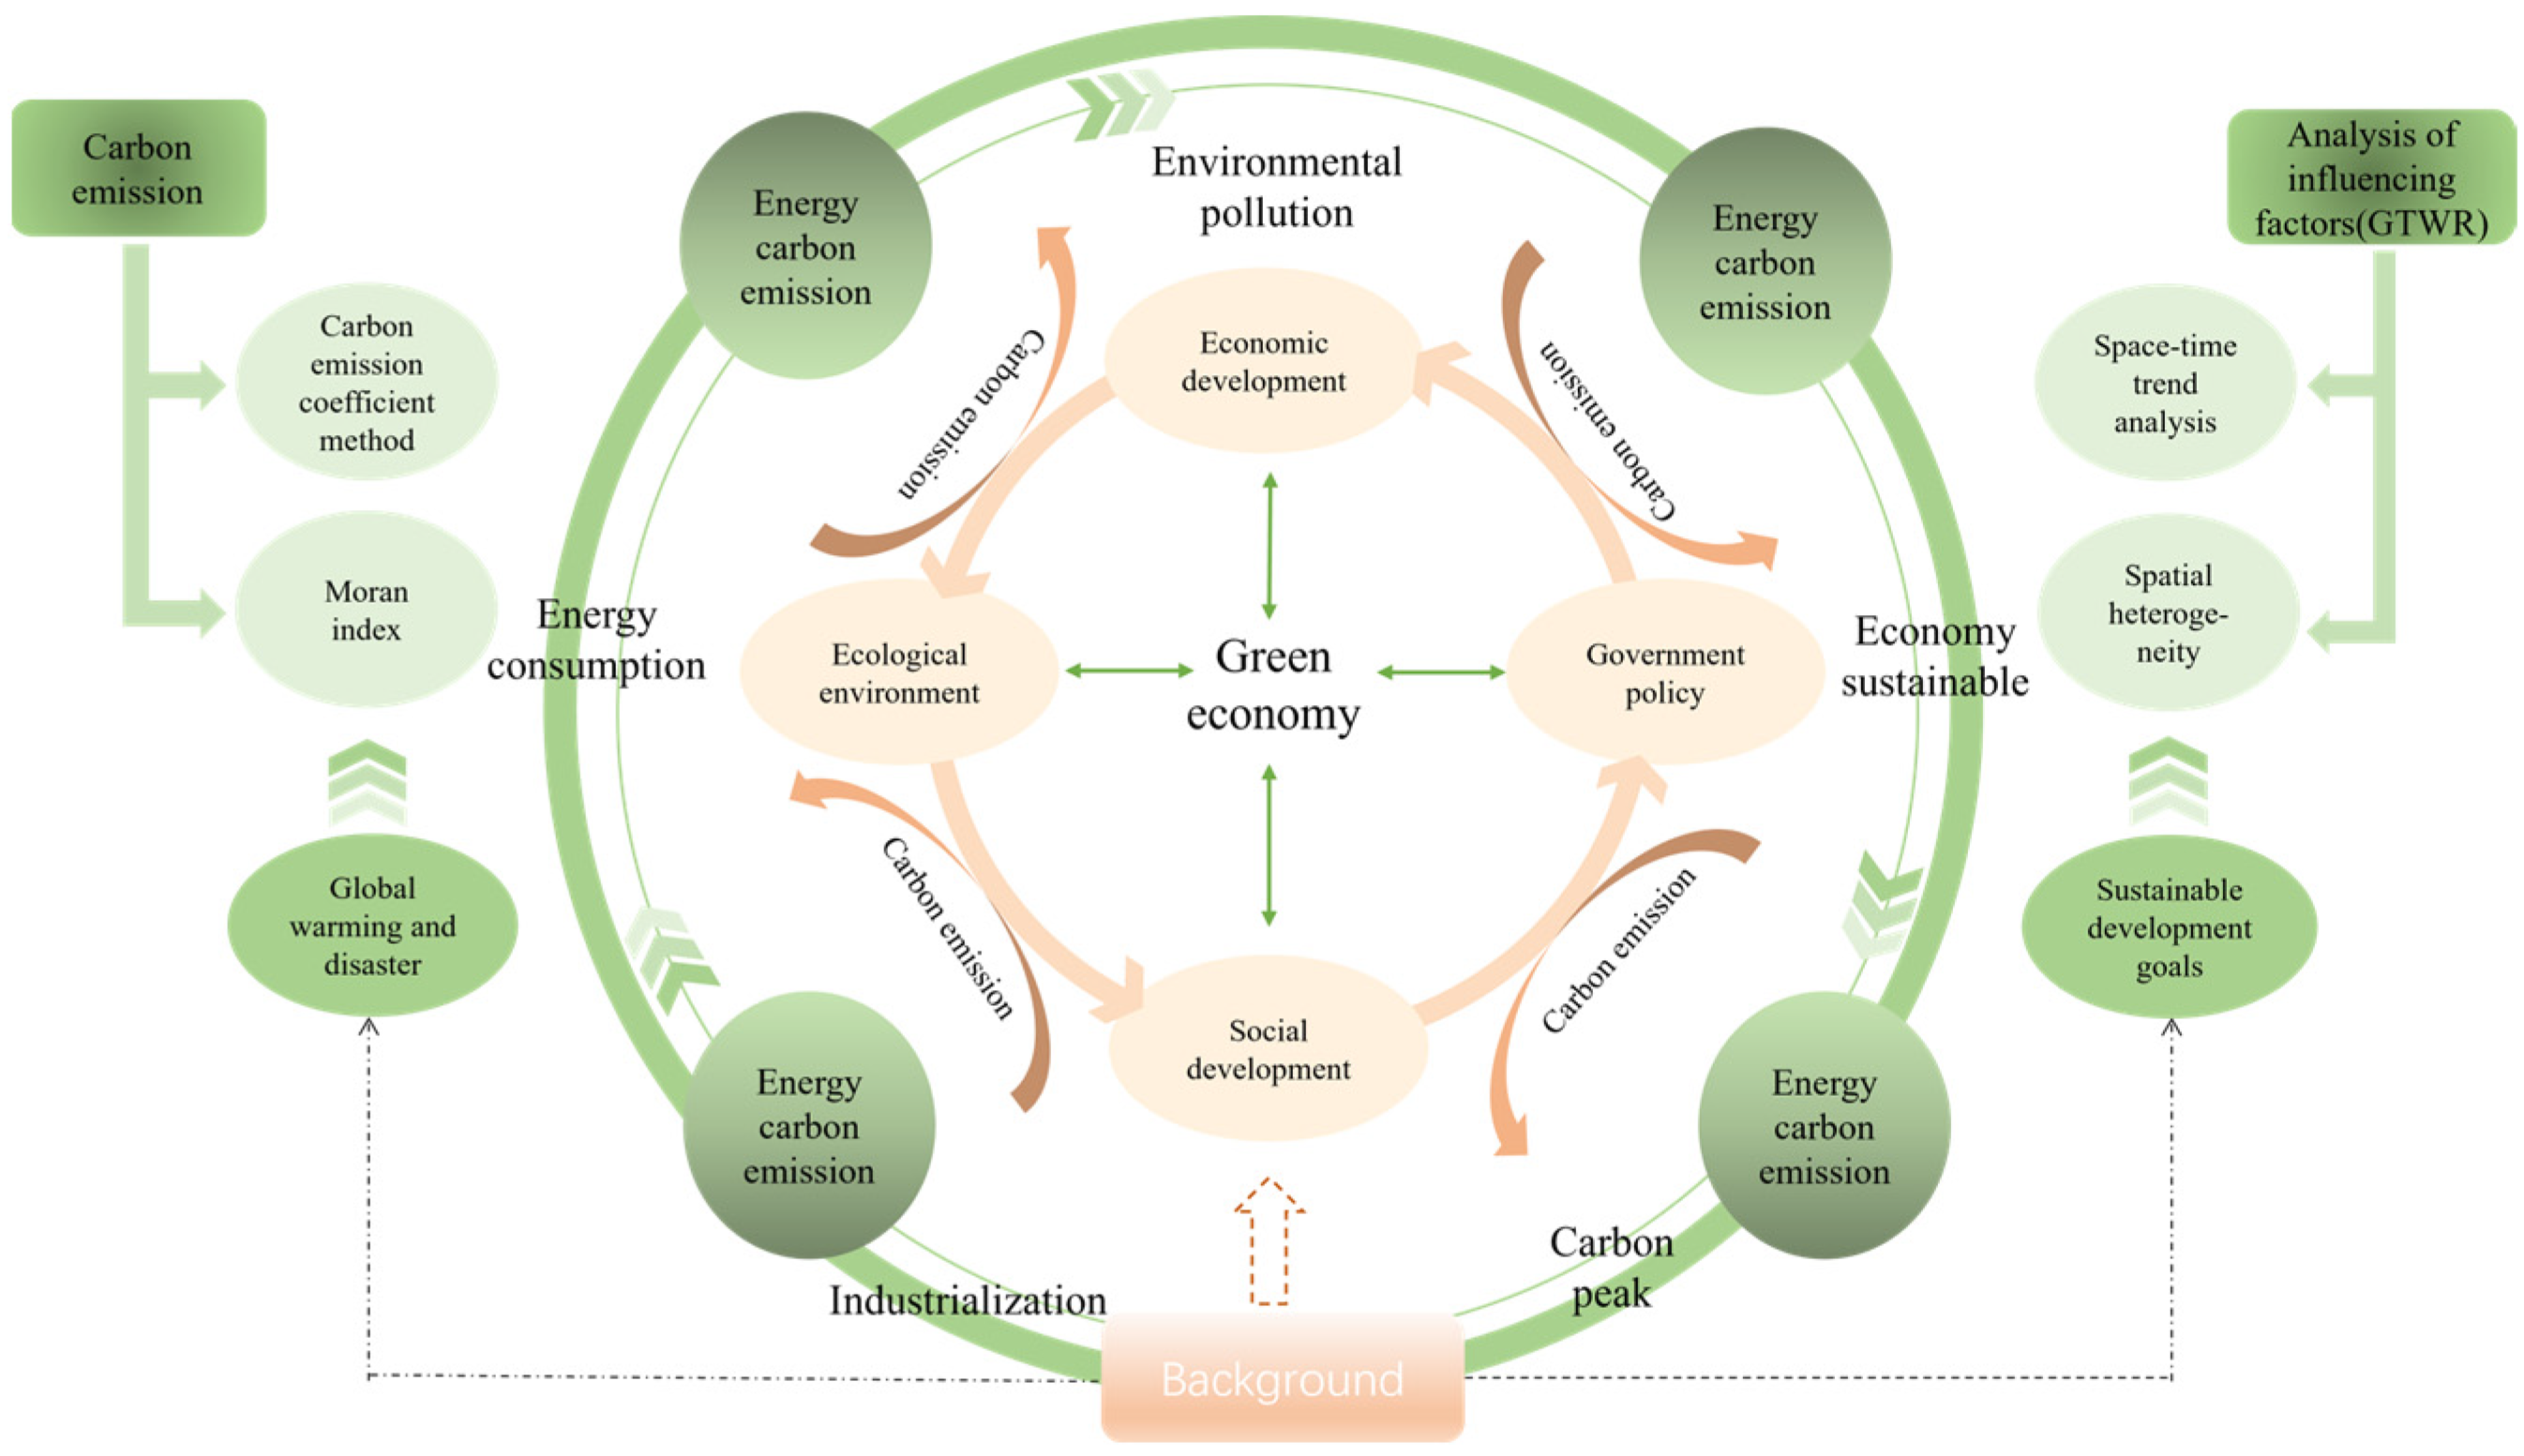
Figure 1. Research framework.
Sustainability 15 10965 g001
Figure 2. Study area.
Sustainability 15 10965 g002
Figure 3. Methodological flowchart.
Sustainability 15 10965 g003
Figure 4. Temporal and spatial variation trend of carbon emissions.
Sustainability 15 10965 g004
Figure 5. Moran’s I chart of average carbon emissions.
Sustainability 15 10965 g005
Figure 6. Correlation heat map.
Sustainability 15 10965 g006
Figure 7. Spatio-temporal change trend diagram under four dimensions: (a) economic development; (b) social development; (c) ecological environment; and (d) governmental policy.
Sustainability 15 10965 g007
Figure 8. The spatial heterogeneity of the influencing factors as per each dimension: (a1) consumer price index; (a2) per capita disposable income; (a3) industrial structure upgrading coefficient; (b1) per capita urban road area; (b2) urbanization rate; (b3) population size; (c1) per capita park green area; (c2) green coverage rate of built-up area; (c3) sulfur dioxide emissions; (d1) science and technology expenditure; (d2) environmental protection expenditure; and (d3) domestic waste harmless treatment rate.
Sustainability 15 10965 g008
Figure 9. Regression results of key factors of energy carbon emissions at various stages based on green economy.
Sustainability 15 10965 g009
Figure 10. Heterogeneity estimation of the influencing factors of energy carbon emissions from 2004 to 2011, before the United Nations defined the green economy. It includes (a) the regional regression coefficient map from 2004 to 2011; (b) the distribution of regression coefficients across various regions from 2004 to 2011; and (c) the mean values of regression coefficients in the eastern, central, and western regions from 2004 to 2011.
Sustainability 15 10965 g010
Figure 11. Heterogeneity estimation of factors influencing energy carbon emissions from 2012 to 2020, following the United Nations’ definition of the green economy. It includes (a) the mean regional regression coefficient map from 2012 to 2020; (b) the distribution of regional regression coefficients from 2012 to 2020; and (c) the mean regression coefficient map across eastern, central, and western regions from 2012 to 2020.
Sustainability 15 10965 g011
Table 1. Green economy system.
Target Layer (A)Criterion Layer (B)Indicator IdentificationIndex Layer (C)UnitIndicator IdentificationReference
Green economyEconomic developmentB1Consumer price index (CPI)%C1[35]
Per capita disposable incomeCNYC2[32]
Industrial structure upgrading coefficient C3[33]
Social developmentB2Road area per citizenm2C4[36]
Urbanization rate%C5[37]
Population sizepeopleC6[38]
Ecological environmentB3Per capita park green aream2/peopleC7[39]
Greenery coverage rate of built-up area%C8[40]
Sulfur dioxide emissions104 tonsC9[41]
Government policyB4Science and technology expenditure108 CNYC10[42]
Environmental protection expenditure108 CNYC11[43]
Decontamination rate of urban refuse%C12[44]
Disclaimer/Publisher’s Note: The statements, opinions and data contained in all publications are solely those of the individual author(s) and contributor(s) and not of MDPI and/or the editor(s). MDPI and/or the editor(s) disclaim responsibility for any injury to people or property resulting from any ideas, methods, instructions or products referred to in the content.