Article

How to Distribute Green Products in Competition with Brown Products? Direct Selling versus Agent Selling?

1
School of Economics and Management, Changsha University of Science and Technology, Changsha 410114, China
2
School of Business, Central South University, Changsha 410083, China
3
School of Transportation and Logistics, Central South University of Forestry and Technology, Changsha 410004, China
*
Author to whom correspondence should be addressed.
Sustainability 2023, 15(14), 10961; https://doi.org/10.3390/su151410961
Submission received: 14 June 2023 / Revised: 8 July 2023 / Accepted: 11 July 2023 / Published: 13 July 2023

Abstract

:
In order to respond to and take advantage of consumers’ growing interest in green products, an increasing number of firms are expanding their market share by introducing green versions of their brown products. However, firms are faced with the challenge of how to distribute green products to avoid mutual encroachment with brown products. To solve this problem, this paper constructs a Stackelberg game model consisting of a manufacturer (leader) and a retailer (follower), in which the manufacturer provides brown and green products, and then develops two channel structures for green products to be sold through the manufacturer (direct selling) and the retailer (agent selling). The results show that the manufacturer’s choice of green product distribution channels is affected by the direct selling costs and the market share of green consumers and their product preferences. When the direct selling cost is zero or consumers are green, the manufacturer always chooses direct selling. However, with an increase in the direct selling costs, if green consumers have a large difference in their preference for green and brown products, the manufacturer chooses agent selling, and vice versa. In particular, the impact of the market share of green consumers on the profits of the manufacturer is different in the two channel structures. The higher the market share of green consumers under agent selling, the more beneficial it is for the manufacturer. However, under direct selling, the profits of the manufacturer show an “inverted U” trend with the increase in the market share of green consumers. In addition, under certain conditions, the direct selling channels opened by the manufacturer are not necessarily to sell green products, but to maximize the market share of brown products. The strategy is to set high prices for green products in direct selling channels to stimulate consumers to buy brown products. These findings can provide insights for manufacturers to design appropriate green product distribution strategies.

1. Introduction

An increasing number of companies have realized that it is difficult to meet consumers’ green needs by only producing brown products [1]. In order to respond to and capitalize on consumers’ growing demand for green products [2,3,4], companies are expanding their market share by introducing green versions of their brown products [5,6,7,8]. For example, BMW and Toyota are developing new energy vehicles while producing gasoline vehicles [9]. However, producing two products can lead to market cannibalization, which causes companies to face a decision on how to allocate sales of green products under traditional retail channels. Specifically, the following two distribution channels are considered: one, direct selling, where manufacturers sell green products directly to consumers, while brown products are sold through intermediary retailers; two, agent selling, where manufacturers simultaneously sell green products and brown products through intermediary retailers. Both allocation structures are common in business practice. For example, Haier, Midea, Hisense, Xiaomi, TCL, etc., sell energy-saving home appliances through the green home appliance section of the Tmall platform to differentiate their sales channels from brown products. In Walmart supermarkets, you can also see brown products and green products displayed on the shelves (such as ordinary milk and organic milk from Mengniu and Yili).
The coexistence of green products and brown products has stimulated interest in studying how manufacturers choose their distribution channels [10,11,12,13,14,15,16,17]. Manufacturers can save channel costs by selling green products and brown products through agency retailers, but it will reduce their control and increase cannibalization between products [18,19]. In addition, it is necessary to pay attention to the factors that affect the manufacturer’s optimal channel selection strategy. In this paper, two important factors are considered: green demand and consumer preference. This is because the difference between green products and brown products is mainly reflected in their impact on the environment, which can be replaced in function [20,21]. Thus, the main driving force for the production of green products comes from the market size of green demand, which affects the manufacturers’ choice of distribution channels. In addition, being environmentally conscious does not mean that consumers will buy green products [22,23,24,25], which implies that the consumers’ preference for green and brown products will affect the manufacturers’ choice of distribution channels by affecting product demand.
In short, this paper aims to explore how manufacturers can develop effective channel allocation strategies for green products when competing with brown products. Specifically, the following research questions are addressed: (i) What are the optimal pricing strategies for manufacturers and retailers under direct and agency sales? (ii) Which channel structure is optimal from the manufacturer’s perspective? (iii) How do green demand scales and consumer product preferences affect the optimal pricing and channel selection strategy? To answer the above questions, this paper constructs a Stackelberg game model consisting of a manufacturer (leader) and a retailer (follower). In the game, the manufacturer produces both brown and green products, and the green product is sold to the final consumer through two channel structures: direct selling or agent selling. This paper explores manufacturers’ channel selection strategies and considers the impact of key factors such as green demand, consumer preferences, etc. Sensitivity analysis is performed and numerical examples are given to reveal the effects of exogenous parameters on the equilibrium results and channel selection strategies theoretically and numerically.
The contribution of this paper can be explained as follows. (1) This article constructs a game model for the competition between green and brown products and studies the distribution strategies of green products. To the best of our knowledge, the existing research mainly focuses on whether to produce green products and confirms that the introduction of green products is profitable [26,27,28]. (2) In this study, a comparison between direct sales and agency sales is considered. The existing literature lacks research on how to sell green products, and the specific channel selection strategies are unclear; therefore, this paper attempts to fill this important gap. (3) This paper considers the impact of green demand and consumer preferences on manufacturers’ channel selection strategies from the demand side, which contributes to research fields such as channel selection and green consumption.
The remainder of this paper is organized as follows. Section 2 reviews the relevant literature and Section 3 describes the game problem. Section 4 introduces the two sales channels: direct selling and agent selling. Section 5 presents our analysis of the results, and the conclusions are presented in Section 6.

2. Literature Review

The research related to our contribution mainly includes the following two categories: the production and sales of green products and channel selection strategies in the supply chain. Then, the authors briefly review and describe our contributions with respect to the most closely related research.

2.1. Production and Sales of Green Products in Supply Chain

Regarding whether to produce green products, some scholars compare supply chain decisions when only producing brown products or only green products [21,29], and they found that when the investment value of green products is high or the unit production cost is low, manufacturers should choose to completely replace brown products with green products. Other scholars pay attention to the production ordering of green products. Dong et al. [30] developed a stylized two-stage model to study investment strategies for green products, in which retailers or manufacturers can decide to continue producing and selling non-green products or transition to green products in the second period. Other scholars discuss the case of companies producing both brown and green products [26,28,31,32]. For example, Agi and Yan [28] constructed three supply chain game models for producing only brown products, only producing green products, and producing both brown and green products. They found that the only producing green products strategy would not be an option for companies and that offering both brown and green products would never reduce market coverage. Shen et al. [32] determined the optimal product line design for green and non-green products based on quality differences and showed that when consumers’ willingness to pay responsibility is high, a dual-product line strategy will take precedence over a single-product line strategy. The above literature explores production line design for green products and provides insights for our paper to construct a competitive game model between green products and brown products. In contrast, our article focuses on how to sell green products rather than production, and explores sales channel selection strategies for green products.
With the improvement in consumers’ environmental awareness, scholars and enterprises have begun to pay attention to the selling strategies of green products. Raza and Govindaluri [33] studied pricing and coordination strategies in supply chains, where manufacturers sell brown products directly and green products through retailers. Conversely, Ranjan and Jha [15] and Wang and Song [16] explored supply chain pricing and green investment strategies by assuming that manufacturers sell green products directly and brown products through retailers. Zhang et al. [17] analyzed the impact of green retailers’ fairness concerns on product greenness levels in a two-level channel of one manufacturer and two retailers, namely one green retailer and one brown retailer. There are also scholars who do not separate sales channels to explore the situation in which retailers sell green and non-green products at the same time. Hosseini-Motlagh et al. [34] investigated retail channels for green and non-green products and optimized green quality levels and warranty decisions for green products through wholesale price contracts. Heydari et al. [35] explored the optimal sales efforts made by retailers to encourage customers to purchase green products rather than non-green products in the supply chain. Shen et al. [36] studied the optimal sales order of retailers, and they found that when the service level of green products is lower than that of non-green products, selling green products first can reduce environmental costs. The above literature only discusses a certain selling channel (direct selling or agent selling) of green products and does not pay attention to channel selection decisions.

2.2. Channel Selection in Supply Chain

There are many studies on the design of channel structures between manufacturers and retailers that explore the influence of different factors on channel selection [36,37,38,39,40]. Desai et al. [41] and Arya and Mittendorf [42] investigated whether a manufacturer should sell durable goods directly to customers or sell through a retailer, finding that manufacturers can earn higher profits in the agent channel than in the direct channel under certain conditions. Yi et al. [14] explored the impact of consumers’ fairness-seeking behavior on manufacturers’ choice of distribution channel structure. They showed that in the presence of strongly fair-minded consumers, it may be in the manufacturer’s best interest to diversify its distribution channels downward by adopting agent sales. Zhao et al. [43] showed that both high-quality and low-quality firms may choose to sell through retailers rather than directly to customers. Zhang et al. [44] configured electronic channels for direct selling, agent selling, or dual-format selling to investigate the impact of channel competition and platform services on manufacturers’ electronic channel configuration strategies. In addition, Shen et al. [36] and Li et al. [38] studied the optimal distribution channel strategies for enterprise software and physical products, respectively. Other scholars have focused on the conversion of distribution channels. Dong et al. [30] studied the dynamic selling strategy of enterprises in two periods under asymmetric market and product information. They found that both direct and agent selling may be optimal in the first stage, while in the second stage, agent sales are never optimal if the manufacturer and the retailer do not share additional market information. The development of e-commerce has also prompted many scholars to discuss the selection of distribution channels under the participation of e-commerce platforms, such as Wang et al. [45], Liu et al. [46], and Cao et al. [47]. However, none of the above papers investigate the channel selection of green products.
Only a few papers have studied the channel selection of green products. For example, Yang et al. [48] considered a two-tier supply chain with green products, where manufacturers produce green products and sell them to final consumers through a single indirect channel or dual channels. They found that if the uncertainty of green level and consumer demand is relatively high, or the green investment cost and degree of environmental responsibility are relatively low, it is easier for manufacturers to establish a dual-channel structure. Zhou and Duan [49] investigated the choice of sales forms (reselling or agent selling) with consumer reference green effects and environmental awareness. The results show that as the reference greenness effect and consumers’ environmental awareness increase, manufacturers will be more inclined toward agent selling than reselling. However, the above literature does not consider the channel allocation strategy under competition with brown products. Zhang et al. [27] compared four channel strategies of selling only brown products, selling only green products, selling green and brown products through one retailer, and selling green and brown products through two retailers, respectively. Their research implies that manufacturers can avoid cannibalization between green and brown products by selling their products through different retailers. Our study is similar to Zhang et al. [27], but considers direct selling channels for green products and focuses on the impact of differences in consumers’ green demands and preferences.
Table 1 summarizes and compares the most relevant studies based on product types, selling channels, key factors, and product competition. Based on Table 1, the following main similarities among the articles and literature gaps can be identified. (1) Most of the existing literature analyzes the situation of replacing brown products with green products, and seldom considers the situation of the selection of sales channels when green products compete with brown products. In fact, the coexistence of green and brown products is more realistic, but most of the literature has not conducted in-depth research on this. (2) Most of the literature only discusses one of the sales modes of direct selling or agent selling, rarely compares direct selling with agent selling, and lacks relevant opinions on the selection of distribution channels. (3) There is a lack of comprehensive consideration of the consumer market factors that affect channel distribution in much of the literature. In practice, green demand and consumer preferences are the key factors driving the green transformation of enterprises.

3. Problem Description

Our study examines the problems of product pricing and the choice of sales channel for a two-level supply chain consisting of a manufacturer (m) and a retailer (r). The manufacturer produces both brown (b) and green products (g) and sells them to consumers through two models, direct selling or agent selling, as shown in Figure 1. In the direct selling model, the manufacturer sells brown and green products separately. Brown products are sold to the retailer at price w t and to consumers at price p b , and green products are sold by the manufacturer directly to the market at price p g . Although the manufacturer sets a direct sales channel to reduce the part of an intermediary, the direct sales channel also incurs sales costs, such as advertising and platform construction. Referring to the study of Zhang et al. [50], this paper supposes that the sales cost per unit of green product through the direct sales channel is c v . In the agent selling model, the manufacturer sells brown and green products to the retailer at wholesale prices w b and w g , and the retailer sells the products to consumers at prices p b and p g , respectively. Let c b and c g represent the unit production costs of brown and green products, respectively. The superscripts D and A denote direct selling and agent selling, respectively, and are expressed as i { D , A } .
Consider a market composed of two types of consumers, brown consumers (B) and green consumers (G), and the market size is normalized to 1 [26]. The proportion of green consumers in the market is γ , and these consumers may buy both green and brown products, while the proportion of brown consumers is 1 γ and buy only brown products [28,32]. Suppose that the value of the brown products derived by brown consumers is v ( v ~ U [ 0 , 1 ] ), and v is uniformly distributed in the interval [0, 1]. Let α 1 v and α 2 v denote the value of the brown products and green products, respectively, derived by green consumers, where 0 < α 1 < 1 < α 2 [28]. This indicates that green consumers have a higher perceived value of purchasing green products rather than brown products.
Consumers are rational and maximize their net utility, given by the difference of their valuation of the product and its price. That is, a brown consumer obtains utility ( U b B = v p b ) from the brown product, and a green consumer obtains utility ( U b G = α 1 v p b ) from the brown product and utility ( U g G = α 2 v p g ) from the green product. The brown consumer purchases the brown product if U b B > 0 . Likewise, the green consumers purchase the green product if U g G > 0 and U g G > U b G . Otherwise, they purchase the brown product if U b G > 0 and U g G < U b G . According to U g G > 0 and U b G > 0 , v > p b / α 1 and v > p g / α 2 are obtained. Let U g G = U b G , then v = ( p g p b ) / ( α 2 α 1 ) is obtained. For analysis, let v 1 = p b / α 1 , v 2 = p g / α 2 , and v 3 = ( p g p b ) / ( α 2 α 1 ) . Thus, when v max { v 2 , v 3 } , green consumers buy green products, and when v 2 v v 3 , they buy brown products. Accordingly, the demand for brown and green products is:
d b = 1 γ 1 p b if p g < α 2 p b α 1 1 γ 1 p b + γ p g p b α 2 α 1 p b α 1 if α 2 p b α 1 < p g < p b + α 2 α 1 1 γ 1 p b + γ 1 p b α 1 + if p g > p b + α 2 α 1
d g = γ 1 p g α 2 i f p g < α 2 p b α 1 γ 1 p g p b α 2 α 1 i f α 2 p b α 1 < p g < p b + α 2 α 1 0 i f p g > p b + α 2 α 1
Let D 1 be the demand satisfying the condition p g < α 2 p b / α 1 , indicating that the price of green products is lower, which attracts green consumers to buy only green products. Let D 2 be the demand satisfying the condition α 2 p b / α 1 < p g < p b + α 2 α 1 , under which the increase in the price of green products prompts some green consumers to buy brown products. Let D 3 be the demand satisfying the condition p g > p b + α 2 α 1 , which means that the price of green products is higher, and green consumers only buy brown products. Based on the above, this paper constructs a Stackelberg game model with a manufacturer as the leader and a retailer as the follower and compares the pricing and profits of the manufacturer and the retailer under two sales models, namely direct selling and agent selling. The notations used in this study are listed in Table 2.

4. Green Product Selling Channels

The main purpose of this study is to describe the manufacturer’s optimal choice of distribution channels for green products when competing with brown products. In what follows, we first analyze the direct selling case, where the manufacturer sells green products by himself, and then examine the counterpart case, where agent selling is adopted. Based on these analyses, a constructive comparison of direct selling and agent selling is made. By doing so, the details of a manufacturer’s preference for one distribution channel over another are identified.

4.1. Direct Selling

In the direct selling model, the manufacturer establishes channels to sell green products directly and sell brown products through the retailer. Thus, in this model, the manufacturer first decides the wholesale price w b D of brown products and the selling price p g D of green products; the retailer then decides the retail price p b D of brown products. The profit functions of the retailer and manufacturer are, respectively:
π r D = p b D w b D d b
π m D = w b D c b d b + d g p g D c g c v
The profits of the retailer and manufacturer are the sum of the revenue from selling both brown and green products. The retail price under different demand scenarios ( D 1 , D 2 , and D 3 ) is solved through backward induction. The results are shown in Proposition 1.
Proposition 1.
Under direct selling, given w b D and p g D , the retailer’s optimal retail prices are: (1) Under D 1 , when w b D > 2 p g D α 1 / α 2 1 , then p b D * = 1 + w t D / 2 ; (2) Under D 2 , when p g D + α 1 α 2 2 A α 1 γ + α 1 α 1 α 2 / A < w b D < α 1 p g D A + α 1 p g D α 2 A α 2 γ / α 2 A , then p b D * = w b D + α 1 γ p g D + A α 2 γ / A ; (3) Under D 3 , when w b D < 2 p g D α 2 + α 1 α 1 / B , then p b D * = α 1 + B w b D / 2 B , where A = α 2 γ + α 1 1 γ α 2 α 1 , B = γ + α 1 γ α 1 . (All proofs are in Appendix A).
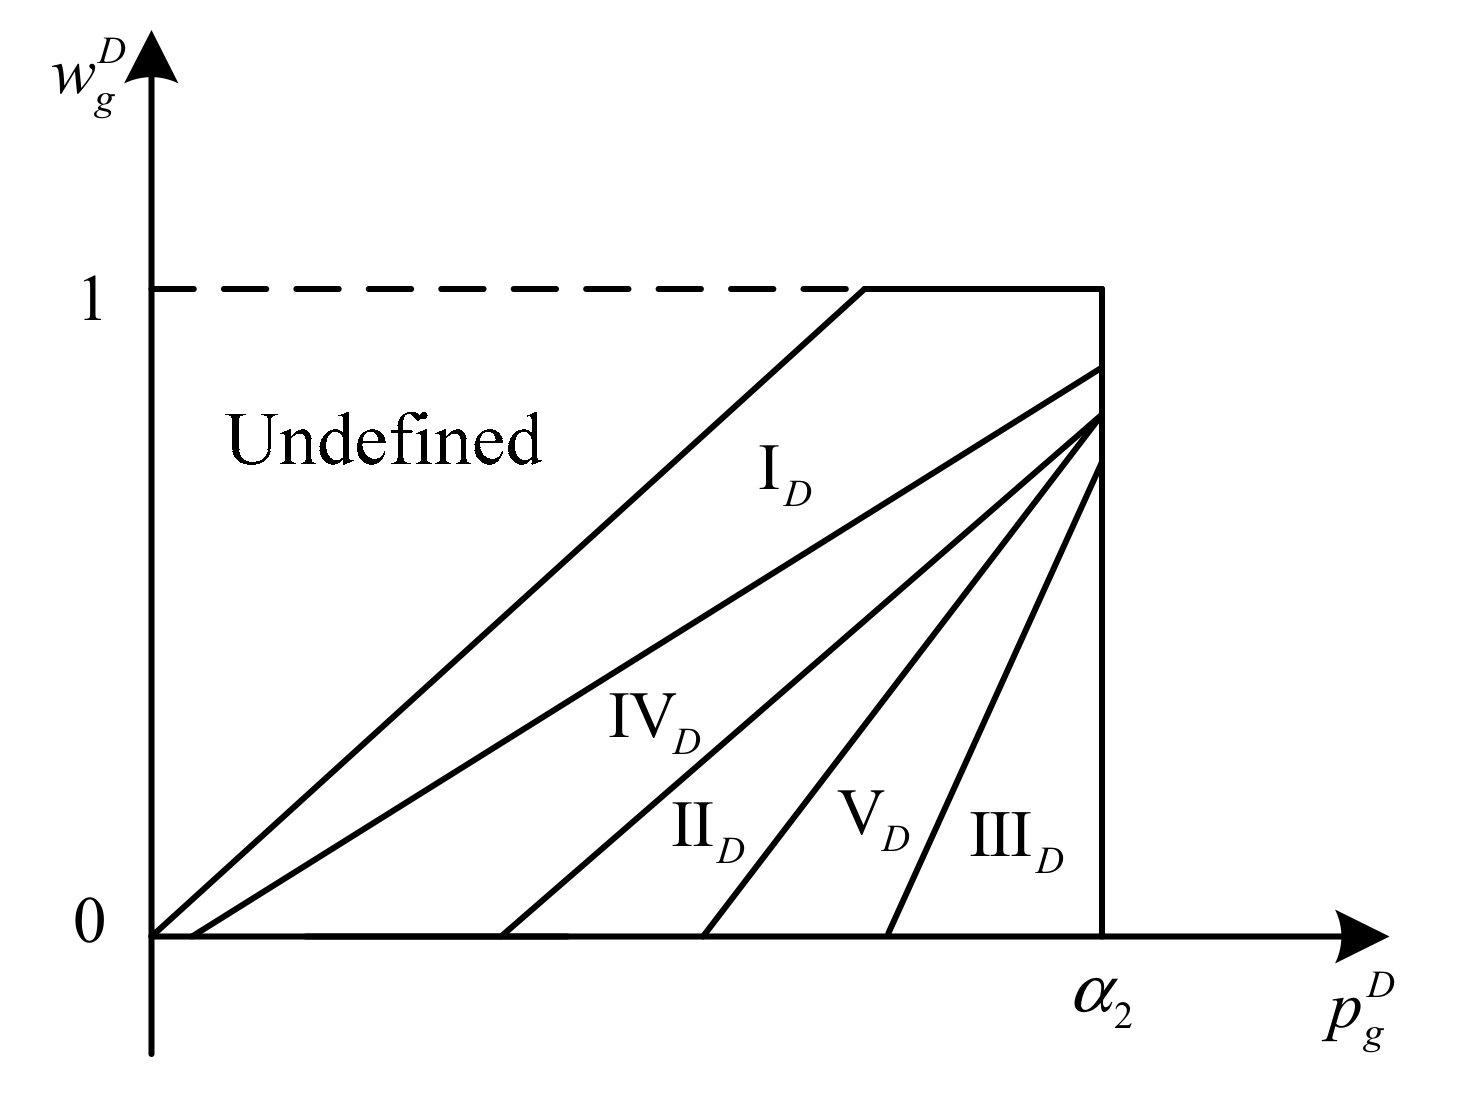
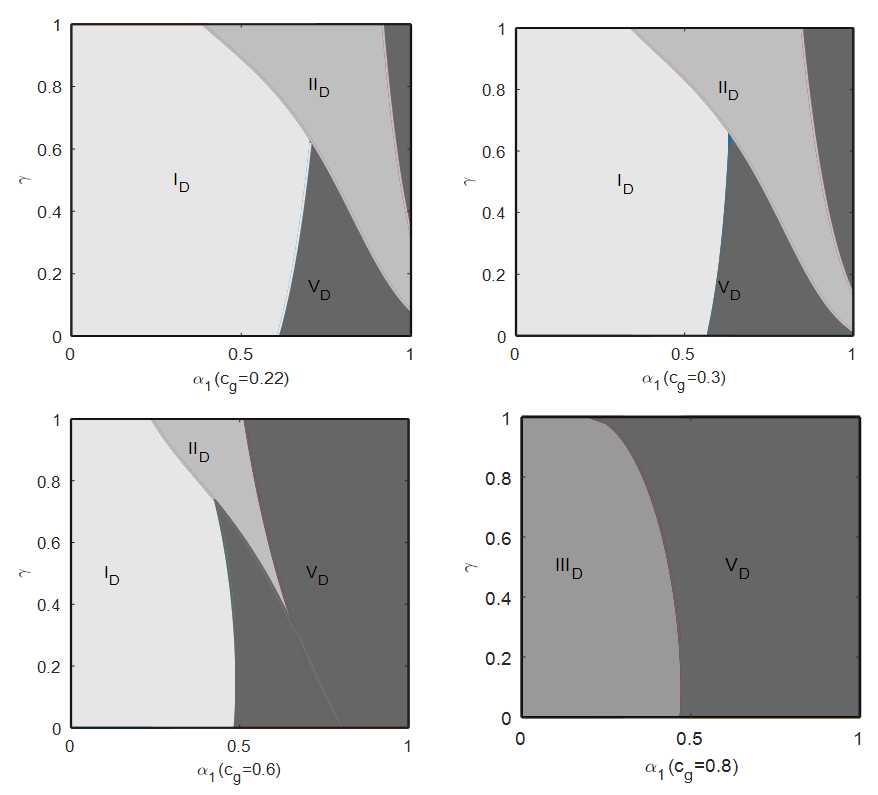
As Proposition 1 shows, when w b D and p g D meet different conditions, the optimal retail prices differ. However, there is an overlap between the conditions of D 1 , D 2 , and D 3 ; therefore, the retailer’s pricing strategy can be further clarified. First, according to the characteristics of green and brown products, the feasible regions of w b D and p g D are obtained, which satisfies Ω D { p g D > w b D , w b D < p t D < 1 , p g D < α 2 } . Second, according to Proposition 1 and the profit maximization principle, the pricing decision of the retailer can be determined by comparing its profits under different demand scenarios. Hence, plugging p b D * into the retailer’s profit function and obtaining the retailer’s profit functions under D 1 , D 2 , and D 3 , which are recorded as π r 1 D , π r 2 D , and π r 3 D , respectively. By comparing π r 1 D , π r 2 D , and π r 3 D , five regions— I D , II D , III D , IV D , and V D —are obtained, as shown in Figure 2. Here, strategies I D , II D , and III D correspond to demands D 1 , D 2 , and D 3 , respectively. The strategies IV D and V D correspond to the critical values of demands D 1 , D 2 , and D 3 ; namely, the scenarios p g D = α 2 p b D / α 1 and p g D = p b D + α 2 α 1 .
When p g D = α 2 p b D / α 1 , the demands for brown and green products are d b = 1 γ α 2 α 1 p g D / α 2 and d g = γ α 2 p g D / α 2 , respectively; therefore, the profit function of the manufacturer is π m D = γ p g D c v c g α 2 p g D + 1 γ w b D c b α 2 p g D α 1 / α 2 . This increases monotonically with respect to w t D . Hence, w b D = 2 p g D α 1 / α 2 1 , and the corresponding strategy is IV D . When p g D = p b D + α 2 α 1 , the demands for these two kinds of products are d g = 0 and d b = 1 γ 1 p g D + A γ p g D / α 1 , respectively; therefore, the profit function of the manufacturer is π m D = w b D c b 1 γ 1 p g D + A γ p g D / α 1 . This increases monotonically with respect to w b D . Hence, w b D = 2 A p g D + α 1 α 2 A + γ α 2 α 1 γ p g D / A , and the corresponding strategy is V D .
According to Figure 1, the manufacturer makes a decision based on the five strategies of the retailer. The results are expressed in Proposition 2.
Proposition 2.
Under direct selling, the optimal decisions of the manufacturer are as follows: (1) Under strategy I D , w b D * = 1 + c b / 2 , p g D * = c g + c v + α 2 / 2 ; (2) Under strategy II D , w b D * = α 1 + B c b / 2 B , p g D * = 1 γ α 1 + c g + c v B + A / 2 B ; (3) Under strategy III D , w b D * = α 1 + B c b / 2 B ; (4) Under strategy IV D , w b D * = 1 γ 1 + c b α 1 2 + γ α 1 c g + c v + α 2 γ α 2 2 1 γ α 1 2 + γ α 2 , p g D * = 1 γ 3 + c b α 1 α 2 + γ α 2 c g + c v + α 2 4 1 γ α 1 2 + 2 γ α 2 ; (5) Under strategy V D , w b D * = c b + α 1 / B / 2 , p g D * = 2 1 γ γ α 1 2 + 3 2 γ 1 A α 1 4 A 2 A B c b 2 B α 1 α 2 γ 2 A .
Proposition 2 presents the equilibrium decisions of the manufacturer in the direct-selling supply chain. It is obvious that the price is increasing in the production costs of green products and brown products. When a manufacturer adopts a low price strategy for green products, the price of green products will increase with the direct sales channel cost and green preference. When adopting a medium pricing strategy, a larger green market size will lead to a decrease in both the green retail price and the brown wholesale price. This is because lowering the green retail price allows manufacturers to occupy more of the green market, while a low brown wholesale price is intended to reduce the retailer’s purchasing cost to earn more revenue from the retailer for brown products. When green consumers prefer green products, the consumers’ willingness to pay for green products will increase, and the green retail prices will increase. Interestingly, a higher green preference increases the brown wholesale prices, suggesting that manufacturers will discourage green consumers from buying brown products and encourage them to switch to green products by increasing the wholesale prices of brown products. In addition, a high price strategy will prevent manufacturers from producing green products, as shown in strategy III D .

4.2. Agent Selling

In the agent selling model, the manufacturer sells green and brown products through the same retailer. The decision sequence in the agent selling model is as follows. First, the manufacturer decides the wholesale prices w b A and w g A , and then the retailer decides the retail prices p b A and p g A of brown and green products based on the wholesale prices. The profit functions of the retailer and manufacturer are, respectively:
π r A = p b A w b A d b + d g p g A w g A
π m A = w b A c b d b + d g w g A c g
Similarly, because there are three demand scenarios, the optimal decisions of the retailer under different scenarios are calculated separately. Then, Proposition 3 is obtained.
Proposition 3.
Under agent selling, given w b A and w g A , the optimal retail prices are: (1) Under D 1 , when w b A > α 1 + w g A α 1 / α 2 1 , then p b A * = 1 + w b A / 2 , p g A * = w g A + α 2 / 2 ; (2) Under D 2 , when w g A + α 1 α 2 < w b A < α 1 w g A + 1 γ 1 α 1 α 1 α 2 / B / α 2 , then p g A * = B w g A + A + α 1 1 γ / 2 B , p b A * = B w b A + α 1 / 2 B ; (3) Under D 3 , when w b A < 2 p g A α 2 + α 1 α 1 / B , then p b A * = B w b A + α 1 / 2 B .
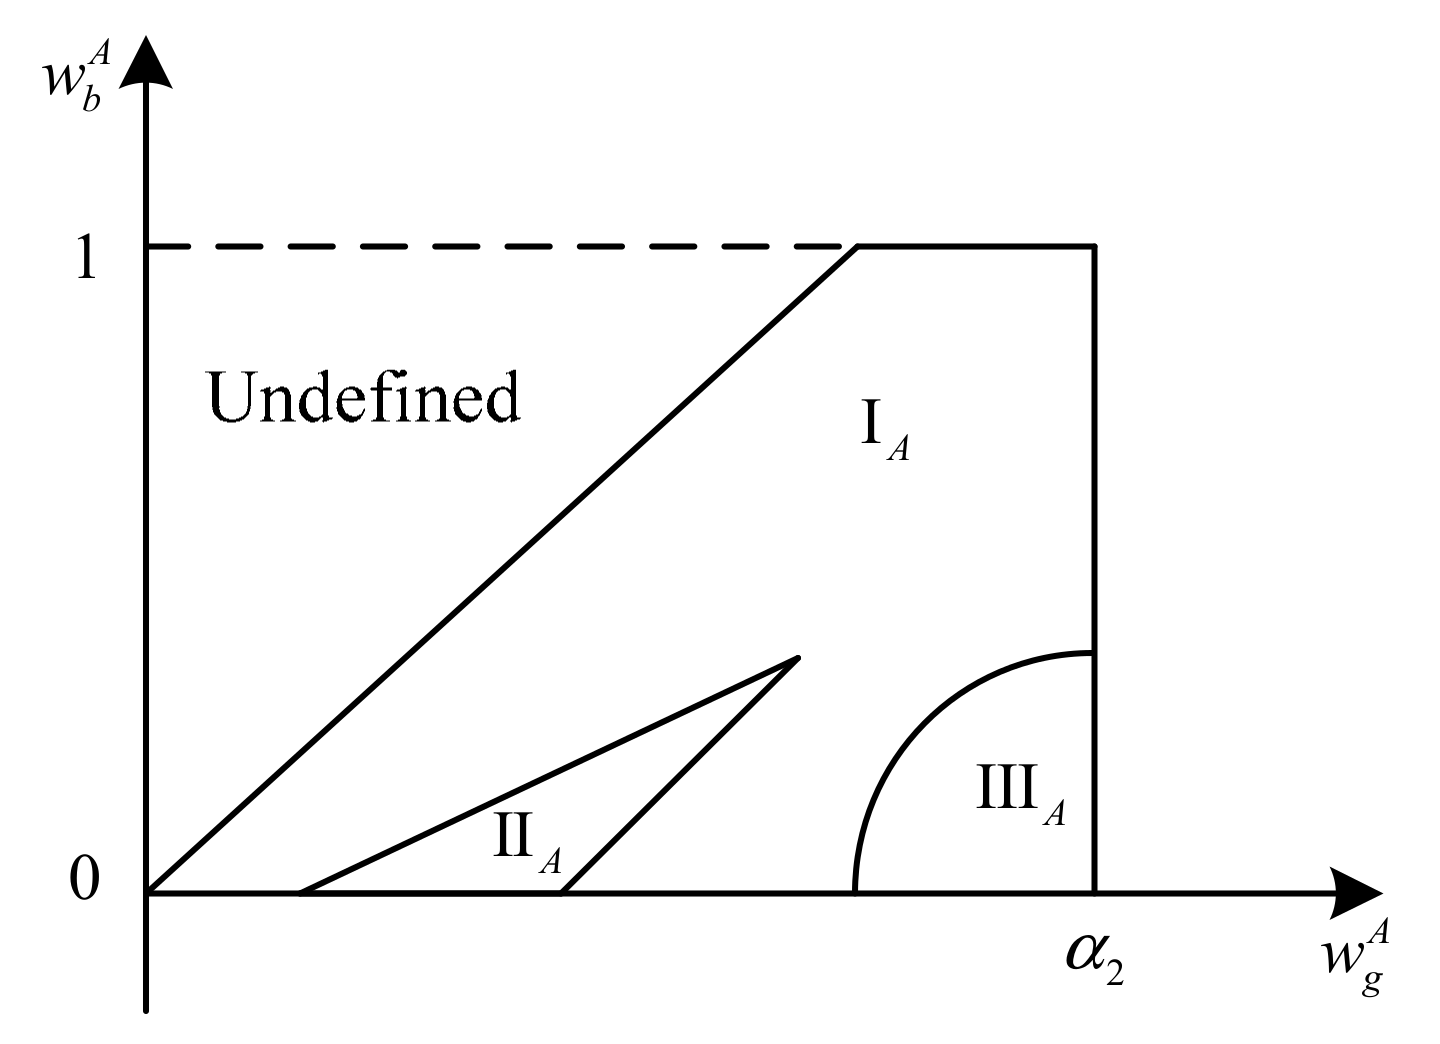
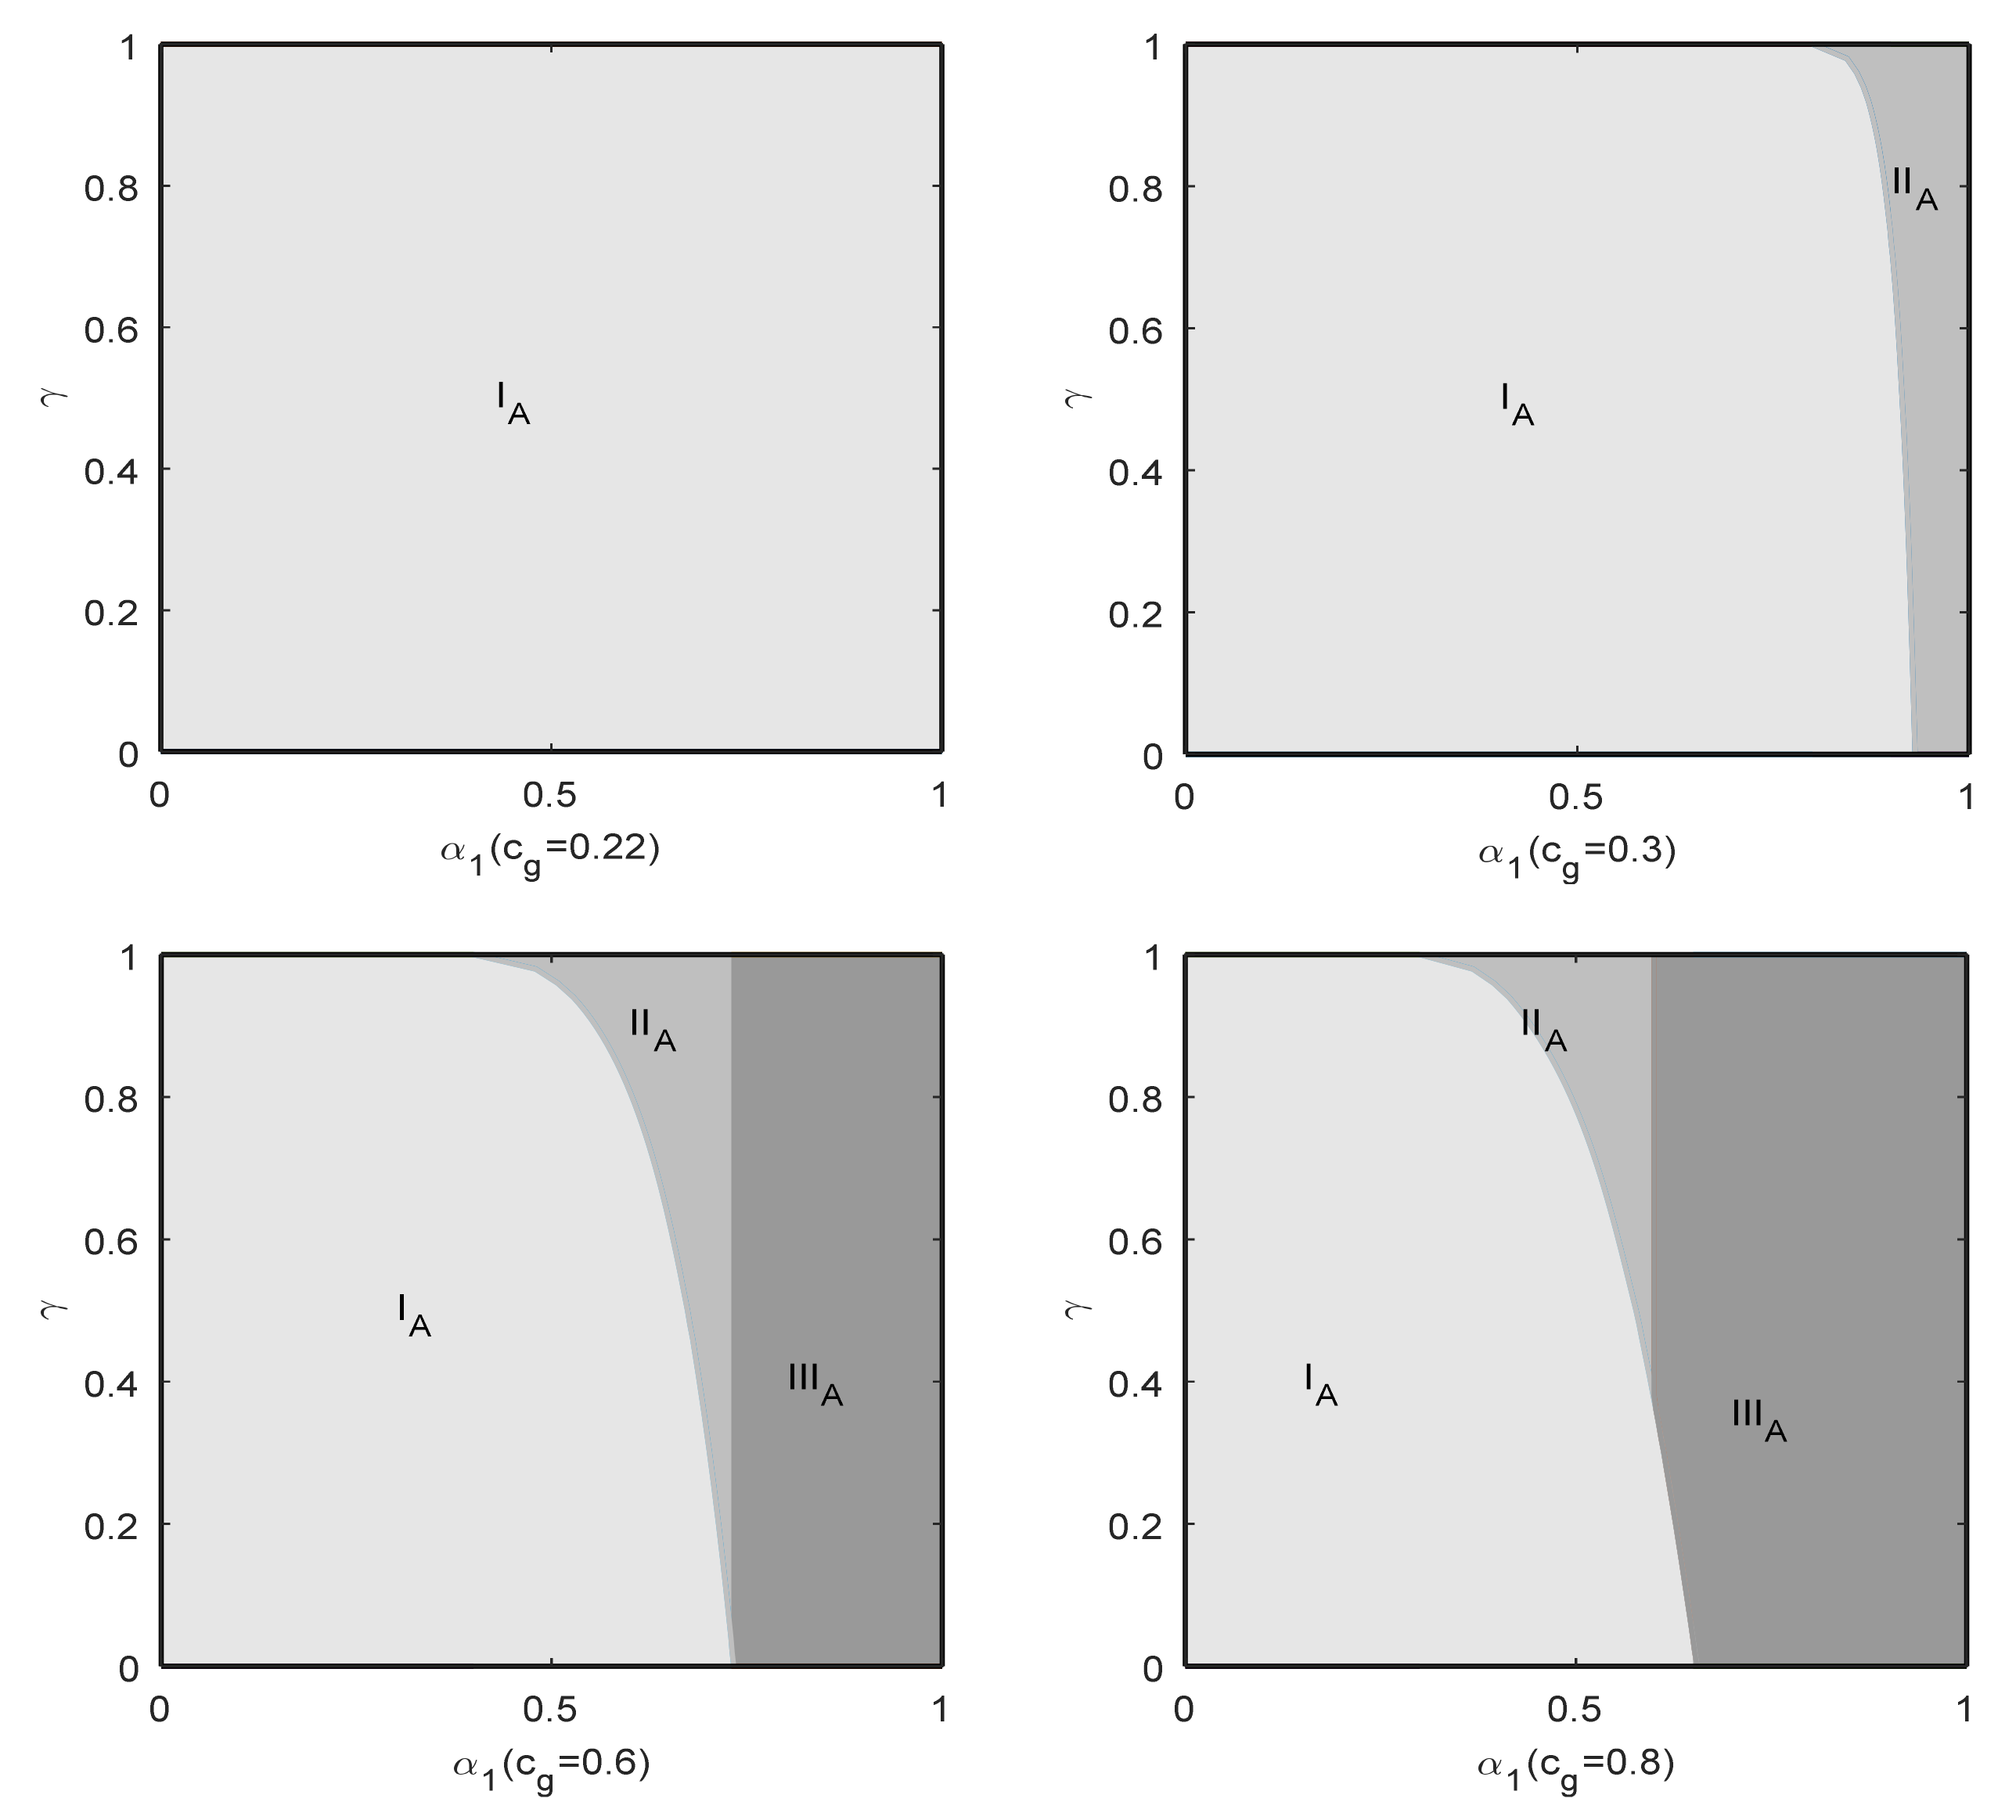
Similarly to direct selling, the retailer needs to determine the optimal retail price based on the principle of profit maximization. According to the range of w b A and w g A , the feasible region for the retailer’s decision is given—that is, Ω A { w g A > w b A , w b A < p b A < 1 , w g A < α 2 } —as shown in Figure 3. By comparing the profits of the retailer under different demand scenarios in Proposition 3, the feasible region can be divided into three subregions— I A , II A , and III A —which are recorded as strategies I A , II A , and III A , respectively.
Under strategies I A , II A , and III A , the retailer will adopt retail prices under the demand scenarios D 1 , D 2 , and D 3 , respectively. Consequently, the manufacturer obtains the optimal wholesale prices of brown and green products according to the three pricing strategies of the retailer. Thus, Proposition 4 is obtained.
Proposition 4.
Under agent selling, the manufacturer’s optimal wholesale price is: (1) Under strategy I A , w b A * = 1 + c b / 2 , w g A * = c g + α 2 / 2 ; (2) Under strategy II A , w b A * = α 1 + B c b / 2 B , w g A * = B c g + A + α 1 1 γ / 2 B ; (3) Under strategy III A , w b A * = α 1 + B c b / 2 B .
Proposition 4 presents the equilibrium decisions of the manufacturer in the agent-selling supply chain. Similarly to Proposition 2, this shows that the manufacturer’s prices decrease as the cost increases when the green product adopts a low or high price strategy. When adopting the medium price strategy, the wholesale prices of green products and brown products will decrease with the size of the green market. At this time, the purchase cost of the retailers will be reduced, and there will be a wider range of retail price adjustments to maximize the market demand for green products, while manufacturers can obtain more green orders for profit growth. It is obvious that, as green consumers prefer green products, manufacturers will increase the green wholesale prices. When green consumers’ preference for brown products increases, if γ > α 1 2 / 1 α 1 2 , manufacturers will also increase the wholesale price of green products, which indicates that although green consumers’ preference for brown products increases, as long as the green market is large enough, the manufacturer can obtain high profits by increasing green wholesale prices. Conversely, manufacturers will choose to reduce green wholesale prices to obtain green purchase orders as much as possible.

5. Comparative Statics

To assess the above results, the authors use theoretical and numerical analysis to explore the pricing strategies and choice of sales channels in the supply chain under direct selling and agent selling.

5.1. Pricing Strategies

The setting of prices depends on the profit comparison in the different models, but as this becomes complex, two special cases are used to analyze the price strategies; namely, γ = 1 and α 1 = 1 . γ = 1 means that the market is composed of green consumers, and α 1 = 1 means that green consumers have the highest preference for brown products, which also indicates that green consumers have the smallest preference difference between green products and brown products. The results are expressed in Corollaries 1–4.
Corollary 1.
Under direct selling, when γ = 1 , the optimal pricing strategy of the manufacturer: (1) If α 1 c b or α 1 c b α 2 α 1 2 α 2 α 1 < α 2 c g c v < α 1 c g + c v α 2 c b 2 α 2 α 1 < 3 α 2 α 1 c g + c v 2 α 1 α 2 2 α 2 α 1 , it is strategy I D ; (2) If 0 < α 1 c g + c v c t α 2 < 2 α 2 α 1 α 2 c g c v , it is strategy II D ; (3) If both (1) and (2) are not satisfied, it is strategy V D .
Corollary 1 reveals that even when the market consists only of consumers who prefer green products, there is still a case in which consumers only buy brown products in the direct selling model; namely, under condition (3). In that case, the manufacturer sets a high price for green products to induce consumers to buy brown products (see Proposition 2).
Corollary 2.
Under direct selling, when α 1 = 1 , the optimal pricing strategy of the manufacturer: (1) If α 2 c g c v 2 α 2 > 1 c b 2 2 α 2 1 + γ 2 2 α 2 2 + γ and 1 + c b > γ α 2 c g c v α 2 1 + γ + 2 c g + c v α 2 or 2 c g + c v / α 2 < 1 + c b < 2 α 2 1 + γ , it is strategy I D ; (2) If 2 α 2 1 + γ < 1 + c b < γ α 2 c g c v α 2 1 + γ + 2 c g + c v α 2 , it is strategy II D ; (3) If both (1) and (2) are not satisfied, the optimal pricing strategy is V D .
Corollary 2 reveals that when there is little difference between green consumers’ preferences for green and brown products, the manufacturer will choose different pricing strategies if different conditions are met. In particular, under condition (3), the manufacturer only sells brown products. This means that in the direct selling model, whether the manufacturer directly sells green products also depends on the cost of green products, as well as the proportion of green consumers in the market. Under certain conditions, the manufacturer will not choose to produce green products.
Corollary 3.
Under agent selling, when γ = 1 , the optimal pricing strategy of the manufacturer: (1) If c g α 1 α 2 c b 3 1 α 1 α 2 and α 2 c g α 2 / α 1 α 1 c b > 0 or α 1 c b , it is strategy I A ; (2) If c g + α 1 < c b + α 2 and c g α 1 > c b α 2 , it is strategy II A ; (3) If both (1) and (2) are not satisfied, the optimal strategy is III A .
Corollary 3 reveals that in the agent selling case, the pricing of the manufacturer is different based on different conditions. Here, when the manufacturer chooses strategy I A , the product pricing is not influenced by competing products, only by its own cost. In other words, the price of green products depends only on c g , and the price of brown products depends only on c b . In a special case, the manufacturer will choose strategy III A when neither conditions (1) and (2) are met and there are no green consumers who choose to buy green products, only those who buy brown products. The implication is that although consumers prefer green products, they are still influenced by the prices of these products and buy brown products when brown products are cheaper.
Corollary 4.
Under agent selling, when α 1 = 1 , the optimal pricing strategy of the manufacturer: (1) If c g c b α 2 , is strategy I A ; (2) If 1 c b < α 2 c g and c g > c b α 2 , then it is strategy II A ; (3) If 1 c b > α 2 c g and c g > c b α 2 , then it is strategy III A .
Corollary 4 reveals that when green costs (conditions (1) and (2)) are not high, the manufacturer’s pricing strategy will cause the retailer to sell both green and brown products. When green costs are high—namely, c g > α 2 + c b 1 and c g > c b α 2 —the manufacturer’s pricing strategy will drive green consumers to buy only brown products.
Some numerical analyses are used to verify our theoretical results. We demonstrate the effects of the proportion of green consumers γ and the coefficient of the preferences of green consumers for brown products α 1 on the optimal pricing strategies. Based on the studies of Ranjan and Jha [11], Wang and Song [12], and Basiri and Heydari [27], some parameter values are set as follows: α 1 = 0.8 , α 2 = 1.2 , c b = 0.1 , c g = 0.15 , c v = 0.1 , γ = 0.5 . The results are shown in Figure 4, Figure 5 and Figure 6.
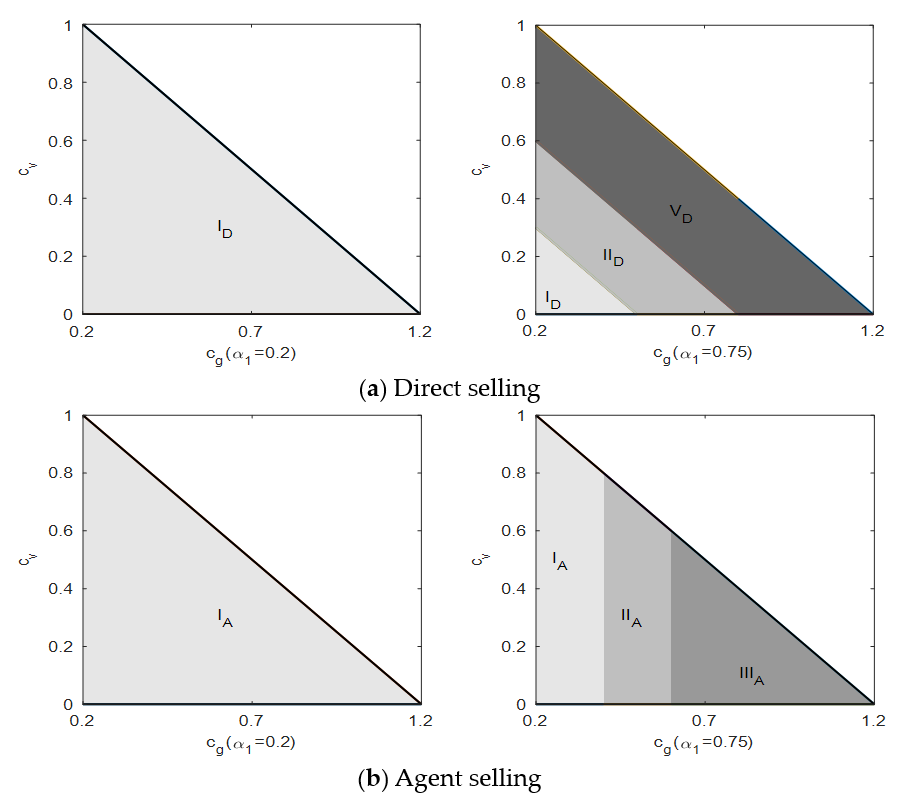
Figure 4 and Figure 5 reveal that if the proportion of green consumers and the green costs are both high, it creates a situation where only brown products are produced in both direct selling and agent selling, which is consistent with the previous findings. Moreover, the green costs have a significant influence on the pricing strategies. In direct selling, an increase in green costs may result in the case where the manufacturer and the retailer sell only brown products; namely, strategy V D . In agent selling, if the green costs are low, either strategy I A or II A is chosen. When the green costs are high and there is little difference between the green consumers’ preference for the two kinds of products, only brown products are produced; thus, strategy III A is chosen. Notably, the cost changes have a significant influence on the prices, but for brevity, the results are not repeated here. For these details, please refer to Appendix B.
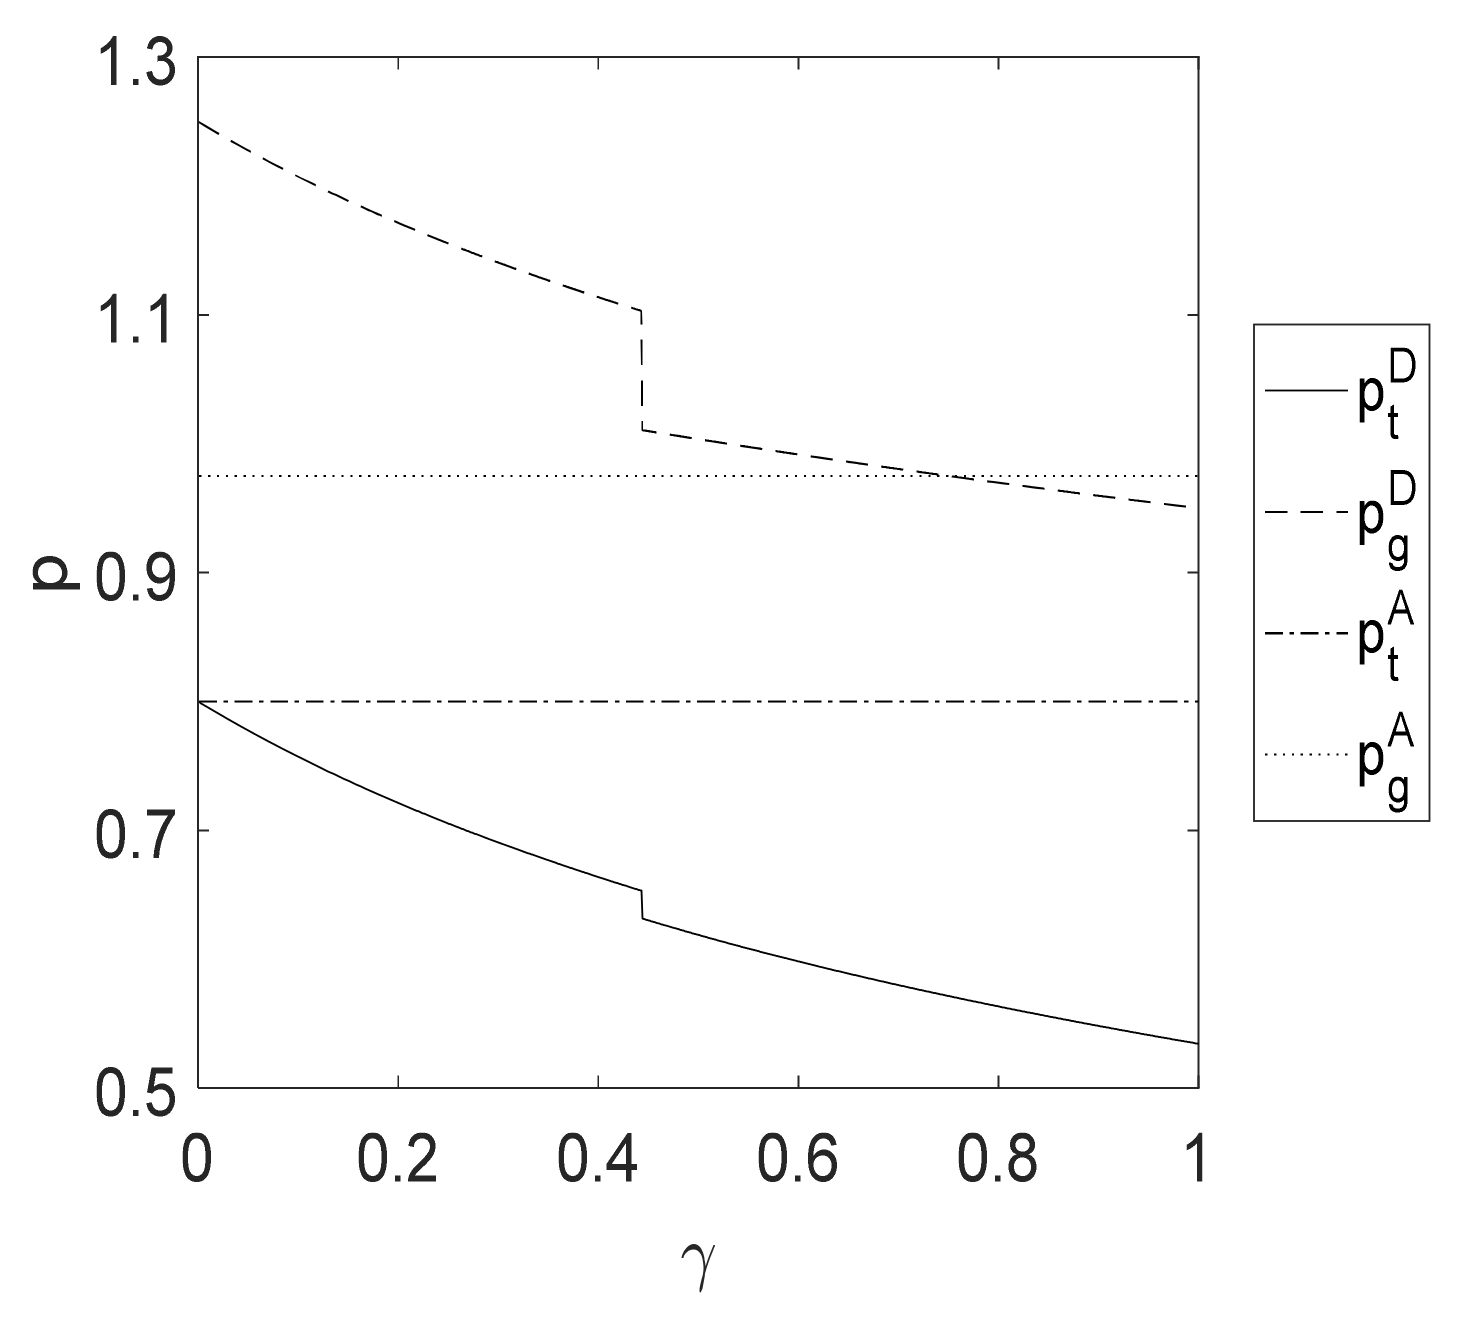
Figure 6 shows that the price of green products is always higher than that of brown products to compensate for the higher production cost of green products. With an increase in γ , the price of the products in the direct selling model decreases, but remains unchanged in the agent selling model (adopting strategy I A of Proposition 4). The reason is as follows. Under direct sales, a greater number of green consumers will prompt manufacturers to lower their prices to expand green demand, while retailers will lower their prices to attract green consumers to buy brown products in response to product competition. However, under agent sales, where the retailer sells both green and brown products, the gains from the green product can make up for the loss of demand cannibalization for the brown product under a certain threshold; therefore, price adjustments are unnecessary. Of course, once the threshold is exceeded, the price of the products is bound to change as the consumer demand changes. Specifically, the price difference between green and brown products is larger under direct sales and smaller under agent sales. This indicates that in direct selling, manufacturers are more willing to reduce the substitutability between two products by increasing the price difference to cope with channel competition, while under agent selling, retailers tend to weaken the difference between the two products and increase the substitutability to cover more markets. Thus, the price of green products in direct selling is significantly higher than that in agent selling, while the price of brown products is lower than that in agent selling.
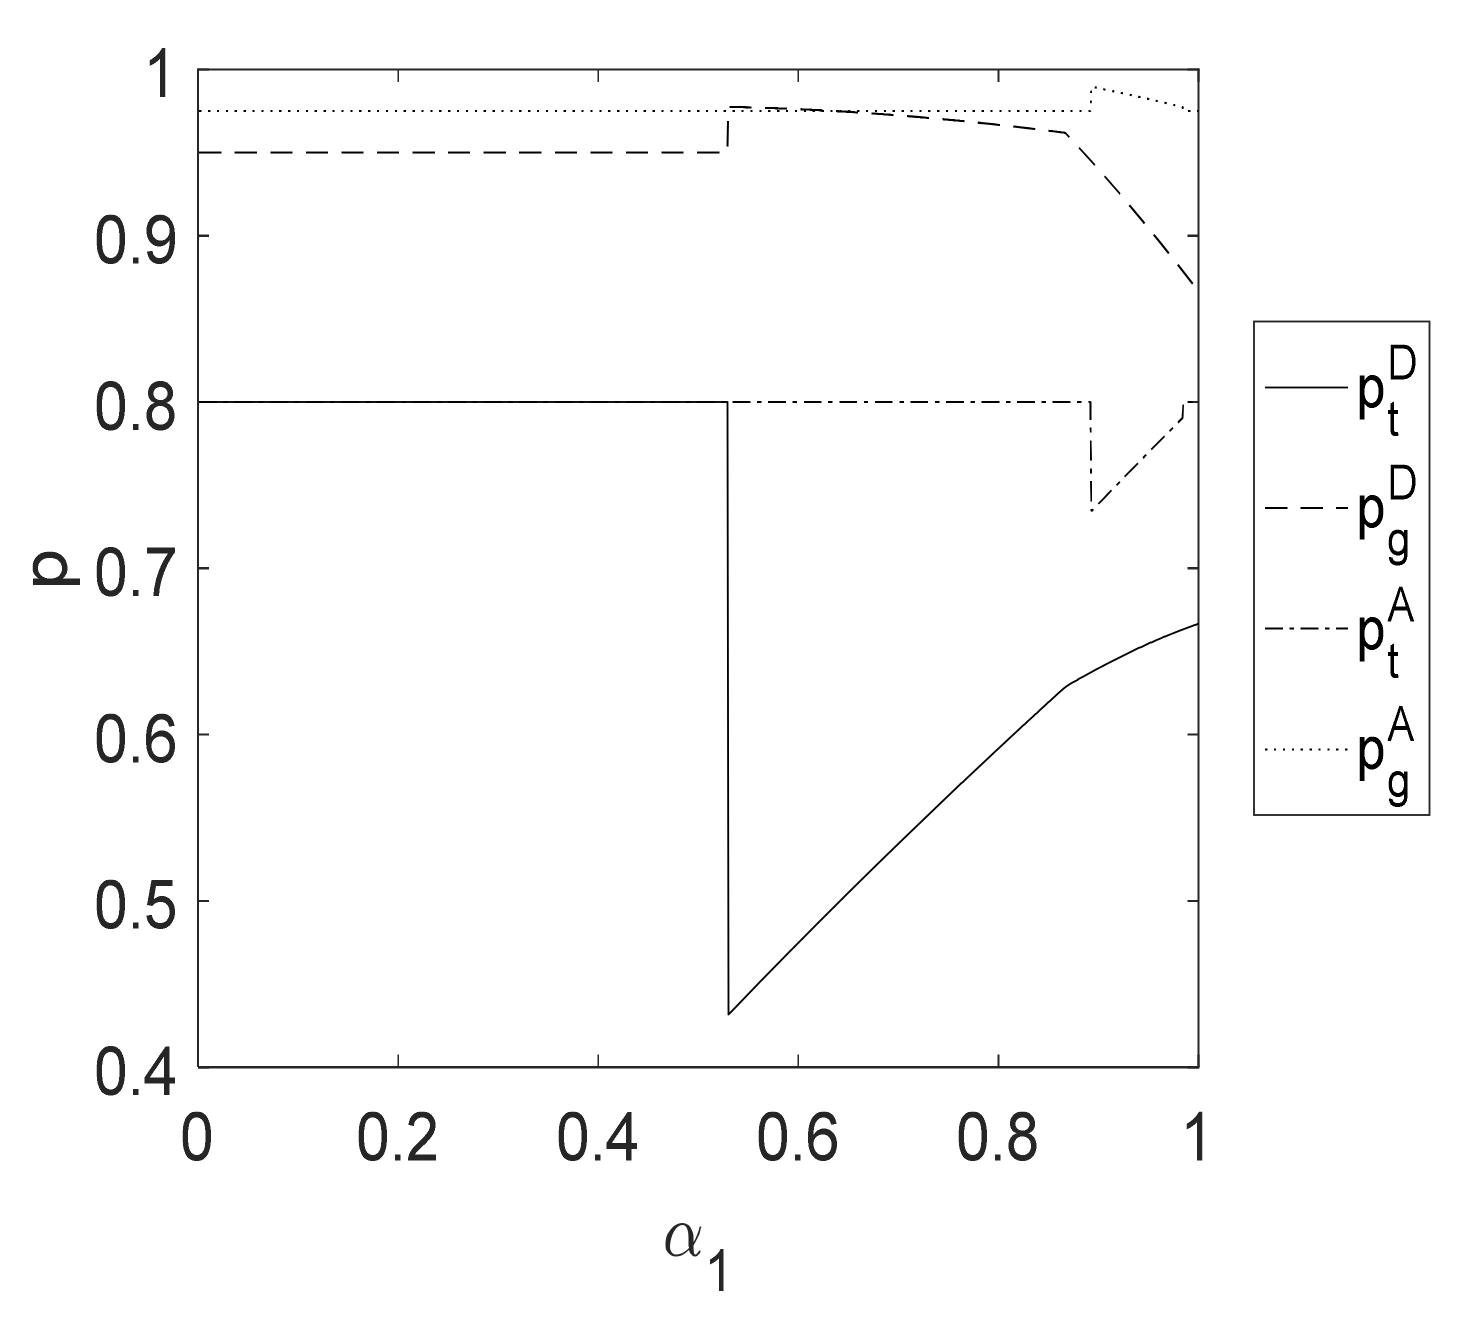
In Figure 7, the prices in the agent selling and direct selling models exhibit relatively similar changes. In other words, when α 1 is below a certain threshold, the prices of green and brown products do not change, but with an increase in α 1 , the price of green products begin to decrease from a high price, while that of brown products increase from a low price. In the direct selling model, the price of the products is more significantly influenced by α 1 . In the agent selling model, only when α 1 is very high will the retailer adjust their pricing strategy. This shows that when there is only a small difference between green consumers’ preferences for these two kinds of products, the retailer will attract consumers by raising the price of brown products and lowering the price of green products; however, the unit price of green products does not decrease (from a high price). In the direct selling model, due to competition, the manufacturer and the retailer begin to adjust their price strategies to capture the market share when α 1 is not high. When the difference in preferences becomes smaller, the manufacturer will adopt a low-price strategy to attract green consumers, while the retailer chooses to increase the price. Thus, the prices of the two kinds of products in the direct selling model will gradually become lower than those in the agent selling model.

5.2. Sales Channel Choice

Next, we compare the manufacturer’s profits in the two models and provide management insights for the manufacturer to choose a suitable sales channel.
Proposition 5.
When c v = 0 and γ = 1 or α 1 = 1 , then π m D * π m A * .
Proposition 5 reveals that when direct selling can be set at no cost, if the market is made up of only green consumers or green consumers show little difference in preference for the products in the market, the manufacturer’s profit under direct selling will always be higher than that under agent selling. The conclusion matches the fact. If consumers prefer green products, the manufacturer will be motivated to establish a direct sales channel and obtain higher marginal revenue. When green consumers have similar preferences for the two kinds of products, the manufacturer can capture a larger consumer market by selling both green and brown products, and thus earn higher profits than those in the agent selling model. Of course, when the production cost or selling cost of green products is high, there may be a situation in which the manufacturer sells only brown products, as mentioned in Corollaries 1 and 2; through a further comparison of the sales models in this situation, Corollary 5 is obtained.
Corollary 5.
When the production of brown products is the manufacturer’s only optimal strategy, the manufacturer prefers direct selling ( π m D * π m A * ).
Corollary 5 reveals that even when the manufacturer sells only brown products, the manufacturer’s profit in the direct selling model is still higher than that in the agent selling model. This is because under direct selling, the manufacturer can stimulate the demand for brown products by setting high prices for green products; hence, the manufacturer can still earn a higher profit than that in the agent selling model, even though it only sells brown products.
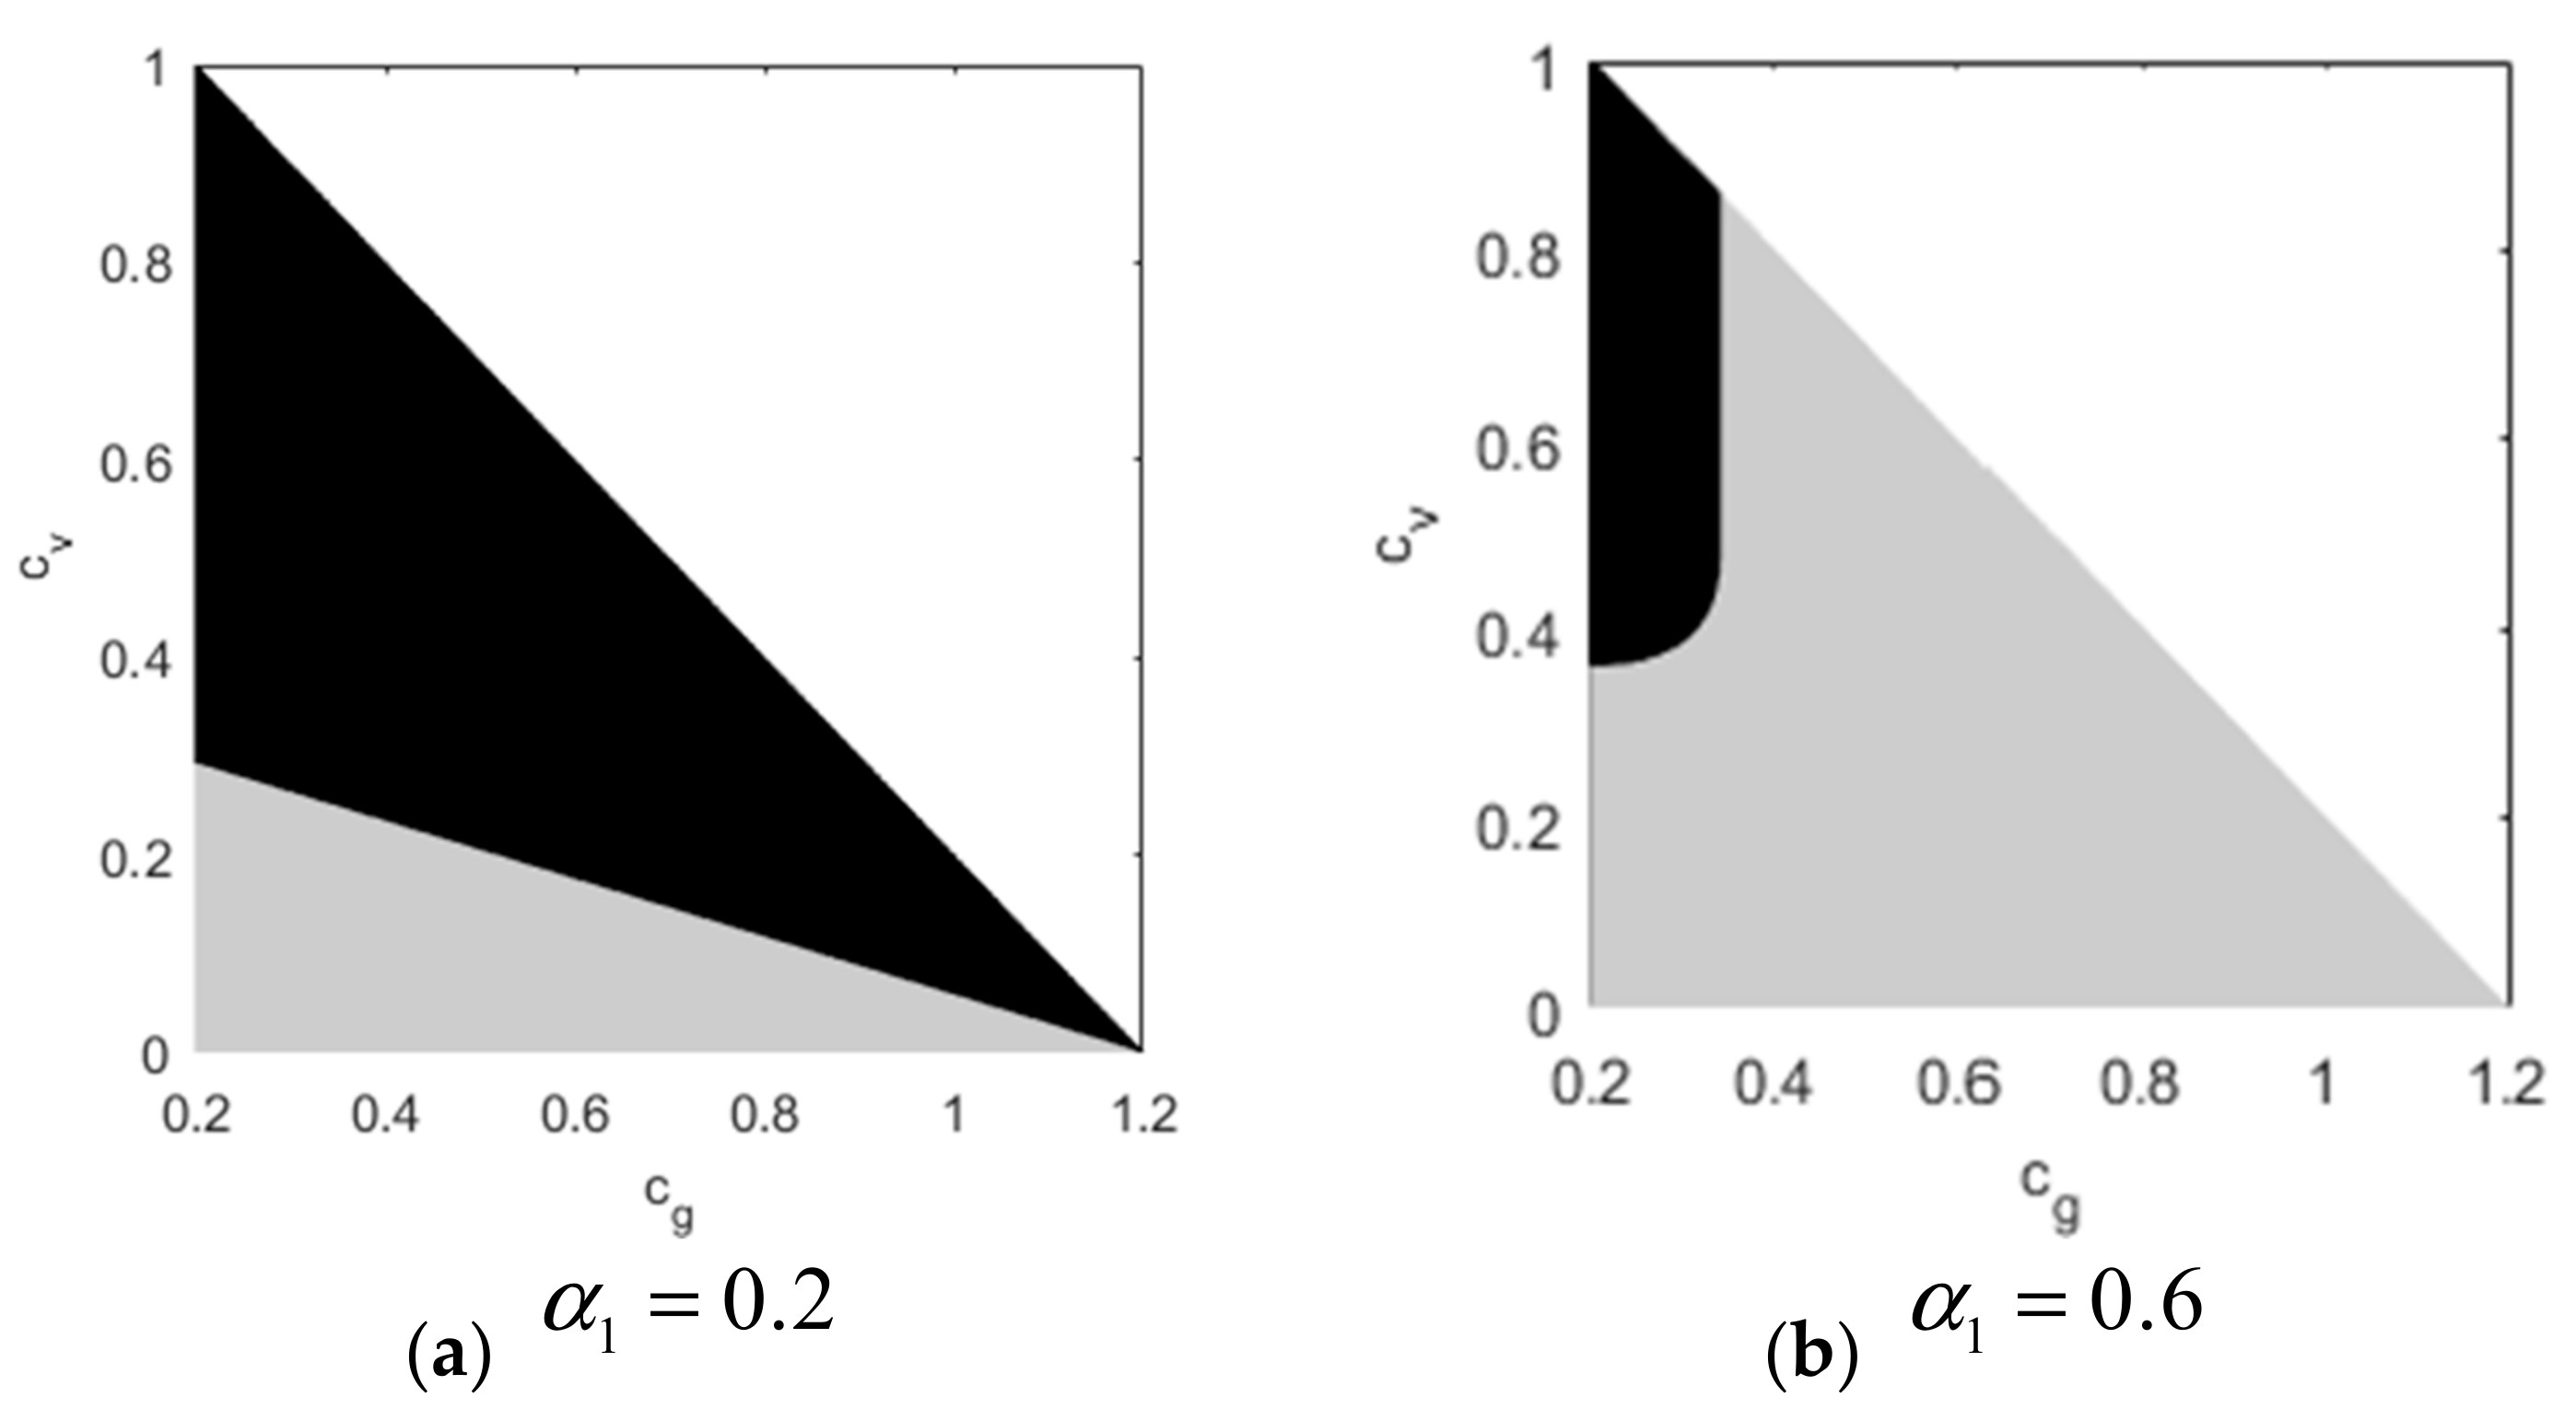
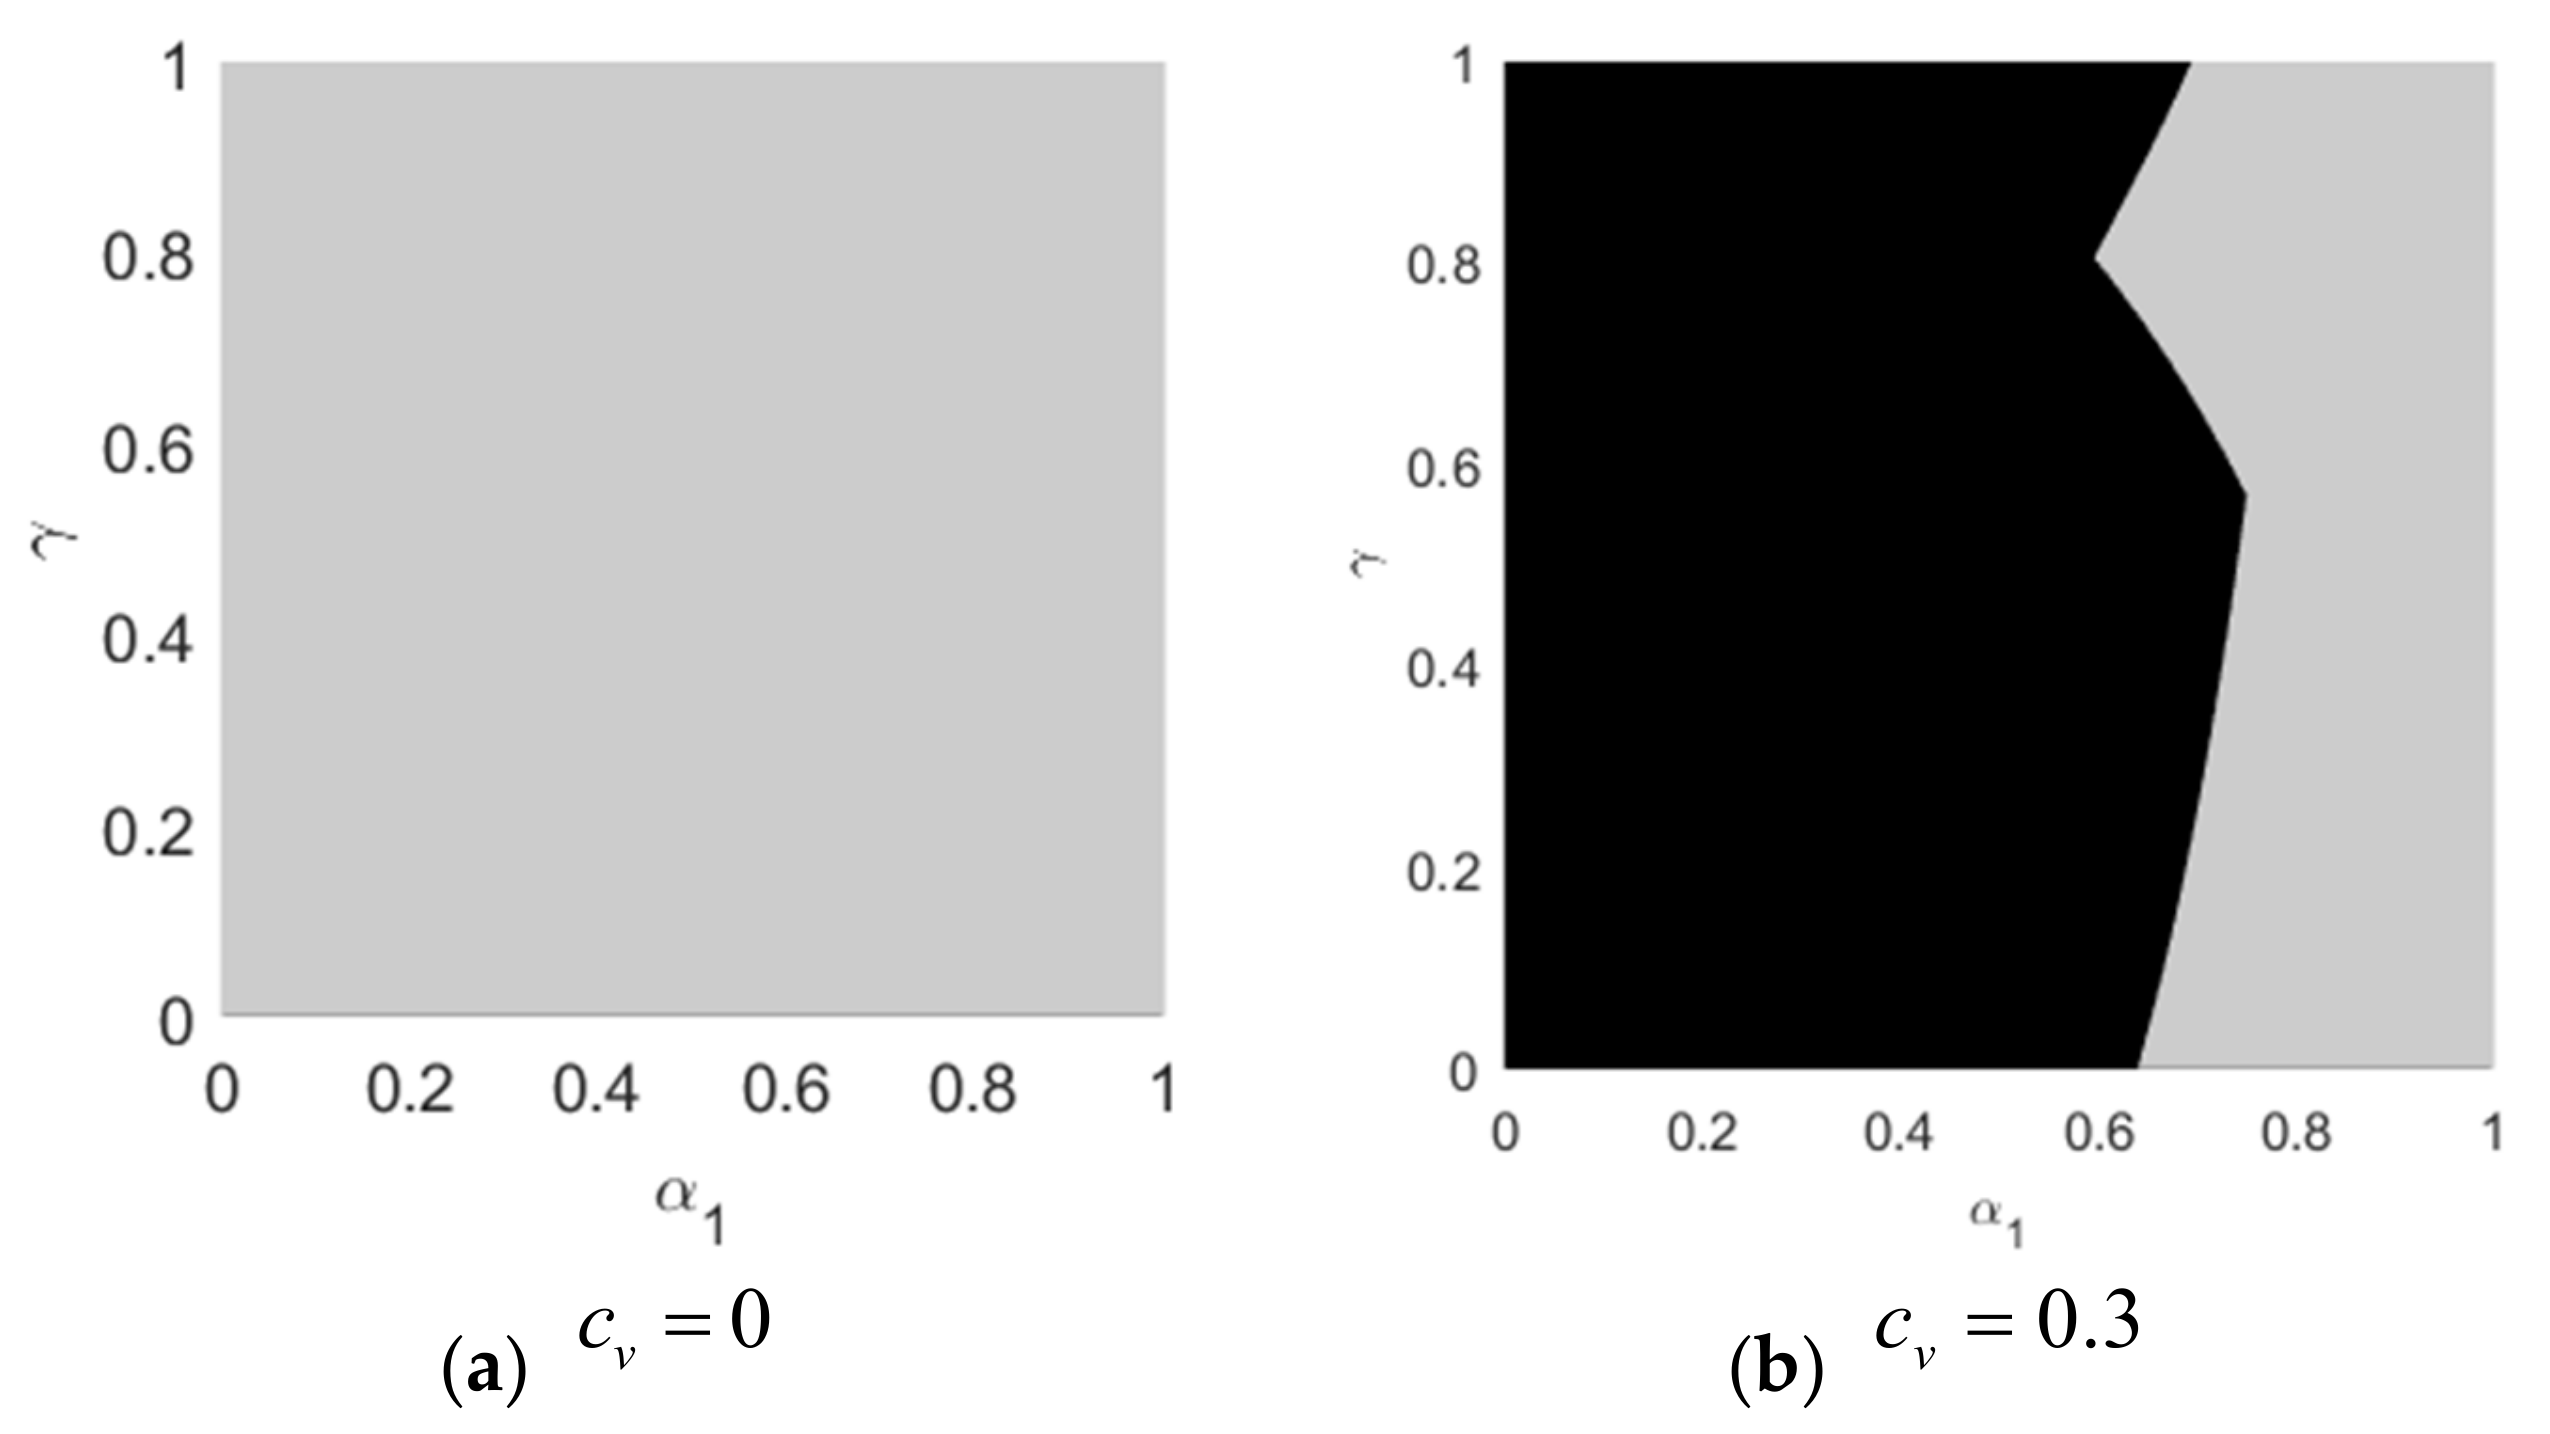
The channel choice strategy of the supply chain in general situations will be discussed through numerical analysis. The results are shown in Figure 8, where the black area represents agent selling and the gray area represents direct selling.
Figure 8 indicates that when there is no direct selling cost ( c v = 0 ),direct selling is always optimal. The manufacturer will not choose to sell green products through the retailer, but establish a direct sales channel to reduce the intermediary cost and increase its marginal profit. When the cost of the direct selling increases, namely c v = 0.3 , direct selling is not necessarily the optimal choice. When green consumers have a low preference for brown products, the manufacturer will choose agent selling, or conversely, will choose direct selling. This indicates that when green consumers have the same preference for the two kinds of products, the substitutability between them is enhanced. Under agent selling, the retailer will not adopt any strategy to increase the demand for green products, and the manufacturer will establish its own direct sales channel to sell green products and expand the market. Although direct selling can incur a sales cost, it avoids sharing profits with intermediaries and can obtain a higher marginal revenue through adjusted pricing strategies. The effects of the cost on channel selection can be seen in Appendix B.
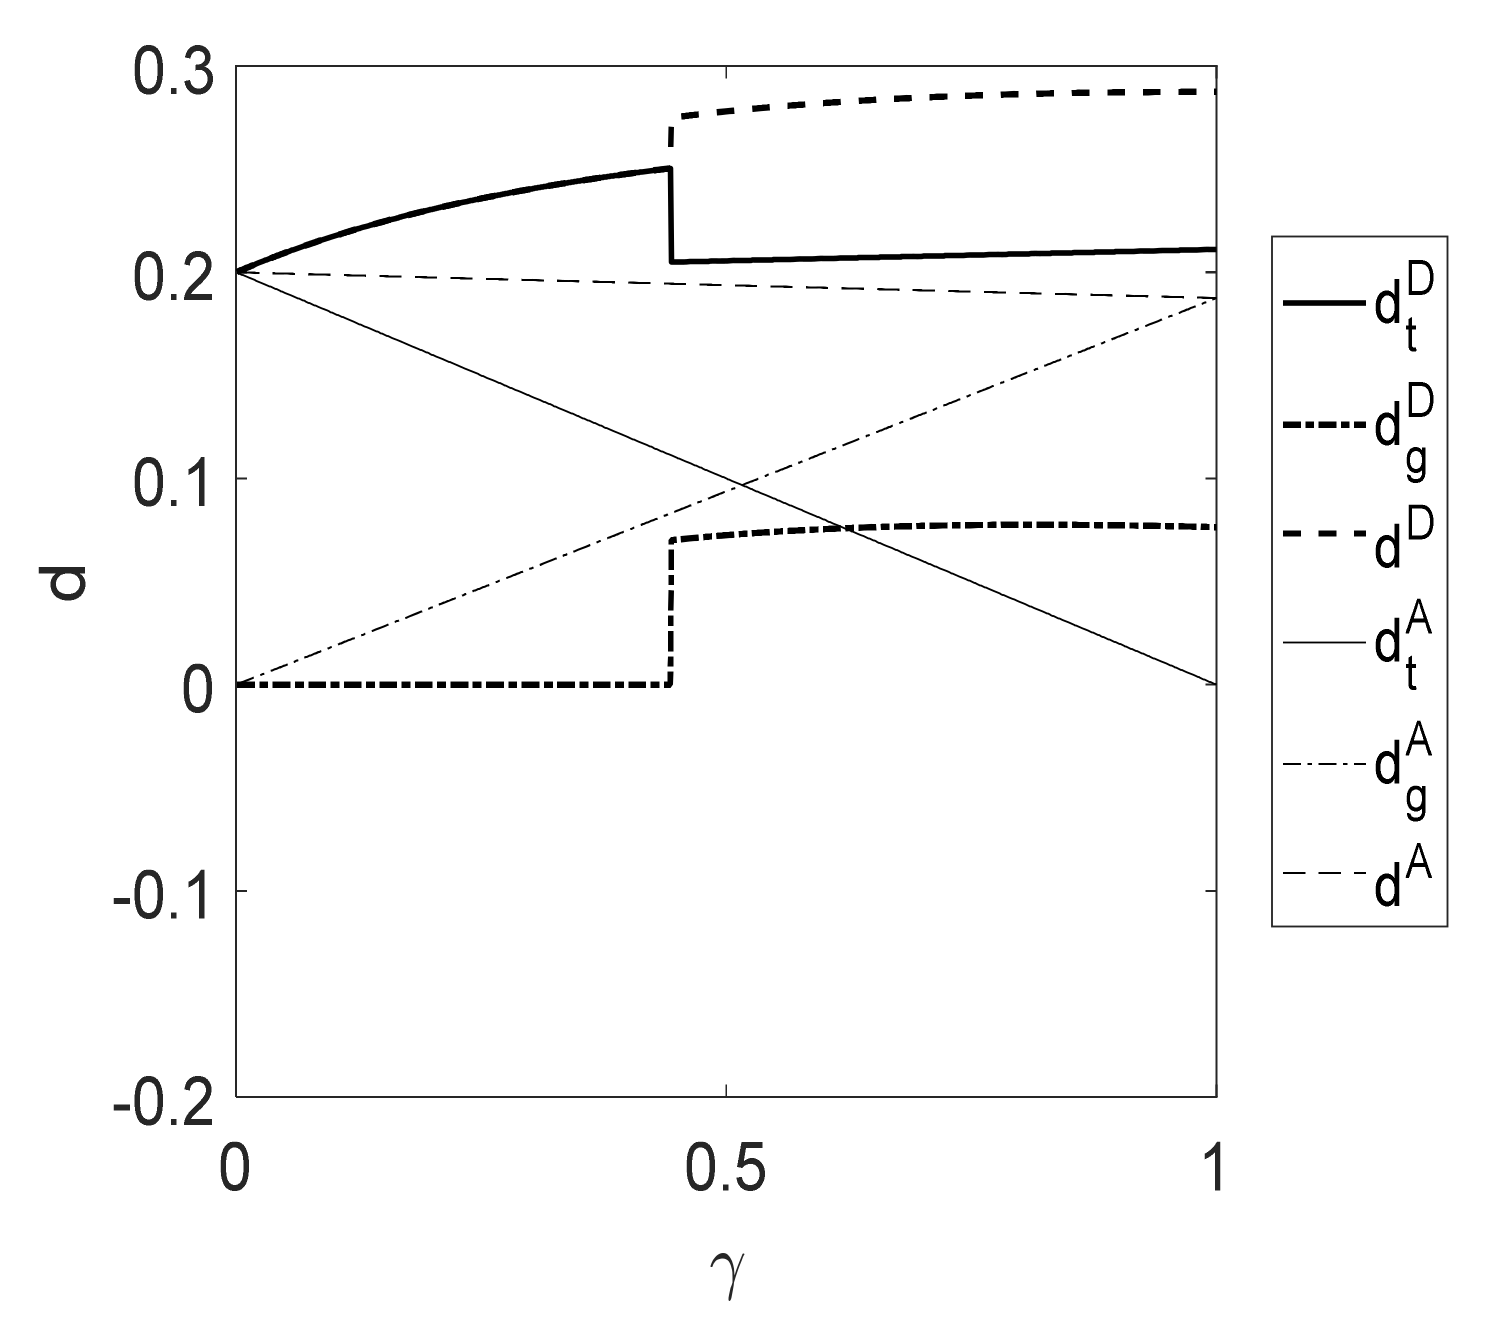
As the effects of consumer types and preferences on the manufacturer’s profits is realized by affecting demand, it is necessary to analyze the impact of consumer types and preferences on the changing trend of demand and profits, and the results are shown in Figure 9, Figure 10, Figure 11 and Figure 12. Figure 9 reveals that with the increase in γ in the agent selling model, the green demand will cannibalize the brown market, but the total demand will remain the same, implying that all brown demand will be gradually replaced by green demand. In the direct selling model, when γ is below a certain threshold, the green demand is 0, but the brown demand gradually increases; when γ is above the threshold, the green demand rises rapidly and then becomes stable, and the brown demand will decrease to a stable level, but will always higher be than the green demand. This indicates that only when the quantity of green consumers reaches a certain proportion will the manufacturer be motivated to establish a direct selling channel; otherwise, it may be difficult to compensate for the direct selling costs. By comparing these two models, it can be seen that the total demand in the direct selling model is always higher than that in the agent selling. This, again, validates the findings of other researchers, such as Yenipazarli and Vakharia [26] and Agi and Yan [28], confirming that the introduction of green products does not reduce market coverage.
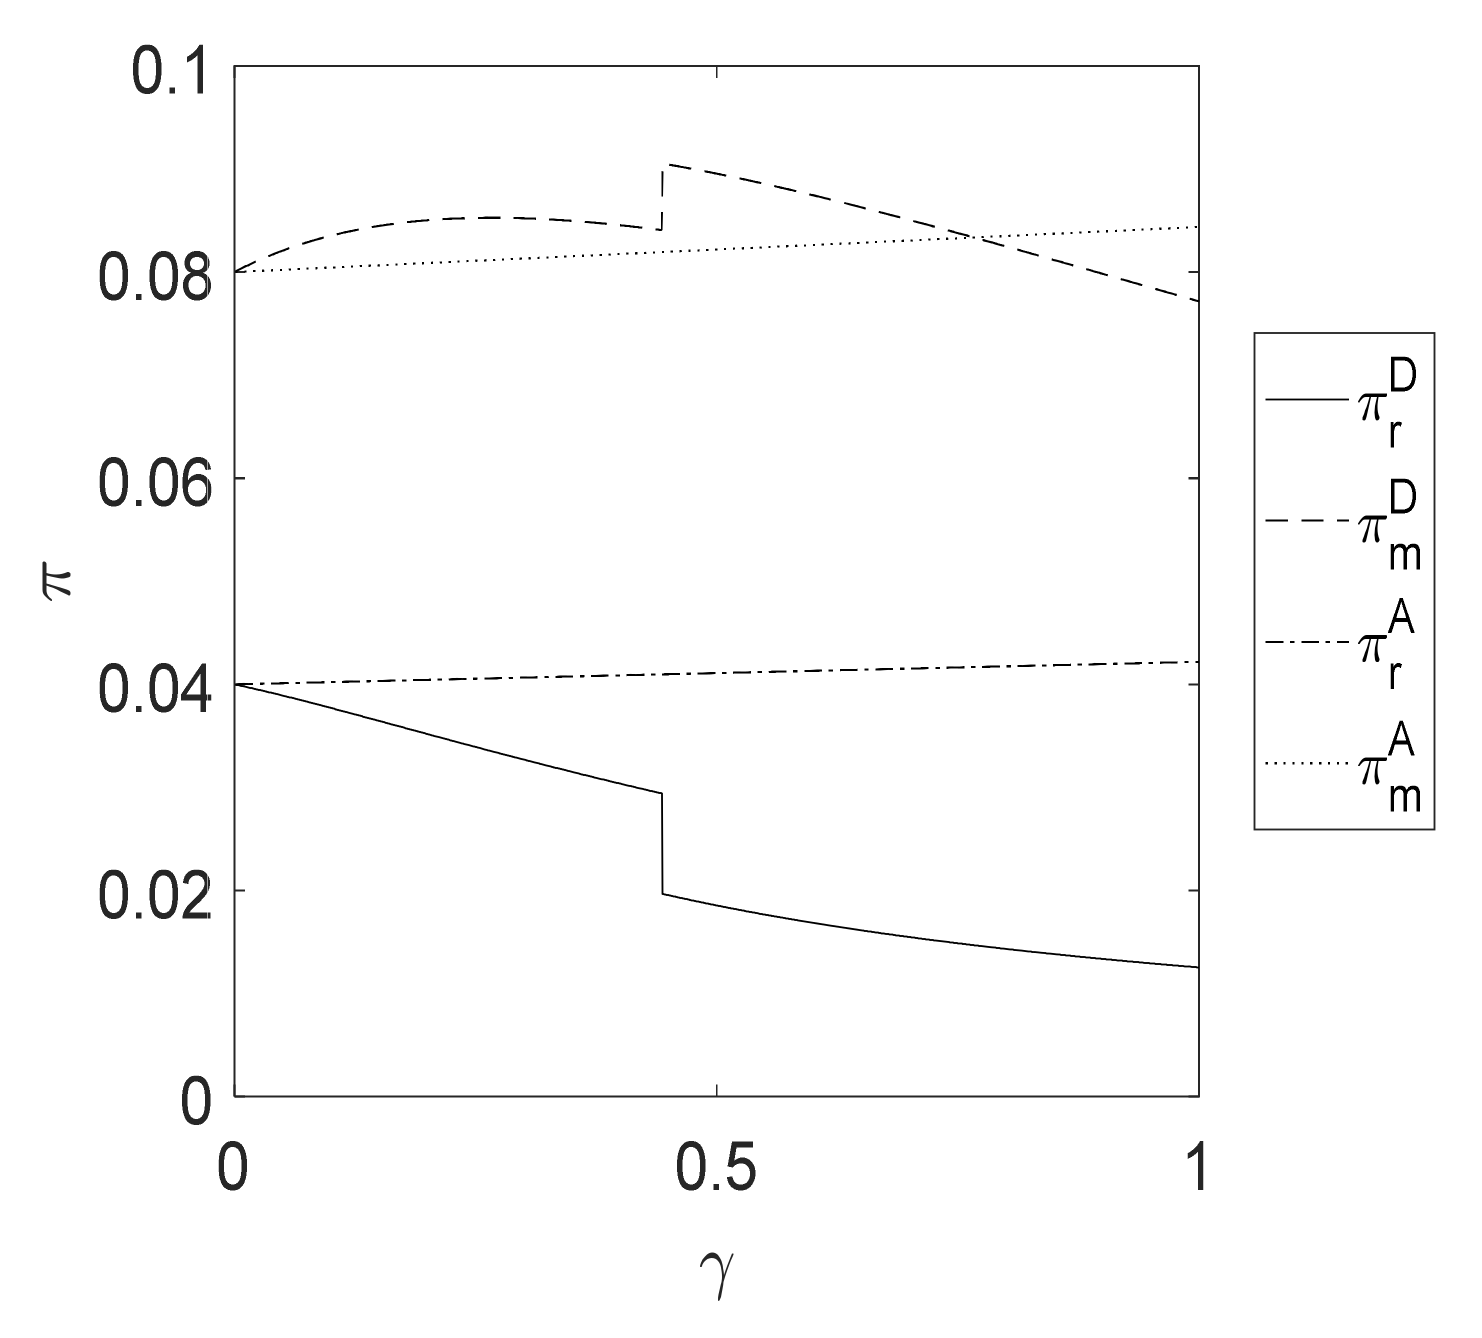
Figure 10 shows that due to the dominance of the manufacturer in the supply chain, its profit is higher than that of the retailer regardless of the sales model. In the agent selling model, with the increase in γ , the profits of the manufacturer and the retailer increase because the marginal profit of selling green products is higher than that of brown products. The more green consumers there are, the more green products the supply chain can sell; thus, the profit of each entity rises. In the direct selling model, as γ increases, the brown demand decreases, which leads to a decrease in the profits of the retailer; however, the profits of the manufacturer first increase and then decrease. Thus, the manufacturer does not earn more profit with more green consumers in this case. When there are more green consumers, the manufacturer lowers the price of green products to capture more demand. This results in a decrease in the marginal profit of green products and a decrease in the total profits of the manufacturer.
In terms of profits, the profits of the retailer in the agent selling model are always higher than those in the direct selling model. This is obvious as, in the agent selling model, the retailer earns profits from selling both green and brown products. However, with respect to the manufacturer, when γ is not high, the profits in the direct selling model are higher than those in the agent selling model, and conversely, the profits under agent selling are higher. Thus, as the green consumer market expands, it becomes detrimental to have a direct sales channel for green products.
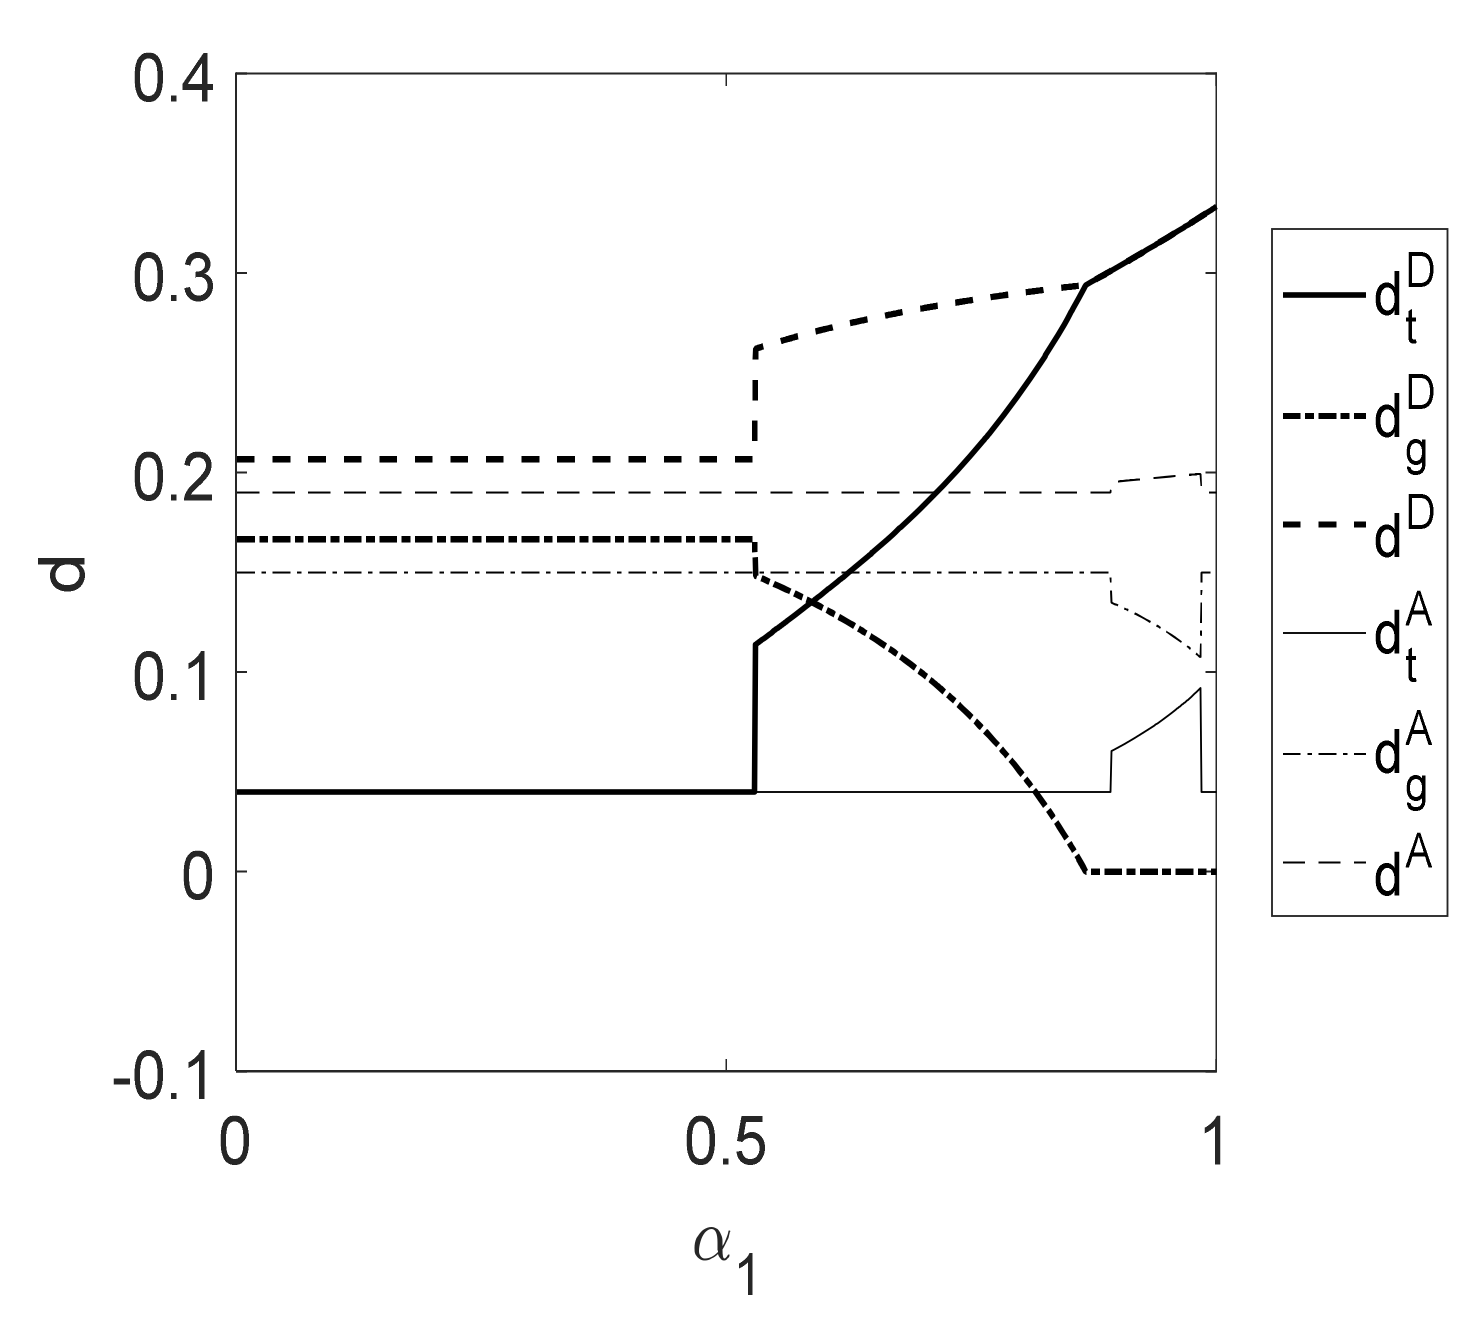
In Figure 11, when α 1 is below a certain threshold, the demand does not change as the price of the products remains the same under agent selling. When it is above the threshold, the demand for green products decreases in response to the high-price strategy, but the demand for brown products increases due to their low price. and the total demand increases. In the direct selling model, when α 1 is low, the demand for brown and green products does not change (the prices of both kinds of products remain the same). When α 1 is high, the green demand decreases to zero, while the brown demand increases. This reveals that when the difference in green consumers’ preference for the two kinds of products narrows, the manufacturer’s direct sales channel lacks a competitive advantage and is gradually surpassed by the retailer channel until it exits the market. Similarly, the total demand in the direct selling model is higher than that in the agent selling model.
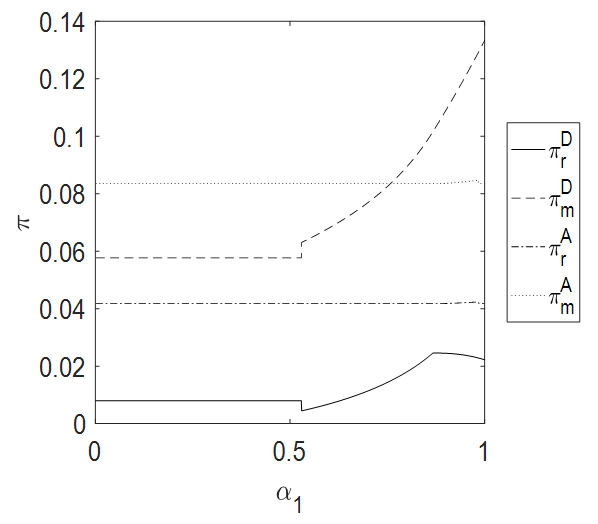
Figure 12 reveals that a change in α 1 does not trigger an adjustment to the pricing strategy of products in the agent selling model; thus, the profits of the manufacturer and the retailer remain unchanged in this case. Similarly, when α 1 is not high, the profits in the direct selling model remain the same as the pricing does not change. However, when α 1 increases, the profits of the manufacturer and the retailer increase, which results from the increase in the demand when the prices drop. By comparing the profits in the two models, the results find that the retailer always earns a higher profit in the agent selling model, but the manufacturer does not always choose agent selling. When α 1 is large, the manufacturer prefers direct selling. This is consistent with the finding shown in Figure 8.

6. Conclusions

This study focuses on the pricing and optimal choice of sales channels for green products and explores the effects of consumer categories and preferences. The results offer new insights.
In terms of pricing, the proportion of green consumers in the market and their preference for brown products (within a certain range) do not affect the retailer’s pricing strategy in the agent selling model. However, in the direct selling model, more green consumers or a smaller difference in their preference for the two kinds of products drive both the manufacturer and the retailer to adopt a price reduction strategy to cope with the competition. However, the retailer adopts opposing price strategies for brown products in the two cases. It chooses a low-price strategy in the agent selling case to cannibalize the green market, and a high-price strategy in the direct selling case to achieve higher marginal revenue.
In terms of channel strategy, the retailer always prefers agent selling, but the manufacturer’s choice depends on several factors. Our conclusion is that the manufacturer’s sales channel strategy will be influenced by the proportion and preference of the consumers in the market. This differs from the conclusion of Zhang et al. [27], which states that channel selection mainly depends on the production cost and launching cost of green products. When there are more green consumers or there is a big difference in product preferences, manufacturers will choose agent selling. Specifically, in direct selling, the manufacturer does not necessarily sell green products, but under certain conditions, it will stimulate demand for brown products by setting a high price for green products.
In terms of the effects of green demand and consumer preferences, when the proportion of green consumers in the market is high, under agent selling, the profits of both the retailer and the manufacturer increase, whereas, under direct selling, the profits of the retailer decrease, while the profits of the manufacturer first increase then decrease, indicating that having more green consumers does not necessarily benefit the manufacturer. This is because in the direct selling model, to capture the green market, the manufacturer will sell at a lower price; thus, its marginal profit for green products decreases. To cope with competition, the retailer also reduces the price of brown products, resulting in a decrease in the marginal profit of brown products. Hence, the total profits of the manufacturer decrease. However, when the preference of green consumers for brown products increases, although the manufacturer and the retailer adopt a price reduction strategy, the coverage of the whole market increases (the brown market is satisfied and the green market is covered as much as possible). Thus, the profits of both the manufacturer and retailer increase in the direct selling model.
Our results have managerial implications for both manufacturers and retailers. For the manufacturer, establishing a direct sales channel will not always be beneficial. As the green market becomes more mature, competition may offset the benefits of an expanding green market. This means that, initially, as new green products with a high production cost launch, the manufacturer can build consumer awareness and revenue success by taking advantage of low prices through a direct sales channel. However, as the green market matures, the manufacturer no longer needs to sell products directly, but can entrust both brown and green products to other retailers. In this way, it can avoid the friction caused by channel competition, and the retailer can adjust the pricing of both products to cover the market as much as possible. For the retailer, compared with direct selling, agent selling achieves more revenue; however, as already stated, the manufacturer will not always choose agent selling. To address this, the retailer can increase publicity around green products and enhance consumers’ trust in green products through blockchain, IoT, and other technologies. Through these efforts, retailers can promote maturity in the green market, turn more consumers into green consumers, and force manufacturers to choose agent selling.
This study has several limitations that should be addressed in future research. In our study, the direct selling model only comprises direct sales by the manufacturer and the retailer. With the development of e-commerce and information technology, direct selling has been enriched and has become more complex. Future studies should look at the competition between brown and green products under different direct selling models. In the context of competition in a multi-product market, the issue of green product design should be explored as well. From the perspective of cooperation, coordination contracts were not considered. Thus, another interesting topic for future research is the exploration of the design of contracts in different channel models.

Author Contributions

Conceptualization, H.H. and Y.C.; methodology, H.H. and Q.L.; software, D.Y. and Q.L.; validation, H.H. and Y.C.; formal analysis, D.Y.; investigation, H.H.; resources, Y.C.; data curation, Q.L.; writing—original draft preparation, H.H.; writing—review and editing, Y.C.; visualization, D.Y. and Q.L.; supervision, Q.L.; project administration, H.H. and Y.C.; funding acquisition, H.H. All authors have read and agreed to the published version of the manuscript.

Funding

This research is supported by the National Social Science Foundation of China (Grant No. 22CGL019).

Institutional Review Board Statement

Not applicable.

Informed Consent Statement

Not applicable.

Data Availability Statement

Not applicable.

Conflicts of Interest

The authors declare no conflict of interest.

Appendix A

Proof of Proposition 1.
Under direct selling, calculations are conducted according to the three demand scenarios. Under D 1 , taking the first-order and second-order derivatives of p t D with respect to π r D , it can be derived that π r D / p t D = 1 γ 1 2 p t D w t and 2 π r D / p 2 t D = 2 1 r < 0 . Let π r D / p t D = 0 , it is easy to see that p t D * = 1 + w t S / 2 . According to the condition p g D < α 2 p t D / α 1 to be met by D 1 , thus w t D > 2 p g D α 1 / α 2 1 . Similarly, by taking the optimal retail prices and the conditions to be met under D 2 and D 3 , Proposition 1 is obtained. □
Proof of Proposition 2.
According to Figure 1, the feasible region can be divided into strategy I D , strategy II D , strategy III D , strategy IV D , and strategy V D . Substituting the optimal retail prices of Proposition 3 into the manufacturer’s profit function, the optimal retail and wholesale prices will be obtained under the different strategies. Under strategy I D , taking the first-order derivatives of w t D and p g D with respect to π m D , it can be obtained that π m D / w t D = 1 γ 1 + c t 2 w t   / 2 and π m D / p g D = γ   α 2 + c g + c v 2 p g D / α 2 . Taking the second-order partial derivative 2 π m D / w t D p g D = 2 γ 1 γ / α 2 > 0 and if π m D / w t D = 0 and π m D / p g D = 0 , then w t D * = 1 + c t / 2 , p g D * = c g + c v + α 2 / 2 . Similarly, taking the optimal retail and wholesale prices under the strategies II D , III D , IV D , and V D , Proposition 2 is obtained. □
Proof of Proposition 3.
Under agent selling, calculations are conducted according to three demand scenarios. Under D 1 , taking the first-order derivatives of p t A and p g A with respect to π r A , it can be derived that π r A / p t A = 1 γ 1 2 p t A w t A   and π r A / p g A = γ α 2 2 p g A + w g A / α 2 . Taking the second-order partial derivative 2 π r A / p t A p g A = 4 γ 1 r / α 2 > 0 , and if π r A / p t A = 0 and π r A / p g A = 0 , then p t A * = 1 + w t A / 2 , p g A * = w g A + α 2 / 2 . According to the condition p g A < α 2 p t A / α 1 to be met by D 1 , the condition w t A > 1 + α 1 + w g A α 1 / α 2 is obtained. Similarly, by taking the optimal retail prices and the conditions to be met under D 2 and D 3 , Proposition 3 is obtained. □
Proof of Proposition 4.
According to Equations (3) and (4), the feasible region can be divided into strategy I A , strategy II A , and strategy III A . By substituting the optimal retail prices of Proposition 1 into the manufacturer’s profit function, the optimal wholesale prices is obtained under the different strategies. Under strategy I A , taking the first-order derivatives of w t A and w g A with respect to π m A , then π m A / w t A = 1 γ 1 + c t 2 w t A   / 2 and π m A / w g A = γ   α 2 + c g 2 w g A / 2 α 2 . Taking the second-order partial derivative π m A 2 / w t A w g A = γ 1 γ / α 2 > 0 , and if π r A / w t A = 0 and π r A / w g A = 0 , it can be obtained that w t A * = 1 + c t / 2 , w g A * = c g + α 2 / 2 . Similarly, taking the optimal retail prices under strategies II A and III A , Proposition 4 is obtained. □
Proof of Corollary 1.
If γ = 1 , according to Proposition 2, the optimal wholesale prices under strategies I D , II D , III D , IV D , and V D can be obtained; thus, w b D * = 1 + c b / 2 , p b D * = 3 + c b / 4 and p g D * = c g + c v + α 2 / 2 in strategy I D ; w b D * = α 1 + c b / 2 , p b D * = a 2 c g a 1 c g + c v 2 / 16 a 1 a 2 a 2 a 1 and p g D * = c g + c v + α 2 / 2 in strategy II D ; w b D * = 1 + c b / 2 and p b D * = 3 + c b / 4 in strategy III D ; w b D * = α 1 c g + c v + α 2 / α 2 1 and p g D * = c g + c v + α 2 / 2 in strategy IV D ; w b D * = α 1 + c b / 2 , p b D * = 3 α 1 α 2 + α 2 c g 2 α 1 2 / 4 α 2 2 α 1 and p g D * = α 2 4 α 2 3 α 1 + c t / 4 α 2 2 α 1 in strategy V D . Substituting the optimal wholesale prices into Proposition 1 and Equations (1) and (2), the following is obtained: (1) if α 1 c b or 2 α 2 α 1 α 2 c g c v < α 1 c b α 2 < α 2 c g c v α 1 2 α 2 α 1 , the manufacturer adopts strategy I D ; (2) If 0 < α 1 c g + c v c t α 2 < 2 α 2 α 1 α 2 c g c v , the manufacturer adopts strategy II D ; and (3) If both (1) and (2) are not satisfied, the manufacturer adopts strategy V D . Therefore, Corollary 1 is obtained. Similarly, according to Propositions 1 and 2, and Equations (1) and (2), Corollary 2 can be obtained, and according to Propositions 3 and 4, and Equations (3) and (4), Corollaries 3 and 4 can be obtained. □
Proof of Proposition 5.
Taking c v = 0 and γ = 1 as an example. According to Equations (3) and (4), the manufacturer’s profit under the agent selling is: (A1) if c g α 1 + 3 c t + 3 α 1 α 2 < 0 , π m 1 A * = α 2 c g 2 / 8 α 2 ; (A2) if c g + α 1 < c t + α 2   &   c t α 2 < c g α 1 , π m 2 A * = α 1 c t 2 / 8 α 1 + α 2 c g α 1 + c t 2 / 8 α 2 α 1 ; (A3) if α 1 > c t , π m 3 A * = α 1 c t 2 / 8 α 1 . According to Equations (1) and (2), the manufacturer’s profit under the direct selling is: (B1) if 2 α 1 c g + α 2 / α 2 < 3 + c t , π m 1 D * = α 2 c g 2 / 8 α 2 ; (B2) if c t c g α 1 / α 2 < 0   &   α 1 2 α 2 c g α 2 c t + 2 α 2 2 c g < 0 , π m 2 D * = α 1 c t 2 / 8 α 1 + α 2 c g α 1 + c t 2 / 8 α 1 + α 2 + α 2 c g 2 / 8 α 2 ; (B3) if α 1 > c t , π m 3 D * = α 2 α 1 c t 2 / 4 α 1 2 α 2 α 1 . If (A1) and (B1) or (A1) and (B2) are satisfied, then π m 1 A * = π m 1 D * and π m 1 A * < π m 2 D * ; if (A2) and (B1) are satisfied, then π m 2 A * π m 1 D * = c t α 2 c g α 1 2 α 1 α 2 α 1 α 2 c g 2 8 α 1 α 2 α 1 α 2 < α 1 2 α 2 c g 2 α 1 α 2 α 1 α 2 c g 2 8 α 1 α 2 α 1 α 2 = c g α 2 2 8 α 1 α 2 < 0 ; if (A2) and (B2) are satisfied, then π m 2 A * < π m 2 D * ; if (A3) and (B3) are satisfied, then π m 3 A * π m 5 D * = α 1 c t 2 8 α 1 2 α 2 < 0 . Therefore, π m A * π m D * is satisfied when c v = 0 and γ = 1 . Similarly, π m A * π m D * when c v = 0 and α 1 = 1 can proved, thus Proposition 5 can be obtained. □
Proof of Corollary 5.
If only producing brown products is the manufacturer’s optimal strategy, the optimal profit of the agent selling is π m A * = α 1 B c t 2 / 8 α 1 B , and the optimal profit of the direct selling is π m D * = α 1 B c t 2 A / 4 α 1 B 2 A α 1 γ with α 1 B c t > 0 or π m A * = α 1 B c t 2 / 8 α 1 B with α 1 B c t 0 . According to α 1 B c t 2 A / 4 α 1 B 2 A α 1 γ α 1 B c t 2 / 8 α 1 B = γ α 1 B c t 2 / 8 B 2 A α 1 γ > 0 , π m D * π m A * is obtained. Thus, Corollary 5 can be obtained. □

Appendix B

Figure A1 reveals that when there is a large difference between green consumers’ preferences for the two kinds of products, namely when α 1 is small, strategies I D and I A will be chosen in the direct- and agent-selling models, respectively; when α 1 is large and the green costs increase, there will be a situation where only brown products are sold in both of the selling models. These results are consistent with the findings shown in Figure 4.
Figure A1. The effects of c g and c v on the pricing strategy choice.
Sustainability 15 10961 g0a1
Figure A2 shows that when green consumers have a low preference for brown products ( α 1 = 0.2 ), if the direct selling channel has a low cost initially, the manufacturer will choose direct selling; otherwise, it will choose agent selling to save costs. This trend becomes particularly obvious when the cost of green products is high. If green consumers have a high preference for brown products ( α 1 = 0.6 ), the manufacturer’s channel choice is influenced more by the cost of green products; thus, it will only choose the direct selling model when the green cost is high. Only when the green cost is low and the cost of the direct sales channel is high will the manufacturer choose the agent selling model. This indicates that in the direct selling model, the manufacturer can save the cost of the intermediary by selling products through its direct sales channel to make up for the high cost of green products. The manufacturer can earn profits this way, but its profits will gradually decrease as the cost of the direct sales channel increases; therefore, the manufacturer will choose the agent selling model.
Figure A2. The effects of c v and c g on channel choice.
Sustainability 15 10961 g0a2

References

  1. Shi, D.; Zhang, W.J.; Zou, G.Y.; Ping, J.K. Advertising and pricing strategies for the manufacturer in the presence of brown and green products. Kybernetes 2022, 51, 1452–1476. [Google Scholar] [CrossRef]
  2. Hong, Z.; Guo, X. Green product supply chain contracts considering environmental responsibilities. Omega 2019, 83, 155–166. [Google Scholar] [CrossRef]
  3. Li, G.; Li, L.; Choi, T.M.; Sethi, S.P. Green supply chain management in Chinese firms: Innovative measures and the moderating role of quick response technology. J. Oper. Manag. 2020, 66, 958–988. [Google Scholar] [CrossRef]
  4. Ghazali, I.; Abdul-Rashid, S.H.; Dawal, S.Z.M.; Irianto, I.; Herawan, S.G.; Ho, F.H.; Abdullah, R.; Rasib, A.H.A.; Padzil, N.W.S. Embedding green product attributes preferences and cultural consideration for product design development: A conceptual framework. Sustainablilty 2023, 15, 4542. [Google Scholar] [CrossRef]
  5. Dey, K.; Roy, S.; Saha, S. The impact of strategic inventory and procurement strategies on green product design in a two-period supply chain. Int. J. Prod. Res. 2018, 57, 1915–1948. [Google Scholar] [CrossRef]
  6. Inman, R.A.; Green, K.W. Lean and green combine to impact environmental and operational performance. Int. J. Prod. Res. 2018, 56, 4802–4818. [Google Scholar] [CrossRef]
  7. Zhang, L.; Zhou, H. The optimal green product design with cost constraint and sustainable policies for the manufacturer. Math. Probl. Eng. 2019, 2019, 7841097. [Google Scholar] [CrossRef] [Green Version]
  8. Singh, G.; Biswas, I.; Srivastava, K.S. Managing supply chain with green and non-green products: Channel coordination and information asymmetry. Manag. Decis. Econ. 2022, 44, 1359–1372. [Google Scholar] [CrossRef]
  9. Xiao, T.; Choi, T.M.; Cheng, T.C.E. Product variety and channel structure strategy for a retailer-Stackelberg supply chain. Eur. J. Oper. Res. 2014, 233, 114–124. [Google Scholar] [CrossRef]
  10. Cao, E.; Ma, Y.; Wan, C.; Lai, M. Contracting with asymmetric cost information in a dual-channel supply chain. Oper. Res. Lett. 2013, 41, 410–414. [Google Scholar] [CrossRef]
  11. Hafezalkotob, A. Competition of two green and regular supply chains under environmental protection and revenue seeking policies of government. Comput. Ind. Eng. 2015, 82, 103–114. [Google Scholar] [CrossRef]
  12. Li, B.; Zhu, M.; Jiang, Y.; Li, Z. Pricing policies of a competitive dual-channel green supply chain. J. Clean. Prod. 2016, 112, 2029–2042. [Google Scholar] [CrossRef]
  13. Xing, W.; Zou, J.; Liu, T.L. Integrated or decentralized: An analysis of channel structure for green products. Comput. Ind. Eng. 2017, 112, 20–34. [Google Scholar] [CrossRef]
  14. Yi, Z.; Wang, Y.; Liu, Y.; Chen, Y.J. The impact of consumer fairness seeking on distribution channel selection: Direct selling vs. agent selling. Prod. Oper. Manag. 2018, 27, 1148–1167. [Google Scholar] [CrossRef]
  15. Ranjan, A.; Jha, J.K. Pricing and coordination strategies of a dual-channel supply chain considering green quality and sales effort. J. Clean. Prod. 2019, 218, 409–424. [Google Scholar] [CrossRef]
  16. Wang, L.; Song, Q. Pricing policies for dual-channel supply chain with green investment and sales effort under uncertain demand. Math. Comput. Simulat. 2019, 171, 79–93. [Google Scholar] [CrossRef]
  17. Zhang, R.; Ma, W.; Si, H.; Liu, J.; Liao, L. Cooperative game analysis of coordination mechanisms under fairness concerns of a green retailer. J. Retail. Consum. Serv. 2021, 59, 102361. [Google Scholar] [CrossRef]
  18. Huang, S.; Guan, X.; Chen, Y.J. Retailer information sharing with supplier encroachment. Prod. Oper. Manag. 2018, 27, 1133–1147. [Google Scholar] [CrossRef]
  19. Alba, J.; Lynch, J.; Weitz, B.; Janiszewski, C.; Lutz, R.; Sawyer, A.; Wood, S. Interactive home shopping: Consumer, retailer, and manufacturer incentives to participate in electronic marketplaces. J. Mark. 1997, 61, 38–53. [Google Scholar] [CrossRef] [Green Version]
  20. Lee, S.Y.; Klassen, R.D. Drivers and enablers that foster environmental management capabilities in small- and medium-sized suppliers in supply chains. Prod. Oper. Manag. 2008, 17, 573–586. [Google Scholar] [CrossRef]
  21. Zhang, Q.; Zhao, Q.; Zhao, X. Manufacturer’s product choice in the presence of environment-conscious consumers: Brown product or green product. Int. J. Prod. Res. 2019, 57, 7423–7438. [Google Scholar] [CrossRef]
  22. Moser, A.K. Consumers’ purchasing decisions regarding environmentally friendly products: An empirical analysis of German consumers. J. Retail. Consum. Serv. 2016, 31, 389–397. [Google Scholar] [CrossRef]
  23. Kumar, B.; Manrai, A.K.; Manrai, L.A. Purchasing Behaviour for Environmentally Sustainable Products: A Conceptual Framework and Empirical Study. J. Retail. Consum. Serv. 2017, 34, 1–9. [Google Scholar] [CrossRef]
  24. Cheung, M.F.Y.; To, W.M. An extended model of value-attitude-behavior to explain Chinese consumers’ green purchase behavior. J. Retail. Consum. Serv. 2019, 50, 145–153. [Google Scholar] [CrossRef]
  25. Simanjuntak, M.; Nafila, N.L.; Yuliati, L.N.; Johan, I.R.; Najib, M.; Sabri, M.F. Environmental care attitudes and intention to purchase green products: Impact of environmental knowledge, word of mouth, and green marketing. Sustainability 2023, 15, 5445. [Google Scholar] [CrossRef]
  26. Yenipazarli, A.; Vakharia, A. Pricing, market coverage and capacity: Can green and brown products co-exist. Eur. J. Oper. Res. 2015, 242, 304–315. [Google Scholar] [CrossRef]
  27. Zhang, Q.; Zhao, Q.; Zhao, X.; Tang, L. On the introduction of green product to a market with environmentally conscious consumers. Comput. Ind. Eng. 2020, 139, 106190. [Google Scholar] [CrossRef]
  28. Agi, M.A.N.; Yan, X. Greening products in a supply chain under market segmentation and different channel power structures. Int. J. Prod. Econ. 2020, 223, 1–17. [Google Scholar] [CrossRef]
  29. Jamali, M.B.; Rasti-Barzoki, M. A game theoretic approach for green and non-green product pricing in chain-to-chain competitive sustainable and regular dual-channel supply chains. J. Clean. Prod. 2018, 170, 1029–1043. [Google Scholar] [CrossRef]
  30. Dong, C.; Liu, Q.; Shen, B. To be or not to be green? Strategic investment for green product development in a supply chain. Transp. Res. Part E Logist. Transp. Rev. 2019, 131, 193–227. [Google Scholar] [CrossRef]
  31. Basiri, Z.; Heydari, J. A mathematical model for green supply chain coordination with substitutable products. J. Clean. Prod. 2017, 145, 232–249. [Google Scholar] [CrossRef] [Green Version]
  32. Shen, B.; Cao, Y.; Xu, X. Product line design and quality differentiation for green and non-green products in a supply chain. Int. J. Prod. Res. 2020, 58, 148–164. [Google Scholar] [CrossRef]
  33. Raza, S.A.; Govindaluri, M.G. Pricing strategies in a dual-channel green supply chain with cannibalization and risk aversion. Oper. Res. Perspect. 2019, 6, 100118. [Google Scholar] [CrossRef]
  34. Hosseini-Motlagh, S.M.; Ebrahimi, S.; Jokar, A. Sustainable supply chain coordination under competition and green effort scheme. J. Oper. Res. Soc. 2019, 6, 1–16. [Google Scholar] [CrossRef]
  35. Heydari, J.; Govindan, K.; Basiri, Z. Balancing price and green quality in presence of consumer environmental awareness: A green supply chain coordination approach. Int. J. Prod. Res. 2021, 59, 1957–1975. [Google Scholar] [CrossRef]
  36. Shen, B.; Choi, T.M.; Chan, H.L. Selling green first or not? A Bayesian analysis with service levels and environmental impact considerations in the Big Data Era. Technol. Forecast. Soc. Change 2019, 144, 412–420. [Google Scholar] [CrossRef]
  37. Ingene, C.A.; Parry, M.E. Mathematical Models of Distribution Channels; Springer: Berlin/Heidelberg, Germany, 2004. [Google Scholar]
  38. Li, K.; Liu, X.Y.; Jacobson, D. Information and profit sharing between a buyer and a supplier: Theory and practice. Manag. Decis. Econ. 2018, 39, 79–90. [Google Scholar] [CrossRef]
  39. Gong, B.; Zhang, H.; Gao, Y.; Liu, Z. Blockchain adoption and channel selection strategies in a competitive remanufacturing supply chain. Comput. Ind. Eng. 2022, 175, 108829. [Google Scholar] [CrossRef]
  40. Zhong, Y.; Yang, T.; Yu, H.; Zhong, S.; Xie, W. Impacts of blockchain technology with government subsidies on a dual-channel supply chain for tracing product information. Transp. Res. Part E Logist. Transp. Rev. 2023, 171, 103032. [Google Scholar] [CrossRef]
  41. Desai, P.; Koenigsberg, O.; Purohit, D. Strategic decentralization and channel coordination. Quant. Mark. Econ. 2004, 2, 5–22. [Google Scholar] [CrossRef] [Green Version]
  42. Arya, A.; Mittendorf, B. Enhancing vertical efficiency through horizontal licensing. J. Regul. Econ. 2006, 29, 333–342. [Google Scholar] [CrossRef]
  43. Zhao, M.; Dong, C.; Cheng, T.C.E. Quality disclosure strategies for small business enterprises in a competitive marketplace. Eur. J. Oper. Res. 2018, 270, 218–229. [Google Scholar] [CrossRef]
  44. Zhang, C.; Li, Y.; Ma, Y. Direct selling, agent selling, or dual-format selling: Electronic channel configuration considering channel competition and platform service. Comput. Ind. Eng. 2021, 157, 107368. [Google Scholar] [CrossRef]
  45. Wang, Y.Y.; Fan, R.; Shen, L.; Jin, M. Decisions and coordination of green e-commerce supply chain considering green manufacturer’s fairness concerns. Int. J. Prod. Res. 2020, 58, 7471–7489. [Google Scholar] [CrossRef]
  46. Liu, Y.; Zhang, S.; Jia, F.; Wu, Z. Channel competition and coordination of E-commerce platforms under low-carbon environment: A cooperative game approach. Math. Probl. Eng. 2022, 3, 3595327. [Google Scholar] [CrossRef]
  47. Cao, K.; Su, Y.; Xu, Y.; Guo, Q. Channel selection for retailers in platform economy under cap-and-trade policy considering different power structures. Electron. Commer. Res. Appl. 2022, 56, 101205. [Google Scholar] [CrossRef]
  48. Yang, D.; Xiao, T.; Huang, J. Dual-channel structure choice of an environmental responsibility supply chain with green investment. J. Clean. Prod. 2019, 210, 134–145. [Google Scholar] [CrossRef]
  49. Zhou, H.; Duan, Y. Online channel structures for green products with reference greenness effect and consumer environmental awareness (CEA). Comput. Ind. Eng. 2022, 170, 108350. [Google Scholar] [CrossRef]
  50. Zhang, P.; He, Y.; Shi, C. Retailer’s channel structure choice: Online channel, offline channel, or dual channels. Int. J. Prod. Econ. 2017, 191, 37–50. [Google Scholar] [CrossRef]
Figure 1. Supply chain selling channels.
Sustainability 15 10961 g001
Figure 2. Feasible region for the retailer’s decision in the direct selling.
Sustainability 15 10961 g002
Figure 3. Feasible region for the retailer’s decision in the agent selling.
Sustainability 15 10961 g003
Figure 4. The effects of α 1 and γ on the pricing strategies in direct selling model.
Sustainability 15 10961 g004
Figure 5. The effects of α 1 and γ on the pricing strategies in agent selling model.
Sustainability 15 10961 g005
Figure 6. The effects of γ on p .
Sustainability 15 10961 g006
Figure 7. The effects of α 1 on p .
Sustainability 15 10961 g007
Figure 8. The effects of γ and α 1 on channel choice.
Sustainability 15 10961 g008
Figure 9. The effects of γ on d .
Sustainability 15 10961 g009
Figure 10. The effects of γ on π .
Sustainability 15 10961 g010
Figure 11. The effects of α 1 on d .
Sustainability 15 10961 g011
Figure 12. The effects of α 1 on π .
Sustainability 15 10961 g012
Table 1. Comparison between this paper and previous studies.
AuthorProduct TypesSelling ChannelsKey FactorsProducts Competition
Brown ProductsGreen ProductsDirect SellingAgent SellingGreen Demand ScaleConsumer Preference
Ranjan and Jha [15]
Wang and Song [16]
Zhang et al. [17]
Zhang et al. [21]
Yenipazarli and Vakharia [26]
Zhang et al. [27]
Agi and Yan [28]
Jamali and Rasti-Barzoki [29]
Basiri and Heydari [31]
Shen et al. [32]
Raza and Govindaluri [33]
Hosseini-Motlagh et al. [34]
Heydari et al. [35]
Shen et al. [36]
Zhang et al. [44]
Yang et al. [48]
Zhou and Duan [49]
Our work
Table 2. Notations used in the paper.
NotationDescription
Decision Variables
p b i Retail   price   of   brown   products   under   direct   ( i = D )   or   agent   ( i = A ) selling channel
p g i Retail   price   of   green   products   under   direct   ( i = D )   or   agent   ( i = A ) selling channel
w b i Wholesale   price   of   brown   products   under   direct   ( i = D )   or   agent   ( i = A ) selling channel
w g i Wholesale   price   of   green   products   under   direct   ( i = D )   or   agent   ( i = A ) selling channel
c v Sales cost per unit of green product through the direct selling channel
c b Unit production costs of brown products
c g Unit production costs of green products
γ Proportion of green consumers in the market
α 1 Preference coefficient of green consumers for brown products
α 2 Preference coefficient of green consumers for green products
d b Demand of brown products
d g Demand of green products
Disclaimer/Publisher’s Note: The statements, opinions and data contained in all publications are solely those of the individual author(s) and contributor(s) and not of MDPI and/or the editor(s). MDPI and/or the editor(s) disclaim responsibility for any injury to people or property resulting from any ideas, methods, instructions or products referred to in the content.