Article

Reconstruction and Trends of Total Phosphorus in Shallow Lakes in Eastern China in The Past Century

1
State Key Laboratory of Lake Science and Environment, Nanjing Institute of Geography and Limnology, Chinese Academy of Sciences, 73 East Beijing Road, Nanjin 210008, China
2
University of Chinese Academy of Sciences, No.1 Yanqihu East Rd, Beijing 101408, China
3
College of Geography and Environment, Shandong Normal University, Jinan 250014, China
*
Author to whom correspondence should be addressed.
Sustainability 2023, 15(14), 10893; https://doi.org/10.3390/su151410893
Submission received: 9 February 2023 / Revised: 11 April 2023 / Accepted: 6 July 2023 / Published: 11 July 2023

Abstract

:
Lake eutrophication due to excessive nutrient enrichment by human activity is one of the most studied ecosystem regime shifts. The suddenness and irreparability of such eutrophication in shallow lakes cause substantial socio-economic losses, especially in fast-developing areas in eastern China. Although eutrophication has been well documented in many lakes, a regional assessment of the eutrophication process is still missing. Here, we provided a regional assessment of water phosphorus changes since 1900 in eutrophic lakes in eastern China using paleolimnological records and diatom-/chironomid-TP transfer functions. We collated the reconstructed water total phosphorus (TP) of ten lakes and reconstructed the other five records based on identified diatom compositions in sediment cores from previous papers. We found three trend types of decrease, increase and fluctuate in the fifteen TP reconstructions according to cluster analysis of the data correlation results. Increase is the dominated trend, in which TP changes are highly correlated. Among eight lakes with an increasing nutrient, the time-series TP data of six lakes fit step functions better than linear regression models, indicating the main non-linear change in lake nutrient levels over time. Our results show how integrating spatial information on a large scale from paleolimnological records highlights the eutrophication process and further benefits current lake management.

1. Introduction

Lakes are often described as sentinels of global change. Under changing climate, increasing population and economic development, lake ecosystems in general have experienced eutrophication, algal blooms, biodiversity loss and other problems over the last century [1,2,3]. The suddenness and irreparability of lake ecosystem degeneration and ecosystem service loss cause substantial socio-economic losses [4]. The risk of regime shifts in ecosystems including, but not limited to, lakes, oceans and forests will increase with future global changes [5]. Research on ecosystem resilience and mechanisms is urgently needed to recover and prevent current and potential ecosystem degeneration.
Eutrophication can be referred to as a natural and gradual process in aquatic ecosystems. Caused by excessive human activity, over-enrichment of aquatic ecosystems with nutrients will lead to algal blooms and anoxic events. Such cultural eutrophication is a widespread environmental problem and also one of the most studied ecosystem regime shifts [6,7,8]. Under changing climate conditions and anthropogenic stress, ecosystems differ greatly in their dynamics and stability over time, with some displaying relative constancy, others varying predictably over longer time periods and yet others changing non-linearly and shifting between alternative stable states [9,10,11]. A critical transition is identified when such a regime shift happens at no or stable changing of external drivers and is normally characterized by a hysteresis in the driver [12,13]. When the driver is slowly increased and then decreased again, the ecosystem jumps between two alternative states. In order for the system to change back to the ‘‘original’’ state, the driver must exceed a second critical threshold, lower than the first. Many research papers use methods such as models [14,15], experiments [16] and field investigations [17,18,19] to quantify ecosystem regime shifts or critical transitions to provide potential early warning signals and analyze possible mechanisms. For example, Gilarranz et al. [20] found that 12.8% of 1015 lakes globally showed regime shifts in lake productivity between 2002 and 2012 and the number of detected regime shifts increased over time. Although intensive efforts have been made to confirm the existence of non-linear changes in ecosystem states on either time or driver scales [21,22,23,24], the prevalence of regime shifts and critical transitions is still questioned and needs to be statistically described. Gradual changes over time reported in lakes [25], streams [26] and other ecosystems are supposed to be less catastrophic to the public in the short term, whereas the neglect of which can impede our comprehensive knowledge of ecosystem stability and mechanisms.
Phosphorus loading is generally regarded as the main driver for lake eutrophication, and external nutrient control is the keystone for lake restoration [27,28,29,30]. Nutrient enrichment from basin to lake water can facilitate algal growth and weaken the clear water state maintenance using macrophytes through the bottom-up effect [31,32] and feedback mechanism between ecosystem factors [33]. The total phosphorus concentration in lake water (TP) is usually used as a surrogate because phosphorus loading is often difficult to measure [34]. Internal nutrient release from sediment also influences water TP. For instance, internal P loading is found to induce weaker decrease effects in water TP in shallow Danish lakes after a reduction in mainly external P loading, thus delaying recovery [35]. The water nutrient level is in fact a state variable of lake ecosystems, as it is the result of interactions between external processes and internal processes. Therefore, knowing the appearances of abrupt change in historical TP in regional lake ecosystems will help to understand the process of regime shifts, further benefiting ecosystem restoration and/or preservation.
Multiple methods can reveal temporal lake ecosystem changes at a regional scale. Long-term observation and remotely sensed data can provide relatively accurate data of lake state variables [20], but it is limited by data availability, especially in developing places, as the history of systematic monitoring and remote sensing is short compared to the changing time of recent regime shifts. For example, comprehensive lake investigations started in the 1980s in eastern China [36]; whereas, rapid changes can be found before 1950 in lake structure changes in the past century [37]. The stabilization of lake ecosystems is generally considered to take at least 10–20 years [38]. The paleolimnological records can provide long-term information on the succession of biological communities, helping us to understand their responses to environmental stress [6,39,40]. Intensive efforts have been made to reveal constant changes in nutrient, hydrology and vegetation using indices including diatoms, geochemical records and chironomids [41,42,43]. Transfer function methods enable the reconstructing of historical environmental indicators such as lake pH, salinity, nutrients and water temperature according to current ecological characteristics of biological groups and historical stratigraphic fossil data [44,45]. The diatom-total phosphorus (DI-TP) and chironomid-total phosphorus (CI-TP) transfer functions [46,47] were provided to reveal phosphorus changes on the assumption that TP is a strong controlling variable in diatom and chironomid assemblage composition and abundance.
China has a total of 2759 lakes with an area over 1 km2. About one-third of these lakes are freshwater ones, mostly distributed along the eastern coast and in the middle and lower reaches of the Yangtze River. Freshwater lakes in eastern China make up 60–70% of all freshwater lakes in China. Influenced by geographical features and population distribution, lake ecosystems in northern China tend to respond to climate while southern lakes are driven more by human activity [36,48]. Lake water eutrophication, initiated since the 1980s, has become one of the most important factors impeding sustainable economic development in China, especially in the most densely populated areas such as the eastern region [49,50,51]. Monitoring data showed that the TP concentrations of most shallow lakes rose to more than 0.1 mg/L from the 1980s to after 2000 [52]. The outbreak of algal blooms in Lake Taihu in 2007 caused drinking water shortages in several cities. Studies based on sediment record show that lakes such as Taihu and Chaohu experienced abrupt increases in nutrient level and algal growth since the 1970s due to excessive external nutrient loadings and hydrological regulations [53,54]. Both observation and paleolimnological data recorded the fact of increasing TP nutrients in lake water; whereas, few studies reveal the (dis)similarity between TP trends on long timescales. The DI-TP and CI-TP transfer functions in the middle and lower reaches of the Yangtze River have been generated [55,56,57]. Using these transfer functions, researchers reconstructed the historical water TP change in main shallow lakes [58,59] and inferred the reference condition of water TP in this region.
Here, we provide a regional assessment of phosphorus changes since 1900 in eutrophic lakes in eastern China using paleolimnological records and DI-TP or CI-TP transfer functions. Phosphorus changes in five typical lakes in the middle and lower reaches of the Yangtze River have been collated previously to reveal the regional reference condition of lake nutrient levels [59]. However, the regional historical TP change cannot be characterized without statistical analysis between different trends, probably due to insufficient amounts of data. More researchers provided TP reconstructions in other lakes thereafter, and more water TP trends can be reconstructed in other lakes with identified diatom assemblages in sediment cores, such as those from Liangzi and Xiliang Lakes [60,61], using the DI-TP transfer function. Few studies synthesize these records and provide a regional report of historical water nutrient changes. Therefore, our assessment is based on the collation of both TP reconstructions and identified diatom composition data in sediment cores of typical shallow lakes from previous papers. Specifically, we address the following questions: (1) Were there different trend types in collated TP records? (2) Can we detect whether there was the prevalence of non-linear changes in the main trend type? (3) Can the findings serve future restoration of lake eutrophication and how? The purpose of the study is to test quantifying lake nutrient dynamics from the paleolimnological record at a regional scale, highlight regime shift prevalence in eutrophication and further benefit effective lake management.

2. Materials and Methods

2.1. Data Collection and Reconstruction

Ten reconstructed TP values and four reported diatom compositions of sediment cores in typical shallow lakes in eastern China were collected from publications before November 2022 from China National Knowledge Infrastructure (https://www.cnki.net/, accessed on 15 December 2022) and Web of Science (https://www.webofscience.com, accessed on 15 December 2022). We used keywords including “total phosphorus”, “transfer function” and “eastern China” and selected paleolimnological data that can cover more than thirty years from 1900 to 2022. Zheng Jianan provided the identified diatom composition of Lake Futou (FTH) (unpublished data). Authors of these ten original papers reconstructed TP based on paleolimnological records (diatom or chironomid). Sedimentary diatom data of 5 lakes were used in this paper to calculate 5 water TP trends. Fifteen lakes were studied in total, located in the middle and lower reaches of the Yangtze River (Figure 1). Half of the freshwater lake area in China was distributed in the study location, which is under intense human activity. Varied in area size, current trophic conditions (TP observation in 2019, unpublished data) and sediment diatom composition changes, these lakes represent the typical historical environment changes in this region (Table 1). Time intervals of collected paleolimnological data ranged from 506 years (CH) to 38 years (SH), and data between 1900 and 2022 were selected.
We reconstructed historical TP changes in five lakes using identified diatom assemblages and DI-TP transfer function in the middle and lower reaches of the Yangtze River. Lake sediment samples from forty-three lakes were used to generate the transfer function using weighted averaging (WA) with inverse deshrinking, as TP was the most important and significant variable in explaining the diatom distributions revealed by canonical correspondence analysis [62]. The generation of diatom-based transfer function contained two steps [63]. Firstly, numerical methods were used to determine the key measured environmental factors influencing the surface sediment diatom distributions. Secondly, several WA models were used to develop transfer functions. See papers for the dataset and detailed steps to generate this transfer function. This model had low predictive error (root mean squared error of prediction; RMSEPjack = 0.12) and a high coefficient of prediction (R2jack = 0.82), comparable with regional TP models elsewhere [55,57]. Calculations of TP reconstruction were performed using the program C2 [64]. As we are more interested in relative trend in time, reconstructed data were normalized before analysis.
Table 1. Information and data resources of fifteen lakes.
NameSurface (km2)Depth (m)2019-TP (mg/L)Reconstructed TP (mg/L)Time and Resource
CH7703.00 0.081500–2006 [65]
DTH80.12.580.290.101840–2019 [66]
DSH63.72.10 0.091920–2009 [67]
FTH *114.72.000.100.071806–2019 (unpublished)
HH344.41.600.070.051823–1996 [59]
LGH316.22.080.110.051815–1998 [62]
LZH *304.32.100.080.071850–2011 [60]
SH3.52.000.590.141973–2011 [68]
STH23.31.52 0.081867–2010 [69]
TBH25.12.750.510.081850–2006 [70]
TH23381.89 0.081830–2001 [54]
WSH16.13.100.210.161860–2007 [71]
XLH *72.11.930.070.061885–2020 [61]
ZDH *35.21.2 0.071863–2011 [69]
PYH *29335.1 0.061944–2011 [72]
The abbreviation 2019-TP is the water TP value observed in 2019, and reconstructed is average value of TP reconstruction based on DI-TP or CI-TP transfer functions. * Represents lake in which TP was reconstructed in this paper using data of diatom assemblages from published papers.

2.2. Statistical Analysis

We first applied Pearson correlation to analyze the similarity of TP trends based on basic function “cor” in R program. The method “pairwise.complete.obs” was selected for handling missing values of each pair of TP trends with different time intervals and resolutions. We visualized correlation results clustered by “average” method using the package “pheatmap”. Pearson r-values of statistically significant relationships (p < 0.05) were displayed. Given that non-linear changes over time were observed in reconstructed TP trends, we used general additive models (GAMs) to fit and assess the consistent change patterns of each trend. This analysis was carried out using the “geom_smooth” function in the R package ggplot 2–3.3.5 [73]. Then, to assess the linear or non-linear relationships between system states and times, we fitted data to two alternative patterns of response: gradual change and abrupt transition. The R2 values allowed us to compare the robustness of fitting, and the p-values were listed for comparison. We used the R code by [37] to conduct this analysis.

3. Results

3.1. TP Reconstructions and Trends

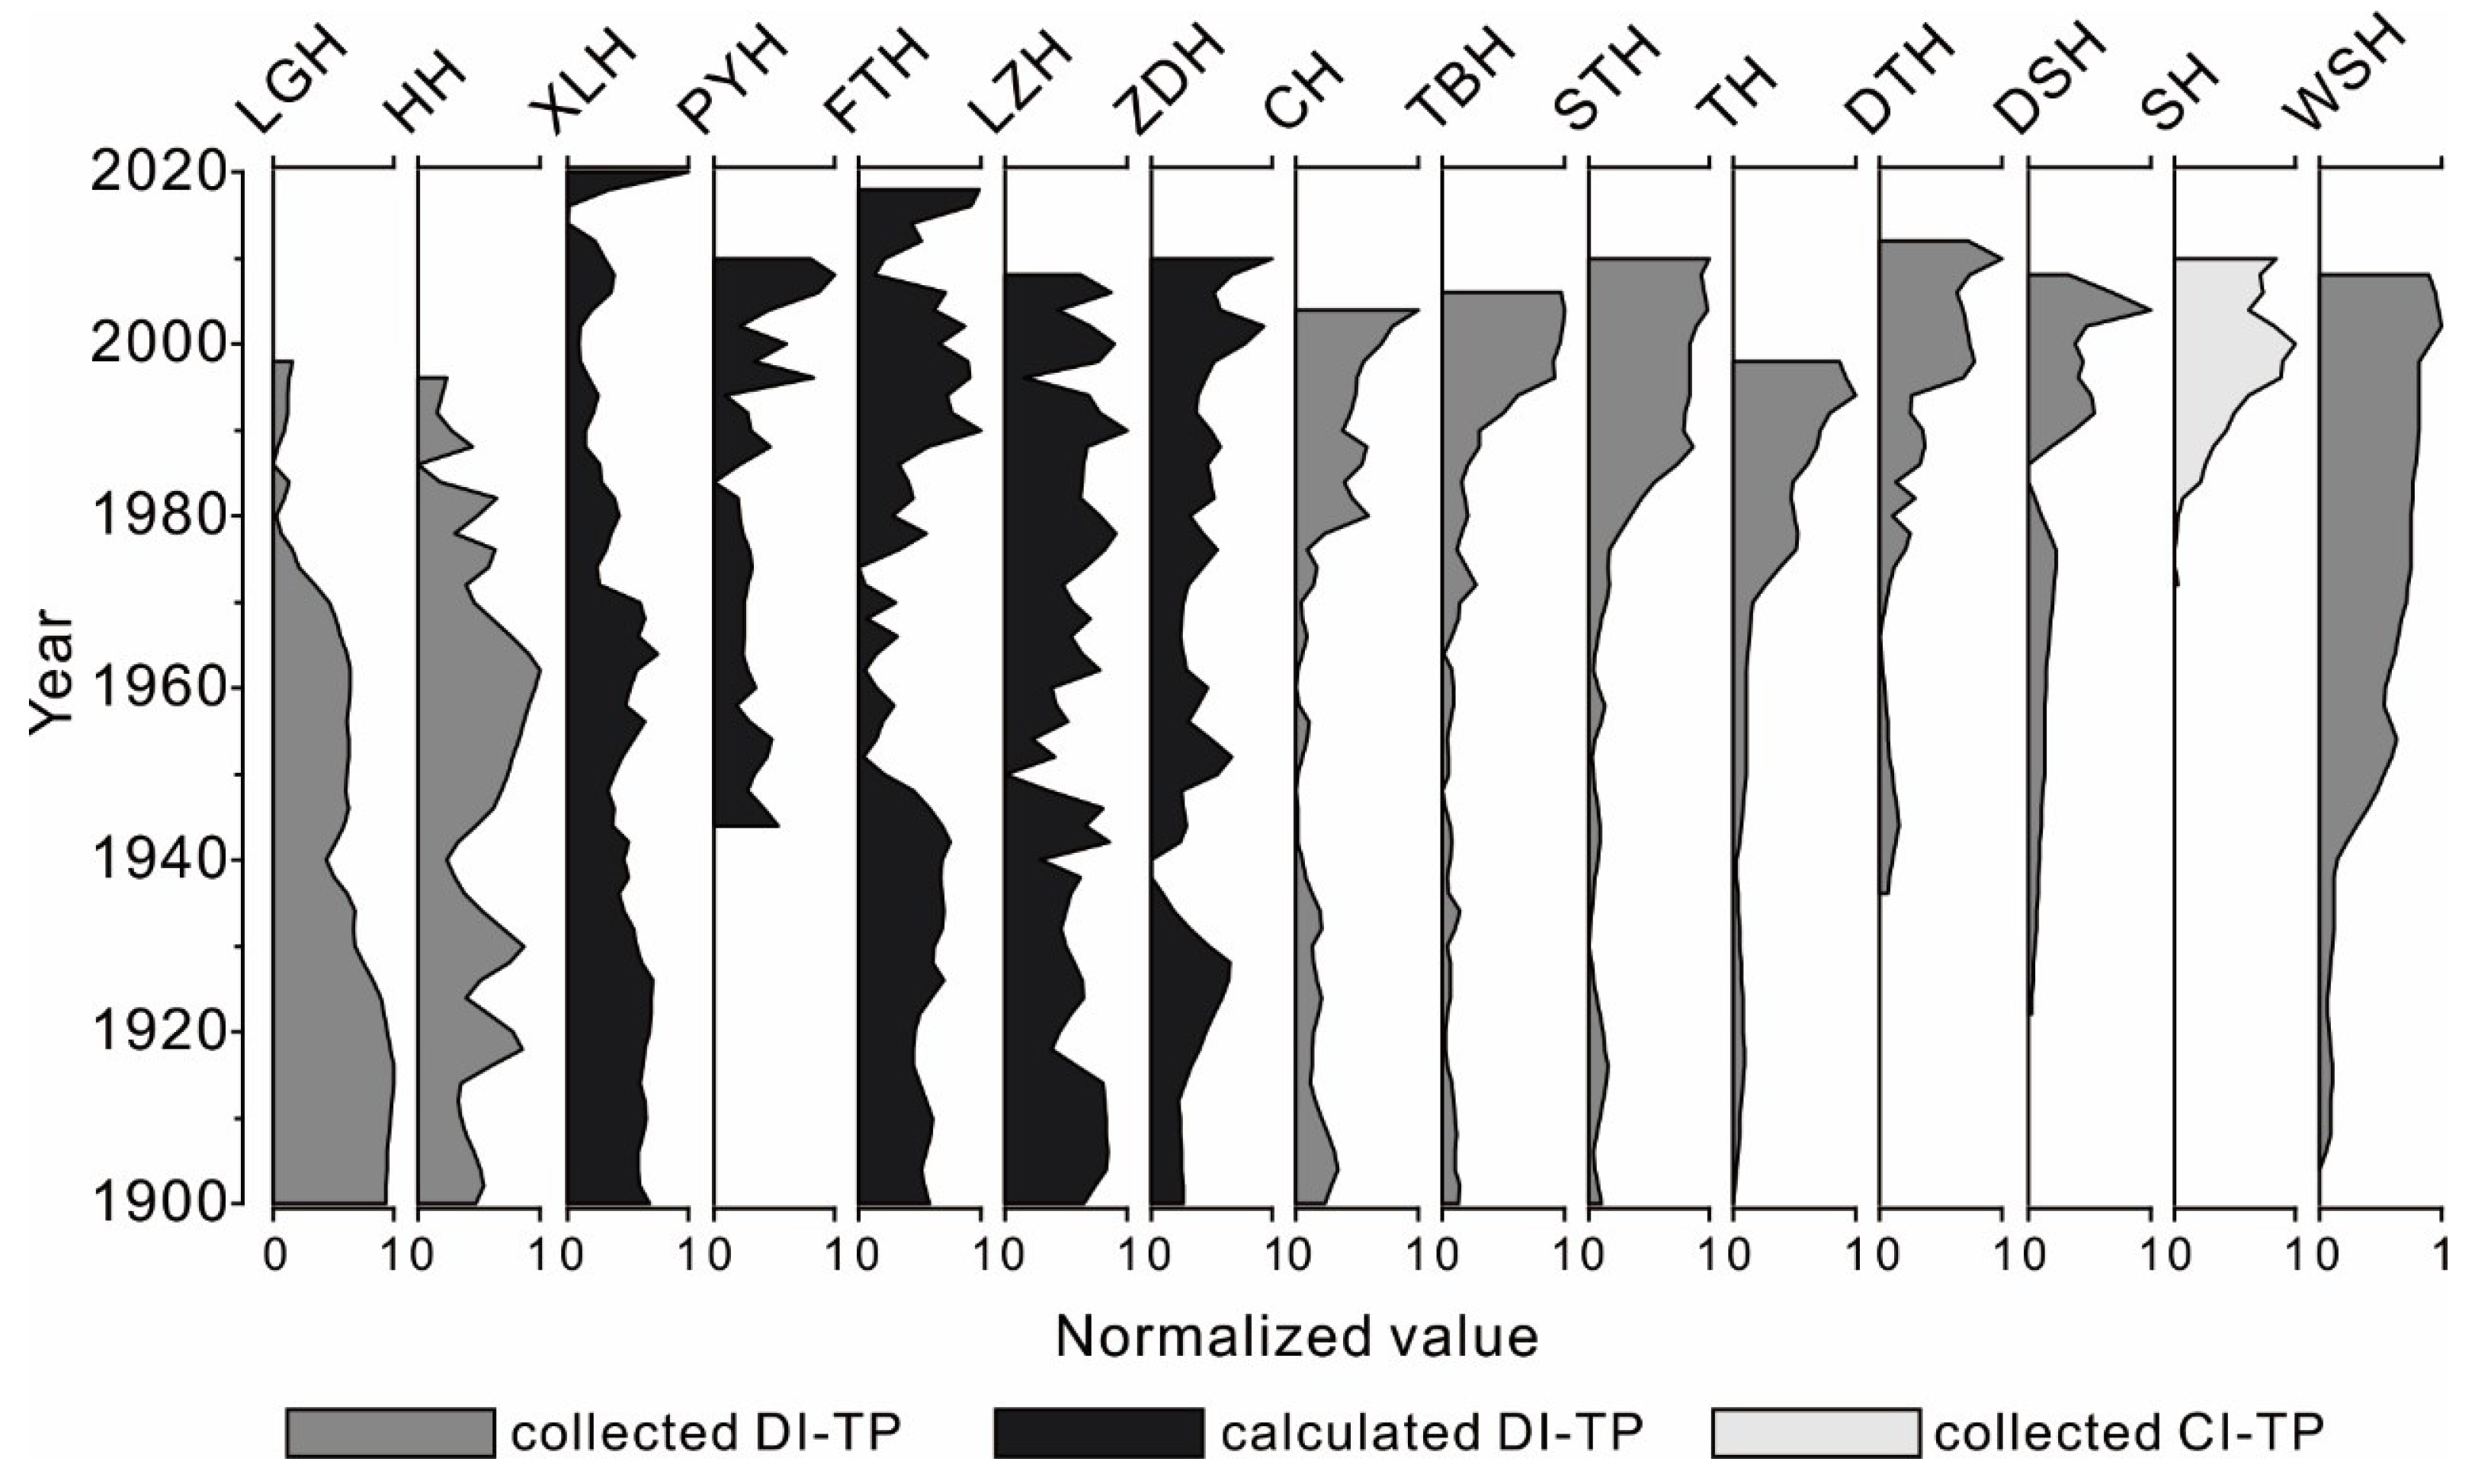
The average values, normalized trends and correlation analysis results of TP reconstruction in fifteen typical lakes in the middle and lower Yangtze River basins are listed in Table 1 and Figure 2 and Figure 3. The average values of reconstructed TP from 1900 to 2022 in fifteen lakes vary from 0.05 to 0.16 mg/L and are relatively consistent with TP observations from 2019 (Table 1). The normalized TP trends are shown according to the rank of average values (Figure 2). One lake (Lake Shahu, SH) has reconstructed TP data from the chromide-TP transfer function, and fourteen lakes, including Lakes Chaohu (CH) and Taihu (TH), have data from the DI-TP transfer function. Lakes such as Longganhu (LGH) and Honghu (HH) have a relative low water TP level and a decrease trend since the last century; whereas, other lakes such as Shahu and Wushanhu have a higher average TP value and experience an increase trend in history.
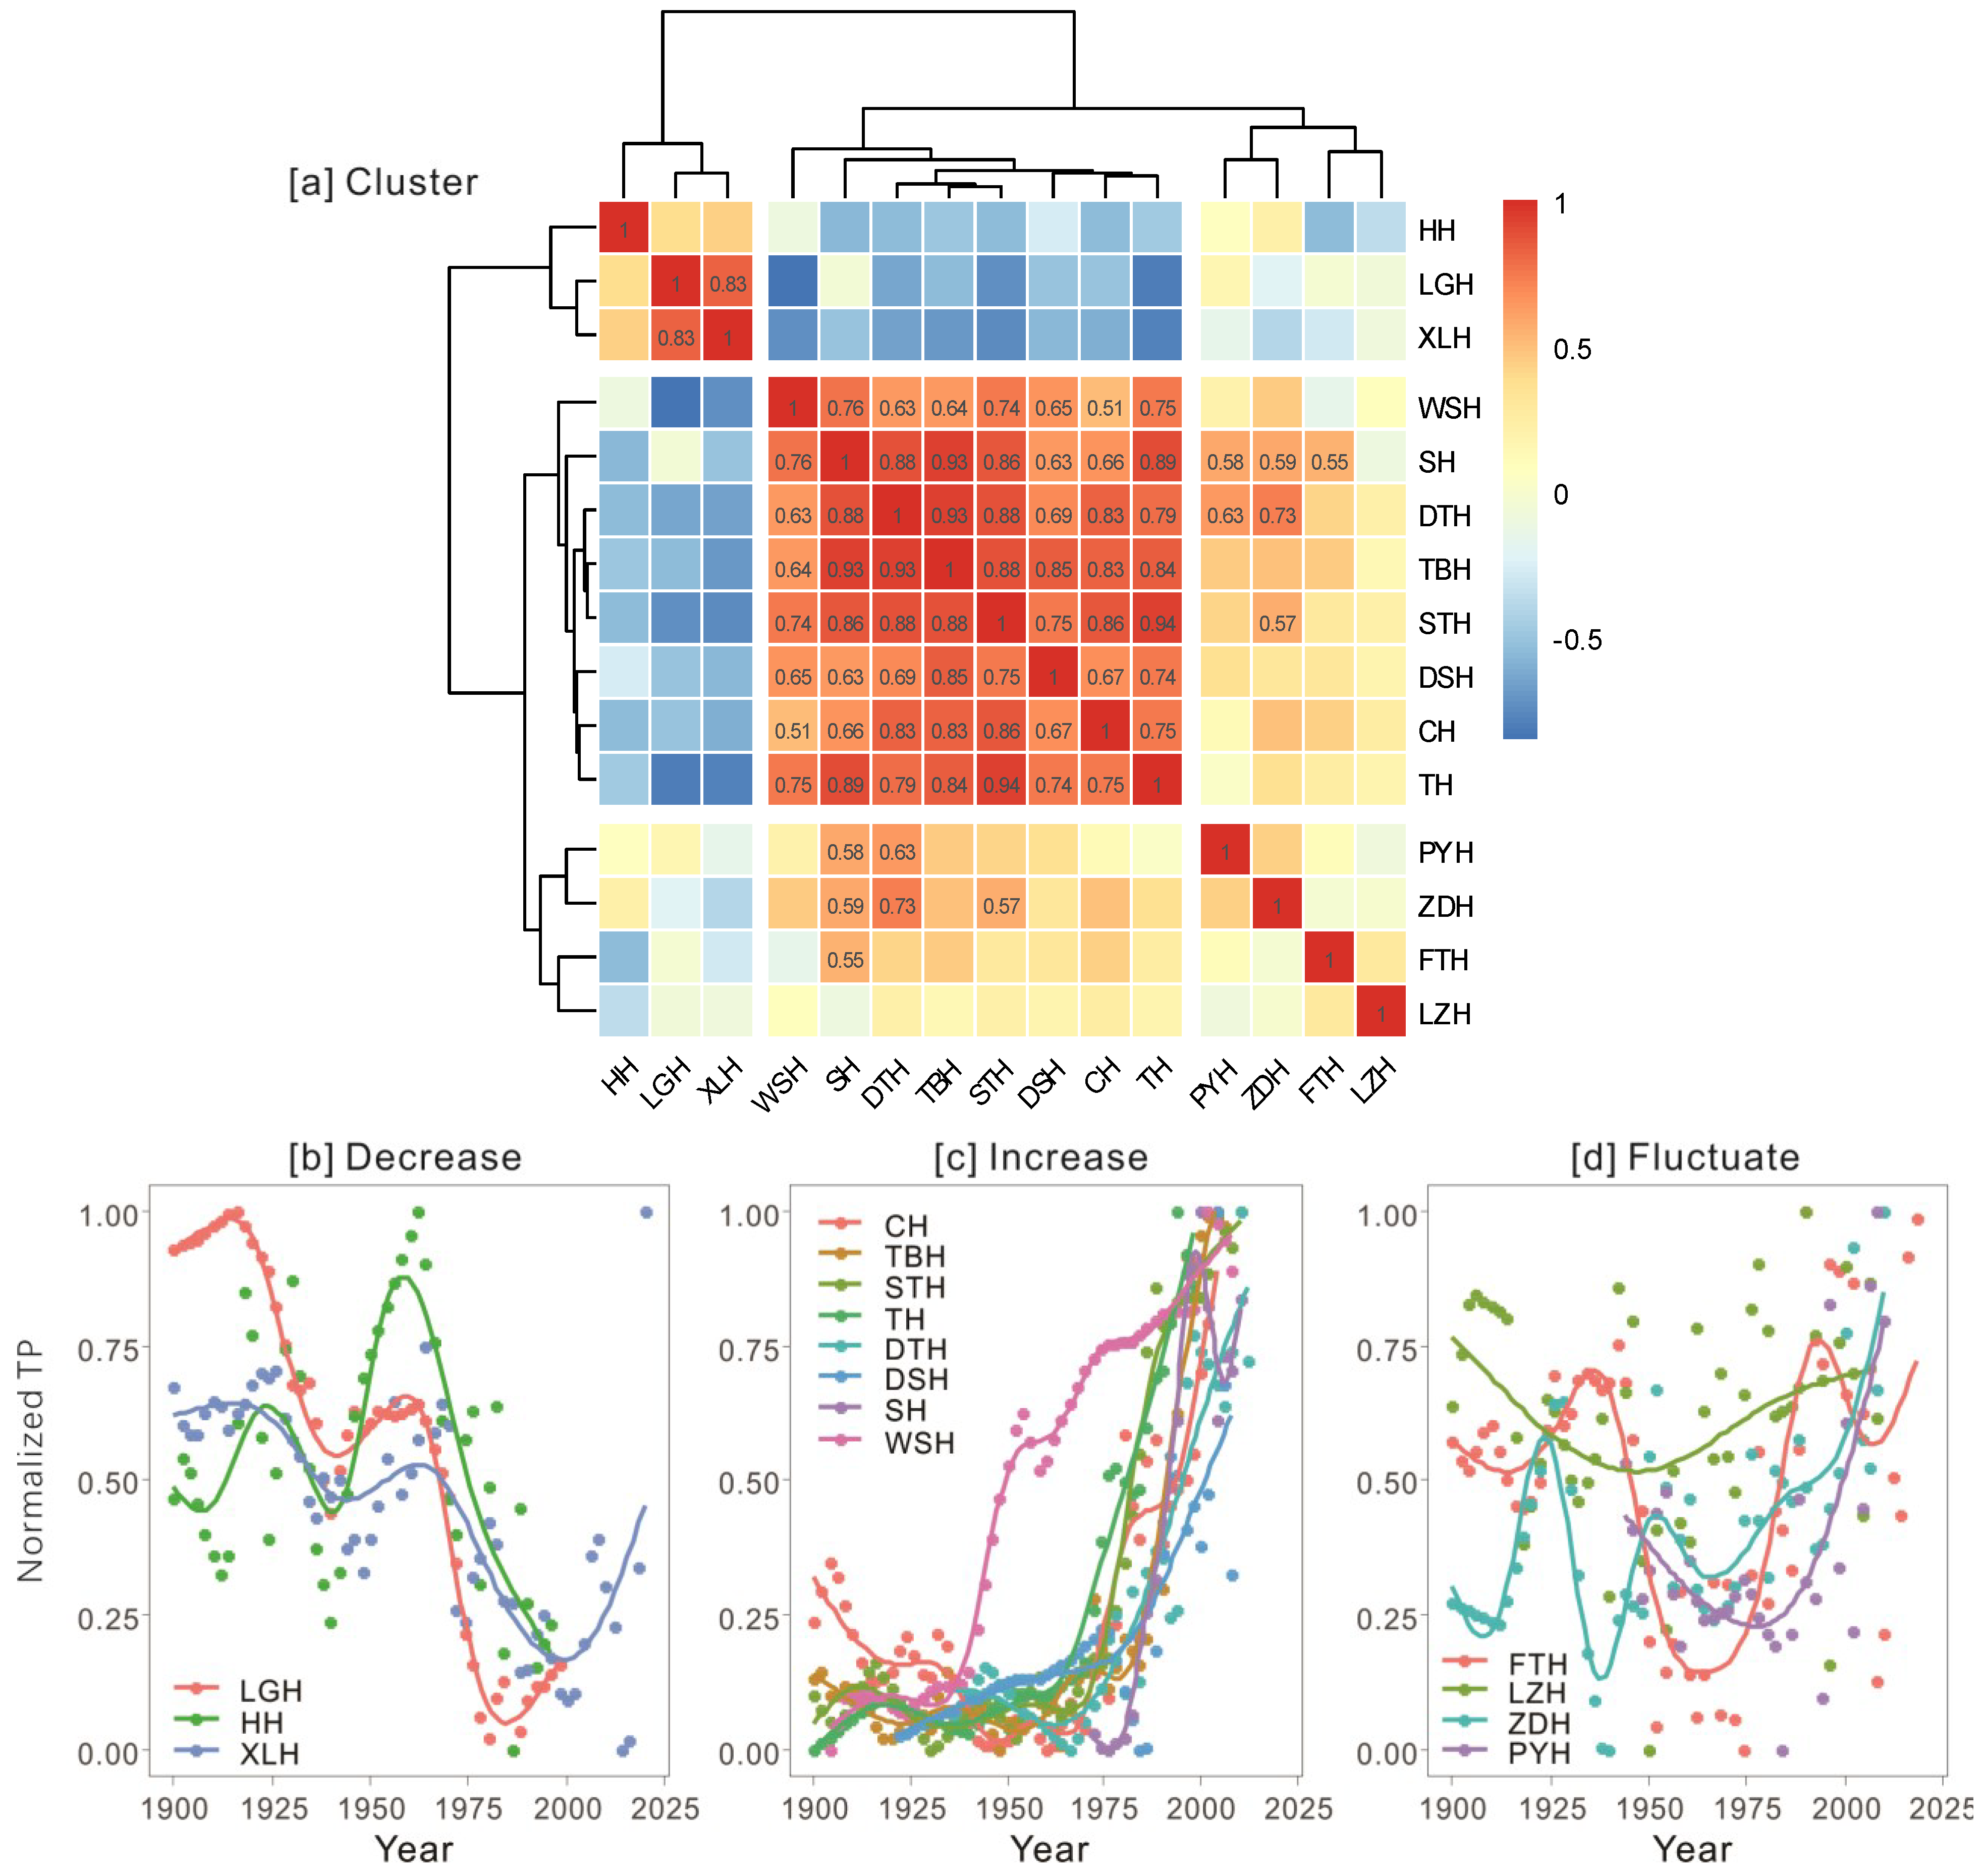
Trend similarities were further analyzed using Pearson correlation (Figure 3a). Pearson r-values of statistically significant relationships (p < 0.05) are displayed in the boxes. Pearson r-values of 35 TP pairs, in total 105, are of statistically significant relationships, and cluster analysis results indicate three main trends between all TP reconstructions. In each trend (Figure 3b–d), the dots are the data, and the smooth curves are the fitting lines of the general additive model (GAM). Increase is the dominated trend (8/15 lakes) in TP reconstructions since 1900, though the other two changing modes of decrease (3/15 lakes) and fluctuate (4/15 lakes) are recognized. In the increase trend type, Pearson r-values of all 28 TP pairs are of statistically significant relationships, while the similarities of lake TP changes are relatively low in the decrease trend and fluctuate trend.

3.2. Non-Linear Changes in the Main Trend

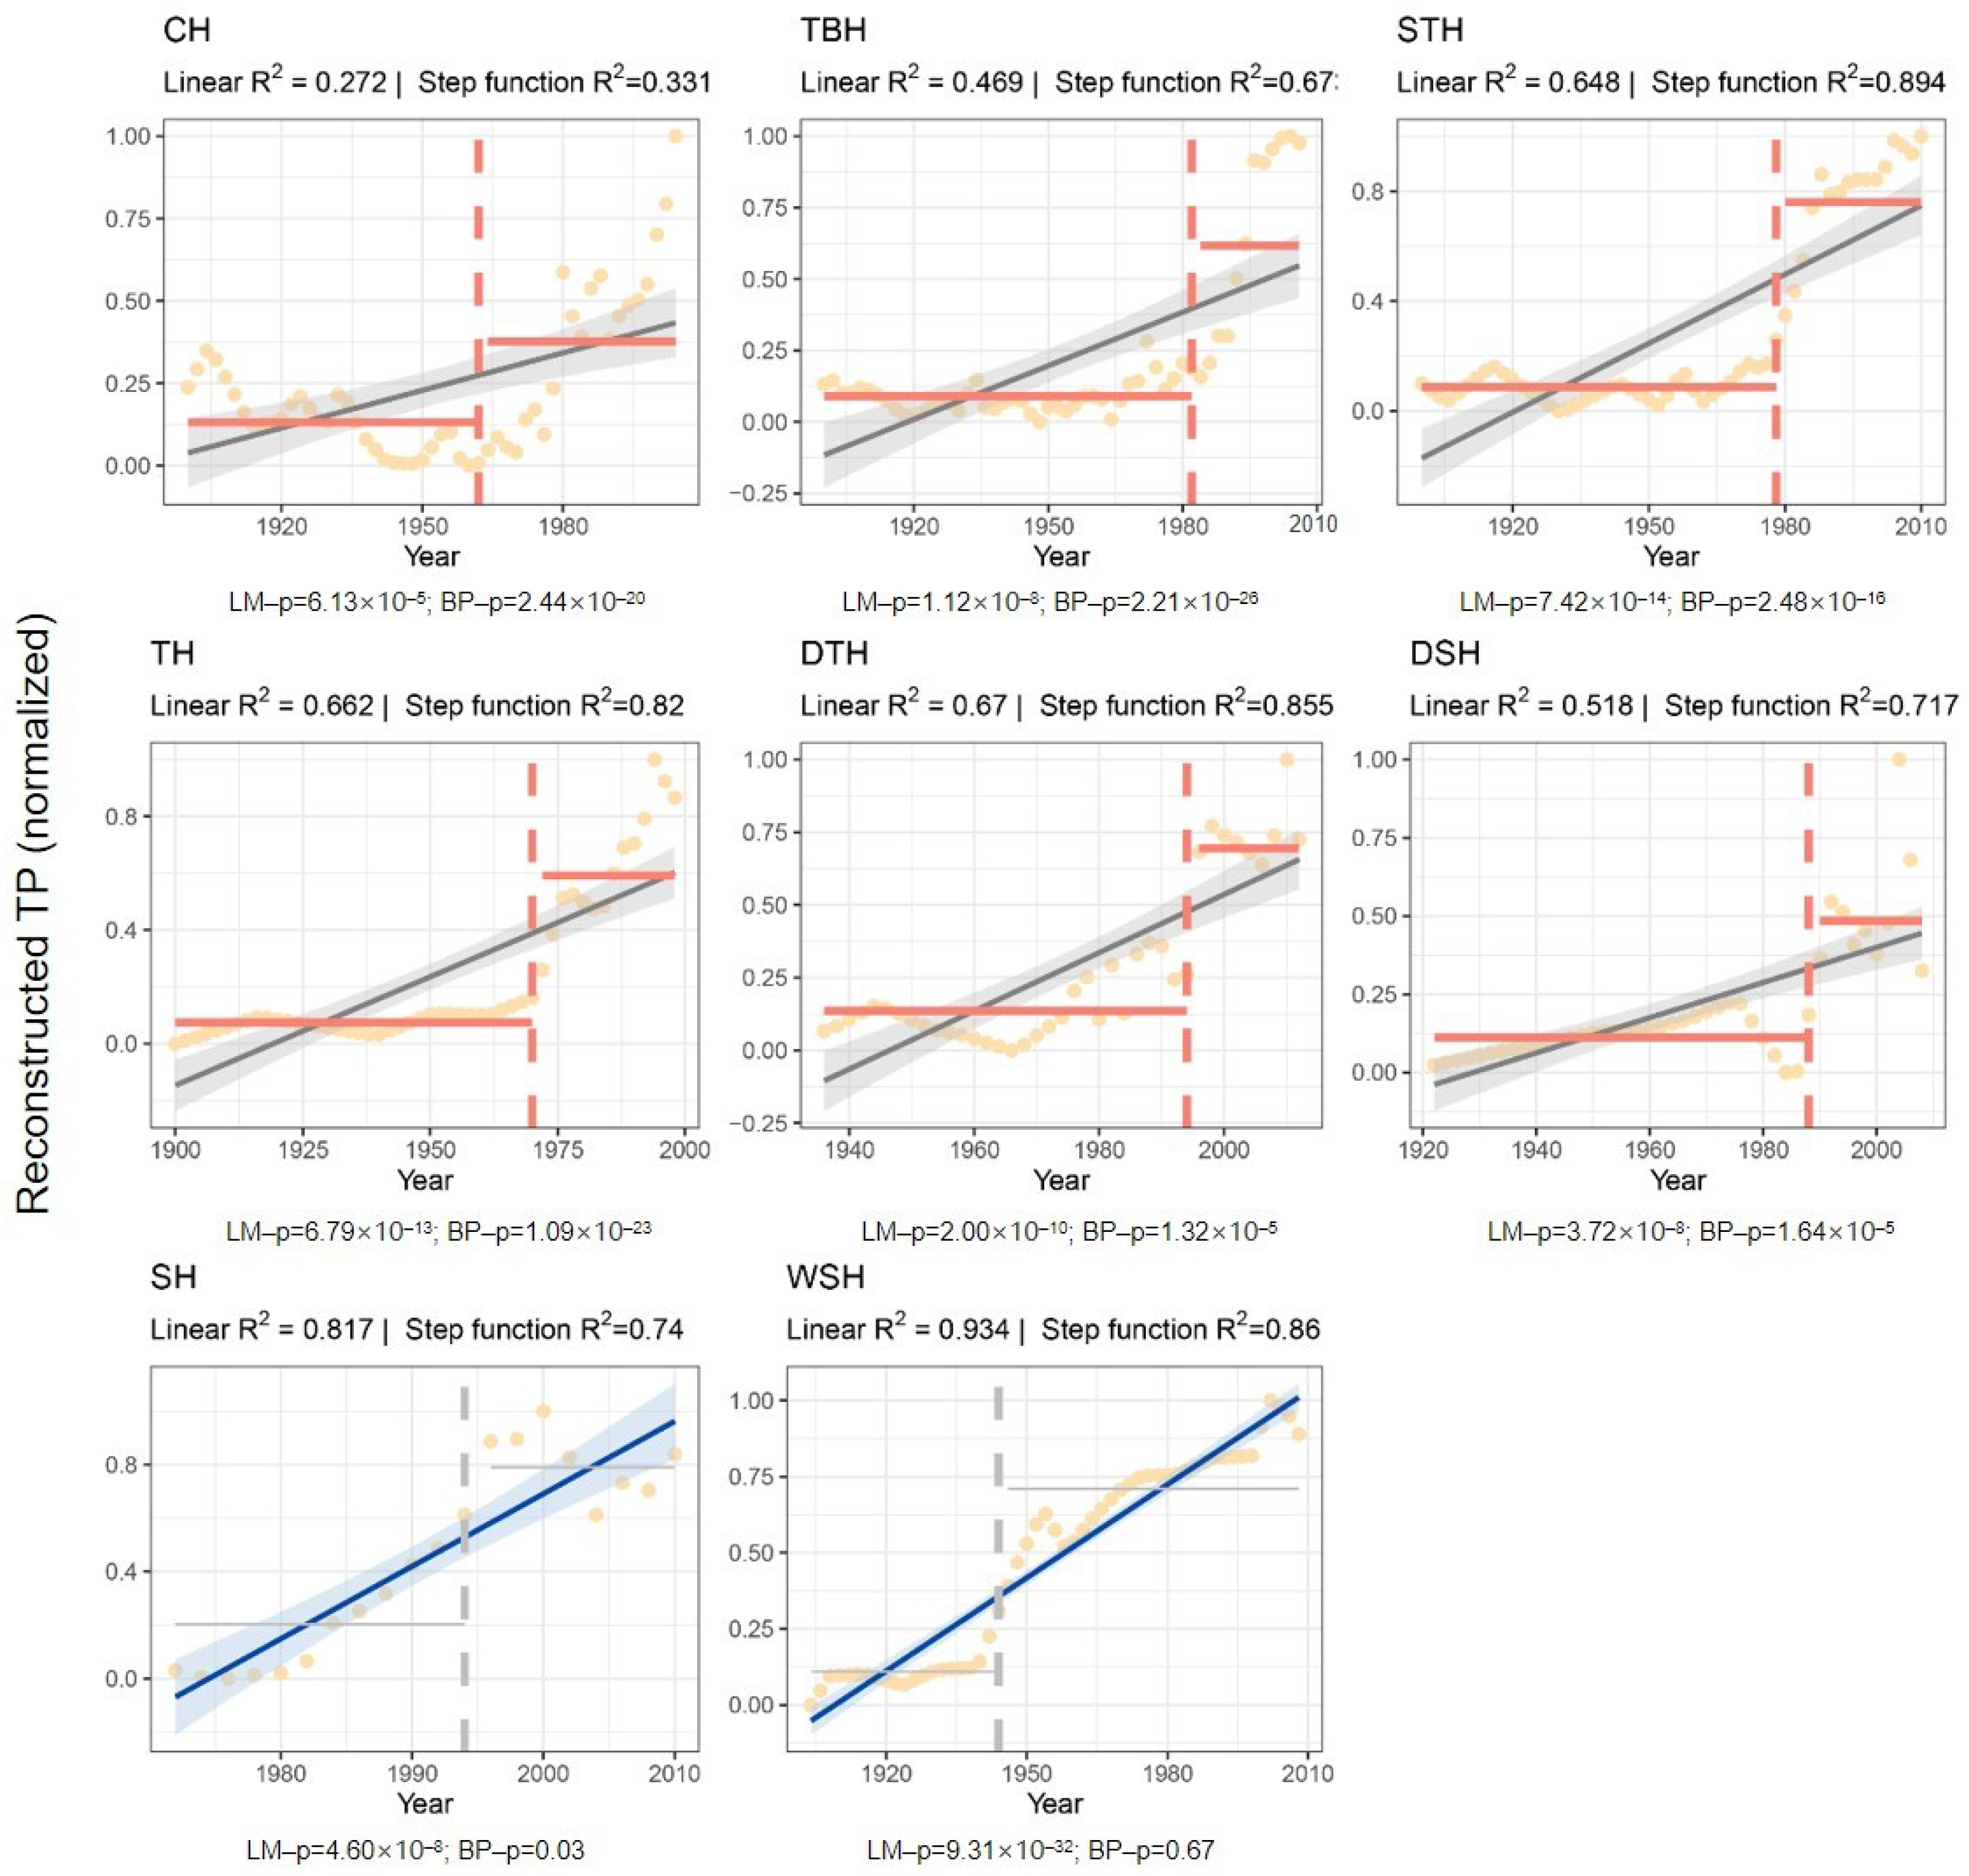
The empirical relationships between time and ecosystem states (here indicated by reconstructed TP) in eight lakes with an increasing nutrient were tested and plotted in a linear regression model and breakpoint regression model (Figure 4). In each plot, the model with a higher R2 value is colored in blue (linear regression) or red (step-change), with the alternative model shown in gray. Comparing the R2, the values of step functions are greater in Lakes Chaohu (CH), Taibaihu (TBH), Shitanghu (STH), Taihu (TH), Datonghu (DTH) and Dianshanhu (DSH). In Lakes Shahu (SH) and Wushanhu (WSH), the values of a linear regression model are greater. The p-values of all models with higher R2 are all lower than 0.1.

4. Discussion

Weber firstly put forward “eutrophic”, “mesotrophic” and “oligotrophic” to describe different habitats of plants in peatland [74]. Eutrophication can refer to the natural process of aquatic ecosystems over long periods of time. Cultural eutrophication refers to human-induced nutrient enrichment, normally occurring over a short period (hour, day, month and decade). Our study focused on the cultural eutrophication. We find three different trends in the fifteen TP reconstructions since 1900. Increase with a high similarity between TP changes is the dominated trend, in which six lakes fit step functions better than linear regression models, indicating the main non-linear change in lake ecosystem states over time. We will discuss the possible causes of different trajectories in regional lake TP changes and link our results to other studies. Then, we will further discuss how our study benefits effective lake management on eutrophication.

4.1. Possible Reasons for Different TP Trajectories

We collected catchment background data to interpret diversities in TP trends. Natural or human-induced factors that directly or indirectly cause a change in an ecosystem are referred to as “drivers”. Climate changes including precipitation, wind speed and temperature are often viewed as natural factors. Global temperature has obviously increased since 1850 [75], the increasing trend of which in eastern China was primarily found since the 1950s, along with a decrease in wind speed and increase in precipitation (Figure 5). Summer precipitation indices can reflect drought events, with value-2 representing severe drought climates. The population and economy in China have been rapidly growing since the establishment of the People′s Republic of China in 1949 and economic reform opening up in 1978. In order to satisfy the increasing food supply, a series of measures include, but are not limited to, lake reclamation, sluice and dam construction, land fertilizer application and enclosure fish farming, which have been applied to stabilize hydrological conditions and increase harvests of grain and fish [76]. Farmland increased, whereas dramatic changes were found in both the amount and size of lakes in the 1960s–1980s. The total number of lakes (area >1 km2) decreased from 2928 to 2693 (by 8%), and lake area in eastern China decreased by 104 km2. Another management to ensure food supply was to build sluices and dams to stabilize hydrological conditions. In the middle and lower Yangtze River basins, the building of sluices and dams isolated the connectivity between lakes and the Yangtze River, which mainly happened in the 1960s–1980s (Figure 5). Under the combination of climate change and anthropogenic stress, shallow lakes in eastern China experienced not only reductions in lake areas and connectivity of rivers and lakes, but also increases in external pollution into the lake [50]. Nutrient enrichment in both lake water and sediments, algal blooms, decreasing Secchi depth and vanishing vegetation are major responses of lake ecosystems [77,78,79]. The lake ecosystem shifted dramatically from a clear macrophyte-dominated stable state to a turbid phytoplankton-dominated stable state at a critical threshold, the shifting state of which further leads to shifting ecosystem services [80,81,82]. This is widely accepted knowledge and is the main mechanism of historical changes in lake ecosystem states in eastern China over the past century. In this study, the similar finding that the increase dominated by non-linear changes is the main trend in past regional lake nutrient change (Figure 3c and Figure 4) also manifests the main trend of main drivers. We speculate that human-induced factors are the most important reasons for such a trend, as the huge magnitude of change due to fast development over a short period of time (one century) exceeds climate changes in its influence. For example, the insignificant increase in precipitation can increase hydrodynamics to a certain extent. However, dams and sluices being built significantly specially decreases lake hydrodynamics, as it can reduce water level changes and turn lakes into reservoirs [83].
However, different to the traditional understanding, we also statistically recognized the trends of decrease and fluctuate in reconstructed TP changes (Figure 3a,c). Previous studies showed that even under similar driving conditions, lakes with varied characteristics, such as lake sizes, sediment types and food web structures, can have different responses [88]. We have to admit that it is hard or even impossible to collect detailed changes in driving factors and lake characteristics over the past century. We found that lakes experienced a fast increase in TP, mainly located in the lower Yangtze River basin; whereas, those lakes whose TP decreased or fluctuated were mainly located in the middle Yangtze River basin. One possible reason why these lakes have not experienced a fast increase in water TP can be that the nutrient enrichment speed is lower in the lower reaches of the Yangtze River. We speculate that different lakes can respond similarly (non-linear increase in TP) when external drivers change rapidly (nutrient enrichment speed). Another potential factor is hydrological regulation. The high lake hydrodynamics in the middle Yangtze River basin before hydrological regulation impended the growth of submerged plants. A good example is that the macrophytes of Lake Honghu had few that were mainly affected by the floods of the Yangtze River and Han River and huge changes in the water level [89]. Sluice building in the 1960s and 1990s stabilized hydrological conditions and reduced water depth, and the macrophytes of Lake Honghu experienced a period of rapid expansion and uptook TP from lake water. After that, the clear water state was sustained by the positive feedback between macrophytes and Secchi depth, until algal blooms dominated and water TP increased, such as in the cases of Lakes Futou and Poyang (Figure 3c). The existence of positive feedback between macrophyte vegetation and lake water clarity in the middle and lower Yangtze River basins was found to be in a “more vegetation, higher water clarity” pattern, and the strength of the positive feedback was interspecific [33]. Positive feedback is generally related to the interactions between biotic processes and abiotic drivers and may lead to the emergence of alternative stable states in ecosystems. In the background of increasing external loading, water nutrient levels in lakes with specific compositions of macrophytes may not show regime shifts over time. Both decrease and fluctuate trends showed rising changes over the recent decade, corresponding to the disappearing trend of macrophytes (Figure 5).
We conjectured that both external drivers and lake structure characteristics lead to differences in trajectories of reconstructed water TP levels. The potential mechanism can be demonstrated using a simulation method from lake dynamic models such as the PClake model [90]. Research using model methods to unravel the drivers and underlying mechanisms in ecosystem dynamics has been reported in several lakes in the middle and lower Yangtze River basins [53,91]. With comprehensive data from observation, paleolimnology and other methods, a representing model can be generated to reveal the mechanism of historical changes in lake ecosystem states on a regional scale.

4.2. The Influence of TP Trends on Lake Ecosystems

The varied trends of lake ecosystem states (represented by water TP) in eastern China since 1900, in this study, are largely consistent with and can complement other results, such as the regional chironomid study of 32 lakes in the Jianghan plain, sediment total organic carbon (TOC) trend and macrophyte change studies in eastern China [78,79,92] (Figure 5). Our study can complement other findings by providing the quantified assessment of water nutrient changes, thus further facilitating our knowledge of ecosystem structure changes through the bottom-up effect. First, chironomid populations are the same in the reference environment and in the modern environment in the Liangzi, Futou, Honghu and Xiliang Lakes, both of which are characterized by oligotrophic and mesotrophic species. We found the above four lakes did not experience an abrupt increase in historical water nutrient levels according to trend cluster results (Figure 3a,c), further confirming that we can use current states of these lakes as reference conditions. Second, research based on 50 TOC changes in lake sediments showed that TOC increased overall and regime shifts, which were highly related to economic development, first occurred in eastern China [78] (Figure 5). Third, the gradual disappearance of submerged vegetation changes in eastern China is traditional knowledge, probably corresponding to lakes with an increase TP trend in our study. Additionally, three periods of scarcity (2000s to 1950s), growth (1950s to 1980s) and decline (1980s to present) were found in macrophyte changes based on 14 shallow lakes in East China over the past century (Figure 5). Lakes not experiencing an abrupt increase in TP maintained relatively high macrophyte coverage. For instance, the continuous developments of aquatic vegetation in the Longgan Lake and Xiliang Lake were indicated by the diatom community change from planktonic diatom assemblage to benthic and epiphytic diatom assemblages around the early 19th century and 1940s, respectively [61,62]. The chironomid assemblage in the Honghu Lake core was mainly characterized by macrophyte-related species [92]. Macrophyte abundance and composition are important to lake ecosystem structures. It is studied that macrophyte-dominated lakes, such as the Honghu Lake and Longgan Lake, have a strong buffering effect on high nutrient inputs, as submerged plants can absorb nutrients, hinder phytoplankton growth to maintain water quality and reduce resuspension by stabilizing sediment [55,93].

4.3. Policy Implications

We provide a regional assessment of the eutrophication process in eastern China using reconstructed water total phosphorus levels of fifteen typical shallow lakes. The results of different trends and the prevalence of non-linear changes in eutrophication in this study can benefit effective lake management in mainly three aspects.
The current main restoration method for eutrophication is external loading control with major efforts focusing on highly eutrophic lakes. Less attention has been paid to mesotrophic lakes or eutrophic lakes without algal blooms, even if water nutrients in these lakes keep increasing. We found that the nutritional trend of lakes can be preliminarily inferred according to their current nutrient levels, which provide important empirical evidence for the current hierarchical management towards eutrophication lakes. The average value of reconstructed TP before the 1950s was around 50 μg/L, the value of which was also used as a reference condition of water TP in the middle and lower Yangtze River basins [59]. The range of reconstructed TP before the 1950s is much lower than that in the 2010s in fifteen lakes. The low average value and small range of TP before the 1950s correspond to the prevalent clear state of lakes in the region before strong anthropogenic disturbances. Lakes such as Longganhu (LGH) and Honghu (HH) have had relative low water TP levels and decrease trends since the last century, whereas other lakes such as Shahu and Wushanhu have higher average TP values and experience increase trends in history (Figure 1 and Figure 2). Focusing major efforts on highly eutrophic lakes is reasonable from both the current urgent situation and historical trends (probably increase).
Second, policy makers applied strong control of external loading to eutrophic lakes with an increase TP trend by reducing fertilizer use and regulating industrial wastewater [94] and achieved some effect. Apart from P input control, other proper methods such as biomanipulation and removal of internal nutrient loading from sediment are recommended in restoration [95]. Moreover, policy makers should pay more attention to lakes in which water TP has not increased suddenly and dramatically in the past because both decrease and fluctuate trends showed rising changes in the recent decade. Under the current uneven resource allocation in restoration and future climate warming, these lakes may have great potential to turn into eutrophic lakes. For these lakes, we recommended focusing on the maintenance or restoration of aquatic vegetation, such as stabilizing the water environment and promoting the expansion of submerged vegetation [96]. The efficiency to control lake nutrients can be low, as the current external loading and in-lake nutrient levels of these lakes are probably low compared with other lakes with regime shifts.
Third, we should reduce phosphate mining and P product use. According to the 2019 World Phosphate Mine Production Survey, China was ranked among the top 10 phosphorus-producing countries in the world. Hubei province is one of the top phosphate resource provinces in China. Most of the lakes with decrease and fluctuate TP trends are located in the Hubei province. In recent decades, the main agricultural fertilizer type in China has transitioned from nitrogen to phosphorus. The phosphorus content in the soil is very high. Encouraging the application of organic fertilizer can reduce the use of phosphorus fertilizer and reduce phosphorus in the geochemical cycle.

5. Conclusions

Previous studies based on paleolimnological methods mainly focused on one or a few representing lakes. This is the first statistical study focusing on the difference in historical TP changes in eastern China lakes using data generated from paleolimnological methods. We found three trends, similar to widely accepted knowledge, in which non-linear increase is dominated. We also statistically recognized the trends of decrease and fluctuate in reconstructed TP changes for lakes mainly located in the Jianghan plain. In addition to a lower magnitude of change in external nutrient inputs, other potential factors influencing TP trends include different lake ecosystem structures due to other drivers such as hydrological regulation. The different TP change trajectories in this paper facilitated a more comprehensive understanding of regional lake ecosystem responses by combining other regional assessments on macrophytes and chironomids. Our results call for more studies on lake response variety using paleolimnology, models and other methods. The nutritional trend of lakes can be preliminarily inferred according to their current nutrient levels, which provides important empirical evidence for the current hierarchical management towards eutrophication lakes. A long restoration of eutrophication is expected as water nutrient levels are also likely to decrease non-linearly over time when external loading has been controlled enough by policies.

Author Contributions

Conceptualization, B.Q., R.W. and X.Y.; data curation, B.Q., X.Y., Q.Z. and J.Z.; funding acquisition, R.W. and X.Y.; investigation, B.Q. and R.W.; methodology, B.Q. and R.W.; supervision, R.W. and X.Y.; writing—original draft, B.Q.;writing—review and editing, B.Q. and R.W. All authors have read and agreed to the published version of the manuscript.

Funding

This research was funded by the Strategic Priority Research Program of the Chinese Academy of Sciences (XDB31000000), National Natural Science Foundation of China (42171161), and the Youth Innovation Promotion Association CAS (Y2021086).

Institutional Review Board Statement

Not applicable.

Informed Consent Statement

Not applicable.

Data Availability Statement

Contact the corresponding author for data.

Acknowledgments

We thank Min Xu, Yanjie Zhao, Yu Zhao and Kexin Zhu for fieldwork and laboratory assistance.

Conflicts of Interest

The authors declare no conflict of interest.

References

  1. Butchart, S.H.M.; Walpole, M.; Collen, B.; van Strien, A.; Scharlemann, J.P.W.; Almond, R.E.A.; Baillie, J.E.M.; Bomhard, B.; Brown, C.; Bruno, J.; et al. Global Biodiversity: Indicators of Recent Declines. Science 2010, 328, 1164–1168. [Google Scholar] [CrossRef] [PubMed]
  2. Carpenter, S.R. Eutrophication of aquatic ecosystems: Bistability and soil phosphorus. Proc. Natl. Acad. Sci. USA 2005, 102, 10002–10005. [Google Scholar] [CrossRef] [PubMed]
  3. Woolway, R.I.; Kraemer, B.M.; Lenters, J.D.; Merchant, C.J.; O’Reilly, C.M.; Sharma, S. Global lake responses to climate change. Nat. Rev. Earth Environ. 2020, 1, 388–403. [Google Scholar] [CrossRef]
  4. Zhang, K.; Yang, X.; Kattel, G.; Lin, Q.; Shen, J. Freshwater lake ecosystem shift caused by social-economic transitions in Yangtze River Basin over the past century. Sci. Rep. 2018, 8, 17146. [Google Scholar] [CrossRef] [PubMed] [Green Version]
  5. Carpenter, S.R.; DeFries, R.; Dietz, T.; Mooney, H.A.; Polasky, S.; Reid, W.V.; Scholes, R.J. Millennium Ecosystem Assessment: Research needs. Science 2006, 314, 257–258. [Google Scholar] [CrossRef]
  6. Davidson, T.A.; Jeppesen, E. The role of palaeolimnology in assessing eutrophication and its impact on lakes. J. Paleolimnol. 2013, 49, 391–410. [Google Scholar] [CrossRef]
  7. Gilbert, P.M. Eutrophication, harmful algae and biodiversity—Challenging paradigms in a world of complex nutrient changes. Mar. Pollut. Bull. 2017, 124, 591–606. [Google Scholar] [CrossRef]
  8. Ho, J.C.; Michalak, A.M.; Pahlevan, N. Widespread global increase in intense lake phytoplankton blooms since the 1980s. Nature 2019, 574, 667–670. [Google Scholar] [CrossRef]
  9. May, R. Thresholds and breakpoints in ecosystems with a multiplicity of stable states. Nature 1977, 269, 471–477. [Google Scholar] [CrossRef]
  10. Ryo, M.; Aguilar-Trigueros, C.A.; Pinek, L.; Muller, L.A.H.; Rillig, M.C. Basic Principles of Temporal Dynamics. Trends Ecol. Evol. 2019, 34, 723–733. [Google Scholar] [CrossRef] [Green Version]
  11. Scheffer, M.; Carpenter, S.; Foley, J.A.; Folke, C.; Walker, B. Catastrophic shifts in ecosystems. Nature 2001, 413, 591–596. [Google Scholar] [CrossRef] [PubMed]
  12. Barnosky, A.D.; Hadly, E.A.; Bascompte, J.; Berlow, E.L.; Brown, J.H.; Fortelius, M.; Getz, W.M.; Harte, J.; Hastings, A.; Marquet, P.A.; et al. Approaching a state shift in Earth’s biosphere. Nature 2012, 486, 52–58. [Google Scholar] [CrossRef] [PubMed]
  13. Scheffer, M.; Carpenter, S.R.; Lenton, T.M.; Bascompte, J.; Brock, W.; Dakos, V.; van de Koppel, J.; van de Leemput, I.A.; Levin, S.A.; van Nes, E.H.; et al. Anticipating Critical Transitions. Science 2012, 338, 344–348. [Google Scholar] [CrossRef] [PubMed] [Green Version]
  14. Gromov, D.; Upmann, T. Dynamics and Economics of Shallow Lakes: A Survey. Sustainability 2021, 13, 13763. [Google Scholar] [CrossRef]
  15. Scheffer, M.; Bascompte, J.; Brock, W.A.; Brovkin, V.; Carpenter, S.R.; Dakos, V.; Held, H.; van Nes, E.H.; Rietkerk, M.; Sugihara, G. Early-warning signals for critical transitions. Nature 2009, 461, 53–59. [Google Scholar] [CrossRef] [PubMed]
  16. Carpenter, S.R.; Cole, J.J.; Pace, M.L.; Wilkinson, G.M. Response of plankton to nutrients, planktivory and terrestrial organic matter: A model analysis of whole-lake experiments. Ecol. Lett. 2016, 19, 230–239. [Google Scholar] [CrossRef] [PubMed]
  17. Sharpley, A.; Jarvie, H.P.; Buda, A.; May, L.; Spears, B.; Kleinman, P. Phosphorus Legacy: Overcoming the Effects of Past Management Practices to Mitigate Future Water Quality Impairment. J. Environ. Qual. 2013, 42, 1308–1326. [Google Scholar] [CrossRef] [Green Version]
  18. Walker, B.; Meyers, J. Thresholds in Ecological and Social-Ecological Systems: A Developing Database. Ecol. Soc. 2004, 9, 3. [Google Scholar] [CrossRef]
  19. Wang, R.; Dearing, J.A.; Langdon, P.G. Critical Transitions in Lake Ecosystem State May Be Driven by Coupled Feedback Mechanisms: A Case Study from Lake Erhai, China. Water 2022, 14, 85. [Google Scholar] [CrossRef]
  20. Gilarranz, L.J.; Narwani, A.; Odermatt, D.; Siber, R.; Dakos, V. Regime shifts, trends, and variability of lake productivity at a global scale. Proc. Natl. Acad. Sci. USA 2022, 119, e2116413119. [Google Scholar] [CrossRef]
  21. Carpenter, S.R.; Caraco, N.F.; Correll, D.L.; Howarth, R.W.; Sharpley, A.N.; Smith, V.H. Nonpoint pollution of surface waters with phosphorus and nitrogen. Ecol. Appl. 1998, 8, 559–568. [Google Scholar] [CrossRef]
  22. Gulati, R.D.; van Donk, E. Lakes in the Netherlands, their origin, eutrophication and restoration: State-of-the-art review. Hydrobiologia 2002, 478, 73–106. [Google Scholar] [CrossRef]
  23. Smol, J.P. Pollution of Lakes and Rivers: A Paleoenvironmental Perspective; John Wiley & Sons: Hoboken, NJ, USA, 2002. [Google Scholar]
  24. Smith, V.H.; Joye, S.B.; Howarth, R.W. Eutrophication of freshwater and marine ecosystems. Limnol. Oceanogr. 2006, 51, 351–355. [Google Scholar] [CrossRef] [Green Version]
  25. Lara, M.; Chen, Y.; Jones, B. Recent warming reverses forty-year decline in Catastrophic lake drainage and hastens Gradual lake drainage across northern Alaska. Environ. Res. Lett. 2021, 16, 124019. [Google Scholar] [CrossRef]
  26. Weitzell, R.E.; Kaushal, S.S.; Lynch, L.M.; Guinn, S.M.; Elmore, A.J. Extent of Stream Burial and Relationships to Watershed Area, Topography, and Impervious Surface Area. Water 2016, 8, 538. [Google Scholar] [CrossRef] [Green Version]
  27. Smith, V.H.; Tilman, G.D.; Nekola, J.C. Eutrophication: Impacts of excess nutrient inputs on freshwater, marine, and terrestrial ecosystems. Environ. Pollut. 1999, 100, 179–196. [Google Scholar] [CrossRef]
  28. Le Moal, M.; Gascuel-Odoux, C.; Menesguen, A.; Souchon, Y.; Etrillard, C.; Levain, A.; Moatar, F.; Pannard, A.; Souchu, P.; Lefebvre, A.; et al. Eutrophication: A new wine in an old bottle? Sci. Total Environ. 2019, 651, 2985–3001. [Google Scholar] [CrossRef] [Green Version]
  29. Jeppesen, E.; Sondergaard, M.; Jensen, J.P.; Havens, K.E.; Anneville, O.; Carvalho, L.; Coveney, M.F.; Deneke, R.; Dokulil, M.T.; Foy, B.; et al. Lake responses to reduced nutrient loading—An analysis of contemporary long-term data from 35 case studies. Freshw. Biol. 2005, 50, 1747–1771. [Google Scholar] [CrossRef]
  30. McCrackin, M.L.; Jones, H.P.; Jones, P.C.; Moreno-Mateos, D. Recovery of lakes and coastal marine ecosystems from eutrophication: A global meta-analysis. Limnol. Oceanogr. 2017, 62, 507–518. [Google Scholar] [CrossRef]
  31. Matsuzaki, S.-I.S.; Suzuki, K.; Kadoya, T.; Nakagawa, M.; Takamura, N. Bottom-up linkages between primary production, zooplankton, and fish in a shallow, hypereutrophic lake. Ecology 2018, 99, 2025–2036. [Google Scholar] [CrossRef]
  32. Li, Y.; Meng, J.; Zhang, C.; Ji, S.; Kong, Q.; Wang, R.; Liu, J. Bottom-up and top-down effects on phytoplankton communities in two freshwater lakes. PLoS ONE 2020, 15, e0231357. [Google Scholar] [CrossRef] [PubMed] [Green Version]
  33. Su, H.J.; Chen, J.; Wu, Y.; Chen, J.F.; Guo, X.C.; Yan, Z.B.; Tian, D.; Fang, J.Y.; Xie, P. Morphological traits of submerged macrophytes reveal specific positive feedbacks to water clarity in freshwater ecosystems. Sci. Total Environ. 2019, 684, 578–586. [Google Scholar] [CrossRef] [PubMed]
  34. Wang, H.J.; Wang, H.Z.; Liang, X.M.; Wu, S.K. Total phosphorus thresholds for regime shifts are nearly equal in subtropical and temperate shallow lakes with moderate depths and areas. Freshw. Biol. 2014, 59, 1659–1671. [Google Scholar] [CrossRef]
  35. Jeppesen, E.; Meerhoff, M.; Jacobsen, B.A.; Hansen, R.S.; Sondergaard, M.; Jensen, J.P.; Lauridsen, T.L.; Mazzeo, N.; Branco, C.W.C. Restoration of shallow lakes by nutrient control and biomanipulation-the successful strategy varies with lake size and climate. Hydrobiologia 2007, 581, 269–285. [Google Scholar] [CrossRef]
  36. Wang, S.M.; Dou, H.S. Lakes in China; Science Press: Beijing, China, 1998. [Google Scholar]
  37. Zhao, Y.; Wang, R.; Yang, X.; Dearing, J.A.; Doncaster, C.P.; Langdon, P.; Dong, X. Reconstruction of Ecological Transitions in a Temperate Shallow Lake of the Middle Yangtze River Basin in the Last Century. Water 2022, 14, 1136. [Google Scholar] [CrossRef]
  38. Lauridsen, T.L.; Jensen, J.P.; Jeppesen, E.; Sondergaard, M. Response of submerged macrophytes in Danish lakes to nutrient loading reductions and biomanipulation. Hydrobiologia 2003, 506, 641–649. [Google Scholar] [CrossRef]
  39. Last, W.M.; Smol, J.P. Tracking Environmental Change Using Lake Sediments: Basin Analysis, Coring, and Chronological Techniques, Developments in Paleoenvironmental Research; Kluwer Academic Publishers: Dordrecht, The Netherlands, 2001. [Google Scholar]
  40. Zeng, L.; McGowan, S.; Cao, Y.; Chen, X. Effects of dam construction and increasing pollutants on the ecohydrological evolution of a shallow freshwater lake in the Yangtze floodplain. Sci. Total Environ. 2018, 621, 219–227. [Google Scholar] [CrossRef]
  41. Xu, M.; Dong, X.H.; Yang, X.D.; Wang, R.; Zhang, K.; Zhao, Y.J.; Davidson, T.A.; Jeppesen, E. Using palaeolimnological data and historical records to assess long-term dynamics of ecosystem services in typical Yangtze shallow lakes (China). Sci. Total Environ. 2017, 584, 791–802. [Google Scholar] [CrossRef] [Green Version]
  42. Zhang, Y.D.; Yu, J.L.; Su, Y.L.; Du, Y.X.; Liu, Z.W. Long-term changes of water quality in aquaculture-dominated lakes as revealed by sediment geochemical records in Lake Taibai (Eastern China). Chemosphere 2019, 235, 297–307. [Google Scholar] [CrossRef]
  43. Randsalu-Wendrup, L.; Conley, D.J.; Carstensen, J.; Fritz, S.C. Paleolimnological records of regime shifts in lakes in response to climate change and anthropogenic activities. J. Paleolimnol. 2016, 56, 1–14. [Google Scholar] [CrossRef] [Green Version]
  44. Battarbee, R.W.A.; Anderson, N.J.; Bennion, H.; Simpson, G.L. Combining limnological and palaeolimnological data to disentangle the effects of nutrient pollution and climate change on lake ecosystems: Problems and potential. Freshw. Biol. 2010, 57, 2091–2106. [Google Scholar] [CrossRef] [Green Version]
  45. Birks, H.; Birks, H. Multi-proxy studies in palaeolimnology. Veg. Hist. Archaeobot. 2006, 15, 235–251. [Google Scholar] [CrossRef] [Green Version]
  46. Bennion, H.; Juggins, S.; Anderson, N.J. Predicting epilimnetic phosphorus concentrations using an improved diatom-based transfer function and its application to lake eutrophication management. Environ. Sci. Technol. 1996, 30, 2004–2007. [Google Scholar] [CrossRef]
  47. Luoto, T.P.; Rantala, M.V.; Tammelin, M.H. Tracking the Limnoecological History of Lake Hiidenvesi (Southern Finland) Using the Paleolimnological Approach. Water Air Soil Pollut. 2017, 228, 461. [Google Scholar] [CrossRef] [Green Version]
  48. Zhang, G.; Yao, T.; Chen, W.; Zheng, G.; Shum, C.K.; Yang, K.; Piao, S.; Sheng, Y.; Yi, S.; Li, J.; et al. Regional differences of lake evolution across China during 1960s–2015 and its natural and anthropogenic causes. Remote Sens. Environ. 2019, 221, 386–404. [Google Scholar] [CrossRef]
  49. Le, C.; Zha, Y.; Li, Y.; Sun, D.; Lu, H.; Yin, B. Eutrophication of Lake Waters in China: Cost, Causes, and Control. Environ. Manag. 2010, 45, 662–668. [Google Scholar] [CrossRef]
  50. Ma, R.; Duan, H.; Hu, C.; Feng, X.; Li, A.; Ju, W.; Jiang, J.; Yang, G. A half-century of changes in China’s lakes: Global warming or human influence? Geophys. Res. Lett. 2010, 37, L24106. [Google Scholar] [CrossRef]
  51. Wang, S.-R.; Meng, W.; Jin, X.-C.; Zheng, B.-H.; Zhang, L.; Xi, H.-Y. Ecological security problems of the major key lakes in China. Environ. Earth Sci. 2015, 74, 3825–3837. [Google Scholar] [CrossRef]
  52. Yang, G.S.; Ma, R.; Zhang, L.; Jiang, J.H.; Yao, S.C.; Zhang, M.; Zeng, H.A. Lake status, major problems and protection strategy in China. J. Lake Sci. 2010, 22, 799–810. [Google Scholar]
  53. Kong, X.Z.; He, Q.S.; Yang, B.; He, W.; Xu, F.L.; Janssen, A.B.G.; Kuiper, J.J.; van Gerven, L.P.A.; Qin, N.; Jiang, Y.J.; et al. Hydrological regulation drives regime shifts: Evidence from paleolimnology and ecosystem modeling of a large shallow Chinese lake. Glob. Change Biol. 2017, 23, 737–754. [Google Scholar] [CrossRef]
  54. Dong, X.; Bennion, H.; Battarbee, R.; Yang, X.; Yang, H.; Liu, E. Tracking eutrophication in Taihu Lake using the diatom record: Potential and problems. J. Paleolimnol. 2008, 40, 413–429. [Google Scholar] [CrossRef]
  55. Yang, X.D.; Anderson, N.J.; Dong, X.H.; Shen, J. Surface sediment diatom assemblages and epilimnetic total phosphorus in large, shallow lakes of the Yangtze floodplain: Their relationships and implications for assessing long-term eutrophication. Freshw. Biol. 2008, 53, 1273–1290. [Google Scholar] [CrossRef]
  56. Zhang, E.; Bedford, A.; Jones, R.; Shen, J.; Wang, S.; Tang, H. A subfossil chironomid-total phosphorus inference model for lakes in the middle and lower reaches of the Yangtze River. Chin. Sci. Bull. 2006, 51, 2125–2132. [Google Scholar] [CrossRef]
  57. Dong, X.; Xiangdong, Y.; Wang, R.; Hongxi, P.A.N. A diatom-total phosphorus transfer function for lakes in the middle and lower reaches of Yangtze River. J. Lake Sci. 2006, 18, 1–12. [Google Scholar] [CrossRef] [Green Version]
  58. Zhang, E.; Cao, Y.; Langdon, P.; Jones, R.; Yang, X.; Shen, J. Alternate trajectories in historic trophic change from two lakes in the same catchment, Huayang Basin, middle reach of Yangtze River, China. J. Paleolimnol. 2012, 48, 367–381. [Google Scholar] [CrossRef]
  59. Dong, X.; Yang, X. Establishing reference condition for lake restoration: The opportunity for palaeoecology. J. Lake Sci. 2012, 24, 974–984. [Google Scholar]
  60. Zhang, Q.; Dong, X.; Yao, M.; Chen, S.; Yang, X. Historical information on aquatic vegetation revealed by sedimentary diatoms: A case study on Liangzi lake. Acta Hydrobiol. Sin. 2014, 38, 1024–1032. [Google Scholar]
  61. Zheng, J.; Xu, M.; Zheng, W.; Zhu, K.; Wang, R.; Zhang, E. Ecosystem Evolutionary Trajectory of Lake Xiliang over the Past Century Driven by Eutrophication. Environ. Sci. 2022, 43, 2518–2526. [Google Scholar]
  62. Yang, X.D.; Shen, J.; Dong, X.H.; Liu, E.F.; Wang, S.M. Historical trophic evolutions and their ecological responses from shallow lakes in the middle and lower reaches of the Yangtze River: Case studies on Longgan Lake and Taibai Lake. Sci. China Ser. D Earth Sci. 2006, 49, 51–61. [Google Scholar] [CrossRef]
  63. Bennion, H. A diatom-phosphorus transfer function for shallow, eutrophic ponds in southeast England. Hydrobiologica 1994, 275, 391–410. [Google Scholar] [CrossRef]
  64. Juggins, S. Software for ecological and palaeoecological data analysis and visualisation. Tutor. Version 2003, 13, 1–24. [Google Scholar]
  65. Chen, X.; Yang, X.; Dong, X.; Liu, Q. Nutrient dynamics linked to hydrological condition and anthropogenic nutrient loading in Chaohu Lake (southeast China). Hydrobiologia 2011, 661, 223–234. [Google Scholar] [CrossRef]
  66. Liao, Y.; Li, C.; Dong, X.; Wei, W. Environmental evolution of Datong Lake over the past 160 years and its nutrient baseline. Acta Hydrobiol. Sin. 2021, 45, 206–215. [Google Scholar]
  67. Li, X.-P.; Chen, X.-H.; Dong, X.-H.; Dong, Z.; Sun, D.-P. Nutrient dynamics over the past 100 years and its restoration baseline in Dianshan Lake. Environ. Sci. 2012, 33, 3301–3307. [Google Scholar]
  68. Huang, C.; Cao, Y.; Chen, X. Ecological environment changes inferred from subfossil chironomid if Shahu Lake in Wuhan city. Acta Hydrobiol. Sin. 2018, 42, 162–170. [Google Scholar]
  69. Zhang, Q.; Dong, X.; Min, Y.; Chen, S.; Xiangdong, Y. Environmental changes in response to altered hydrological connectivities with the Yangtze River in Lake Zhangdu (Hubei Province) over the past 200 years. J. Lake Sci. 2013, 25, 463–470. [Google Scholar] [CrossRef] [Green Version]
  70. Liu, Q.; Yang, X.D.; Anderson, N.J.; Liu, E.F.; Dong, X.H. Diatom ecological response to altered hydrological forcing of a shallow lake on the Yangtze floodplain, SE China. Ecohydrology 2012, 5, 316–325. [Google Scholar] [CrossRef]
  71. Zhang, E.; Liu, E.; Jones, R.; Langdon, P.; Yang, X.; Shen, J. A 150-year record of recent changes in human activity and eutrophication of Lake Wushan from the middle reach of the Yangze River, China. J. Paleolimnol. 2010, 69, 235–241. [Google Scholar] [CrossRef] [Green Version]
  72. Zhang, Q.H.; Dong, X.H.; Chen, Y.W.; Yang, X.D.; Xu, M.; Davidson, T.A.; Jeppesen, E. Hydrological alterations as the major driver on environmental change in a floodplain Lake Poyang (China): Evidence from monitoring and sediment records. J. Great Lakes Res. 2018, 44, 377–387. [Google Scholar] [CrossRef]
  73. Wickham, H.; Chang, W.; Henry, L.; Pedersen, T.L.; Takahashi, K.; Wilke, C.O.; Woo, K.H.; Yutani, H.; Dunnington, D. Create Elegant Data Visualisations Using the Grammar of Graphics, CRAN 1–292. 2021.
  74. Weber, C.A. Aufbau und Vegetation der Moore Norddeutschlands. Bot. Jahrb. Beibl. 1907, 90, 19–34. [Google Scholar]
  75. Brohan, P.; Kennedy, J.J.; Harris, I.; Tett, S.F.B.; Jones, P.D. Uncertainty estimates in regional and global observed temperature changes: A new data set from 1850. J. Geophys. Res. Atmos. 2006, 111, D12106. [Google Scholar] [CrossRef] [Green Version]
  76. Liu, C. The Cause and Nevigate Externality of Agricultural Chemical Fertilizer Pollution in China. Ph.D. Thesis, Zhejiang University, Hangzhou, China, 2018. [Google Scholar]
  77. Xu, H.; Paerl, H.W.; Qin, B.; Zhu, G.; Hall, N.S.; Wu, Y. Determining Critical Nutrient Thresholds Needed to Control Harmful Cyanobacterial Blooms in Eutrophic Lake Taihu, China. Environ. Sci. Technol. 2015, 49, 1051–1059. [Google Scholar] [CrossRef] [PubMed]
  78. Yifan, D.; Wenxiu, Z.; Chenxue, Z.; Min, X.; Rong, W.; Xinghua, W.; Yuan, L. Temporal and spatial differences of lake ecosystem regime shift in China. J. Lake Sci. 2021, 33, 992–1005. [Google Scholar] [CrossRef]
  79. Huang, F.; Zhang, K.; Huang, S.; Lin, Q. Patterns and trajectories of macrophyte change in East China’s shallow lakes over the past one century. Sci. China Earth Sci. 2021, 64, 1735–1745. [Google Scholar] [CrossRef]
  80. Janssen, A.B.G.; de Jager, V.C.L.; Janse, J.H.; Kong, X.Z.; Liu, S.; Ye, Q.H.; Mooij, W.M. Spatial identification of critical nutrient loads of large shallow lakes: Implications for Lake Taihu (China). Water Res. 2017, 119, 276–287. [Google Scholar] [CrossRef]
  81. Janssen, A.B.G.; Hilt, S.; Kosten, S.; Klein, J.J.M.; Paerl, H.W.; Van de Waal, D.B. Shifting states, shifting services: Linking regime shifts to changes in ecosystem services of shallow lakes. Freshw. Biol. 2020, 66, 1–12. [Google Scholar] [CrossRef]
  82. Qin, B.Q.; Gao, G.; Zhu, G.W.; Zhang, Y.L.; Song, Y.Z.; Tang, X.M.; Xu, H.; Deng, J.M. Lake eutrophication and its ecosystem response. Chin. Sci. Bull. 2013, 58, 961–970. [Google Scholar] [CrossRef] [Green Version]
  83. Wang, Y.; Kao, Y.-C.; Zhou, Y.; Zhang, H.; Yu, X.; Lei, G. Can water level management, stock enhancement, and fishery restriction offset negative effects of hydrological changes on the four major Chinese carps in China’s largest freshwater lake? Ecol. Modell. 2019, 403, 1–10. [Google Scholar] [CrossRef]
  84. Zhang, Y. Assessment and Correction of Urban Bias in Surface Air Temperature Series of Eastern China over Time Period 1913–2012; China Academy of Meteorological Sciences: Beijing, China, 2014. [Google Scholar]
  85. Feng, Y.; Que, L.; Feng, J. Spatiotemporal characteristics of wind energy resources from 1960 to 2016 over China. Atmos. Ocean. Sci. Lett. 2020, 13, 136–145. [Google Scholar] [CrossRef] [Green Version]
  86. Junmei, L.; Congwen, Z.H.U.; Jianhua, J.U.; Xiang, L.I.N. Interdecadal Variability in Summer Precipitation over East China during the Past 100 Years and Its Possible Causes. Chin. J. Atmos. Sci. 2014, 38, 782–794. [Google Scholar]
  87. He, F.; Li, M.; Li, S.; Xiao, R. Comparison of changes in land use and land cover in China and the USA over the past 300 years. J. Geog. Sci. 2015, 25, 1045–1057. [Google Scholar] [CrossRef] [Green Version]
  88. Janse, J.H.; Domis, L.N.D.S.; Scheffer, M.; Lijklema, L.; Van Liere, L.; Klinge, M.; Mooij, W.M. Critical phosphorus loading of different types of shallow lakes and the consequences for management estimated with the ecosystem model PCLake. Limnologica 2008, 38, 203–219. [Google Scholar] [CrossRef] [Green Version]
  89. Li, L. Survey and Analysis of Submerged Plant Communities in Honghu Lake, China. Int. J. Ecol. 2018, 7, 129–141. [Google Scholar] [CrossRef]
  90. Janse, J.H. Model Studies on the Eutrophication of Shallow Lakes and Ditches; Wageningen University and Research: Wageningen, The Netherlands, 2005. [Google Scholar]
  91. Qin, B.; Kong, X.; Wang, R.; Zahao, Y.; Yang, X. Lake restoration time of Lake Taibai (China): A case study based on paleolimnology and ecosystem modeling. J. Paleolimnol. 2022, 68, 25–38. [Google Scholar] [CrossRef]
  92. Luo, W. Sediment Record of Subfossil Chironomid Assemblages in the Ecosystem Evolution of Typical Lakes in the Jianghan Lake Group. Master’s Thesis, Jiangsu Normal University, Xuzhou, China, 2017. [Google Scholar]
  93. Eigemann, F.; Mischke, U.; Hupfer, M.; Schaumburg, J.; Hilt, S. Biological indicators track differential responses of pelagic and littoral areas to nutrient load reductions in German lakes. Ecol. Indic. 2016, 61, 905–910. [Google Scholar] [CrossRef]
  94. Yu, C.X.; Li, Z.Y.; Xu, Z.H.; Yang, Z.F. Lake recovery from eutrophication: Quantitative response of trophic states to anthropogenic influences. Ecol. Eng. 2020, 143, 105697. [Google Scholar] [CrossRef]
  95. Wang, H.; Wang, P.; Xu, C.; Sun, Y.; Shi, L.; Zhou, L.; Jeppesen, E.; Chen, J.; Xie, P. Can the "10-year fishing ban" rescue biodiversity of the Yangtze River? Innovation 2022, 3, 100235. [Google Scholar] [CrossRef]
  96. Chen, Y.; Chen, S.; Ma, C.; Yu, S.; Yang, L.; Zhang, Z.; Yao, M. Palynological evidence of natural and anthropogenic impacts on aquatic environmental changes over the last 150 years in Dongping Lake, North China. Quat. Int. 2014, 349, 2–9. [Google Scholar] [CrossRef]
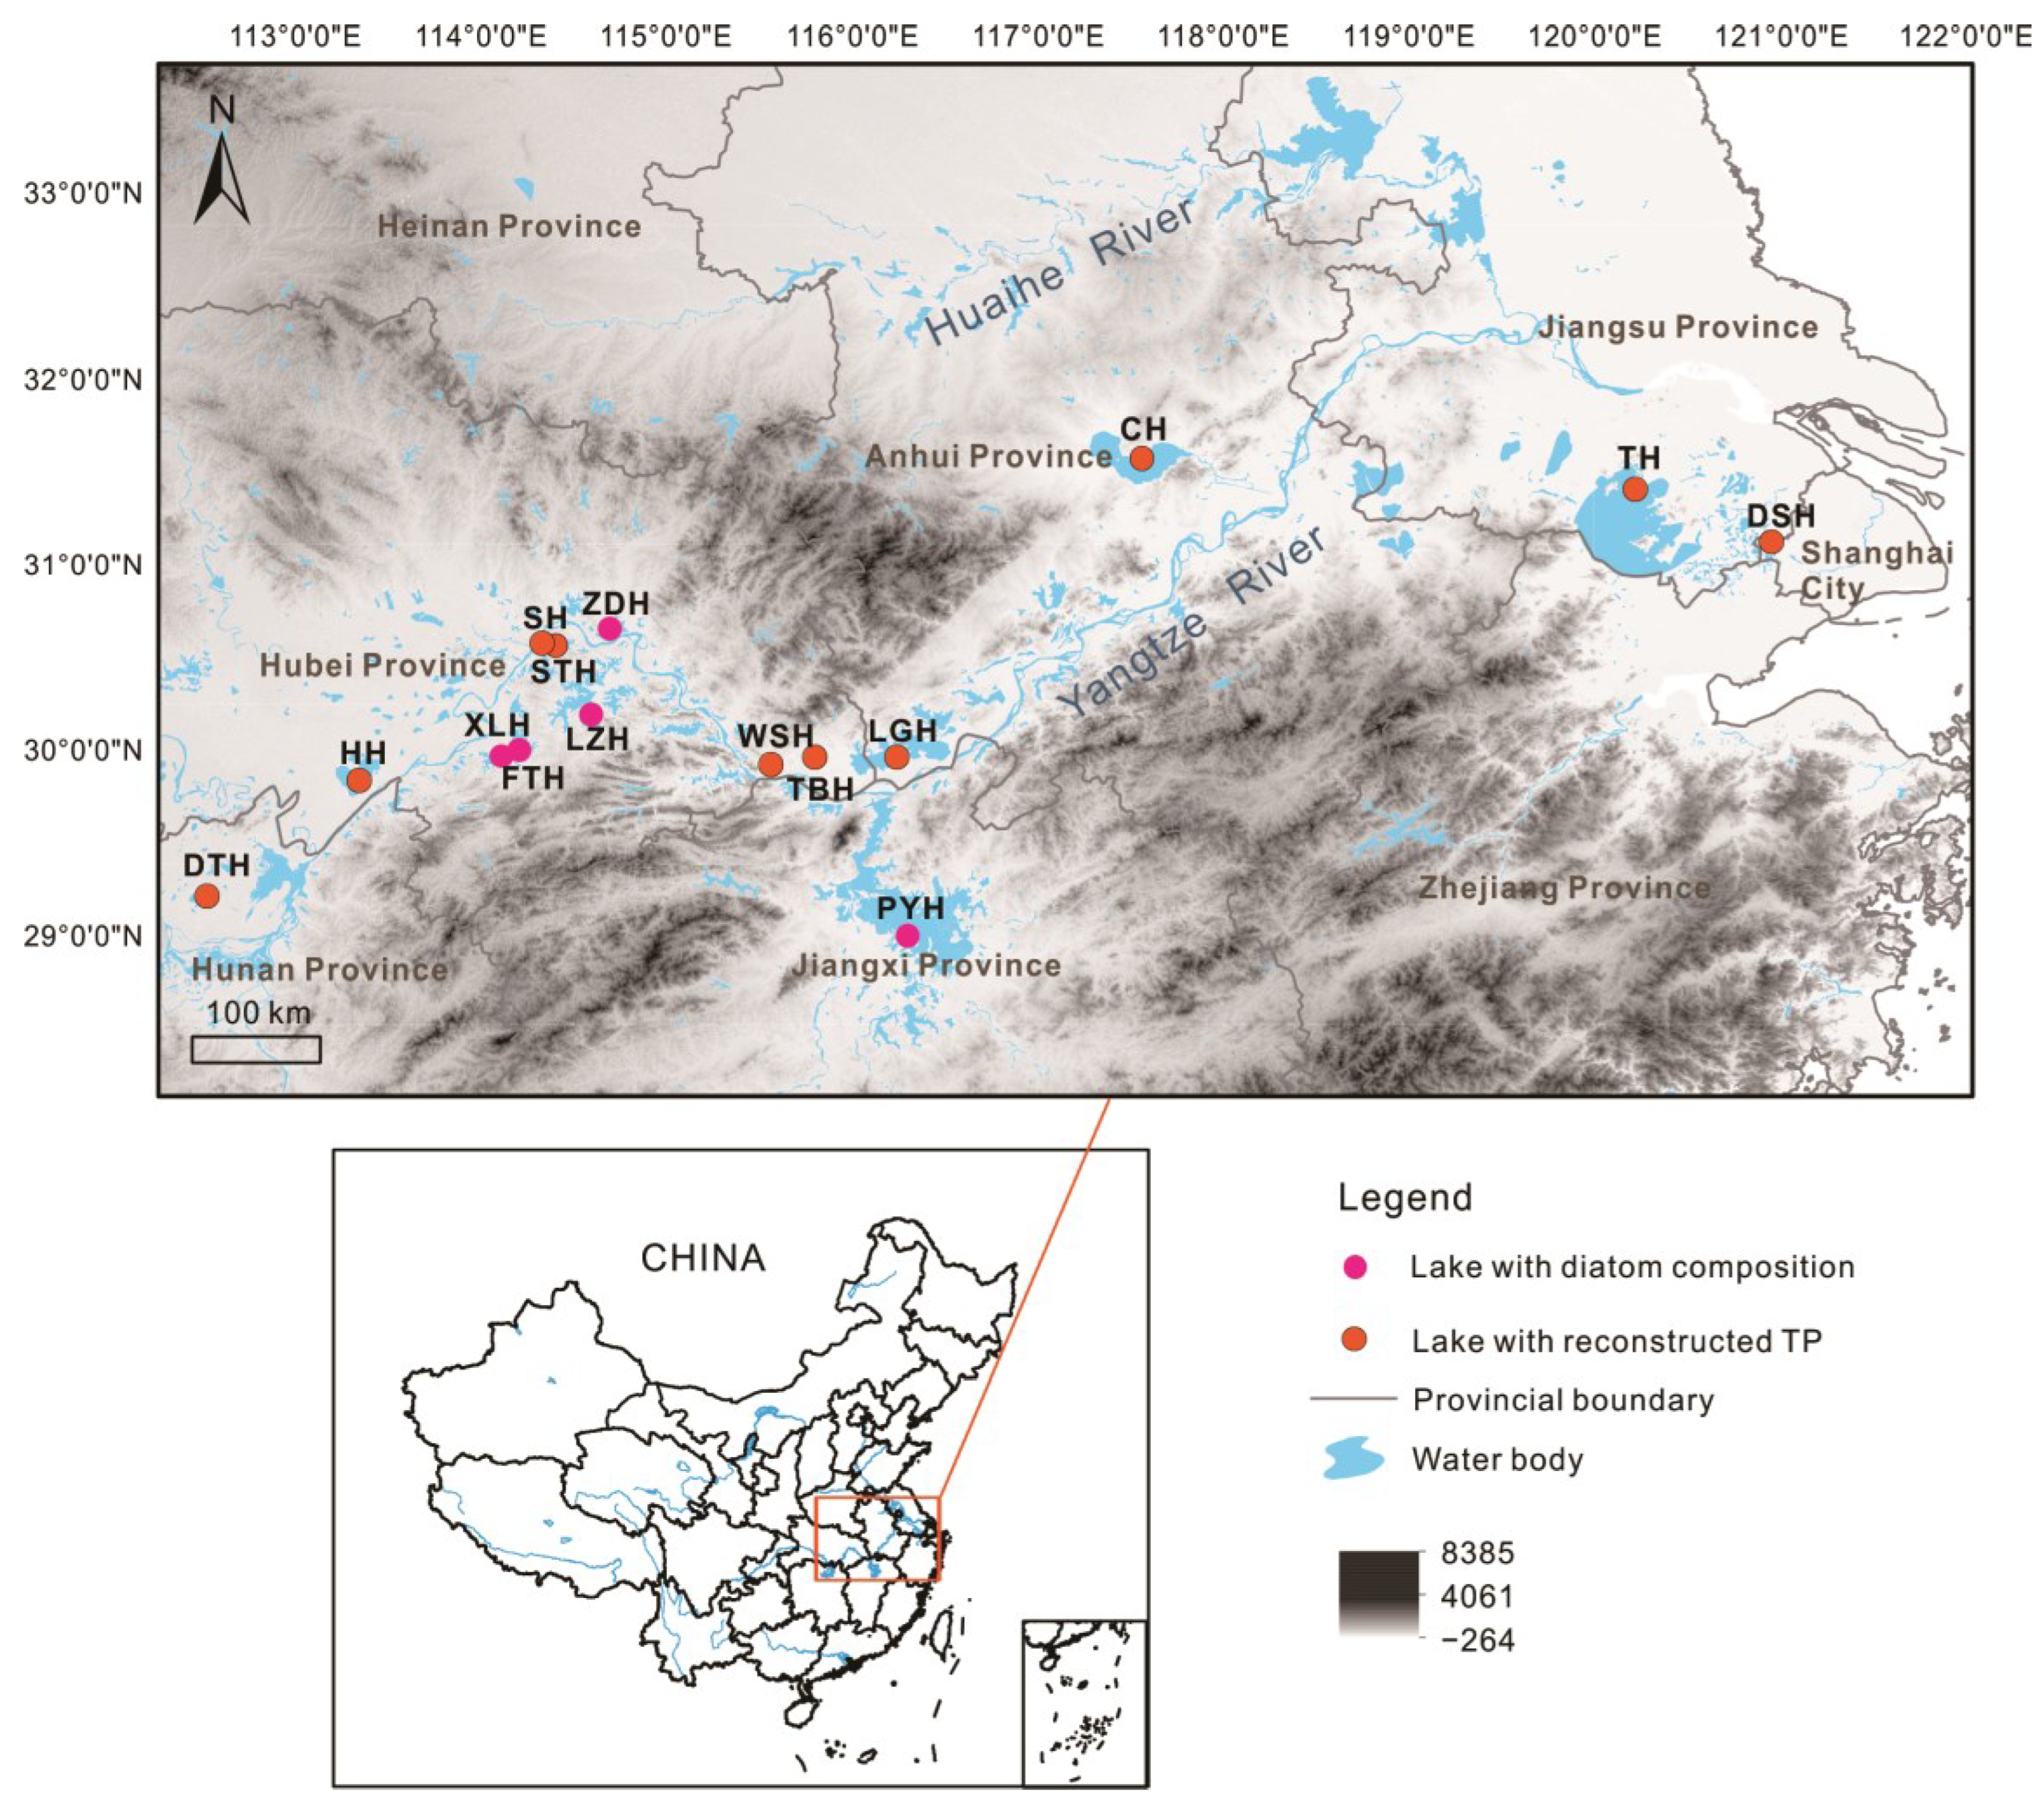
Figure 1. Distribution of studied lakes with TP reconstruction in eastern China.
Sustainability 15 10893 g001
Figure 2. TP reconstructions of fifteen typical lakes in eastern China. Collected or calculated TP trends based on DI-TP or CI-TP transfer functions are shown in different colors.
Sustainability 15 10893 g002
Figure 3. Correlation analysis and clusters of TP trends. (a) Correlation between each pair of TP reconstructions. Pearson r-values of statistically significant relationships (p < 0.05) are displayed in the boxes. (bd) Three main trend types recognized by correlation analysis. The dots are the data, and the smooth curves are the fitting lines of the general additive model (GAM).
Sustainability 15 10893 g003
Figure 4. Regression models of the time-state responses in eight lakes with an increasing TP trend. The model with a higher R2 value is colored in blue (linear regression) or red (step-change), with the alternative model shown in gray. Both p-values for linear regression model (LM-p) and breakpoint regression model (BP-p) are listed for comparison.
Sustainability 15 10893 g004
Figure 5. Regional climate, society information and other ecosystem responses. Climate data include annual temperature, wind speed and summer precipitation indices in eastern China [84,85,86]; society data include GDP, farmland and lake areas and isolation time (sluice building) [52,87]; and other ecosystem responses include sediment total organic carbon (TOC) and macrophytes [78,79]. * Indicates multiplication.
Sustainability 15 10893 g005
Disclaimer/Publisher’s Note: The statements, opinions and data contained in all publications are solely those of the individual author(s) and contributor(s) and not of MDPI and/or the editor(s). MDPI and/or the editor(s) disclaim responsibility for any injury to people or property resulting from any ideas, methods, instructions or products referred to in the content.