1. Introduction
When observing the sky, there is the problem of not knowing whether the observation will be carried out under optimal conditions [
1]. The visibility of stars in the night sky is mainly affected by urban night-time light pollution (ALAN), the weather conditions and the Moon phase [
1,
2,
3,
4,
5,
6,
7,
8]. The ALAN influence on the night sky darkness level (NSB) has been extensively studied [
4,
5,
9,
10,
11,
12,
13,
14,
15,
16,
17,
18]. By correctly selecting the observing site (setting it in a low-brightness place, usually far from urban centres) and a proper design of the illumination of the area [
6,
17], it is possible to minimise the ALAN interference. The presence of the Moon may also be reliably determined depending on the Moon phase at the time of observation. By selecting the days with a Moon phase close to the new Moon, the level of brightness due to its reflection can be minimized [
1].
Weather conditions beyond the observer’s control and may interfere with observation [
1,
19,
20,
21,
22,
23]. However, with today’s technology it is possible to predict, with a certain degree of reliability, future weather conditions (within a given time frame).
In this sense, several studies analyse the influence of weather conditions on the level of night-time darkness in urban environments [
2,
3,
4,
19,
24]. However, there is a high level of ALAN in these locations, which may interfere with the results obtained. In areas without a high level of ALAN, e.g., rural areas far from the main population centres, it is possible to study the meteorological influence on the level of darkness without the influence of ALAN. In this respect, there are fewer studies assessing the influence of climatic conditions in these areas.
A detailed investigation in these areas could reveal which meteorological variables affect the observation and the level of interference they exert. From this information, it is possible to plan the observation properly. The observer can check the forecast of these variables at the meteorological agencies in advance and know whether the observation will take place under optimal conditions. This information can help skywatchers (astronomers, astro-tourists, etc.), allowing them to observe under optimal conditions [
1,
23].
Therefore, the novelty of this study is to evaluate the influence of meteorological conditions on the observation of the starry sky in rural areas (low ALAN conditions) and compare them with those obtained in urban areas (high ALAN conditions). For this purpose, it is necessary to analyse the atmospheric variables (sky temperature, ambient temperature, humidity, relative pressure, wind speed, dew point and hourly rainfall) and, simultaneously, the level of darkness of the sky to calculate the correlation between them. The measurement of these parameters requires the use of a photometer together with a weather station for simultaneous recording. Through further analysis, it is possible to carry out a comparison between them. This study could help in the planning of stargazing in both urban and rural areas, allowing to know in advance the influence of meteorological conditions on the quality of the observation to establish optimal viewing conditions.
2. Materials and Methods
In order to determine the interference generated by the meteorological variables, it was necessary to measure the NSB in mag/arcsec
2. A higher value of this magnitude will imply a higher level of darkness of the night sky, associated with a lower level of light pollution, which will allow for better observability of celestial bodies. A higher NSB value is linked to a lower level of light contamination, which allows a better perception of the stars. The registration of NSB was performed using a Sieltec Canarias SKYGLOW photometer (
Appendix A [
25]).
Depending on the magnitude level, the observer will be able to appreciate a wider range of celestial objects. The NSB should reach a value as high as possible, up to a maximum of 24 mag/arcsec
2 [
18], where visibility is perfect. Simultaneously with the above measurements, a Davis Vantage Vue weather station (
Appendix A [
26]) was recording the atmospheric conditions in the area. The atmospheric variables analysed in the study were as follows:
A number of other secondary variables were measured, which were discarded from the analysis as they did not directly influence the quantification of the measured brightness (e.g., wind direction) or were directly dependent on other measurements (e.g., wind chill). As for cloudiness, the in-house team did not carry out this measurement, so the data available for the study were provided by AEMET [
27]. Meteorological and night sky darkness data were collected simultaneously so that a comparison between the two could be made later and their possible correlation established.
2.1. Research Area
The best sites for sky observation are normally placed away from large cities [
18,
28]. Various rural villages in the province of Cáceres were selected for the experimental phase. This study is part of the GLOBALTUR EUROACE [
29] project that promotes tourism development in the Tejo/Tajo International Biosphere Reserve (
Figure 1). The selected municipalities were: Zarza la Mayor, Herreruela, Valencia de Alcántara, Membrío, Salorino, Brozas, Alcántara, Carbajo, Herrera de Alcántara and Santiago de Alcántara.
Additionally, a grouping of different municipalities geographically close to each other was carried out in three different areas, A (Herreruela, Salorino, Valencia de Alcántara and Membrío), B (Cedillo, Herrera de Alcántara, Santiago de Alcántara and Carbajo) and C (Alcántara, Brozas, Piedras Albas and Zarza la Mayor). In addition, data were collected at the Industrial Engineering School (University of Extremadura) in Badajoz. In this way, data were available for both rural and urban areas.
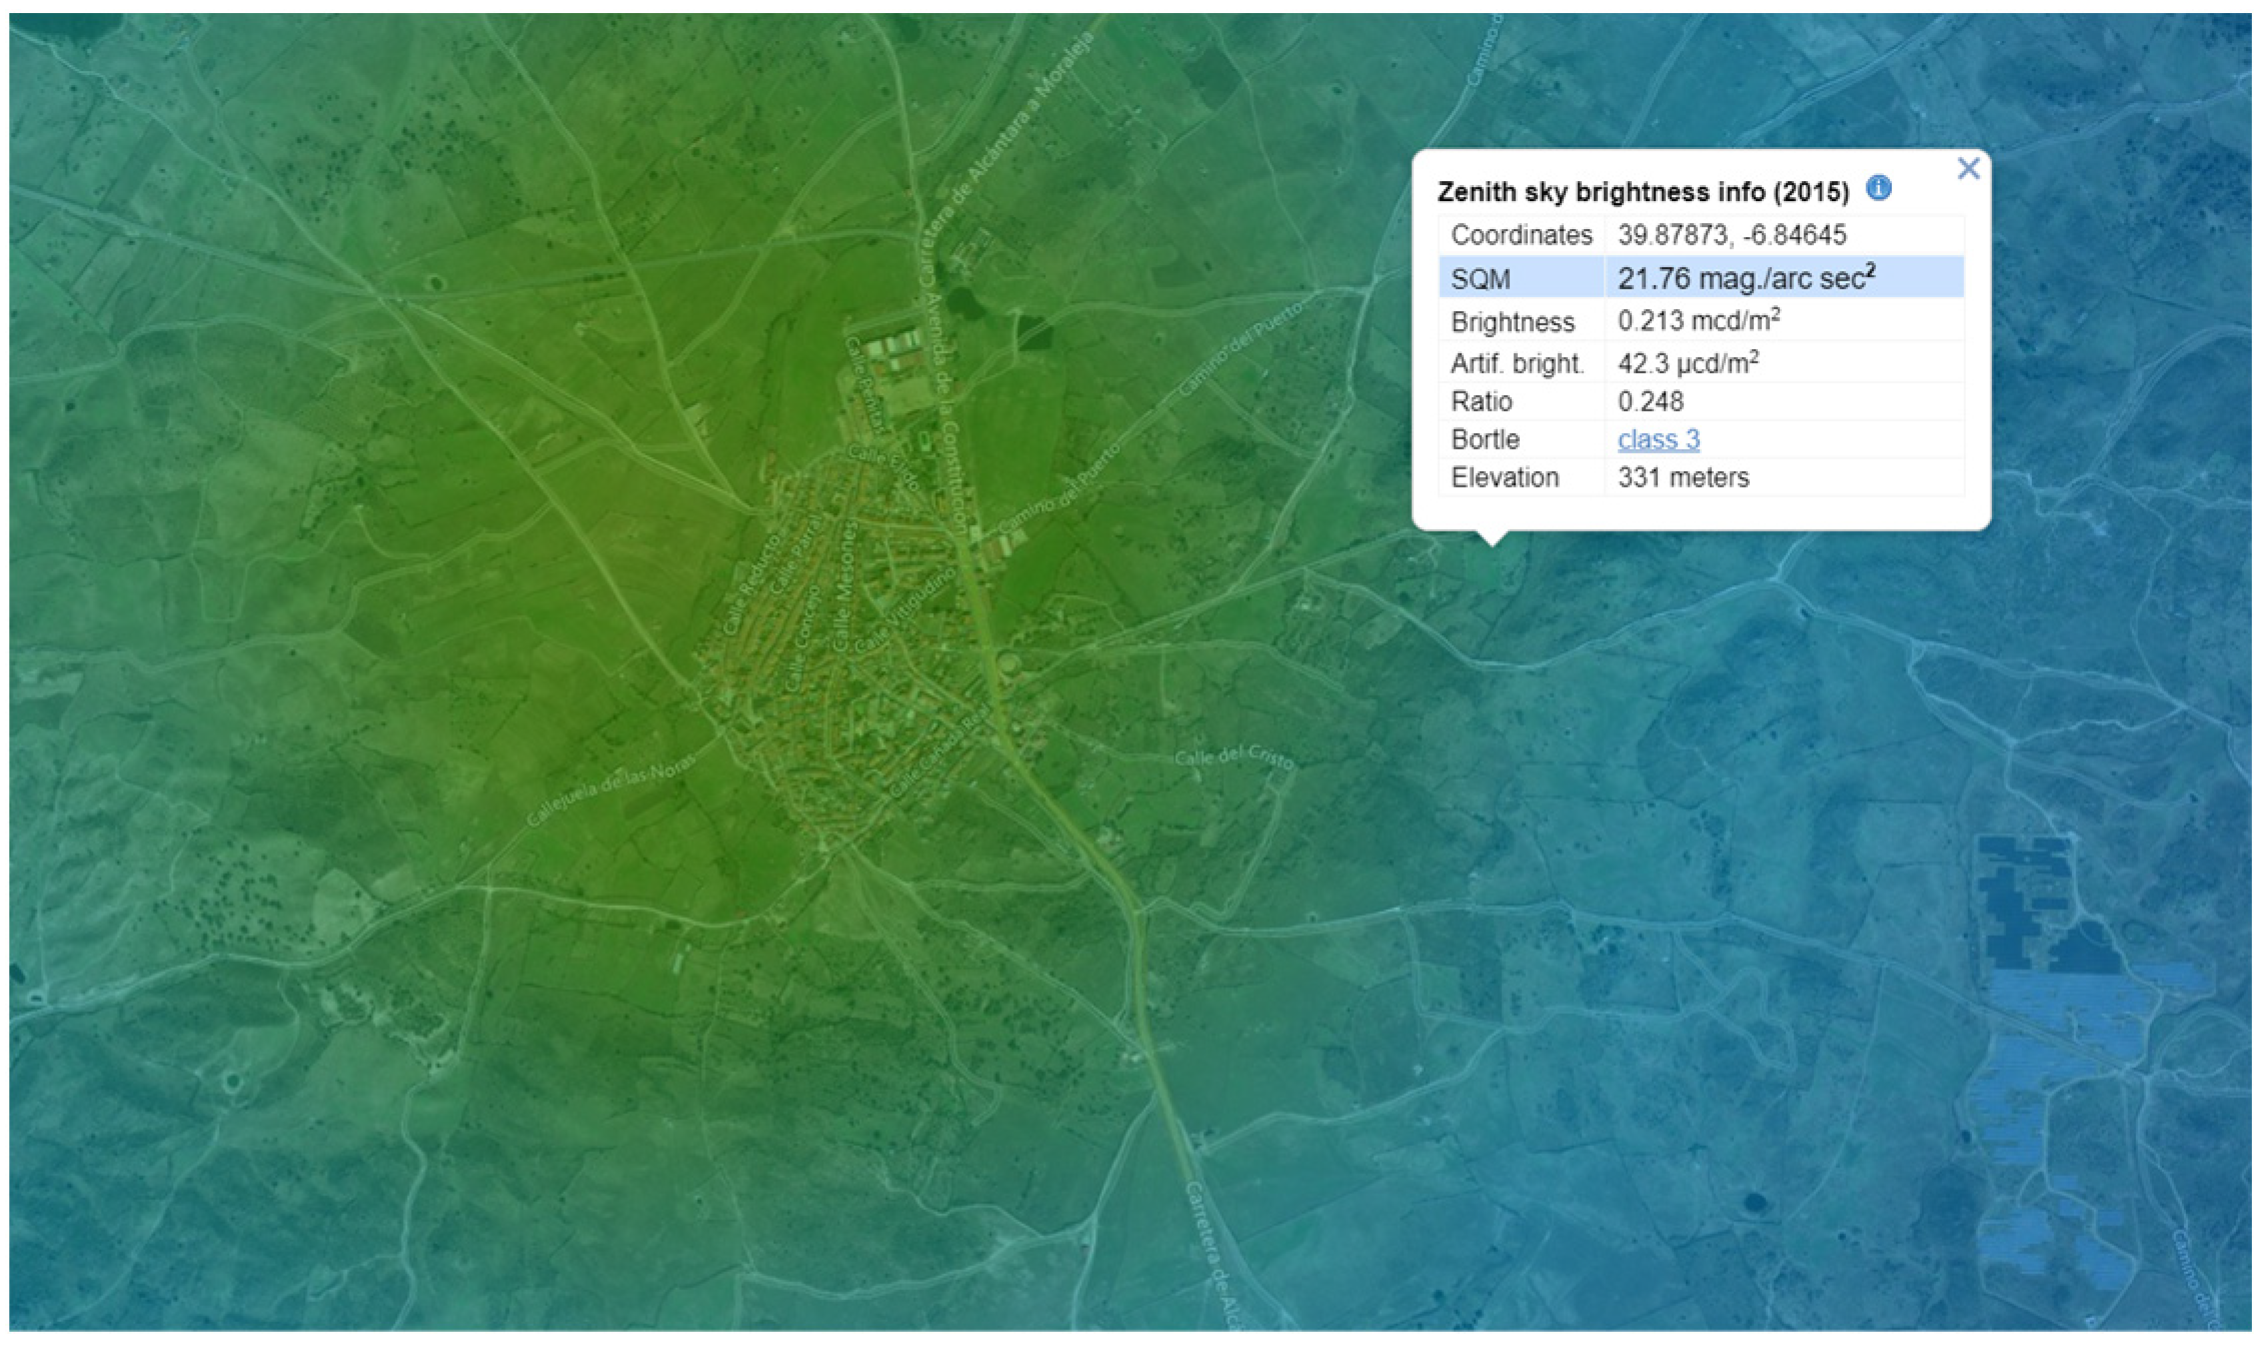
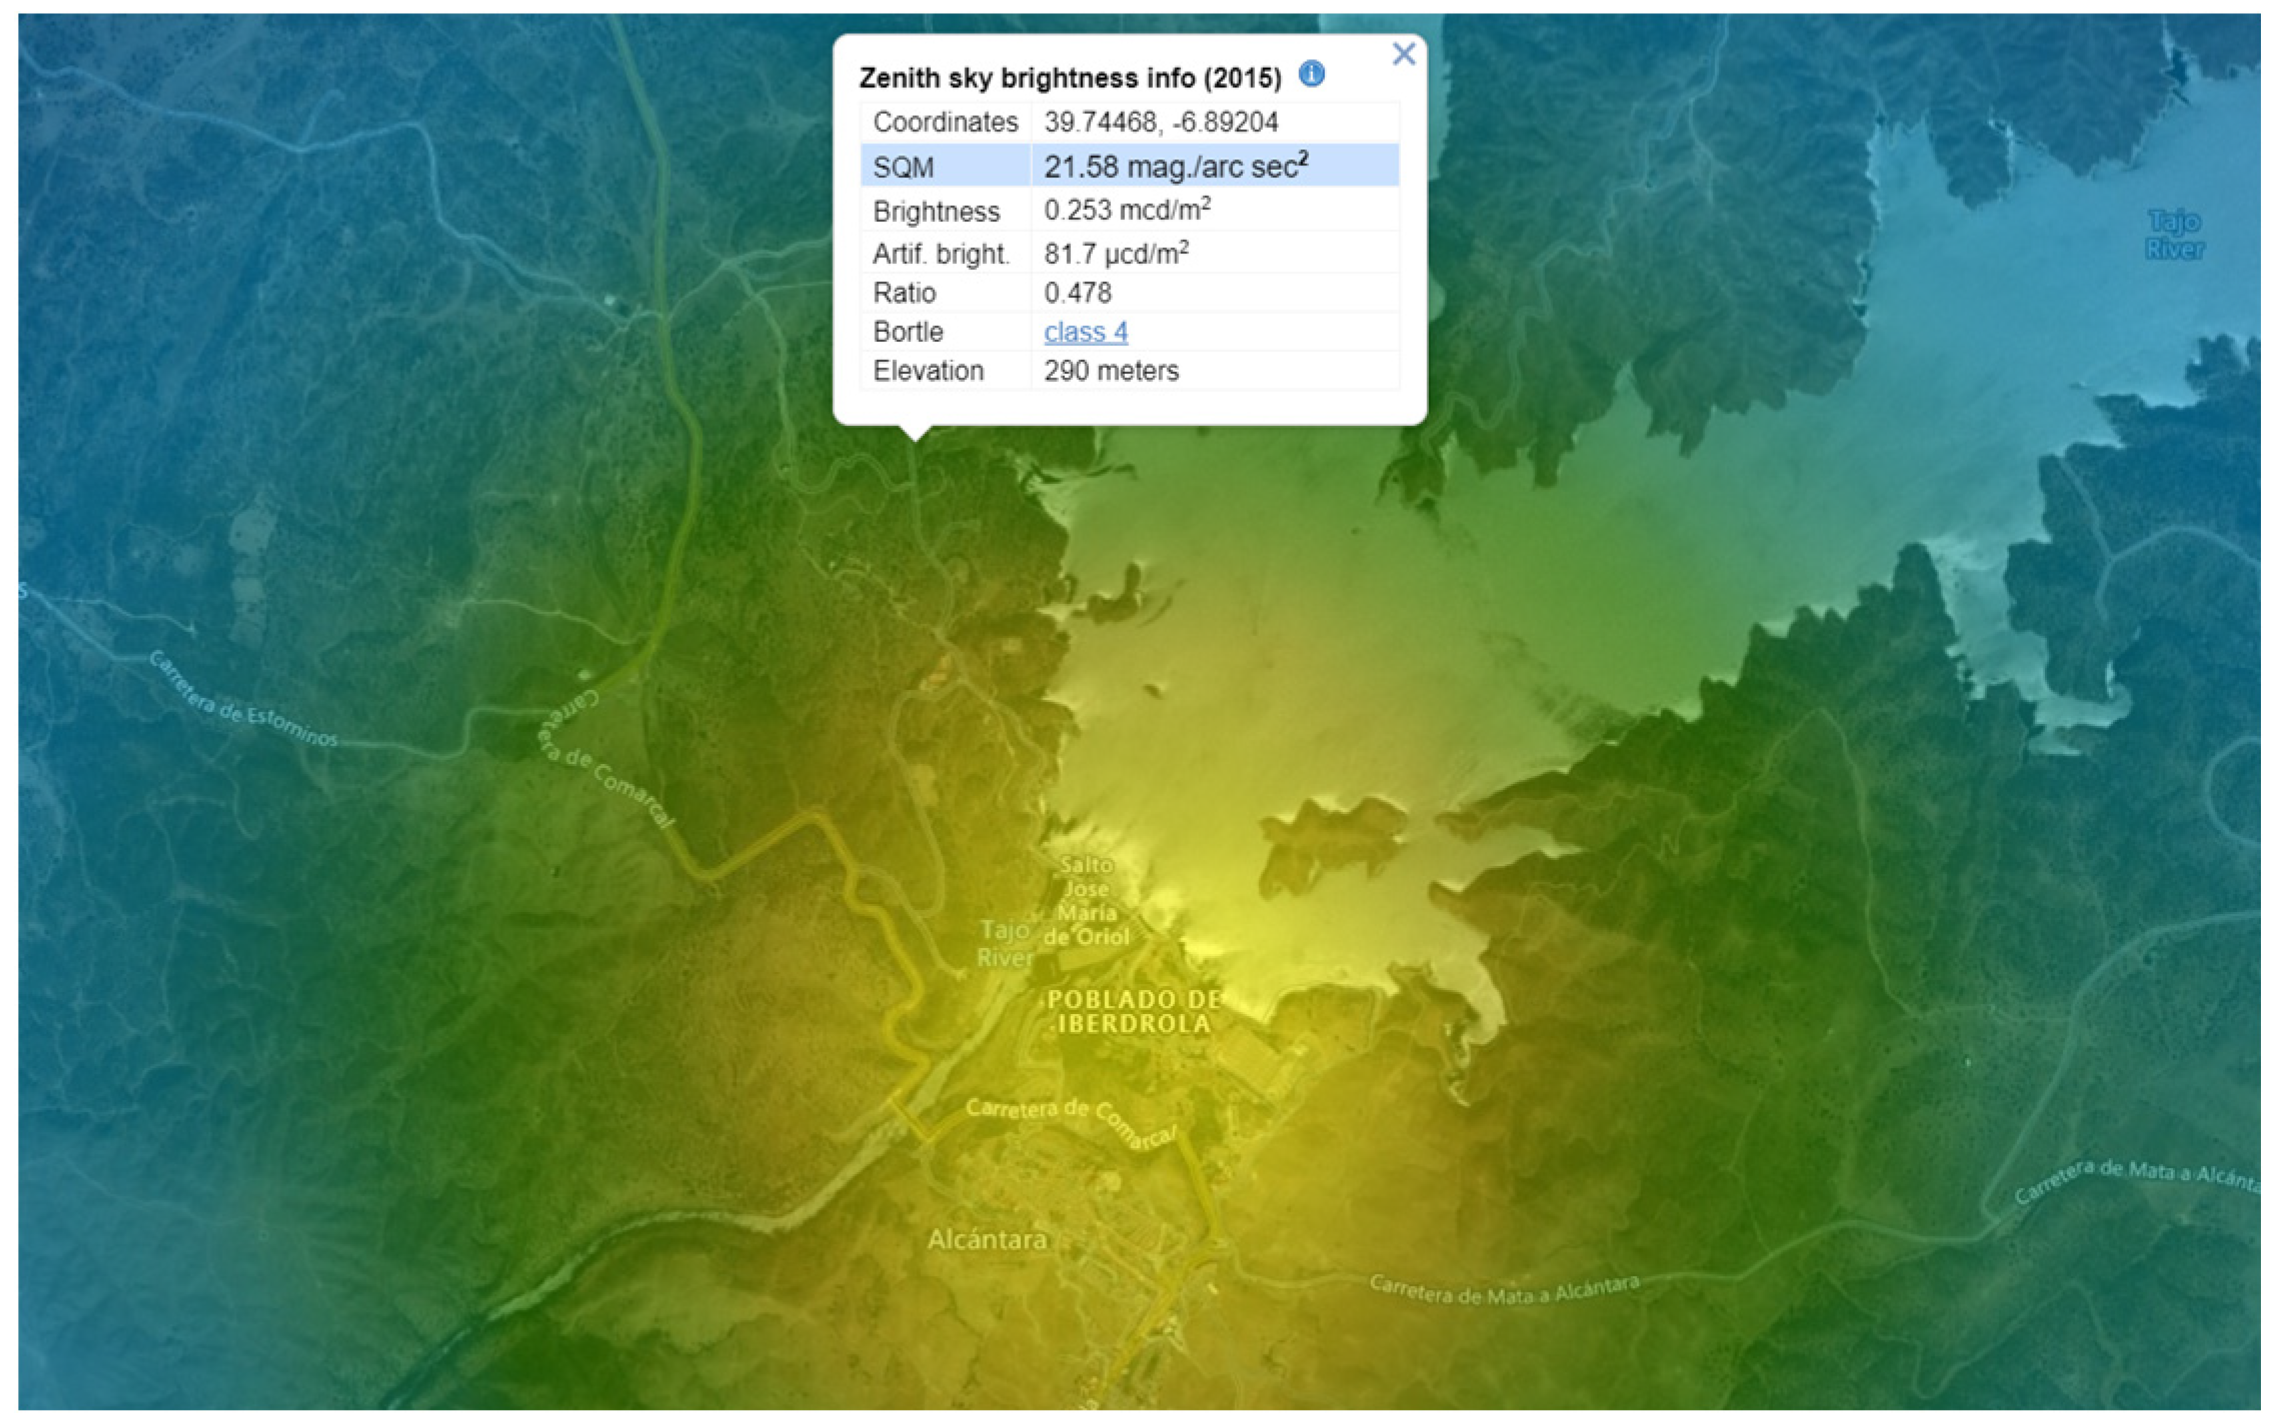
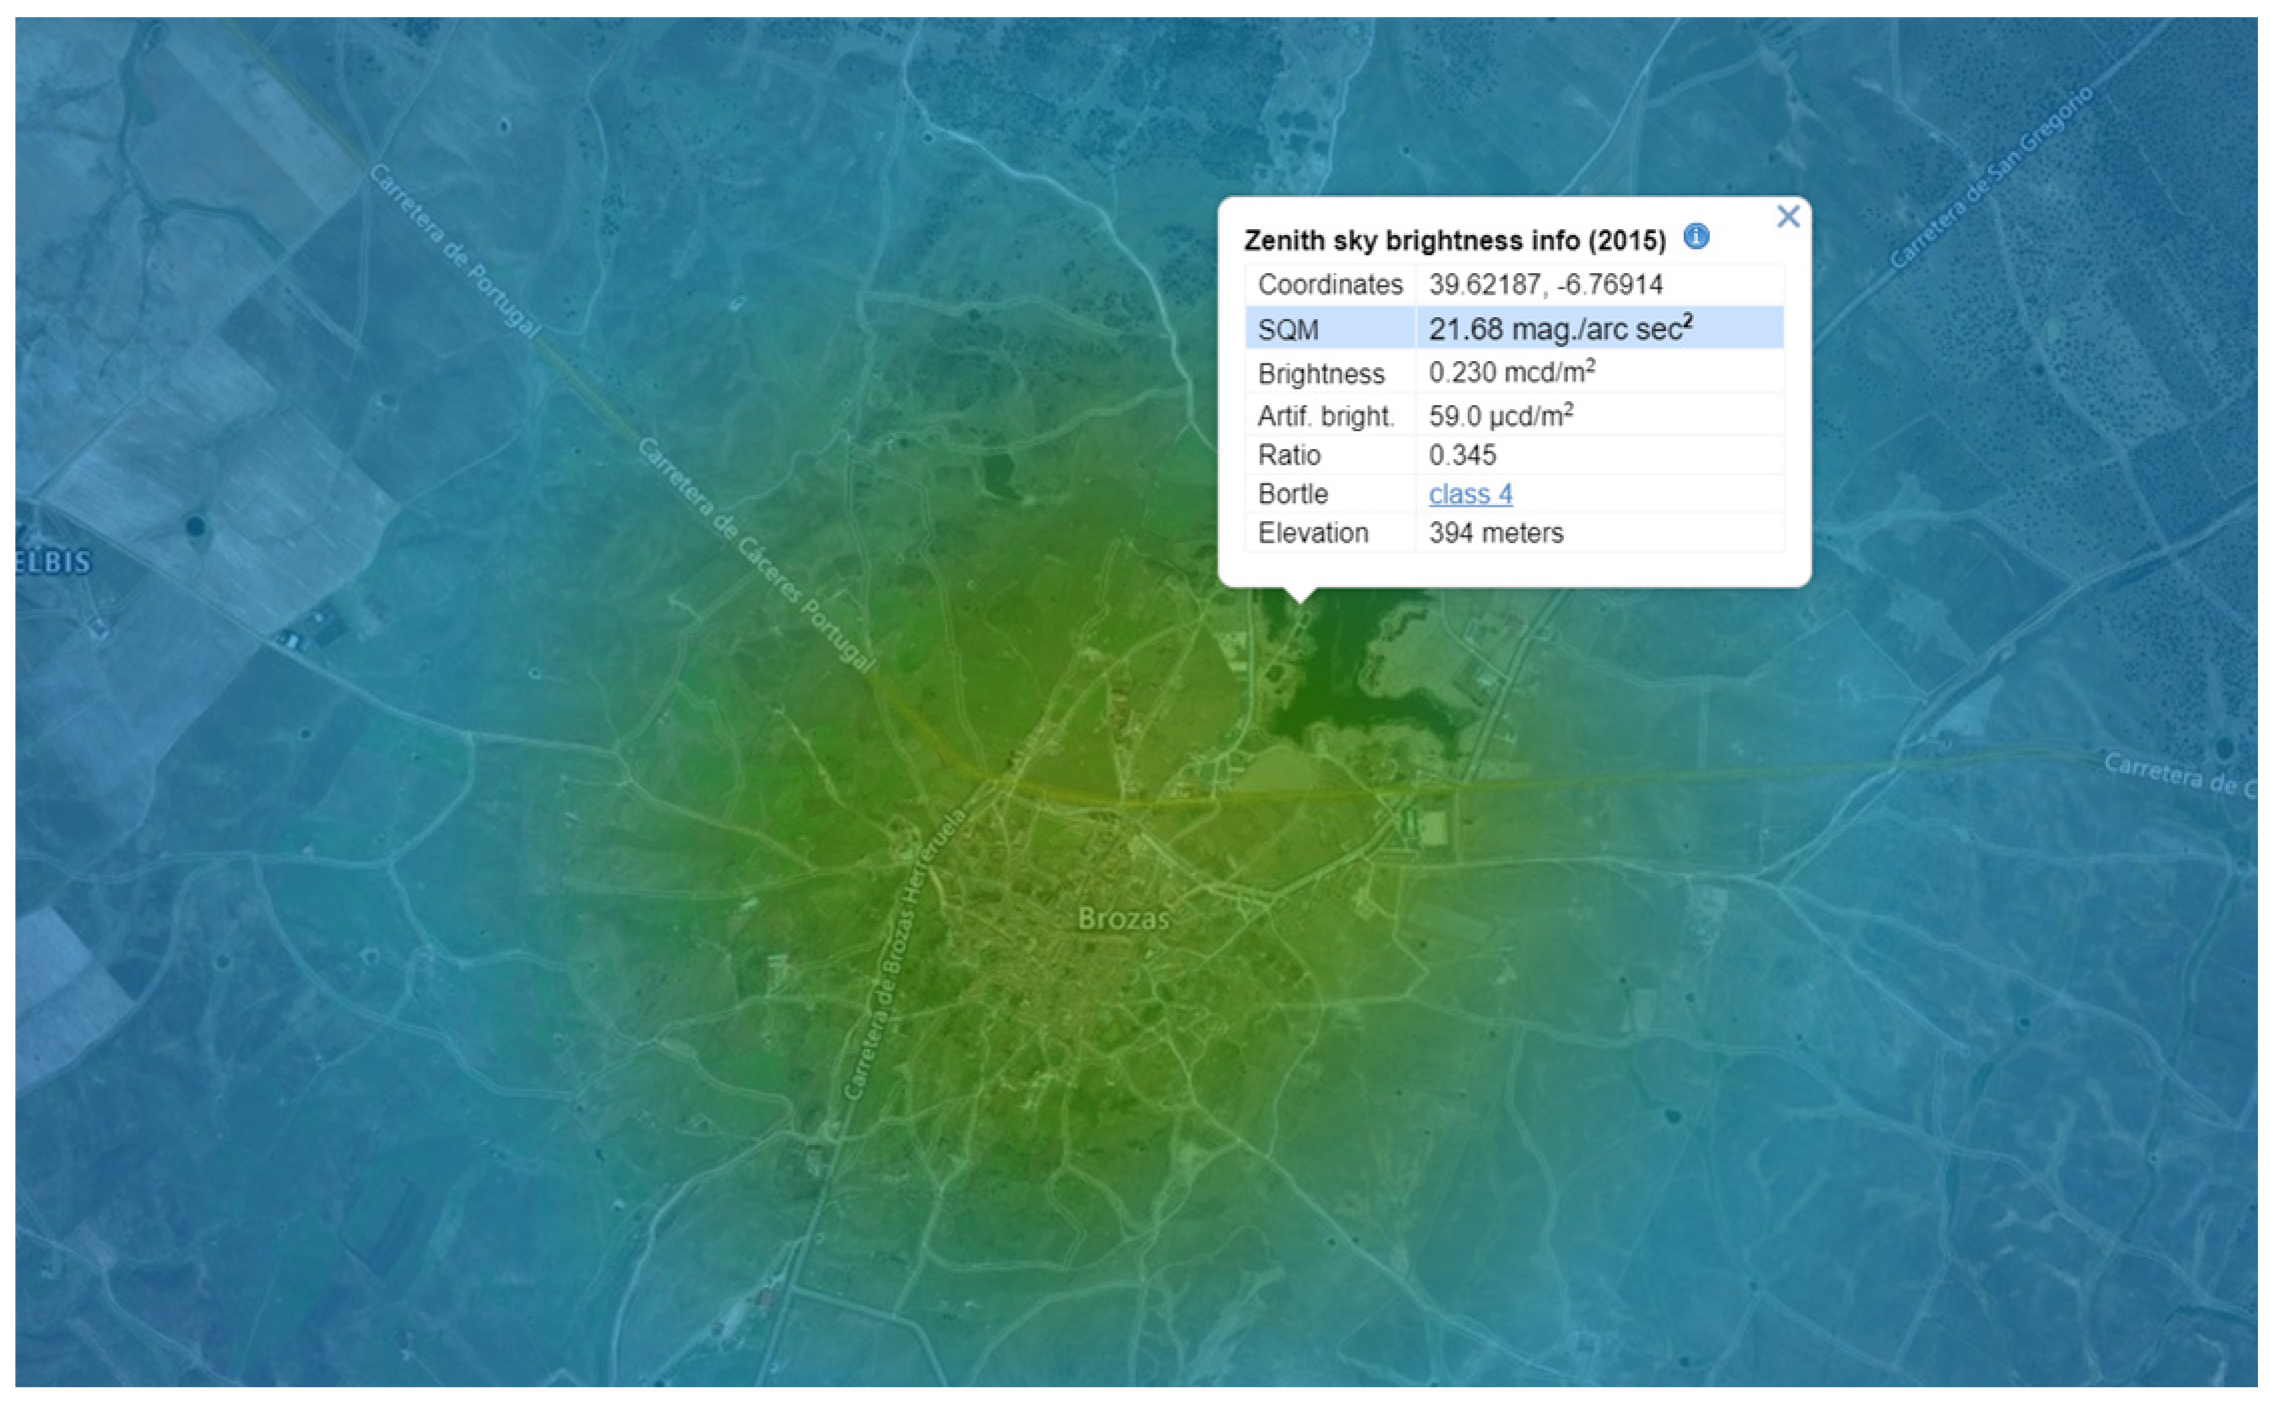
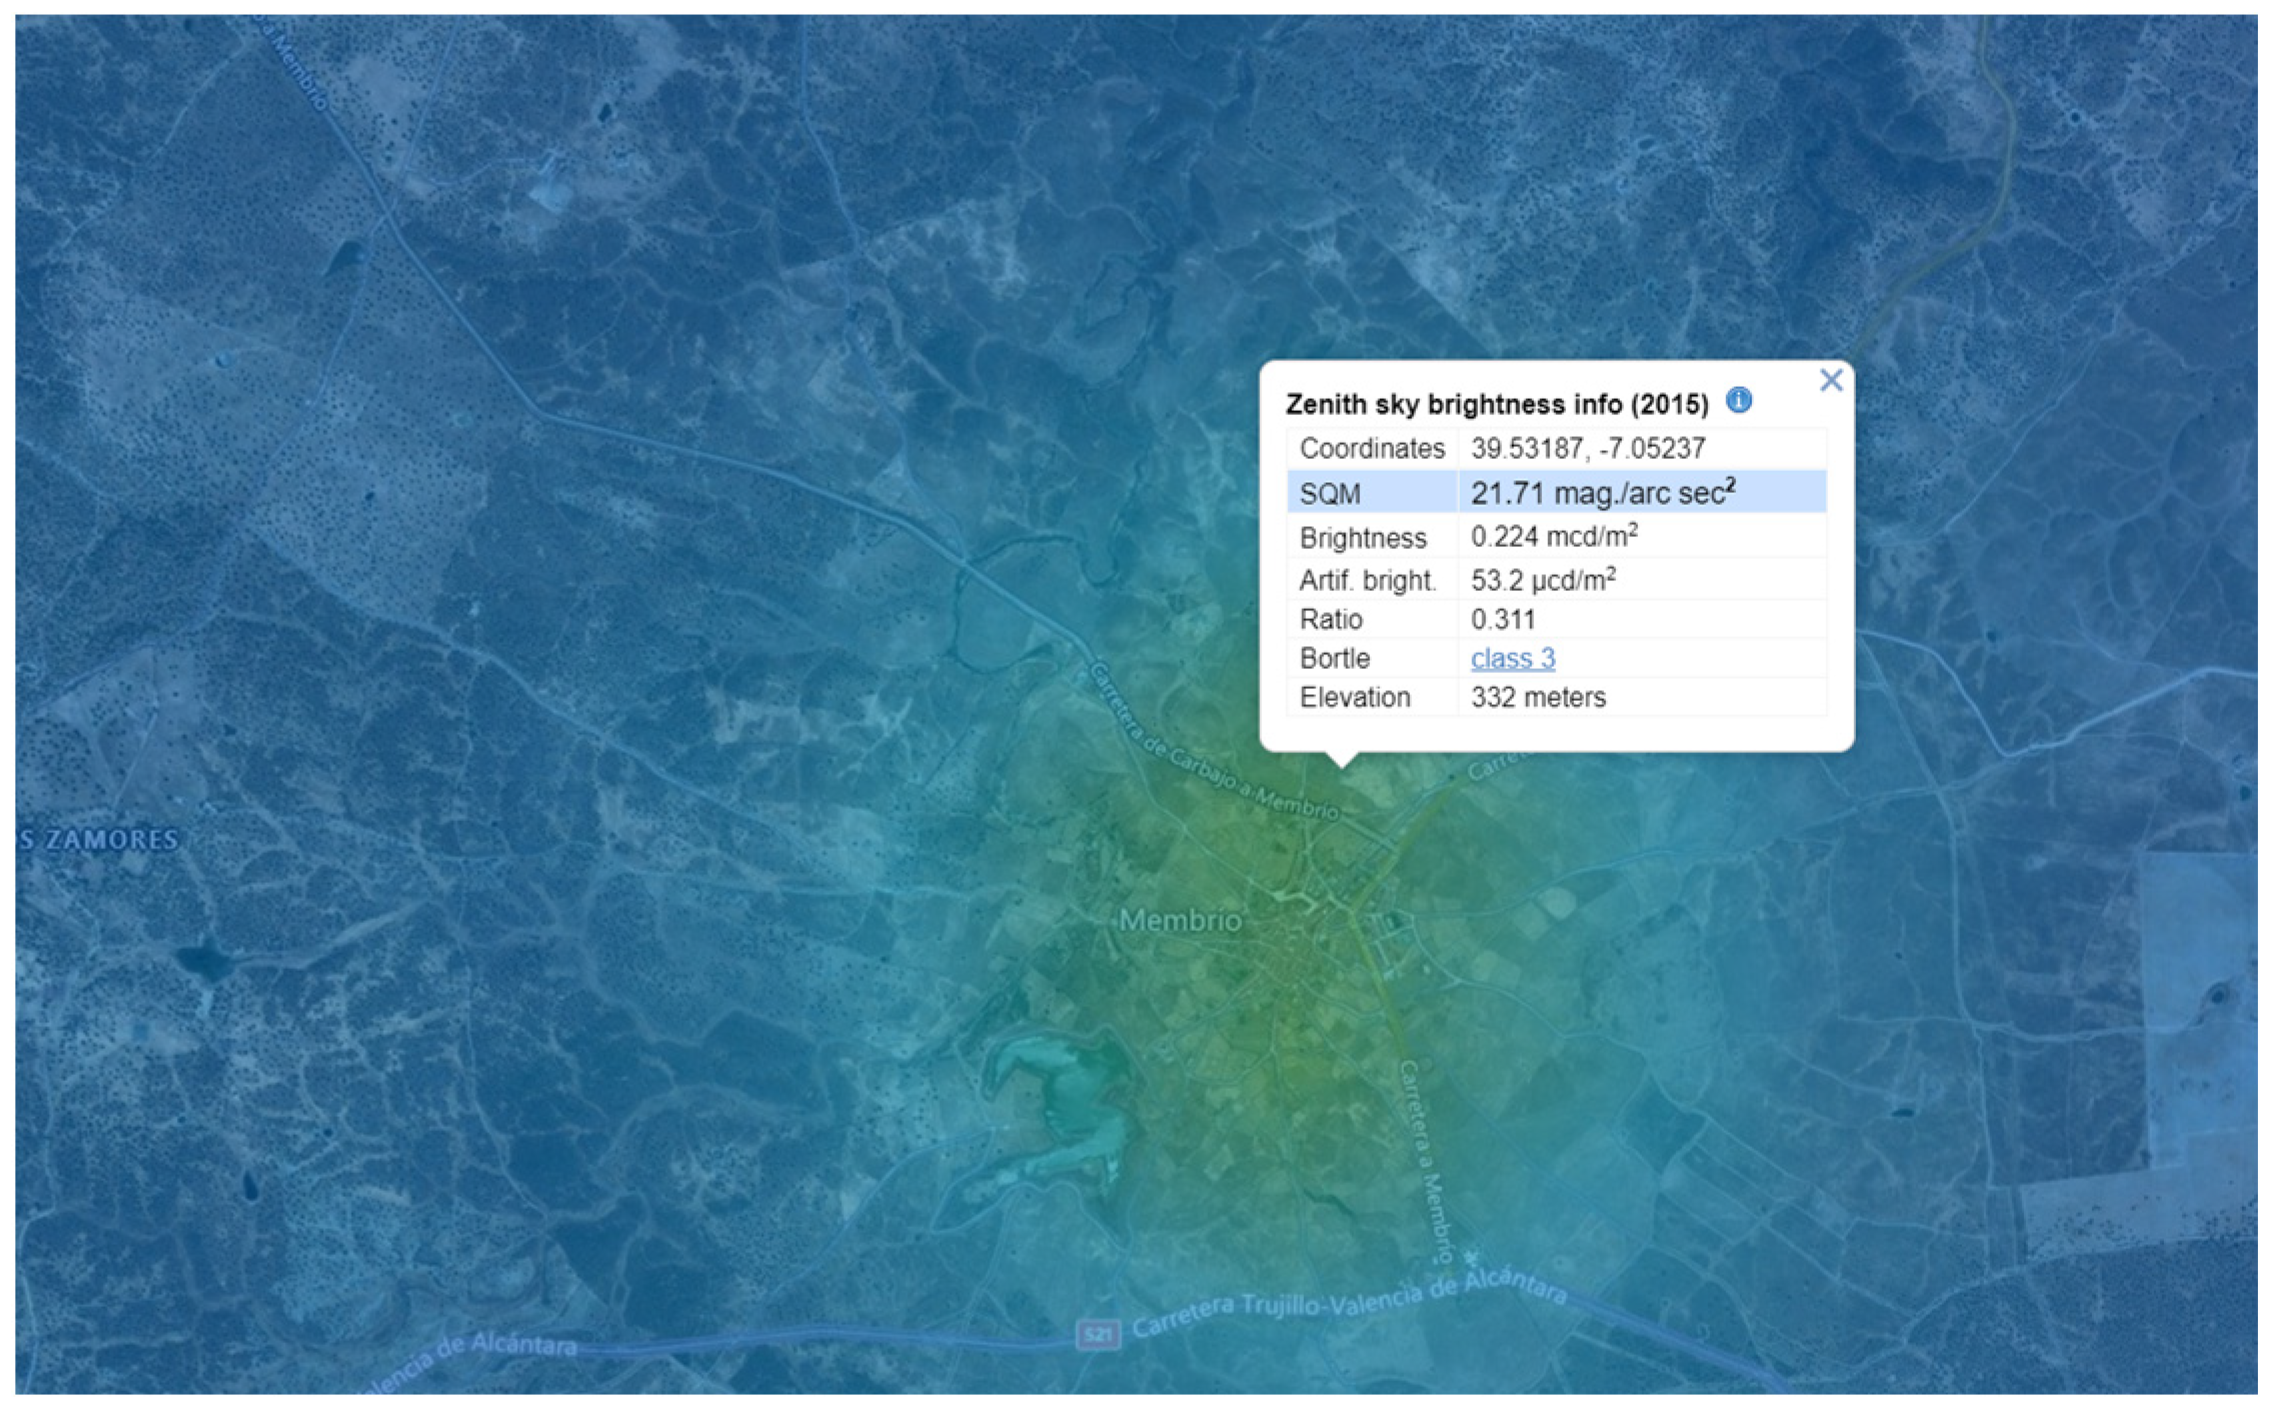
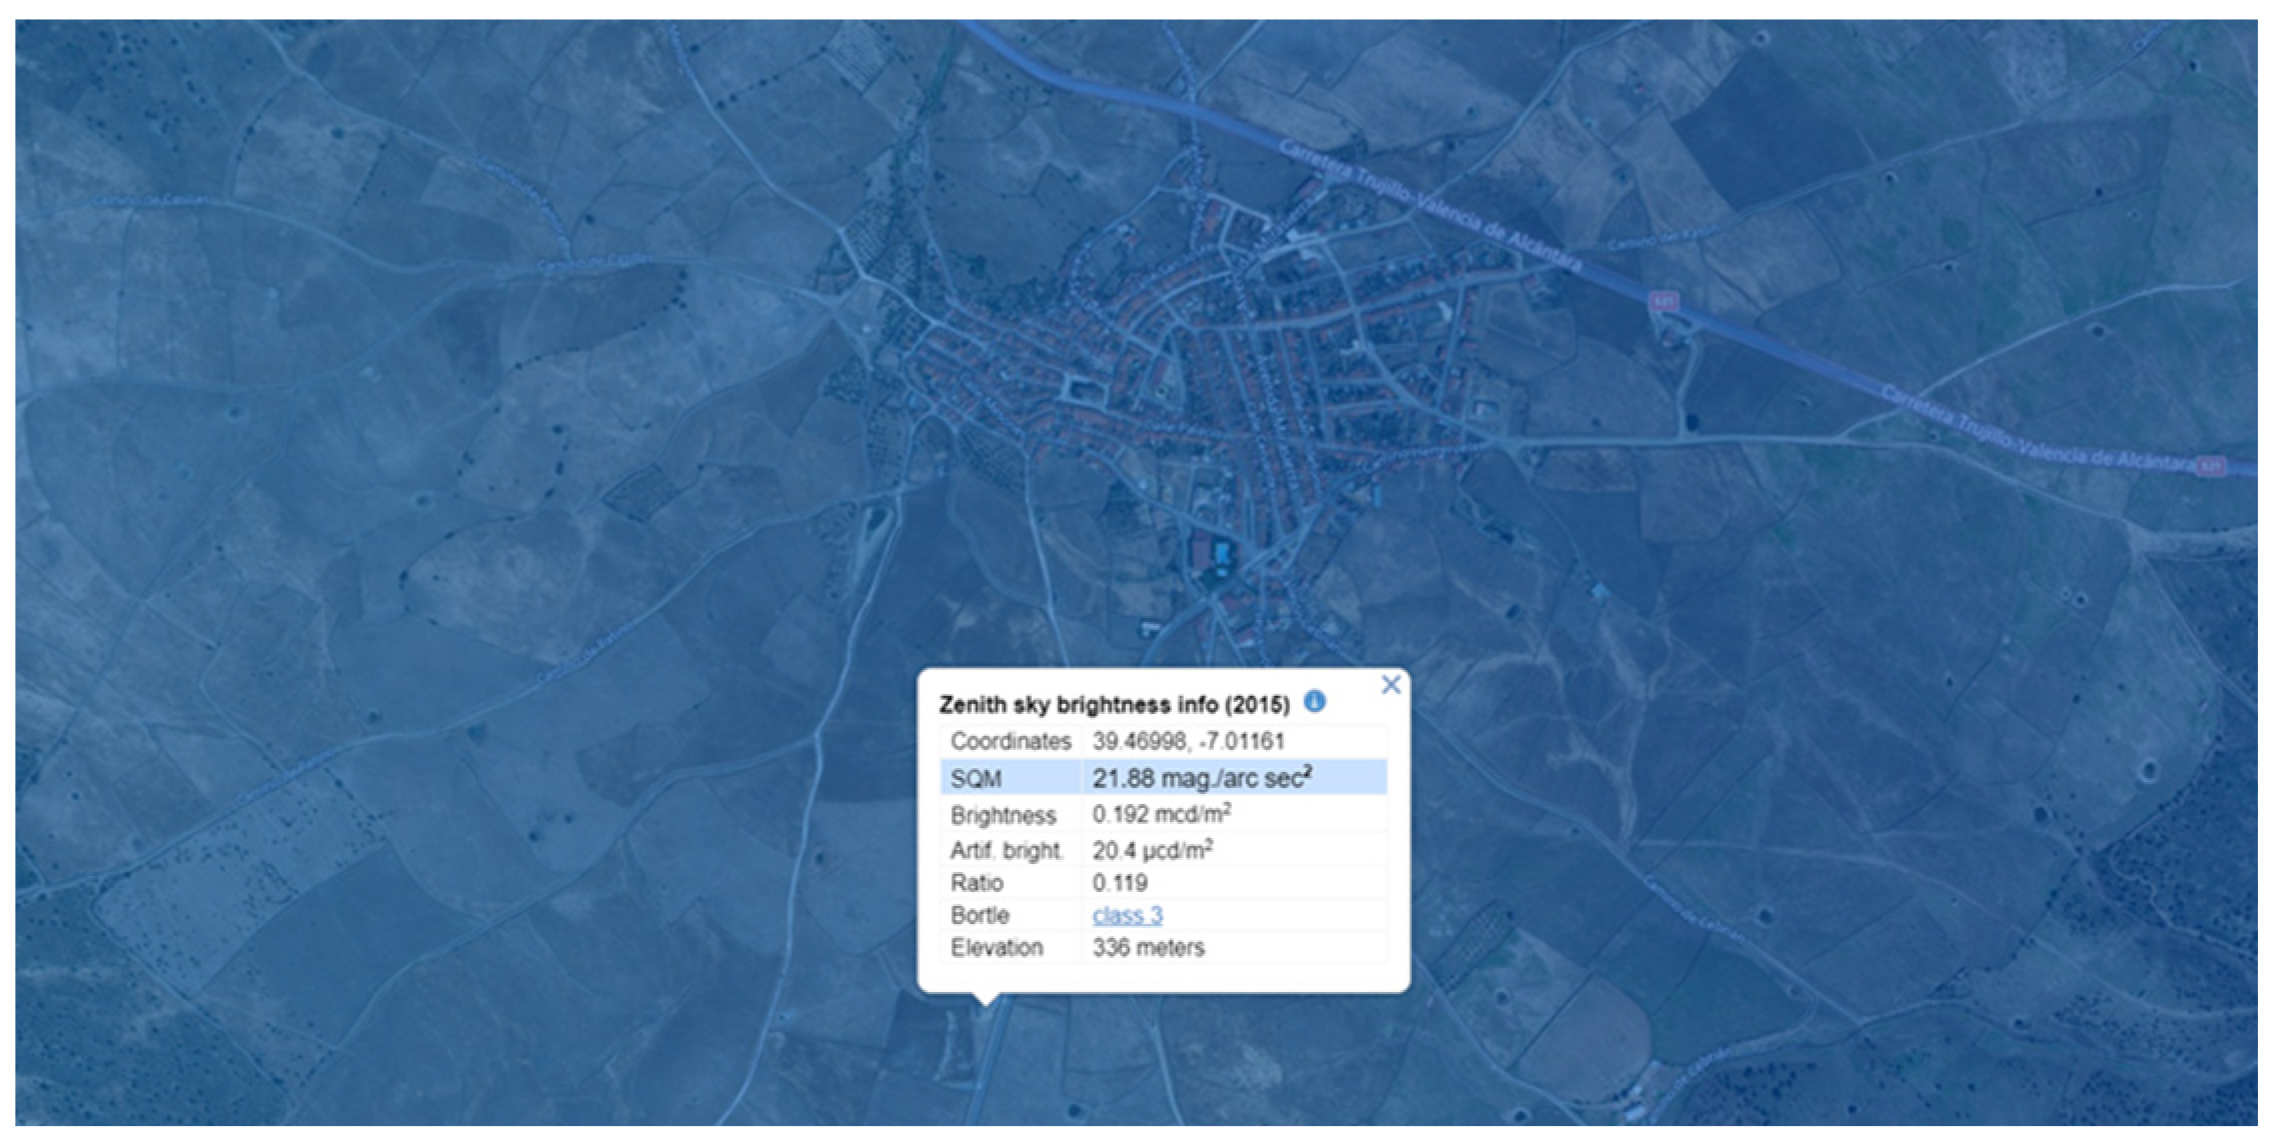
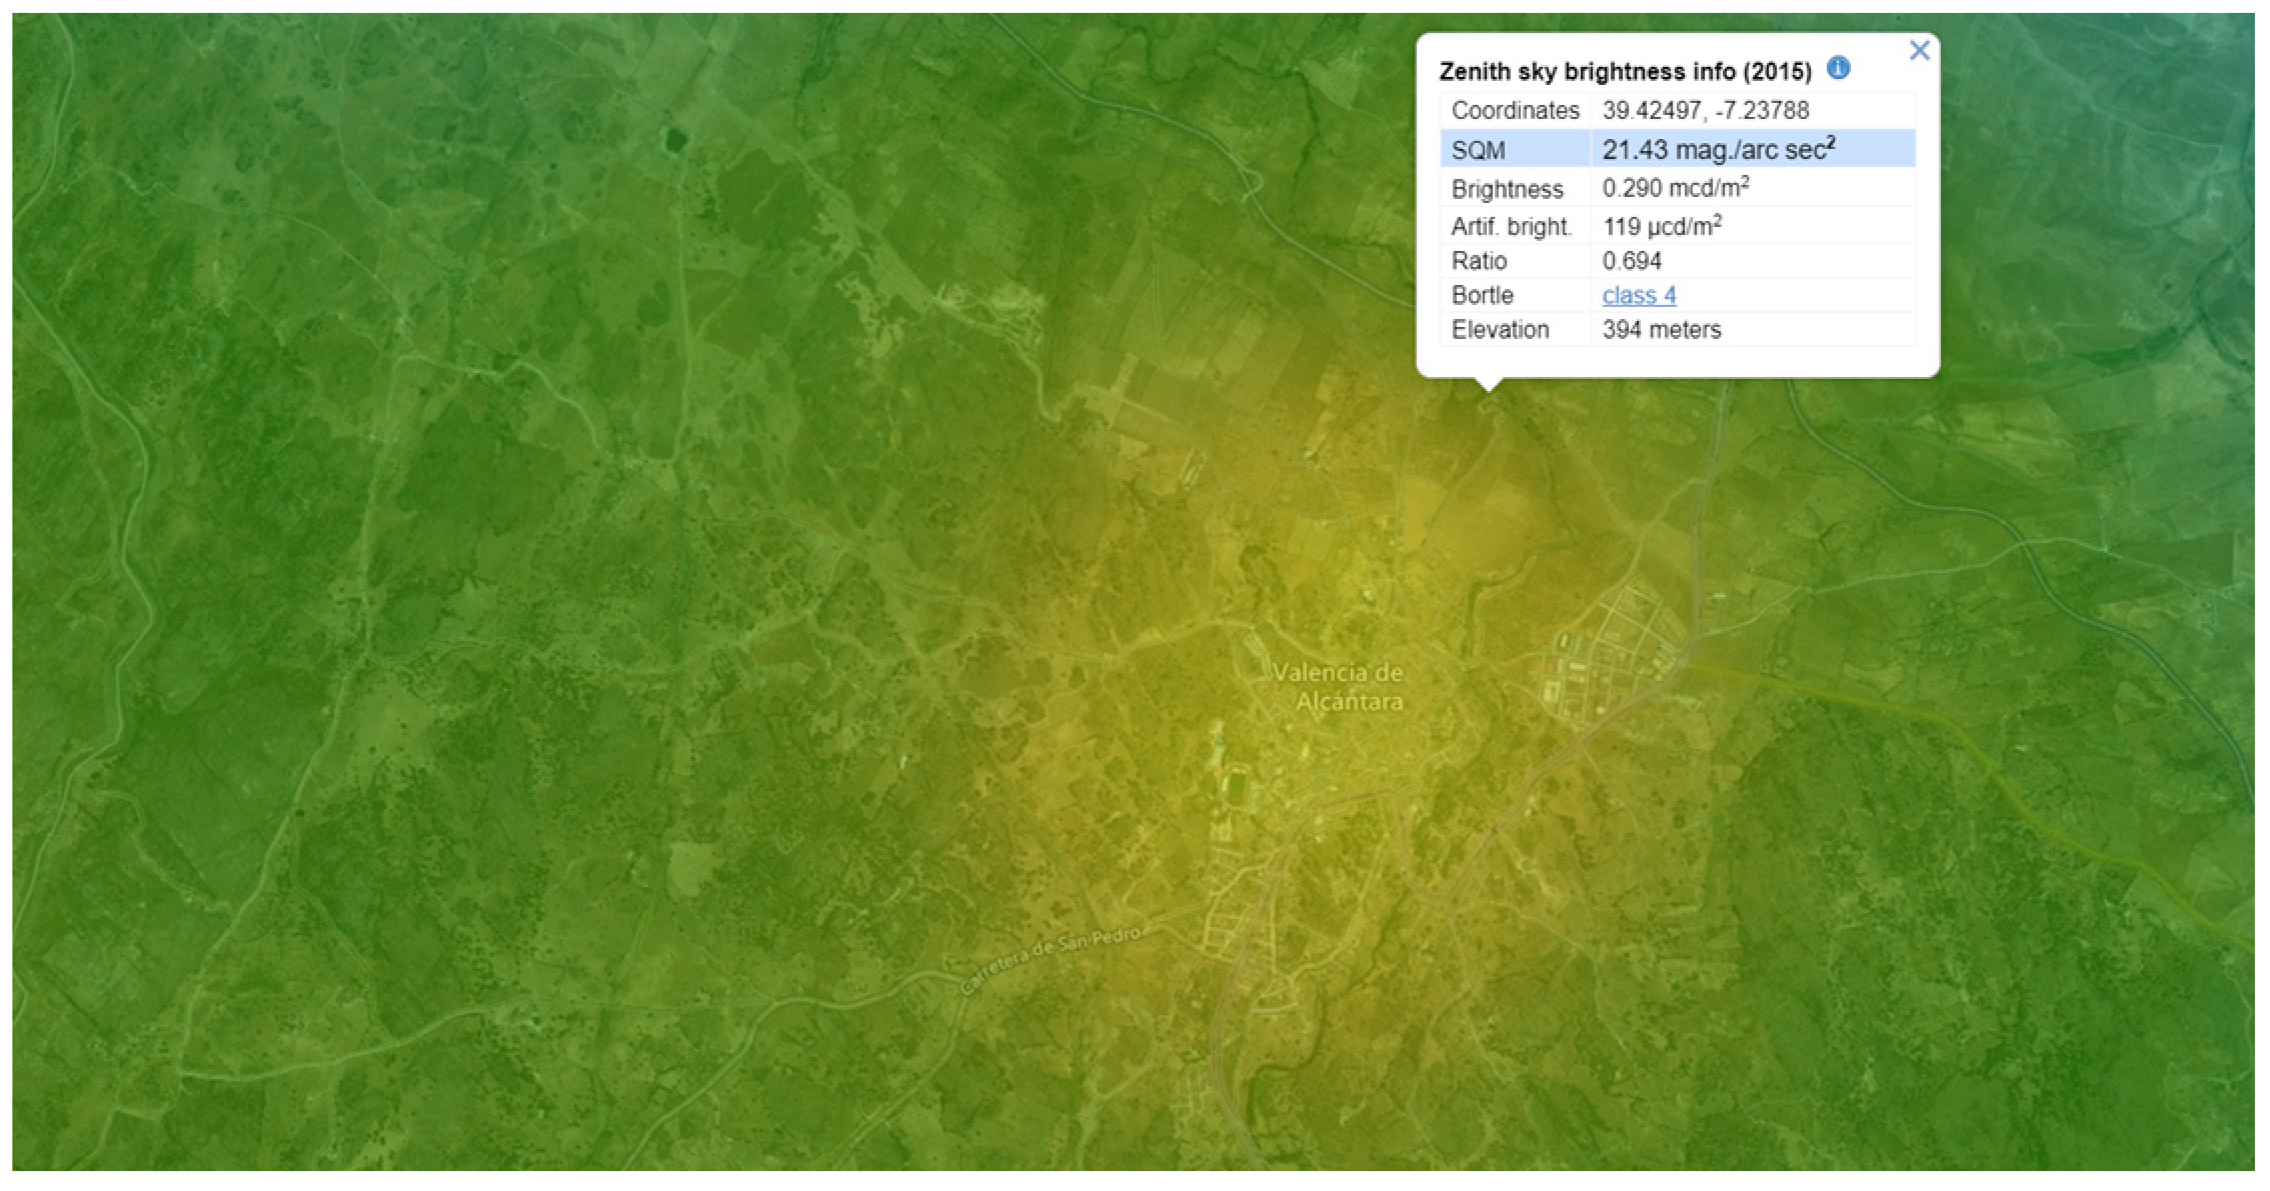
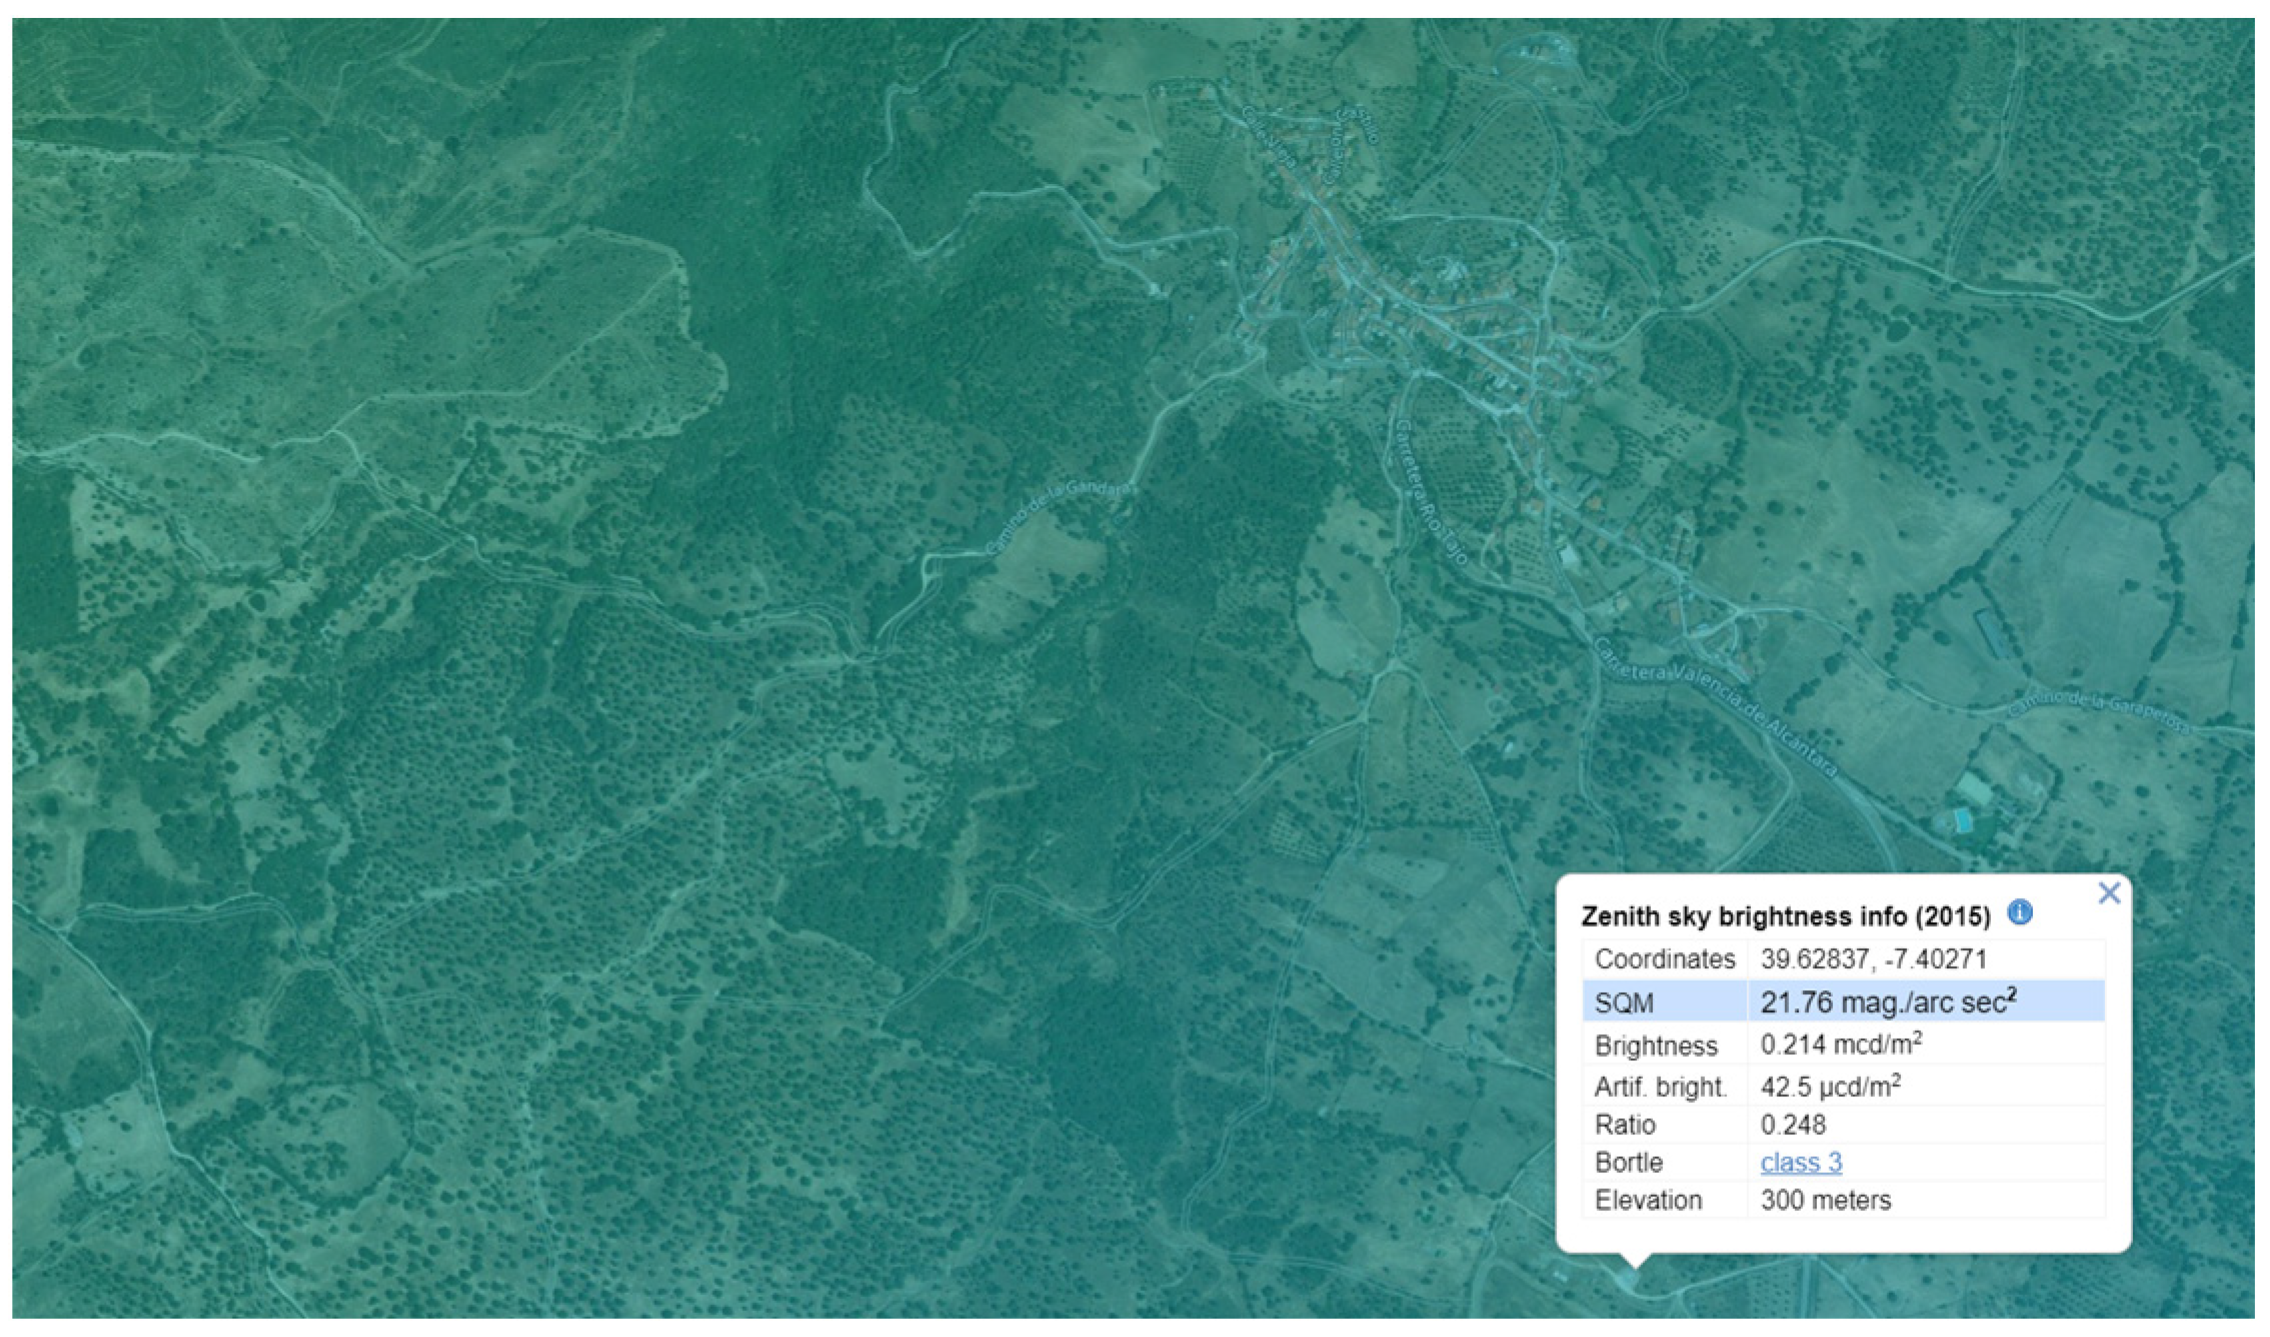
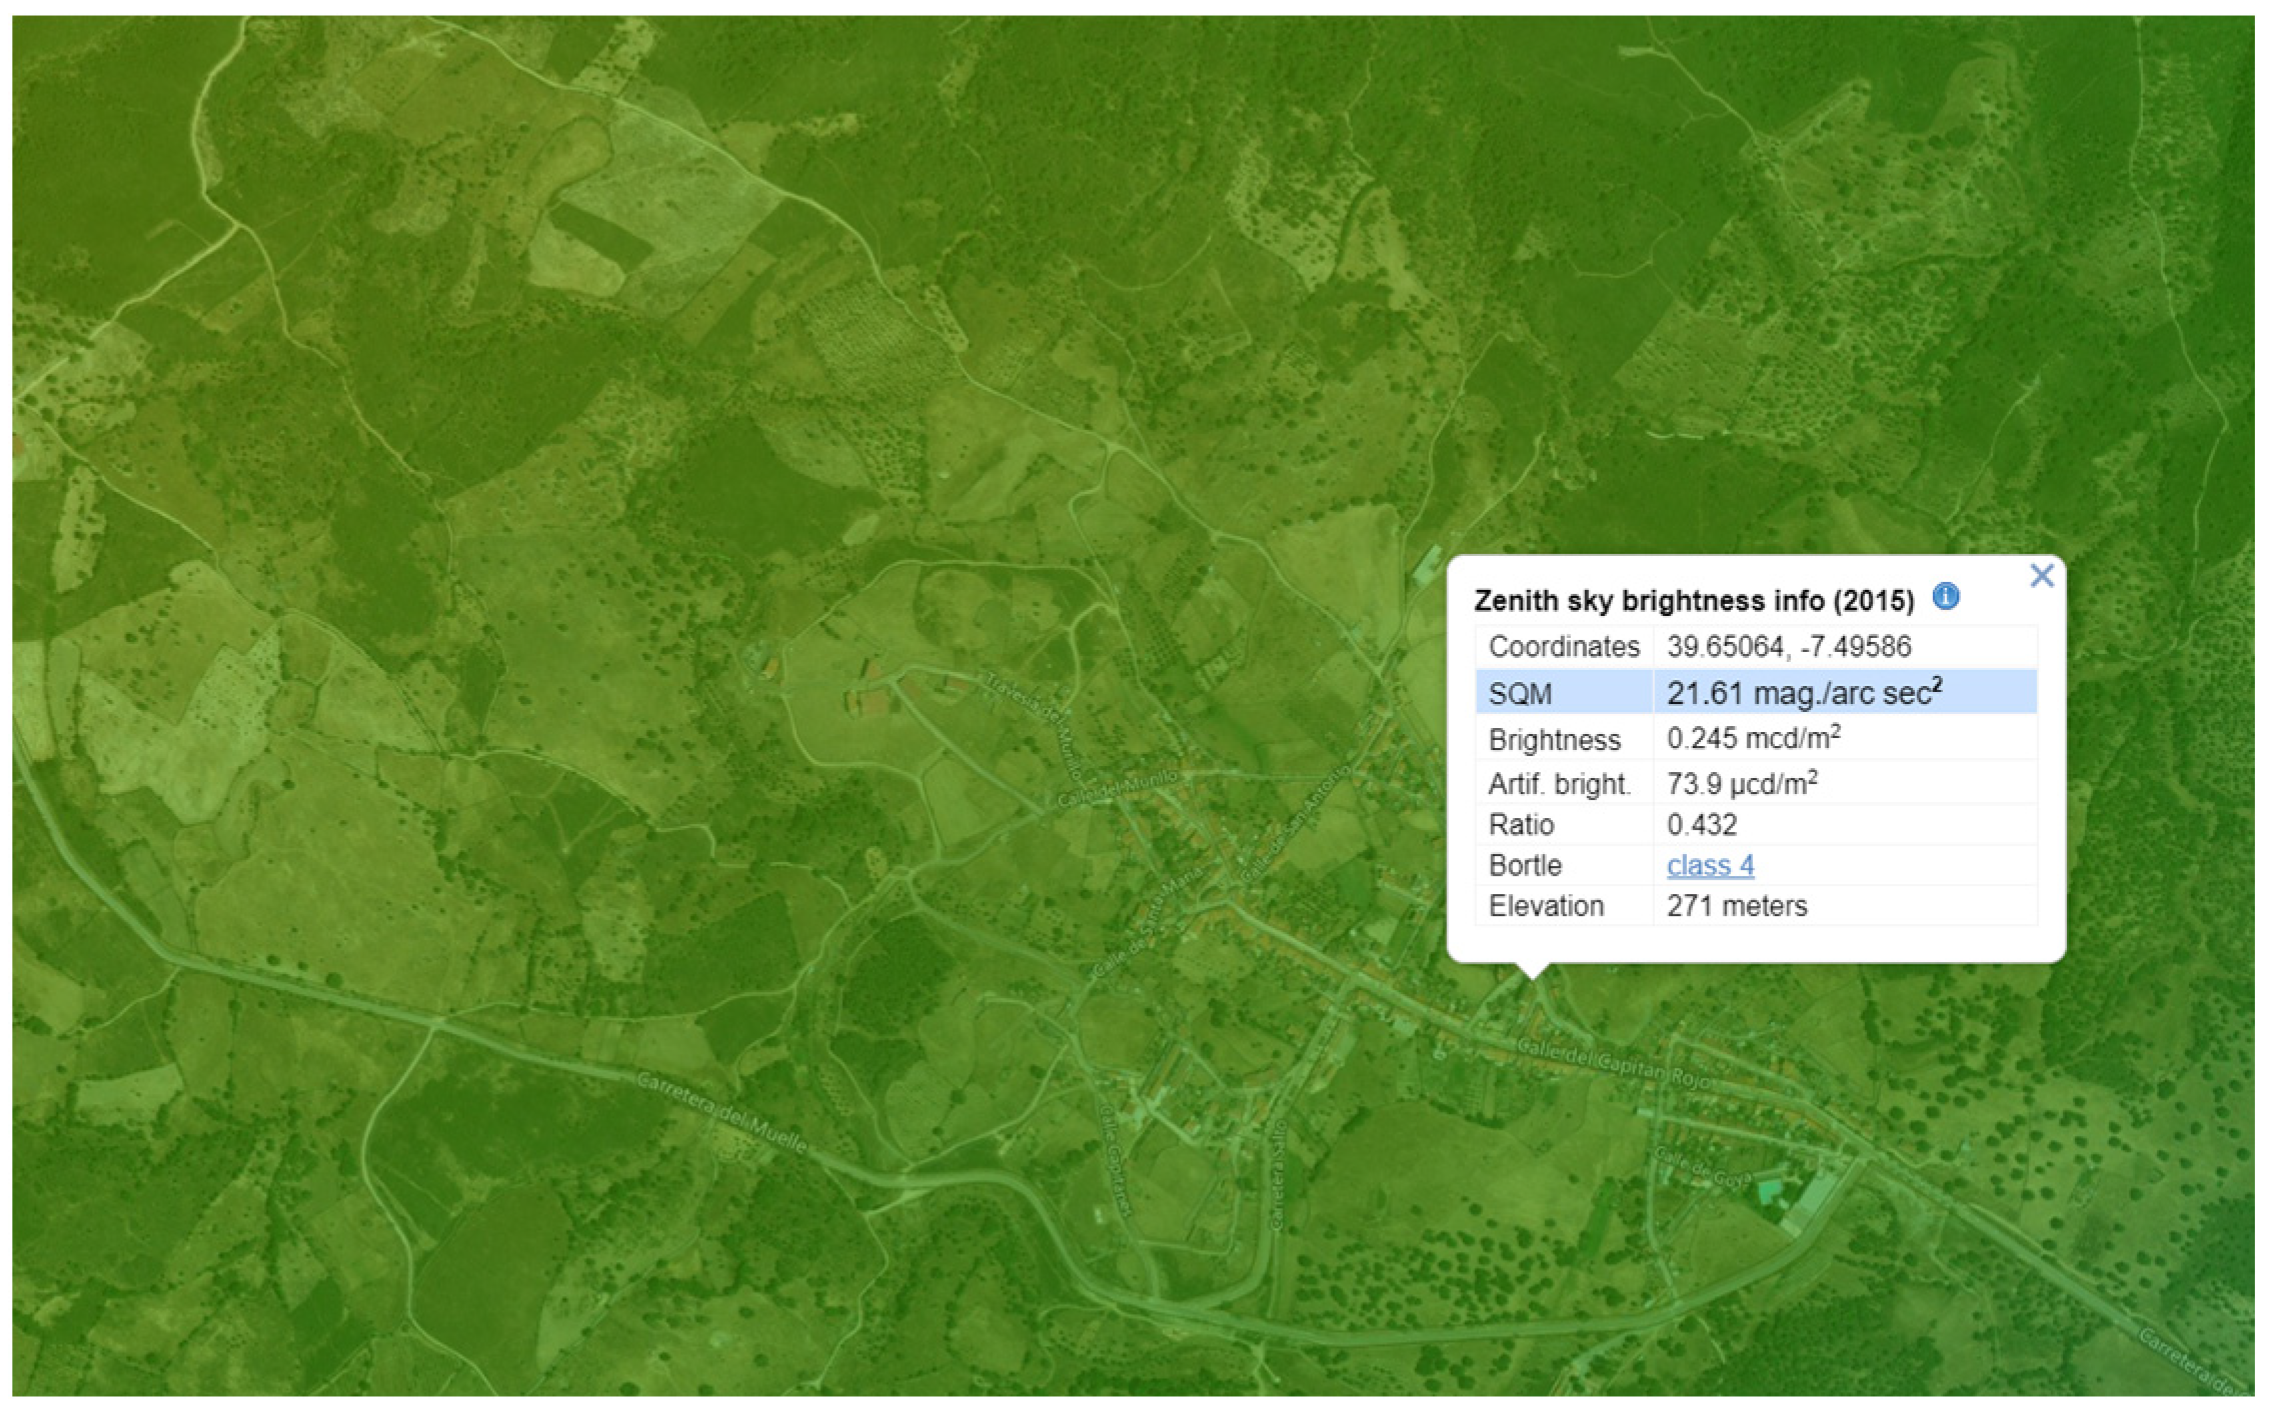
To avoid the influence of the municipality’s lighting, the photometers were placed on the outskirts. In the towns of Cedillo and Valencia de Alcántara, the measuring devices had to be located within the municipality due to the poor coverage present in the area. The coordinates and NSB level in the zone are detailed in
Appendix B.
3. Results
At the beginning of the project, a weather station along with a photometer was moved to each of the different rural municipalities indicated in
Section 2.1 for one week. This equipment allowed the simultaneous recording of NSB and meteorological conditions. Based on these data, a municipality was selected as representative of the meteorological conditions in each of the zones. Specifically, the municipalities selected as representatives of their area were Herreruela (Zone A), Santiago de Alcántara (Zone B) and Zarza la Mayor (Zone C). In each of these zones, a photometer was placed together with a meteorological station for approximately 6 months (from 14 February 2022 to 26 August 2022).
Similarly, a photometer and a weather station were installed at the School of Industrial Engineering (University of Extremadura) in Badajoz, which collected data from 22 February 2022 to 25 August 2022. This equipment allowed data to be collected in an urban area, for later comparison with data collected in rural areas.
The NSB and meteorological data recorded in rural and urban areas were used for the statistical analysis and can be found in the following handle [
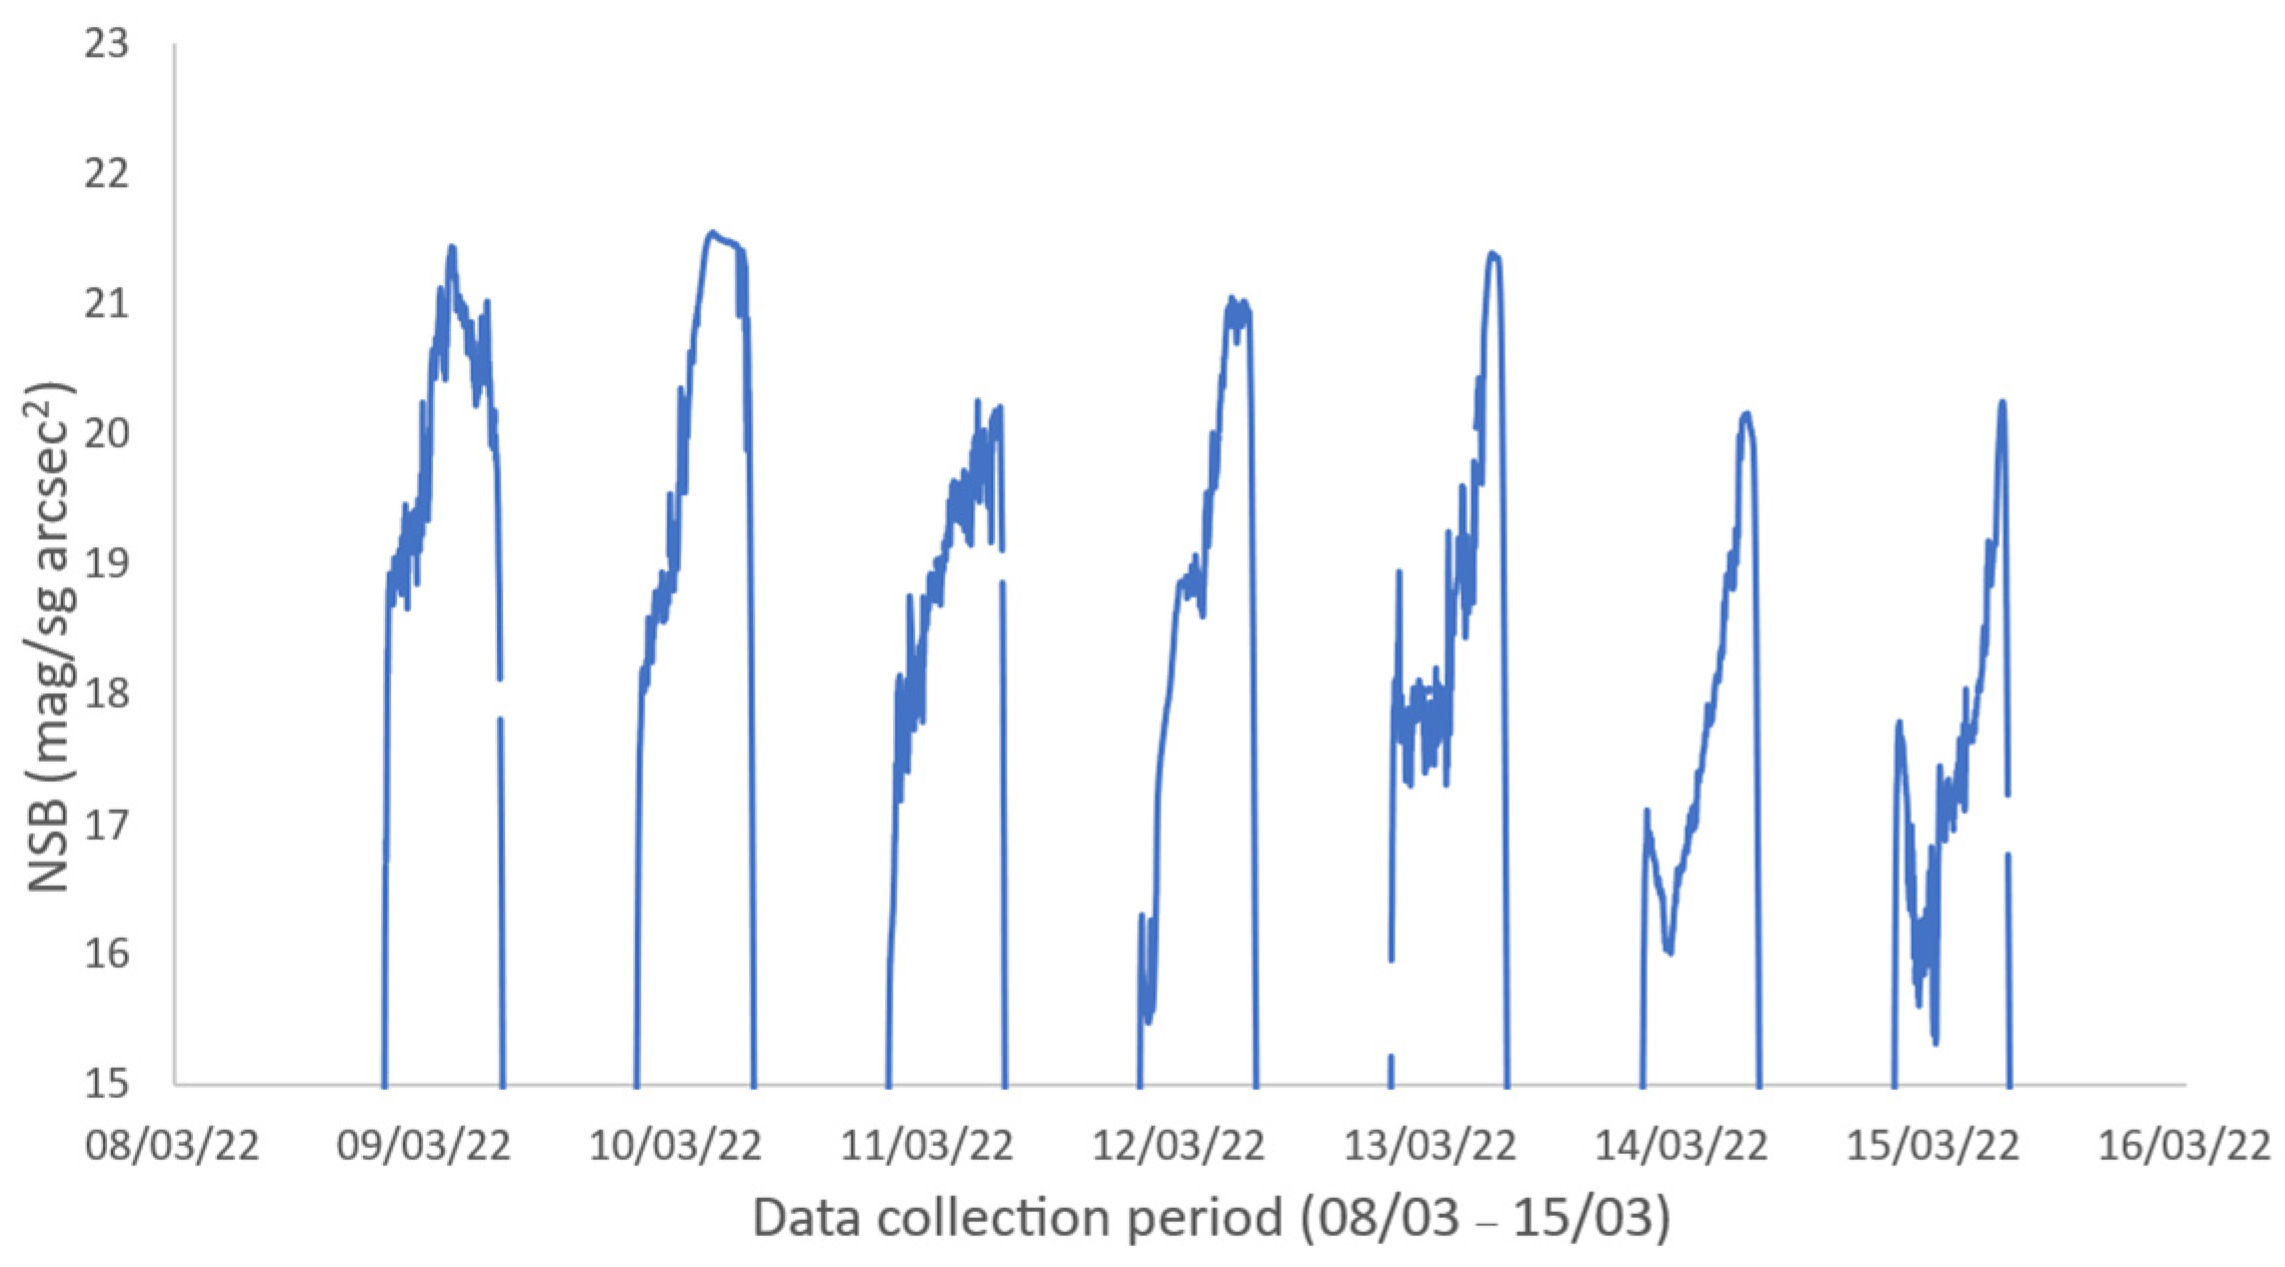
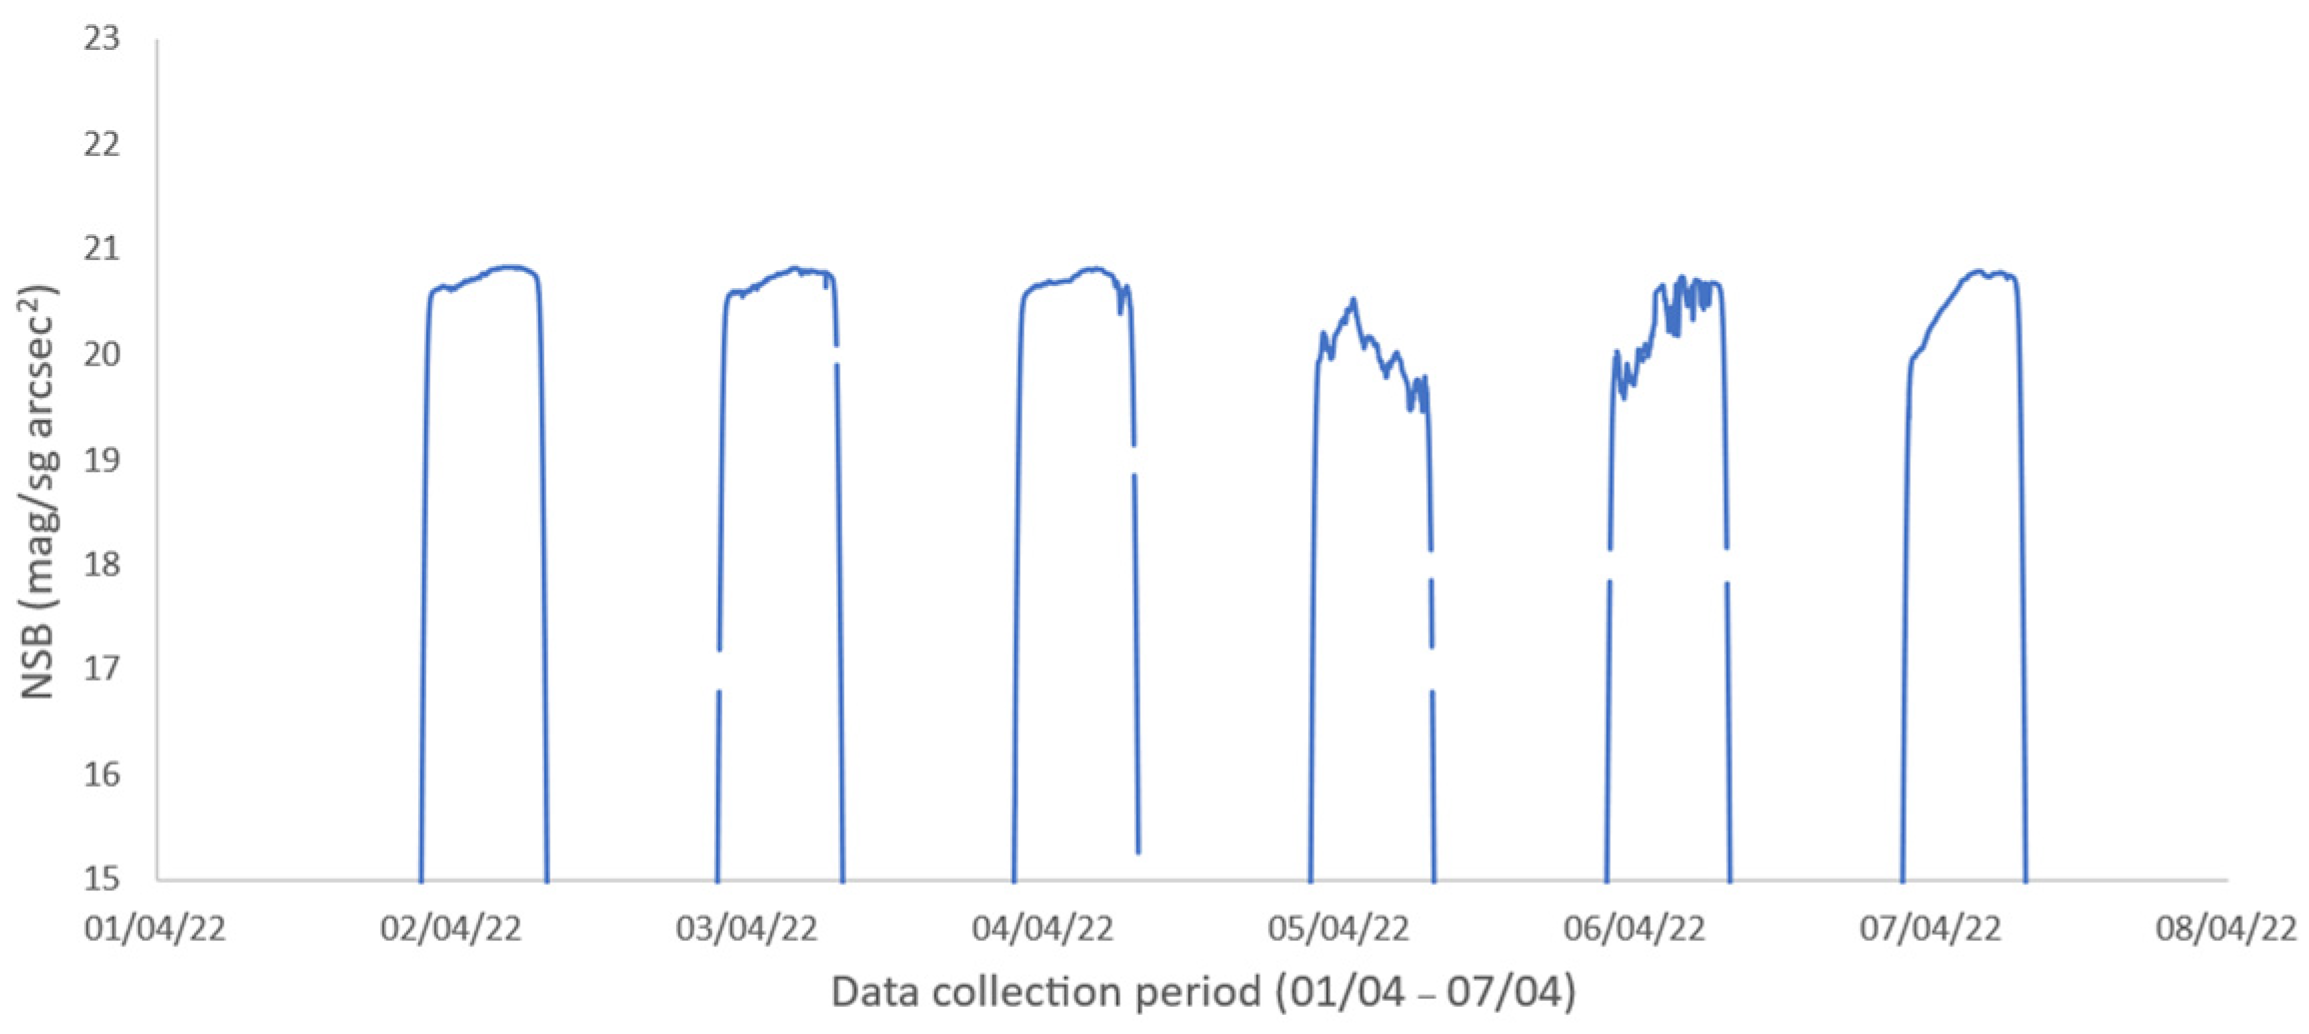
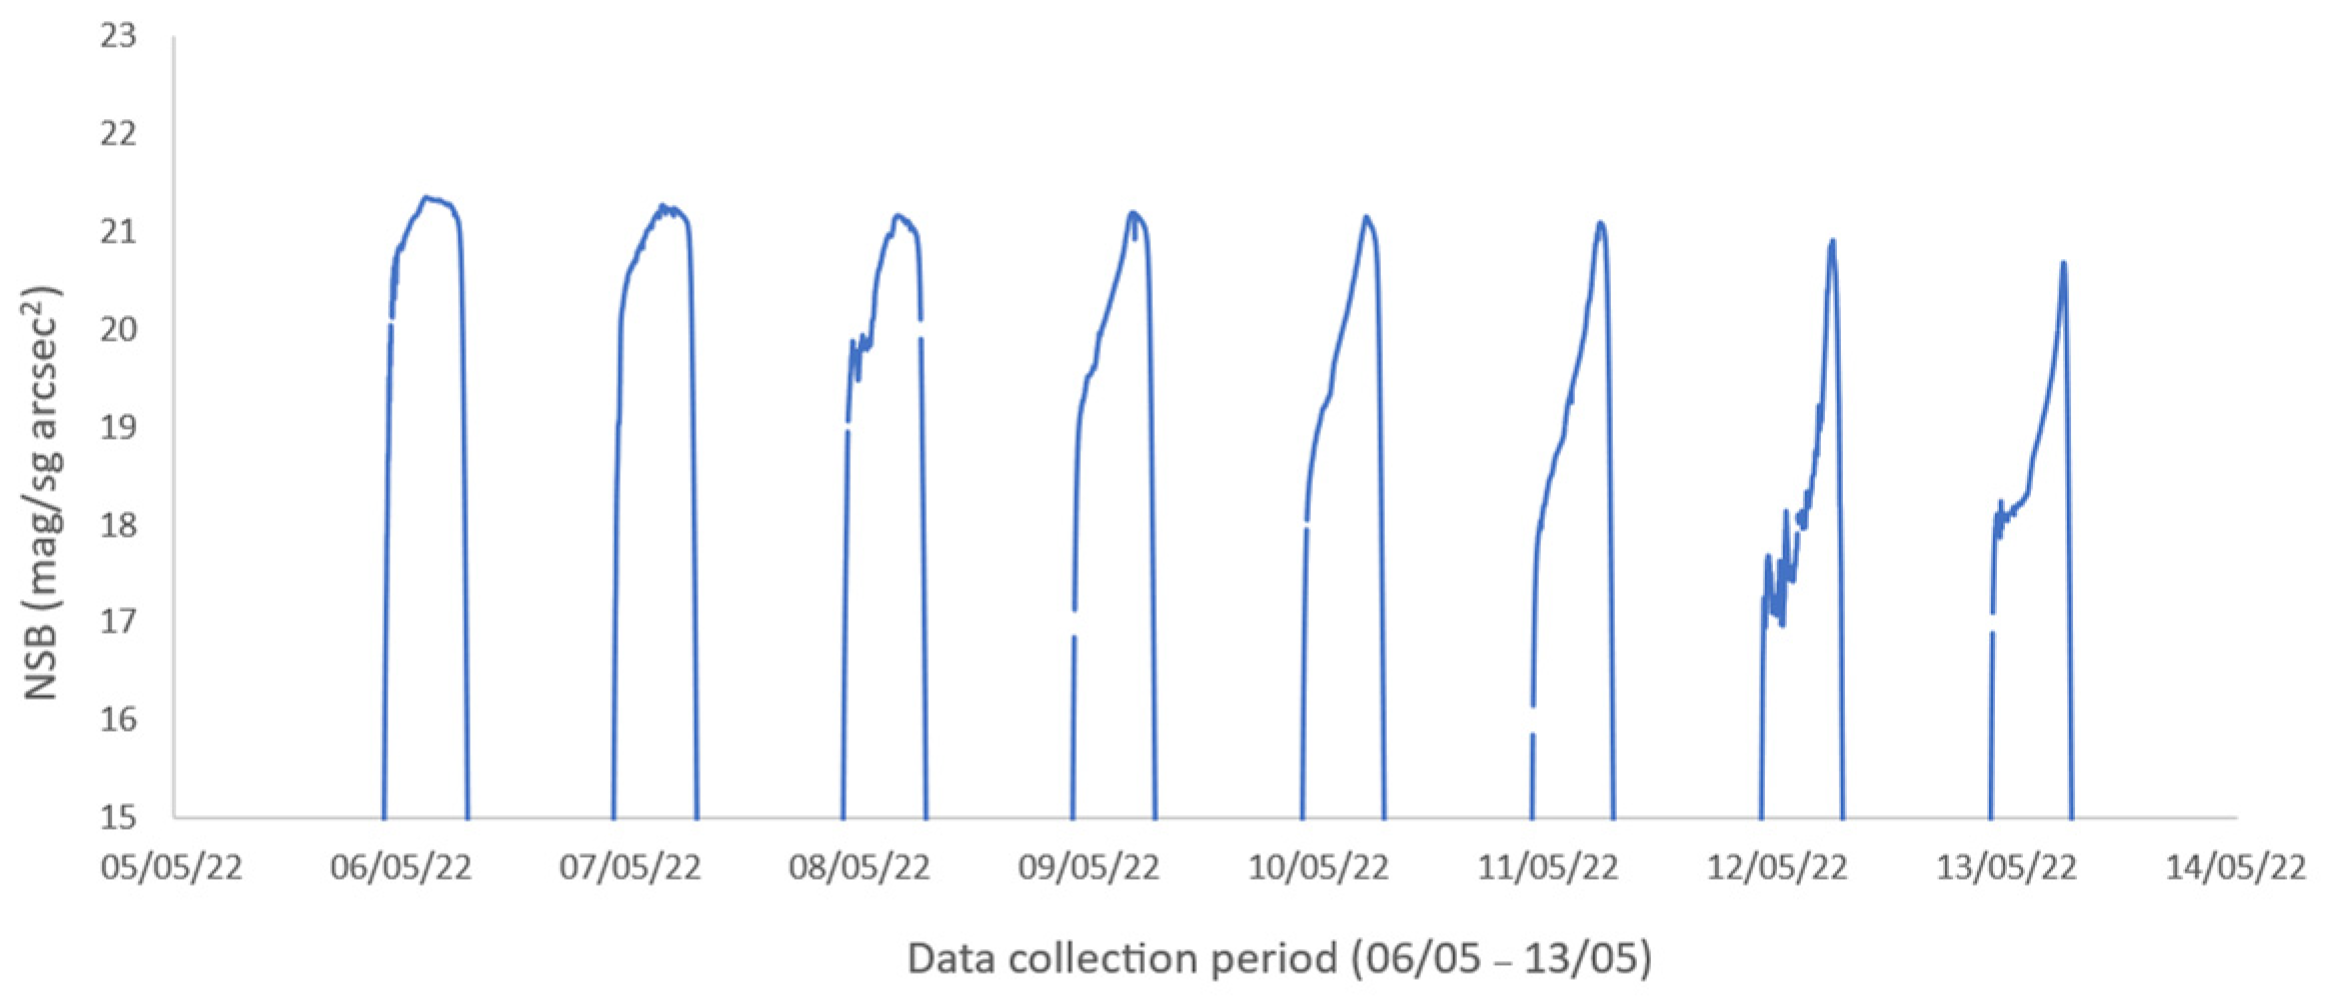
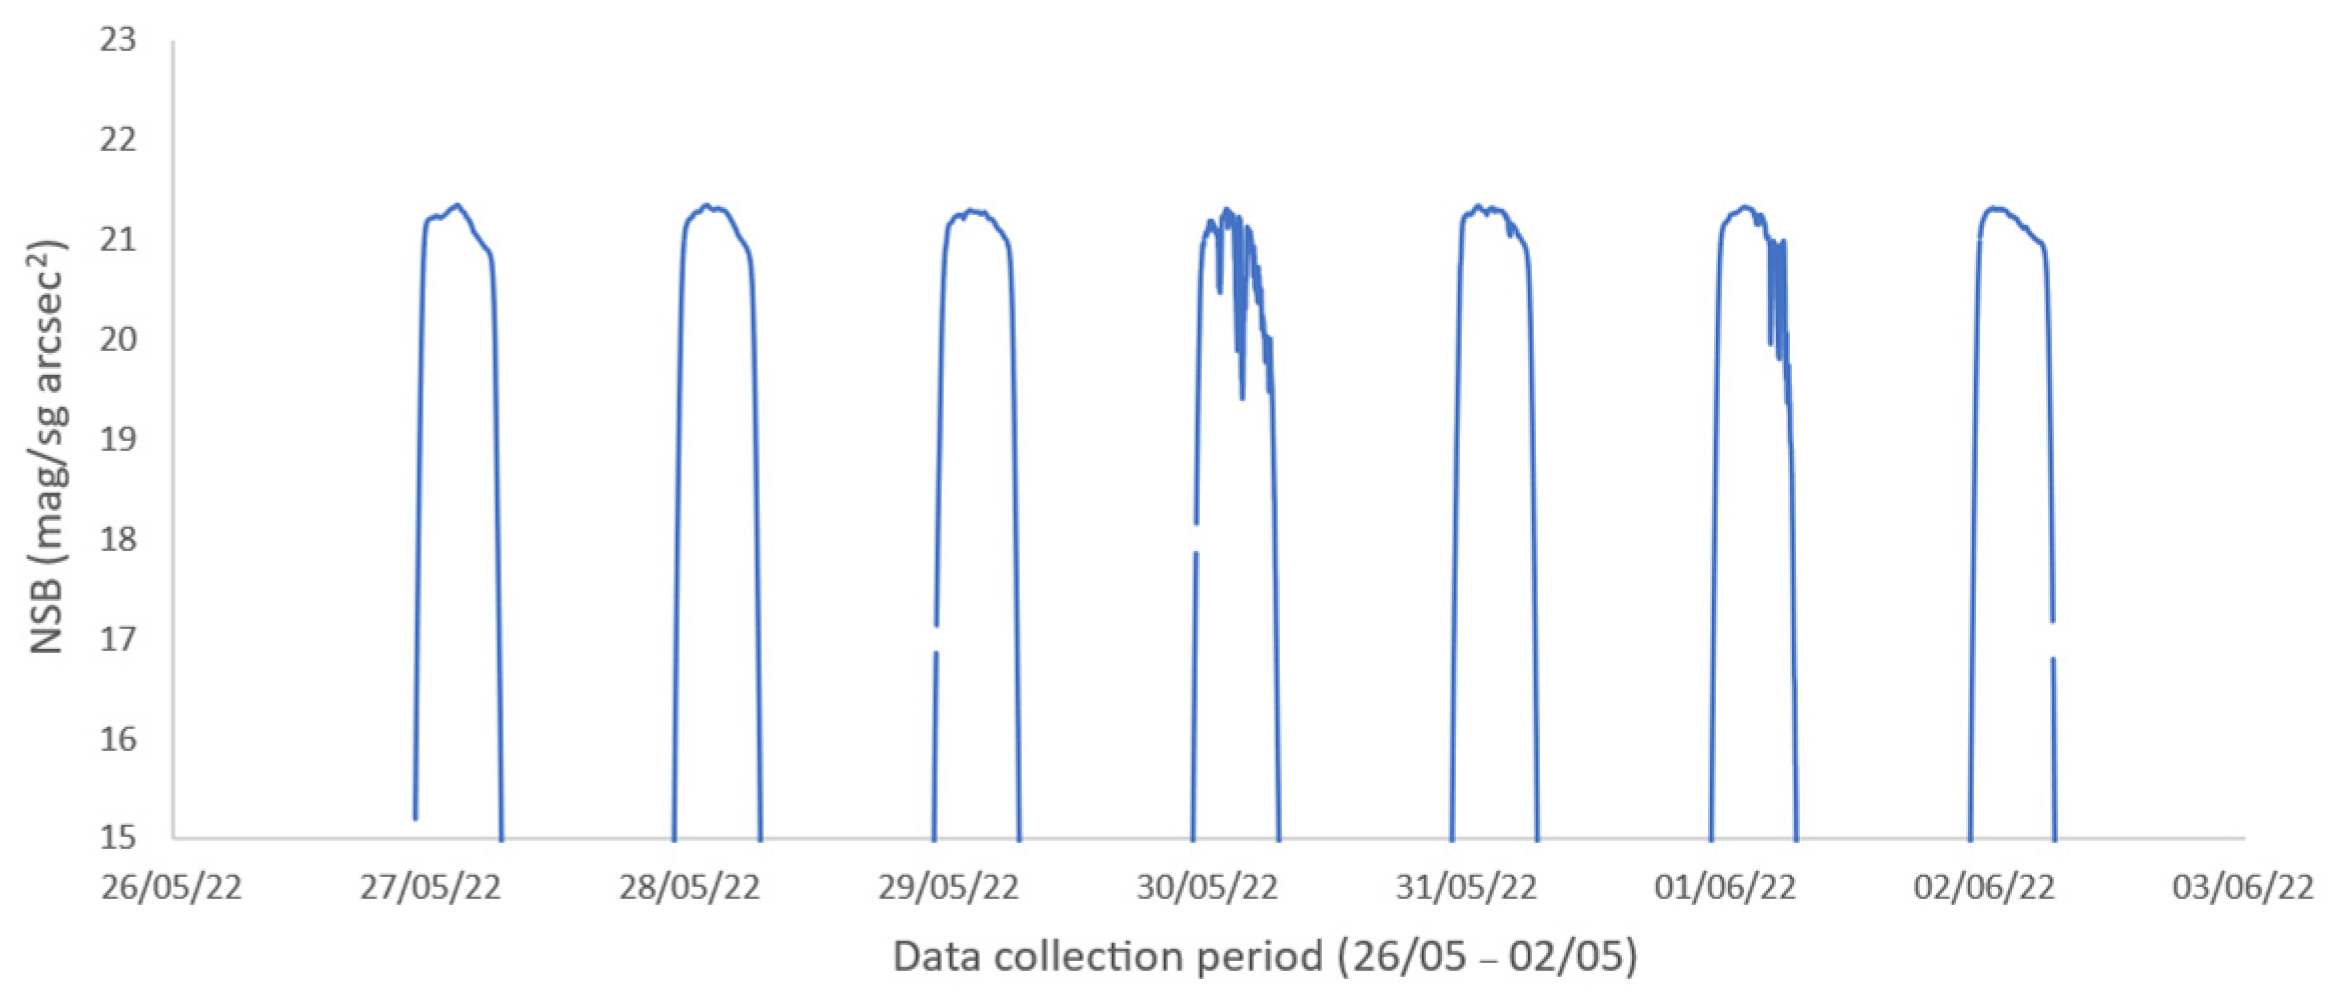
31]. As an example, the values of the NSB recorded during the first week in the different municipalities have been plotted in
Figure 2,
Figure 3,
Figure 4,
Figure 5,
Figure 6,
Figure 7,
Figure 8,
Figure 9,
Figure 10,
Figure 11 and
Figure 12. The y-axis shows the evolution of the night-time brightness detected using the photometer (NSB) in mag/sg arcsec
2. The abscissa axis (x-axis) shows the date at which the measurement was taken. Each date corresponds to the set of hours between 10 p.m. and 7 a.m.
As can be seen in
Figure 2,
Figure 3,
Figure 4,
Figure 5,
Figure 6,
Figure 7,
Figure 8,
Figure 9,
Figure 10,
Figure 11 and
Figure 12, the NSB increases progressively from sunset to its maximum value before dawn twilight, at which point it begins to decrease. In some measurements, specifically those corresponding to the municipalities of Zarza, Brozas and Santiago de Alcántara, the NSB is significantly lower than the values reached on previous nights. This may mainly be due to two factors: the presence of the Moon and cloudiness. In both cases, the values recorded are irregular, with small fluctuations due to the variation in the relative position of these elements throughout the night. In those cases where the Moon is present, there is also an increase in the luminosity of the area, thus reducing the NSB values recorded.
A web application WeatherUEX [
32] has been developed that allows real-time consultation of the level of darkness (NSB) and meteorological data recorded by the measurement equipment in each area, which allows data to be collected in the study area and could help in the observation of the starry sky.
4. Discussion
Once the data collection phase was completed, the data [
31] were analysed. First of all, the data were downloaded from the server where they were stored and transformed from the original json data format (a format widely used for data exchange) to a format that allowed for them to be manipulated and analysed in a simpler and more accessible way (opting in this case for an xlsx format present in Microsoft Excel spreadsheets).
It was noted that the sampling period for data collection for each instrument was different. The weather station recorded data every 15 min, while the photometer recorded data every 5 min. In this case, the brightness data were more variable, especially at sunrise/sunset times. For this reason, each meteorological record was repeated three times, thus obtaining meteorological data every 5 min. In this way, the same amount of both meteorological and luminosity data was available, which was then merged into a single file.
The data collected were then filtered, eliminating those values corresponding to the hours of sunlight (between 7:00 h and 22:00 h), as they are not relevant for the study of the night darkness level. The data where there had been an error in the recording of any of the devices were also eliminated. Once these filters had been applied, the approximate number of measurements to be analysed was 28,000 for the whole of the different municipalities and 13,550 for the city of Badajoz, which allows for a solid database analysis to be carried out.
Using the MATLAB tool, the Pearson correlation matrix was calculated for the data recorded in the three zones A, B and C (all data taken in rural areas) and in the city of Badajoz (urban area). The correlation between the different variables analysed in the experiment was determined with Pearson’s correlation matrix. Values of this matrix close to 1 imply a direct correlation between variables, and close to −1 an inverse correlation between variables. The results obtained are shown below, with those values associated with the NSB variable being particularly important. These values will allow us to determine those meteorological variables that have a decisive effect on the observation of the sky.
4.1. Comparison and Discussion of Results
The correlation values of the different variables with the NSB are marked in bold font. These are close to 0 in both rural (
Table 1) and urban areas (
Table 2), therefore, there is no significant correlation between the different meteorological variables measured with the level of night-time darkness. Only two variables are moderately correlated with the NSB: the sky temperature (−0.41 in urban areas) and the presence of the Moon (−0.3 in rural areas and −0.35 in urban areas).
With the available data, it is not possible to assume that the low correlation between the NSB and the sky temperature is due to causality between the two variables. It can be seen that, as the night progresses, less sunlight reaches the geographical point of data collection due to the Earth’s rotational movement. This fact causes that, simultaneously, the level of darkness increases while the sky temperature drops, as the amount of light and heat provided by the Sun decreases. This could cause a correlation between the NSB and the sky temperature since both variables depend on the amount of solar radiation reaching the area.
As for the presence of the Moon, in those phases in which the Moon is full (full Moon), the existing brightness level is higher, which causes a decrease in the NSB. This fact is reflected in the results obtained, as there is an inverse relationship between the NSB and Moon phase variables, namely −0.3 in rural areas and −0.35 in urban areas. This result is similar to that provided by other authors, specifically Ref. [
2] establishes a correlation of −0.271 between both variables and Ref. [
33] one of −0.225, in the same meteorological conditions as this study (clear sky). As for the average NSB values recorded under full Moon conditions, Ref. [
34] establishes a value between 18 and 18.5 mag/arcsec
2 for urban environments (Berlin). Other authors [
10] set the NSB level of the urban night sky at between 16.8 and 19.2 mag/arcsec
2. These values are correctly matched with the average NSB value of 18.24 mag/arcsec
2 recorded in an urban environment (Badajoz) in this experiment.
In this sense, Ref. [
34] provides a slightly lower value of 17.3 mag/arcsec
2 in the same conditions, but for a rural environment (Dachstein plateau, Alps). The authors of [
10,
35] establish values in rural areas between 19 and 21.6 mag/arcsec
2. The average recorded in rural environments and full Moon and clear sky conditions of this experiment was 19.52 mag/arcsec
2, coinciding with the range established by [
35]. The discrepancy with [
34] may be due to differences in measurement conditions.
4.2. Contrast of Results
To compare these results, the AEMET was asked for the historical meteorological data recorded both in the different rural areas and Badajoz city. This agency had data recorded in Badajoz city. The agency did not have data on the rural municipalities. For this reason, only the data obtained in Badajoz city could be compared.
A new comparison was made between the data recorded by our photometer and the meteorological conditions recorded by the AEMET in the city of Badajoz, which allowed for a much broader analysis to be carried out, as data was available for a longer period, specifically from 10 May 2021 to the present day. The data provided by AEMET also included measurements of cloudiness in the area. To increase the reliability of the study, it was decided to eliminate those data that had been taken under cloudy conditions, that is, with cloudiness values above four-eighths of an overcast sky [
36], since the presence of clouds prevents the visualisation of the starry sky [
4,
21,
24,
37,
38,
39,
40], also increasing the glow level due to the greater scattering of light. Additionally, the different Moon phases were also included in the study, to evaluate how the presence of the Moon affected the NSB. Once these new filters were applied, together with those initially proposed, the total number of measurements to be analysed was approximately 51,000. The results of this analysis are shown in
Table 3.
The results obtained in
Table 3 are similar to those obtained in
Table 2, where the analysis was performed with the meteorological data. In both analyses (
Table 2 and
Table 3) the only variables correlated with the NSB are sky temperature (−0.41 in
Table 2 and −0.3 in
Table 3) and illumination due to the Moon (−0.35 in
Table 2 and −0.48 in
Table 3). Given these results, it is possible to corroborate the conclusion obtained in
Section 4.1.
Finally, the agreement between the data recorded using our equipment and the data provided by AEMET was evaluated to verify the validity of the data recorded using our measuring equipment (
Table 4).
The data recorded by our meteorological teams show a high correlation with the data provided by AEMET, thus verifying the validity of the analysis carried out in
Section 4.1. The small differences between the results obtained in
Table 2 and
Table 3 may be due precisely to the fact that the correlation between the two data records is not perfect.
5. Conclusions
The influence of the different meteorological variables on the darkness level in the observation zone of rural areas (low ALAN) and urban areas (high ALAN) was evaluated. Only the Moon illumination variable was correlated with the NSB in both cases (−0.3 in rural areas and −0.35 in urban areas). The sky temperature showed a correlation with the NSB only in the urban area (−0.41). The indicated correlations are significant at the 0.01 level.
The results obtained in the urban area were confirmed by a second analysis using meteorological data provided by an independent entity (AEMET). The correlation of the sky temperature variable with the NSB was −0.3, compared to the −0.41 obtained initially. The variable illumination due to the Moon presence showed a correlation with the NSB of −0.48, compared to the −0.35 obtained initially. The rest of the variables showed a very low correlation with the NSB. The small differences between these values may be because the correlation between our meteorological data and those provided by AEMET is not perfect.
From these data, it can be concluded that the variables sky temperature and illumination due to the Moon will be relevant and influential in the observation. To optimise the conditions under which the observation will be carried out, the forecasts of these two variables should be consulted, looking for the lowest sky temperature and the moon phase closest to the new Moon (as the correlation in both cases is inverse).
A web application WeatherUEX [
32] has been developed that allows real-time consultation of NSB and meteorological data for each area, which can help the sky observation in the studied area. The results obtained are intended for use by astronomers, astro-tourists and skywatchers, which may consult meteorological agencies for forecasts of the indicated variables, allowing them to know in advance whether the observation will be carried out under optimal conditions.
Limitations of the Study
It was impossible to compare the results obtained in the rural areas (
Table 1) as the AEMET did not have the data record for these areas. The closest AEMET weather station to the study area was far away, so it was not possible to use these data. If these data had been available, a comparison of results could have been carried out, as was performed with the results obtained in the urban area. The equipment installed [
26] did not allow the recording of the cloudiness variable, so we found an important limitation in this aspect. In future studies, it would be interesting to have specific equipment for recording this variable.
Author Contributions
Conceptualization, D.C.-F., M.Á.J.-M., M.C.-G. and J.F.G.; Methodology, A.M.-M. and A.B.-R.; Software, A.M.-M. and A.B.-R.; Validation, A.M.-M.; Formal Analysis, A.M.-M.; Investigation, A.M.-M.; Resources, D.C.-F., M.C.-G. and M.Á.J.-M. and J.F.G.; Data Curation, A.M.-M., A.B.-R. and M.Á.J.-M.; Writing—Original Draft Preparation, A.M.-M.; Writing—Review and Editing, A.M.-M.; Visualization, J.F.G.; Supervision, J.F.G.; Project Administration, D.C.-F., M.Á.J.-M., M.C.-G. and J.F.G.; Funding Acquisition, D.C.-F., M.Á.J.-M., M.C.-G. and J.F.G. All authors have read and agreed to the published version of the manuscript.
Funding
This study was funded by the project “Overall Strategy for Tourism Development in EUROACE”, 0476_GLOBALTUR_EUROACE_4_E. This project is part of the European Regional Development Fund (ERDF).
Institutional Review Board Statement
Not applicable.
Informed Consent Statement
Not applicable.
Data Availability Statement
The data supporting the reported results can be found at the following handle [
31].
Acknowledgments
We are grateful to the Spanish Meteorological Agency (AEMET) for providing historical meteorological data for the city of Badajoz, and to the representatives of the different municipalities involved in the experimental phase for their help and attention.
Conflicts of Interest
The authors declare no conflict of interest.
Appendix A
Appendix A contains the information about the instruments used during the experiment.
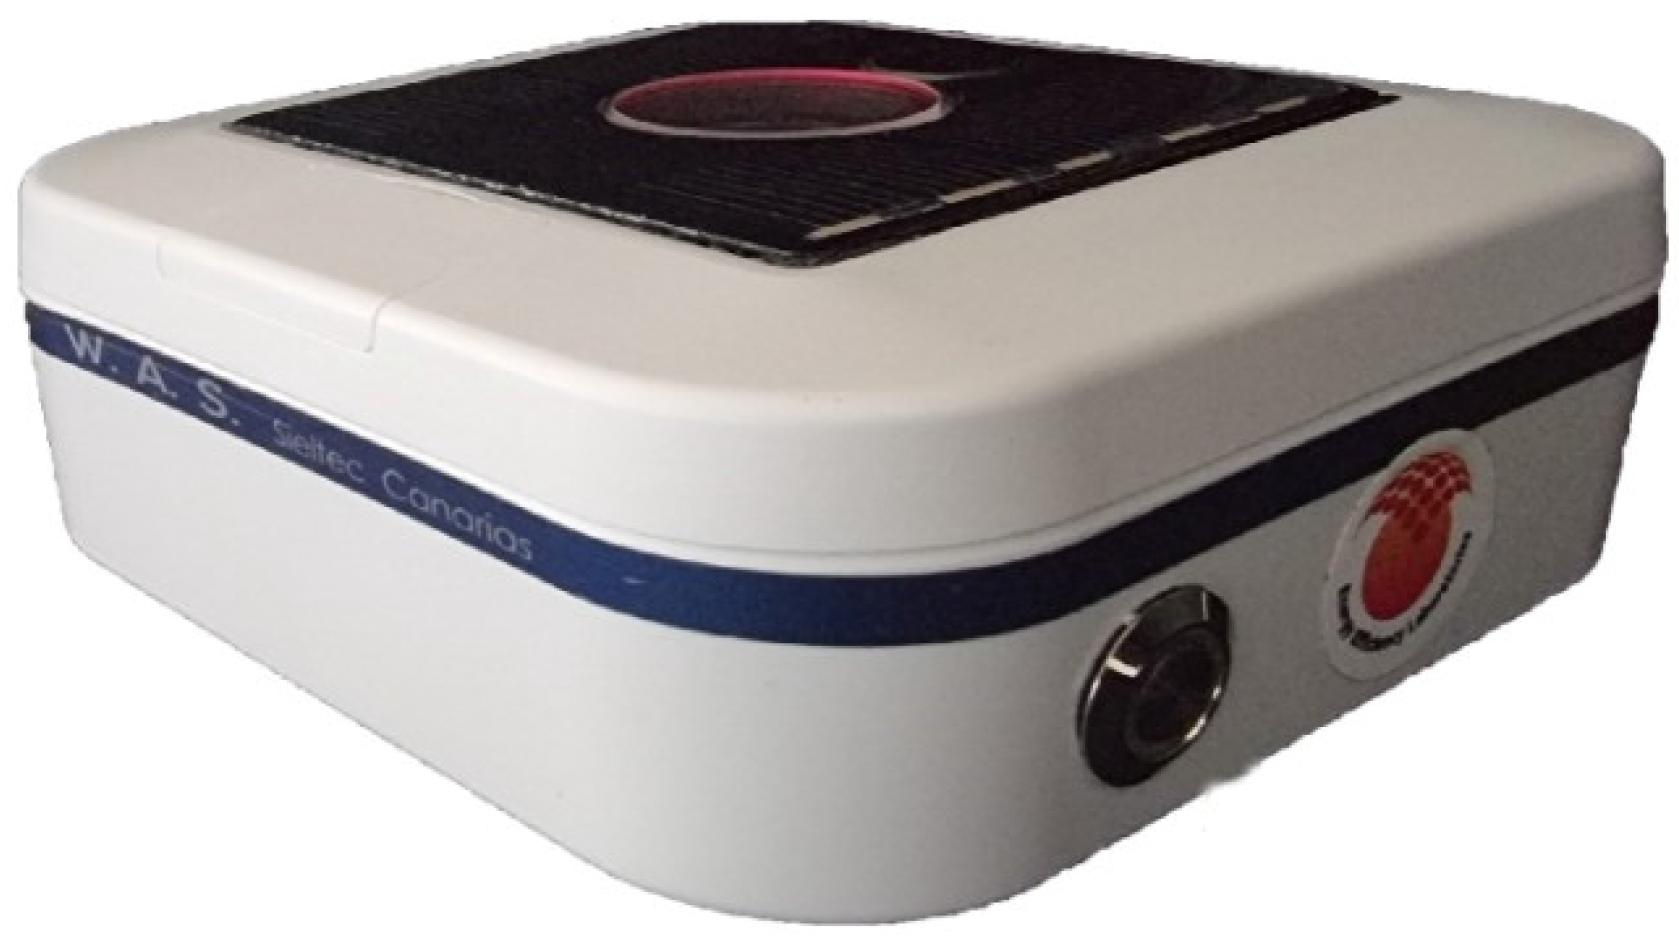
The Sieltec Canarias SKYGLOW V3.1 photometer, (
Figure A1), was used to measure the NSB in the different localities. Using WIFI or a mobile connection, the measurements are automatically stored on a server. The device is charged via the photovoltaic panel at the top. Below is a link to the manufacturer’s website [
25] and to an article detailing its technical characteristics [
41].
Figure A1.
Sieltec Canarias SKYGLOW photometer.
Figure A1.
Sieltec Canarias SKYGLOW photometer.
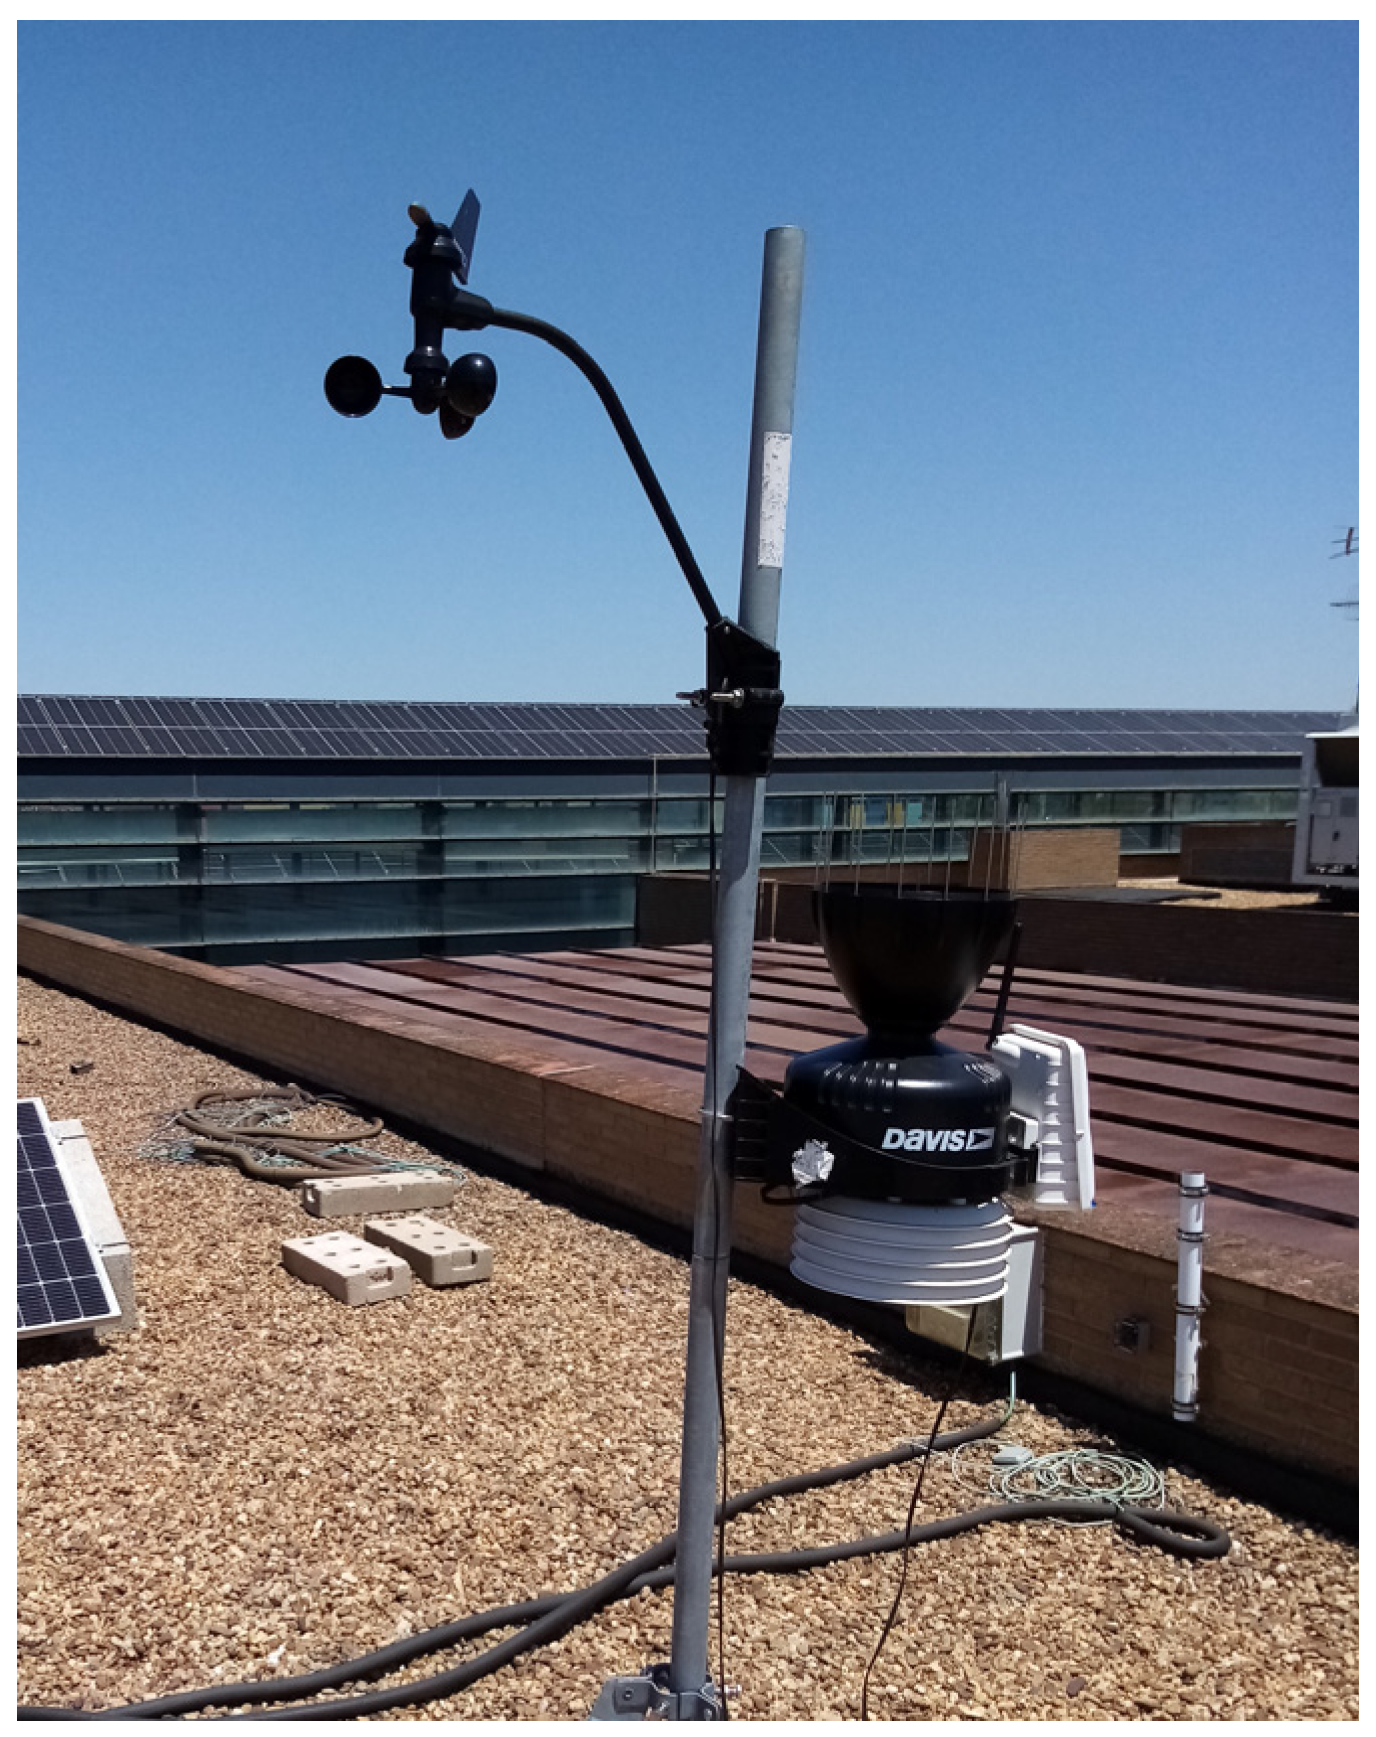
The weather station used for the measurement of weather conditions was the Davis Vantage Vue + Weatherlink live (
Figure A2). The information and technical specifications are detailed in the following link [
26].
Figure A2.
Davis Vantage Vue + Weatherlink live.
Figure A2.
Davis Vantage Vue + Weatherlink live.
Appendix B
Figure A3.
Coordinates and NSB in Zarza la Mayor.
Figure A3.
Coordinates and NSB in Zarza la Mayor.
Figure A4.
Coordinates and NSB in Alcántara.
Figure A4.
Coordinates and NSB in Alcántara.
Figure A5.
Coordinates and NSB in Brozas.
Figure A5.
Coordinates and NSB in Brozas.
Figure A6.
Coordinates and NSB in Herreruela.
Figure A6.
Coordinates and NSB in Herreruela.
Figure A7.
Coordinates and NSB in Membrío.
Figure A7.
Coordinates and NSB in Membrío.
Figure A8.
Coordinates and NSB in Salorino.
Figure A8.
Coordinates and NSB in Salorino.
Figure A9.
Coordinates and NSB in Valencia de Alcántara.
Figure A9.
Coordinates and NSB in Valencia de Alcántara.
Figure A10.
Coordinates and NSB in Carbajo.
Figure A10.
Coordinates and NSB in Carbajo.
Figure A11.
Coordinates and NSB in Santiago de Alcántara.
Figure A11.
Coordinates and NSB in Santiago de Alcántara.
Figure A12.
Coordinates and NSB in Herrera de Alcántara.
Figure A12.
Coordinates and NSB in Herrera de Alcántara.
Figure A13.
Coordinates and NSB in Cedillo.
Figure A13.
Coordinates and NSB in Cedillo.
References
- European Southern Observatory: Observing Conditions. Available online: https://www.eso.org/sci/observing/phase2/ObsConditions.html (accessed on 1 June 2023).
- Liu, M.; Liu, X.; Zhang, B.; Li, Y.; Luo, T.; Liu, Q. Analysis of the Evolution of Urban Nighttime Light Environment Based on Time Series. Sustain. Cities Soc. 2022, 78, 103660. [Google Scholar] [CrossRef]
- Cabello, A.J.; Kirschbaum, C.F. Modeling of Urban Light Pollution: Seasonal and Environmental Influence. J. Illum. Eng. Soc. 2001, 30, 142–151. [Google Scholar] [CrossRef]
- Aubé, M.; Kocifaj, M.; Zamorano, J.; Solano Lamphar, H.A.; Sanchez de Miguel, A. The Spectral Amplification Effect of Clouds to the Night Sky Radiance in Madrid. J. Quant. Spectrosc. Radiat. Transf. 2016, 181, 11–23. [Google Scholar] [CrossRef]
- Cinzano, P.; Falchi, F. Quantifying Light Pollution. J. Quant. Spectrosc. Radiat. Transf. 2014, 139, 13–20. [Google Scholar] [CrossRef]
- Martínez-Martín, A.; Bocho-Roas, A.; Carmona-Fernández, D.; Calderón-Godoy, M.; Jaramillo-Morán, M.Á.; González, J.F. Influence of Illumination Parameters on Night Sky Observation in Rural Areas. Sustainability 2023, 15, 9359. [Google Scholar] [CrossRef]
- Statal Meteorology Agency (AEMET). The Atmosphere and the Stars. The Relations between Meteorology and Astronomy. Available online: https://aemetblog.es/2017/10/27/la-atmosfera-y-las-estrellas-las-relaciones-entre-meteorologia-y-astronomia/ (accessed on 3 July 2023).
- Garstang, R.H. Night sky brightness at observatories and sites. Publ. Astron. Soc. Pac. 1989, 101, 306. [Google Scholar] [CrossRef]
- Pun, C.S.J.; So, C.W.; Leung, W.Y.; Wong, C.F. Contributions of Artificial Lighting Sources on Light Pollution in Hong Kong Measured through a Night Sky Brightness Monitoring Network. J. Quant. Spectrosc. Radiat. Transf. 2014, 139, 90–108. [Google Scholar] [CrossRef]
- Hänel, A.; Posch, T.; Ribas, S.J.; Aubé, M.; Duriscoe, D.; Jechow, A.; Kollath, Z.; Lolkema, D.E.; Moore, C.; Schmidt, N.; et al. Measuring Night Sky Brightness: Methods and Challenges. J. Quant. Spectrosc. Radiat. Transf. 2018, 205, 278–290. [Google Scholar] [CrossRef]
- Zielińska-Dabkowska, K.M.; Xavia, K.; Bobkowska, K. Assessment of Citizens’ Actions against Light Pollution with Guidelines for Future Initiatives. Sustainability 2020, 12, 4997. [Google Scholar] [CrossRef]
- Pothukuchi, K. City Light or Star Bright: A Review of Urban Light Pollution, Impacts, and Planning Implications. J. Plan. Lit. 2021, 36, 155–169. [Google Scholar] [CrossRef]
- Brons, J.A.; Bullough, J.D.; Rea, M.S. Outdoor Site-Lighting Performance: A Comprehensive and Quantitative Framework for Assessing Light Pollution. Light. Res. Technol. 2008, 40, 201–224. [Google Scholar] [CrossRef]
- Kyba, C.C.M.; Ruby, A.; Kuechly, H.U.; Kinzey, B.; Miller, N.; Sanders, J.; Barentine, J.; Kleinodt, R.; Espey, B. Direct Measurement of the Contribution of Street Lighting to Satellite Observations of Nighttime Light Emissions from Urban Areas. Light. Res. Technol. 2021, 53, 189–211. [Google Scholar] [CrossRef]
- Espey, B.R. Empirical Modelling of Public Lighting Emission Functions. Remote Sens. 2021, 13, 3827. [Google Scholar] [CrossRef]
- de Miguel, A.S.; Bennie, J.; Rosenfeld, E.; Dzurjak, S.; Gaston, K.J. First Estimation of Global Trends in Nocturnal Power Emissions Reveals Acceleration of Light Pollution. Remote Sens. 2021, 13, 3311. [Google Scholar] [CrossRef]
- Ściężor, T. Effect of Street Lighting on the Urban and Rural Night-Time Radiance and the Brightness of the Night Sky. Remote Sens. 2021, 13, 1654. [Google Scholar] [CrossRef]
- Green, R.F.; Luginbuhl, C.B.; Wainscoat, R.J.; Duriscoe, D. The Growing Threat of Light Pollution to Ground-Based Observatories. Astron. Astrophys. Rev. 2022, 30, 1. [Google Scholar] [CrossRef]
- Kuechly, H.U.; Kyba, C.C.M.; Ruhtz, T.; Lindemann, C.; Wolter, C.; Fischer, J.; Hölker, F. Aerial Survey and Spatial Analysis of Sources of Light Pollution in Berlin, Germany. Remote Sens. Environ. 2012, 126, 39–50. [Google Scholar] [CrossRef]
- Bará, S.; Tapia, C.E.; Zamorano, J. Absolute Radiometric Calibration of TESS-W and SQM Night Sky Brightness Sensors. Sensors 2019, 19, 1336. [Google Scholar] [CrossRef] [PubMed]
- Jechow, A.; Hölker, F.; Kyba, C.C.M. Using All-Sky Differential Photometry to Investigate How Nocturnal Clouds Darken the Night Sky in Rural Areas. Sci. Rep. 2019, 9, 1391. [Google Scholar] [CrossRef]
- Falchi, F. Campaign of Sky Brightness and Extinction Measurements Using a Portable CCD Camera. Mon. Not. R. Astron. Soc. 2011, 412, 33–48. [Google Scholar] [CrossRef]
- Masciadri, E. Optical Turbulence. In Proceedings of the Astronomy Meets Meteorology, Alghero, Italy, 15 September 2008. [Google Scholar]
- Puschnig, J.; Schwope, A.; Posch, T.; Schwarz, R. The Night Sky Brightness at Potsdam-Babelsberg Including Overcast and Moonlit Conditions. J. Quant. Spectrosc. Radiat. Transf. 2014, 139, 76–81. [Google Scholar] [CrossRef]
- Sieltec Canarias SKYGLOW V3.1. Available online: https://www.sieltec.es/2022/07/20/proyecto-de-desarrollo-experimental-skyglow/ (accessed on 27 January 2023).
- Davis Vantage Vue + Weatherlink Live. Available online: https://www.estacionesdavis.es/es/davis-vantage-vue/84-pack-davis-vantage-vue-weatherlink-live.html (accessed on 26 January 2023).
- Agencia Estatal de Meteorología (AEMET). Available online: https://www.aemet.es/es/portada (accessed on 16 December 2022).
- Garstang, R.H. Dust and light pollution. Publ. Astron. Soc. Pac. 1991, 103, 1109. [Google Scholar] [CrossRef]
- Interreg Globaltur Euroace. Available online: https://globaltur.eu/ (accessed on 16 December 2022).
- Diputación Provincial de Cáceres Astronomía En Tajo Internacional. Guía Práctica Para Ver Las Estrellas; Diputación Provincial de Cáceres: Cáceres, Spain, 2020. [Google Scholar]
- Dataset for Interference of Meteorological Variables on Night Sky Observation in Rural and Urban Zones of South-Western Spain. Available online: http://hdl.handle.net/10662/17977 (accessed on 3 July 2023).
- University of Extremadura WeatherUEX. Available online: https://weather-uex.netlify.app/fotometros (accessed on 3 July 2023).
- Liu, M.; Li, W.; Zhang, B.; Hao, Q.; Guo, X.; Liu, Y. Research on the Influence of Weather Conditions on Urban Night Light Environment. Sustain. Cities Soc. 2020, 54, 101980. [Google Scholar] [CrossRef]
- Posch, T.; Binder, F.; Puschnig, J. Systematic Measurements of the Night Sky Brightness at 26 Locations in Eastern Austria. J. Quant. Spectrosc. Radiat. Transf. 2018, 211, 144–165. [Google Scholar] [CrossRef]
- Kyba, C.C.M.; Tong, K.P.; Bennie, J.; Birriel, I.; Birriel, J.J.; Cool, A.; Danielsen, A.; Davies, T.W.; den Outer, P.N.; Edwards, W.; et al. Worldwide Variations in Artificial Skyglow. Sci. Rep. 2015, 5, 8409. [Google Scholar] [CrossRef]
- Metoffice Weather Guides: Observation. Available online: https://www.metoffice.gov.uk/weather/guides/observations/how-we-measure-cloud#:~:text=Cloud%20amount%20is%20reported%20in,but%20not%20full%20cloud%20cover (accessed on 5 June 2023).
- Ribas, S.; Torra, J.; Paricio, S.; Canal-Domingo, R. How Clouds Are Amplifying (or Not) the Effects of ALAN. Int. J. Sustain. Light. 2016, 18, 32–39. [Google Scholar] [CrossRef]
- Kyba, C.C.M.; Ruhtz, T.; Fischer, J.; Hölker, F. Cloud Coverage Acts as an Amplifier for Ecological Light Pollution in Urban Ecosystems. PLoS ONE 2011, 6, e17307. [Google Scholar] [CrossRef]
- Kyba, C.C.M.; Ruhtz, T.; Fischer, J.; Hölker, F. Red Is the New Black: How the Colour of Urban Skyglow Varies with Cloud Cover. Mon. Not. R. Astron. Soc. 2012, 425, 701–708. [Google Scholar] [CrossRef]
- Solano Lamphar, H.A.; Kocifaj, M. Urban Night-Sky Luminance Due to Different Cloud Types: A Numerical Experiment. Light. Res. Technol. 2015, 48, 1017–1033. [Google Scholar] [CrossRef]
- Alarcon, M.R.; Puig-Subirà, M.; Serra-Ricart, M.; Lemes-Perera, S.; Mallorquín, M.; López, C. SG-WAS: A New Wireless Autonomous Night Sky Brightness Sensor. Sensors 2021, 21, 5590. [Google Scholar] [CrossRef] [PubMed]
- NASA “Blue Marble” Navigator. Available online: https://blue-marble.de/nightlights/2022 (accessed on 16 December 2022).
| Disclaimer/Publisher’s Note: The statements, opinions and data contained in all publications are solely those of the individual author(s) and contributor(s) and not of MDPI and/or the editor(s). MDPI and/or the editor(s) disclaim responsibility for any injury to people or property resulting from any ideas, methods, instructions or products referred to in the content. |
© 2023 by the authors. Licensee MDPI, Basel, Switzerland. This article is an open access article distributed under the terms and conditions of the Creative Commons Attribution (CC BY) license (https://creativecommons.org/licenses/by/4.0/).
