Article

Evaluation and Design of Parameterized Dynamic Daylighting for Large-Space Buildings

1
School of Civil Engineering, Architecture and Environment, Hubei University of Technology, Wuhan 430068, China
2
Zhongnan Architectural Design Institute Co., Ltd., Wuhan 430061, China
*
Author to whom correspondence should be addressed.
Sustainability 2023, 15(14), 10773; https://doi.org/10.3390/su151410773
Submission received: 3 May 2023 / Revised: 16 June 2023 / Accepted: 6 July 2023 / Published: 9 July 2023
(This article belongs to the Special Issue Sustainable Development in Prefabrication)

Abstract

:
This study aimed to promote the use of natural lighting in building designs to create a good lighting environment and to save energy. Dynamic daylight evaluation and analysis have become hot research topics due to the influence of outdoor light climate changes that occur throughout the season and over a period of time. However, there are certain gaps in the application of dynamic daylight evaluation for large-space buildings. In China, static daylight evaluation is mainly used to assess the actual daylighting performance of buildings. The Hangzhou E-sports Center in China was selected as the study object in this research, and dynamic daylight simulations were conducted using Rhino + Grasshopper and Ladybug + Honeybee for different representative days in each season and in each measurement zone. Spatial daylight autonomy (sDA) and useful daylight illuminance (UDI) were used as the dynamic daylight evaluation indicators, and a parameterized dynamic daylight evaluation method was proposed for evaluating the design scheme. By comparing the initial and optimized design schemes, the results showed the following: (1) the optimized scheme increased the ratio of area and time within the UDI 100–2000 lux range, and areas with an sDA >300 lux accounted for over 55% of the primary use areas, indicating a significant improvement in the daylighting quality of the large space; (2) the daylighting quality of the large space building showed seasonal changes, with the best daylighting quality occurring during the summer solstice and the worst occurring on the winter solstice, while the daylighting quality was similar during the spring and autumn equinoxes; (3) the dynamic evaluation metrics facilitated the identification of daylighting issues in large-scale buildings more effectively; (4) the parameterized method proposed in this study can solve the cumbersome process of daylight simulation and is more conducive to the adjustment and optimization of design schemes by designers. The parameterized dynamic daylight evaluation method proposed in this study provides references and ideas for the design and research of daylighting in other large-space buildings.

1. Introduction

With the global energy crisis and excessive greenhouse gas emissions [1], there is growing concern regarding energy consumption trends and their impact on the natural environment [2]. Among the different industries, the construction industry is responsible for a significant portion of global energy consumption, accounting for approximately one-third, with related gas emissions contributing to 40% of greenhouse gases [3,4]. Saving electricity consumption is one of the most effective ways through which to reduce emissions, and lighting energy efficiency is a crucial aspect of building energy efficiency. In office buildings, lighting accounts for 20–30% of total electricity consumption [5,6], while in stadium-type buildings, it can account for about 25% [7]. In residential buildings, lighting consumes around 10% of electricity [8]. Therefore, to reduce artificial lighting and save building energy consumption, natural lighting should be prioritized. These findings underscore the urgent need for research and innovation in building design and energy-efficient technologies to mitigate the impacts of climate change.
Natural lighting, as an effective passive design means [9], has positive significance for creating a good indoor light environment, energy saving, emission reductions, and the sustainable development of buildings [10,11,12]. The reasonable use of natural lighting can not only reduce the lighting energy of lamps and lanterns (as well as reduce building energy consumption [13,14]), but also increase the visual comfort of users, improve the efficiency of users [15,16], and have a positive effect on human physical and mental health [17,18,19,20]. It has been confirmed that natural light can promote the rehabilitation of the elderly and hospital patients [21,22], as well as improve students’ learning ability and hands-on ability; in addition, improving the light level has a preventive effect on students’ myopia [23]. The ultraviolet light from natural light has a germicidal effect and helps people maintain good health. However, the demand for natural light in buildings is not simply a requirement for greater illumination and longer duration. For example, human exposure to sunlight can trigger many adverse reactions in the human body, such as the uncomfortable visual effects caused by people in glare conditions; that tropical excess natural lighting makes the building overheated, which not only causes discomfort, but also increases building energy consumption [24,25,26,27]. Therefore, the evaluation of building lighting cannot rely on a single indicator; it must be carried out as a comprehensive evaluation of time, space, light intensity, and area.
In China, the evaluation of building lighting is one of the important indicators of green building performance design. How to obtain good building lighting effects through reasonable window opening design and effective evaluation has become a key concern for designers. Due to the vast territory of China, with a total area of 9.6 million square kilometers, it is difficult to develop the same standards nationwide. According to the definition of the Chinese Standard for Daylighting Design of Buildings [28], the country is divided into five lighting climate zones—which are numbered 1–5, with lower numbers indicating greater natural light resources—and corresponding building lighting design standards are adopted for each climate zone. Traditional Chinese lighting evaluation indicators mainly focus on the various indicators of natural indoor lighting conditions at specific times, such as illuminance, daylight factor, uniformity of daylighting, and glare value [28,29]. However, this type of lighting evaluation presents static characteristics, only reflecting the lighting level of a particular day, and it does not reflect the impact of changes during different times and seasons on building lighting, which limits the evaluation of building lighting [30]. In practical situations, building lighting reflects the dynamic influence of time and season on the indoor lighting environment of buildings that face different directions. Building lighting is determined by taking into account the factors of building space, window design, and building materials on building optical performance and lighting level under the constantly changing outdoor lighting environment. Therefore, from the perspective of lighting design and evaluation, adopting a dynamic evaluation approach can better reflect the building’s lighting performance when in actual use. Dynamic evaluation methods consider the dynamic impact of factors such as time and seasons on the indoor lighting environment of buildings that face different orientations, enabling a more comprehensive assessment of the daylighting conditions. In contrast, traditional static evaluation methods fail to capture this dynamic variation [31].
Currently, the most widely used international metric for evaluating lighting dynamics is spatial daylight autonomy (sDA) [32,33], which is defined as the percentage of annual working hours for which natural light is sufficient enough to exceed a baseline illuminance value [34]. There is also the metric useful daylight illuminance (UDI), which quantifies daylight availability and daylight exposure levels with a single assessment model. It is defined as an illumination level in the range of 100–2000 lux, which meets basic requirements, i.e., effective illumination. Furthermore, illumination levels that are >2000 lux produce visual discomfort, and illumination levels <100 lux make it difficult to meet basic visual needs. As dynamic evaluation indices take into account the dynamic effects of time, season, and other changes in the indoor light environment of buildings under different orientations, the sDA and UDI metrics have, thus, been widely used in the process of lighting design in recent years [35,36,37]. However, from the analysis of existing research on the dynamic lighting evaluation of buildings, these metrics have been more applied on small- and medium-scale building spaces [38]. Among them is the use of dynamic lighting design in residential buildings [31,39,40,41,42], office buildings [43,44,45,46], and commercial buildings [47,48], and these can effectively improve the comfort and energy-saving effect of the indoor environment. However, in large-space buildings, only static indicators are used to evaluate the lighting quality of buildings [49] (i.e., dynamic indicator evaluation is not used), which has limitations. Thus, there is a certain gap in the research of dynamic lighting design in large-space buildings.
The complex modeling and the multitude of influencing parameters in the pre-analysis stage make the lighting analysis of large-space buildings challenging due to their diverse spatial types, large spans, and complex structures [50,51,52]. On the one hand, the lighting in large-space buildings is evaluated via only using static indicators, which may result in certain areas being too bright or too dark due to limitations in time and space conditions, thus making it difficult to meet the lighting design requirements of modern large-space buildings. On the other hand, green building performance design evaluations require designers to have high demands for the overall green building technology and performance analysis tools. The traditional process from design, analysis, and feedback to redesign, reanalysis, and feedback cannot meet the fast-paced needs of project optimization design.
Addressing the aforementioned shortcomings, this study takes the parameterized dynamic lighting evaluation as the starting point and uses the Hangzhou E-sports Center in China as the representative model of a large-space building in order to conduct lighting design research. Specifically, this study achieves the following:
(1)
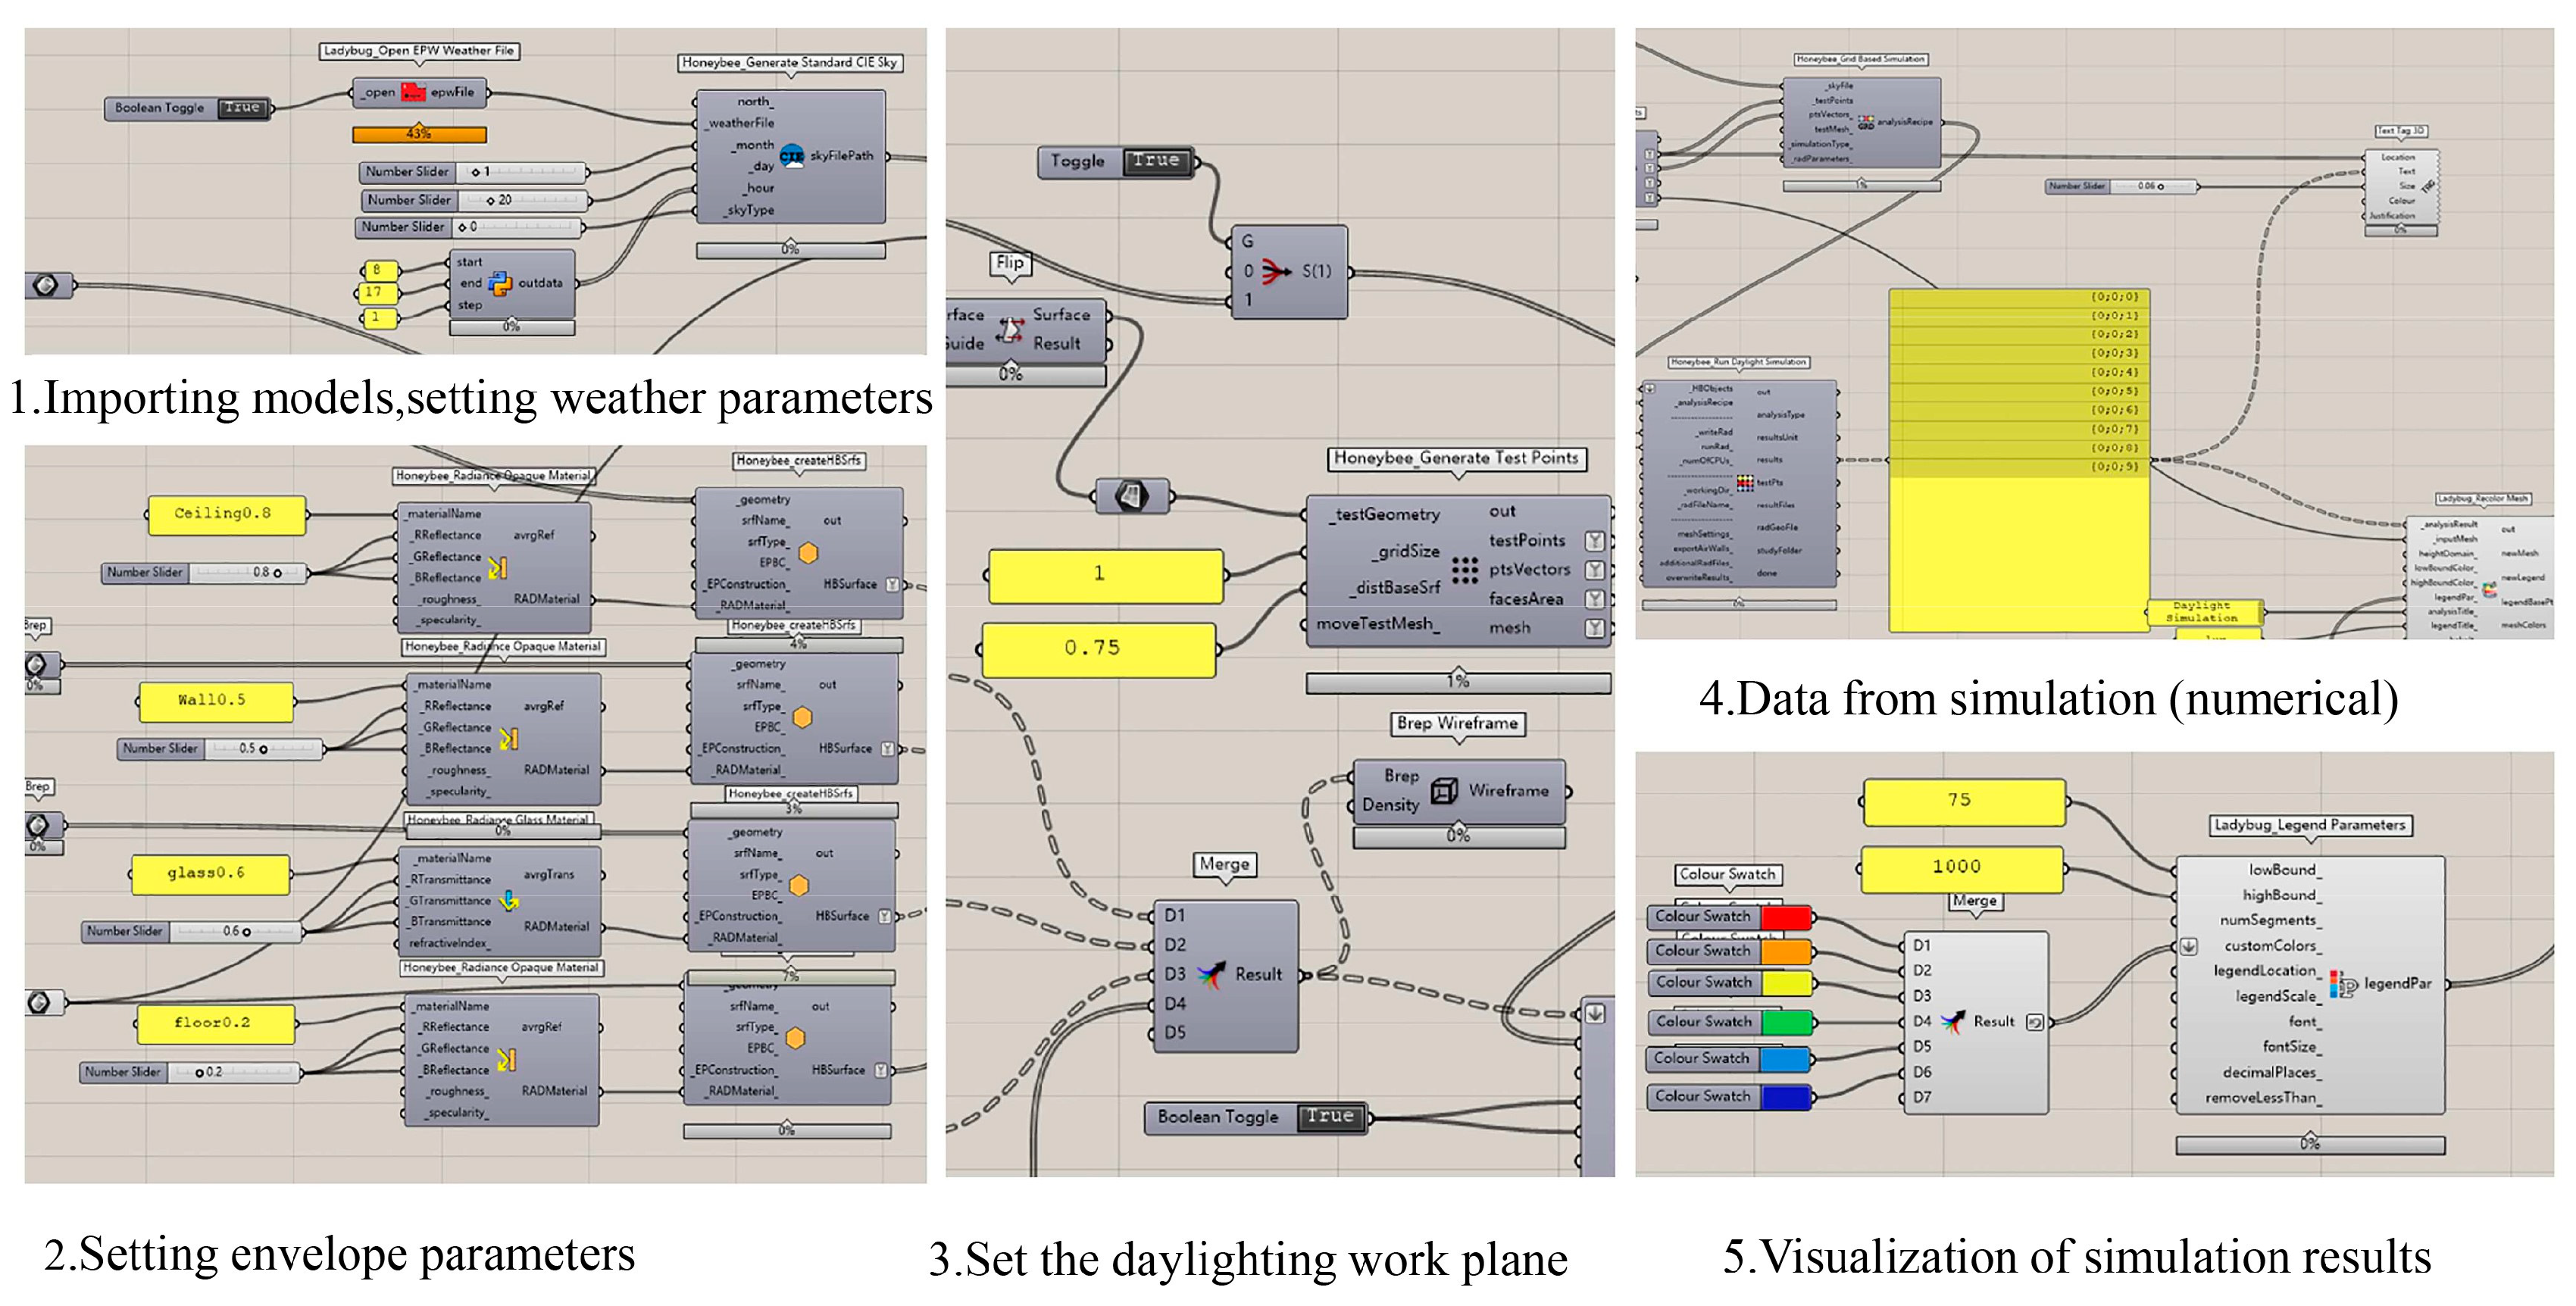
The parametric software Ladybug + Honeybee (Ver.1.4) is used to simulate the light environment of the building during the usage hours throughout the year.
(2)
A comprehensive evaluation analysis of the simulation results is conducted with sDA and UDI dynamic evaluation indices.
(3)
According to the evaluation and analysis results, the object is optimized, and a comparative study of large-space building lighting before and after optimization will is conducted.
Large-space parametric dynamic lighting evaluation, which is a comprehensive evaluation that uses the light intensity of the building’s annual use period, can improve the lighting quality inside large-space buildings, reduce the building’s energy consumption and operating costs, and provide a reference for the optimal design of large-space building lighting and energy saving.

2. Research Methodology and Model Building

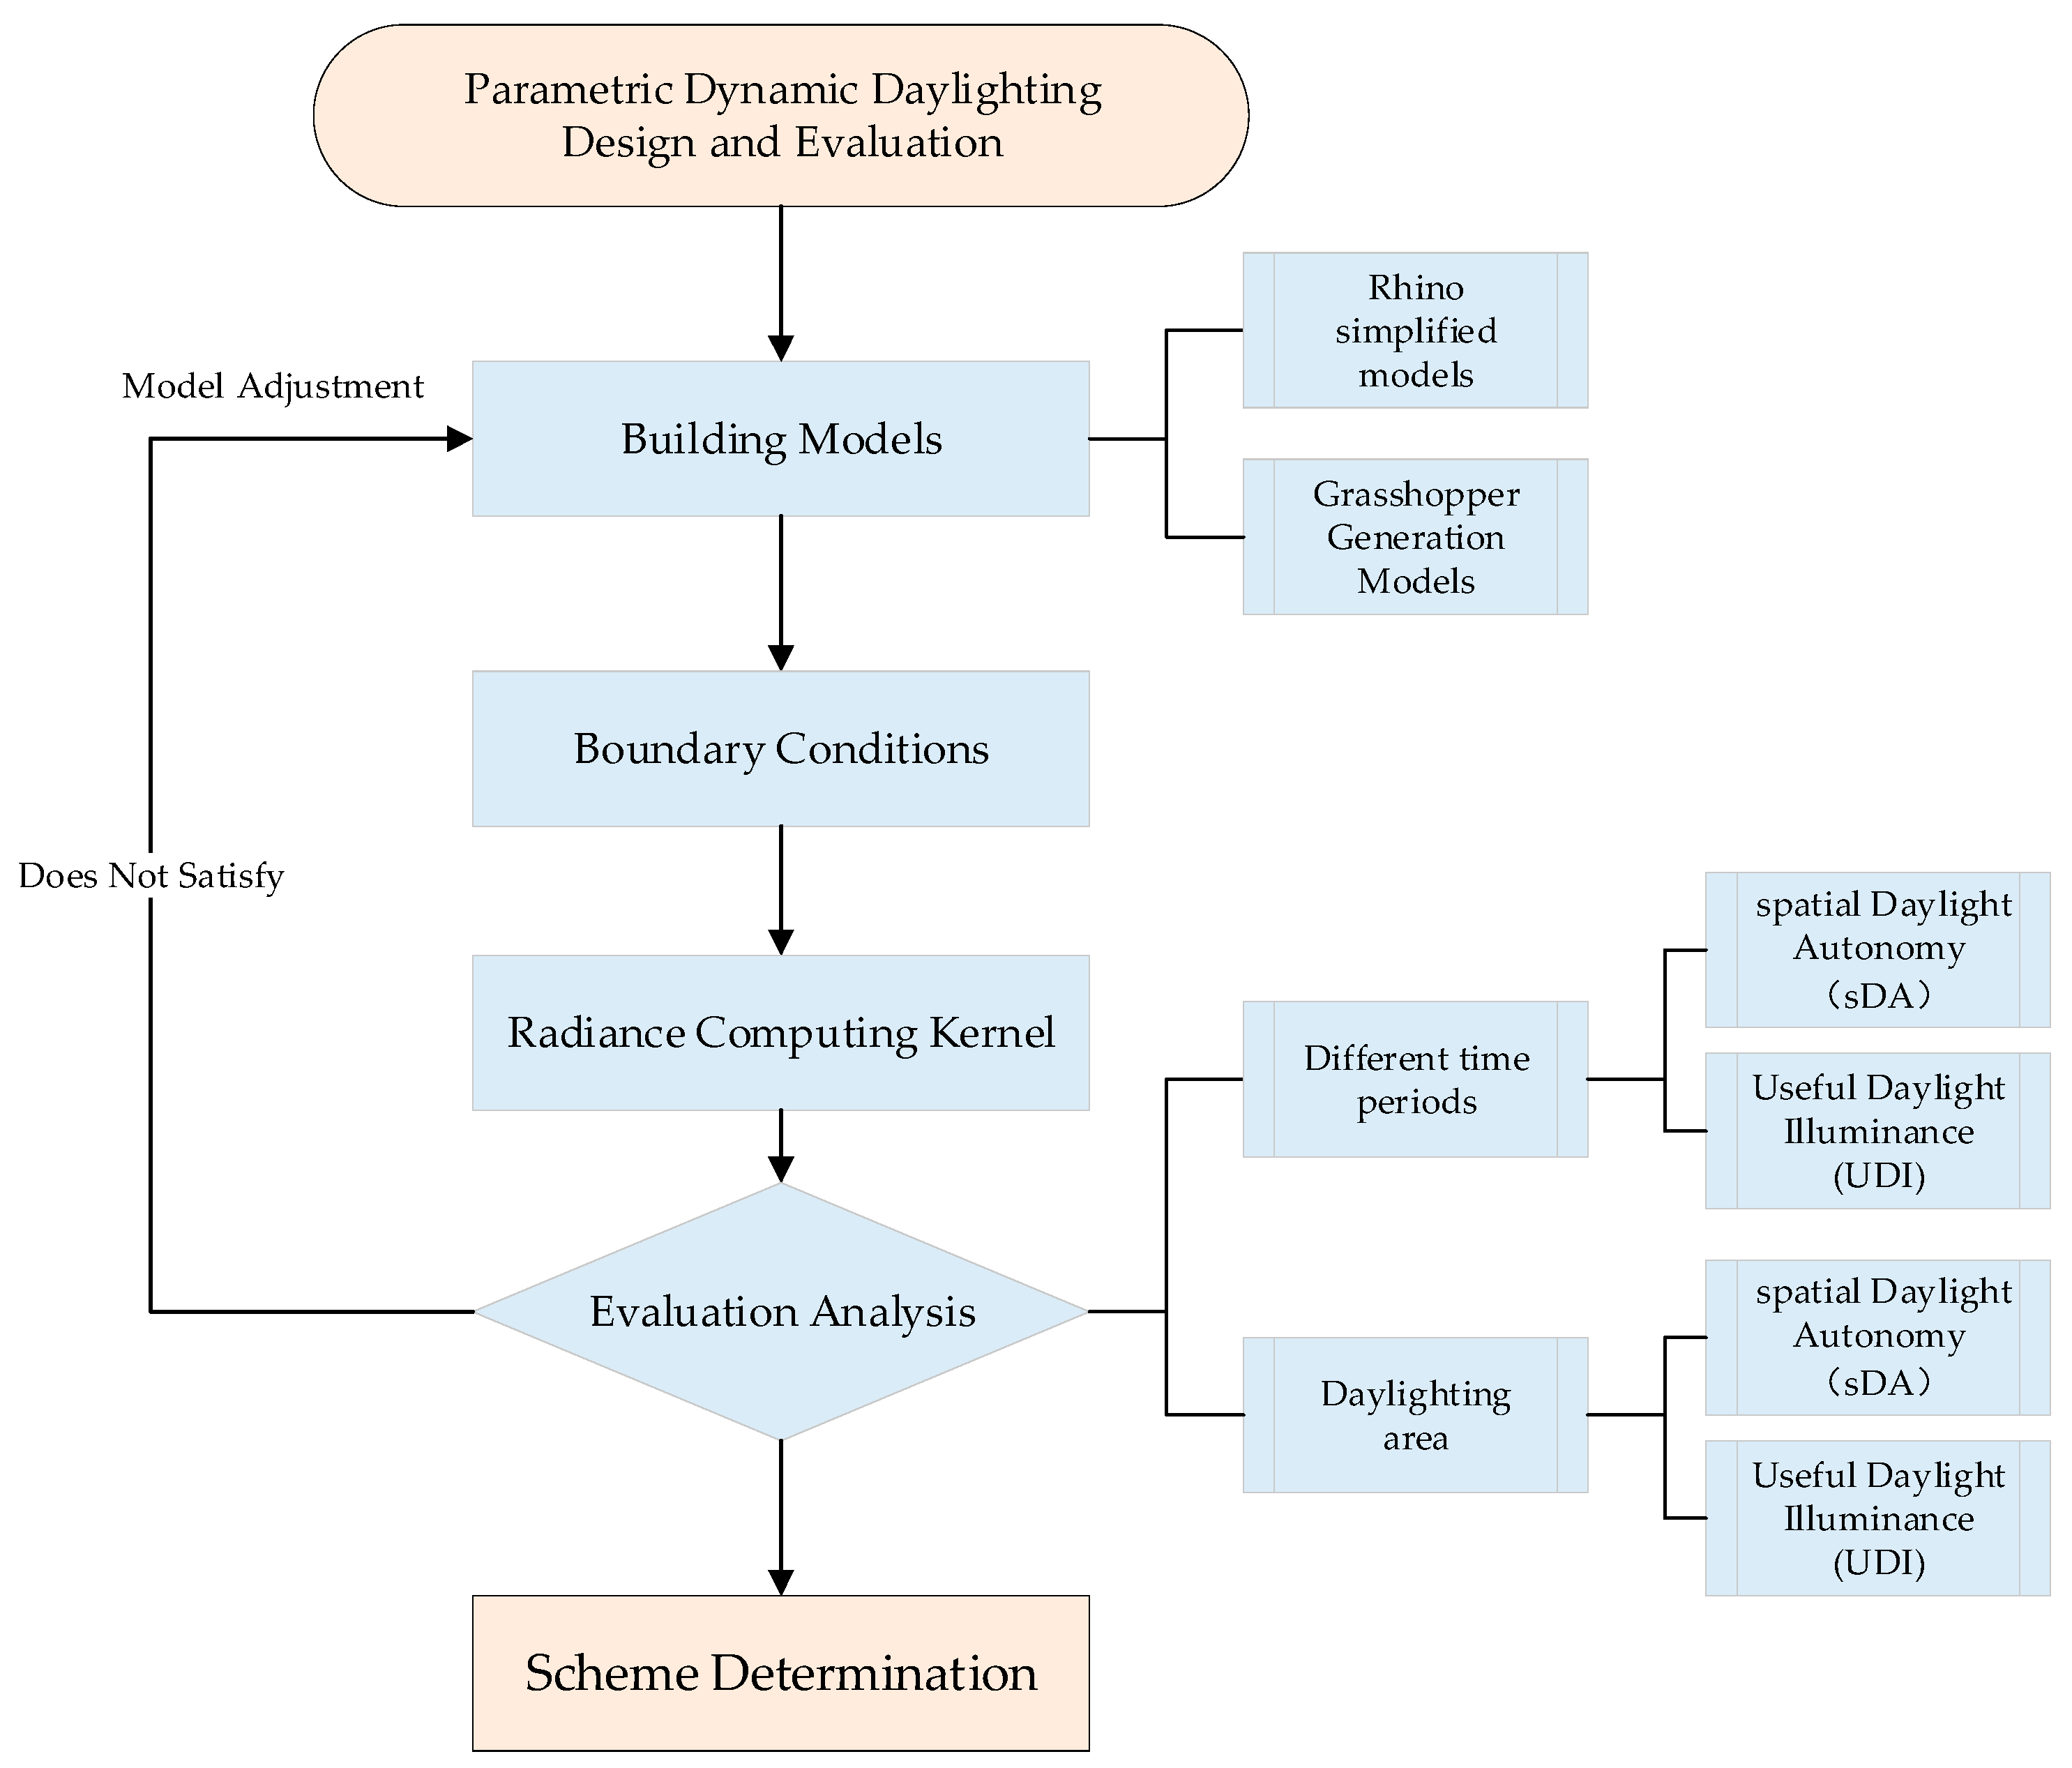
2.1. Parametric Daylighting Analysis Process

In recent years, with the rapid development of computer level and digital technology, artificial intelligence(AI) [53,54,55], parametric design, and performance numerical simulation technology have provided new ideas and directions for performance design and optimization in the early stages of green building. In the early stage of design, the traditional process from design to evaluation to feedback is changed through parametric design, and computers simulate the feedback in real-time through controlling to screening to modifying the key design parameters. This is conducted in order to realize the evaluation of program performance and to provide the decisions for program design and optimization at the same time. Experts and scholars, such as Manfren [56], Kotireddy [57], Biloria [58], Lin [59], Sun [60] and Ligier [61], have carried out numerous studies and have completed manifold practices in terms of parametric performance analysis. On the basis of the idea of parametric performance design analysis, the parametric dynamic lighting design and analysis evaluation process is proposed in this study (Figure 1). To better utilize the advantages of the parametric design platform and realize the parallel effect of lighting design evaluation and program optimization, the analysis process is carried out in four aspects.
(1)
The first step is the model building platform. The basic building model is the basis for light performance analysis, especially in large-space buildings such as stadia; the model is constrained by various factors such as building form, space, structure, and light form. In the early stages of design, it is difficult to fully interface traditional schematic models such as CAD, Sketch, or Revit with green performance analysis; thus, model processing or reconstruction is often required. In this study, the Grasshopper plug-in in Rhino [62]—a parametric design platform—can not only realize the drawing of free-form surfaces, but can also control the generation of graphics through visual programming, as well as realize secondary development with its powerful compatibility with the calculation kernels.
(2)
The second step is parameter setting and control. From the perspective of building lighting performance analysis and evaluation, the influencing parameters can be defined and controlled from multiple dimensions such as building morphology generation [63,64], building skin window forms [65,66], and building material optical properties [67]. Moreover, parametric design analysis is carried out by setting boundary conditions and thresholds for the different dimensions. In this study, the form of the window opening of the building skin is taken as the main parametric variable for the evaluation and optimal design analysis of the lighting performance, specifically under the premise that the building form and the optical properties of the material are determined in conjunction with the actual project situation.
(3)
The third step is to select the calculation kernel. To better take into account the domestic light environment performance analysis and evaluation standards, the light environment calculation module calls on Radiance—an internationally used kernel from Lawrence Berkeley Laboratory, USA. This calculation kernel, as the internationally recognized software for spatial light environment simulation in optical research, uses stochastic Monte Carlo sampling and inverse ray tracing algorithms to obtain a more satisfactory calculation accuracy [68].
(4)
The fourth step is evaluation and feedback. Using the parametric Ladybug and Honeybee platform [69], which has been widely applied in the evaluation of building lighting [70,71,72], the time-by-time distribution data of lighting level, average degree, and annual light comfort of the working surfaces of building indoor objects can be obtained through the simulation of dynamic indicators throughout the year. In addition, they can be visualized and dynamically displayed at the same time, providing rich results for the evaluation of lighting performance. The logical structure of the lighting evaluation and analysis, which was based on the parameterized platform, is shown in Figure 2.

2.2. Large-Space Dynamic Daylighting Evaluation Index

Lighting evaluation is one of the important performance indicators of green buildings. To comprehensively evaluate the quality of indoor lighting, requirements for lighting area and lighting time are put forward in public buildings. On the basis of the above parametric dynamic lighting evaluation ideas, through the comparison of Chinese and other countries’ lighting standards (Table 1), the combination of relevant large space lighting research results found that dynamic lighting design and evaluation mainly focus on daylight quality, daylight intensity (daylight intensity refers to the amount of natural light that is available in a space, measured in units of illuminance (lux) or luminous flux (lumens)) [47,48,49,73], useful daylight illuminance (UDI 100–2000 lux), and other aspects.
Therefore, to better capture the dynamic characteristics of lighting in large-space buildings, the lighting performance in this study was evaluated from two perspectives: (1) the UDI 100–2000 lux illuminance space ratio (a UDI of 100–2000 lux meets the basic visual requirements for effective illumination; a UDI >2000 lux results in high illumination and visual discomfort, while a UDI <100 lux leads to low illumination and insufficient visual needs); (2) sDA300 ≥50%, which means that the percentage of daylight space in the evaluation area is no less than 55% of the main use space, and at least 50% of the annual use time obtains 300 lux of daylight.
The UDI and sDA reference levels are presented in Table 2. Additionally, to better present the indoor lighting environment in large-space buildings during different periods, representative typical days (vernal equinox, summer solstice, autumn equinox, and winter solstice) were selected for a light environment characteristic analysis for the annual periods that were investigated in this study [79]. The comprehensive evaluation analysis was conducted with the ratio of the annual hours of different light intensities in different indoor areas and the area ratio of different light intensities.

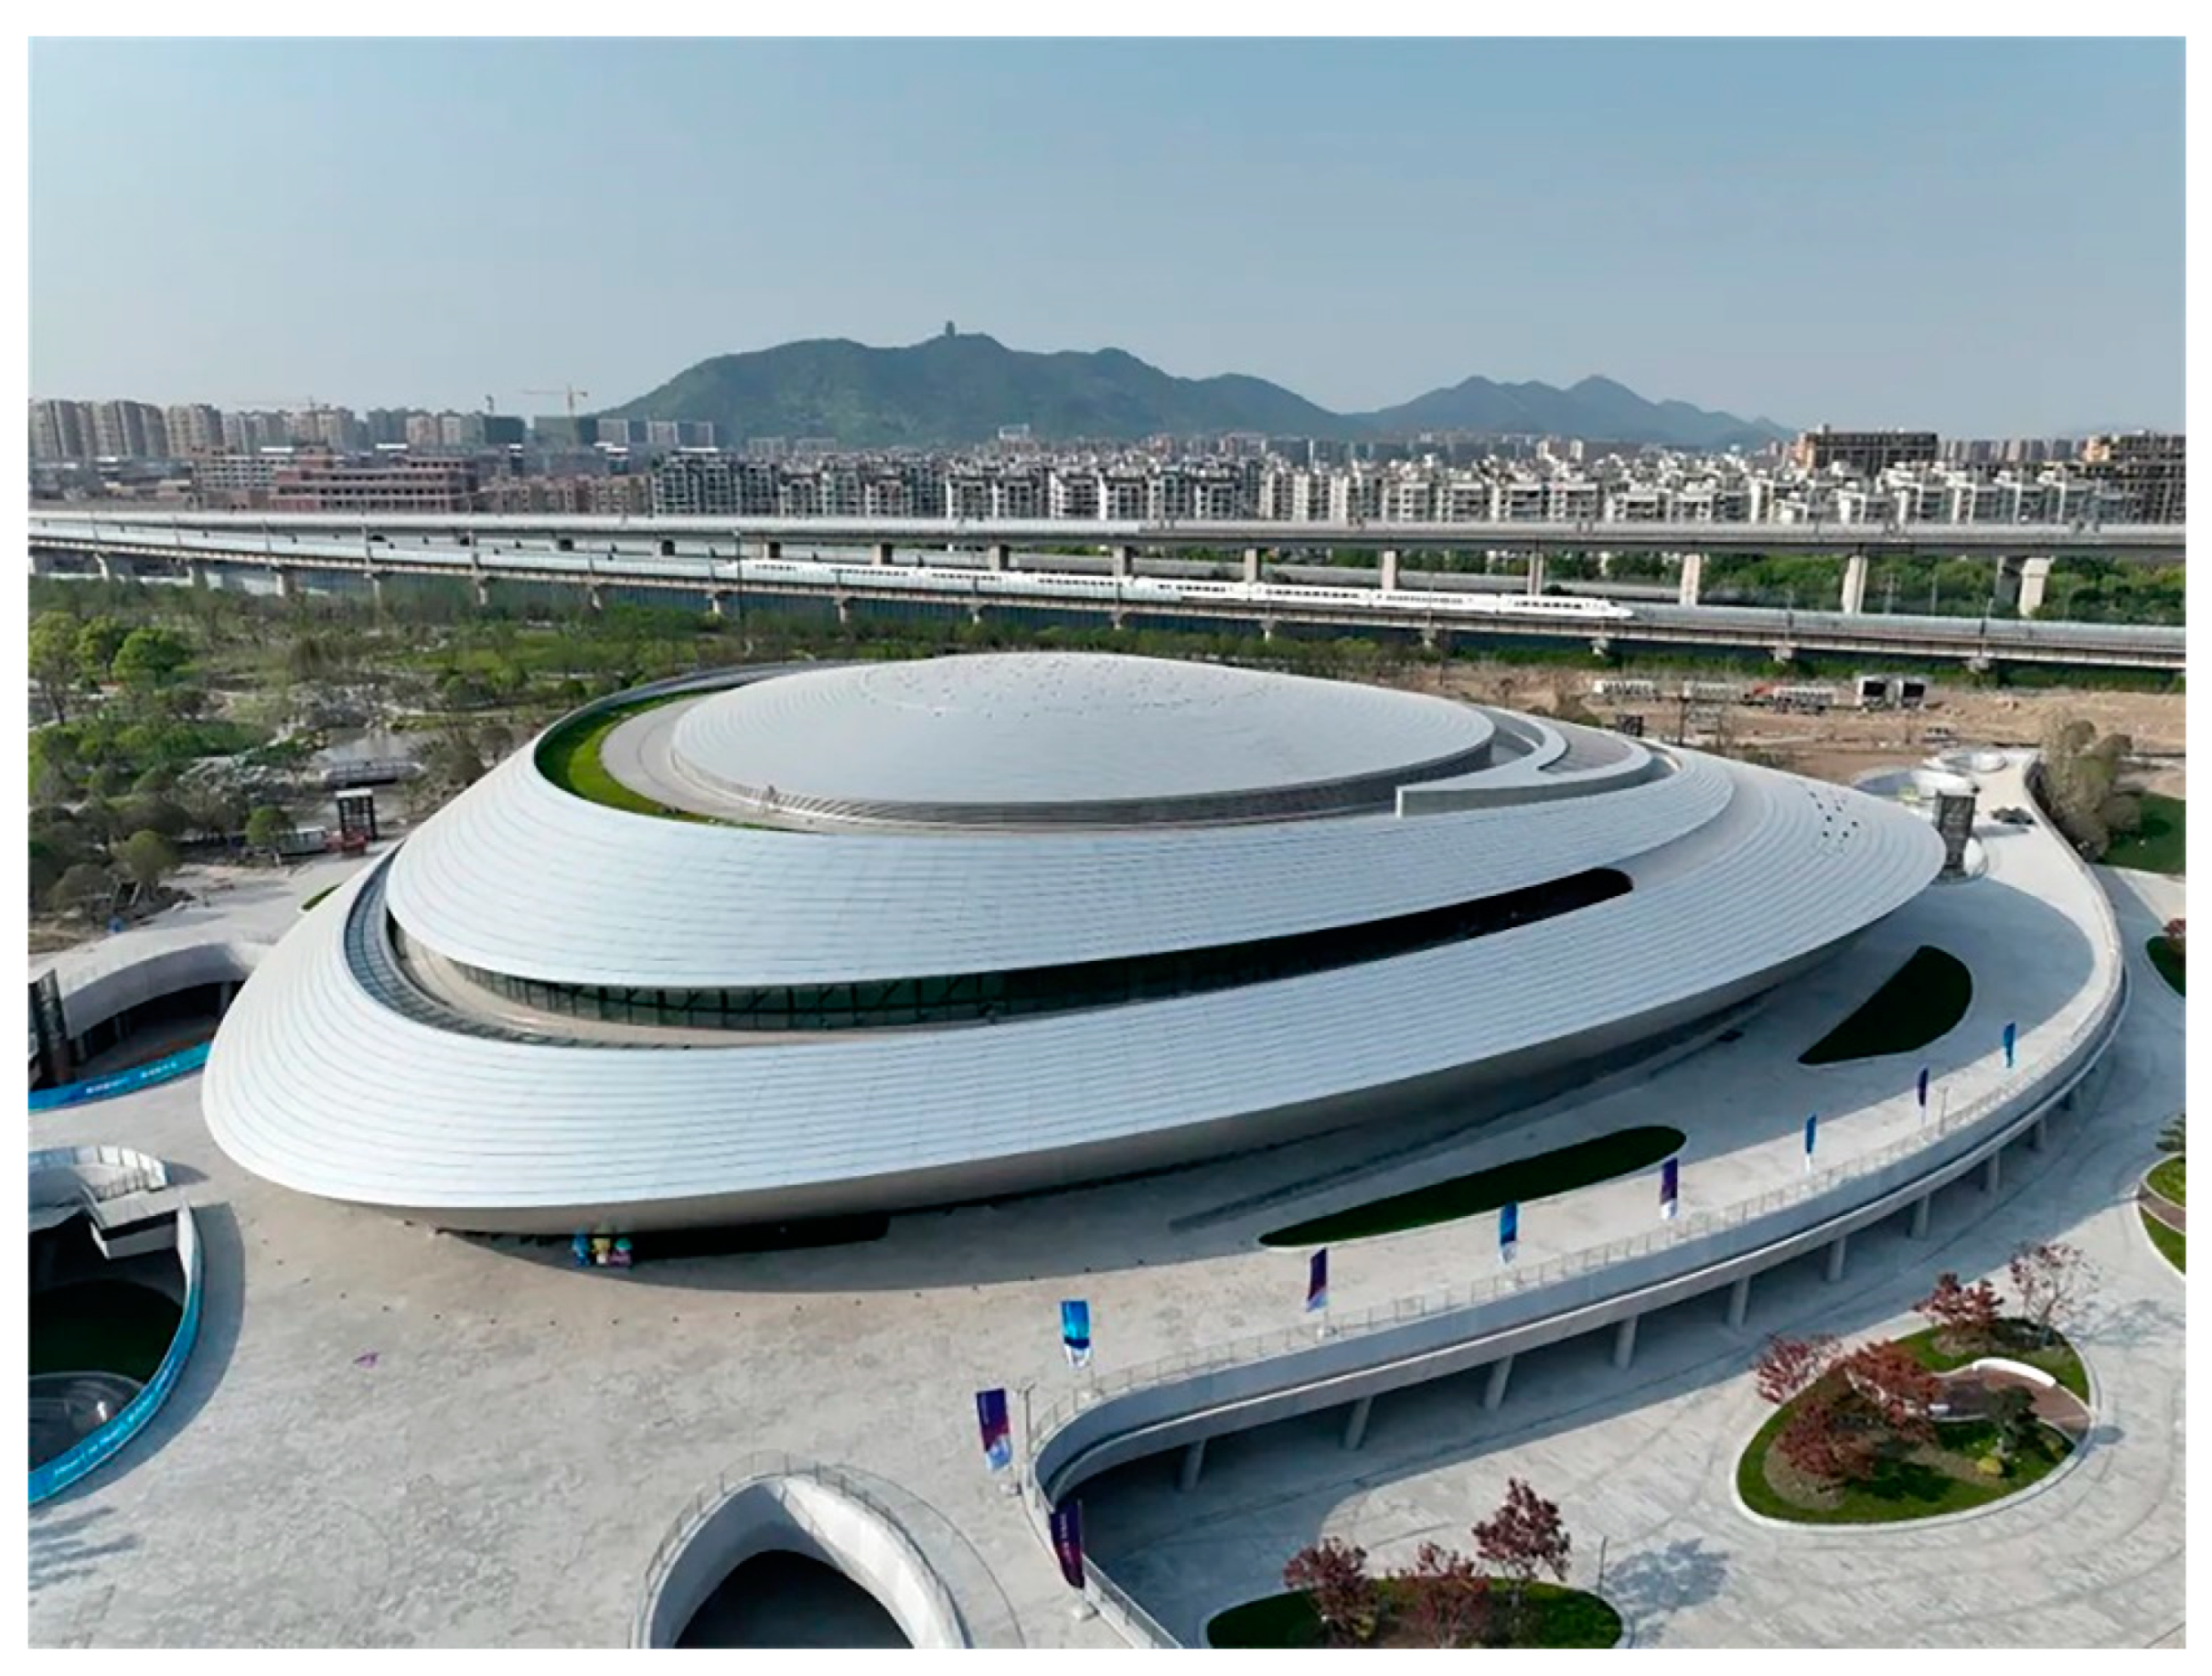
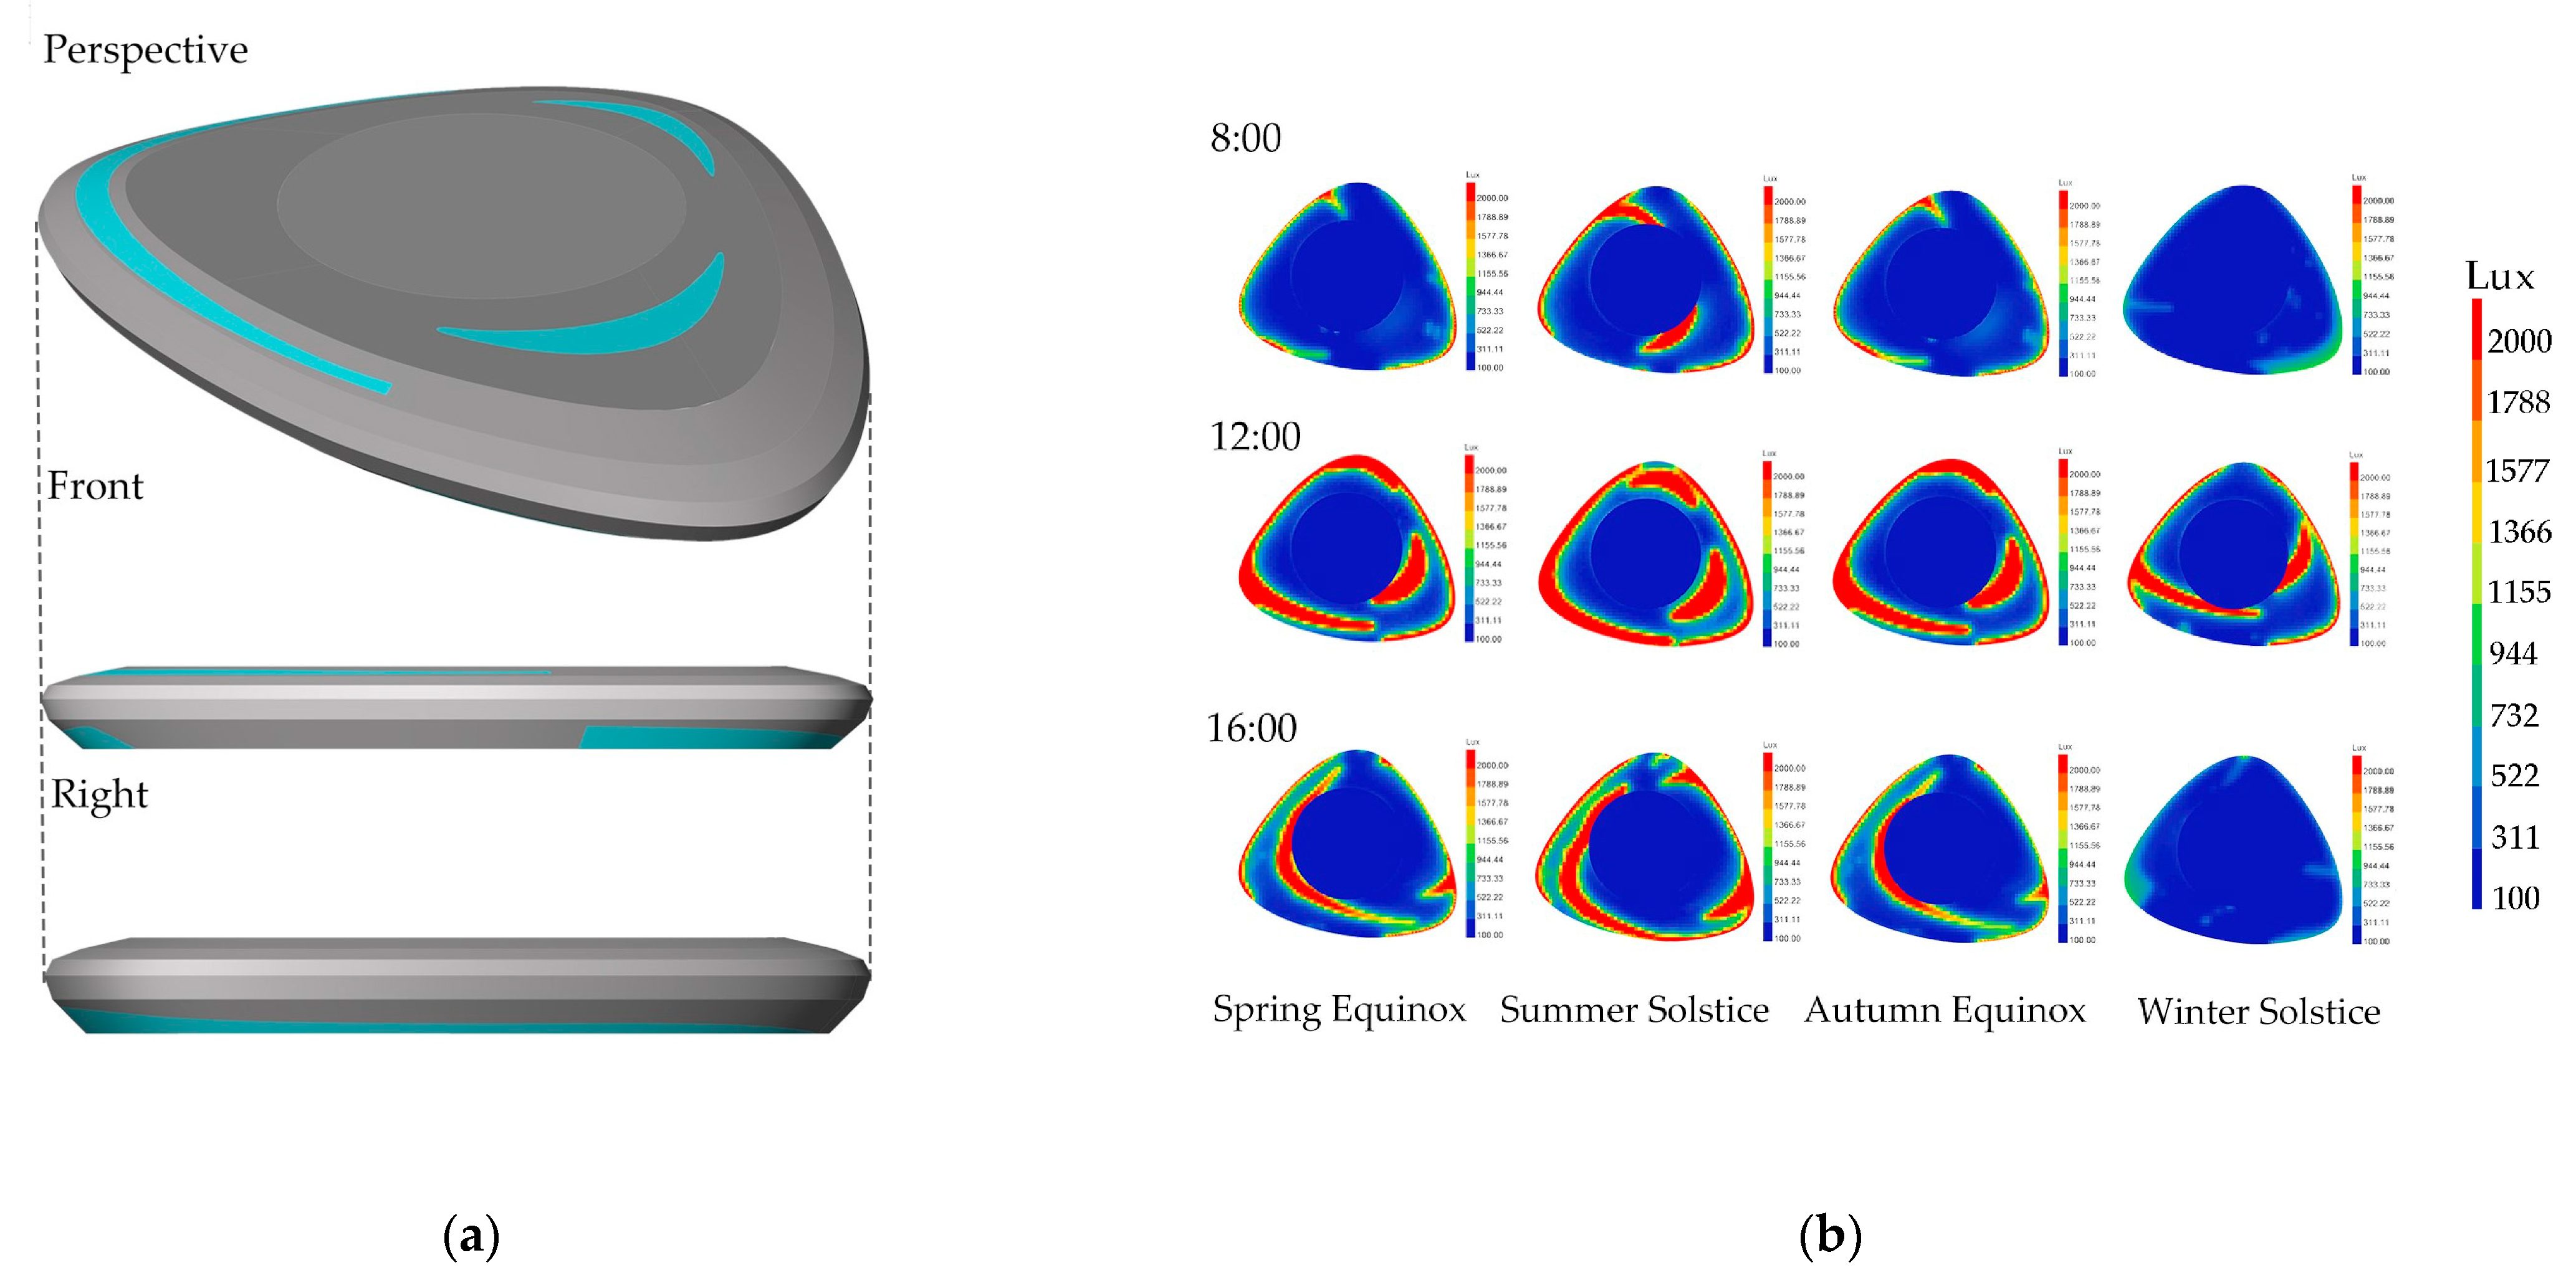
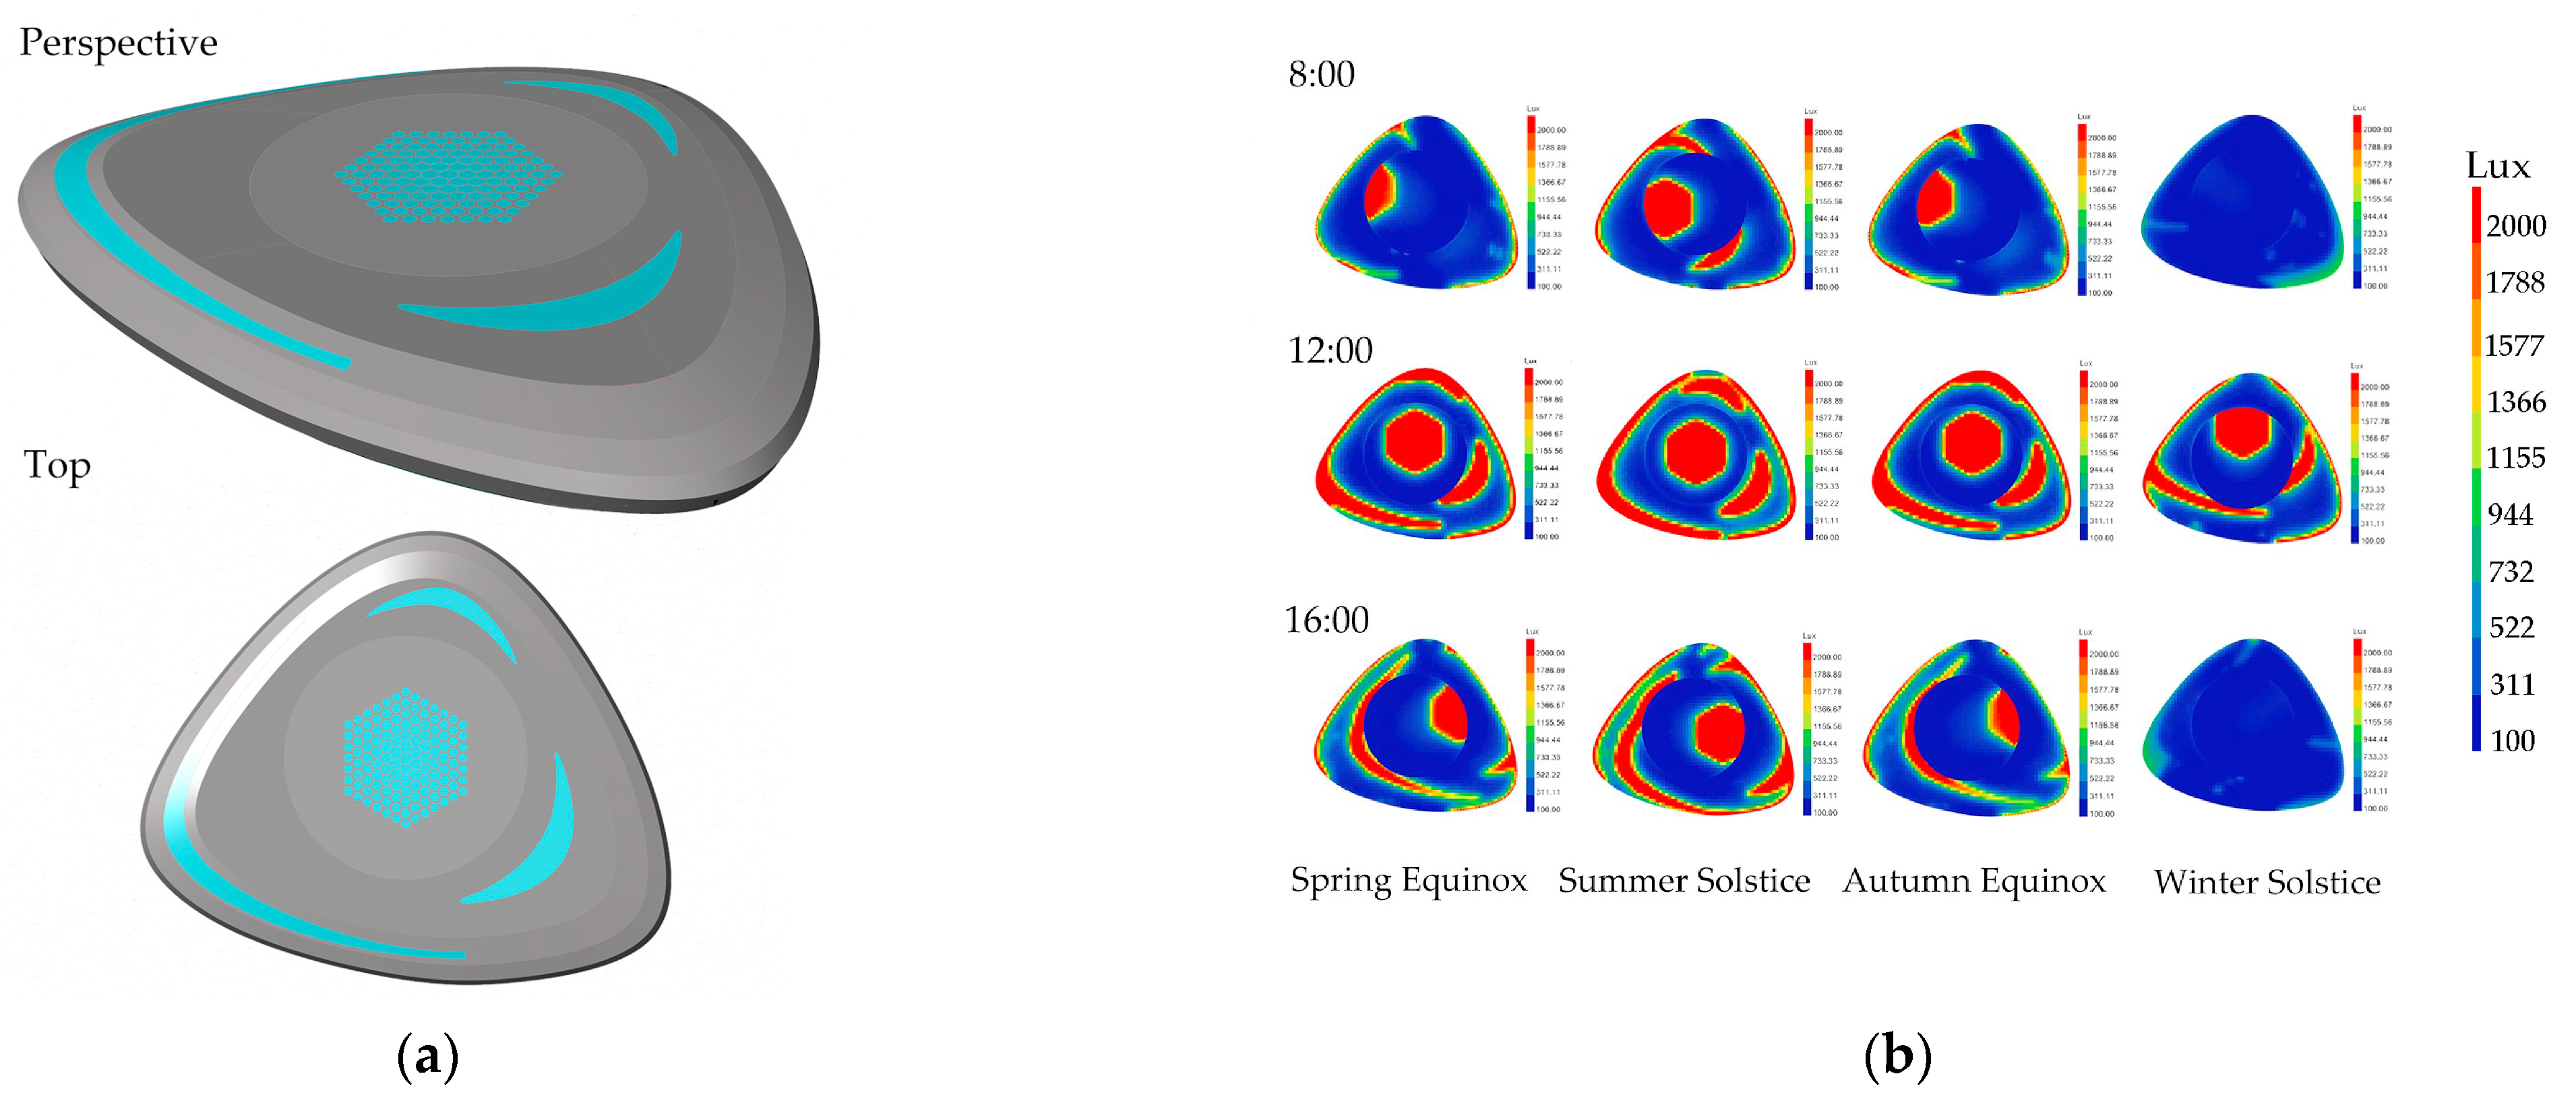
2.3. Research Object

This study takes Hangzhou E-sports Center in China as the study object for the dynamic lighting performance design and evaluation analysis. The E-sports Center is located in the E-sports Ecological Park in Xiacheng District, Hangzhou City, Zhejiang Province. The project covers an area of 12,838 m2, with a total construction area of 79,790 m2 and a building height of 34.6 m, and it is in Zone IV of China’s light climate zoning. The main competition area adopts a circular layout and can accommodate 4087 spectators. The architectural scheme introduces the concept of an “interstellar vortex” from an aerial view, and the venue is similar to an “interstellar battleship” that is coiled in the ecological park. It is similar to a star in the cosmic nebula, throwing light and energy into interstellar space, which fits with the science fiction and futuristic feel of e-sports competitions. In terms of lighting, the building is designed for better lighting. In terms of architectural lighting, the design scheme draws on the form of traditional Chinese residential “bright tiles” to better meet the natural lighting effects of different areas, as shown in Figure 3.

2.4. Model Building and Parameter Setting

The time zone, longitude, and latitude were extracted in combination with the location of the study subject, and the EPW data were imported for a typical meteorological year. The calculation time was selected with different time changes throughout the year, and the possible influence of the sun’s position on indoor lighting was also considered. The optical parameters of the materials refer to the requirements in the standard for the daylighting design of buildings (GB5033-2013), the design standard for energy efficiency of public buildings (GB50189-2015), and other specifications. The calculation grid was set to 1 m × 1 m, and the total number of calculation grids reached 12,850. The specific parameters are shown in Table 3.

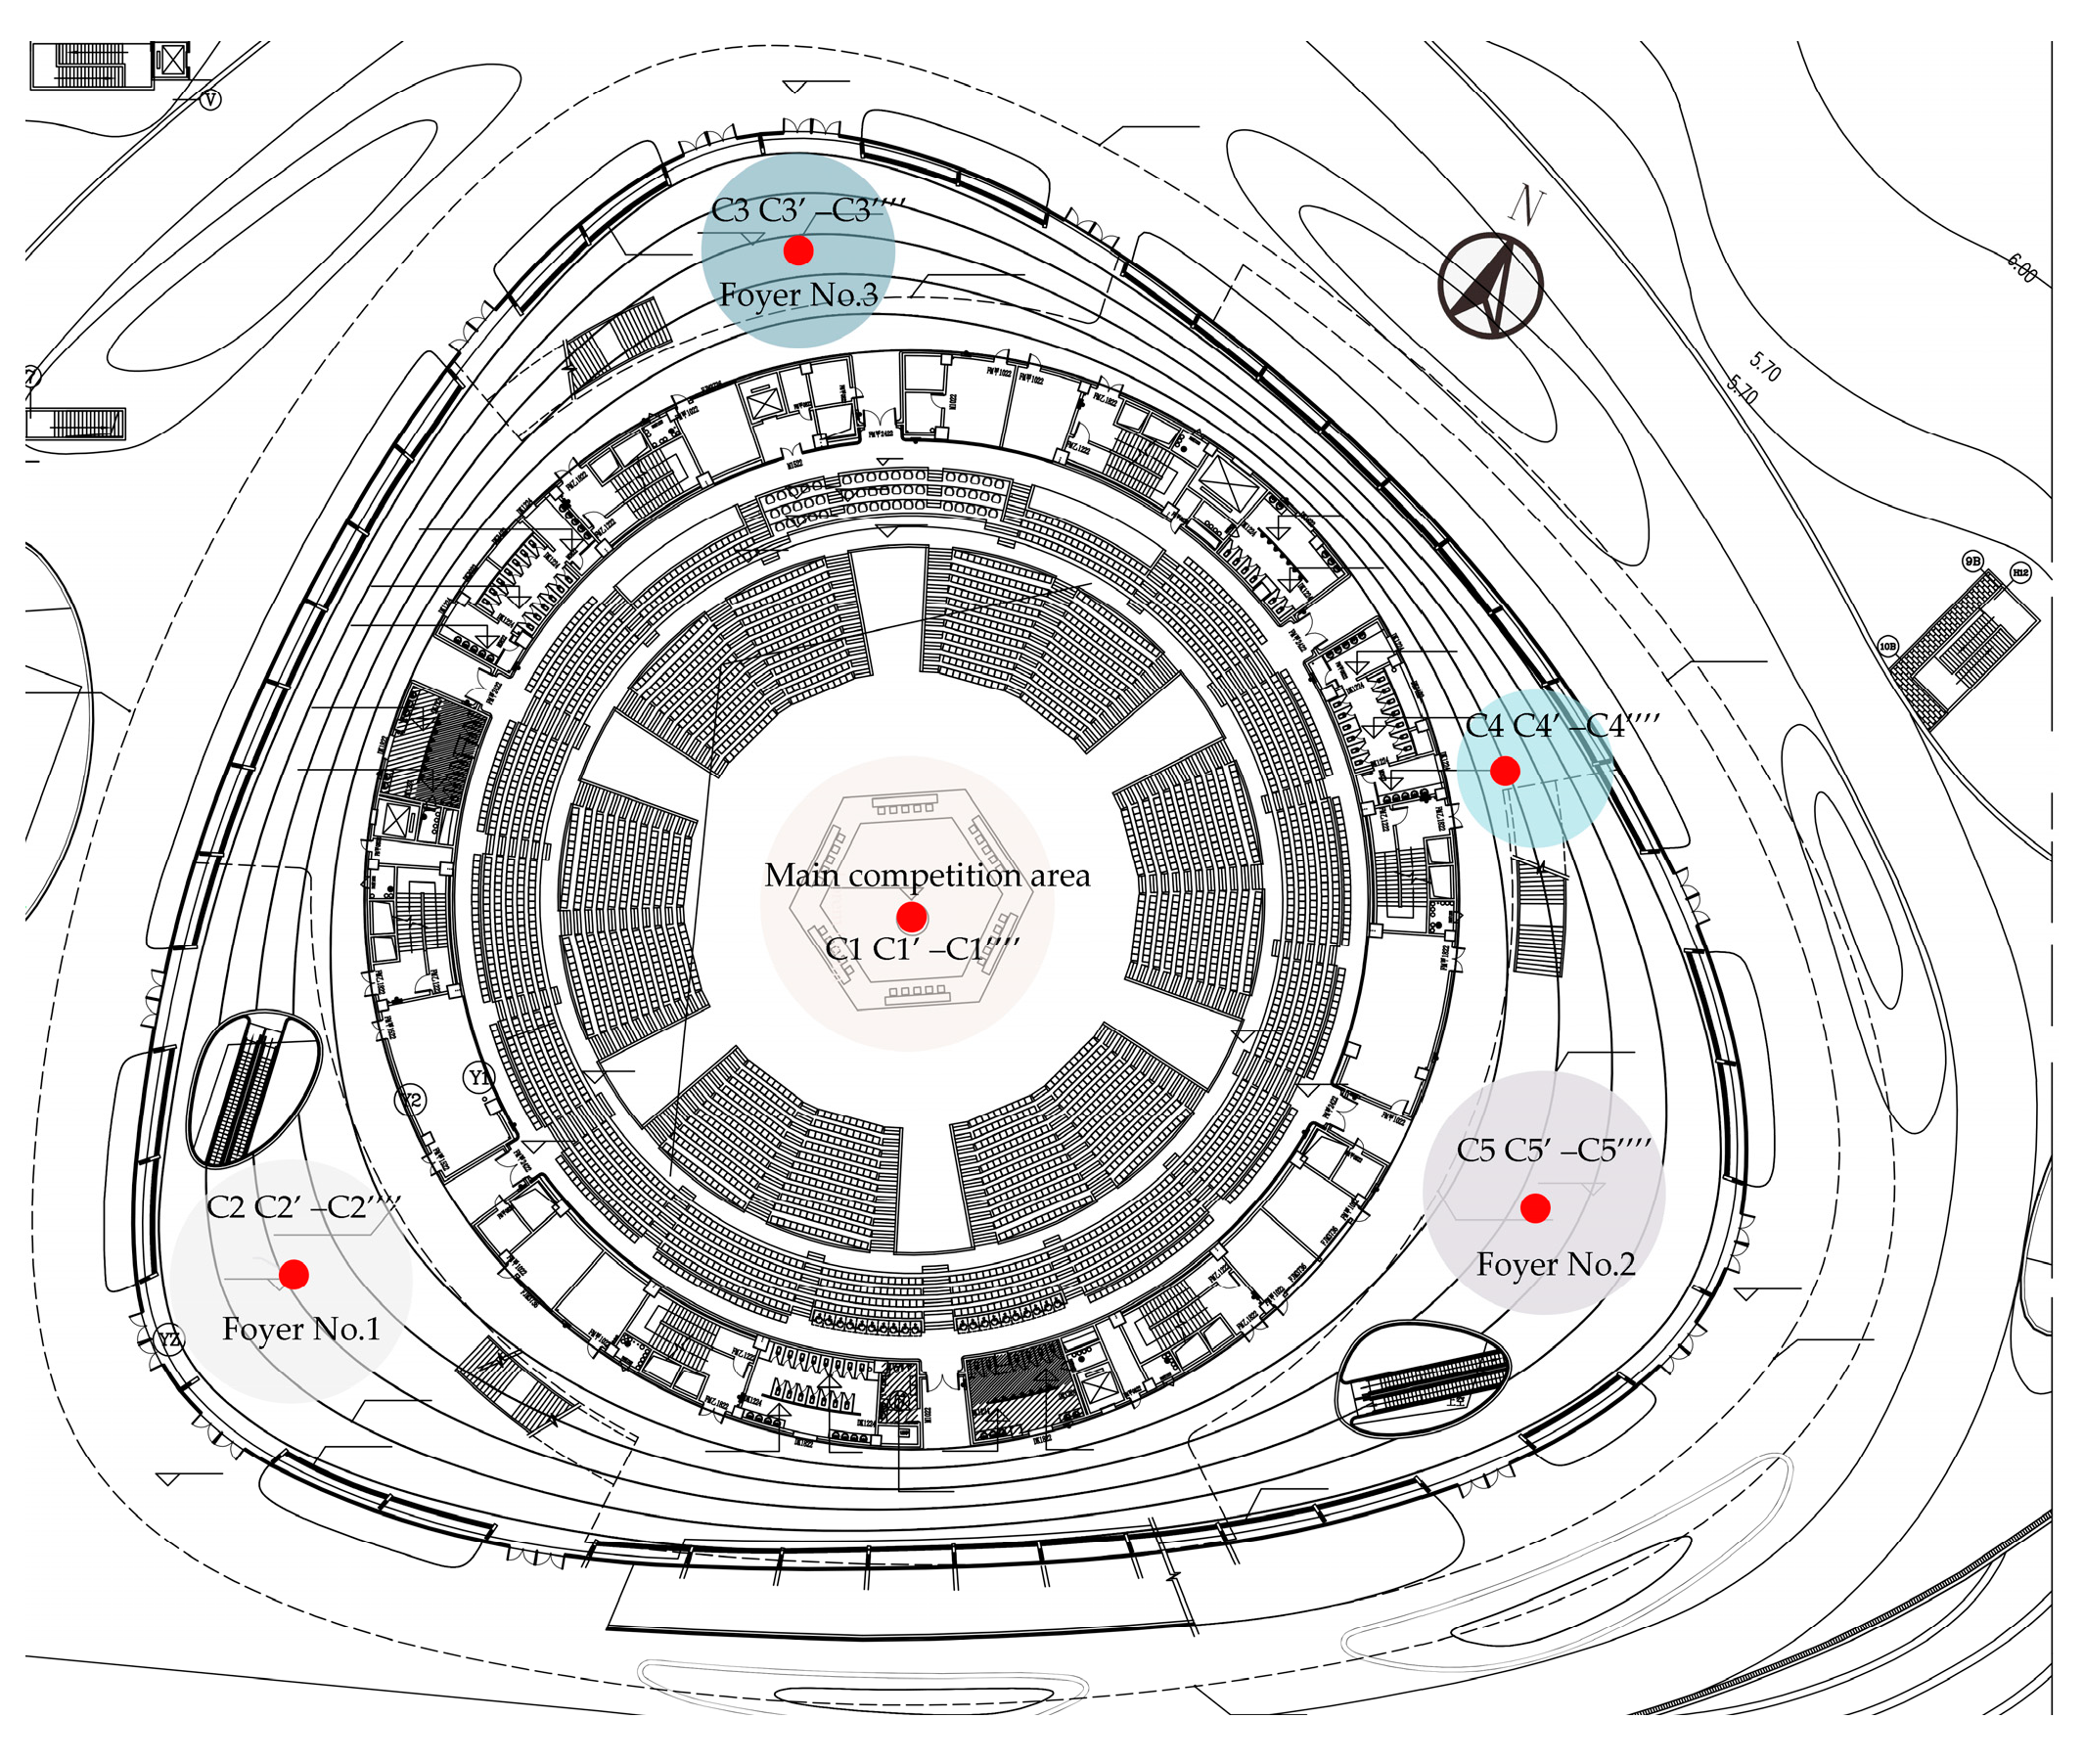
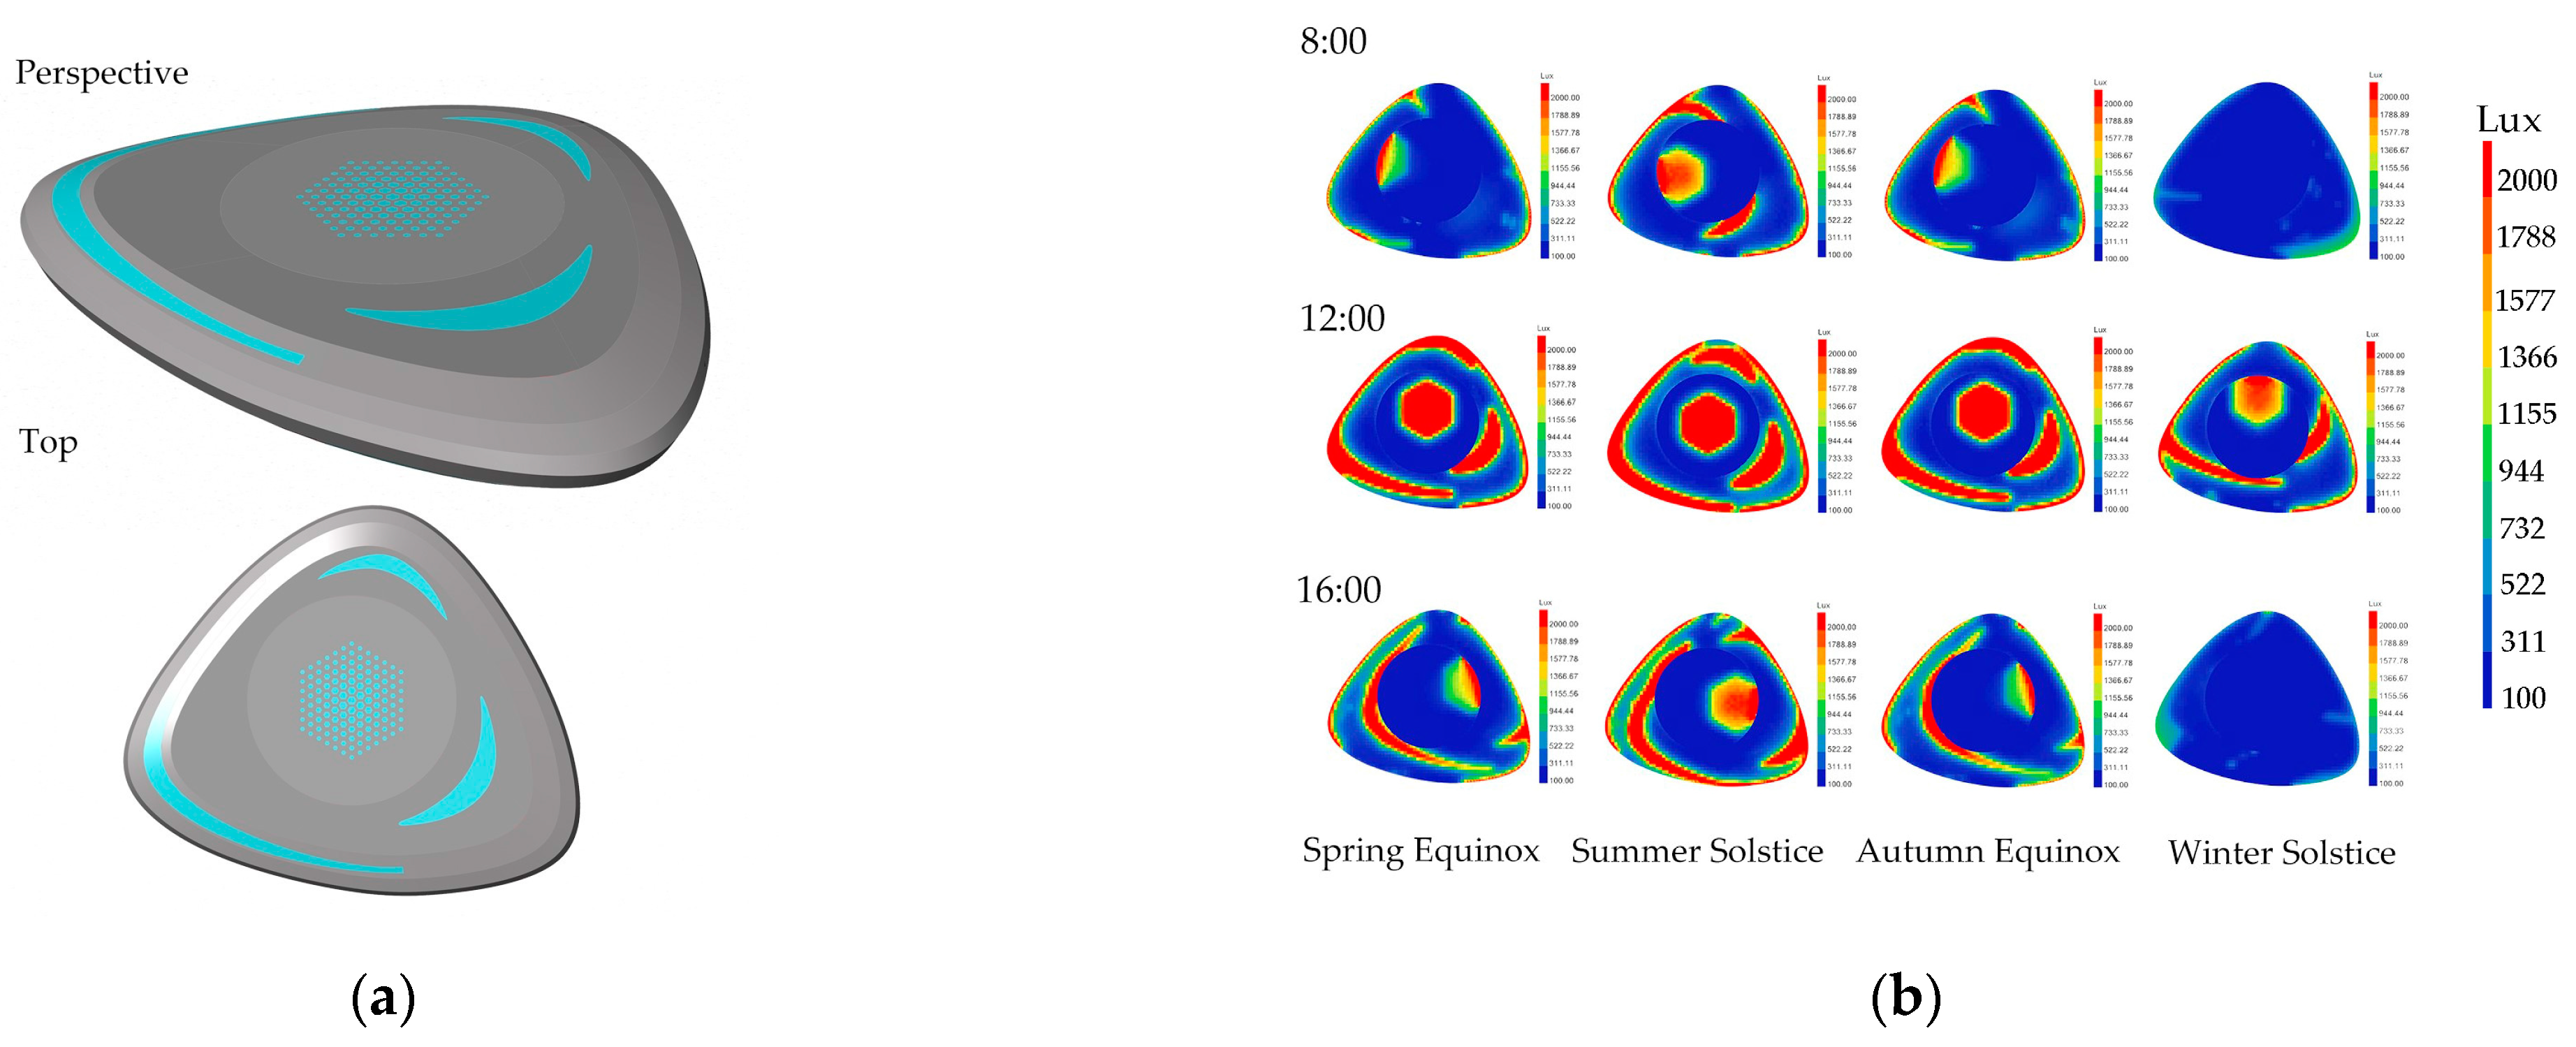
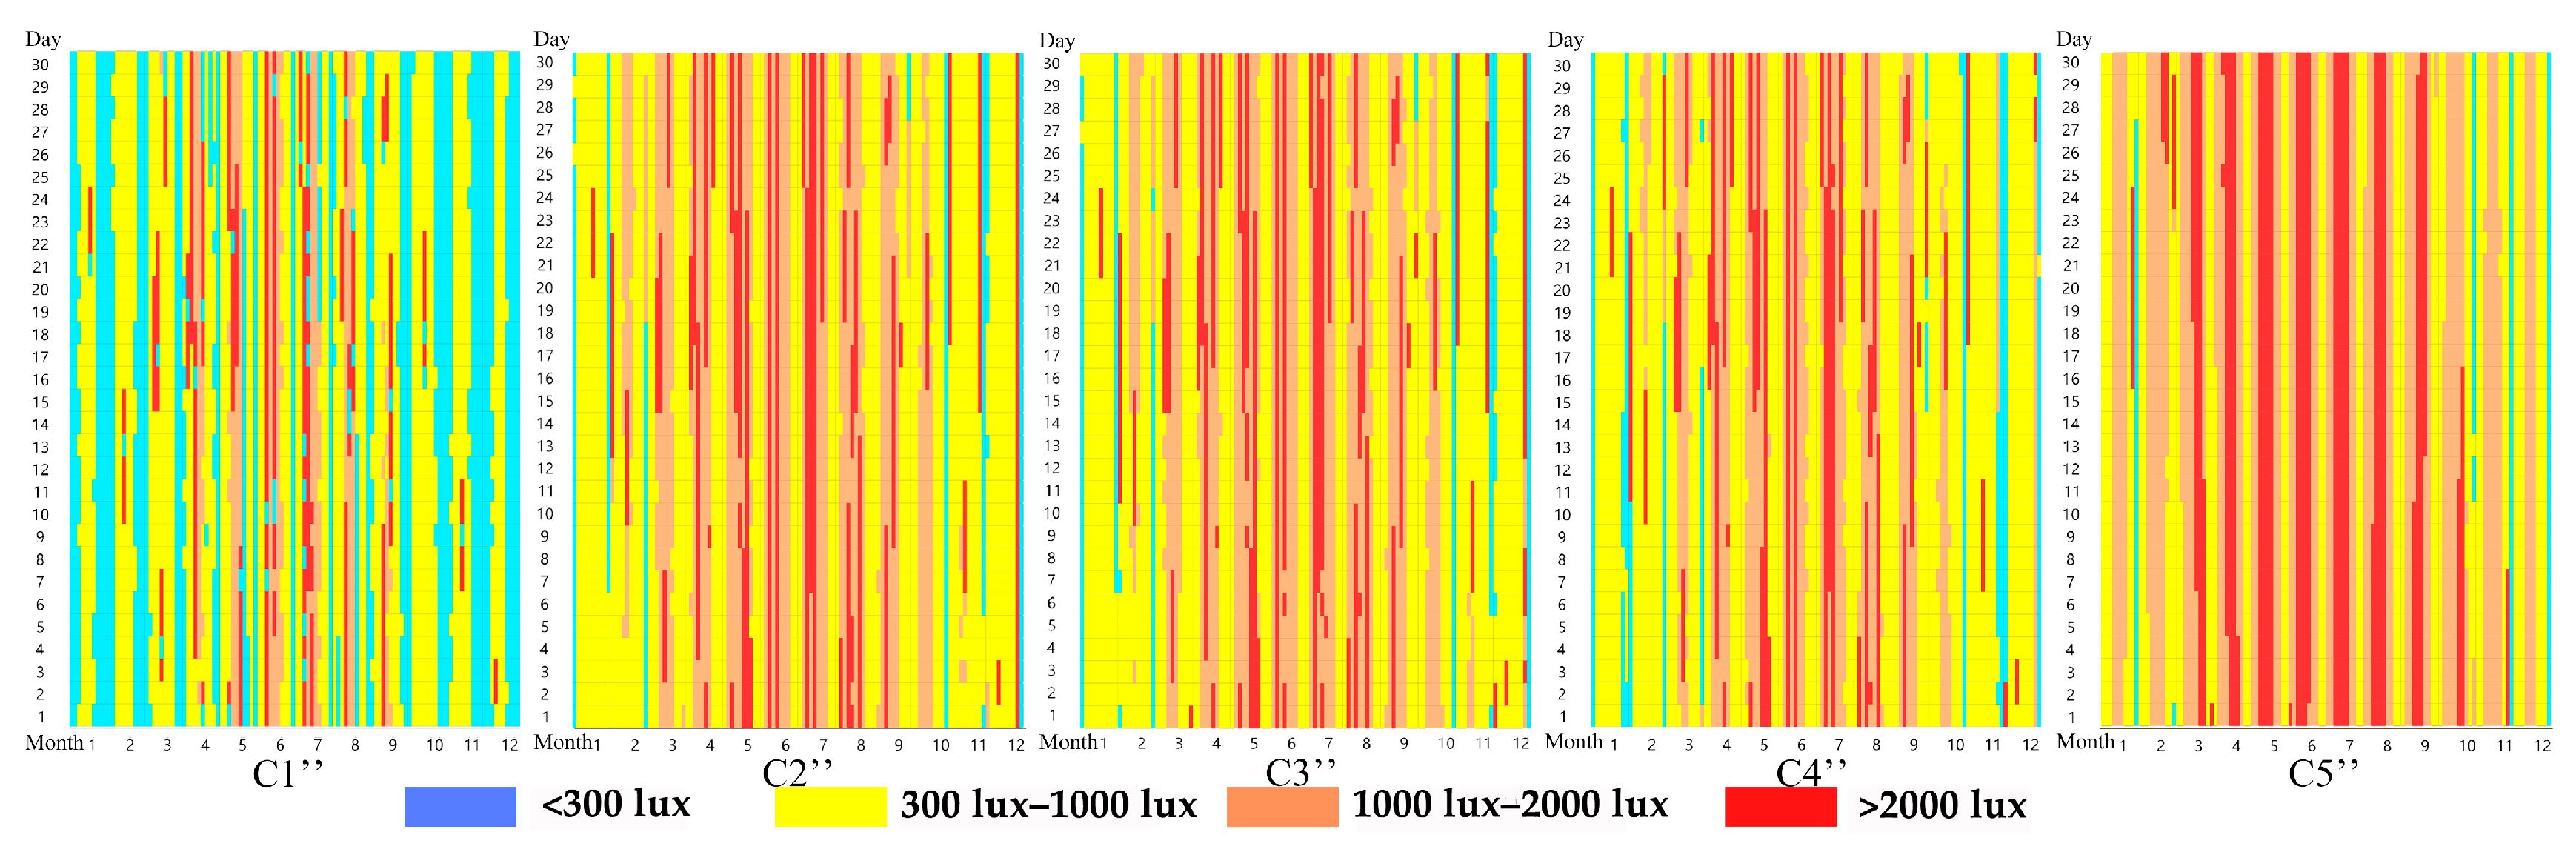
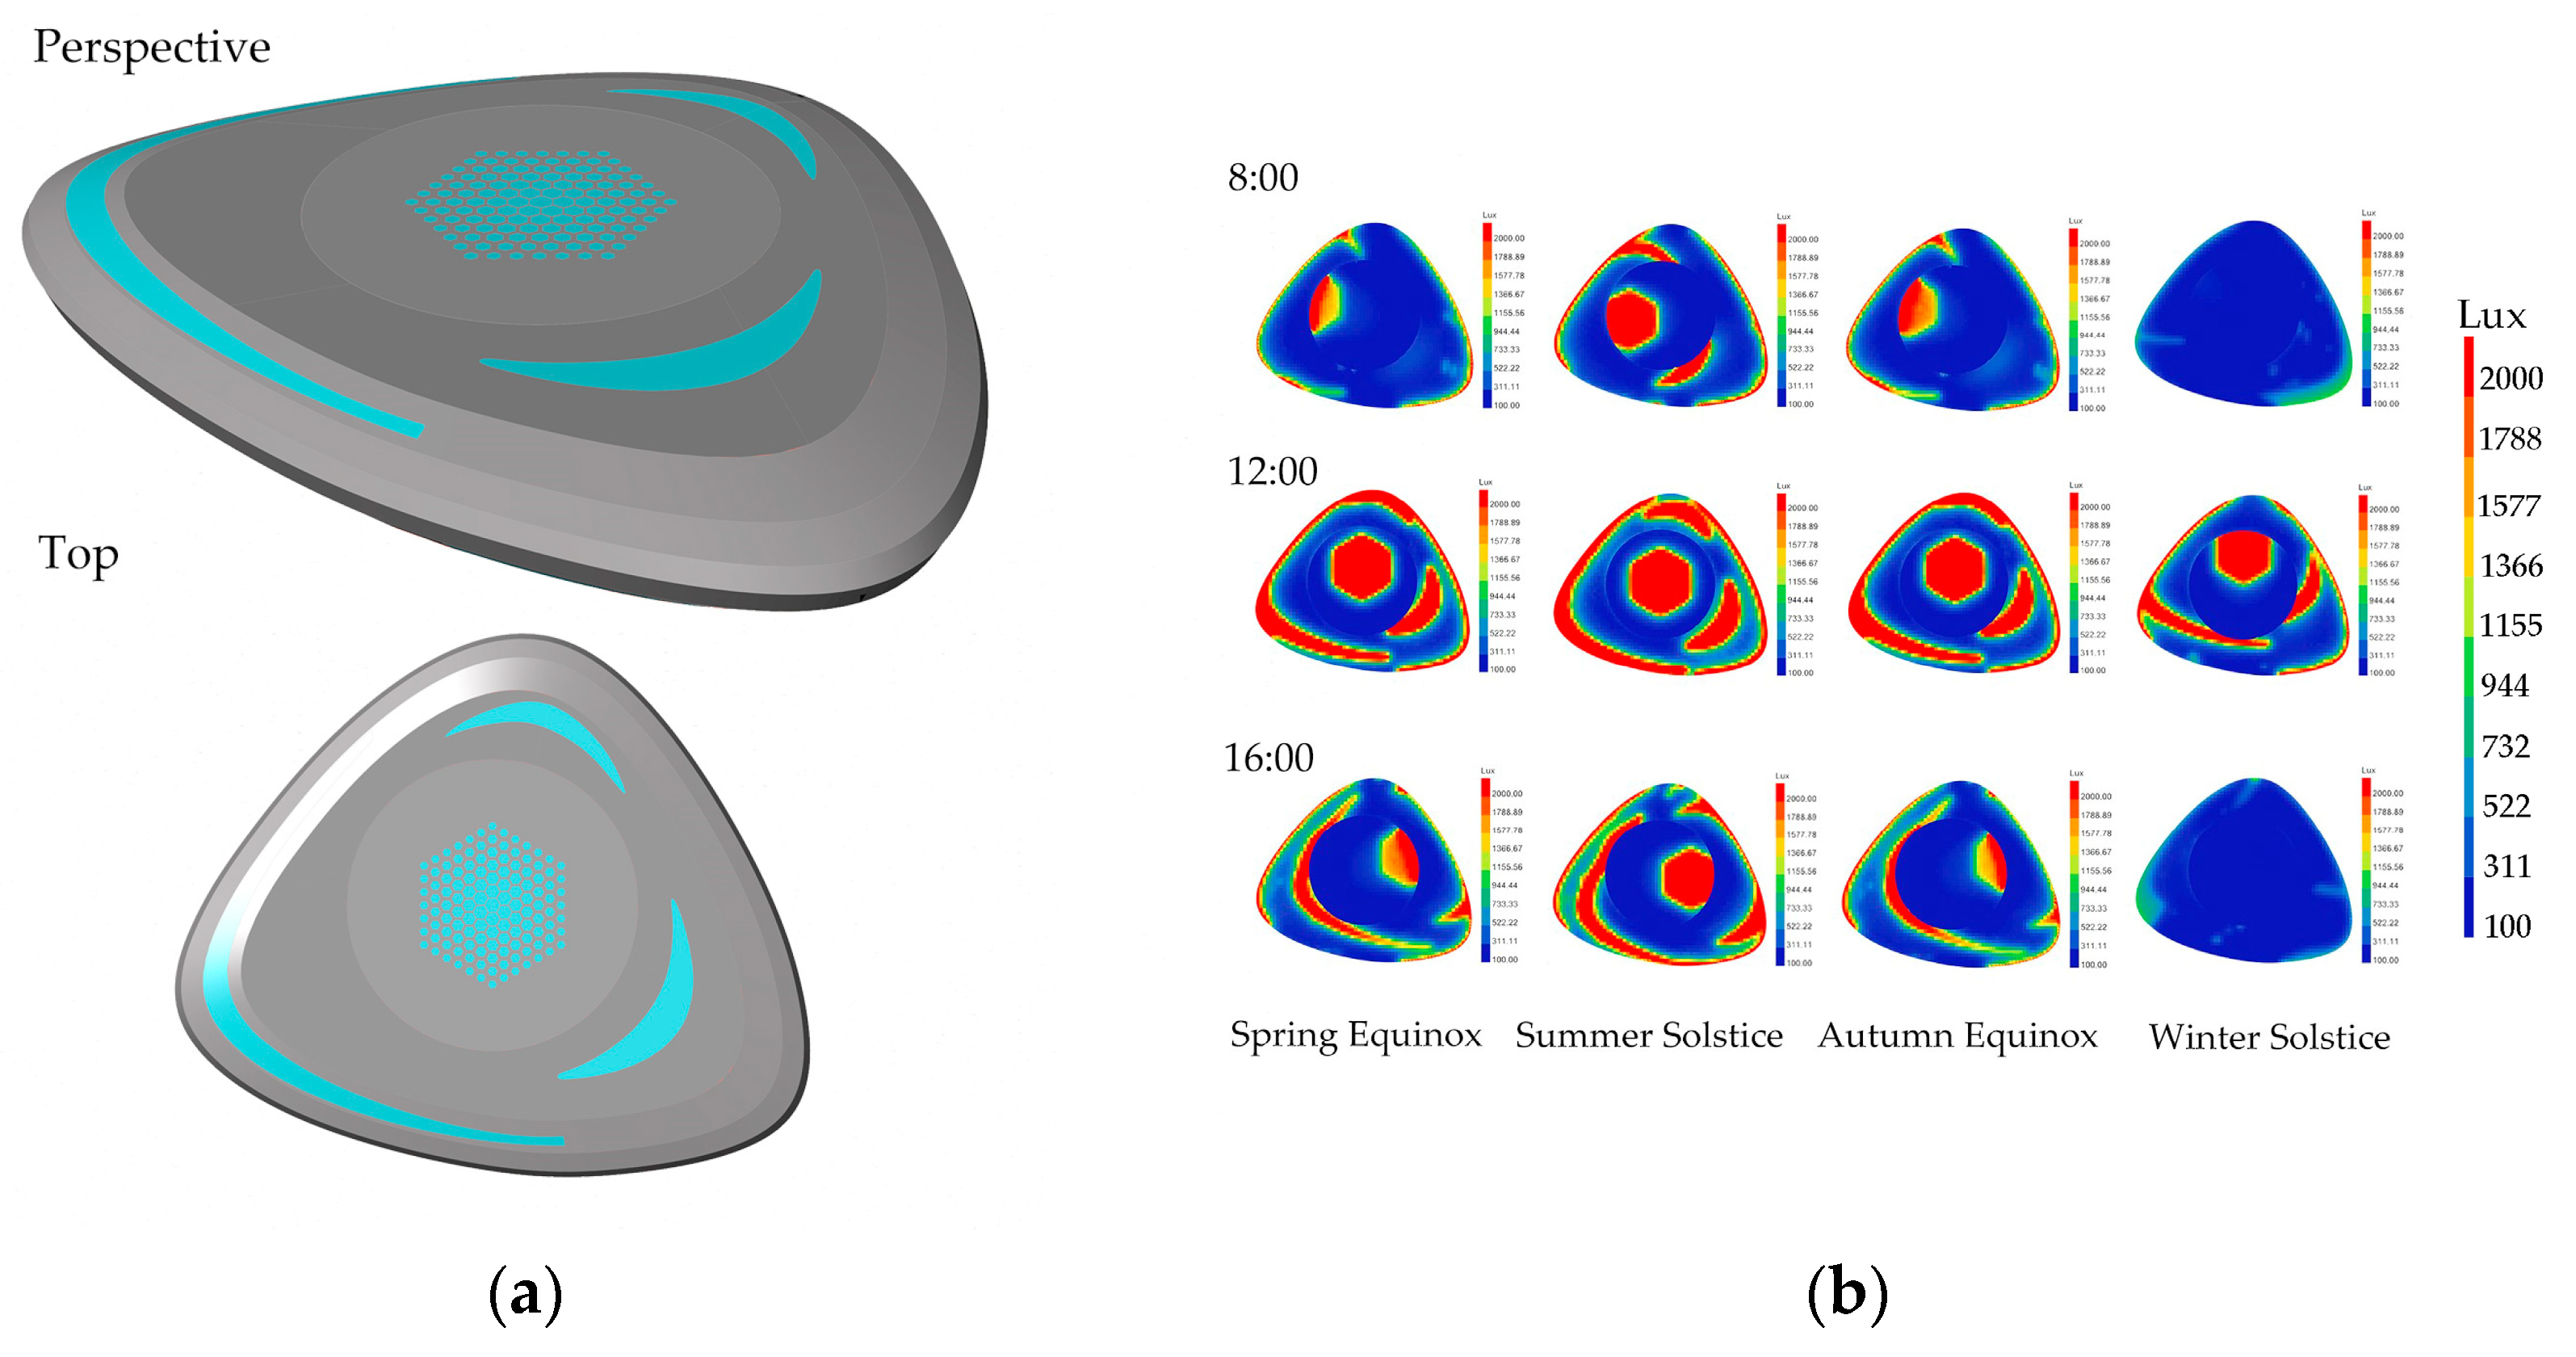
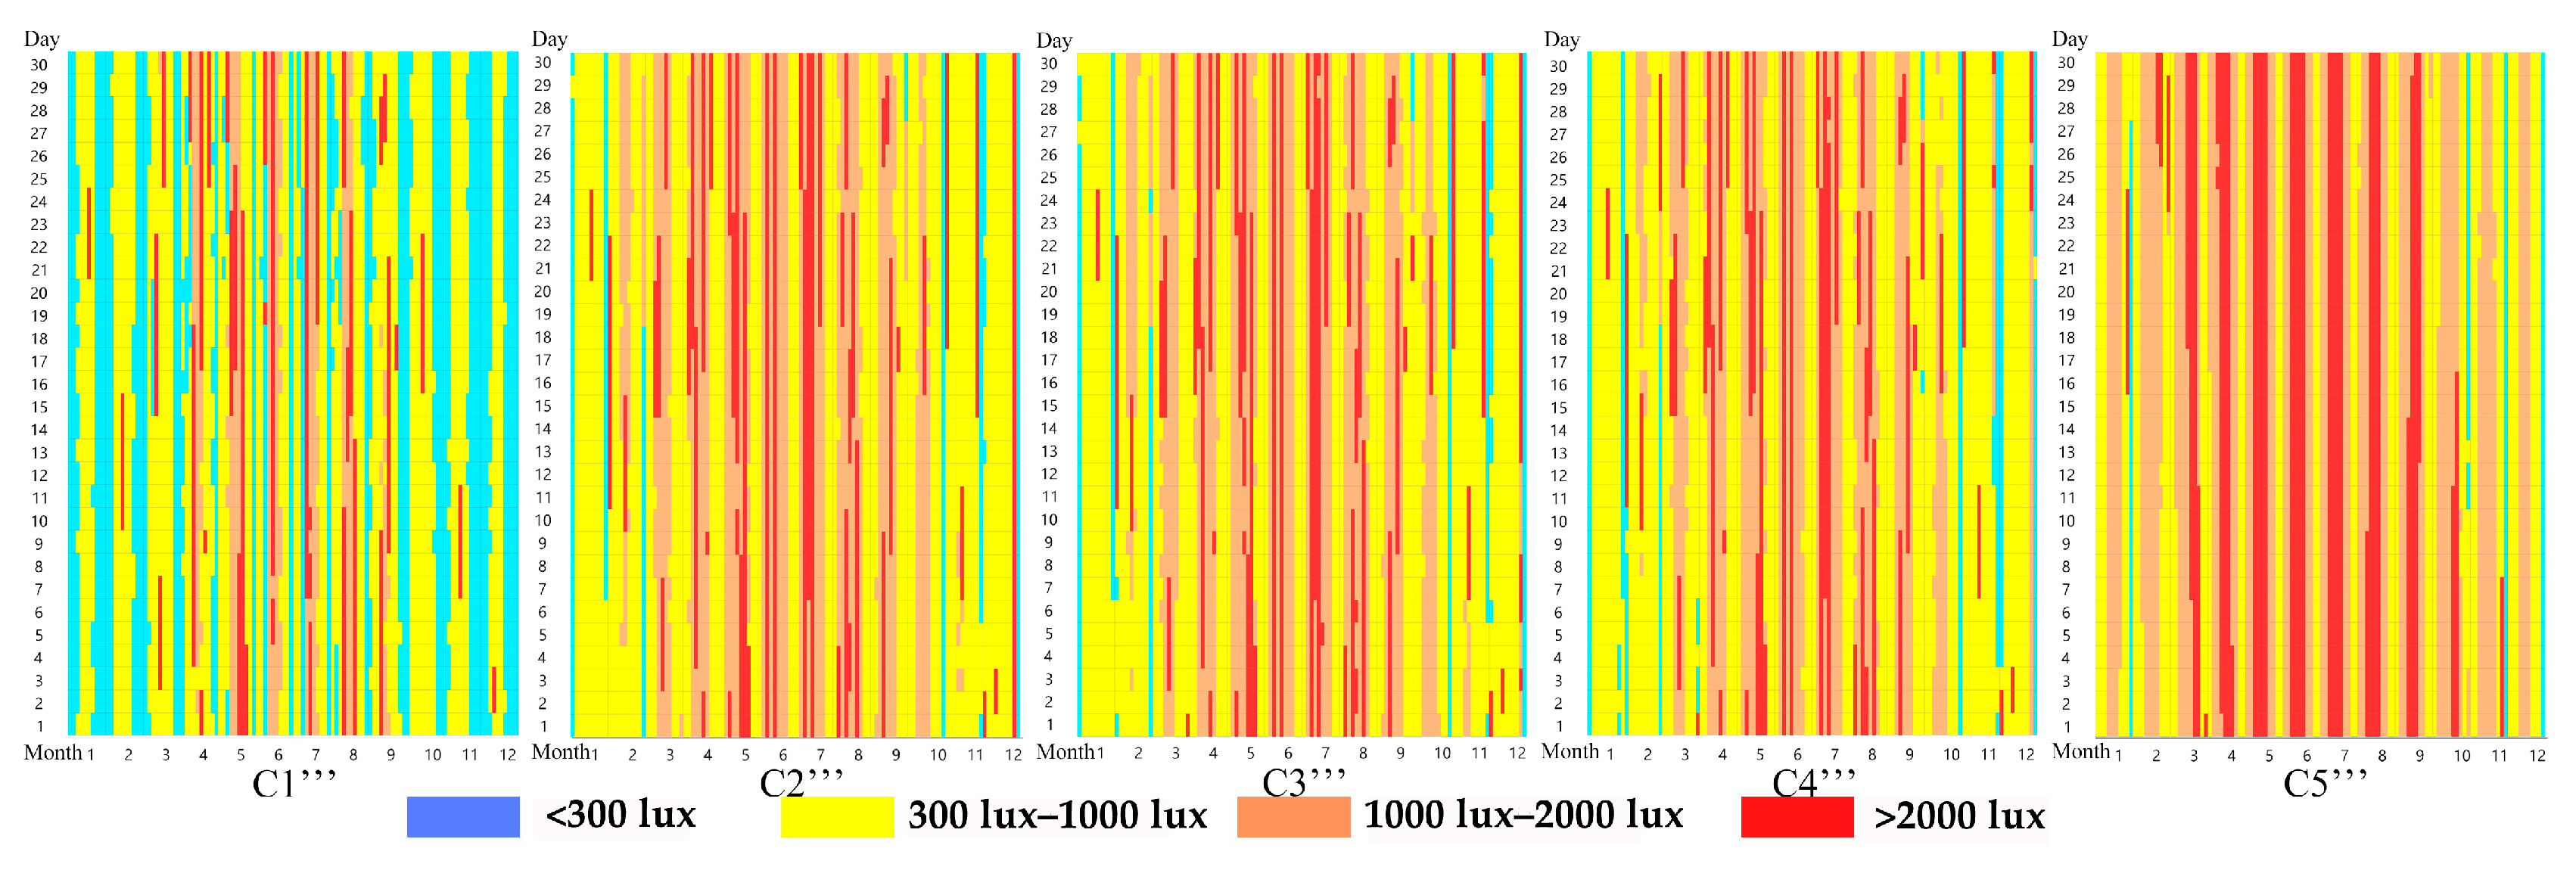
2.5. Daylighting Evaluation Area Division Thought
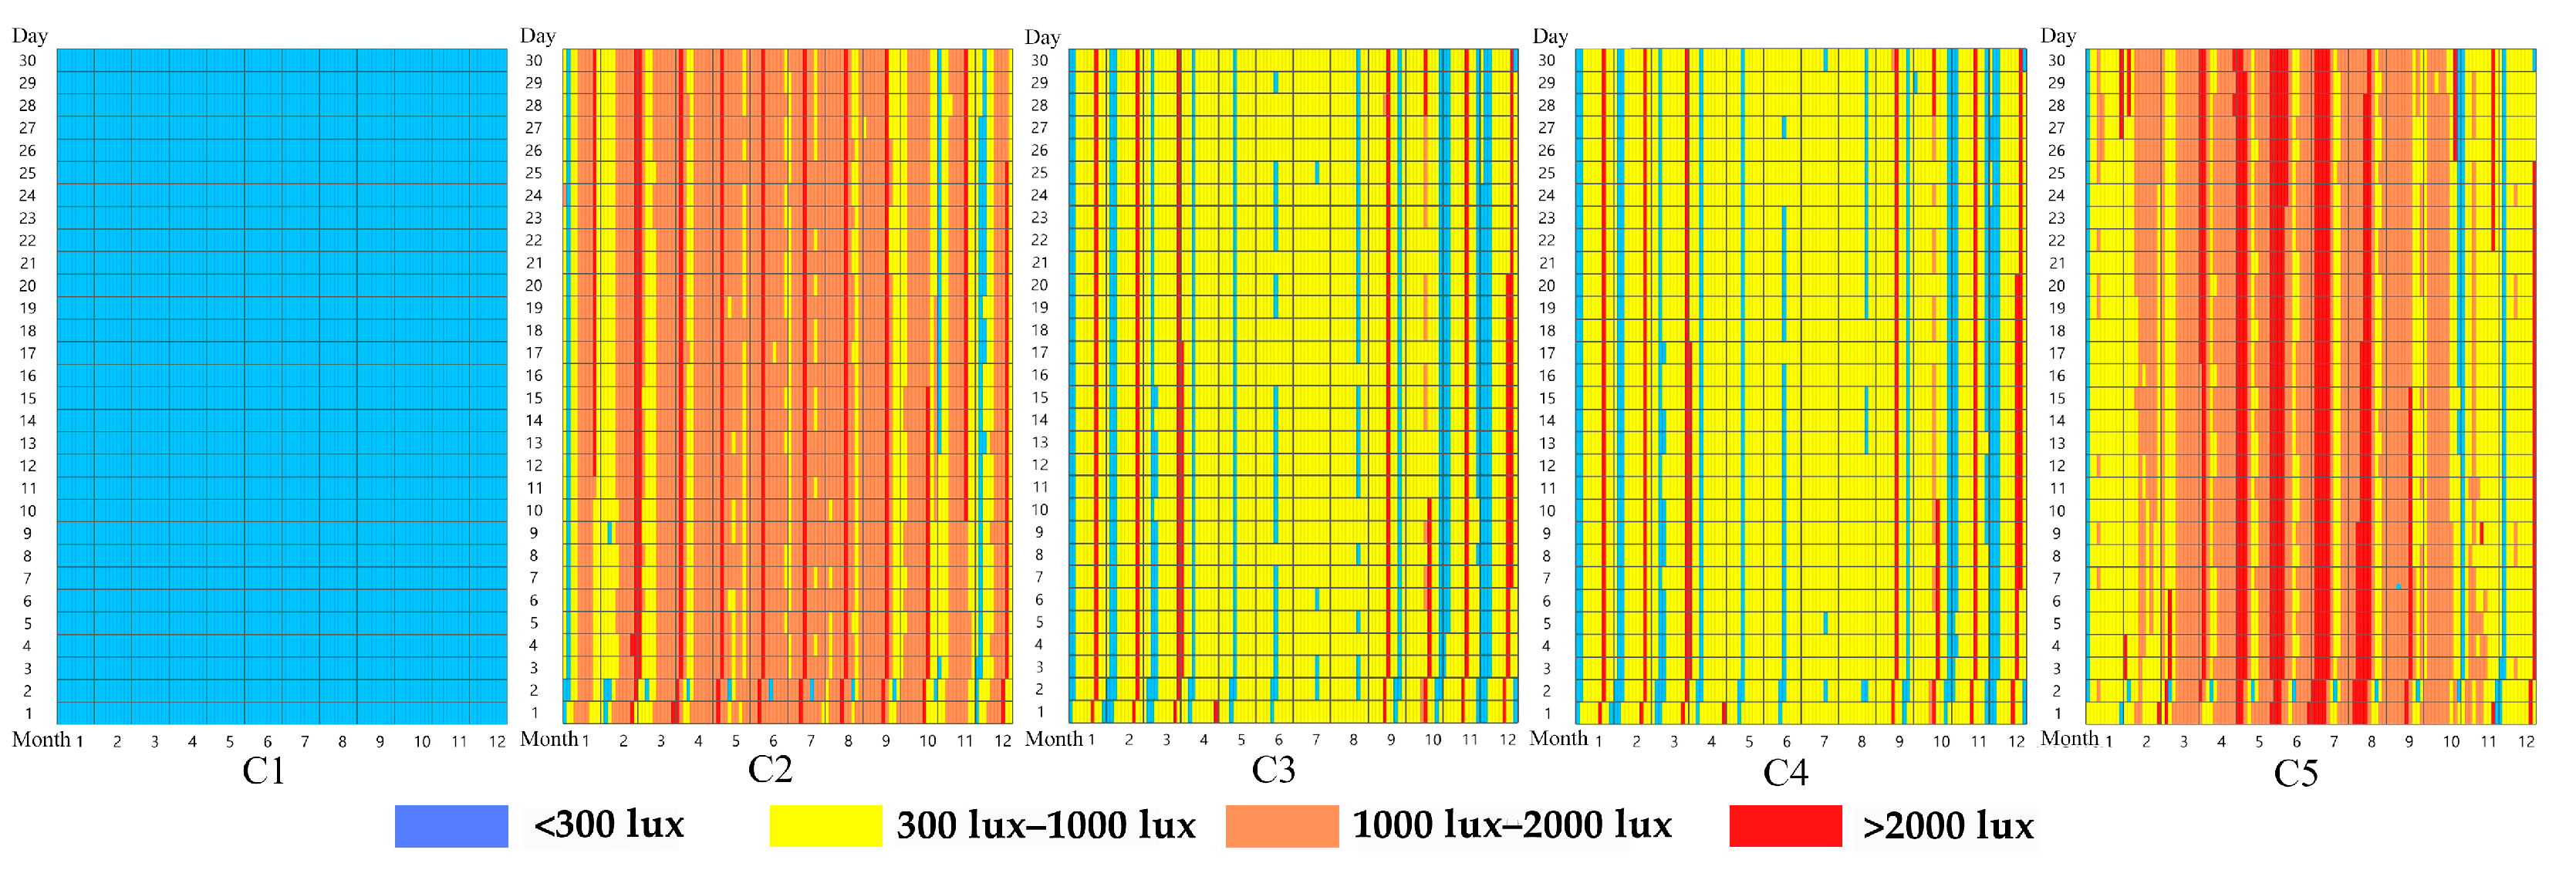
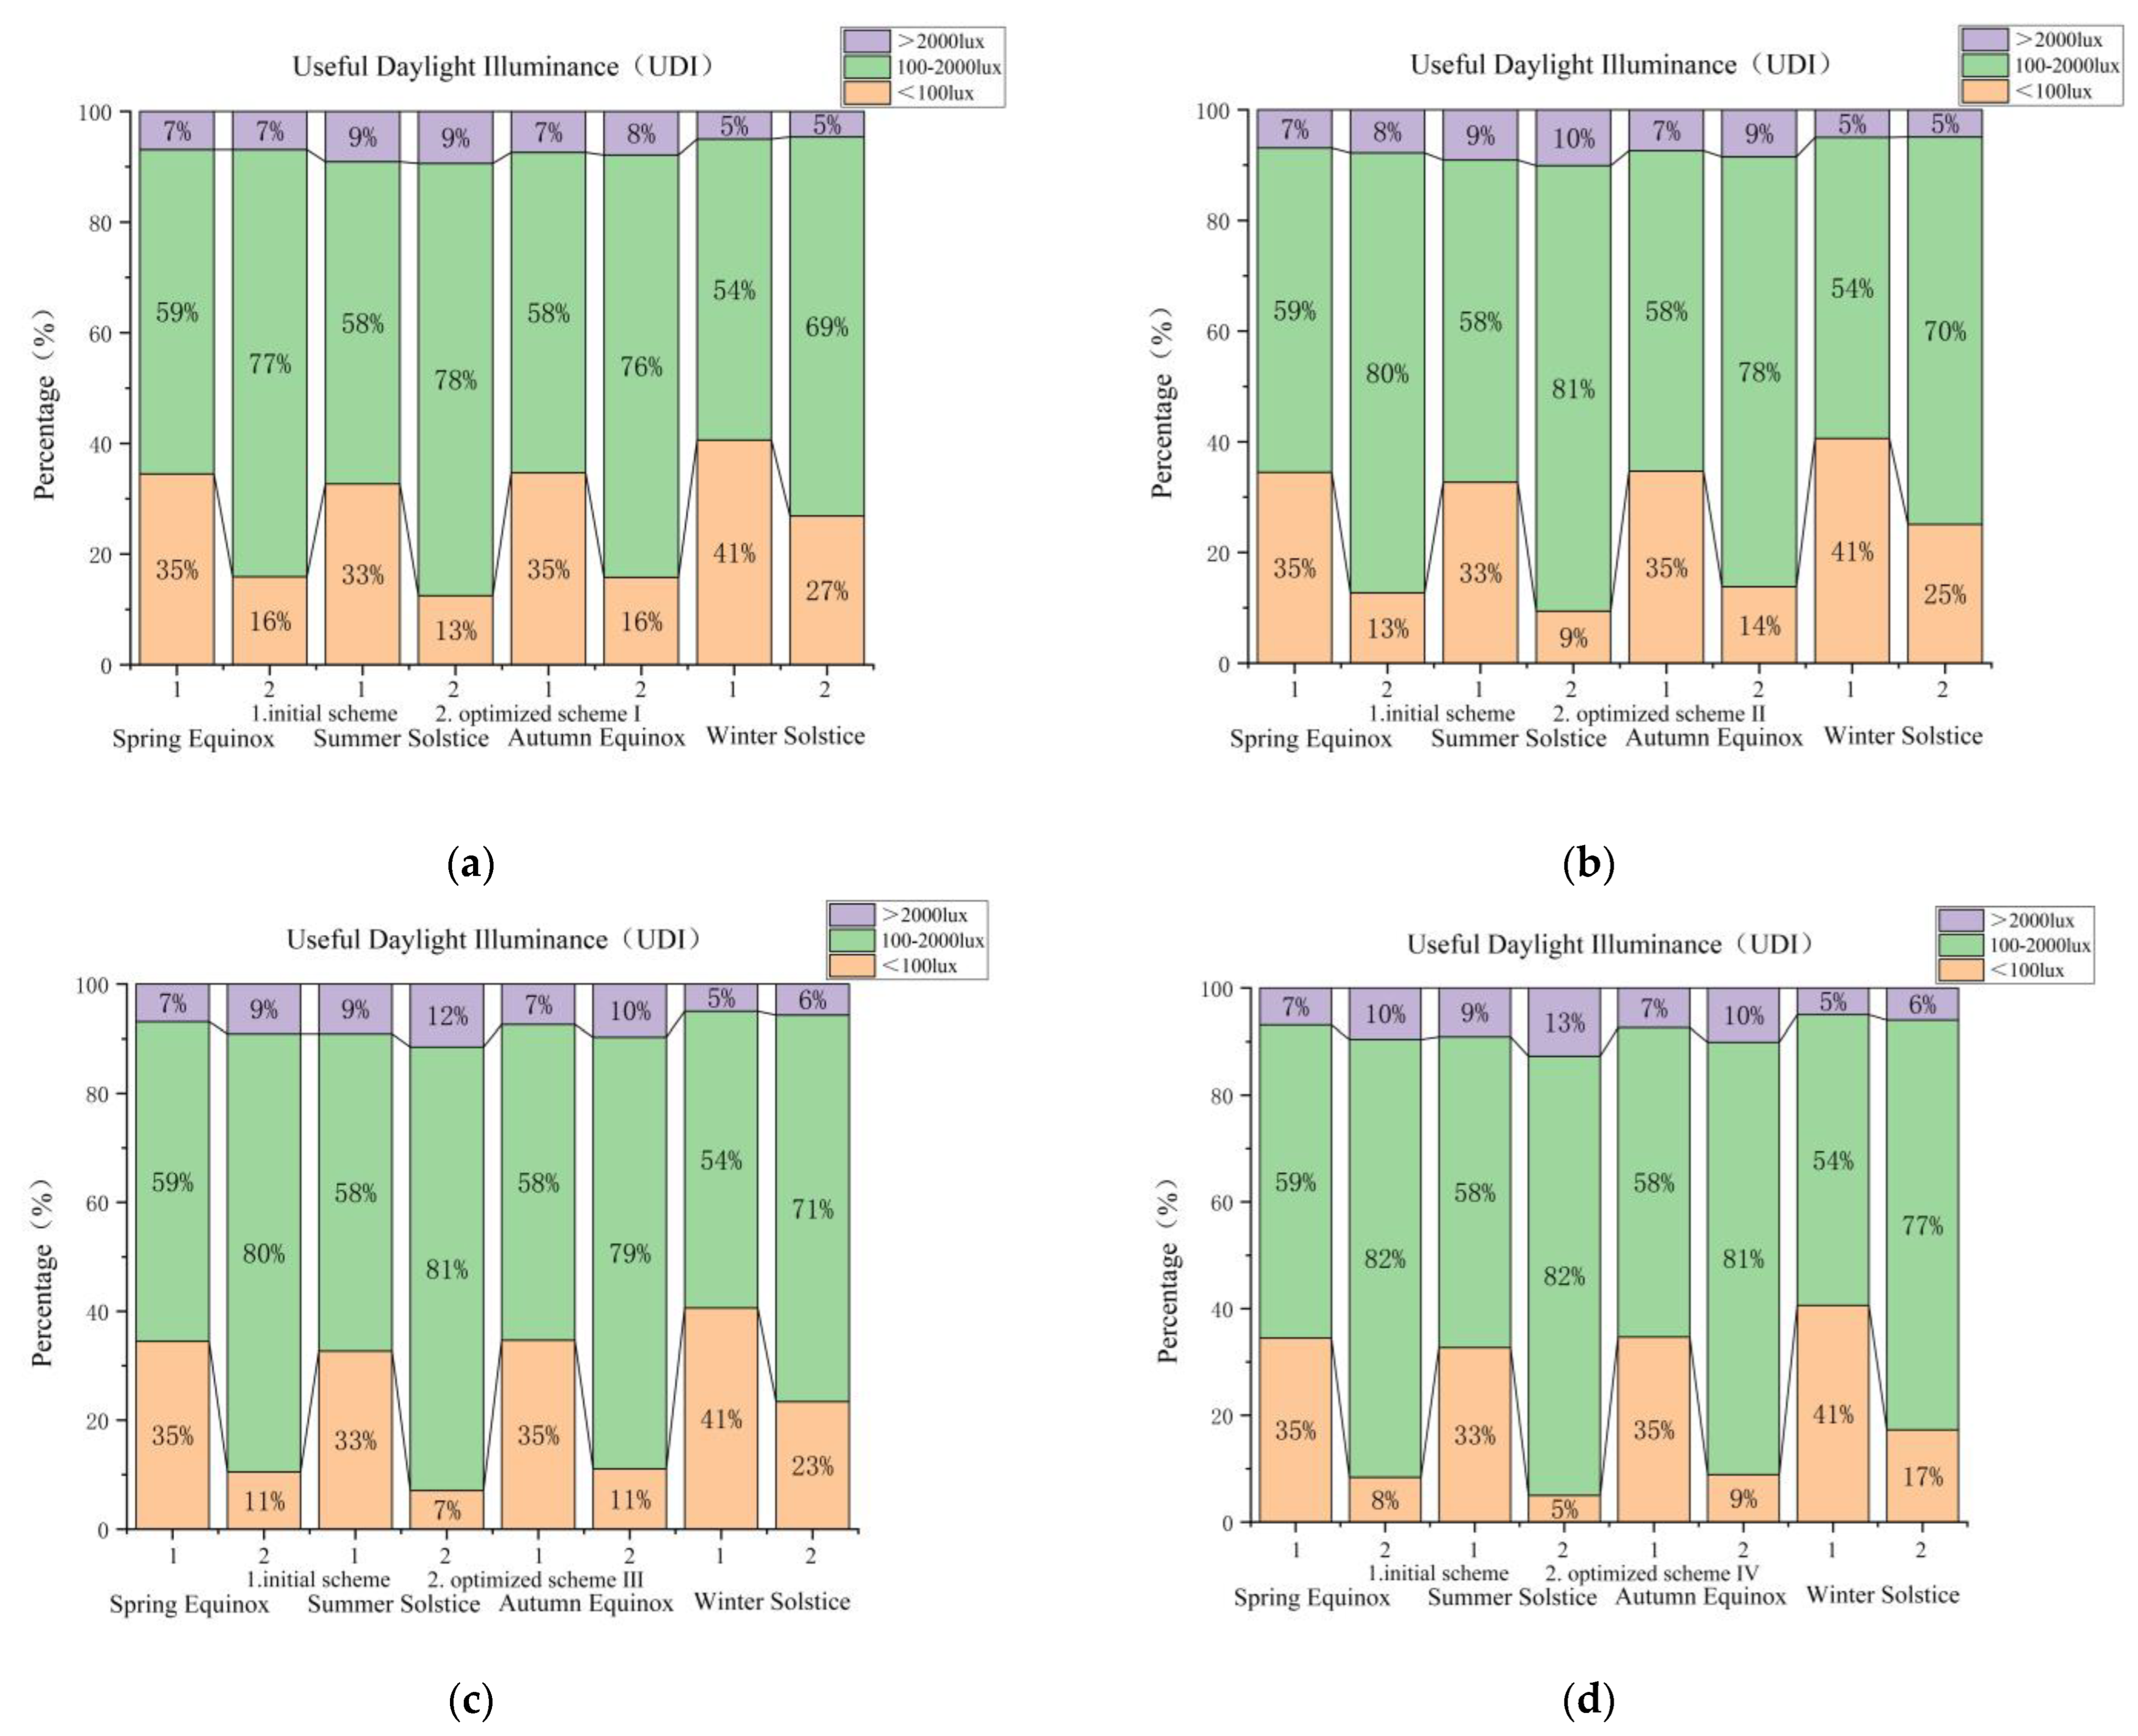
In terms of functional division, the Hangzhou E-sports Center is mainly divided into the main competition area, spectator area, rest area (for athletes, referees, etc.), and entrance hall. Without considering the underground space, the main competition area accounts for 18% of the total area, the spectator area accounts for 20% of the total area, the rest area accounts for 21% of the total area, and the entrance hall accounts for 36% of the total area. This study was conducted to better evaluate the indoor light environment quality of the main use function space under the influence of dynamic outdoor light environment changes. Due to the large number of layers in the audience area and rest area, the influencing factors are difficult to control, and it is difficult to simulate the use areas throughout the year. Therefore, this study conducts a year-round evaluation and analysis of the selected daylighting areas in the entrance hall and the main competition area, and uses representative days (spring equinox, summer solstice, autumn equinox, and winter solstice) to evaluate the main usage areas. As shown in Figure 4 and Table 4, the measurement areas are divided into the initial design measurement areas (C1–C5), the scheme optimization I measurement areas (C1′–C5′), the scheme optimization II measurement areas (C1″–C5″), the scheme optimization III measurement areas (C1‴–C5‴), and the scheme optimization IV measurement areas (C1⁗–C5⁗). The daylighting methods are divided into side window daylighting, skylight daylighting, and mixed daylighting, where the mixed daylighting method combines side window and skylight daylighting.

3. Results

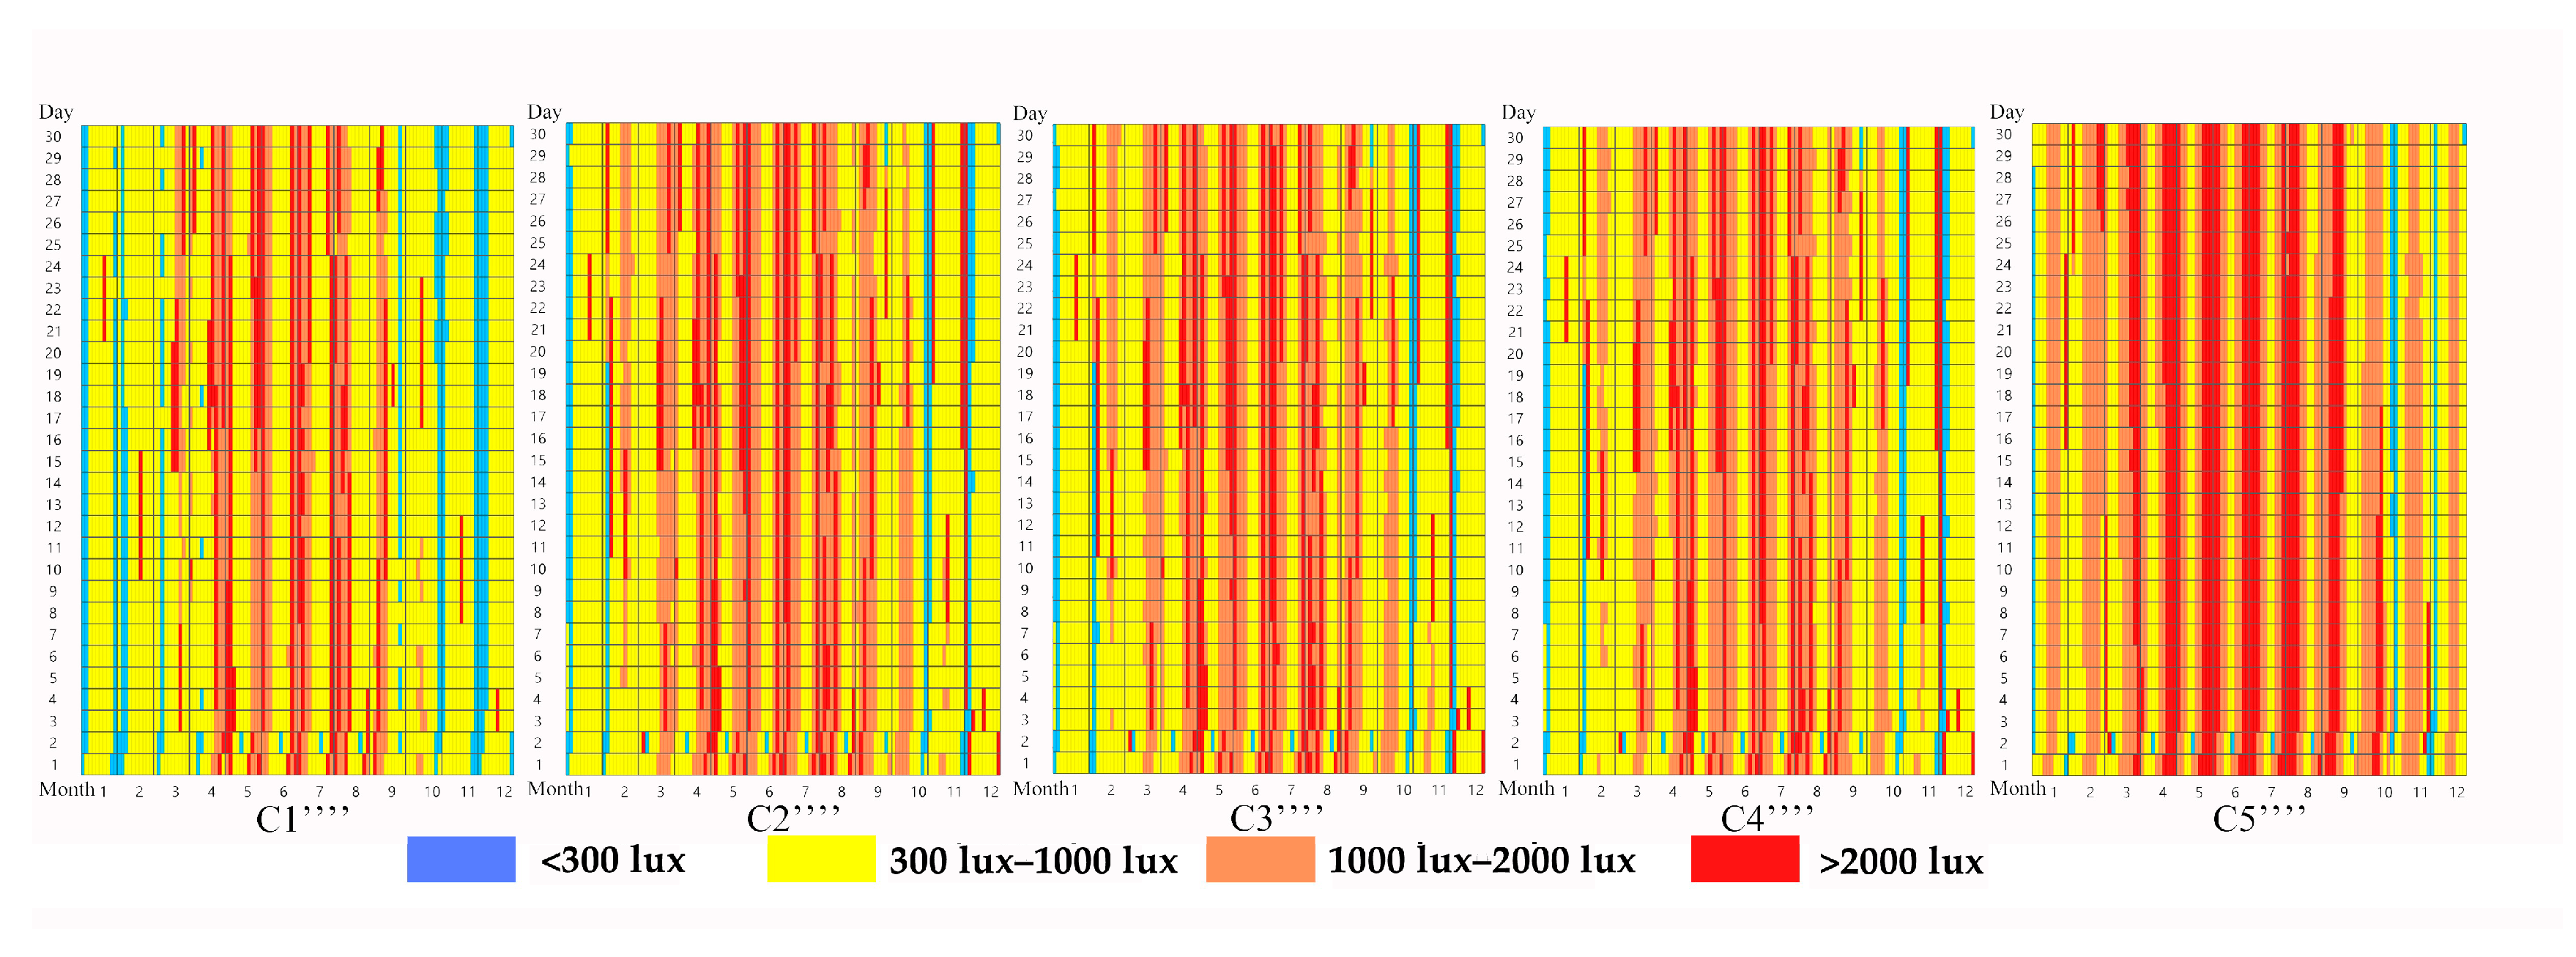
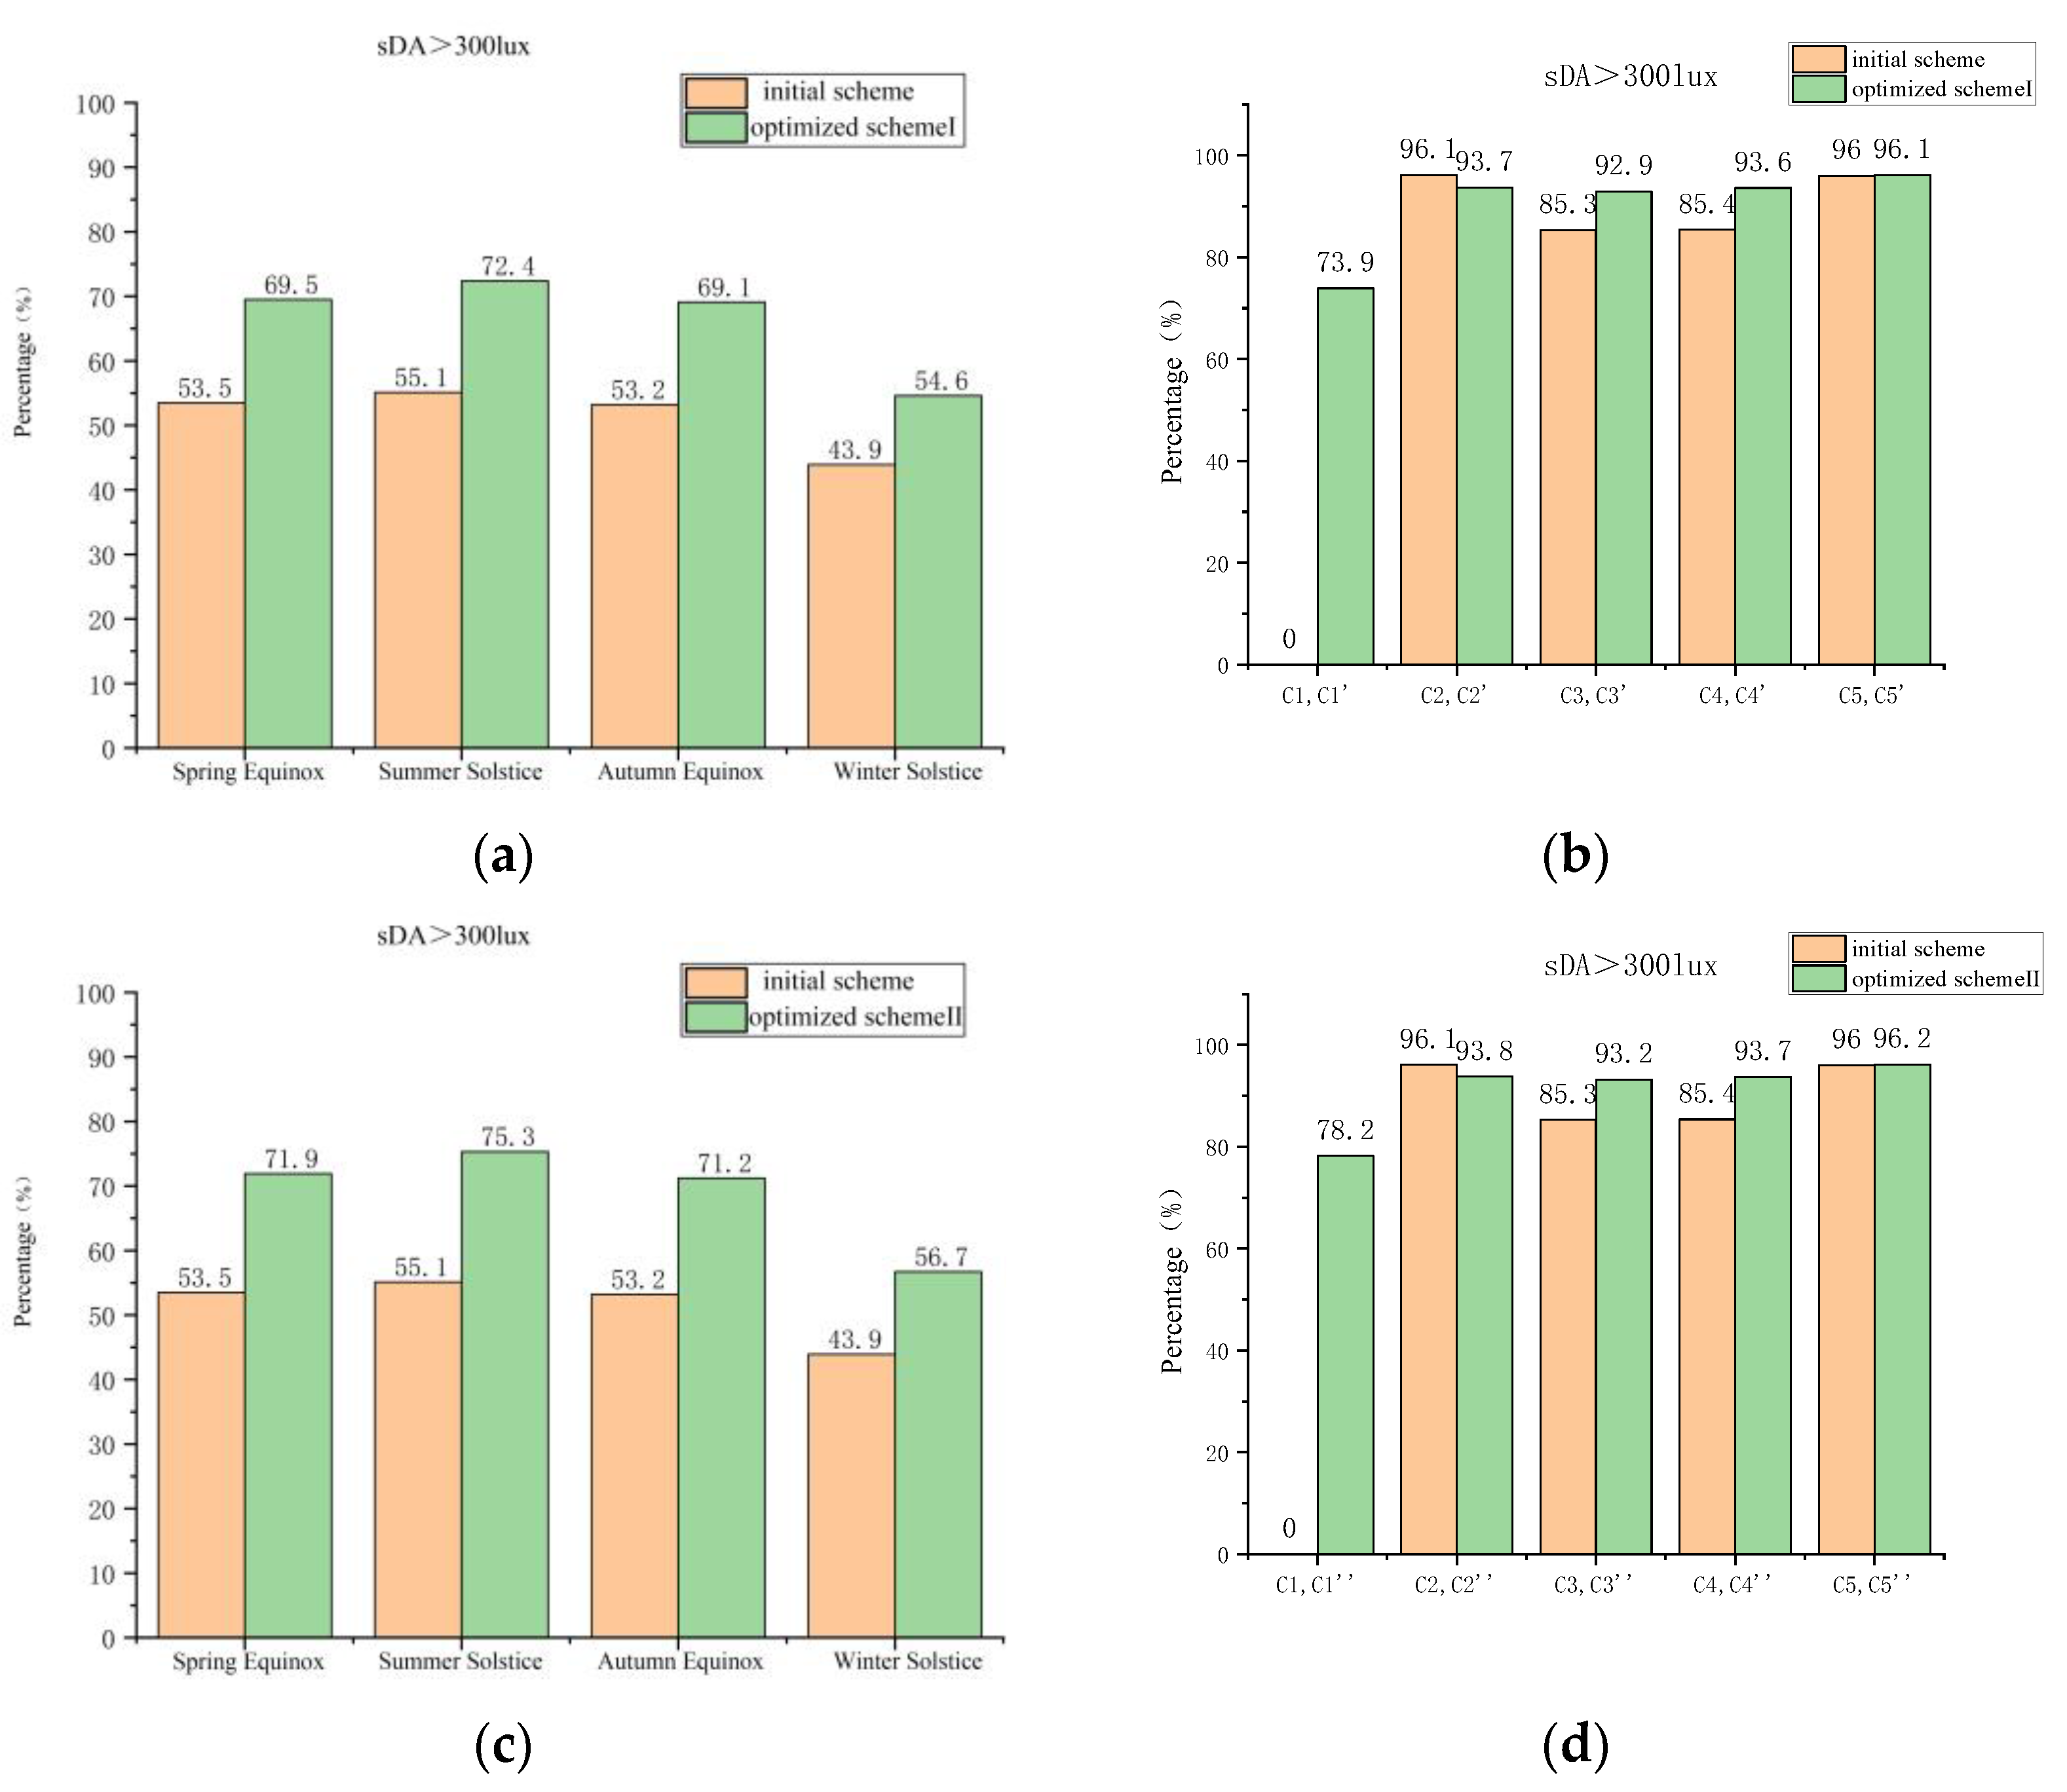
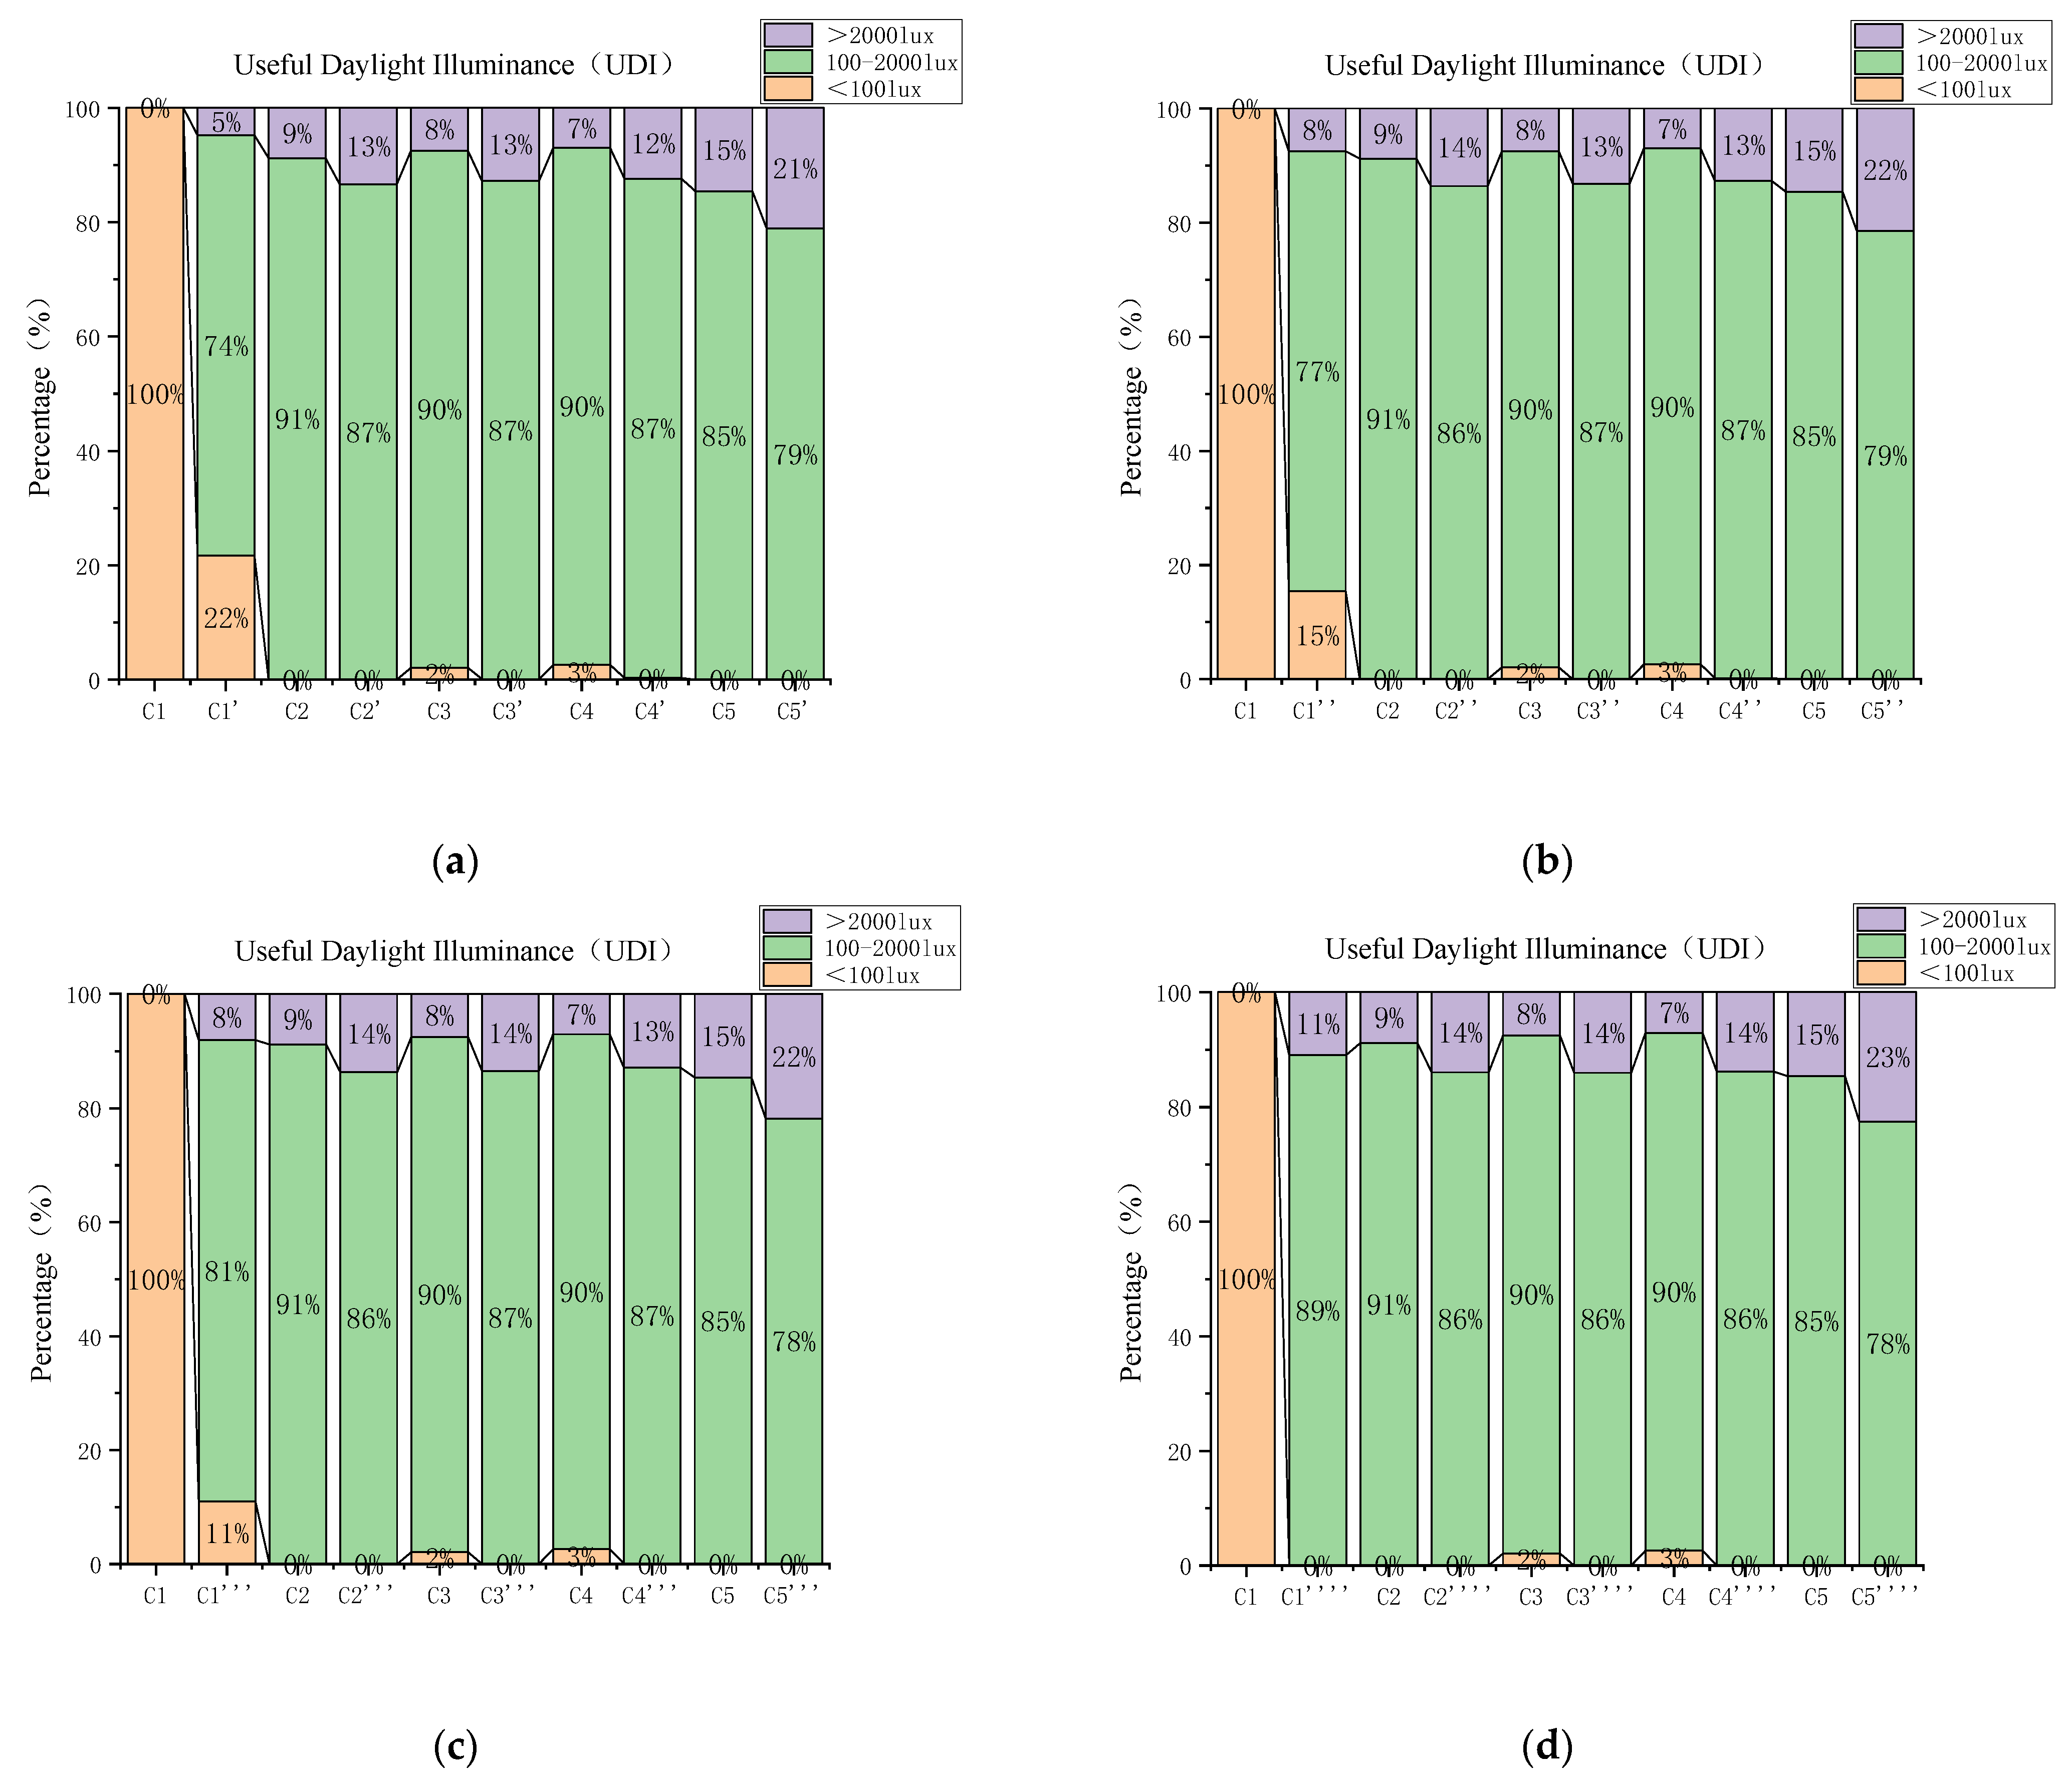
3.1. Dynamic Daylighting Evaluation Analysis of the Initial Scheme

The initial scheme model is shown in Figure 5a, and it shows the window layout of the preliminary scheme. Figure 5b displays the daylighting conditions representing the spring equinox, summer solstice, autumnal equinox, and winter solstice at 8:00 a.m., 12:00 p.m., and 4:00 p.m. Under the initial scheme condition, the overall daylighting conditions in the main indoor area from 8:00 a.m. to 5:00 p.m. are shown in Table 5. On the basis of the above dynamic daylighting evaluation indicators, there was an sDA >300 lux that was above 50.0% for the spring equinox, summer solstice, and autumnal equinox, but was relatively low at 43.9% for the winter solstice. Regarding the changes in UDI during different typical periods throughout the year, a UDI of 100–2000 lux >55% was still concentrated in the spring equinox, summer solstice, and autumnal equinox, while a UDI <100 lux reached 40.7% at the winter solstice, indicating a significant increase in areas with low daylighting.
The annual daylight distribution of the selected areas within the main functional zones of the Hangzhou E-sports Center is shown in Figure 6. The horizontal axis represents the months from January to December, and the vertical axis represents the days of each month from 1 to 30. From the comparison of the annual daylight changes in different areas, it can be noted that the C1 area was significantly lower, and all of the areas were below 300 lux. The C3 and C4 areas had relatively uniform daylight throughout the year, with most periods ranging from 300 to 2000 lux. When comparing C3 and C4 to C2 and C5, the time of daylight exceeding 2000 lux was significantly longer in the C2 and C5 areas than in the C3 and C4 areas. Regarding the distribution in different months, the months with daylight exceeding 2000 lux in the C2 area were mainly from February to September, whereas, in the C5 area, they were mainly from May to August.
The dynamic distribution of daylight in different areas throughout the year is shown in Table 6. According to the analysis of the sDA dynamic daylighting index, it is evident that an sDA >300 lux for the C2, C3, C4, and C5 areas was above 85.0% for all (whereas the data for the C1 area were significantly lower). Furthermore, according to the analysis of the UDI dynamic daylighting index, the C2, C3, and C4 areas had a lighting level ranging from 100 to 2000 lux throughout the year (reaching 90.0%), whereas the C1 area had a lighting level below 100 lux throughout the year.

3.2. Dynamic Daylighting Evaluation Analysis of the Optimized Scheme

In the initial design scheme, it was identified that the C1 area had poor lighting conditions compared to other areas, which had better lighting quality. Therefore, parameterized model adjustments were made specifically targeting the C1 area. Adjustable skylight windows were installed on the roof of the atrium, allowing for parametric modifications. The size of the skylight is reflected by the skylight roof area ratio, which is defined as the ratio of the translucent area of the roof to the total roof area. According to the GB50189-2015 design standard for energy efficiency of public buildings, the translucent area of the roof in large Class A public buildings should not exceed 20% of the roof area. For this optimization plan [80], the skylight roof area ratio was selected within the range of 5–20%, with a step size of 5%.

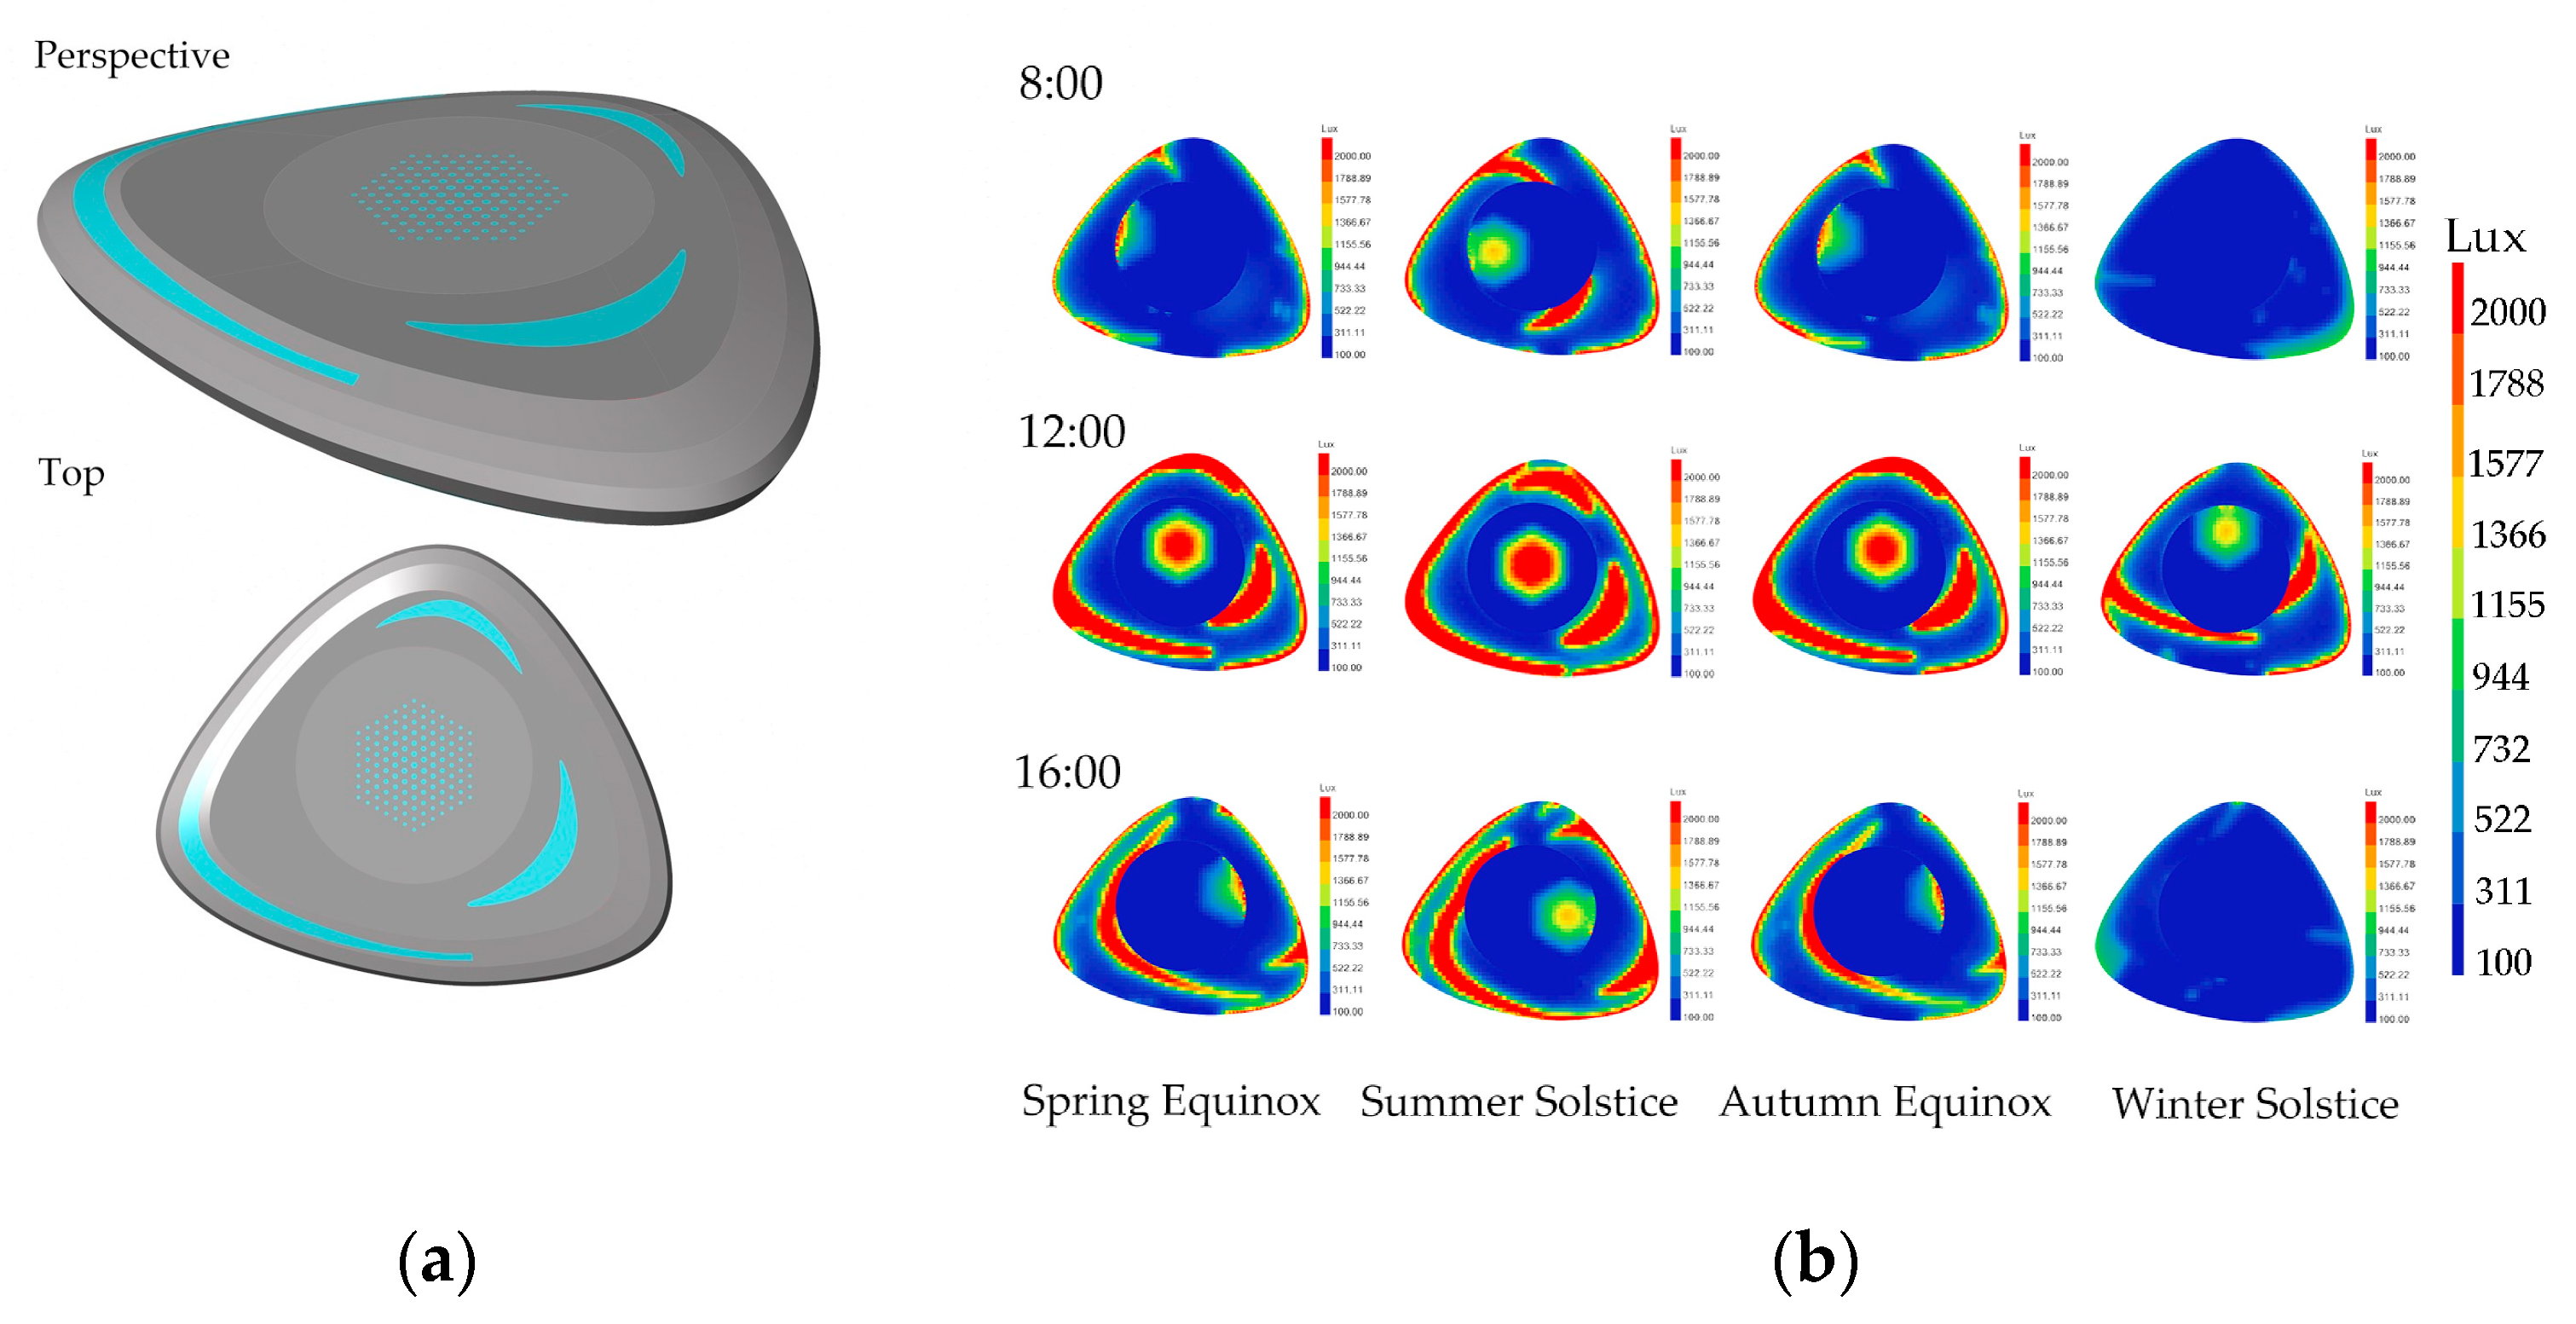
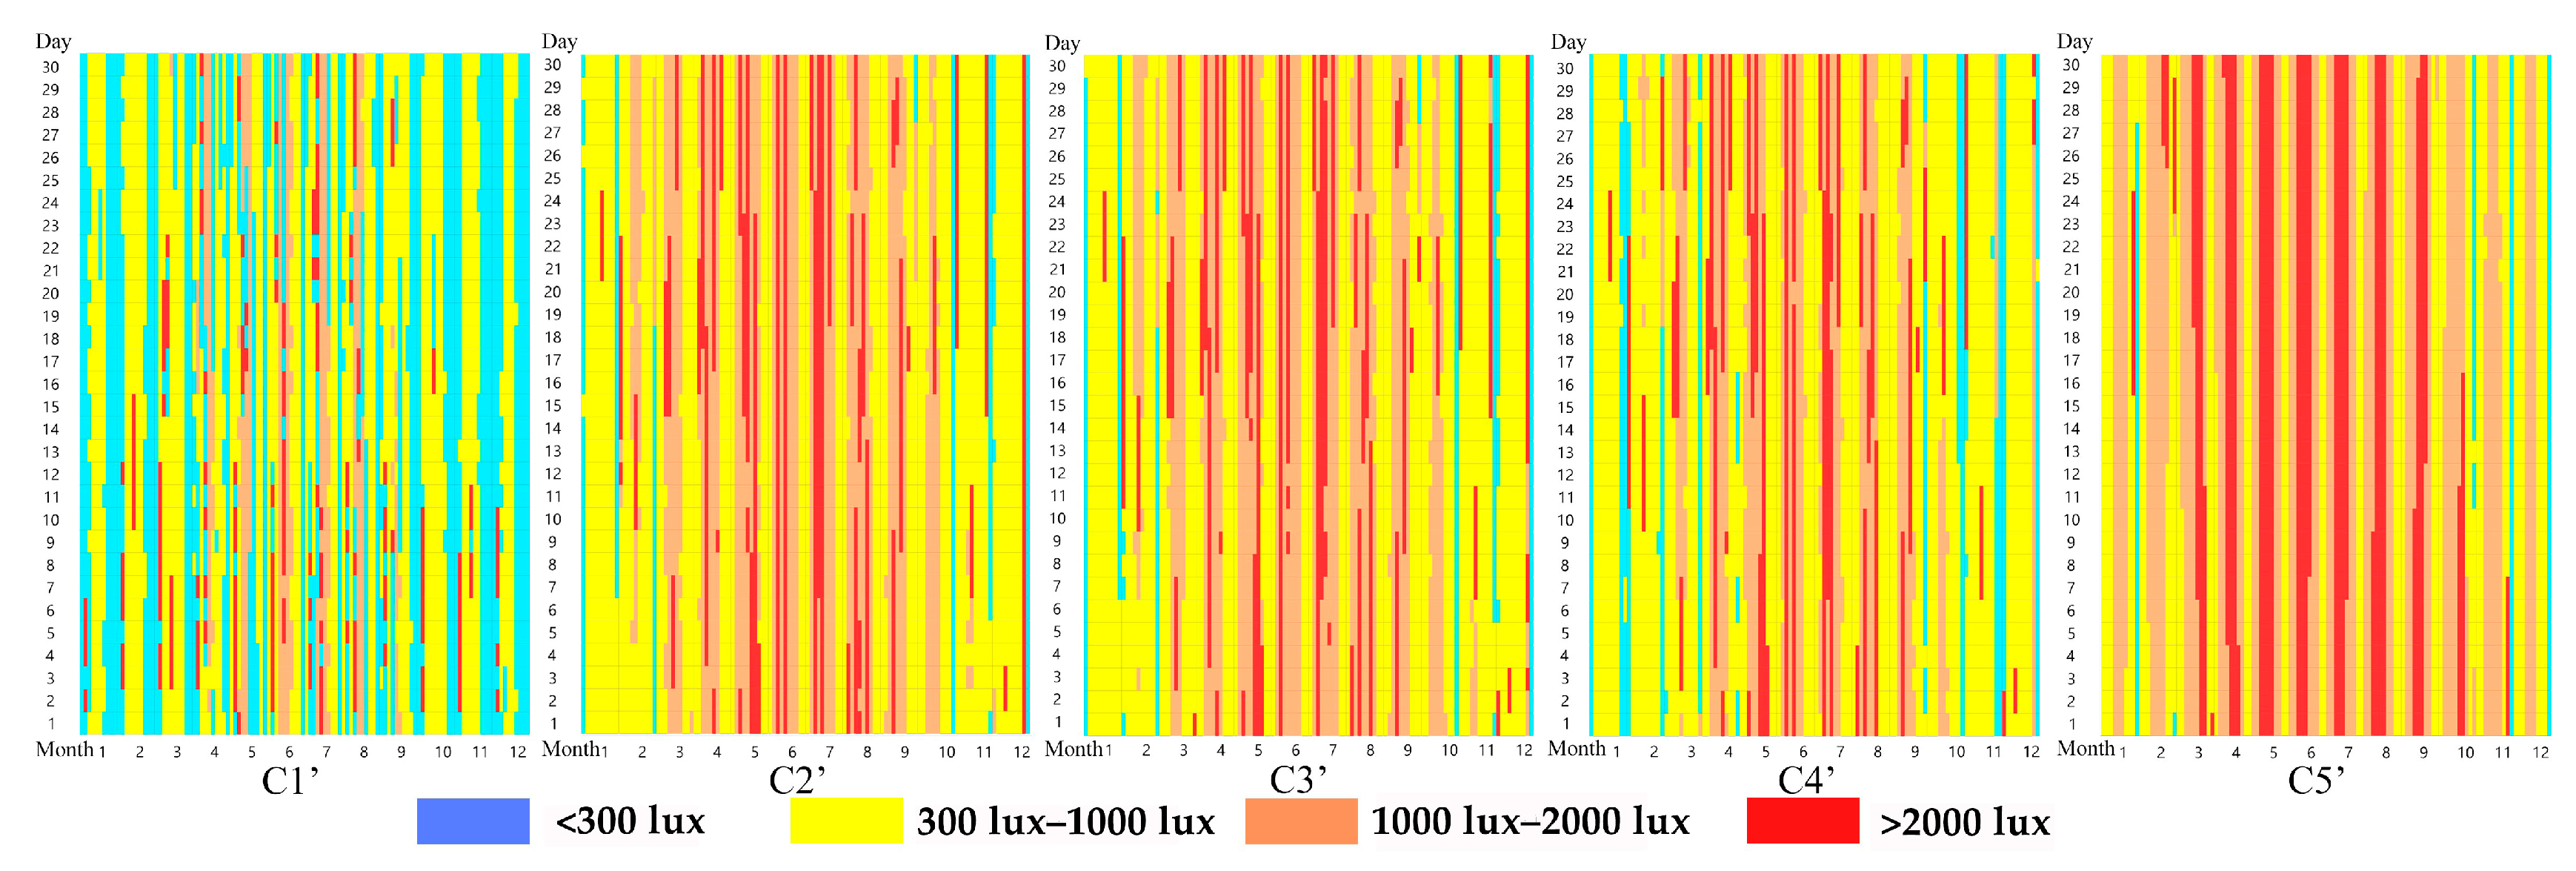
3.2.1. Optimized Scheme I

With a skylight roof area ratio of 5%, the daylighting area can be increased by 98 square meters, as shown in the model in Figure 7a. The representative daily daylight simulation is shown in the corresponding Figure 7b. The optimization plan I was simulated for the entire year for daylighting, and the resulting data are shown in Table 7. On the basis of the sDA dynamic daylighting index, the area with an sDA >300 lux during the winter solstice reached 54.6%, while the remaining representative daily sDA >300 lux areas were above 65.0%. The overall daylighting area during the spring equinox, summer solstice, and autumn equinox exceeded the 55% threshold requirement. The UDI 100–2000 lux dynamic daylighting index indicated the following: during the spring equinox, 77.2% of the year’s usage time had an illumination level of 100–2000 lux; during the summer solstice, 78.1% of the year’s usage time had an illumination level of 100–2000 lux; during the autumn equinox, 76.3% of the year’s usage time had an illumination level of 100–2000 lux; during the winter solstice, 68.5% of the year’s usage time had an illumination level of 100–2000 lux.
Following the aforementioned approach, a comprehensive yearly simulation of the C1′–C5′ areas in Optimized Scheme I was conducted for the period of 8:00 a.m. to 5:00 p.m. The distribution of daylight for these selected areas is displayed in Figure 8. From the comparison of the annual changes in daylighting across different areas, the time frame when the C1′ area experienced <300 lux decreased, while the C2′, C3′, and C4′ areas mostly experienced lighting of 300–2000 lux, resulting in relatively uniform annual daylighting. Comparing the distribution across different months reveals that the period when the C1′ area was <300 lux was concentrated in September to December, whereas the months when the C1′, C2′, C3′, and C4′ areas experienced >2000 lux were primarily from May to August. The C5′ area experienced frequent periods of lighting >2000 lux, and these were primarily concentrated in March to September.
Table 8 presents the dynamic distribution, throughout the year, of the daylighting in the different areas of Optimized Scheme I. The comparison and analysis of the dynamic daylighting index of sDA for different measuring areas indicated that C1′–C5′ achieved 73.9%, 93.7%, 92.9%, 93.6%, and 96.1%, respectively. The sDA >300 lux of C1′, C2′, C3′, C4′, and C5′ areas were all above 70.0%. On the basis of the dynamic daylighting index of UDI, the analysis and comparison of different measuring areas showed that, in the range of 100–2000 lux, C1′–C5′ achieved 73.5%, 86.6%, 87.1%, 87.3%, and 78.9%, respectively. The annual illuminance in the range of 100–2000 lux for C1′, C2′, C3′, C4′, and C5′ areas all reached 73.0%. In the range of <100 lux, the highest percentage was achieved by C1′ at 21.7%. For the range of >2000 lux, C5′ had the highest percentage of 21.1%.

3.2.2. Optimized Scheme II

When the ratio of skylight roof area to floor area was 10%, the daylighting area was increased by 196 square meters, as shown in the model in Figure 9a. The representative daily daylighting simulation is shown in Figure 9b. The optimized solution was simulated for daylighting throughout the year, and the results are shown in Table 9. The sDA dynamic daylighting index indicates that the areas where sDA >300 lux on the winter solstice reached 56.7%, while the other representative days all had sDA >300 lux above 70.0%. The overall daylighting areas for the spring equinox, summer solstice, autumn equinox, and winter solstice in the optimized solution all exceeded the 55% benchmark requirement. The UDI 100–2000 lux dynamic daylighting index shows that the time intervals when the illuminance was between 100 lux and 2000 lux during the spring equinox, summer solstice, autumn equinox, and winter solstice were 79.5%, 80.5%, 77.7%, and 70.0%, respectively, when used throughout the year.
Optimized Scheme II maintained the same annual daylighting area as before. It was represented by C1″–C5″, and it was simulated for the entire year during the 8:00 a.m.–5:00 p.m. time period. The annual daylighting distribution for the selected areas is shown in Figure 10. From the comparison of the annual daylighting changes at different areas, the periods when the illuminance at C1″ areas was <300 lux were continuously decreasing, and the C2″, C3″, and C4″ areas mostly stayed within the range of 300–2000 lux, resulting in relatively uniform annual daylighting. When comparing the distribution in different months, the period when the illuminance at C1″ was <300 lux was concentrated from October to December, while the months when the illuminance at the C1″, C2″, C3″, and C4″ areas was >2000 lux were mainly from May to August. The periods when the illuminance at the C5″ area was >2000 lux were relatively more in number, and they were mainly concentrated in March to September.
The dynamic data distribution of the areas selected by Optimized Scheme II throughout the year is shown in Table 10. When comparing the dynamic daylighting indicators of different areas with sDA, it can be seen that the C1″–C5″ areas achieved 78.2%, 93.8%, 93.2%, 93.7%, and 96.2%, respectively. The sDA >300 lux for the C1″, C2″, C3″, C4″, and C5″ areas were all above 75.0%. When analyzing the data using UDI dynamic daylighting indicators, it was found that the C1″–C5″ areas achieved, in the 100–2000 lux range, 77.1%, 86.4%, 86.8%, 87.1%, and 78.5%, respectively. The C1″, C2″, C3″, C4″, and C5″ areas all achieved an annual illumination in the range of 100–2000 lux, reaching 77.0%. In the <100 lux range, C1″ reached a maximum of 15.4%. In the >2000 lux range, C5″ reached a maximum of 21.5%.

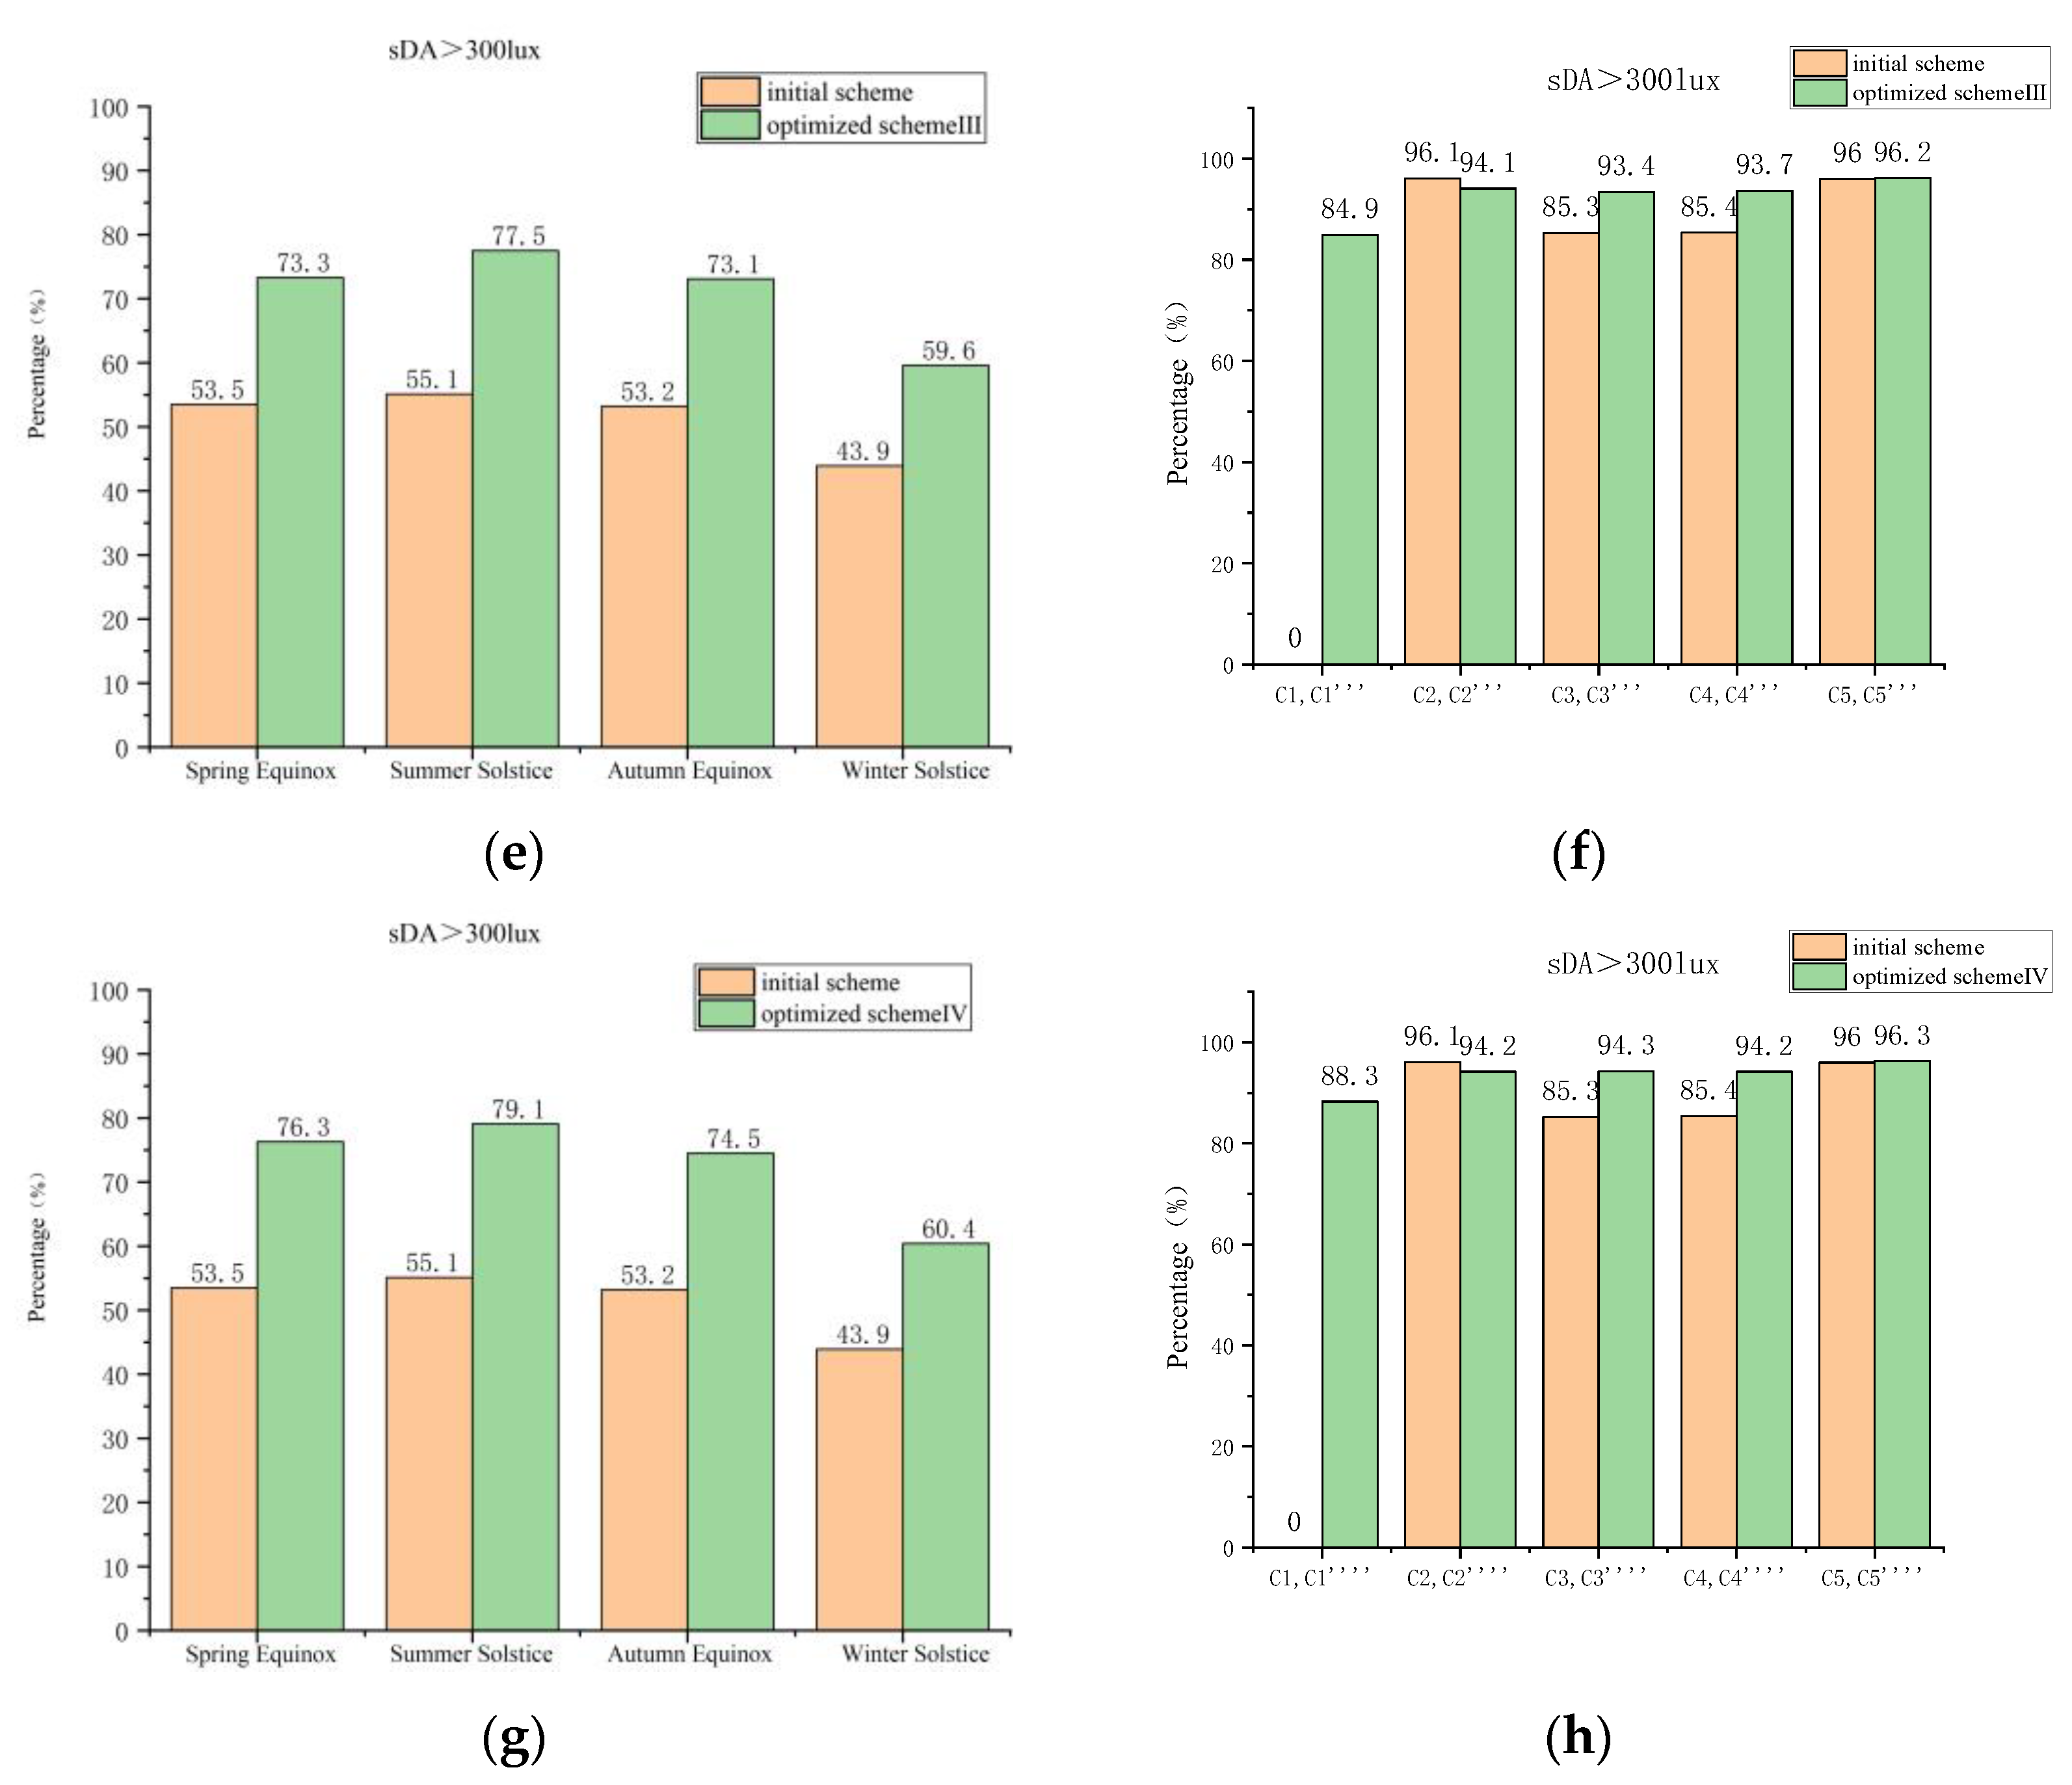
3.2.3. Optimized Scheme III

The model was enhanced with an additional 294 square meters of daylighting area and a skylight-to-floor area ratio of 15%, as depicted in Figure 11a. The representative day’s simulated daylighting is illustrated in Figure 11b, and the annual daylighting simulation outcomes for the optimized scheme are presented in Table 11. The sDA dynamic daylighting metric indicates that 59.6% of representative days during the winter solstice had an sDA >300 lux, while, for all other representative days, it was above 73.0%. The optimized scheme achieved a daylighting area of over 55% for the spring equinox, summer solstice, autumn equinox, and winter solstice. According to the UDI 100–2000 lux dynamic daylighting metric, the percentage of time when the illuminance was between 100 lux and 2000 lux during the spring equinox, summer solstice, autumn equinox, and winter solstice, throughout the year, was 80.4%, 81.4%, 79.2%, and 70.9%, respectively.
Through using Optimization Scheme III, the daylighting area remained unchanged throughout the year and was represented by the C1″–C5″areas. The simulation was conducted for the entire year from 8:00 a.m. to 5:00 p.m. The distribution of annual daylighting in the selected areas is shown in Figure 12. When comparing the annual daylighting changes in different areas, the C1″, C2″, C3″, and C4″ areas are mostly within the range of 300–2000 lux, and the annual daylighting was relatively uniform. Comparing the distribution of different months, the time when the illuminance in the C1″ area was <300 lux was mainly concentrated from October to December. The time when the illuminance in the C1″, C2″, C3″, and C4″ areas was >2000 lux was mainly from May to August. The periods when the illuminance in the C5″ area was >2000 lux were relatively more in number, and they were mainly concentrated from March to September.
The dynamic distribution, throughout the year, of the daylighting data in different areas of Optimized Scheme III is shown in Table 12. By comparing the sDA dynamic daylighting indicators of the different areas, the results show that the values of C1″–C5⁗ reached 84.9%, 94.1%, 93.4%, 93.7%, and 96.2%, respectively. The sDA values in the C1‴, C2‴, C3‴, C4‴, and C5⁗ areas were all above 75.0%, meeting the daylighting requirements. By comparing the UDI dynamic daylighting indicators in different areas, the results show that, in the range of 100–2000 lux, the values of C1″–C5⁗ reached 81.8%, 86.3%, 86.5%, 87.0%, and 78.2%, respectively. The annual illuminance in the range of 100–2000 lux in the C1‴, C2‴, C3‴, C4‴, and C5⁗ areas all reached 78.0%. In the range of <100 lux, the C1″–C5⁗ areas reached up to 11.1%; in the range of >2000 lux, the C5⁗ area reached up to 21.8%.

3.2.4. Optimized Scheme IV

With a roof-to-floor area ratio of 20%, optimized solution IV increased the daylighting area by 392 square meters, as shown in Figure 13 and Table 13. The results of the annual daylighting simulation using this optimized solution indicate that the sDA dynamic daylighting index for each representative day was improved. During the winter solstice period, the area where the sDA exceeded 300 lux reached 60.4%, while, for other representative days, the area with the sDA exceeding 300 lux was above 70.0%, thus meeting the requirement of an overall daylighting area that exceeds 55%. Additionally, the UDI 100–2000 lux dynamic daylighting index indicated that, during the full-year usage period, the illumination time within the range of 100–2000 lux was 82.0%, 82.3%, 81.0%, and 76.7% for the spring equinox, summer solstice, autumnal equinox, and winter solstice, respectively.
The optimized solution maintained a consistent daylighting area, which was represented by the C1⁗–C5⁗ areas (Figure 14). The simulation was conducted throughout the year from 8:00 a.m. to 5:00 p.m. When comparing the daylighting distribution across different areas, the C1⁗, C2⁗, C3⁗, and C4⁗ areas experienced relatively even daylighting levels, ranging from 300 to 2000 lux throughout the year. In contrast, the time during which the C5⁗ area experienced illuminance levels above 2000 lux was noticeably longer than other measurement areas. When comparing the distribution across different months, the intervals in which the illuminance levels of C1 were <300 lux were concentrated between November and February, whereas the months when the C1⁗, C2⁗, C3⁗ and C4⁗ areas experienced illuminance levels >2000 lux were mainly between April and August. The time intervals during which the illuminance levels of C5⁗ exceeded 2000 lux were more frequent and were mainly concentrated between March and September.
The dynamic distribution of daylighting in different areas of the optimized solution throughout the year is shown in Table 14. The analysis of the dynamic daylighting indicators using sDA shows that the C1⁗–C5⁗ areas achieved 88.3%, 94.2%, 94.3%, 94.2%, and 96.3%, respectively. Among all areas, the C1⁗–C5⁗ areas had sDA values above 88.0% for illuminance levels above 300 lux. The analysis of the dynamic daylighting indicators using UDI shows that, in the illuminance range of 100–2000 lux, the C1⁗–C5⁗ areas achieved 89.1%, 86.1%, 86.0%, 86.2%, and 77.5%, respectively. Among all areas, the C1⁗–C5⁗ areas had an illuminance level between 100 and 2000 lux for 75.0% of the time. The percentage of time for which the illuminance was <100 lux was 0 for all areas, while the percentage for which it was >2000 lux was over 10% for all areas, with the highest percentage of 22.5% for C5⁗.

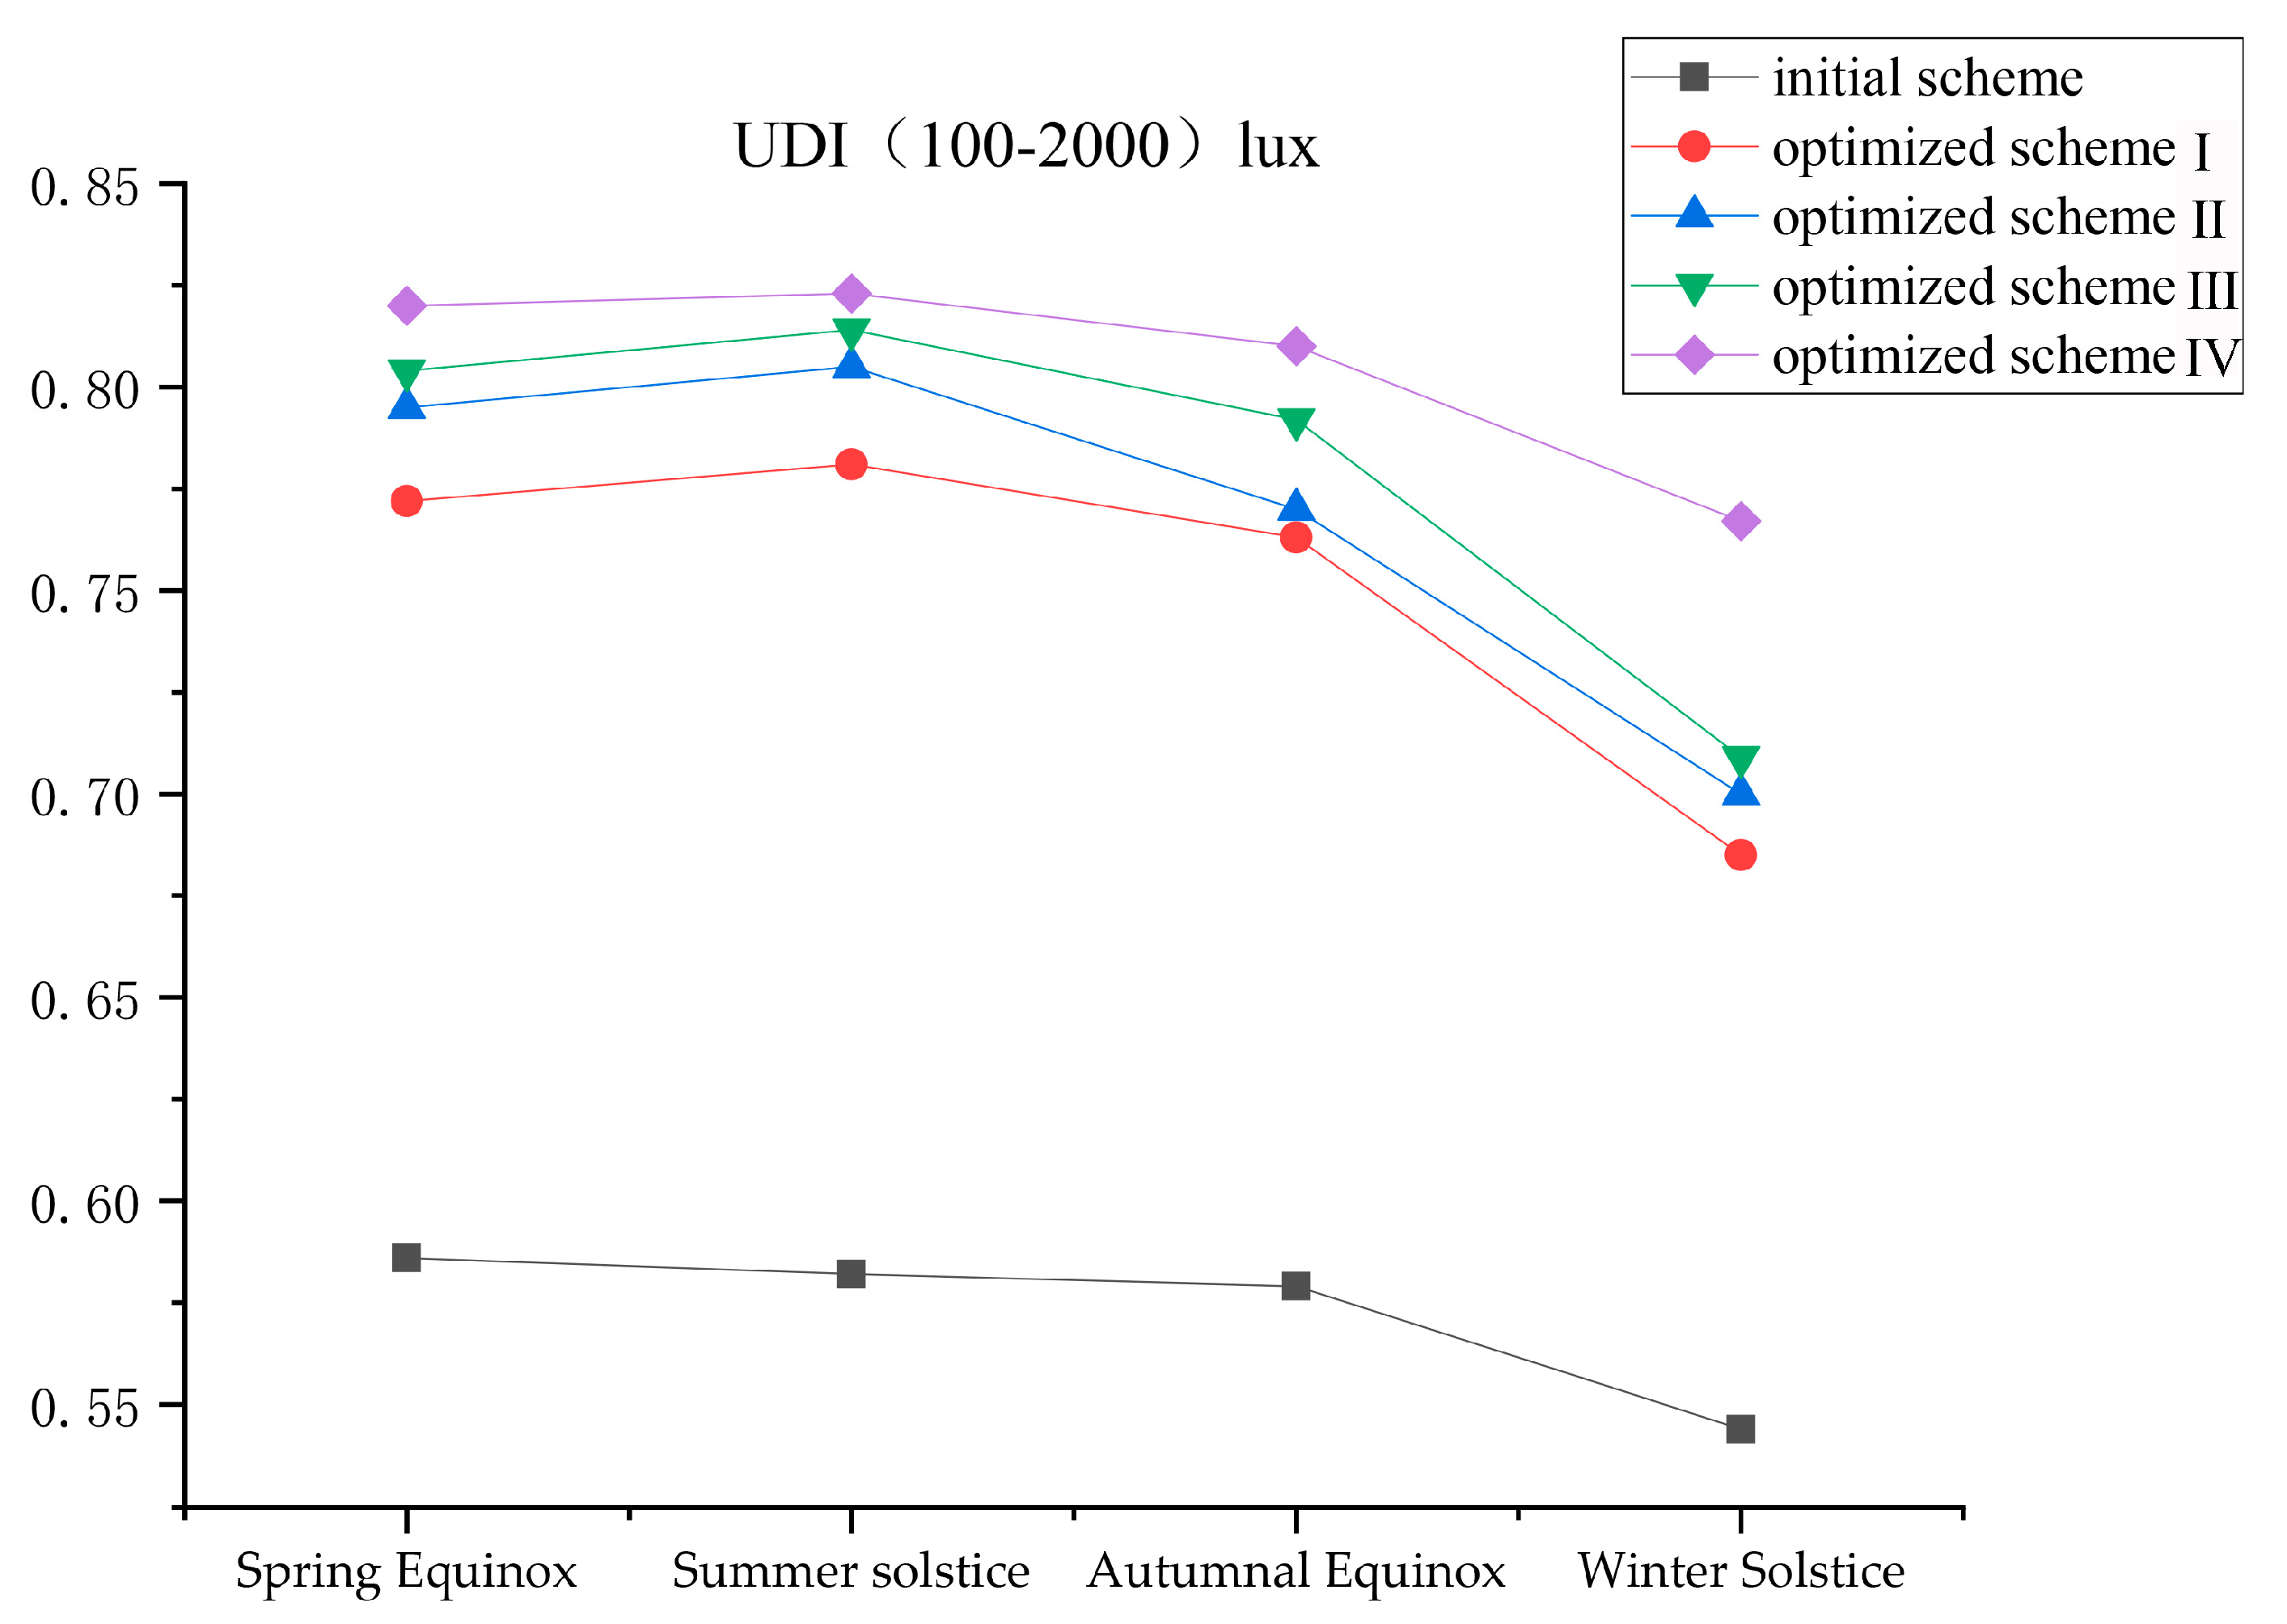
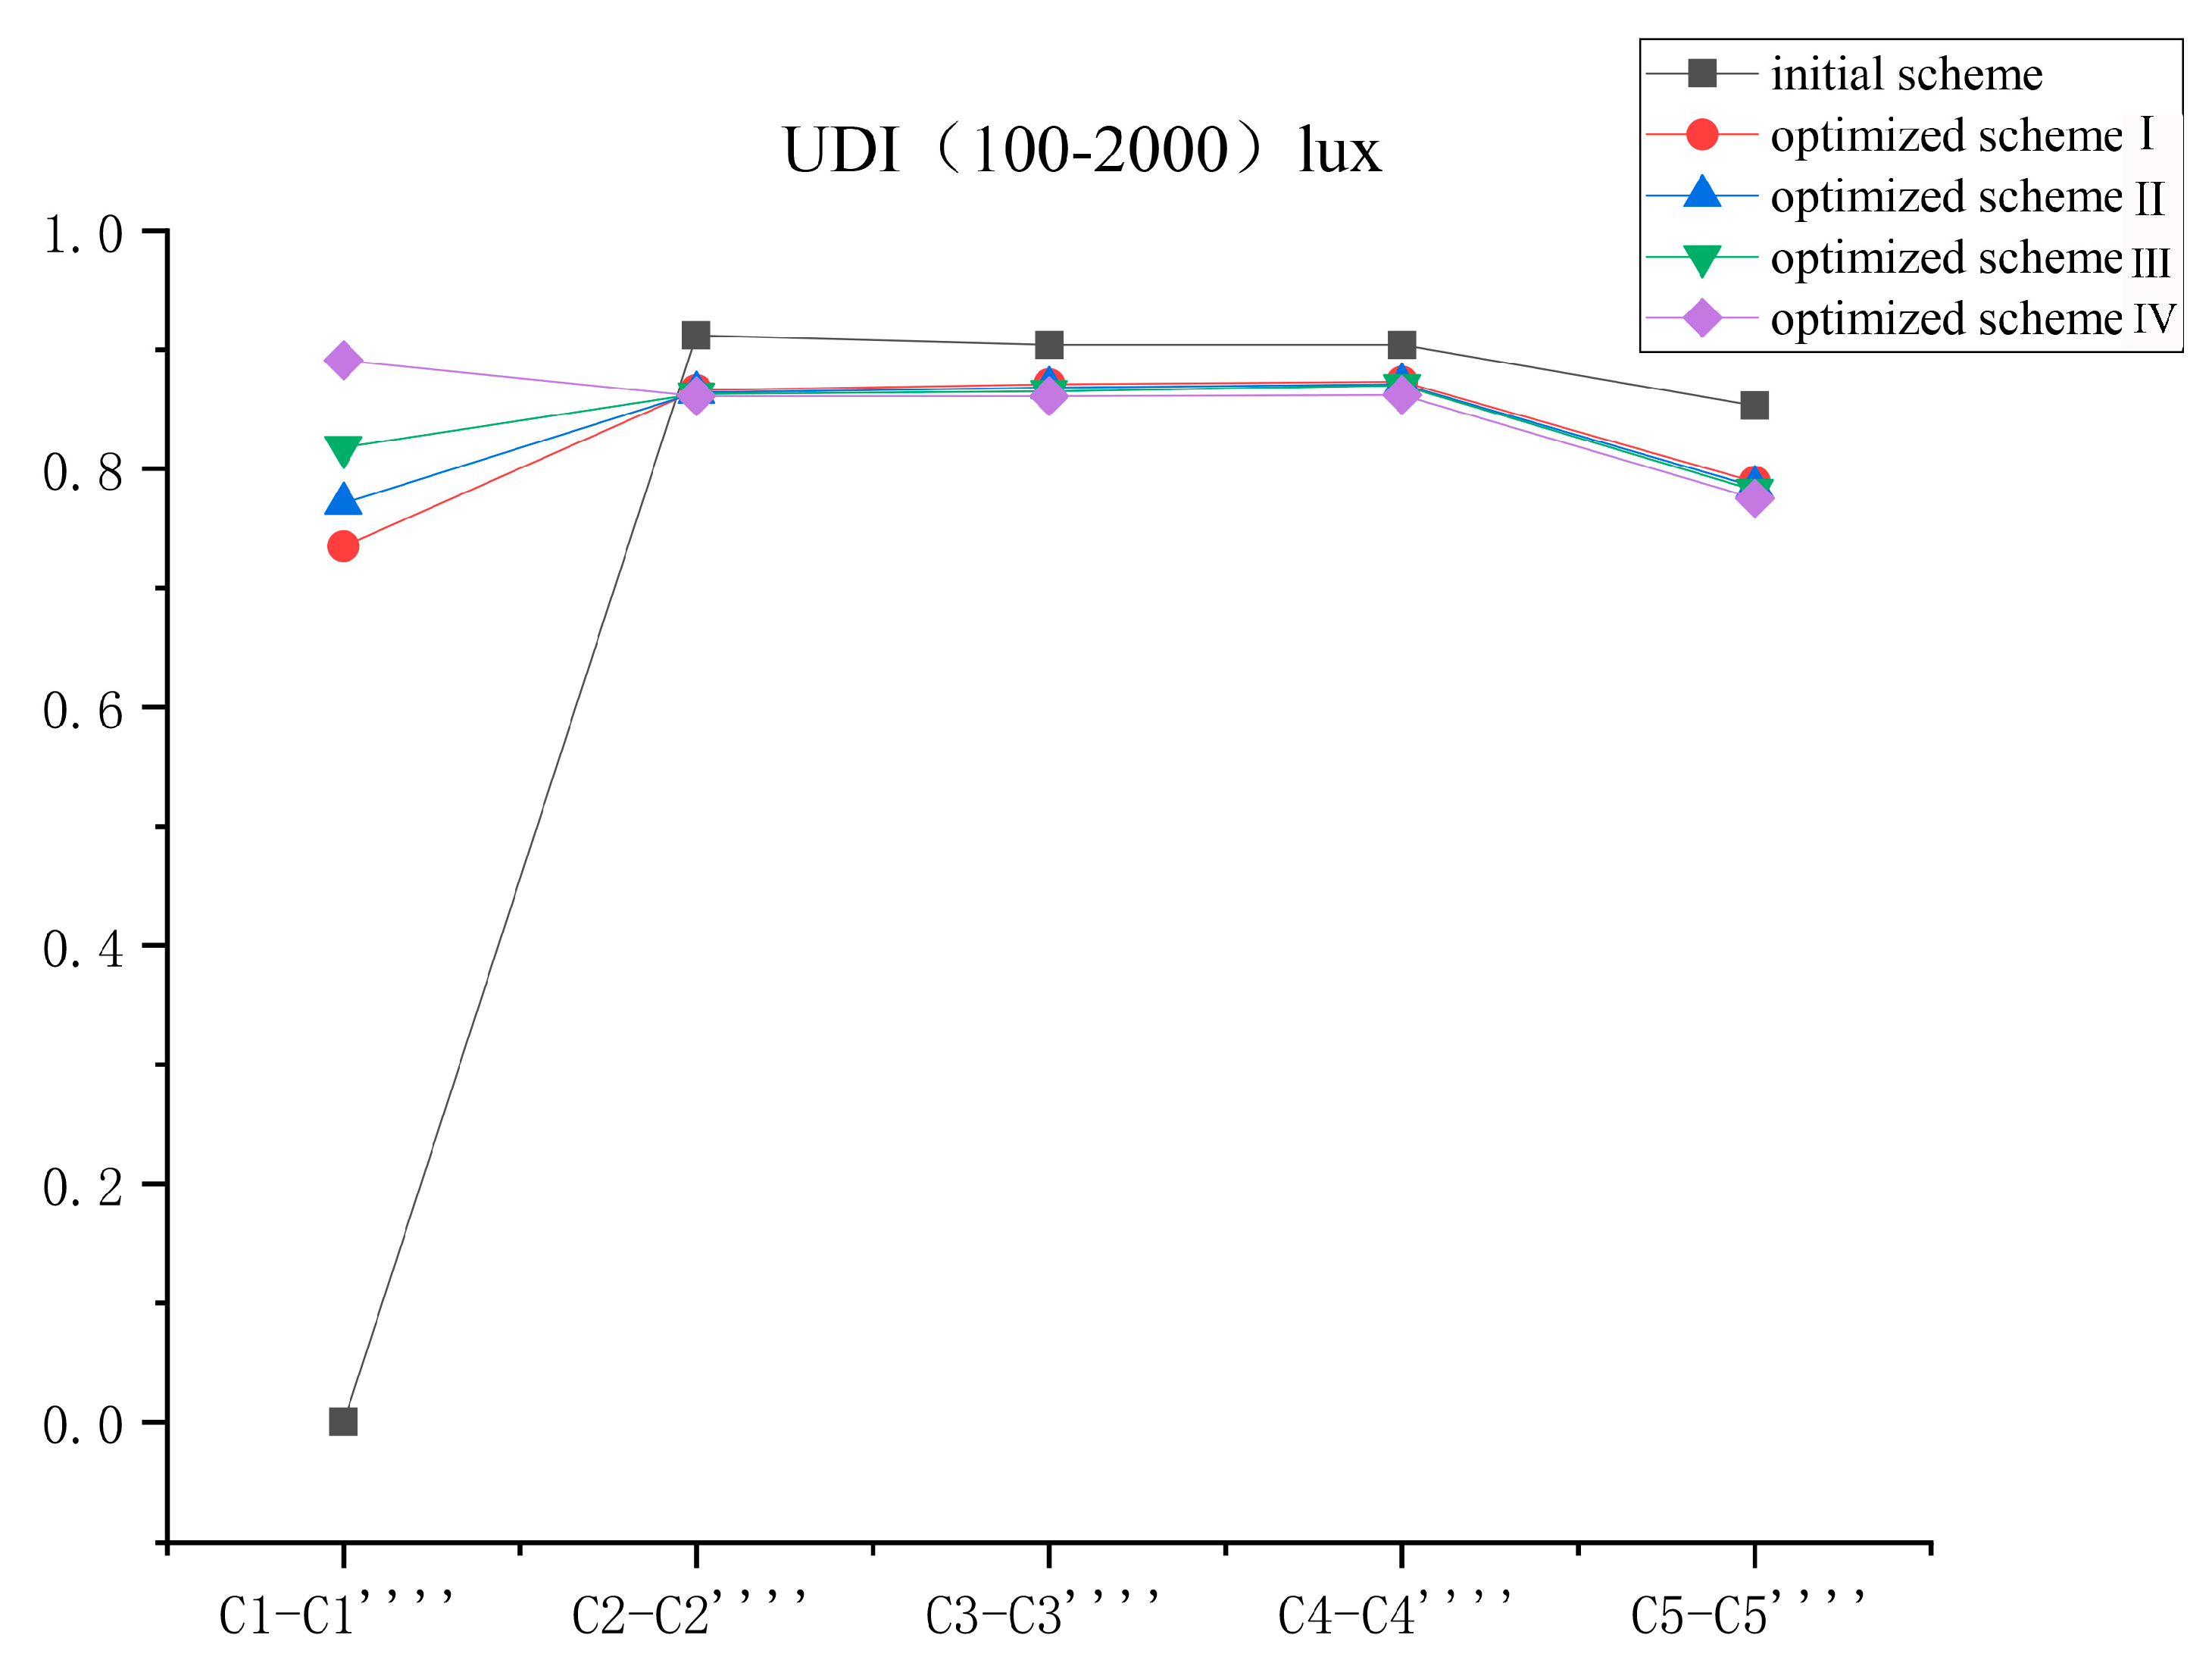
3.3. Comparison of Dynamic Daylighting Evaluation before and after Scheme Optimization

Figure 15 compares the initial schemes and four optimized schemes using the dynamic daylighting evaluation metric, with sDA as the primary consideration. Figure 15a presents the daylighting variation on four representative days for the initial schemes and Optimized Scheme I, showing an increase of 16.0% on the spring equinox, 17.3% on the summer solstice, 15.9% on the autumn equinox, and 10.7% on the winter solstice. The average daylighting area ratio for the initial schemes was 51.4%, whereas, for Optimized Scheme I, it reached 66.4%, which represents an increase of 15%. Figure 15b shows the change in annual daylighting for the C1′–C5′ areas in Optimized Scheme I compared to the C1–C5 areas in the initial scheme, with average time ratios of 90.0% and 72.6%, respectively, representing an increase of 17.4%.
Figure 16 and Figure 17 show the comparison results of the initial scheme and four optimized schemes in terms of the UDI dynamic daylighting evaluation index. Figure 16a–d illustrate the daylighting variations for four representative days of the initial schemes and Optimized Schemes I, II, III, and IV, respectively. By comparing the UDI evaluation index, it can be observed that the optimized schemes significantly increased the average proportion of the effective illuminance environment in the UDI 100–2000 lux range, with increases of 17.7%, 19.6%, 20.7%, and 23.2% when compared to the initial schemes.
Figure 16a shows the daylighting performance comparison between the initial schemes and Optimized Scheme I on four representative days. Through the UDI evaluation indicator comparison, it can be observed that Optimized Scheme I significantly increased the average area proportion of the effective illuminance environment in the UDI 100–2000 lux range when compared to the initial scheme, with an increase of 17.7%. Specifically, the increases were as follows: in the spring equinox, it was 18.6%; in the summer solstice, it was 19.9%; in the autumn equinox, it was 18.4%; in the winter solstice, it was 14.1%. In addition, the average area proportion of uncomfortable illuminance environments with UDI <100 lux also decreased, with decreases of 18.6%, 20.2%, 18.9%, and 13.7% during the spring equinox, summer solstice, autumn equinox, and winter solstice, respectively. However, the uncomfortable illuminance environment range, with a UDI >2000 lux, slightly increased.
Figure 16b shows the daylighting performance comparison between the initial schemes and Optimized Scheme II on four representative days. By comparing the UDI evaluation index, it can be found that Optimized Scheme II significantly increased the average area percentage of the effective illuminance environment, within the UDI 100–2000 lux range, by 19.6%. Specifically, the percentage increased by 20.9% on the spring equinox, 22.3% on the summer solstice, 19.8% on the autumnal equinox, and 15.6% on the winter solstice. Additionally, the average area percentage of uncomfortable illuminance environment below UDI 100 lux also decreased by 21.8%, 23.3%, 20.9%, and 15.5% during the spring equinox, summer solstice, autumnal equinox, and winter solstice, respectively. However, the uncomfortable illuminance environment range, with a UDI >2000 lux, slightly increased.
Figure 16c shows the daylighting variations in the initial schemes and in Optimized Scheme III on four representative days. Comparing the UDI evaluation index, it can be found that Optimized Scheme III significantly increased the average area proportion in the effective illuminance environment range of UDI 100–2000 lux, with an increase of 20.7%. Specifically, it increased by 21.8% on the spring equinox, 23.2% on the summer solstice, 21.3% on the autumnal equinox, and 16.5% on the winter solstice. In addition, the average area proportion of uncomfortable lighting environments with a UDI <100 lux also decreased, with reductions of 24.0%, 25.6%, 23.6%, and 17.2% on the spring equinox, summer solstice, autumnal equinox, and winter solstice, respectively. However, the uncomfortable lighting environment range, with a UDI >2000 lux, showed a slight increase.
Figure 16d shows the daylighting variations in the initial schemes and Optimized Scheme IV for four representative days. Compared with the UDI evaluation index, it can be found that Optimized Scheme IV significantly increased the average percentage of the area within the effective illuminance UDI 100–2000 lux range, with an increase of 23.2% compared to the initial scheme. Specifically, during the spring equinox, summer solstice, autumn equinox, and winter solstice, the area percentage increased by 23.4%, 24.1%, 23.1%, and 22.3%, respectively. In addition, the average percentage of the uncomfortable light environment area with a UDI < 100 lux was reduced, with reductions of 26.1%, 27.7%, 25.8%, and 23.3% during the spring equinox, summer solstice, autumn equinox, and winter solstice, respectively. However, the uncomfortable light environment range, with a UDI >2000 lux, slightly increased.
In Figure 18 and Figure 19, the comparison results of the initial scheme and the four optimized schemes in different areas based on the UDI dynamic lighting evaluation index are shown, respectively. Figure 18d shows the changes in lighting in the C1–C5 areas of the initial scheme and Optimized Schemes I, II, III, and IV in five areas, respectively. By comparing the UDI evaluation index, it can be seen that the optimized schemes significantly increased the effective illuminance environment within the UDI 100–2000 lux range, with increases of 10.2%, 10.7%, 11.5%, and 12.5%, respectively, when compared to the initial scheme.
Through combining the above analysis, the four optimization schemes evaluated by the sDA and UDI metrics improved the daylighting conditions when compared to the initial schemes. Among them, Optimized Scheme IV had the best overall optimization effect. Evaluated by sDA dynamic daylighting metrics, Optimized Scheme IV increased the representative daily daylight area by 21.2%. In addition, the average time of the daylighting in the C1‴–C5⁗ areas increased by 20.9% when compared to the initial scheme. When evaluated by UDI metrics, the representative daily Optimized Scheme IV significantly increased the average proportion of the area within the UDI 100–2000 lux range by 23.2% when compared to the initial scheme. In different daylighting areas, Optimized Scheme IV increased the average proportion within the UDI 100–2000 lux range by 12.5% when compared to the initial scheme.
Figure 18a compares the daylighting performance of the initial scheme (C1–C5) and Optimized Scheme I (C1′–C5′) in different areas via the UDI evaluation index. Compared with the initial scheme, Optimized Scheme I increased the average area proportion in the UDI 100–2000 lux range by 10.2%, with C1–C1′ increasing by 73.5% and other areas decreasing slightly. In the UDI <100 lux range, the uncomfortable lighting environment in the C1 and C1′ areas was significantly reduced from 100% to 21.7%. As for the UDI >2000 lux range, the C1–C5 and C1′ –C5′ areas increased by 4.8%, 4.6%, 5.3%, 5.4%, and 6.5%, respectively.
Figure 18b compares the daylighting performance of the initial scheme and Optimized Scheme II in the C1–C5 and C1″–C5″ areas, as well as evaluates them with the UDI index. Compared to the initial scheme, Optimized Scheme II increased the average proportion of the effective illuminance environment (UDI 100–2000 lux) by 10.7%, with an increase of 77.1% in the C1–C1″ area and slight decreases in other areas. In the UDI <100 lux range, the uncomfortable lighting environment in the C1 and C1″ areas was significantly reduced from 100% to 15.4%. In the UDI >2000 lux range, there was an increase of 7.5%, 4.8%, 5.7%, 5.7%, and 6.9% in the C1–C5 and C1″–C5″ areas, respectively.
Figure 18c compares the daylighting performance of the initial scheme and Optimized Scheme III in the C1–C5 and C1‴–C5‴ areas, and these were evaluated with the UDI metric. Optimized Scheme III resulted in an average increase of 10.7% in the UDI range of 100–2000 lux when compared to the initial scheme, with an increase of 81.8% in the C1–C1‴ area and slight decreases in other areas. The discomfort glare in the C1 and C1‴ areas significantly decreased from 100% to 11.1% in the UDI <100 lux range. In the UDI >2000 lux range, the areas C1–C5 and C1‴–C5‴ increased by 8.1%, 4.9%, 6.0%, 5.9%, and 7.2%, respectively.
Figure 18d compares the daylighting changes in the C1–C5 and C1⁗–C5⁗ regions between the initial scheme and Optimized Scheme IV, and they were evaluated with the UDI metric. Compared to the initial scheme, Optimized Scheme IV increased the average proportion in the UDI 100–2000 lux range by 12.5%, with the C1–C1⁗ areas increasing by 89.1%, but slight decreases being observed in other regions. In the UDI <100 lux range, the uncomfortable lighting environment in the C1 and C1⁗ regions was significantly reduced, from 100% to 0.0%. In the UDI >2000 lux range, the C1–C5 and C1⁗–C5⁗ areas both increased by 10.9%, 5.1%, 6.5%, 6.8%, and 7.9%, respectively.

4. Discussion

This article discussed the dynamic daylighting evaluation of a large-space building, whereby the Hangzhou E-sports Center was used as a case study. This study explored the use of sDA and UDI metrics for daylighting evaluation and parametric design optimization. By comparing the initial scheme with four optimization schemes, the study concluded that Optimized Scheme IV was the most optimal. The research provides a new approach for evaluating and optimizing daylighting in large-space buildings by evaluating the daylighting conditions that are representative of a single day and which are important areas throughout the year, all while using a parametric approach for optimization.
Although previous research has been conducted on daylighting evaluations in large- space buildings for energy conservation, sports venues are an important research object that has been neglected. In daylighting calculations, 4:00 p.m. on the autumnal equinox is considered an appropriate date and time. Additionally, the parametric software Ladybug + Honeybee [49] has been widely used in daylighting research for small and medium-sized buildings [48,72,81]. However, the use of parametric tools for evaluating and optimizing daylighting throughout the year in large-space buildings is still limited.
This study used dynamic evaluation metrics as a starting point through which to analyze and optimize the daylighting of the Hangzhou E-sports Center via parametric analysis. First, by using the parametric tool Ladybug + Honeybee, the problem of tedious daylighting simulation throughout the year could be solved, providing a more intuitive understanding of the dynamic changes in the building’s indoor lighting environment. By combining the feedback from the design scheme, the advantages of the fast modeling and adjustment speed of parametric design could be leveraged to present intuitive and effective adjustment results.
Furthermore, by comparing the building’s dynamic daylighting evaluation and optimization before and after, the lighting environment exhibited a seasonal trend, with Optimized Scheme IV being the best. Through the comparison of the four optimization schemes with the initial scheme, it was found that the building’s daylighting quality exhibited the same trend on representative days such as the spring equinox, summer solstice, autumnal equinox, and winter solstice. The building’s daylighting quality was best during the summer solstice, worst during the winter solstice, and roughly the same during the spring and autumn equinoxes.
Moreover, the daylighting environment of large-space buildings requires the reasonable design of window opening areas. In using the sDA and UDI dynamic evaluation metrics, it was found that as the window area increased during optimization; the area and period with a lighting environment >2000 lux also increased slightly, causing glare.
Although this method provides clear value and a novel perspective, there are still certain limitations. The simulation of annual daylighting in buildings involves a large amount of data, resulting in longer simulation periods. Therefore, this study focused on parameterized model adjustments for the poorly lit areas in the initial design scheme, while maintaining the existing daylighting design for the well-lit areas in large-space buildings. Future improvements could include improving the model, using parallel computing technology while improving hardware computing power to address this issue.

5. Conclusions

Under carbon peak and neutrality targets, fully utilizing natural daylighting is of great significance in creating a good indoor lighting environment, as well as for saving building energy, and promoting the sustainable development of buildings. This study applied dynamic daylighting evaluation indicators sDA and UDI and used a parametric approach to evaluate and analyze the Hangzhou E-sports Center in China. The simulation results of the pre- and post-optimized design of the E-sports Center demonstrated that parametric dynamic daylighting evaluation plays an important role in evaluating the daylighting performance of large spaces.
The contributions of this study are mainly reflected in three aspects. Firstly, dynamic daylighting indicators were used to evaluate the daylighting of large-scale buildings. Compared with static indicators, dynamic daylighting indicators can more realistically and intuitively reflect the daylighting situation of large-scale buildings, which helps architects to discover daylighting problems and to fill the gap in the dynamic daylighting evaluations of large-scale buildings. Secondly, parametric performance design and evaluation analysis provide architects with a quick and effective method for analyzing and optimizing schemes, which helps to create more scientifically reasonable green building works. Optimizing the daylighting design of large-scale buildings achieves the goal of energy conservation and emission reduction, improves indoor comfort, and helps to improve the health level of indoor environments. Thirdly, designers can also use the visualization function of parametric performance analysis to present the indoor daylighting level of large spaces throughout the year in the form of animation to the owners, in better demonstrating the results of performance optimization design, and in helping people to better understand the relationship between architecture and nature, thereby promoting the sustainable development of the building industry and reducing environmental impact. Therefore, in the long run, the research on the dynamic daylighting design of large-scale buildings should not only be limited to the field of architecture but should also have a far-reaching impact on environmental protection and sustainable development.
The present study had certain limitations. Firstly, there are various indicators for evaluating dynamic daylighting [48], and this article only evaluated the dynamic daylighting of large building spaces using two indicators: sDA and UDI. In future research, more dynamic evaluation indicators can be added, such as annual sunlight exposure (ASE) and climate-based daylight modeling (CBDM), which will help to comprehensively evaluate the daylighting of buildings and to optimize accordingly. In future research, more dynamic evaluation indices can be added to achieve a more comprehensive evaluation of building daylighting and its corresponding optimization. Secondly, there are many types of large-space buildings, such as large-scale commercial complexes, exhibition halls, and school sports arenas. This study only used the Hangzhou E-sports Center in China as the research object. In future research, more objects can be included for comprehensive evaluation. Thirdly, this paper focused on optimizing daylight openings in specific areas with poor lighting conditions and conducting dynamic daylighting analysis. In future research, we will explore the use of single-zone or multi-zone optimization methods based on different building types and daylighting conditions. This will contribute to better meeting the daylighting requirements of buildings and in providing more comprehensive daylighting solutions. Lastly, parameterized dynamic daylighting design requires the use of certain algorithms and models for analysis and optimization. The accuracy of algorithms and models can affect the accuracy and feasibility of design results. The current algorithms and models may have certain errors in some cases and need to be continuously improved and verified. In summary, the limitations of parameterized dynamic daylighting design include dynamic daylighting evaluation indices, research objects, daylighting shading, building energy consumption, and the accuracy of algorithms and models, which need to be continuously explored and improved in future research.

Author Contributions

Conceptualization, H.Z.; methodology, H.H. and H.Z.; validation, H.H., H.Z. and L.W.; formal analysis, H.H.; investigation, H.H., Z.K. and L.W.; writing—original draft preparation, H.Z. and H.H.; writing—review and editing, H.H. and H.Z.; visualization, H.H. and Z.K.; supervision, H.Z.; project administration, H.Z. All authors have read and agreed to the published version of the manuscript.

Funding

This research is funded by the National Natural Science Foundation of China (grant number: 51508169), the Hubei Provincial Central Leading Local Science and Technology Development Special Project (grant number: 2018ZYYD037), and the China Scholarship Council Local Cooperation Project (grant number: 2022008420322).

Institutional Review Board Statement

Not applicable.

Informed Consent Statement

Written informed consent was obtained from all participants.

Data Availability Statement

The data underlying this article are available in the article.

Conflicts of Interest

The authors declare no conflict of interest.

References

  1. Peter, S.C. Reduction of CO2 to chemicals and fuels: A solution to global warming and energy crisis. ACS Energy Lett. 2018, 3, 1557–1561. [Google Scholar] [CrossRef]
  2. Petroleum, B. British Petroleum Statistical Review of World Energy; British Petroleum: London UK, 2021. [Google Scholar]
  3. Li, D.H.W. A review of daylight illuminance determinations and energy implications. Appl. Energy 2010, 87, 2109–2118. [Google Scholar] [CrossRef]
  4. IEA. Transition to Sustainable Buildings: Strategies and Opportunities to 2050; IEA: Paris, France, 2013. [Google Scholar]
  5. Krarti, M.; Erickson, P.M.; Hillman, T.C. A simplified method to estimate energy savings of artificial lighting use from daylighting. Build. Environ. 2005, 40, 747–754. [Google Scholar] [CrossRef]
  6. Chirarattananon, S.; Chaiwiwatworakul, P.; Pattanasethanon, S. Daylight availability and models for global and diffuse horizontal illuminance and irradiance for Bangkok. Renew. Energy 2002, 26, 69–89. [Google Scholar] [CrossRef]
  7. Zheng, Y.; Xie, H.; Wang, L.-F.; Liang, W.; Zou, K.-K. Energy Consumption of One Gymnasium Building in Beijing. Constr. Conserves Energy 2012, 40, 54–58. [Google Scholar]
  8. Lam, J.C. An analysis of residential sector energy use in Hong Kong. Energy 1996, 21, 1–8. [Google Scholar] [CrossRef]
  9. Ahmad, A.; Prakash, O.; Kumar, A.; Hasnain, S.M.; Verma, P.; Zare, A.; Dwivedi, G.; Pandey, A. Dynamic analysis of daylight factor, thermal comfort and energy performance under clear sky conditions for building: An experimental validation. Mater. Sci. Energy Technol. 2022, 5, 52–65. [Google Scholar] [CrossRef]
  10. Ruck, N.C. International Energy Agency’s Solar Heating and Cooling Task 31, ‘Daylighting Buildings in the 21st Century’. Energy Build. 2006, 38, 718–720. [Google Scholar] [CrossRef]
  11. To, D.W.T.; Sing, L.K.; Chung, T.; Leung, C. Potential energy saving for a side-lit room using daylight-linked fluorescent lamp installations. Light. Res. Technol. 2002, 34, 121–132. [Google Scholar] [CrossRef]
  12. Chel, A.; Tiwari, G.N.; Singh, H.N. A modified model for estimation of daylight factor for skylight integrated with dome roof structure of mud-house in New Delhi (India). Appl. Energy 2010, 87, 3037–3050. [Google Scholar] [CrossRef]
  13. Chen, X.; Yang, H.X. Combined thermal and daylight analysis of a typical public rental housing development to fulfil green building guidance in Hong Kong. Energy Build. 2015, 108, 420–432. [Google Scholar] [CrossRef]
  14. Ne’eman, E. A comprehensive approach to the integration of daylight and electric light in buildings. Energy Build. 1984, 6, 97–108. [Google Scholar] [CrossRef] [Green Version]
  15. Mills, P.R.; Tomkins, S.C.; Schlangen, L.J. The effect of high correlated colour temperature office lighting on employee wellbeing and work performance. J. Circadian Rhythm. 2007, 5, 2. [Google Scholar] [CrossRef] [Green Version]
  16. Juslén, H.; Wouters, M.; Tenner, A. The influence of controllable task-lighting on productivity: A field study in a factory. Appl. Ergon. 2007, 38, 39–44. [Google Scholar] [CrossRef]
  17. Dijk, D.-J.; Lockley, S. Functional Genomics of Sleep and Circadian Rhythm Invited Review: Integration of human sleep-wake regulation and circadian rhythmicity. J Appl Physiol 2002, 92, 852–862. [Google Scholar] [CrossRef] [Green Version]
  18. Stevens, R.G.; Blask, D.E.; Brainard, G.C.; Hansen, J.; Lockley, S.W.; Provencio, I.; Rea, M.S.; Reinlib, L. Meeting report: The role of environmental lighting and circadian disruption in cancer and other diseases. Environ. Health Perspect. 2007, 115, 1357–1362. [Google Scholar] [CrossRef] [Green Version]
  19. Maltais, L.G.; Gosselin, L. Daylighting ‘energy and comfort’ performance in office buildings: Sensitivity analysis, metamodel and pareto front. J. Build. Eng. 2017, 14, 61–72. [Google Scholar] [CrossRef]
  20. Galasiu, A.D.; Veitch, J.A. Occupant preferences and satisfaction with the luminous environment and control systems in daylit offices: A literature review. Energy Build. 2006, 38, 728–742. [Google Scholar] [CrossRef] [Green Version]
  21. Choi, J.H.; Beltran, L.O.; Kim, H.S. Impacts of indoor daylight environments on patient average length of stay (ALOS) in a healthcare facility. Build. Environ. 2012, 50, 65–75. [Google Scholar] [CrossRef]
  22. Yang, H.; Guo, B.X.; Shi, Y.Z.; Jia, C.; Li, X.Y.; Liu, F. Interior daylight environment of an elderly nursing home in Beijing. Build. Environ. 2021, 200, 107915. [Google Scholar] [CrossRef]
  23. Zhang, A.X.; Bokel, R.; van den Dobbelsteenb, A.; Sun, Y.C.; Huang, Q.; Zhang, Q. Optimization of thermal and daylight performance of school buildings based on a multi-objective genetic algorithm in the cold climate of China. Energy Build. 2017, 139, 371–384. [Google Scholar] [CrossRef]
  24. Webb, A.R. Considerations for lighting in the built environment: Non-visual effects of light. Energy Build. 2006, 38, 721–727. [Google Scholar] [CrossRef]
  25. Ochoa, C.E.; Aries, M.B.C.; van Loenen, E.J.; Hensen, J.L.M. Considerations on design optimization criteria for windows providing low energy consumption and high visual comfort. Appl. Energy 2012, 95, 238–245. [Google Scholar] [CrossRef] [Green Version]
  26. Tzempelikos, A. Advances on daylighting and visual comfort research. Build. Environ. 2017, 100, 1–4. [Google Scholar] [CrossRef]
  27. Bian, Y.; Luo, J.H.; Hu, J.W.; Liu, L.; Pang, Y.Z. Visual discomfort assessment in an open-plan space with skylights: A case study with POE survey and retrofit design. Energy Build. 2021, 248, 111215. [Google Scholar] [CrossRef]
  28. Gb5033-2013; Standard for Daylighting Design ofBuildings. Ministry of Housing and Urban-Rural Development of the People Republic of China: Beijing, China, 2012. (In Chinese)
  29. Zhou, J.; Huang, Y.; Zhang, G. Research on Building Energy Consumption Based upon the Difference between the New and the Original Lighting Standard. Build. Sci. 2015, 31, 65–71. [Google Scholar]
  30. Zhang, W. Study on Energy Saving of Office Buildings with the Influence of Daylighting. Ph.D. Thesis, Tianjin University, Tianjin, China, 2005. [Google Scholar]
  31. Ahadi, A.A.; Saghafi, M.R.; Tahbaz, M. The study of effective factors in daylight performance of light-wells with dynamic daylight metrics in residential buildings. Sol. Energy 2017, 155, 679–697. [Google Scholar] [CrossRef]
  32. Reinhart, C.F.; Herkel, S. The simulation of annual daylight illuminance distributions—A state-of-the-art comparison of six RADIANCE-based methods. Energy Build. 2000, 32, 167–187. [Google Scholar] [CrossRef]
  33. Reinhart, C.F.; Walkenhorst, O. Validation of dynamic RADIANCE-based daylight simulations for a test office with external blinds. Energy Build. 2001, 33, 683–697. [Google Scholar] [CrossRef]
  34. Nabil, A.; Mardaljevic, J. Useful daylight illuminances: A replacement for daylight factors. Energy Build. 2006, 38, 905–913. [Google Scholar] [CrossRef]
  35. Reinhart, C.F.; Jakubiec, J.A.; Ibarra, D. Definition of a reference office for standardized evaluations of dynamic façade and lighting technologies. In Proceedings of the BS2013: 13th Conference of International Building Performance Simulation Association, Chambery, France, 25–28 August 2013; pp. 3645–3652. [Google Scholar]
  36. Glassman, E.J.; Reinhart, C. Façade optimization using parametric design and future climate scenarios. In Proceedings of the 13th Conference of International Building Performance Simulation Association, Chambery, France, 25–28 August 2013; pp. 26–28. [Google Scholar]
  37. Berardi, U.; Wang, T.N. Day lighting in an atrium-type high performance house. Build. Environ. 2014, 76, 92–104. [Google Scholar] [CrossRef]
  38. Xue, P.; Mak, C.M.; Cheung, H.D. The effects of daylighting and human behavior on luminous comfort in residential buildings: A questionnaire survey. Build. Environ. 2014, 81, 51–59. [Google Scholar] [CrossRef]
  39. Bugeat, A.; Beckers, B.; Fernandez, E. Improving the daylighting performance of residential light wells by reflecting and redirecting approaches. Sol. Energy 2020, 207, 1434–1444. [Google Scholar] [CrossRef]
  40. Lu, M.; Du, J.T. Dynamic evaluation of daylight availability in a highly-dense Chinese residential area with a cold climate. Energy Build. 2019, 193, 139–159. [Google Scholar] [CrossRef]
  41. Al-Dossary, A.M.; Kim, D.D. A Study of Design Variables in Daylight and Energy Performance in Residential Buildings under Hot Climates. Energies 2020, 13, 5836. [Google Scholar] [CrossRef]
  42. Cheong, C.H.; Kim, T.; Leigh, S.B. Thermal and Daylighting Performance of Energy-Efficient Windows in Highly Glazed Residential Buildings: Case Study in Korea. Sustainability 2014, 6, 7311–7333. [Google Scholar] [CrossRef] [Green Version]
  43. Kong, Z.; Utzinger, D.M.; Freihoefer, K.; Steege, T. The impact of interior design on visual discomfort reduction: A field study integrating lighting environments with POE survey. Build. Environ. 2018, 138, 135–148. [Google Scholar] [CrossRef]
  44. Turan, I.; Chegut, A.; Fink, D.; Reinhart, C. The value of daylight in office spaces. Build. Environ. 2020, 168, 106503. [Google Scholar] [CrossRef]
  45. Abdollahzadeh, N.; Tahsildoost, M.; Zomorodian, Z.S. A method of partition design for open-plan offices based on daylight performance evaluation. J. Build. Eng. 2020, 29, 101171. [Google Scholar] [CrossRef]
  46. Kim, J. Adaptive façade design for the daylighting performance in an office building: The investigation of an opening design strategy with cellular automata. Int. J. Low-Carbon Technol. 2015, 10, 313–320. [Google Scholar] [CrossRef] [Green Version]
  47. Kunwar, N.; Cetin, K.S.; Passe, U. Calibration of energy simulation using optimization for buildings with dynamic shading systems. Energy Build. 2021, 236, 110787. [Google Scholar] [CrossRef]
  48. Xue, Y.B.; Liu, W.H. A Study on Parametric Design Method for Optimization of Daylight in Commercial Building’s Atrium in Cold Regions. Sustainability 2022, 14, 7667. [Google Scholar] [CrossRef]
  49. Zhao, Y.; Mei, H.Y. Dynamic simulation and analysis of daylighting factors for gymnasiums in mid-latitude China. Build. Environ. 2013, 63, 56–68. [Google Scholar] [CrossRef]
  50. Huang, X.F.; Wei, S.Y.; Zhu, S.Y. Study on Daylighting Optimization in the Exhibition Halls of Museums for Chinese Calligraphy and Painting Works. Energies 2020, 13, 240. [Google Scholar] [CrossRef] [Green Version]
  51. Shi, L.G.; Li, Y.Q.; Tao, L.L.; Zhang, Y.X.; Jiang, X.T.; Yang, Z.J.; Qi, X.Z.; Qiu, J.H. Sporters? visual comfort assessment in gymnasium based on subjective evaluation & objective physiological response. Build. Environ. 2022, 225, 109678. [Google Scholar] [CrossRef]
  52. El-Abd, W.; Kamel, B.; Afify, M.; Dorra, M. Assessment of skylight design configurations on daylighting performance in shopping malls: A case study. Sol. Energy 2018, 170, 358–368. [Google Scholar] [CrossRef]
  53. Wang, Y.X.; Chen, L.Y. Architectural and Landscape Garden Planning Integrated with Artificial Intelligence Parametric Analysis. Secur. Commun. Netw. 2022, 2022, 8577269. [Google Scholar] [CrossRef]
  54. Ji, L.H. Application and Optimization of Artificial Intelligence Technology in Architectural Design. Wirel. Commun. Mob. Comput. 2022, 2022, 5170068. [Google Scholar] [CrossRef]
  55. Pena, M.L.C.; Carballal, A.; Rodríguez-Fernández, N.; Santos, I.; Romero, J. Artificial intelligence applied to conceptual design. A review of its use in architecture. Autom. Constr. 2021, 124, 103550. [Google Scholar] [CrossRef]
  56. Manfren, M.; Nastasi, B. Parametric performance analysis and energy model calibration workflow integration—A scalable approach for buildings. Energies 2020, 13, 621. [Google Scholar] [CrossRef] [Green Version]
  57. Kotireddy, R.; Hoes, P.-J.; Hensen, J.L. A methodology for performance robustness assessment of low-energy buildings using scenario analysis. Appl. Energy 2018, 212, 428–442. [Google Scholar] [CrossRef]
  58. Biloria, N.; Sumini, V. Performative building skin systems: A morphogenomic approach towards developing real-time adaptive building skin systems. Int. J. Archit. Comput. 2009, 7, 643–675. [Google Scholar] [CrossRef]
  59. BoRong, L.; Ziwei, L. Building energy-saving approach in early design stage. Chin. Sci. Bull. 2015, 61, 113–121. [Google Scholar]
  60. Cheng, S.; Dagang, Q.; Qian, H. Towards AI-architect Interactive and collaborative architectural design: A case study of intelligent stylization of building shape. Architect. J. 2020, 2, 74–78. [Google Scholar]
  61. Ligier, S.; Robillart, M.; Schalbart, P.; Peuportier, B. Energy performance contracting methodology based upon simulation and measurement. In Proceedings of the Building Simulation 2017, San Francisco, CA, USA, 7–9 August 2017. [Google Scholar]
  62. Touloupaki, E.; Theodosiou, T. Performance simulation integrated in parametric 3D modeling as a method for early stage design optimization—A review. Energies 2017, 10, 637. [Google Scholar] [CrossRef] [Green Version]
  63. Mahmoud, A.H.A.; Elghazi, Y. Parametric-based designs for kinetic facades to optimize daylight performance: Comparing rotation and translation kinetic motion for hexagonal facade patterns. Sol. Energy 2016, 126, 111–127. [Google Scholar] [CrossRef]
  64. Yuan, P.F.; Song, Y.; Lin, Y.; Beh, H.S.; Chao, Y.; Xiao, T.; Huang, S.; Zheng, J.; Wu, Z. An architectural building cluster morphology generation method to perceive, derive, and form based on cyborg-physical wind tunnel (CPWT). Build. Environ. 2021, 203, 108045. [Google Scholar] [CrossRef]
  65. Skarning, G.C.J.; Hviid, C.A.; Svendsen, S. The effect of dynamic solar shading on energy, daylighting and thermal comfort in a nearly zero-energy loft room in Rome and Copenhagen. Energy Build. 2017, 135, 302–311. [Google Scholar] [CrossRef] [Green Version]
  66. Mangkuto, R.A.; Rohmah, M.; Asri, A.D. Design optimisation for window size, orientation, and wall reflectance with regard to various daylight metrics and lighting energy demand: A case study of buildings in the tropics. Appl. Energy 2016, 164, 211–219. [Google Scholar] [CrossRef]
  67. Wang, K.; Zhang, T.; Li, C.; Xiao, X.; Tang, Y.; Fang, X.; Peng, H.; Liu, X.; Dong, Y.; Cai, Y. Shape-reconfigurable transparent wood based on solid-state plasticity of polythiourethane for smart building materials with tunable light guiding, energy saving, and fire alarm actuating functions. Compos. Part B Eng. 2022, 246, 110260. [Google Scholar] [CrossRef]
  68. Saraiva, N.B.; Rodrigues, E.; Gaspar, A.R.; Costa, J.J. Daylighting simulation of a heritage building by comparing matrix methods and solar models. Sol. Energy 2021, 224, 685–696. [Google Scholar] [CrossRef]
  69. Roudsari, M.S.; Pak, M.; Smith, A. Ladybug: A parametric environmental plugin for grasshopper to help designers create an environmentally-conscious design. In Proceedings of the 13th International IBPSA Conference, Lyon, France, 25–28 August 2013; pp. 3128–3135. [Google Scholar]
  70. Eltaweel, A.; Yuehong, S. Parametric design and daylighting: A literature review. Renew. Sustain. Energy Rev. 2017, 73, 1086–1103. [Google Scholar] [CrossRef]
  71. Mahdavinejad, M.; Nazar, N.S. Daylightophil high-performance architecture: Multi-objective optimization of energy efficiency and daylight availability in BSk climate. Energy Proc. 2017, 115, 92–101. [Google Scholar] [CrossRef]
  72. Toutou, A.; Fikry, M.; Mohamed, W. The parametric based optimization framework daylighting and energy performance in residential buildings in hot arid zone. Alex. Eng. J. 2018, 57, 3595–3608. [Google Scholar] [CrossRef]
  73. Zhang, H.; Zhou, X. Research on green building, design strategy of large space railway stationTaking Taiyuan south, railway station as a case. Sichuan Build. Sci. 2016, 42, 134–137. [Google Scholar]
  74. GB/T 50033-2013; Design Standard for Building Daylighting. China Architecture & Building Press: Beijing, China, 2013.
  75. GB/T 55016-2021; General Code for Building Environment. China Architecture & Building Press: Beijing, China, 2021.
  76. GB/T 50378-2014; Assessment Standard·for Green Building. China Architecture & Building Press: Beijing, China, 2014.
  77. GB/T 50378-2019; Assessment Standard·for Green Building. China Architecture & Building Press: Beijing, China, 2019.
  78. LEED. LEED v4 for New Construction and Major Renovations. 2019. Available online: https://www.usgbc.org/sites/default/iles/LEED%20v4%20BDC_07.25.19_current.pdf (accessed on 20 November 2020).
  79. Ravn, M.; Mach, G.; Hansen, E.K.; Triantafyllidis, G. Simulating Physiological Potentials of Daylight Variables in Lighting Design. Sustainability 2022, 14, 881. [Google Scholar] [CrossRef]
  80. Zhao, N.; Fan, Z.; Liu, J. Daylight oriented optimization of photovoltaic integrated skylights for railway station waiting hall represented large space buildings in China. Energy Build. 2023, 285, 112777. [Google Scholar] [CrossRef]
  81. Suryandono, A.R.; Hariyadi, A.; Fukuda, H. Economic Assessment of L-Shaped Minilouvers for Reducing Cooling Energy and Improving Daylight Condition in Offices: A Simulation Study in Jakarta. Sustainability 2021, 13, 4021. [Google Scholar] [CrossRef]
Figure 1. Parametric dynamic daylighting design and analysis process.
Sustainability 15 10773 g001
Figure 2. Schematic diagram of the logical structure of parametric platform daylighting evaluation analysis.
Sustainability 15 10773 g002
Figure 3. Hangzhou E-sports Center project.
Sustainability 15 10773 g003
Figure 4. Daylighting measurement area schematic.
Sustainability 15 10773 g004
Figure 5. Daylight simulation of the initial scheme on representative days: (a) the initial scheme model, including perspective view, front view, and right view; (b) dynamic daylight simulation (Ladybug + Honeybee).
Sustainability 15 10773 g005
Figure 6. The dynamic distribution of daylighting at different measurement areas throughout the year in the initial scheme.
Sustainability 15 10773 g006
Figure 7. Daylight simulation of Optimized Scheme I on representative days: (a) the Optimized Scheme I model, including perspective view, front view, and right view; (b) dynamic daylight simulation (Ladybug + Honeybee).
Sustainability 15 10773 g007
Figure 8. The dynamic distribution of daylighting at different measurement areas throughout the year in Optimized Scheme I.
Sustainability 15 10773 g008
Figure 9. Daylight simulation of Optimized Scheme II on representative days: (a) the Optimized Scheme II model, including perspective view, front view, and right view; (b) dynamic daylight simulation (Ladybug + Honeybee).
Sustainability 15 10773 g009
Figure 10. The dynamic distribution of daylighting at different measurement areas throughout the year in Optimized Scheme II.
Sustainability 15 10773 g010
Figure 11. Daylight simulation of Optimized Scheme III on representative days: (a) the Optimized Scheme III model, including perspective view, front view, and right view; (b) dynamic daylight simulation (Ladybug + Honeybee).
Sustainability 15 10773 g011
Figure 12. The dynamic distribution of daylighting at different measurement areas throughout the year in Optimized Scheme III.
Sustainability 15 10773 g012
Figure 13. Daylight simulation of Optimized Scheme IV on representative days: (a) Optimized Scheme IV model, including perspective view, front view, and right view; (b) dynamic daylight simulation (Ladybug + Honeybee).
Sustainability 15 10773 g013
Figure 14. The dynamic distribution of daylighting at different measurement areas throughout the year in Optimized Scheme IV.
Sustainability 15 10773 g014
Figure 15. Comparison of the sDA evaluation index: (a) comparison of the representative day sDA evaluation indicators for Optimized Scheme I; (b) comparison of the sDA evaluation indicators in the measurement area for Optimized Scheme I; (c) comparison of the representative day sDA evaluation indicators for Optimized Scheme II; (d) comparison of the sDA evaluation indicators in the measurement area for Optimized Scheme II; (e) comparison of the representative day sDA evaluation indicators for Optimized Scheme III; (f) comparison of the sDA evaluation indicators in the measurement area for Optimized Scheme III; (g) comparison of the representative day sDA evaluation indicators for Optimized Scheme IV; (h) comparison of the sDA evaluation indicators in the measurement area for Optimized Scheme IV.
Sustainability 15 10773 g015aSustainability 15 10773 g015b
Figure 16. Comparison of representative day UDI evaluation indicators: (a) comparison of the representative day UDI evaluation indicators for Optimized Scheme I; (b) comparison of the representative day UDI evaluation indicators for Optimized Scheme II; (c) comparison of the representative day UDI evaluation indicators for Optimized Scheme III; (d) comparison of the representative day UDI evaluation indicators for Optimized Scheme IV.
Sustainability 15 10773 g016
Figure 17. Comparison of the representative day UDI 100–2000 lux evaluation indicators.
Sustainability 15 10773 g017
Figure 18. Comparison of the UDI evaluation indicators in the measurement areas: (a) Optimized Scheme I; (b) Optimized Scheme II; (c) Optimized Scheme III; (d) Optimized Scheme IV.
Sustainability 15 10773 g018
Figure 19. Comparison of the UDI 100–2000 lux evaluation indicators in the measurement areas.
Sustainability 15 10773 g019
Table 1. Comparison of large-space lighting evaluation system.
StandardPromulgation TimeThe Main Content of Daylighting EvaluationEvaluation Type
Design standard for building daylighting GB 50033-2013 [74]2013Stadium grounds, spectator entrance hall, lounge, athletes’ lounge, treatment rooms, VIP lounges, referees’ rooms ≥ lighting level IV lighting standard value, side lighting coefficient ≥2.0%, indoor natural illumination ≥300 lux, top lighting coefficient ≥1.0%, indoor natural illumination ≥150 lux.Static
General code for building environment
GB 55016-2021 [75]
2021Stadium grounds, audience entrance hall, lounge, athletes’ lounge ≥ lighting level Ⅳ lighting standard value, side lighting coefficient ≥2.0%, indoor natural illumination ≥270 lux, top lighting coefficient ≥1.0%, indoor natural illumination ≥135 lux.Static
Assessment standard for green building
GB/T 50378-2014 [76]
2014Public building main function room lighting area ratio RA: 60% ≤ RA ≤ 65% scores 4 points, 65% ≤ RA ≤ 70% scores 5 points, 70% ≤ RA ≤ 75% scores 6 points, 75% ≤ RA ≤ 80% scores 7 points, and RA ≥ 80% scores 8 points.Static
Assessment standard for green building
GB/T 50378-2019 [77]
2019The proportion of the area in the inner area of public buildings (where the lighting factor meets the lighting requirements) reaches 60%; the lighting illuminance value is at least 60% of the area proportion of the main indoor functional space for no less than the average number of hours required for lighting (<4 h/day).Dynamic
LEED V 4 [78]2013No less than 55% of commonly used spaces receive 450 lux of sunlight during ≥50% of operating hours per year (sDA300/50%); no more than 10% of ASE commonly used spaces.Dynamic
Table 2. UDI and sDA rating evaluation.
LevelUDI ValuesDA Value
Inappropriate<100 lux, >2000 lux<0.55
Acceptable100–2000 lux0.55–0.75
Satisfactory->0.75
Table 3. Main parameter settings.
Geographic Location30°16′ N, 120°12′ E
Time zoneUTC + 8
Sun position changeWinter solstice noon solar altitude 36.5°
Summer solstice noon solar altitude 83.5°
Calculation periodDecember–February (winter solstice) period 8:00 a.m.–5:00 p.m.
March–May (vernal equinox) period 8:00 a.m.–5:00 p.m.
June–September (summer solstice) period 8:00 a.m.–5:00 p.m.
October–November (autumn equinox) period 8:00 a.m.–5:00 p.m.
Material light reflection ratioStandardDesign standard for energy efficiency of public buildings
GB 50189-2015
Standard for daylighting design of buildings
GB 50033-2013
Value
ceiling0.7–0.90.6–0.90.8
External window--0.65
facade--0.3
interior wall0.5–0.80.3–0.80.5
floor0.3–0.50.1–0.50.3
Working face-0.2–0.60.2
Roof structure--0.8
Table 4. Daylighting analysis measurement areas description.
Measurement
Areas
Selection DescriptionHeight of Daylight SurfaceMethod of
Daylighting
Area of Light
Opening (Unit: Square Meters, m²)
C1Located in the main usage area of the venue0.75 mIndirect daylighting0.0
C1′–C1⁗Skylight daylighting98–392
C2Located at the main entrance of Foyer I, hosting a large number of people0.45 mMixed lighting290.8
C2′–C2⁗
C3Located at the third entrance of the foyer, close to the main entrance of the building, with a lot of foot traffic0.45 mSkylight daylighting41.5
C3′–C3⁗
C4Connecting space between Foyer II and Foyer III, adjacent to the side door0.45 mMixed lighting122.9
C4′–C4⁗
C5Located at the second entrance of the foyer, close to the main entrance of the building, the main use space0.45 mMixed lighting194.4
C5′–C5⁗
Table 5. Comparison of the dynamic daylighting indices for the initial scheme representatives.
TimesDA >300 luxUDI 100–2000 lux UDI <100 luxUDI >2000 lux
Spring equinox53.5%58.6%34.5%6.9%
Summer solstice55.1%58.2%32.7%9.1%
Autumn equinox53.2%57.9%34.7%7.4%
Winter solstice43.9%54.4%40.6%5.0%
Table 6. Full-year data for the measurement areas C1–C5 of the initial scheme.
Measurement AreassDA >300 LuxUDI 100–2000 lux UDI <100 luxUDI >2000 lux
C10.0%0.0%100%0.0%
C296.1%91.2%0%8.8%
C385.3%90.4%2.1%7.5%
C485.4%90.4%2.6%7.0%
C596.0%85.4%0.0%14.6%
Table 7. Comparison of the dynamic daylighting indices for the Optimized Scheme I representatives.
TimesDA >300 luxUDI 100–2000 luxUDI <100 luxUDI >2000 lux
Spring equinox69.5%77.2%15.9%6.9%
Summer solstice72.4%78.1%12.5%9.4%
Autumn equinox69.1%76.3%15.8%7.9%
Winter solstice54.6%68.5%26.9%4.6%
Table 8. Full-year data for the measurement areas C1′–C5′ of Optimized Scheme I.
Measurement AreassDA >300 luxUDI 100–2000 luxUDI <100 luxUDI >2000 lux
C1′73.9%73.5%21.7%4.8%
C2′93.7%86.6%0.0%13.4%
C3′92.9%87.1%0.1%12.8%
C4′93.6%87.3%0.3%12.4%
C5′96.1%78.9%0.0%21.1%
Table 9. Comparison of dynamic daylighting indexes for the Optimized Scheme II representatives.
TimesDA >300 luxUDI 100–2000 luxUDI <100 luxUDI >2000 lux
Spring equinox71.9%79.5%12.7%7.8%
Summer solstice75.3%80.5%9.4%10.1%
Autumn equinox71.2%77.7%13.8%8.5%
Winter solstice56.7%70.0%25.1%4.9%
Table 10. Full-year data for the measurement areas C1′–C5′ of Optimized Scheme II.
Measurement AreassDA >300 luxUDI 100–2000 luxUDI <100 luxUDI >2000 lux
C1″78.2%77.1%15.4%7.5%
C2″93.8%86.4%0.0%13.6%
C3″93.2%86.8%0.0%13.2%
C4″93.7%87.1%0.2%12.7%
C5″96.2%78.5%0.0%21.5%
Table 11. Comparison of dynamic daylighting indexes for the Optimized Scheme III representatives.
TimesDA >300 luxUDI 100–2000 luxUDI <100 luxUDI >2000 lux
Spring equinox73.3%80.4%10.5%9.1%
Summer solstice77.5%81.4%7.1%11.5%
Autumn equinox73.1%79.2%11.1%9.7%
Winter solstice59.6%70.9%23.4%5.7%
Table 12. Full-year data for the measurement areas C1′–C5′ of Optimized Scheme III.
Measurement AreassDA >300 luxUDI 100–2000 luxUDI <100 luxUDI >2000 lux
C1‴84.9%81.8%11.1%8.1%
C2‴94.1%86.3%0.0%13.7%
C3‴93.4%86.5%0.0%13.5%
C4‴93.7%87.0%0.1%12.9%
C5‴96.2%78.2%0.0%21.8%
Table 13. Comparison of the dynamic daylighting indexes for the Optimized Scheme IV representatives.
TimesDA >300 luxUDI 100–2000 luxUDI <100 luxUDI >2000 lux
Spring equinox76.3%82.0%8.4%9.6%
Summer solstice79.1%82.3%5.0%12.7%
Autumn equinox74.5%81.0%8.9%10.1%
Winter solstice60.4%76.7%17.3%6.0%
Table 14. Full-year data for the measurement areas C1′–C5′ of Optimized Scheme IV.
Measurement
Areas
sDA >300 luxUDI 100–2000 luxUDI <100 luxUDI >2000 lux
C1⁗88.3%89.1%0.0%10.9%
C2⁗94.2%86.1%0.0%13.9%
C3⁗94.3%86.0%0.0%14.0%
C4⁗94.2%86.2%0.0%13.8%
C5⁗96.3%77.5%0.0%22.5%
Disclaimer/Publisher’s Note: The statements, opinions and data contained in all publications are solely those of the individual author(s) and contributor(s) and not of MDPI and/or the editor(s). MDPI and/or the editor(s) disclaim responsibility for any injury to people or property resulting from any ideas, methods, instructions or products referred to in the content.

