Article

Traffic Safety Sensitivity Analysis of Parameters Used for Connected and Autonomous Vehicle Calibration

TRYSE Research Group, ETSI Caminos, Canales y Puertos, University of Granada, Campus de Fuentenueva, s/n, 18071 Granada, Spain
*
Author to whom correspondence should be addressed.
Sustainability 2023, 15(13), 9990; https://doi.org/10.3390/su15139990
Submission received: 16 May 2023 / Revised: 12 June 2023 / Accepted: 19 June 2023 / Published: 23 June 2023

Abstract

:
Recently, the number of traffic safety studies involving connected and autonomous vehicles (CAVs) has been increasing. Due to the lack of information regarding the real behaviour of CAVs in mixed traffic flow, traffic simulation platforms are used to provide a reasonable approach for testing various scenarios and fleets. It is necessary to analyse how traffic safety is affected when key parameter assumptions are changed. The current study conducts a sensitivity analysis to identify the parameters used in CAV calibration that have the highest influence on traffic safety. Using a microsimulation-based surrogate safety assessment model approach (SSAM), traffic conflicts were identified, and a ceteris paribus analysis was conducted to measure the effect of gradually changing each parameter on the number of conflicts. Afterwards, a two-at-a-time sensitivity analysis was performed to explore the influence of simultaneously varying two parameters. The results revealed that reaction time, clearance, maximum acceleration, normal deceleration, and the sensitivity factor are key parameters. Studying these parameters two at a time revealed that low maximum acceleration, when combined with other parameters, consistently resulted in the highest number of conflicts, while combinations with short reaction time always yielded the best traffic safety results. This investigation broadens the understanding of CAV behaviour for future implementation for both manufacturers and researchers.

1. Introduction

Connected and autonomous vehicles (CAVs) fundamentally differ from human-driven vehicles (HDVs) in terms of their operational behaviour. CAVs can be adjusted to minimise emissions, improve fuel savings, and harmonise traffic flow due to their shorter reaction times [1,2,3,4,5]. Additionally, they are expected to change travel behaviour by generating new demand for very young, elderly, or disabled individuals, being utilized for freight transport, and impacting parking and ride-sharing patterns, thereby affecting the total vehicle miles travelled [6]. Furthermore, CAVs can enhance traffic safety by adhering to traffic laws and mitigating human driving errors [7].
An increasing number of new automobile models are being equipped with amenities and advanced assistance systems, including adaptive cruise control, parking assist technologies, and self-driving capabilities. However, as CAVs are still in the testing stage, it remains challenging to predict their actual behaviour and determine if they will deliver the projected safety benefits. Consequently, significant research efforts are required to develop a transportation system that optimally harnesses the potential advantages of CAVs. The knowledge gained from research is essential for stakeholders to achieve incremental improvements in CAV design and address complex questions related to legal, safety, and regulation issues.
One common research approach to studying the safety impact of CAVs is through traffic simulation considering different CAV market penetration rates [8]. Simulation tools, in general, allow for the comparison of multiple conditions under the same traffic input and facilitate the study of various mixed traffic scenarios more quickly and easily than field-based investigations. In CAV safety research, simulation is the most reasonable approach since access to real CAV field data is still limited [8]. Consequently, numerous researchers have endeavoured to conduct safety evaluation studies based on traffic simulations utilizing surrogate safety measures (SSM).
Specifically, traffic safety is measured based on the calibration of various traffic flow models to reflect CAV driving behaviour. Most literature studies have used unique calibration values for these parameters, estimated based on future CAV behaviour (e.g., [9,10,11]). Nevertheless, further exploration is needed to understand the effect of CAV behaviour, and an examination of which driving parameters may have a concrete effect on safety analysis could provide valuable insights into the safety impact of CAV implementation for both designers and researchers.
Despite a few studies that have attempted to explore the sensitivity of a limited number of parameters related to CAV driving behaviour or tested different calibrated traffic models for various levels of automation, no specific sensitivity analysis has been published for the majority of commonly used parameters that calibrate CAV driving behaviour in relation to their impact on traffic safety.
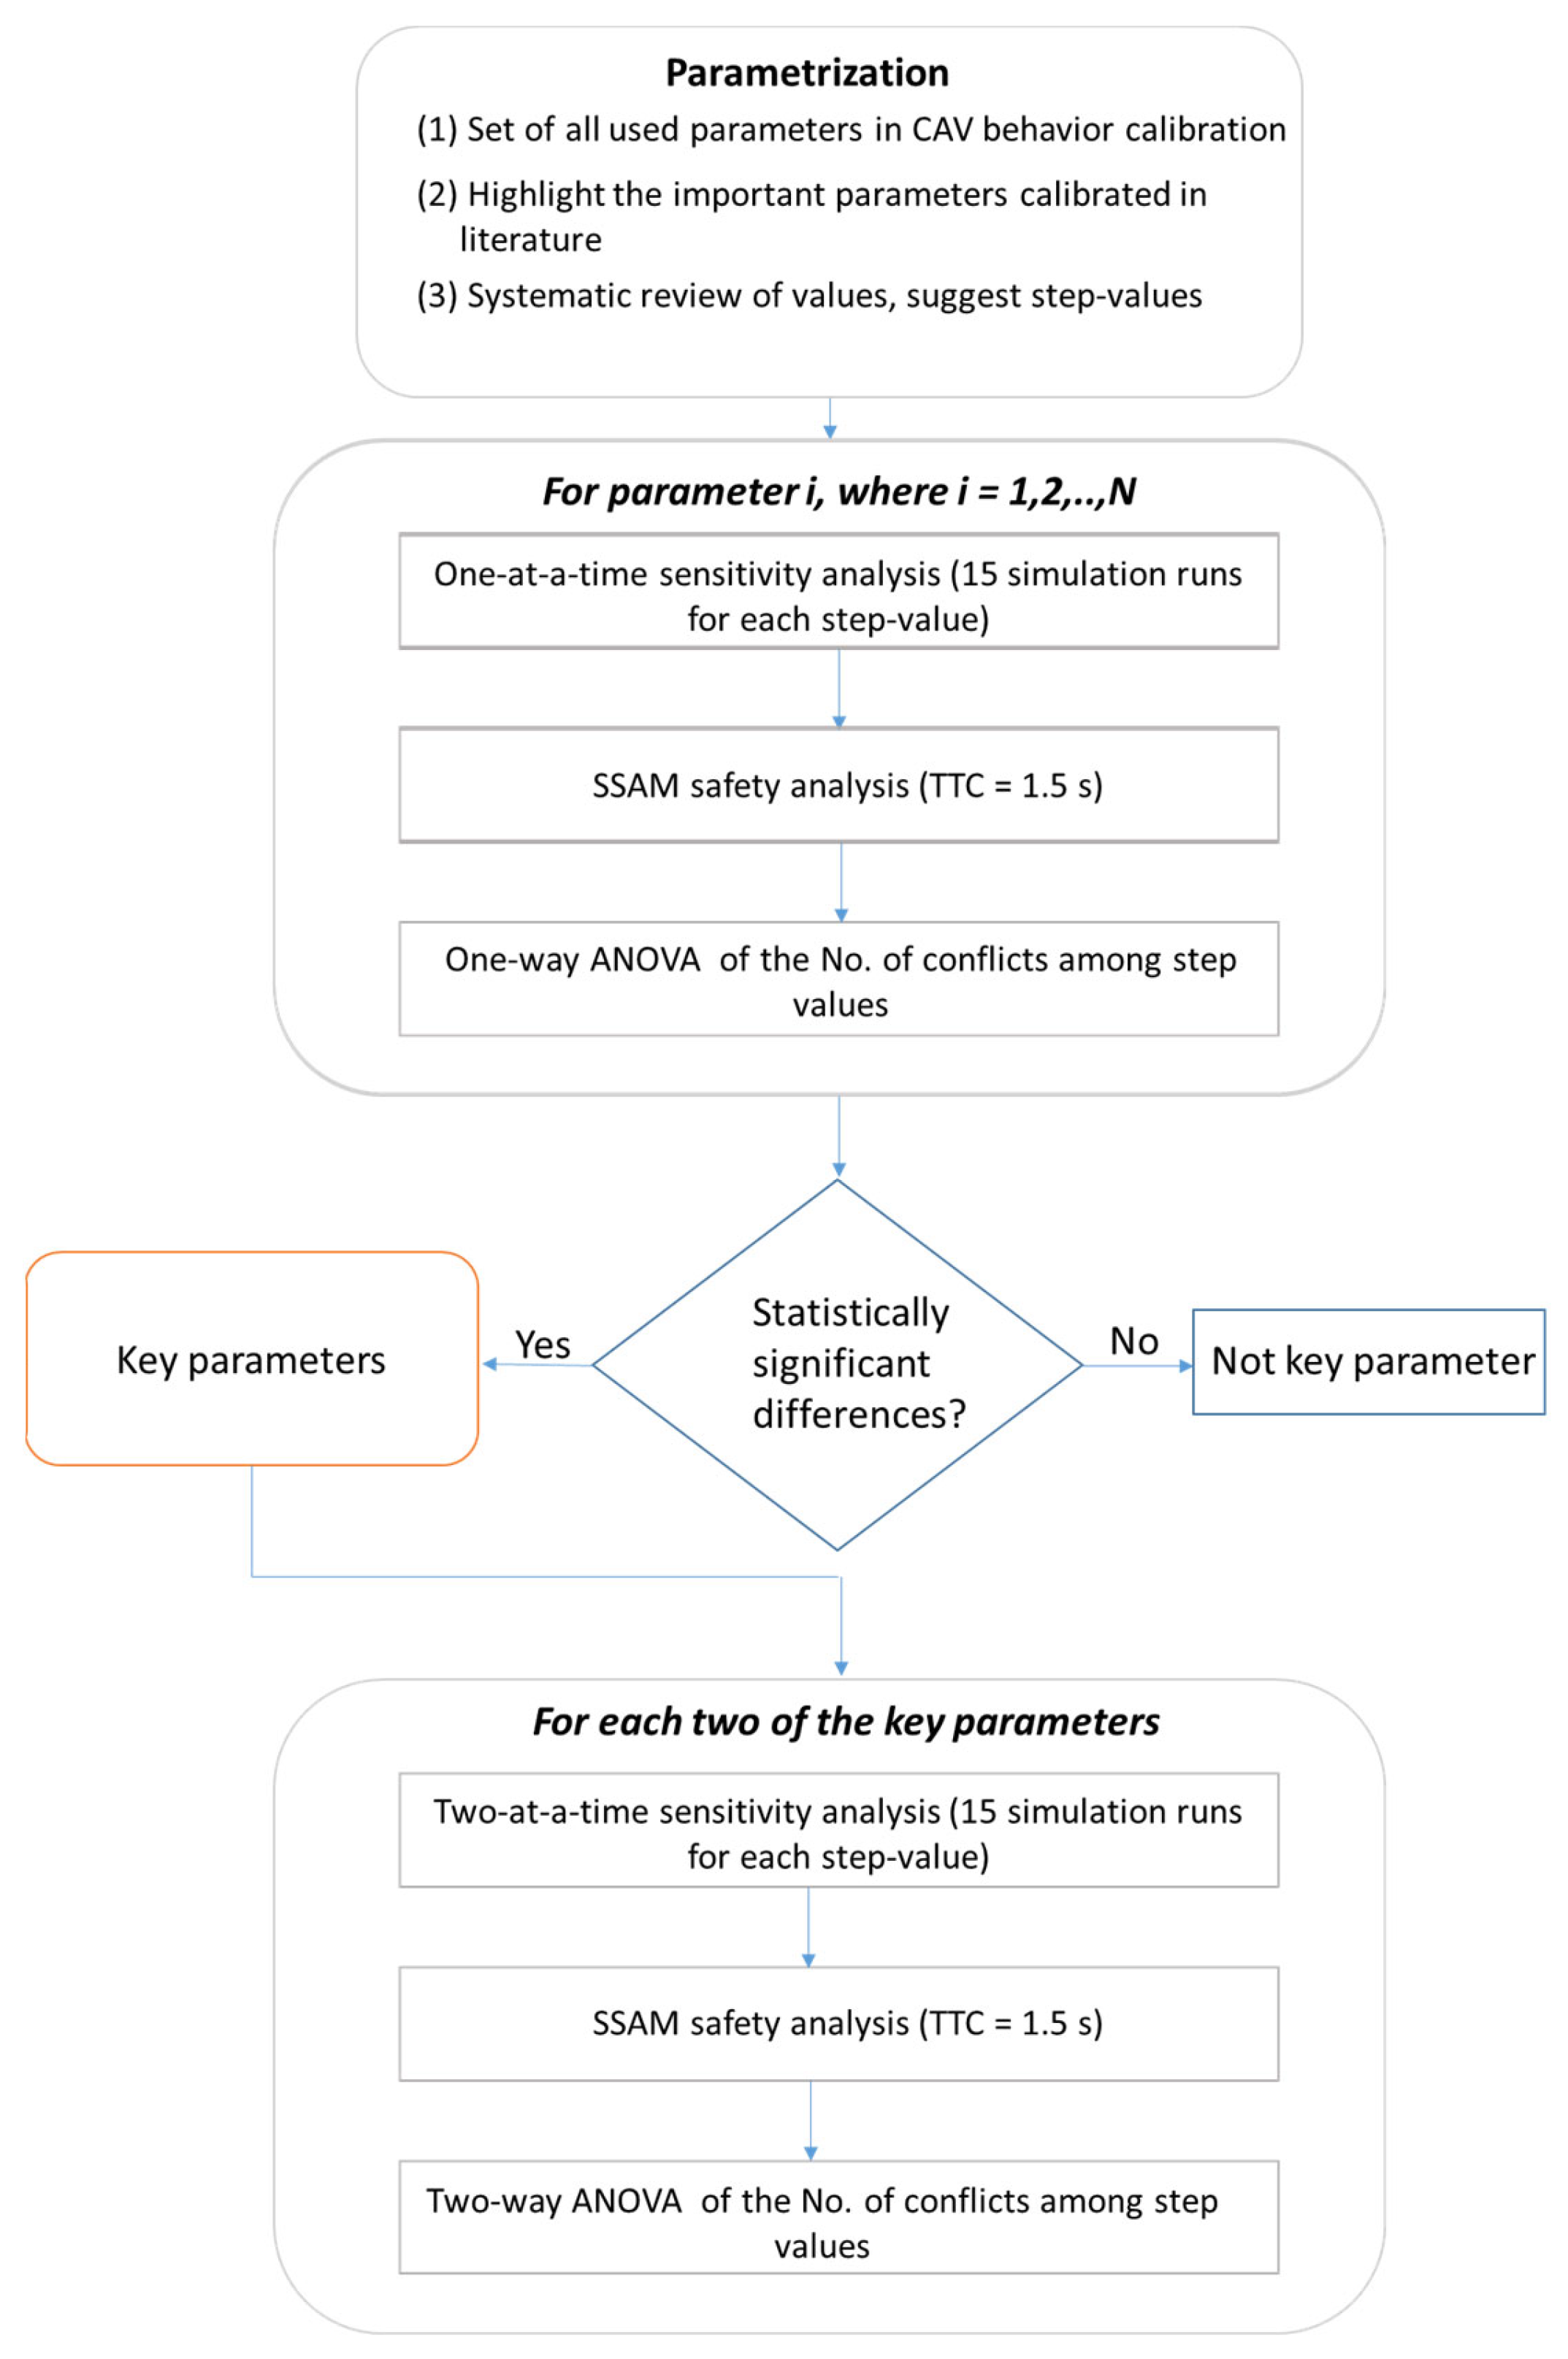
Therefore, the aim of this study is to thoroughly analyse CAV driving behaviour on roads from a safety perspective. Specifically, this study conducts a sensitivity analysis of traffic safety that, for the first time, aims to discover the effects of varying the values of widely acknowledged driving parameters used in the calibration of CAV behaviour in microsimulation models. A one-at-a-time sensitivity analysis is performed for each parameter to identify the key parameters with a higher effect on traffic safety. Subsequently, these significant parameters are analysed two at a time to gain a better understanding of their simultaneous effects.
In other simulation-based traffic safety studies (e.g., [9,10,11]), traffic safety is determined by analysing traffic conflicts identified using the surrogate safety assessment model (SSAM). Traffic conflicts refer to observable non-crash incidents where there is a risk of accidents due to interactions between various road users in terms of their spatial and temporal trajectories if they do not alter their paths [12]. Conflicts have proven to be capable of reflecting traffic safety on roads as they are highly correlated with crashes [8]. Traffic simulation outputs, such as vehicle trajectories, are analysed using SSAM with predefined time-to-collision (TTC) thresholds. Interactions in which the TTC values fall below a predefined threshold are considered conflicts. Furthermore, statistical tests, such as one-way and two-way analysis of variance (ANOVA), are conducted on the explored parameters.
The remainder of this paper is organised as follows: Section 2 presents a literature review on the impact of CAVs on safety. Section 3 describes the methodology. The results of the sensitivity analysis are presented and discussed in Section 4. Finally, in Section 5, we draw conclusions from this study and discuss further developments and potential future research.

2. Literature Review

Traffic simulation platforms provide a practical method for evaluating various scenarios and fleets, including the operation of connected and autonomous vehicles (CAVs). The literature utilizes several traffic microsimulation platforms such as Aimsun, VISSIM, PARAMICS, and SUMO, each with different traffic flow models. The findings of these studies are comparable, indicating that CAVs can improve traffic safety, especially in scenarios with high penetration rates (e.g., [9,10,11]). However, each study used its own proposed calibration parameters and values based on their estimation of future CAV behaviour. To obtain useful simulation outcomes, the dynamic and stochastic nature of data, along with the stochastic nature of traffic simulation models and internal calibration parameters, must be considered [13]. Consequently, without a good understanding of the parameters that dominate a model during specific operations, the use of model-based algorithms in this area becomes challenging [14].
The most relevant research to the current study, which evaluates the use of different parameter values in simulation, was conducted by Xie et al. [15]. They calibrated SMARTS’s model parameters for each automation level, controlled the percentage of different vehicle types, and evaluated various data types from simulation runs to quantify the impact of autonomous vehicles on traffic efficiency and safety. They explored the effect of varying some parameters such as maximum acceleration, maximum deceleration, clearance, minimum headway, aggressiveness factor, and reaction time on traffic efficiency (travel time) and road safety (traffic conflicts) on freeways and urban streets with different traffic volumes. Their general conclusion proposed that greater aggressiveness in car-following parameters and shorter reaction times are key factors contributing to the improvement in traffic efficiency. However, their study mainly focused on automation levels and not on parameter sensitivity analysis. They calibrated all the model parameters’ values simultaneously among different traffic demands and did not specifically investigate the impact of changing these parameters. Similarly, Miqdady et al. [16,17] proposed various values for Gipps’ car-following and lane-change models among automation levels and vehicle types (passenger car, heavy vehicle). However, like [15], they ran the various calibrated values simultaneously without exploring the impact of changing these parameters.
The following paragraphs highlight the commonly used parameters for CAV calibration and discuss the values proposed in the literature, which justify the suggested values used in the sensitivity analysis.
The parameters most commonly used are those related to car-following theory (longitudinal movement parameters), specifically acceleration and deceleration parameters. Researchers agree on their importance in understanding the impact of CAVs on traffic safety and efficiency [18,19]. However, other researchers have discussed the significance of calibrating other less frequently used parameters, such as the lane-changing parameters, as they believe that CAVs are expected to engage in more cooperative lane changes compared to HDVs, directly impacting traffic efficiency and safety [18]. Other variables are also assumed to have a crucial influence on traffic safety, although they were not frequently considered in calibration due to limitations in microsimulation platforms. For example, reaction time is a highly important parameter [19] that has recently been calibrated by vehicle type with the introduction of the API in the Aimsun platform, leading researchers to consider lower reaction times for CAVs.
Based on a comprehensive review of simulation-based studies that calibrated CAVs in their models, the parameters were classified into three attribute types: (1) parameters directly related to technology advancement (e.g., reaction time and clearance); (2) longitudinal movement parameters (e.g., acceleration, deceleration, speed oscillation, and platooning); and (3) lateral movement parameters (e.g., lateral clearance, look-ahead distance, and overtaking-speed threshold). Each study used three to five different parameters to calibrate CAV behaviour. Longitudinal movement parameters are the most acknowledged parameters, indicating that the major expected changes in CAV driving behaviour are related to this type of parameter. Therefore, the evaluated safety benefit of CAVs in the literature could be highly correlated with the harmonisation of longitudinal traffic flow and the enhancement of traffic safety.
This study suggests examining several parameters that are either frequently used in CAV calibration or important from a traffic safety perspective.
Figure 1 shows the parameters used in this study and the range of values found in the literature for each of them.
On the other hand, Table 1 summarizes the proposed values for the sensitivity analysis based on the discussion provided in this section regarding the literature values.
Reaction time is one of the most proposed technology advancements in autonomous driving [18,19,20]. However, reaction time is considered as a global parameter in modelling platforms and cannot be changed during simulation. Aimsun Next, in its recent editions, allows for the modelling of this feature for CAV modelling. As the majority of previous studies used VISSIM for CAV simulations, this parameter was uncommon during calibration. Zhang et al. [22] used a value of 0.5 s while simulating CAVs with an external driver model extension. Other studies that have used the Aimsun Next platform assumed that CAVs should react within 0.1 s [20,21]. In a sensitivity analysis study, Xie et al. [19] applied different values (2.0, 1.5, 1.0, 0.5, and 0.0 s for CAV levels from Level 0 to Level 4, respectively). As the default reaction time for HDVs in Aimsun platform is 0.8 s, and considering the high impact associated with this parameter in traffic safety, this study proposes the following values to be examined: 0.1, 0.2, 0.3, 0.4, 0.5, 0.6, 0.7, and 0.8 s.
The clearance between two vehicles in the standstill condition (i.e., the minimum standstill headway space) or the minimum gap is also an important parameter for safety considerations. In general, CAVs are expected to maintain shorter distances than HDVs [18,20]. In previous studies that used PTV–VISSIM models for modelling CAV, 1.2 m was suggested by Stanek et al. [18] and 0.5 m was suggested by Sinha et al. [29], compared to the default value in that model (1.5 m). Morando et al. [14], who used two calibrated models (ATKIN [19] and PTV [30] models), utilised their suggested values for clearance (0.5 and 0.75 m). Using the SUMO model, HDV clearances are averaged to 2.5 m, whereas they were suggested to be 1.5 m for Level 2 and 1.0 m for Level 4 [2]. Xie et al. [15] used several values (1.0, 1.5, 2.0, 2.5, and 3.0 m) for different levels of automation (from Level 4 to Level 0, respectively). This study also suggests testing the effect of changes in this parameter on traffic safety using different values: 0.5, 1.0, and 1.5 m.
Regarding the wide review of CAV acceleration and deceleration, the maximum acceleration is the most frequent and debatable parameter used in CAV calibration (Figure 1). Some studies have suggested lower values for CAVs than for HDVs [22,23], whereas others have considered higher values [15,19,29]. Furthermore, others have maintained the same behavioural pattern [1,18,24]. Karjanto et al. [3] explained that the corresponding value should be related to the driving style. They suggested a higher value than for HDVs in the case of an aggressive driving style, whereas a cautious driving style should be represented by low values, similar to light rail transit values (1 m/s²) [3]. On the other hand, regarding the level of automation, Guériau and Dusparic [23] suggested that the maximum acceleration will decrease with the level of automation; for Level 0, Level 2, and Level 4, they suggested values of 2.5, 1.5, and 1.0 m/s², respectively. However, Xie et al. [15] claimed that this value should increase from Level 0 to Level 4 from 1.4, 1.6, 1.8, 2.0, to 2.2 m/s², respectively. In this study, the proposed values to be tested are the following: 1.0, 2.0, 3.0, and 4.0 m/s², whereas the default value for HDVs in Aimsun is 3.0 m/s². Speed oscillations have also been reported in CAV traffic safety studies. However, the high correlation between this parameter and acceleration causes one parameter to reflect the other.
The same pattern of assumptions is related to CAV deceleration. In particular, normal deceleration has been presented within a wide range of values in the literature: between −1.3 and −7.5 m/s² (Figure 1). ATKINS [19] proposed a higher deceleration for autonomous vehicles. Guériau and Dusparic [23] and Stanek et al. [18] did not suggest any change between human and autonomous behaviours. However, the value reported by Zhang et al. [22] for CAVs is lower than that for human driving. Regarding the maximum deceleration, it was assumed to be the same for humans and autonomous driving in several studies (e.g., [9,11,18,19,20,21,22,23]). They explained that it should not be affected by technology; it is the capacity of the vehicle’s motor, which is an extreme value that is followed within both cases with the same magnitude [18]. Thus, this study follows previous research by studying traffic safety sensitivity using normal deceleration instead of maximum deceleration. The suggested values to be analysed are −2.0, −3.0, and −4.0 m/s².
Moreover, the sensitivity factor (that considers the effect of overestimating/underestimating leader deceleration) is a valuable indicator of traffic safety. A value below 1.0 refers to an underestimation case, whereas a value above 1.0 indicates that the vehicle overestimates the leader deceleration. To the best of our knowledge, only one study calibrated CAVs using Aimsun and attempted to change this parameter in the LEVITATE project [25]. They suggested two values: 0.7 for cautious driving and 0.5 for aggressive driving. They assumed that, as a safety constraint, CAVs are more aggressive than HDVs, even when a cautious driving style is adopted. This study suggests studying different values for both cases (underestimation and overestimation): 0.5, 0.7, 0.9, 1.0, 1.1, and 1.3.
Finally, because a greater number of vehicles in a platoon reflects more braking actions [27,28], the maximum number of vehicles in a platoon (platoon size) is important for traffic safety. The default maximum platoon size for Aimsun is ten vehicles. However, Aramrattana et al. [28] considered two, three, four, and five vehicles in their studies, whereas Faber et al. [27] considered five, seven, and ten vehicles. This study tests the following platoon sizes: four, six, eight, and ten vehicles.
Regarding lateral movement calibration, Stanek et al. [18] discussed that CAVs should perform more cooperative lane changes, as they could occur at a higher speed. In addition, they could be detected at smaller lateral distances. Nevertheless, lateral movement has not been sufficiently investigated in simulation-based studies. Recently, Delpiano [31] recommended a study of the lateral dimension according to CAV behaviour. Aimsun developers demonstrated the feasibility of calibrating these parameters in their traffic model. Several lateral parameters were investigated in this study. First, the lateral clearance between vehicles was investigated; the average default value in the Aimsun is 0.3 m, and 0.2, 0.3, 0.4, and 0.5 m values are used for the sensitivity analysis.
Subsequently, the effect of modifying the distance zones used in the lane-changing model and look-ahead distances was analysed. To adjust when lane changes are considered, a factor for minimum and maximum look-ahead distances is defined for CAV behaviour. For example, if the look-ahead distance is set to 200 m, the minimum look-ahead factor is 0.9 and the maximum look-ahead factor is 1.2, then the perceived distance will range from 180 m (calculated as 0.9 × 200) to 240 m (calculated as 1.2 × 200). All vehicles randomly select distances within the range of 180–240 m using a uniform distribution. These values are specified as a range in the Aimsun model to randomise the behaviour. Different values have been assumed in the Aimsun calibration of CAV studies (1.25, 1.5 [21], 1–1.25, and 1.1–1.3 [25]). Since CAVs are expected to exhibit high cooperation during lane-changing, the values in both studies are higher than the human driving range for both cautious and aggressive driving styles. Based on previous studies and to explore the effect of lower values, the following values are suggested for sensitivity analysis: 0.8–1.2, 0.9–1.2, 1–1.25, and 1.1–1.3.
Finally, the study also analyses the speed threshold for overtaking (overtaking-speed threshold). When the leading vehicle is slower than the overtake-speed threshold (%), it will attempt to overtake. Previous Aimsun-based studies [21,25] have suggested lower values than the human driving value (90%) for both cautious and aggressive driving (80 and 85%, respectively). This study investigates four values (80, 85, 90, and 95%) to cover all cases.

3. Methodology

3.1. Methodological Approach

CAVs are expected to influence traffic flow by introducing technological advances that result in faster reaction times and shorter standstill distances (clearance). Additionally, both acceleration and deceleration can lead to different longitudinal behaviours on the road. Following and reacting to the leader’s movement may also vary in the future of CAVs, indicating sensitivity to leader movement or different platoon sizes. Similarly, lateral movements are assumed to change with the introduction of CAVs.
To understand how CAVs will affect traffic flow models and how these changes will impact traffic safety, a sensitivity analysis is applied to the important variables in the models. Figure 2 illustrates the methodological approach used for the sensitivity analysis.
The approach begins by identifying the main parameters to be analysed in the sensitivity analysis, which are considered to have a crucial influence on CAV driving behaviour.
The parameters identified in Section 2 and their proposed different values are subjected to a ceteris paribus analysis. This involves changing the value of one parameter in the model while keeping all other parameters at their default values. This was accomplished after running a statistically sufficient number of microsimulation runs for each value of one parameter. Later, the vehicle trajectories (outputs) of these runs were introduced into the safety analysis tool (SSAM) to identify the number of conflicts. SSAM is a commonly used tool for extracting traffic conflicts based on TTC which is a widely used parameter for this purpose [8]. Following Batsch et al. [32], a threshold of 1.5 s was established for identifying critical scenarios, and the variance between the results of the examined values was tested using analysis of variance (ANOVA) to assess the effect of varying the studied parameter on traffic safety. If a statistically significant difference was observed among the examined values of a particular parameter, it was considered a key parameter.
In other words, statistically, varying a parameter without showing a significant effect on traffic safety indicated that this parameter is less important in CAV behaviour modelling. In contrast, the parameters that showed a significant effect on traffic safety are considered very important for CAV modelling and are forwarded to the next step. The following step is a two-at-a-time sensitivity analysis, that is, by varying two parameters simultaneously while keeping the others with the default value with a statistically sufficient number of microsimulation runs for each proposed value. Again, the outputs of varying each of the two parameters are analysed using SSAM with the same TTC threshold (1.5 s). The resulting number of conflicts is then subjected to two-way ANOVA to gauge the effect of the tested combinations of values.
Particularly, one-way as well as two-way ANOVA were conducted using StataMP 16, with a 95% confidence interval. Previously, the tests’ assumptions were verified. Shapiro–Wilk’s test was used to test the normality. The dependent variable (number of conflicts) was observed as normally distributed (i.e., p > 0.05) across each group of the independent variables (parameters’ values) in the one-way analysis and across each combination of independent variables (groups combining two values from two independent variables) in a multivariate normality analysis. Homogeneity of variances was also checked at both stages; Levene’s test of equality of error variances (based on means) was applied and the values were always non-significant (p > 0.05), indicating that the assumption of homogeneity of variances was supported.

3.2. Case Study and Traffic Validation

The road network selected to run the sensitivity analysis using Aimsun is a major motorway segment in Granada city, Spain (GR-30) (see Figure 3). The three-lane motorway segment is approximately 10 km in length, with ten access points (five entrances and five exits). An Open Street Map was used to extract the details of the modelled segment geometry (e.g., lane width, road curves, exits, and entrance details). Meanwhile, the detectors installed in the area by the General Traffic Directorate (Dirección General de Tráfico, DGT, Madrid, Spain) were used to collect the traffic flow, speed, and distribution (passenger car, pc; or heavy vehicle, hv) data among the sections at 15 min intervals.
The analysis period for the simulation was one hour under free-flow conditions. The data were for a regular day with off-peak hours (10:00–11:00). The gathered data were as follows: between 547–3570 pc/h and 89–260 hv/h for the GR-30 northbound, and between 809–3281 pc/h and 93–499 hv/h for the GR-30 southbound. The average reported speed varied from 83 km/h to 118 km/h. The warm-up period was set to 15 min in accordance with Wunderlich et al. [33] (based on the length of the road section and the average speed of vehicles) to guarantee that the model generated a suitable demand for the network at the starting time. To boost the simulation accuracy and reduce the likelihood of losing the vehicle movement details, following earlier studies (e.g., [9,11]), a time step of 0.1 s was used to generate the traffic operations.
The generated traffic operations were validated in terms of volume and speed by vehicle type (pc, hv) and for 15 min intervals following the Roads and Maritime Services modelling guidelines [34]. For more details about the validation process, refer to our previous analysis [16]. A preliminary analysis [26] was conducted to assign a statistically sufficient number of runs based on Shahdah et al.’s [35] equation, which was found to be 15 runs. Therefore, 15 runs were applied for each value for each parameter analysed in the one-at-a-time analysis, and then 15 runs were applied for each pair of examined values of the parameters analysed in the two-at-a-time sensitivity analysis. In total, 2985 runs were conducted in this study: 615 runs for the one-at-a-time analysis and 2370 runs for the two-at-a-time analysis after the significant parameters from a safety perspective were identified.

4. Results and Discussion

4.1. The Key Parameters

This study takes an important step toward understanding how the proposed changes in CAV behaviour can affect road traffic safety. As outlined in the previous sections, some parameters have been proposed to be analysed for calibrating CAV behaviour. The parameters included the reaction time, clearance, maximum acceleration, normal deceleration in the flow, sensitivity to leader deceleration, platoon size, lateral clearance, look-ahead distance, and overtaking-speed threshold. The results of changing their values one-at-a-time were obtained as the number of simulation-based traffic conflicts.
The results are illustrated in Table 2. The shaded values represent the default values in Gipps’ models (i.e., those related to human driving behaviour). Table 2 also shows the number of conflicts as the average value of the 15 runs and the standard deviation for each parameter value examined. The results of the ANOVA among the examined values of each parameter appear with letters in the last column (Homogeneous Subgroups) to identify statistically significant differences among the number of conflicts. The same letter indicates the same homogeneous subgroup between the different values of that parameter. Therefore, the parameters that showed only one letter are not considered for the next step (two-at-a-time analysis).
Technology advancements provided by CAVs are proposed to decrease the reaction time and change the clearance which promises to significantly enhance traffic safety. Xie et al. [19] confirmed these predictions when they tested several values of reaction time related to automation levels; shorter reaction times resulted in a lower number of conflicts in both freeways and urban streets and within different traffic volumes. Our results also show that the number of conflicts is highly sensitive to driver reaction time. Stanek et al. [18] also emphasised the significant change that faster reaction time could produce in both shorter headways and lane changes’ shorter gap acceptance. Table 2 shows that each 0.1 s change in reaction time presented statistically significant differences (p < 0.05) in the number of conflicts arisen, except for 0.2 to 0.5 s that shape two homogeneous groups. Reaction times equal to 0.2 and 0.3 s represent group b, and reaction times equal to 0.3, 0.4, and 0.5 s represent group c. Therefore, the main significant values are as follows: if compared to the reference value (0.8), the first 0.1 and 0.2 s decreases (0.7 and 0.6 s reaction time) have shown about 25 and 38% improvement, respectively, in traffic safety. Reaction times equal to 0.3, 0.4 and 0.5 s have registered a value higher than 50% of conflict reduction, and a drop of about two-thirds of the default conflicts is reached with 0.2 and 0.3 s reaction times. Lastly, a reaction time equal to 0.1 s improved traffic safety by about 77%.
However, the results show that traffic safety does not show a high sensitivity to clearance between vehicles under standstill conditions. However, the assertive driving style (0.5 m clearance) duplicated the traffic conflicts when compared with human driving clearance (1 m). However, in a highly cautious driving style (if clearance is higher than human-driven clearance) there is an improvement in traffic safety, but without statistically significant differences (p > 0.05) between the two values analysed (1.5 and 2 m) with percentages of traffic conflicts with respect to the default values equal to 70.2 and 64.7%, respectively. Xie et al. [15] examined traffic safety among levels of automation (with decreasing clearance by increasing automation level) and found higher traffic conflicts for small clearances. They also highlighted that this effect increases with higher traffic volumes (moderate and congested traffic conditions).
The behaviour related to longitudinal movement is expected to change with the introduction of CAVs. As discussed in Section 2, a wide range of assumptions were made in calibrating the car-following model parameters to represent CAV behaviour. In general, Table 2 shows that low values of maximum acceleration and normal deceleration may dramatically reduce traffic safety on the road (i.e., increase the number of conflicts), which agrees with the results in [36]. However, this could change if all vehicles exhibit the same cautious behaviour [37]. Table 2 also shows that the normal values around the default values did not show statistically significant differences (p > 0.05). However, as these parameters define the dynamics in the driving models, CAV behaviour calibration in the literature is mainly dependent on these parameters [5,19,29]. Moreover, regarding previous studies which calibrated CAV behaviour by assigning values of different parameters simultaneously (including acceleration and deceleration parameters), the results were as follows: studies which used low values (e.g., 1.0 and 1.5 m/s²) for CAV acceleration [22,23] presented a considerable effect on traffic safety enhancement; however, they calibrated the acceleration with other performance parameters that could enhance traffic safety on the road (i.e., with low reaction time or lower speed deviation). On the other hand, the use of values around the default value ([15,19,29]) did not significantly change the effect on traffic safety, which is confirmed by our sensitivity analysis.
Another parameter could point out the car-following issue, which is the sensitivity factor to leader deceleration. Both the underestimation (<1.0) and overestimation (>1.0) of the leader deceleration on the road negatively affect traffic safety. Many errors in programming, performance, or even the application of highly cautious or assertive driving behaviour can lead to a CAV which behaves with a high sensitivity or very low sensitivity with respect to its leader vehicle deceleration. Table 2 also presents an interesting finding. Traffic safety is highly sensitive to these two situations, and is more sensitive in the overestimation case (when the sensitivity factor is above 1). For example, traffic safety will not be statistically significantly affected (p > 0.05) if the leader deceleration is underestimated by 10% (sensitivity factor = 0.9), but this is not the case with an overestimation of 10% (sensitivity factor = 1.1), which will multiply traffic conflicts by 2.5 times (from 100% to 250%) which is in the same significant group as the underestimation of 30% of leader deceleration (sensitivity factor = 0.7). This indicates that the aggressiveness of the vehicle deceleration to its leader, which normally decelerates (overestimation), increases the potential of crashes significantly when compared to the case when the vehicle maintains its normal deceleration while the leader could present breaking behaviour.
The results related to platoon size are also analysed in this study. Four, six, eight, and ten vehicles in a platoon did not show a statistically significant difference in traffic safety (p > 0.05). Nevertheless, decreasing the number of vehicles in the platoon slightly enhanced the traffic safety and decreased the number of traffic conflicts. This result was previously reported by both [27,28], who explained that a higher number of vehicles in a platoon reflects more braking actions which may result in a higher number of conflicts.
As CAVs could also affect traffic behaviour in lateral movements, this study selected three parameters that reflect lateral movements and lane-changing manoeuvres to be analysed. First, several values of lateral clearance between vehicles were tested, and the results showed that increasing the lateral clearance could enhance traffic safety. However, there were no significant differences (p > 0.05). It should be highlighted that this analysis in urban and/or congested cases could have a significant effect on traffic safety.
Moreover, the upstream distance to the point where the vehicle is aware of its target lanes (look-ahead distance) for the lane-change process was studied by changing the range of the minimum and maximum look-ahead factors. Owing to the projected facilitation of CAV lane changing, all the ranges tested were for values above the default one. The results did not show any statistically significant differences (p > 0.05) among the ranges tested. The last parameter selected was the overtake-speed threshold. In the overtaking case of the vehicle moving forward, whenever a vehicle is constrained to drive slower than the overtake-speed threshold as a percentage of its desired speed, it will try to overtake. The considered thresholds for overtaking did not show statistically significant differences (p > 0.05) in the number of traffic conflicts. However, it can be indicated that the lower thresholds provided by [21,25] have shown a slight enhancement in traffic safety, if combined with very low values of reaction time and aggressiveness measures.

4.2. Key Parameters Combinations

The key parameters are those which have shown significant effects on traffic safety while changing their values and are also widely used in CAV behaviour calibration. The following non-key parameters were excluded before this step: platoon size, lateral clearance, look-ahead distance factor, and overtaking-speed threshold. Subsequently, a two-at-a-time sensitivity analysis accompanied by a two-way ANOVA was performed by combining the key parameters. Figure 4 shows the results of the two-way ANOVA (using StataMP 16) on the number of resulting conflicts (of 15 runs each at a two-way step value).
Appendix A presents detailed results with numbers and significant groups.
The results obtained by combining the effects of the technology advancement parameters (reaction time and clearance) are shown in Figure 4a. Traffic safety is improved by simultaneously decreasing the reaction time and increasing clearance at the same time. A short clearance (0.5 m) demonstrates the highest number of conflicts regardless of the reaction time. However, the effect is smoothed with very short reaction times (below 0.3 s), which shows a number of conflicts lower than the result of the default value (i.e., when the reaction time is 0.8 s and clearance is 1.0 m). These results are in line with Stanek et al.’s [18] discussion that CAVs will provide both shorter reaction time and clearance together, which indicates that lower reaction times will overcome the risk derived by lower clearance values.
The effect of another combination of key factors is illustrated in Figure 4b (reaction time/maximum acceleration), where the default value is the combination 0.8 s and 3.0 m/s². A clear impact can be extracted; both the reaction time and maximum acceleration are extremely significant parameters for traffic safety. Every small step in these parameters generates a significant group (see Appendix A). In addition, combinations which include low maximum acceleration (1 m/s²) reflect the highest adverse impact on traffic safety, regardless of the reaction time. Nevertheless, the shortest reaction times (0.1 s, 0.2 s) showed better safety in these cases. For the rest of the combinations with anything other than 1 m/s² maximum acceleration, a gradual improvement in traffic safety was registered by decreasing the reaction time and increasing the maximum acceleration. Only two studies have considered these two parameters at the same time ([16,22]). In [22], a low value of acceleration (1 m/s²) was combined with a 0.5 s reaction time, and their results varied between deteriorating and enhancing traffic safety on the road. However, their results were related to a special road configuration and policy operation (exclusive lanes). On the contrary, in [16], two different combinations for reaction time and maximum acceleration to calibrate CAVs in the same traffic model were used (0.5 s and 1 m/s²; and 0.1 s and 1 m/s²). They found similar results to this study (the combination 0.1 s and 1 m/s² provided lower number of conflicts).
A similar pattern was identified in the reaction time/normal deceleration case (Figure 4c), with a default value 0.8 s and −4.0 m/s². The scale clearly indicates that traffic safety improves by simultaneously decreasing the reaction time and increasing the normal deceleration at the same time. The results agree with the findings in [16], where their calibrated combination of 0.1 s and −3 m/s² resulted in less conflicts than the 0.5 s and −3 m/s² combination, indicating the crucial impact of the reaction time parameter.
Considering both reaction time and the sensitivity factor together (Figure 4d), in comparison with the default combination (0.8 s and 1.0), the results underline that, in general, traffic safety is more sensitive to reaction time as the number of conflicts decreases, mainly while decreasing the reaction time. Very short reaction times (0.1–0.3 s) resulted in the highest improvement in traffic safety, regardless of the fit of estimation of the leader deceleration.
In contrast, the effect of under/over estimation of the leader deceleration (i.e., the error in estimation) on traffic safety is adversely increased with an increase in the reaction time to take action and averting traffic incidents. These results agree with the LEVITATE project’s results ([20,25]), which after calibrating Gipps’ models for CAV behaviour with two different combinations of reaction time and sensitivity factor (0.1 s and 0.5; and 0.1 s and 0.7), they identified that the combination 0.1 s and 0.7 generated a smaller number of conflicts. Likewise, [16] found that the 0.5 s and 1.1 combination generates a higher number of conflicts than 0.1 s and 1.2.
Studying the effect of clearance and maximum acceleration together (with a default combination of 1.0 m and 3.0 m/s²) reflects the following: combining both high clearance/maximum acceleration values indicates a high traffic safety improvement (Figure 4e). Most of these two-way examined values follow homogeneous groups and represent a similar number of conflicts. The most significant groups with negative effects on traffic safety were 0.5 m and 1 m/s², and 1.0 m and 1.0 m/s². A similar effect was demonstrated by the clearance/normal deceleration combination (Figure 4f), with 1.0 m and −4.0 m/s² as the default combination. Increasing both values resulted in an enhancement in traffic safety. The combinations used in CAV calibration in [16] confirm the results of the current study, in that there are slight differences while the clearance is larger than 1.0 m.
Figure 4g compares the differences among maximum acceleration and normal deceleration combinations, with 3 m/s² and −4 m/s² as the default combination. The figure shows that combining low values of maximum acceleration (1 m/s² or even 2 m/s²) with different values of normal deceleration generates a significant negative effect on traffic safety. However, none of the other combinations, even with low deceleration (−2 m/s²), show statistically significant differences in the number of conflicts. Thus, traffic safety is more sensitive to maximum acceleration. However, on the one hand, both factors are regarded as sensitive factors in CAV calibration and in driving behaviour in general ([18,19]). And, on the other hand, as previously shown in this section, the changes regarding the two factors are affected by the reaction time combined value as well.
Regarding the sensitivity factor/clearance combinations (Figure 4h) where the default value is 1.0 and 1.0 m, an interesting result is shown: the under/overestimation of the leader deceleration, even with high percentages (30%), could be overcome by introducing sufficiently long clearance values (1.5, 2.0 m). However, shorter clearances (0.5, 1.0 m) would adversely affect traffic safety if combined with under/overestimation cases. The outcomes obtained by [37] showed that under large clearance values for CAVs (1.5 m), if the sensitivity factor is near the default value (i.e., lower underestimation/overestimation), a value equal to 1.1 resulted in better traffic safety than larger values (1.2).
In the sensitivity factor/maximum acceleration analysis (Figure 4i), where the default value was 1.0 and 3.0 m/s², the greatest traffic safety improvement was registered when the sensitivity factor was equal to 0.9 or 1.0, and the maximum acceleration shifted between 2 and 4 m/s² (i.e., the combinations 0.9 and 2.0 m/s², 0.9 and 3.0 m/s², 0.9 and 4.0 m/s², 1.0 and 2.0 m/s², 1.0 and 3.0 m/s², and 1.0 and 4.0 m/s²) without statistically significant differences among the means. A sensitivity factor of 0.7 also presented good safety values. This indicates that a low underestimation of leader deceleration (0.7 and 0.9) can be addressed by increasing the maximum acceleration. On the other hand, high underestimation/overestimation (sensitivity factor = 0.5 or 1.3) combinations show the worst results regardless of the maximum acceleration applied. Keeping the default value of maximum acceleration, LEVITATE [25] tested the values of 0.5 and 0.7 of the sensitivity factor and it was found in traffic safety evaluation [20] that the 0.7 and 3.0 m/s² combination resulted in a lower number of conflicts than the 0.5 and 3.0 m/s² combination, which is in agreement with the current results.
Again, from the sensitivity factor/normal deceleration analysis (Figure 4j), where the default value is 1.0 and −4.0 m/s², the high sensitivity to leader deceleration (0.9 or 1) presents the minimum brought-out traffic conflicts without statistically significant differences among their means, regardless of the normal deceleration on the road (2, 3, or 4 m/s²). The logical relationship between these two parameters is shown in Figure 4j. If the deceleration in traffic flow is already high (4 m/s²) and greatly underestimated (0.5 and 0.7), the risk will be higher, and traffic safety will worsen significantly. On the other hand, a small overestimation of leader deceleration could be overcome by higher deceleration values (the 1.1 and 4 combination). However, if the overestimation of leader deceleration is high (1.3), the negative effect on traffic safety will be significant, although the deceleration value is high (the 1.3 and 4 combination).
Likewise, under the same normal deceleration value (for example −3.0 and −4.0 m/s²), the 30% underestimation shows significantly better traffic safety than that of 50% underestimation, which agrees with [20,25].

5. Conclusions

Estimating the behaviour of connected and autonomous vehicles (CAVs) poses a challenge due to the limited availability and testing of these technologies among the general public. As transportation researchers delve deeper into the behaviour and operational constraints of CAVs, the sensitivity analysis applied in this study provides a reference point for gaining a comprehensive understanding of the effects on driving behaviour. This broader knowledge will offer insights to designers and decision makers, aiding in the enhancement of CAV programming to optimize traffic safety on the roads.
Therefore, this study aims to identify the critical behavioural driving parameters from a traffic safety perspective using simulation-based statistical analysis, employing both one-way and two-way ANOVA. Initially, the analysis is performed for each parameter individually and subsequently for different combinations of two parameters.
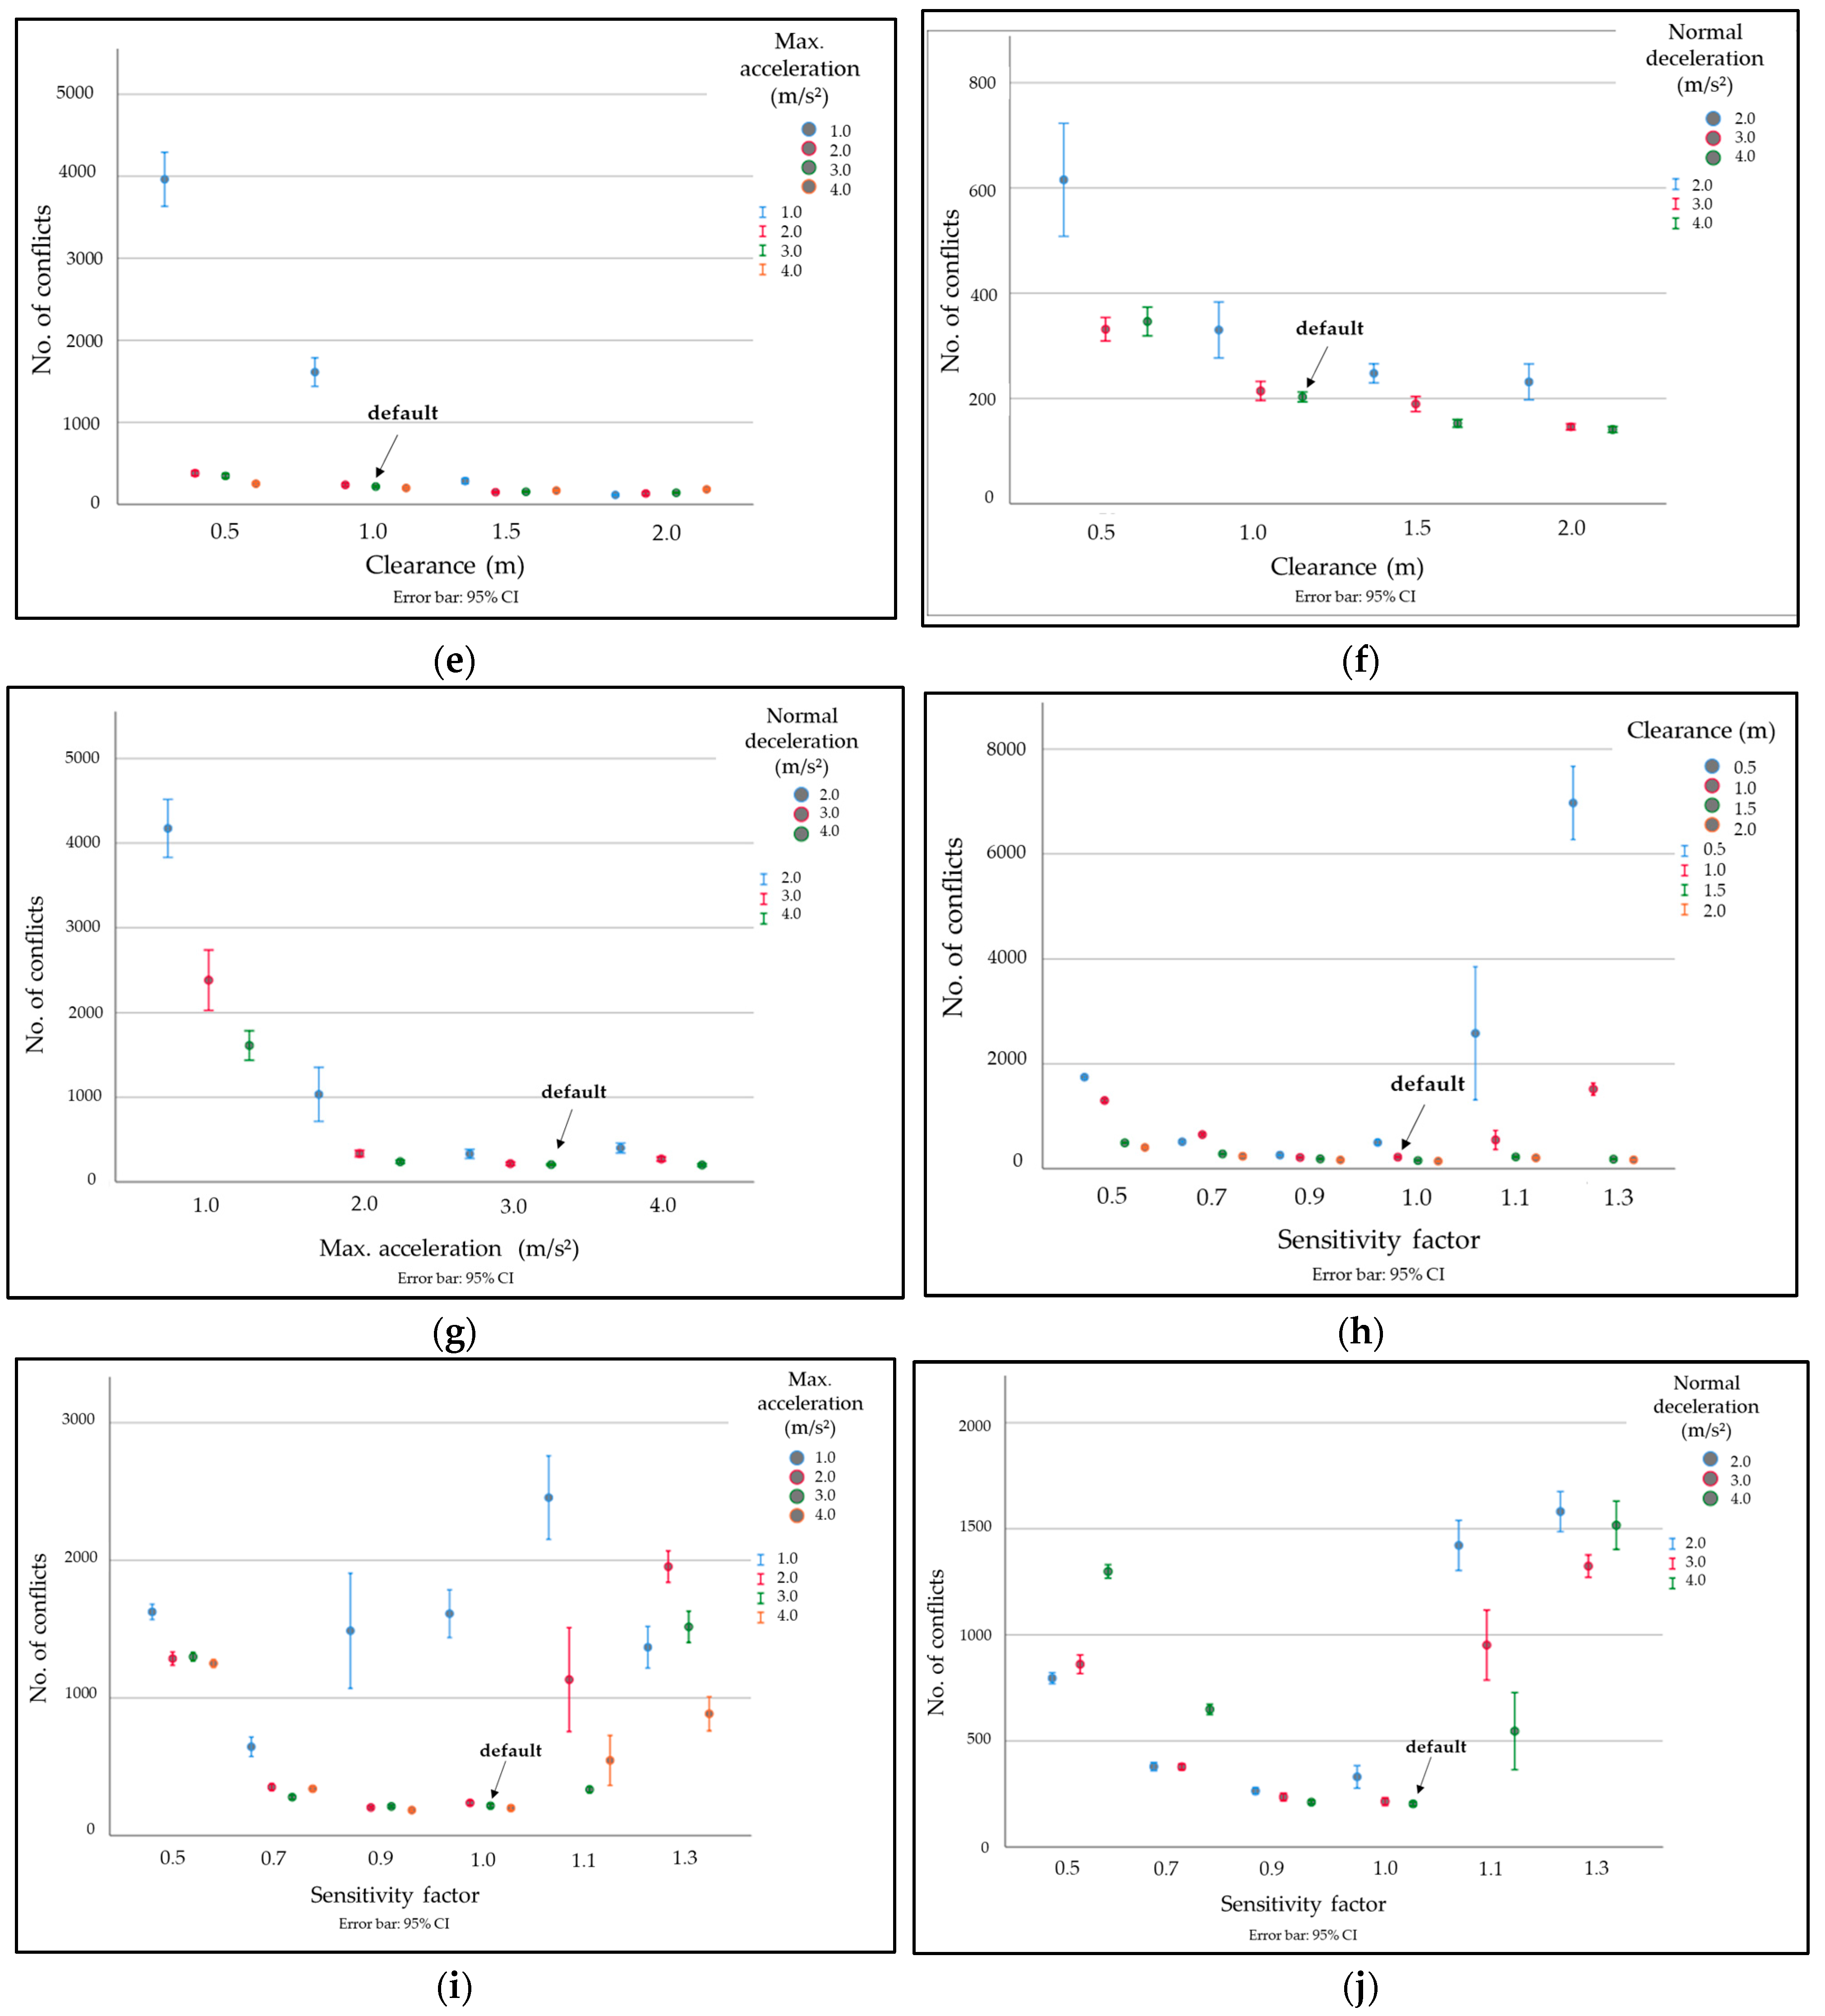
The one-at-a-time sensitivity analysis of the parameters highlighted the significant impact of varying the clearance, reaction time, sensitivity factor, maximum acceleration, and normal deceleration on traffic safety. The reaction time parameter showed a negative linear correlation with traffic safety. In addition, clearance, maximum acceleration, and normal deceleration at extremely low values have exhibited an extremely negative impact on traffic safety. A reasonable value for the sensitivity factor is recommended to be close to 1.0. Furthermore, traffic safety is not significantly influenced by the lateral movement parameters of motorways during off-peak traffic conditions. Finally, the platoons with four and six vehicles provided better traffic safety than those with eight or ten vehicles.
The main findings of the study are as follows: Maximum acceleration of 1 m/s² combined with any other parameter resulted in the highest number of conflicts. Among the maximum acceleration/normal deceleration combinations, those of high acceleration and deceleration yielded the best safety results. However, the maximum acceleration was more sensitive within these combinations. Traffic safety improved by decreasing the reaction time and simultaneously increasing the maximum acceleration or normal deceleration. To mitigate a minor underestimation (−10% to −30%) of the leader’s deceleration, it is advisable to increase the maximum acceleration and clearance. However, in the case of high underestimation/overestimation (−50% and +30%) of the leader deceleration, increasing the maximum acceleration is not sufficient to mitigate the negative effect on traffic safety, whereas a larger clearance achieves this outcome. In reaction time/sensitivity factor combinations, traffic safety is more sensitive to reaction time. Moreover, regardless of the fit of the assessment of the leading deceleration, very short reaction times (0.1–0.3 s) resulted in the largest reduction of conflicts.
However, this study has certain limitations. To date, CAV behaviour calibration has been limited to simulations and assumptions, and a calibration with real data is recommended for future studies. Moreover, the sensitivity analysis conducted in this study was a two-at-a-time analysis. Further optimisation of traffic safety using sensitivity analyses of all calibrated parameters are suggested to obtain the optimal combined effect for these parameters. The values used in the sensitivity analysis were the mean values of the studied parameters with normal distributions. To provide a better understanding of the effects of calibrating these parameters, sensitivity analyses with different parameter distributions (e.g., lognormal) should be applied. Finally, this study analysed a motorway segment under free-flow conditions. Analysing different road sections, road types, and traffic conditions may yield different results.

Author Contributions

Conceptualization, R.d.O. and J.d.O.; methodology, T.M., R.d.O. and J.d.O.; software, T.M.; formal analysis and investigation, T.M., R.d.O. and J.d.O.; data curation, T.M.; writing—original draft preparation, T.M.; writing—review and editing, R.d.O. and J.d.O.; supervision, R.d.O. and J.d.O.; funding acquisition, R.d.O. All authors have read and agreed to the published version of the manuscript.

Funding

This research was supported by the Research Project PID2019-110741RA-I00, funded by the Spanish State Research Agency under Grant MCIN/AEI /10.13039/501100011033.

Institutional Review Board Statement

Not applicable.

Informed Consent Statement

Not applicable.

Data Availability Statement

Data are available from the corresponding author upon request.

Acknowledgments

This work is part of the Research Project PID2019-110741RA-I00, funded by the Spanish State Research Agency MCIN/AEI/10.13039/501100011033. Thanks are given to the Spanish General Directorate of Traffic (DGT) for providing the traffic flow information for GR-30 segment. Tasneem Miqdady appreciates Aimsun in providing their postgraduate student license to help in completing this work.

Conflicts of Interest

The authors declare no conflict of interest. The funders had no role in the design of the study; in the collection, analyses, or interpretation of data; in the writing of the manuscript; or in the decision to publish the results.

Appendix A

This appendix presents the results of the two-way ANOVA for the key parameters discussed in Section 4.2. The tables below show the following for each two key parameters: the mean of the number of conflicts resulting from fifteen microsimulation-run analyses at each combined value, standard deviation, and homogeneous group identified in each two-way ANOVA (in each table, the same letter is used to indicate a homogeneous group with no statistically significant differences, and different letters denote statistically significant differences (p < 0.05)). The shaded cells in the table indicate the default values in the Aimsun driving model [38].
Table A1. Two-way ANOVA results of reaction time vs. clearance.
Clearance (m)
0.51.01.52.0
MeanSt.dGroupMeanSt.dGroupMeanSt.dGroupMeanSt.dGroup
Reaction time (s)0.110822.3e,g,h5010.3a,b,c357.3a,b257.1a
0.215533.4i7310.8b,c,d,e,f466.7a,b377.2a,b
0.322627.9j8710.7c,d,e,f445.5a,b404.9a,b
0.424830.7j,k9912.8d,e,f,g506.2a,b,c465.6a,b
0.528248.6k10518.1d,e,g,h498.3a,b,c457.6a,b
0.638466.2l13720.1g,h,i6811.6b,c,d,f6210.5a,b,c,f
0.747555.6m16419.2i10117.5d,e,g,h9916.9d,e,f,g
0.849795.2m21824.8j15313.3i14110.5h,i,
Note: The shaded cells in the table indicate the default values in the Aimsun driving model [38]. The same letter refers to a homogeneous group (no statistically significant differences).
Table A2. Two-way ANOVA results of reaction time vs. maximum acceleration.
Max Acceleration (m/s²)
1234
MeanSt.dGroupMeanSt.dGroupMeanSt.dGroupMeanSt.dGroup
Reaction time (s)0.142236.0j17711.1d,e,f,g,h5010.3a,b476.3a
0.228933.5i17328.5d,e,f,g,h7310.8a,b,c,d608.9b,c,d
0.362464.6j12915.1a,b,c,d,e,f,g8610.7a,b,c,d,e8512.9a,b,c,d,e
0.4757100.3K14225.2a,b,c,d,e,f,g9912.8a,b,c,d,e,f8510.1a,b,c,d,e
0.5774130.8k,l15522.2b,c,d,e,f,g,h10518.1a,b,c,d,e,f9022.3a,b,c,d,e
0.6848342.2k,l16720.5d,e,f,g,h13720.2a,b,c,d,e,f,g10117.3a,b,c,d,e,f
0.7868107.6l19034.7e,f,g,h,i16419.2c,d,e,f,g,h15021.7a,b,c,d,e,f,g,h
0.8992113.1l25028.6h,i21824.8g,h,i20022.8f,g,h,i,
Note: The shaded cells in the table indicate the default values in the Aimsun driving model [38]. The same letter refers to a homogeneous group (no statistically significant differences).
Table A3. Two-way ANOVA results of reaction time vs. normal deceleration.
Normal Deceleration (m/s²)
234
MeanSt.dGroupMeanSt.dGroupMeanSt.dGroup
Reaction time (s)0.114530.0c,d,e8617.9a,b5010.3a
0.216724.7e,f,g11016.2a,b,c7310.8a,b
0.332340.0J15018.6d,e,f8610.7a,b
0.438283.4k18239.7e,f,g,h9912.8a,b,c
0.541070.7k18231.3e,f,g,h10518.1b,c,d
0.637063.3j,k19733.7f,g,h13720.2c,d,e
0.746053.9l20524.0g,h16419.2e,f,g
0.848955.7l27231.0i21824.8h
Note: The shaded cells in the table indicate the default values in the Aimsun driving model [38]. The same letter refers to a homogeneous group (no statistically significant differences).
Table A4. Two-way ANOVA results of reaction time vs. sensitivity factor.
Sensitivity Factor
0.50.70.91.01.11.3
MeanSt.dGroupMeanSt.dGroupMeanSt.dGroupMeanSt.dGroupMeanSt.dGroupMeanSt.dGroup
Reaction time (s)0.1369.7a3612.2a3811.2a5010.3a,b6418.2a,b,c20259.1c,d,e,f,g,h,i
0.25715.5a,b5418.4a,b5716.8a,b7310.8a,b,c,d9313.7a,b,c,d,e,f,g27941.3h,I,j,k
0.31127.6a,b,c,d,e,f,g8416.1a,b,c,d,e,f649.8a,b,c8610.7a,b,c,d,e,f22323.7f,g,h,i,j35544.6j,k,l
0.41469.9a,b,c,d,e,f,g,h7619.7a,b,c,d7611.8a,b,c,d,e9912.8a,b,c,d,e,f,g30957.0i,j,k719274p,q
0.51835.9b,c,d,e,f,g, h,i6810.6a,b,c6316.4a,b,c10518.1a,b,c,d,e,f,g38671.2k,l846322.3m,q
0.685637.8m,q41828.4k,l,n14410.9a,b,c,d,e,f,g,h13720.2a,b,c,d,e,f,g686133.3o,p1045141.5r,s
0.798443.5m,r45339.8l,n23529.0g,h,i,j57419.2a,b,c,d,e,f,g,h915177.7m,r1149155.5s
0.8129957.5t64944.2o,p21116.0d,e,f,g, h,i21824.8e,f,g, h,I,j546328.0n,o1516205.3t
Note: The shaded cells in the table indicate the default values in the Aimsun driving model [38]. The same letter refers to a homogeneous group (no statistically significant differences).
Table A5. Two-way ANOVA results of clearance vs. maximum acceleration.
Max Acceleration (m/s²)
1234
MeanSt.dGroupMeanSt.dGroupMeanSt.dGroupMeanSt.dGroup
Clearance (m)0.53964595.7d37959.9c34649.1b,c25131.9a,b,c
11612313.5d23732.9a,b,c21824.8a,b,c19928.3a,b,c
1.528459.7a,b,c14816.5a,b15313.3a,b16816.2a,b,c
211420.2a13138.2a,b14110.5a,b18322.3a,b,c
Note: The shaded cells in the table indicate the default values in the Aimsun driving model [38]. The same letter refers to a homogeneous group (no statistically significant differences).
Table A6. Two-way ANOVA results of clearance vs. normal deceleration.
Normal Deceleration (m/s²)
234
MeanSt.dGroupMeanSt.dGroupMeanSt.dGroup
Clearance (m)0.5616193.9f33240.4d,e34649.1e
133096.1d,e21432.5a,b,c21824.8a,b,c
1.524848.7c,d19025.8a,b,c15313.3a,b
223261.6b,c14610.4a14110.5a
Note: The shaded cells in the table indicate the default values in the Aimsun driving model [38]. The same letter refers to a homogeneous group (no statistically significant differences).
Table A7. Two-way ANOVA results of maximum acceleration vs. normal deceleration.
Normal Deceleration (m/s²)
234
MeanSt.dGroupMeanSt.dGroupMeanSt.dGroup
Max acceleration (m/s²)14175620.5b2384644.9b1612313.5b
21033577.2b33467.8a23732.9a
333096.0a21432.5a21824.8a
4399106.1a26944.6a19928.3a
Note: The shaded cells in the table indicate the default values in the Aimsun driving model [38]. The same letter refers to a homogeneous group (no statistically significant differences).
Table A8. Two-way ANOVA results of sensitivity factor vs clearance.
Clearance (m)
0.51.01.52.0
MeanSt.dGroupMeanSt.dGroupMeanSt.dGroupMeanSt.dGroup
Sensitivity factor0.5174556.9c129957.4b,c49115.8a40437.3a
0.751134.9a69444.2a,b27914.5a30285.9a
0.925723.1a21116.1a18519.3a19338.2a
1.049795.2a21824.8a15313.3a15117.7a
1.125822296d546328.1a22221.6a17739.1a
1.369721264e1516205.3c1797.9a18122.6a
Note: The shaded cells in the table indicate the default values in the Aimsun driving model [38]. The same letter refers to a homogeneous group (no statistically significant differences).
Table A9. Two-way ANOVA results of sensitivity factor vs. maximum acceleration.
Max Acceleration (m/s²)
1234
MeanSt.dGroupMeanSt.dGroupMeanSt.dGroupMeanSt.dGroup
Sensitivity factor0.5162699.7g,h128686.8e,f,g129957.5e,f,g125051.5d,e,f
0.7644128.3b,c35143.6a,b64944.2d,c33922.0a,b
0.91488755.7e,f,g20316.1a21116.1a18418.3a
1.01612313.5f,g,h23732.9a21824.8a19928.3a
1.12456547.4i1133681.9d,e546328.0a,b,c546328.0a,b,c
1.31368273.4e,f,g1954206.3h1516205.3f,g885224.1c,d
Note: The shaded cells in the table indicate the default values in the Aimsun driving model [38]. The same letter refers to a homogeneous group (no statistically significant differences).
Table A10. Two-way ANOVA results of sensitivity factor vs. normal deceleration.
Normal Deceleration (m/s²)
234
MeanSt.dGroupMeanSt.dGroupMeanSt.dGroup
Sensitivity factor0.579647.2d,e86179.7e129957.5f
0.737935.5a,b37826.5a,b64944.2c,d
0.926426.9a23532.7a21116.1a
1.033096.0a21432.5a21824.8a
1.11422213.7f,g952298.3e546328.0b,c
1.31581170.7g132495.1f1516205.3g
Note: The shaded cells in the table indicate the default values in the Aimsun driving model [38]. The same letter refers to a homogeneous group (no statistically significant differences).

References

  1. Zhong, Z.; Lee, J.; Zhao, L. Traffic Flow Characteristics and Lane Use Strategies for Connected and Automated Vehicles in Mixed Traffic Conditions. J. Adv. Transp. 2021, 2021, 8816540. [Google Scholar] [CrossRef]
  2. Guériau, M.; Billot, R.; El Faouzi, N.E.; Monteil, J.; Armetta, F.; Hassas, S. How to assess the benefits of connected vehicles? A simulation framework for the design of cooperative traffic management strategies. Transp. Res. Part C Emerg. Technol. 2016, 67, 266–279. [Google Scholar] [CrossRef] [Green Version]
  3. Karjanto, J.; Yusof, N.M.; Terken, J.; Delbressine, F.; Hassan, M.Z.; Rauterberg, M. Simulating autonomous driving styles: Accelerations for three road profiles. MATEC Web Conf. 2016, 90, 01005. [Google Scholar] [CrossRef] [Green Version]
  4. Ye, L.; Yamamoto, T. Modeling connected and autonomous vehicles in heterogeneous traffic flow. Phys. A Stat. Mech. Its Appl. 2018, 490, 269–277. [Google Scholar] [CrossRef]
  5. Talebpour, A.; Mahmassani, H.S. Influence of connected and autonomous vehicles on traffic flow stability and throughput. Transp. Res. Part C Emerg. Technol. 2016, 71, 143–163. [Google Scholar] [CrossRef]
  6. Fagnant, D.J.; Kockelman, K. Preparing a nation for autonomous vehicles: Opportunities, barriers and policy recommendations. Transp. Res. Part A Policy Pract. 2015, 77, 167–181. [Google Scholar] [CrossRef]
  7. Gettman, D.; Pu, L.; Sayed, T.; Shelby, S. Surrogate Safety Assessment Model and Validation: Final Report; Publ. No. FHWA-HRT-08-051; Research, Development, and Technology Turner-Fairbank Highway Research Center: McLean, VA, USA, 2008; pp. 1–324. [Google Scholar]
  8. Wang, C.; Xie, Y.; Huang, H.; Liu, P. A review of surrogate safety measures and their applications in connected and automated vehicles safety modeling. Accid. Anal. Prev. 2021, 157, 106157. [Google Scholar] [CrossRef]
  9. Papadoulis, A.; Quddus, M.; Imprialou, M. Evaluating the safety impact of connected and autonomous vehicles on motorways. Accid. Anal. Prev. 2019, 124, 12–22. [Google Scholar] [CrossRef] [PubMed] [Green Version]
  10. El-Hansali, Y.; Farrag, S.; Yasar, A.; Shakshuki, E.; Al-Abri, K. Using Surrogate Measures to Evaluate the Safety of Autonomous Vehicles. Procedia Comput. Sci. 2021, 191, 151–159. [Google Scholar] [CrossRef]
  11. Morando, M.M.; Tian, Q.; Truong, L.T.; Vu, H.L. Studying the Safety Impact of Autonomous Vehicles Using Simulation-Based Surrogate Safety Measures. J. Adv. Transp. 2018, 2018, 6135183. [Google Scholar] [CrossRef]
  12. Souleyrette, R.; Hochstein, J. Development of a Conflict Analysis Methodology Using SSAM; Center for Transportation Research and Education, Institute for Transportation, Iowa State University: Ames, IA, USA, 2012. [Google Scholar]
  13. Schultz, G.G.; Rilett, L.R. Analysis of distribution and calibration of car-following sensitivity parameters in microscopic traffic simulation models. Transp. Res. Rec. 2004, 1876, 41–51. [Google Scholar] [CrossRef]
  14. Nolte, M.; Schubert, R.; Reisch, C.; Maurer, M. Sensitivity Analysis for Vehicle Dynamics Models—An Approach to Model Quality Assessment for Automated Vehicles. In Proceedings of the 2020 IEEE Intelligent Vehicles Symposium (IV), Las Vegas, NV, USA, 19 October–13 November 2020; pp. 1162–1169. [Google Scholar] [CrossRef]
  15. Xie, H.; Tanin, E.; Karunasekera, S.; Qi, J.; Zhang, R.; Kulik, L.; Ramamohanarao, K. Quantifying the impact of autonomous vehicles using microscopic simulations. In Proceedings of the 12th ACM SIGSPATIAL International Workshop on Computational Transportation, Chicago, IL, USA, 5 November 2019. [Google Scholar] [CrossRef] [Green Version]
  16. Miqdady, T.; De Oña, R.; Casas, J.; De Oña, J. Studying traffic safety during the transition period between manual driving and autonomous driving: A simulation-based approach. IEEE Trans. Intel. Transp. Syst. 2023, 24, 6690–6710. [Google Scholar] [CrossRef]
  17. Miqdady, T.; De Oña, R.; De Oña, J. In search of severity dimensions of traffic conflicts for different simulated mixed fleets involving connected and autonomous vehicles. J. Adv. Transp. 2023, 2023, 4116108. [Google Scholar] [CrossRef]
  18. Stanek, D.; Huang, E.; Milam, R.T.; Wang, A. Measuring Autonomous Vehicle Impacts on Congested Networks Using Simulation. In Proceedings of the Transportation Research Board (TRB) Annual Meeting 2018, Washington, DC, USA, 7–11 January 2018; Volume 18, pp. 1–19. [Google Scholar]
  19. ATKINS. Research on the Impacts of Connected and Autonomous Vehicles (CAV) on Traffic Flow; Summary Report; Department for Transport; ATKINS: Montréal, QC, Canada, 2016. [Google Scholar]
  20. Weijermars, W.; Hula, A.; Chaudhry, A.; Sha, S.; de Zwart, R.; Mons, C.; Boghani, H. LEVITATE: Road Safety Impacts of Connected and Automated Vehicles. 2021. Available online: https://levitate-project.eu/downloads/ (accessed on 16 July 2021).
  21. Mesionis, G.; Brackstone, M.; Gravett, N. Microscopic Modeling of the Effects of Autonomous Vehicles on Motorway Performance. Transp. Res. Rec. 2020, 2674, 697–707. [Google Scholar] [CrossRef]
  22. Zhang, J.; Wu, K.; Cheng, M.; Yang, M.; Cheng, Y.; Li, S. Safety Evaluation for Connected and Autonomous Vehicles’ Exclusive Lanes considering Penetrate Ratios and Impact of Trucks Using Surrogate Safety Measures. J. Adv. Transp. 2020, 2020, 5847814. [Google Scholar] [CrossRef]
  23. Guériau, M.; Dusparic, I. Quantifying the impact of connected and autonomous vehicles on traffic efficiency and safety in mixed traffic. In Proceedings of the 2020 IEEE 23rd International Conference on Intelligent Transportation Systems, ITS, Rhodes, Greece, 20–23 September 2020; pp. 1–8. [Google Scholar] [CrossRef]
  24. Makridis, M.; Mattas, K.; Ciuffo, B.; Raposo, M.A.; Thiel, C. Assessing the Impact of Connected and Automated Vehicles. A Freeway Scenario. In Advanced Microsystems for Automotive Applications 2017; Springer: Cham, Switzerland, 2018; pp. 213–225. [Google Scholar] [CrossRef]
  25. Papazikou, E.; Zach, M.; Boghani, H.C.; Elvik, R.; Tympakianaki, A.; Nogues, L.; Hu, B. Detailed List of Sub-Use Cases, Applicable Forecasting Methodologies and Necessary Output Variables; Deliverable D4.4 of the H2020 project LEVITATE; no. 824361; LEVITATE, University of Loughborough: Loughborough, UK, 2020. [Google Scholar]
  26. Miqdady, T.; De Oña, R.; De Oña, J. Quantifying the Safety Impact of Connected and Autonomous Vehicles in Motorways: A Simulation-Based Study. In Proceedings of the 2021 XIV Congreso de Ingeniería del Transporte (CIT 2021, Burgos, Spain, 6–8 July 2021; pp. 2654–2671. [Google Scholar] [CrossRef]
  27. Faber, T.; Sharma, S.; Snelder, M.; Klunder, G.; Tavasszy, L.; van Lint, H. Evaluating Traffic Efficiency and Safety by Varying Truck Platoon Characteristics in a Critical Traffic Situation. Transp. Res. Rec. 2020, 2674, 525–547. [Google Scholar] [CrossRef]
  28. Aramrattana, M.; Habibovic, A.; Englund, C. Safety and experience of other drivers while interacting with automated vehicle platoons. Transp. Res. Interdiscip. Perspect. 2021, 10, 100381. [Google Scholar] [CrossRef]
  29. Sinha, A.; Chand, S.; Wijayaratna, K.; Virdi, P.N.; Dixit, V. Comprehensive safety assessment in mixed fleets with connected and automated vehicles: A crash severity and rate evaluation of conventional vehicles. Accid. Anal. Prev. 2020, 142, 105567. [Google Scholar] [CrossRef]
  30. PTV. Autonomous Vehicle Lateral Space—Example Description; PTV AG: Karlsruhe, Germany, 2017. [Google Scholar]
  31. Delpiano, R. Understanding the lateral dimension of traffic: Measuring and modeling lane discipline. Transp. Res. Rec. 2021, 2675, 1030–1042. [Google Scholar] [CrossRef]
  32. Batsch, F.; Daneshkhah, A.; Palade, V.; Cheah, M. Scenario optimisation and sensitivity analysis for safe automated driving using gaussian processes. Appl. Sci. 2021, 11, 775. [Google Scholar] [CrossRef]
  33. Wunderlich, K.; Vasudevan, M.; Wang, P. Traffic Analysis Toolbox Volume III: Guidelines for Applying Traffic Microsimulation Modeling Software 2019 update to the 2004 Version; U.S. Department of Transportation, Federal Highway Administration: Washington, DC, USA, 2019.
  34. Roads & Maritime Services. Traffic Modelling Guidelines; Roads & Maritime Services: Sydney, NSW, Australia, 2013. [Google Scholar]
  35. Shahdah, U.; Saccomanno, F.; Persaud, B. Application of traffic microsimulation for evaluating safety performance of urban signalized intersections. Transp. Res. PART C 2015, 60, 96–104. [Google Scholar] [CrossRef]
  36. Riaz, F.; Jabbar, S.; Sajid, M.; Ahmad, M.; Naseer, K.; Ali, N. A collision avoidance scheme for autonomous vehicles inspired by human social norms. Comput. Electr. Eng. 2018, 69, 690–704. [Google Scholar] [CrossRef]
  37. Virdi, N.; Grzybowska, H.; Waller, S.T.; Dixit, V. A safety assessment of mixed fleets with Connected and Autonomous Vehicles using the Surrogate Safety Assessment Module. Accid. Anal. Prev. 2019, 131, 95–111. [Google Scholar] [CrossRef] [PubMed]
  38. Aimsun Next. Aimsun Next 20 User’s Manual; Aimsun Next Version 20.0.2; Aimsun Next: Barcelona, Spain, 2020. [Google Scholar]
Figure 1. Parameter values used for CAV calibration in the literature.
Sustainability 15 09990 g001
Figure 2. Framework of the applied sensitivity analysis.
Sustainability 15 09990 g002
Figure 3. The modelled study area.
Sustainability 15 09990 g003
Figure 4. Two-way impact of key parameters in CAV calibration: (a) reaction time (s) vs. clearance (m); (b) reaction time (s) vs. maximum acceleration (m/s²); (c) reaction time (s) vs. normal deceleration (m/s²); (d) reaction time (s) vs. sensitivity factor; (e) clearance (m) vs. maximum acceleration (m/s²); (f) clearance (m) vs. normal deceleration (m/s²); (g) maximum acceleration (m/s²) vs. normal deceleration (m/s²); (h) sensitivity factor vs. clearance (m); (i) sensitivity factor vs. maximum acceleration (m/s²); (j) sensitivity factor vs. normal deceleration (m/s²).
Sustainability 15 09990 g004aSustainability 15 09990 g004b
Table 1. The proposed values to be tested for each parameter.
ParameterValuesUsed for CAV Calibration
Reaction time (s)0.1[16,17,20,21]
0.2-
0.3-
0.4-
0.5[15,16,17,22]
0.6-
0.7-
0.8-
Clearance (m)0.5[19]
1.0[15,16,17]
1.5[15,16,17]
2.0-
Max. acceleration (m/s²)1.0[3,16,17,22,23]
2.0[15,16,17]
3.0[18,24,25]
4.0[5]
Normal deceleration (m/s²) −2.0[5]
−3.0[16,17,22]
−4.0[11,25,26]
Sensitivity factor0.5[25]
0.7[16,17,25]
0.9-
1.0[16,17]
1.1[16,17]
1.3[26]
Platoon size (No.)4.0[27,28]
6.0[27]
8.0-
10.0[27]
Lateral clearance (m)0.2-
0.3-
0.4-
0.5-
Look-ahead distance factor0.8–1.2[16,17]
0.9–1.2-
1.0–1.25[16,17,21,25]
1.1–1.3[16,17,25]
Overtake-speed threshold (%)80[21]
85[16,17,25]
90[16,17,20]
95[26]
Note: The shaded values are the default values in the Aimsun models.
Table 2. One-way ANOVA analysis results for the examined parameters.
ParameterExamined ValuesNo. of Conflicts
Mean (std.)
Homogeneous Subgroups *
Reaction time (s)0.150 (10.32)a
0.274 (10.84)b
0.387 (10.70)b,c
0.499 (12.86)c
0.5105 (18.07)c
0.6137 (20.17)d
0.7165 (19.23)e
0.8218 (24.86)f
Clearance (m)0.5497 (95.22)a
1.0218 (24.86)b
1.5153 (13.32)c
2.0141 (10.52)c
Max. acceleration (m/s²)1.01613 (313.50)a
2.0237 (32.95)b
3.0218 (24.86)b
4.0199 (28.34)b
Normal deceleration (m/s²) −2.0330 (96.01)a
−3.0250 (56.93)b
−4.0218 (24.86)b
Sensitivity factor0.51299 (57.48)a
0.7649 (44.17)b
0.9211 (16.07)c
1.0218 (24.86)c
1.1546 (328.01)b
1.31517 (205.33)d
Platoon size (No.)4.0215 (25.57)a
6.0202 (22.31)a
8.0206 (24.90)a
10.0218 (24.86)a
Lateral clearance (m)0.2208 (21.59)a
0.3218 (24.86)a
0.4202 (21.90)a
0.5199 (23.79)a
Look-ahead distance factor0.8–1.2218 (24.86)a
0.9–1.2222 (25.69)a
1.0–1.25216 (23.86)a
1.1–1.3210 (17.62)a
Overtake-speed threshold (%)80202 (26.38)a
85200 (16.67)a
90218 (24.86)a
95214 (16.79)a
* Different letters (a, b, etc.) denote statistically significant differences (p < 0.05) between the values of one parameter. Two or more values with the same letter denote a homogeneous subgroup. Note: The shaded values are the default values in Aimsun models.
Disclaimer/Publisher’s Note: The statements, opinions and data contained in all publications are solely those of the individual author(s) and contributor(s) and not of MDPI and/or the editor(s). MDPI and/or the editor(s) disclaim responsibility for any injury to people or property resulting from any ideas, methods, instructions or products referred to in the content.

