1. Introduction
A “price bubble” is a phenomenon in which the value of a commodity or asset deviates from its market price [
1]. The phenomenon frequently happens in various financial markets such as futures markets [
2], and it usually occurs due to reasons other than supply and demand [
3]. By deviating from market fundamentals, speculative additional demand could raise price volatility [
4]. The initial upward price trend of a commodity or asset builds anticipation for future price increases and draws in new speculators, but the expectations of speculators change when prices hit a certain range. This change results in a sharp decrease in commodity or asset prices, and the price bubble bursts [
1]. According to Alola (2022) [
5], this type of bubble can create a cycle of swiftly growing and reducing expenses that can be hard to predict and manipulate. In addition, price bubbles can results in the misallocation of resources, as sources are diverted from their most efficient uses [
6,
7]. During the bubble era, traders’ speculative actions were a significant factor in raising the price of food [
8]. Traders’ decisions to purchase and sell based on anticipated price changes can increase the volatility of food prices [
9]. Food price spikes can have a significant adverse impact on households’ purchasing power, especially in developing nations [
10].
The conflict between Russia and Ukraine, two major agricultural powers, has resulted in adverse socioeconomic consequences that may have a global impact and worsen further. This conflict is especially worrisome for global food security [
11]. Climate change also affects the inflation of food prices. As per [
12] research, climate change results in a reduction in food production and an escalation in food costs. Extreme weather events resulting from climate change, such as droughts, floods, and heat waves, have lowered crop yields, and this has had a noticeable influence on food production globally. As a result of droughts and heat waves that have lowered agricultural yields and crop quality, food costs may increase [
13].
Speculation in the commodities markets has also contributed to the inflation of food prices [
4,
14,
15,
16,
17,
18,
19]. Traders’ predictions of future food costs can cause market volatility and immediately impact the pricing of food commodities. There are two types of investors in the food sector. The first are long-term (fundamentalist) investors, and the second are short-term investors. Short-term investors are divided into speculators and manipulators [
20]. The impact of speculation on food prices is explained by two hypotheses: the efficient market hypothesis and the speculative bubble hypothesis. The efficient market hypothesis suggests that speculating on futures markets plays a crucial role in determining market liquidity and facilitating price discovery. The speculative bubble hypothesis suggests that an overabundance of conjecture leads to futures prices surpassing their market-clearing threshold [
21].
Food price bubbles are caused by several factors, including the rising demand for food commodities, which has resulted in a rapid and significant increase in food prices. According to [
22], between 2010 and 2050, the per capita and total food demand are projected to increase by 0% to 20% and by 35% to 56%, respectively, in the absence of climate change. Taking climate change into consideration expands the range of possible outcomes (+1% to +20% for per capita food demand and +30% to +62% for total food demand). The world population is expected to exceed 9.7 billion by 2050, posing unprecedented challenges to the global food system [
23]. Conflict, climatic shocks, and the COVID-19 pandemic have also contributed to the global food crisis since 2018, driving up food prices and negatively affecting food production and distribution [
24]. The increase in demand for biofuels has also contributed to the food price bubble [
25].
The increase in food costs has reduced the amount of food households can afford to buy, resulting in food insecurity, hunger, and malnutrition. In addition to affecting families’ food budgets, it has also reduced the amount of money they have for other necessities, such as healthcare and education. Since food accounts for a significant portion of family consumption expenditures, the food price bubble has had a significant impact on households, particularly those in low-income nations [
26]. It is critical to address the root causes of the food price bubble and implement policies that support disadvantaged households and promote food security.
The food price bubble has negatively affected small-scale farmers who require assistance finding markets and obtaining fair product pricing. According to the research of Lang and Heasman [
27] and Sheahan and Barrett [
28], the increase in food prices has reduced the incentives for small-scale farmers to improve their farming methods as they cannot profit from the price hikes. It has also made it even more difficult for them to compete with larger-scale producers and reach markets. Small-scale farmers now find it more difficult to produce food due to rising inputs, such as seed and fertilizer costs. Consequently, the food price bubble has resulted in a shift away from small-scale farming towards large-scale industrial agriculture, leading to its decline [
27].
Diverse policy interventions could be implemented to mitigate the adverse impacts of food price inflation. Investing more in agriculture, particularly in developing countries, is one of the primary policy responses [
29,
30]. This may be accomplished by giving small-scale farmers access to infrastructure, such as irrigation systems, and by providing them with training and assistance. Irrigation infrastructure investments may significantly boost agricultural yields, especially in arid regions, which can assist in enhancing food production and lowering food poverty [
31]. Investment in agriculture can result in higher yields and enhanced productivity, which can aid in reducing food insecurity and poverty in developing nations [
32]. Expanding social protection programs, such as cash transfers and food assistance, can mitigate the harm caused by the food price bubble to households by providing families with the financial resources to purchase food, healthcare, and education [
33]. Improving the global food distribution and reducing food waste can also reduce pressure on global food markets and make food more affordable for all. These initiatives may lead to a reduction in inequality and foster inclusive economic growth, resulting in overall development [
34].
Food price bubbles affect sustainability in several ways and have become an area of focus in recent times. The financialization of food commodity markets leads to increased price volatility, price comovement, and food price bubbles, but it is not entirely responsible for high and volatile food commodity prices. However, it has affected these markets [
35]. These bubbles have been attributed to a combination of factors, such as climate change, extreme weather conditions, and geopolitical tensions [
36,
37,
38,
39]. Developing countries are often heavily dependent on food imports, making them particularly vulnerable to price shocks [
40]. When food prices spike, many people in these countries are pushed into poverty, and hunger becomes widespread [
41]. This has significant implications for the achievement of the United Nations’ Sustainable Development Goals (SDGs), particularly SDG 1 (no poverty) and SDG 2 (zero hunger). The focus on food price bubbles is in part due to the significant impacts on sustainability concerning hunger, social unrest, and poverty [
42,
43,
44,
45,
46]. The occurrence of food price bubbles carries noteworthy implications for sustainability, encompassing issues such as hunger, poverty, social unrest, environmental degradation, and price volatility.
The primary objective of the research is to provide a comprehensive understanding of the food price bubble phenomenon, including its causes, consequences, and potential policy interventions. The research also aims to propose policy interventions to mitigate the adverse effects of food price inflation. The study investigates the existence of price bubbles in the food market and focuses on Turkey, which has been experiencing a sustained increase in food prices. The distinctive aspect of the study is that it reveals whether there is a bubble formation in food prices, which have increased around the world and especially in Turkey in recent years. At the time of the study, the increase in food prices started to slow down around the world, but this was not the case for Turkey. The study aims to investigate whether the rise in food prices in Turkey is a price bubble despite the global slowdown. The research first discusses the specific kinds of price bubbles, their causes, and their temporary and long-term consequences. It then gives an overview of the literature on price bubbles. Then, in the methodology, the SADF (Supremum Augmented Dickey–Fuller) and GSADF (Generalized Supremum Augmented Dickey–Fuller) tests are explained. In the sequel, the results of the analysis and the interpretations of these results are discussed, and the paper ends with a concluding section wherein the results of the analysis on food price bubbles are interpreted.
2. Literature Review
There is a large and growing body of empirical literature that tests to identify the existence of price bubbles. The literature on price bubbles is extensive, covering different markets and underlying assets. Studies such as [
47,
48] found evidence of price bubbles in commodities such as gold, copper, and Brent crude oil and in real estate markets, respectively. Researchers have identified various factors contributing to the formation of price bubbles, including investor irrationality and the impact of financial innovations [
49,
50]. Malkiel’s [
51] review of historical examples of asset-price bubbles discusses the role of policymakers in addressing them, while [
52] identifies components of speculative bubbles in the real estate market. Phillips and Yu [
53] create a new procedure for testing bubble migration across financial and commodity markets that serves as an early warning sign of bubble activity. The definition and detection of a price bubble have also been explored in different ways, such as testing for the presence of bubbles using the GSADF method [
54] or through martingale theory [
55]. The volatility of food prices has increased over the years, creating uncertainties for consumers and producers [
56]. Overall, the literature highlights the importance of understanding the nature and mechanisms of price bubbles to prevent their negative consequences. This section summarizes the studies and their findings.
In their research, Guloglu and Nazlioglu [
57] conducted an analysis of annual data from a sample of 111 countries, comprising 28 developed and 83 developing nations, from 1980 to 2007. The study aimed to investigate the impact of inflation rates on food prices, utilizing the panel soft transition regression method. The analysis revealed that inflation had a positive impact during periods of low inflation and a negative impact during periods of high inflation. In addition, it has been concluded that inflation has a positive effect in developed countries and a negative effect in developing countries.
Balcilar et al. [
58] aimed to identify bubbles in oil prices in their study. The authors employed the daily closing prices of crude oil denominated in US dollars for West Texas Intermediate (WTI) spanning from 2 January 1986 to 9 July 2013, and for Brent spanning from 20 May 1987 to 9 July 2013. Since 1986, there have been four distinct occurrences of extended bubbles in the price of crude oil. Two instances of persistent bubbles took place prior to 2000, and the remaining two instances occurred subsequently. Finally, empirical studies indicate that fluctuations and downturns in crude oil prices transpire due to various factors. At first glance, the event in question may be categorized as a political, military, financial, or economic shock.
In their study, Adämmer and Bohl [
18] used the MTAR approach to test for speculative bubbles in US corn, soybean, and wheat prices. The dataset was partitioned into two distinct subintervals, spanning from January 1993 to December 2002 and from January 2003 to December 2012. The empirical results suggest that wheat prices between 2003 and 2013 have had price bubbles, while corn and soybean prices have not.
In their research, Areal et al. [
59] employed the GSADF test to identify instances of explosive bubbles in a range of sectors, including food, beverages, agricultural raw materials, cereals, dairy, meat, oils and sugar indices, as well as 28 agricultural commodities. The study analyzed data from the years 1980–2012. The study revealed the presence of price bubbles in 60% of the indices examined and in 32.1% of the commodities in food markets. The study’s results can facilitate the development and implementation of tactics targeted at mitigating the effects of potential price spikes on food commodity markets.
Li et al. [
60] studied food price bubbles in China and government intervention in response to the phenomenon. In this study, a novel right-tailed unit root testing methodology is utilized to identify instances of price bubbles in the agricultural futures market of both the Chicago Board of Trade (CBOT) and China, over the timespan of 2005–2014. The authors determined that government policies, such as import tariffs and charge controls, had a massive impact on the conduct of food price bubbles in the country.
A study conducted by Wang et al. [
61] aimed to investigate the presence of several explosive bubble occurrences in global food markets through the application of the GSADF test. The study utilized the Food Price Index (FFPI) to examine the timeframe spanning January 1990 to August 2017. The findings revealed the occurrence of four instances of explosive bubble episodes, which were characterized by significant price volatility. The phenomenon of bubble episodes, characterized by a surge in market enthusiasm followed by a sudden decline, can be attributed to a disparity between the availability of goods and services and the level of consumer interest, the devaluation of the United States currency, the economic downturn, and conjecture. The results corroborate the hypothesis proposed by Masters, which suggests that significant bubble episodes can be attributed to considerable purchasing pressure resulting from index investments.
The study conducted by Zhang et al. [
62] aimed to investigate the occurrence of bubble formation in Chinese agricultural commodity prices. To achieve this objective, the researchers employed the SADF test and analyzed weekly data for six commodities, namely garlic, ginger, green onion, rice, corn, and wheat, over a period spanning 2009 to 2017. The emergence of bubbles in the pricing of agricultural commodities in China has been attributed to the global financial crisis and agricultural policy. Instances of price bubbles were identified in the prices of garlic during the years 2009, 2010, and 2016, ginger prices in 2013, corn prices in 2011, and wheat prices during the period of 2012–2013.
Huang and Xiong [
63] examined price bubbles in international sugar futures markets with the SADF test from 2006 to 2017. The results show 19 bubbles with characteristics similar in quantity, duration, and price variation. Empirical results show that price bubbles reflect supply and demand imbalances, market participants are sensitive, and market information exchanges frequently occur during the bubble period.
Mao et al. [
64] identified the existence of price bubbles in China’s primary agricultural commodity markets, specifically those for corn and soybeans. The authors employed a multinomial logistic model to assess the factors that contributed to the observed phenomenon. The findings suggest that the occurrence of price bubbles in the corn and soybean markets amounts to 5.48% and 3.91%, respectively, during the periods under investigation. Furthermore, it is observed that these bubbles tend to be linked with robust economic conditions, elevated interest rates and subdued inflation levels. The research additionally concludes that there exists a contrasting impact of market liquidity and speculation on the incidence of bubbles in the two markets, as well as global stocks-to-use and currency exchange rates.
In their study, Şahin Kutlu [
65] analyzed the effects of the IMF world food price index, exchange rate, industrial production index, and food exports on domestic food prices in Turkey with the help of the SVAR model with monthly data for the period August 2008–August 2020. According to the results of the analysis, it was seen that the other variables that had an effect on the exchange rate on food prices did not have a statistically significant effect.
In her study, Varlık [
66] examined the existence of food price bubbles between January 2007and September 2020 with the help of SADF and GSADF tests. In the study, food price bubbles in eight fragile countries were analyzed using FAO food price index data. According to the results of the analysis, short-term price bubbles were observed in Indonesia, South Africa, India, Russia, and Turkey during the 2008 global economic crisis. For the COVID-19 period, it was concluded that there was a price bubble that started in 2020 Q2 in Brazil, South Africa, India, Russia, Turkey, and Chile, including the period when the study was conducted, and that the largest food price bubble occurred in Turkey during this period.
In their study, Cavlak and Selvi [
67] looked at why food prices are going up around the world and how the COVID-19 pandemic has affected these price increases. Since the study is a review, no statistical analysis was made. It was determined that the increase in food prices became more and more regular in the summer of 2021, and it was claimed that the reasons for these changes in prices were climate change, an increase in input, labor and transportation costs, an increase in intermediary commissions and profit margins, and taxes. In addition, it was stated that the rise in inflation and exchange rates in general and the unethical attitudes of the sellers during the pandemic period also caused the price increases.
In their study, Khan et al. [
68] investigated vanilla price bubbles on a quarterly basis between 1971 and 2020 with the GSADF approach. According to the results obtained, a balloon formation was observed over five periods: 1980Q4–1983Q4, 1990Q4–1991Q4, 1996Q1–1997Q1, 2001Q1–2004Q4, and 2014Q3–2018Q3. The first balloon was due to Hurricane Hudah and the cartels; the second balloon was due to export tax and regulation; the third balloon was due to the removal of cartels and currency adjustment; the fourth balloon was due to political instability, hurricanes, and bad weather conditions; and finally, increased global demand and decreased supply, price speculation, decreased quality, and Hurricane Enawo caused the fifth bubble.
Chen, Yan, and Kang [
3] examined price bubbles in China’s futures market for agricultural commodities. In their study, they tested price bubbles using the GSADF test with data from 4 January 1999 to 28 October 2020. The authors located proof of charge bubbles in the market, which they attributed to elements such as supply and demand imbalances, speculation, and government policies.
The provided references describe studies that have investigated the phenomenon of price bubbles in various markets. Balcilar et al. [
58] identified bubbles in the prices of crude oil in four instances between 1986 and 2013, while Adämmer and Bohl [
18] examined corn, soybean, and wheat prices. Areal et al. [
59] employed the GSADF test to identify instances of explosive bubbles in various sectors, including food, beverages, agricultural raw materials, cereals, dairy, meat, oils, and sugar indices. Li et al. [
60] investigated food price bubbles in China, while Wang et al. [
61] identified several explosive bubble occurrences in global food markets. Zhang et al. [
62] investigated the bubble formation in agricultural commodity prices and Huang and Xiong [
63] examined price bubbles in international sugar futures markets. Mao et al. [
64] studied price bubbles in agricultural commodity markets, while Varlık [
66] examined the existence of food price bubbles in eight fragile countries. Khan et al. [
68] investigated price bubbles in vanilla prices, and Chen, Yan, and Kang [
3] investigated price bubbles in China’s futures market for agricultural commodities.
3. Materials and Methods
In this section of the study, information about the variables, dataset, and econometric analysis methods used in the research is provided. The research aims to examine the bubble formation behavior on food prices in Turkey and worldwide (FAO, OECD, IMF) between January 1992 and October 2022. The food price index of the Food and Agriculture Organization (FAO) reached its minimum value during the period of 2002–2005. Its highest value was realized in March 2022. It started to decline in April 2022. The food price index of the Organization for Economic Co-operation and Development (OECD) reached its lowest level in July 1992 and its highest value in October 2022. Since January 2021, it has been on the rise. In Turkey, food prices reached their lowest level in 1992–2001. Despite occasional declines, food prices have generally increased throughout the period under consideration, reaching their highest level in October 2022. Since October 2020, there has been an upward trend in food prices in Turkey. While the International Monetary Fund (IMF) food prices were at their lowest level in December 1992, they were at their highest in April 2022. When analyzed in general, it is seen that the data reached its highest value in 2022.
In this context, the bubble formation for Turkey food prices, Food and Agriculture FAO food prices, OECD food prices, and IMF food prices variables is examined with ADF (Augmented Dickey–Fuller) right-tailed test types SADF (Supremum Augmented Dickey–Fuller) and GSADF (Generalized Supremum Augmented Dickey–Fuller) tests. The SADF and GSADF tests are two widely used right-tailed unit root tests employed in detecting and date-stamping price bubbles in different markets, such as financially, in cryptocurrencies, foreign exchange, oil, energy, stock, housing, and food markets [
3,
61,
62,
63,
64,
68]. The SADF test is used to identify the existence of single price bubbles, whereas the GSADF test is employed to detect multiple bubbles in a series that may lead to biased results. Studies have shown that the SADF and GSADF tests produce unbiased and robust results when applied to detect the presence of irrational price bubbles caused by speculative movements or surpassing the assets’ true value [
69].
3.1. Standard Dickey–Fuller Test
The standard Dickey–Fuller test starts from the first difference of the random walk process in Equation (1) [
70].
Subtracting
from both sides of Equation (1) yields Equation (2).
When the definitions in Equation (3) are made, Equation (4), which is the without-constant and no-trend ADF model, is obtained.
The without-constant ADF model can be expressed as in Equation (4).
Models with a constant and trend are as in Equations (5) and (6).
Therefore, in the presence of a unit root, Otherwise, for a stationary series . The null hypothesis and alternative hypothesis will be as follows:
H0. δ = 0 (the series has a unit root; the series is non-stationary).
H1. δ < 0 (there is no unit root in the series; the series is stationary).
3.2. Augmented Dickey–Fuller (ADF) Test
While the standard DF test utilizes the AR(1) process, the error terms (
) lose their clean series property when there is a higher-order correlation in the series. In order to solve the problem of higher-order correlations than the AR(1) process, the ADF test utilizes the AR(p) process instead of AR(1) to add pth order lagged terms to the equations and revises the models in Equations (4)–(6) without a constant, and with a constant and trend as in Equations (7)–(9), respectively [
70].
The unit root hypotheses for the ADF test are the same as for the standard DF test and the asymptotic distribution properties of the statistic are not affected by the lagged difference terms added to the equation.
3.3. RADF (Rolling Augmented Dickey–Fuller), SADF (Supremum Augmented Dickey–Fuller), and GSADF (Generalized Supremum Augmented Dickey–Fuller) Tests
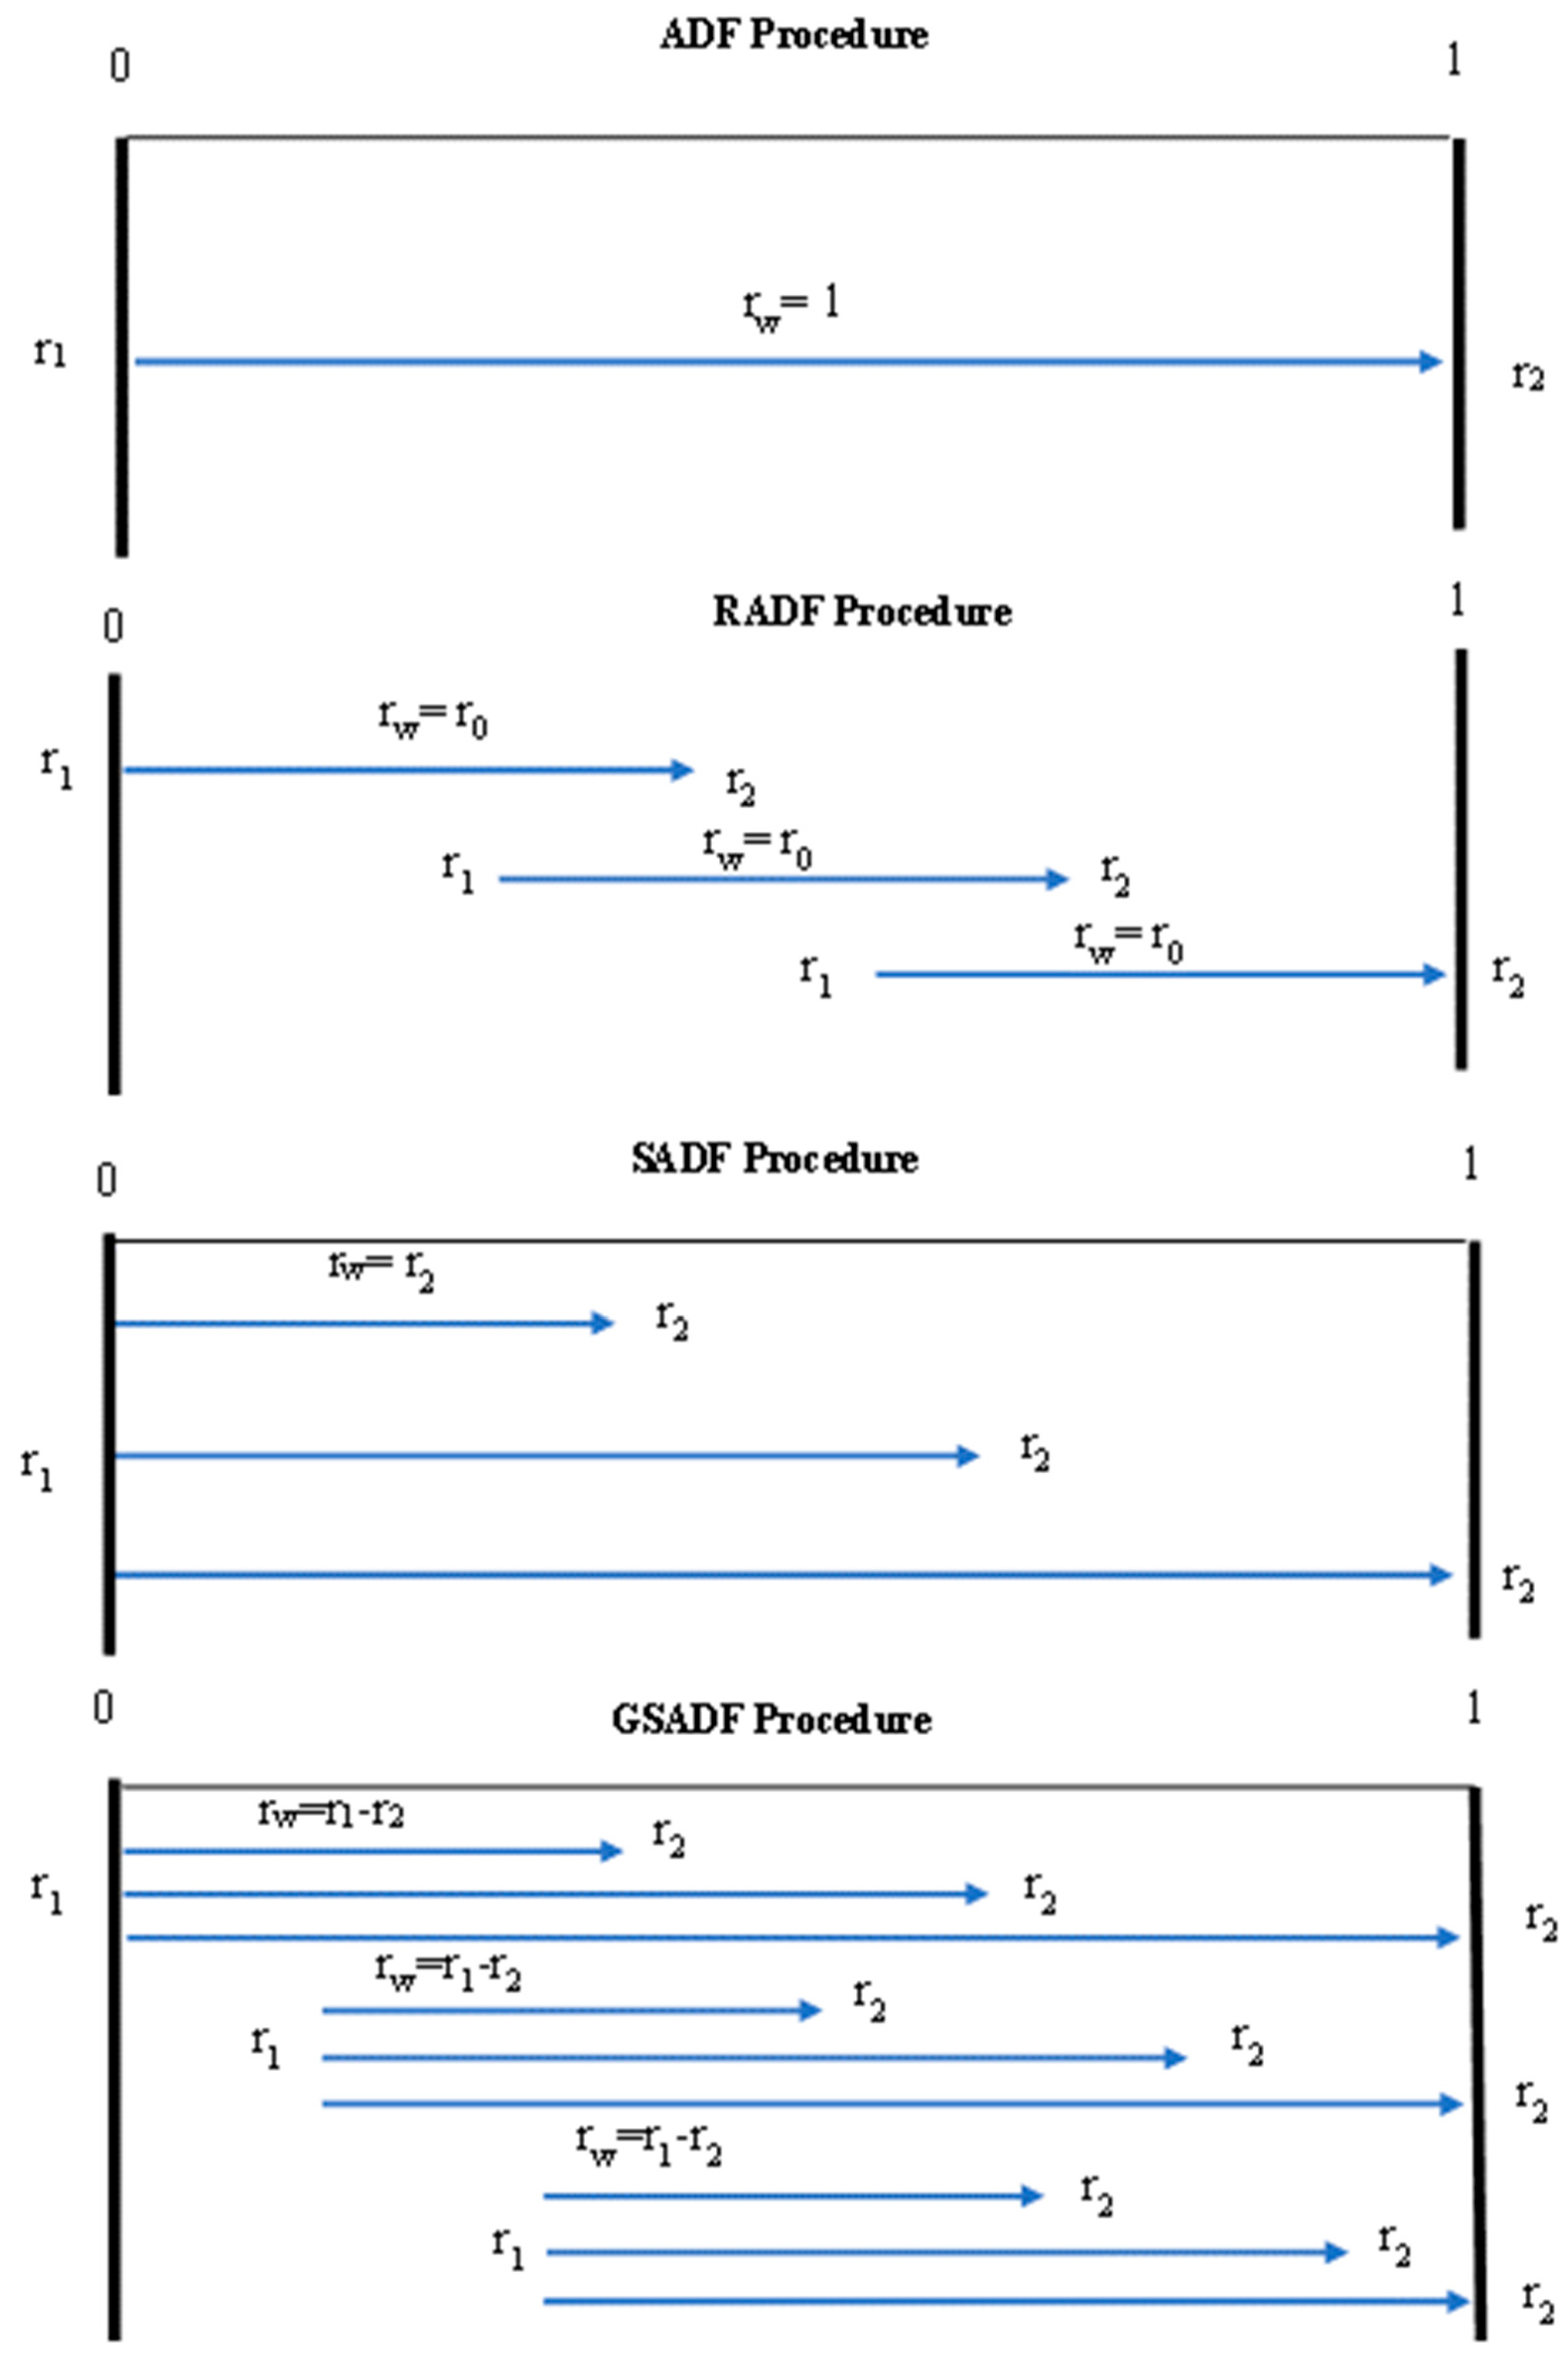
The RADF, SADF, and GSADF tests are iterative right-tailed unit root tests in the ADF test procedure that allow testing for bubbles in the series. While all three tests involve the ADF right-tailed test applied iteratively from a chosen starting point to a sample of a chosen length, the sample selection procedures differ. In the standard ADF test, the test statistic is computed once from the entire sample, while in the iterative ADF tests (RADF SADF, GSADF), the dataset is used as a sliding window in temporal longitude and the sample is differentiated at each iteration. The sample selection procedures for iterative ADF tests can be more easily understood with the help of
Figure 1 [
71,
72,
73].
Figure 1 shows that, in the standard ADF test, an ADF statistic is calculated over the whole sample with a window size of
from the starting point
to the endpoint
. In the iterative sample ADF (RADF) test, a test statistic is calculated from the first observation
to the last observation
by moving the window size
, and then the statistical calculation is repeated for each observation in shifted windows. In the SADF test, similar to the RADF test, there is a shift in window size
, while the sample
does not change in the iterations during the calculation of the test statistics. The sample is advanced by the window size from the first sample, starting from the first sample each time. In the GSADF test, similar to the RADF test, there is a sliding window, while the first sample is always kept constant. As can be seen, the sample is much larger in the GASDF test compared to other tests [
74].
The RADF test statistic is calculated as in Equation (10) [
71].
The SADF test statistic is calculated as in Equation (11) [
69]
The suprementum test statistic, abbreviated as Sup in Equation (11), is calculated for the SADF test as in Equation (12) [
69].
The GSADF test statistic is calculated as in Equation (13) [
69].
The above-mentioned test statistic in Equation (13) is calculated as in Equation (14) [
69].
The null and alternative hypotheses for the SADF and GSADF tests are as follows:
H0. There is no bubble formation in the series.
H1. There is a bubble formation in the series.
When the test statistics calculated in Equations (13) and (14) are compared with the bootstrap upper confidence limits, it is concluded that if the H0 hypotheses are accepted, there is no bubble formation in the series; otherwise, the series is judged to have a bubble formation.
If the hypothesis of a bubble formation in the series is accepted, by comparing the test statistics with the bootstrap critical value calculated for the bubble formation periods, it can be said that bubble formation has started if the test statistic exceeds the upper confidence level, and bubble formation has ended if the test statistic falls below the critical value. The bubble formation periods can be expressed as in Equation (15) for both tests [
71].
In this study, the GSADF test statistics and the critical values obtained by the Monte Carlo Wild-Bootstrap method at the 95% confidence level are taken into account to decide the bubble formation periods (the package programs provide Monte-Carlo Wild-Bootstrap critical values as well as [
75]).
4. Results
Descriptive statistics of the variables used in the study are given in
Table 1.
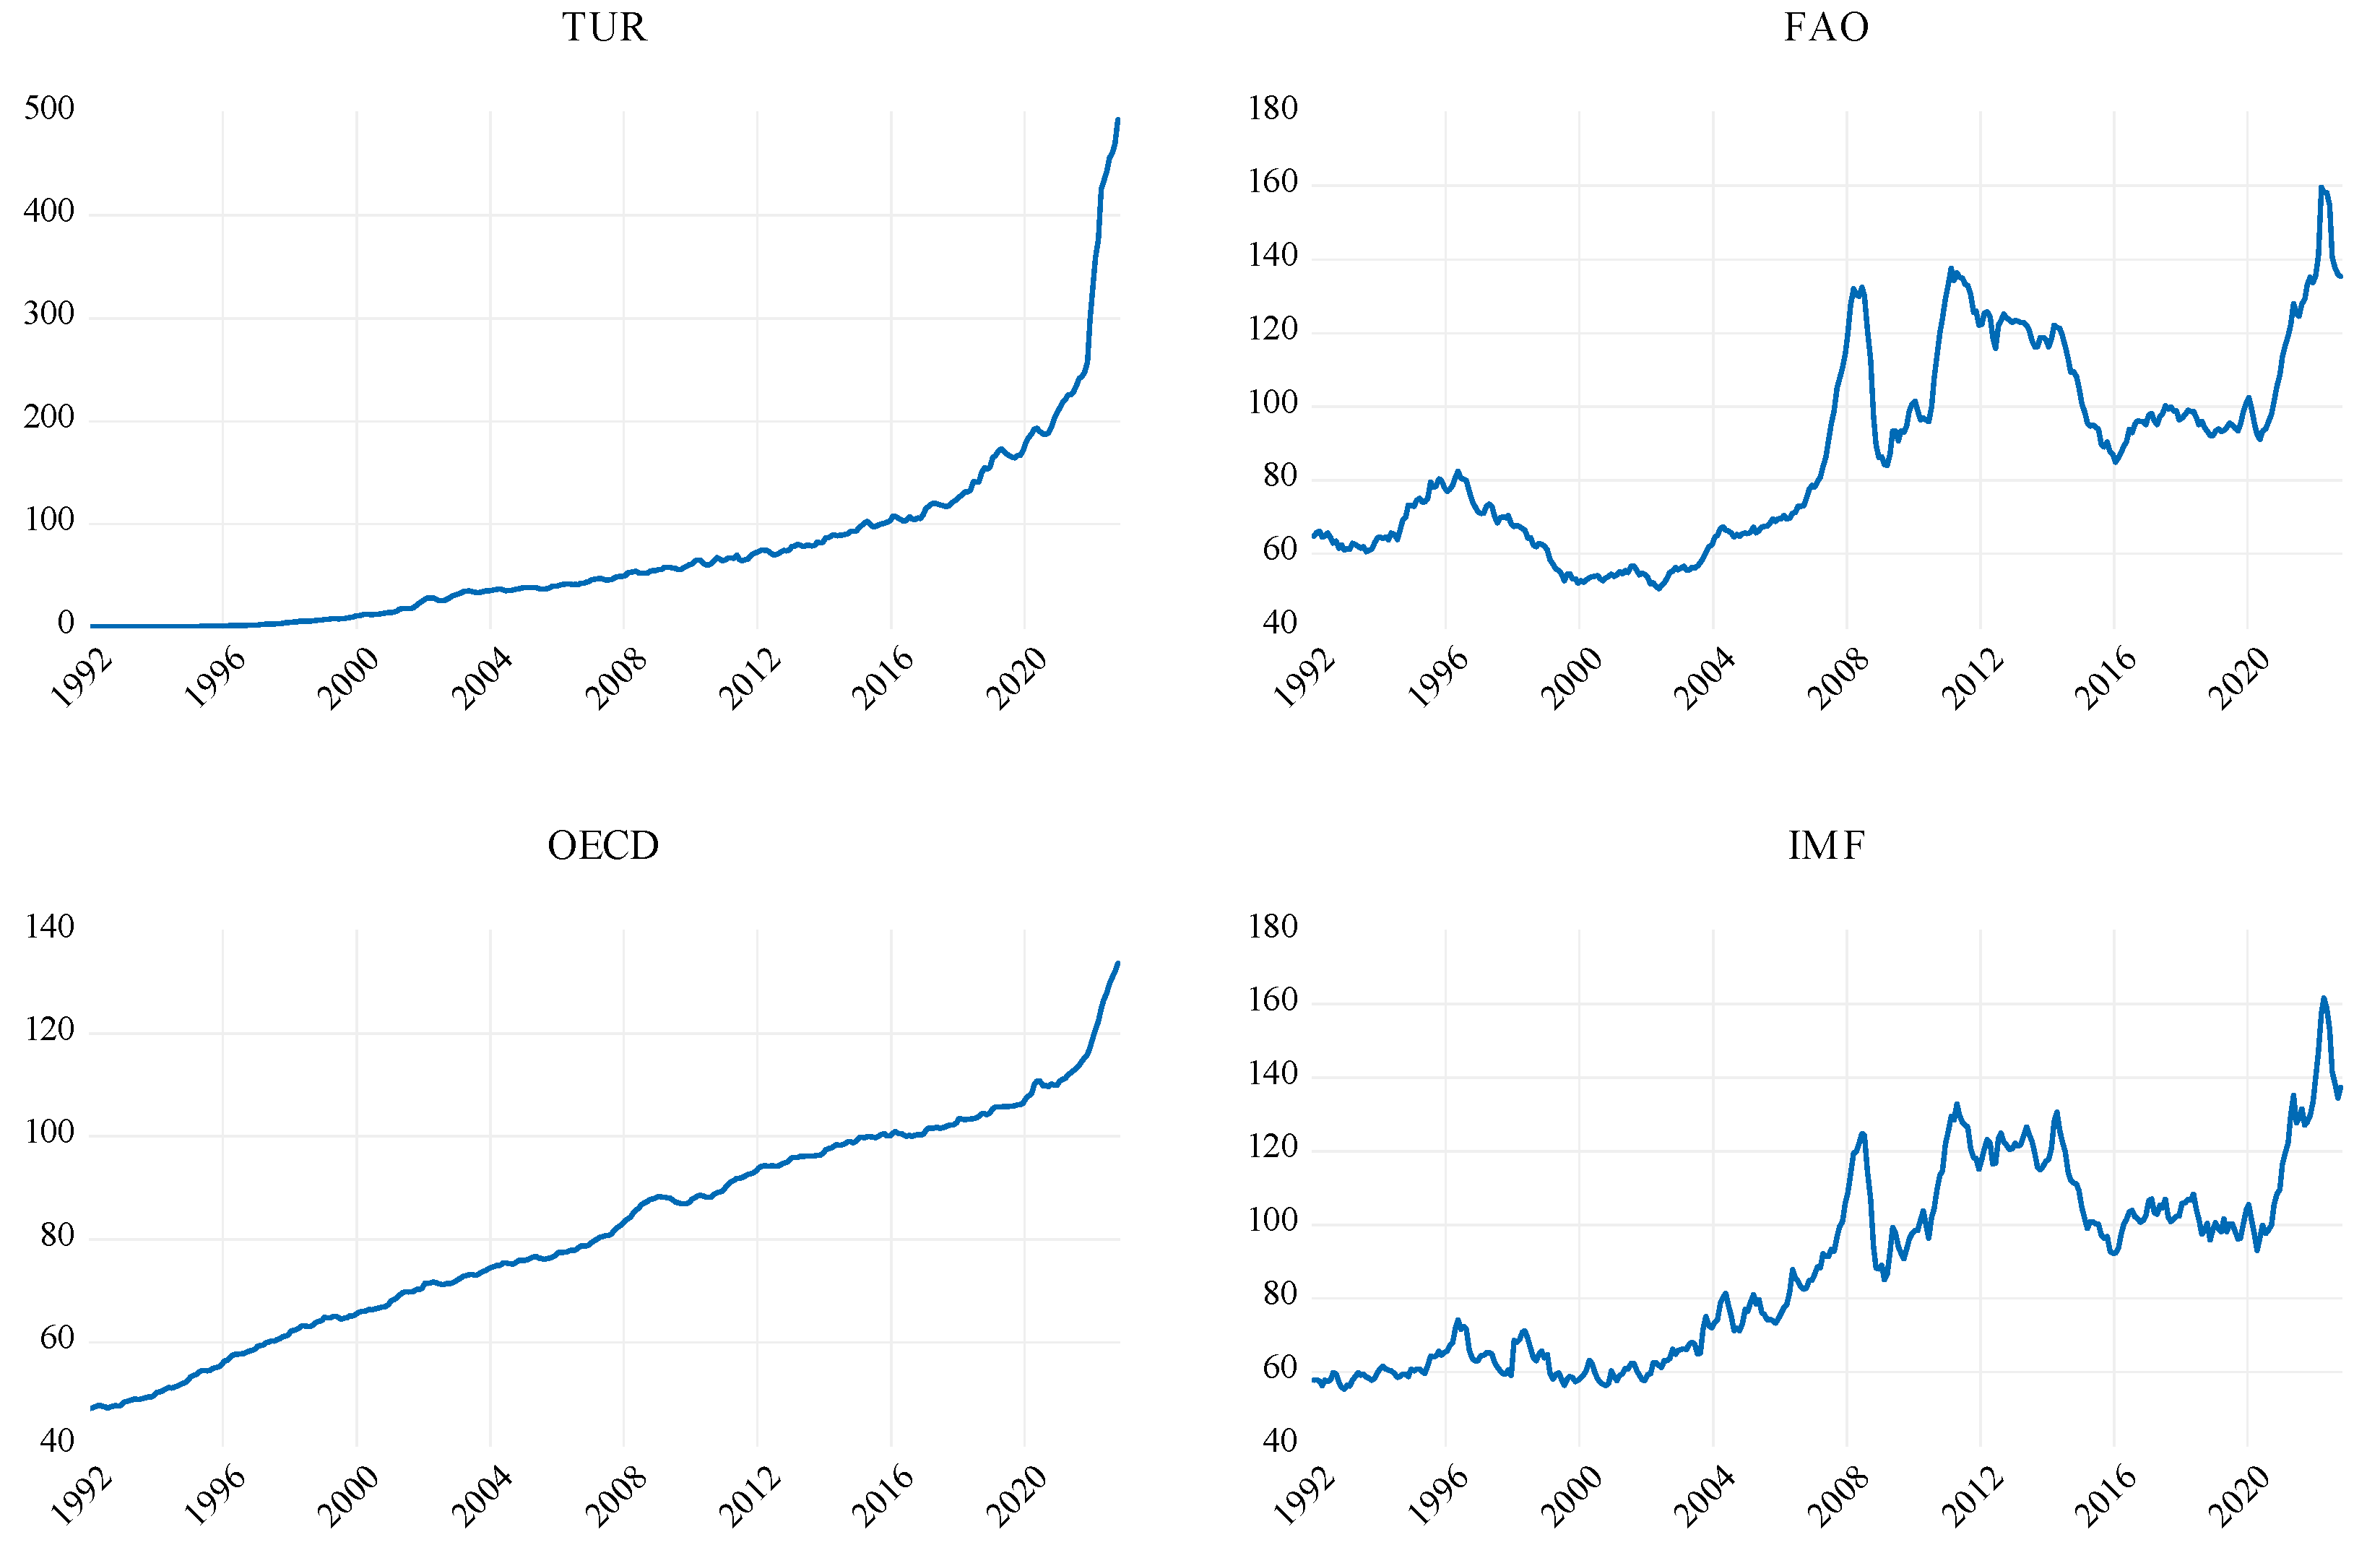
The TUR variable is distributed between a minimum value of 0.1169 and a maximum value of 493.0621, with a standard deviation of 84.4944 and a mean of 70.6919. The variable does not fit the normal distribution (ꭓ2(02) = 1154.00, Sig. < 0.10). The FAO variable is distributed between 50.5000 minimum and 159.7000 maximum values, with a standard deviation of 26.1811 and a mean of 86.9703. The variable does not follow a normal distribution (ꭓ2(02) = 24.84, Sig. < 0.10). The OECD variable is distributed between 47.1673 minimum and 133.7050 maximum values, with a standard deviation of 20.3439 and a mean of 81.8417. The variable does not follow a normal distribution (ꭓ2(02) = 12.02, Sig. < 0.10). The IMF variable is distributed between 55.1421 minimum and 161.7333 maximum values with a standard deviation of 25.5140 and a mean of 88.2409. The variable does not fit the normal distribution (ꭓ2(02) = 22.42, Sig. < 0.10). Time course graphs of the variables are given in
Figure 2.
When the graphs are analyzed, it is noteworthy that there is a significant upward trend for the TUR and OECD variables. FAO and IMF variables, on the other hand, have upward trends, albeit not as fast as those of the TUR and OECD variables. Based on the visualizations in
Table 1, it can be said that the FAO and IMF variables are expected to have bubble formations with clear beginnings and endings, while the TUR and OECD variables are expected to have mostly bubble-like price formations throughout the periods analyzed.
The findings of the SADF and GSADF tests applied to the variables are given in
Table 2.
In order to select the optimal lags for the SADF and GSADF tests applied to the variables, Akaike, Schwartz, and Hannan information criteria were utilized and the optimal number of lags up to a maximum of five lags was selected according to all three criteria (the formula maxlag =
is used for the maximum lag [
76]). The window length, also called the control period, is set as 38 (the formula
was used for the window length [
77]). In addition, the number of bootstrap repetitions is set as 2000 (for the number of bootstrap repetitions, it is recommended to resample each sample with between 1000 and 5000 repetitions, with no less than two repetitions [
78]).
The findings in
Table 2 indicate that the null hypothesis, that there is no bubble formation in the series for the TUR variable, cannot be accepted at the 99% confidence level according to the SADF test and at the 95% confidence level according to the GSADF test. More precisely, it can be said that there were statistically significant multiple bubble formations in the series throughout the period under consideration (SADF = 7.3937 > 6.0768, GSADF = 7.3937 > 6.7233).
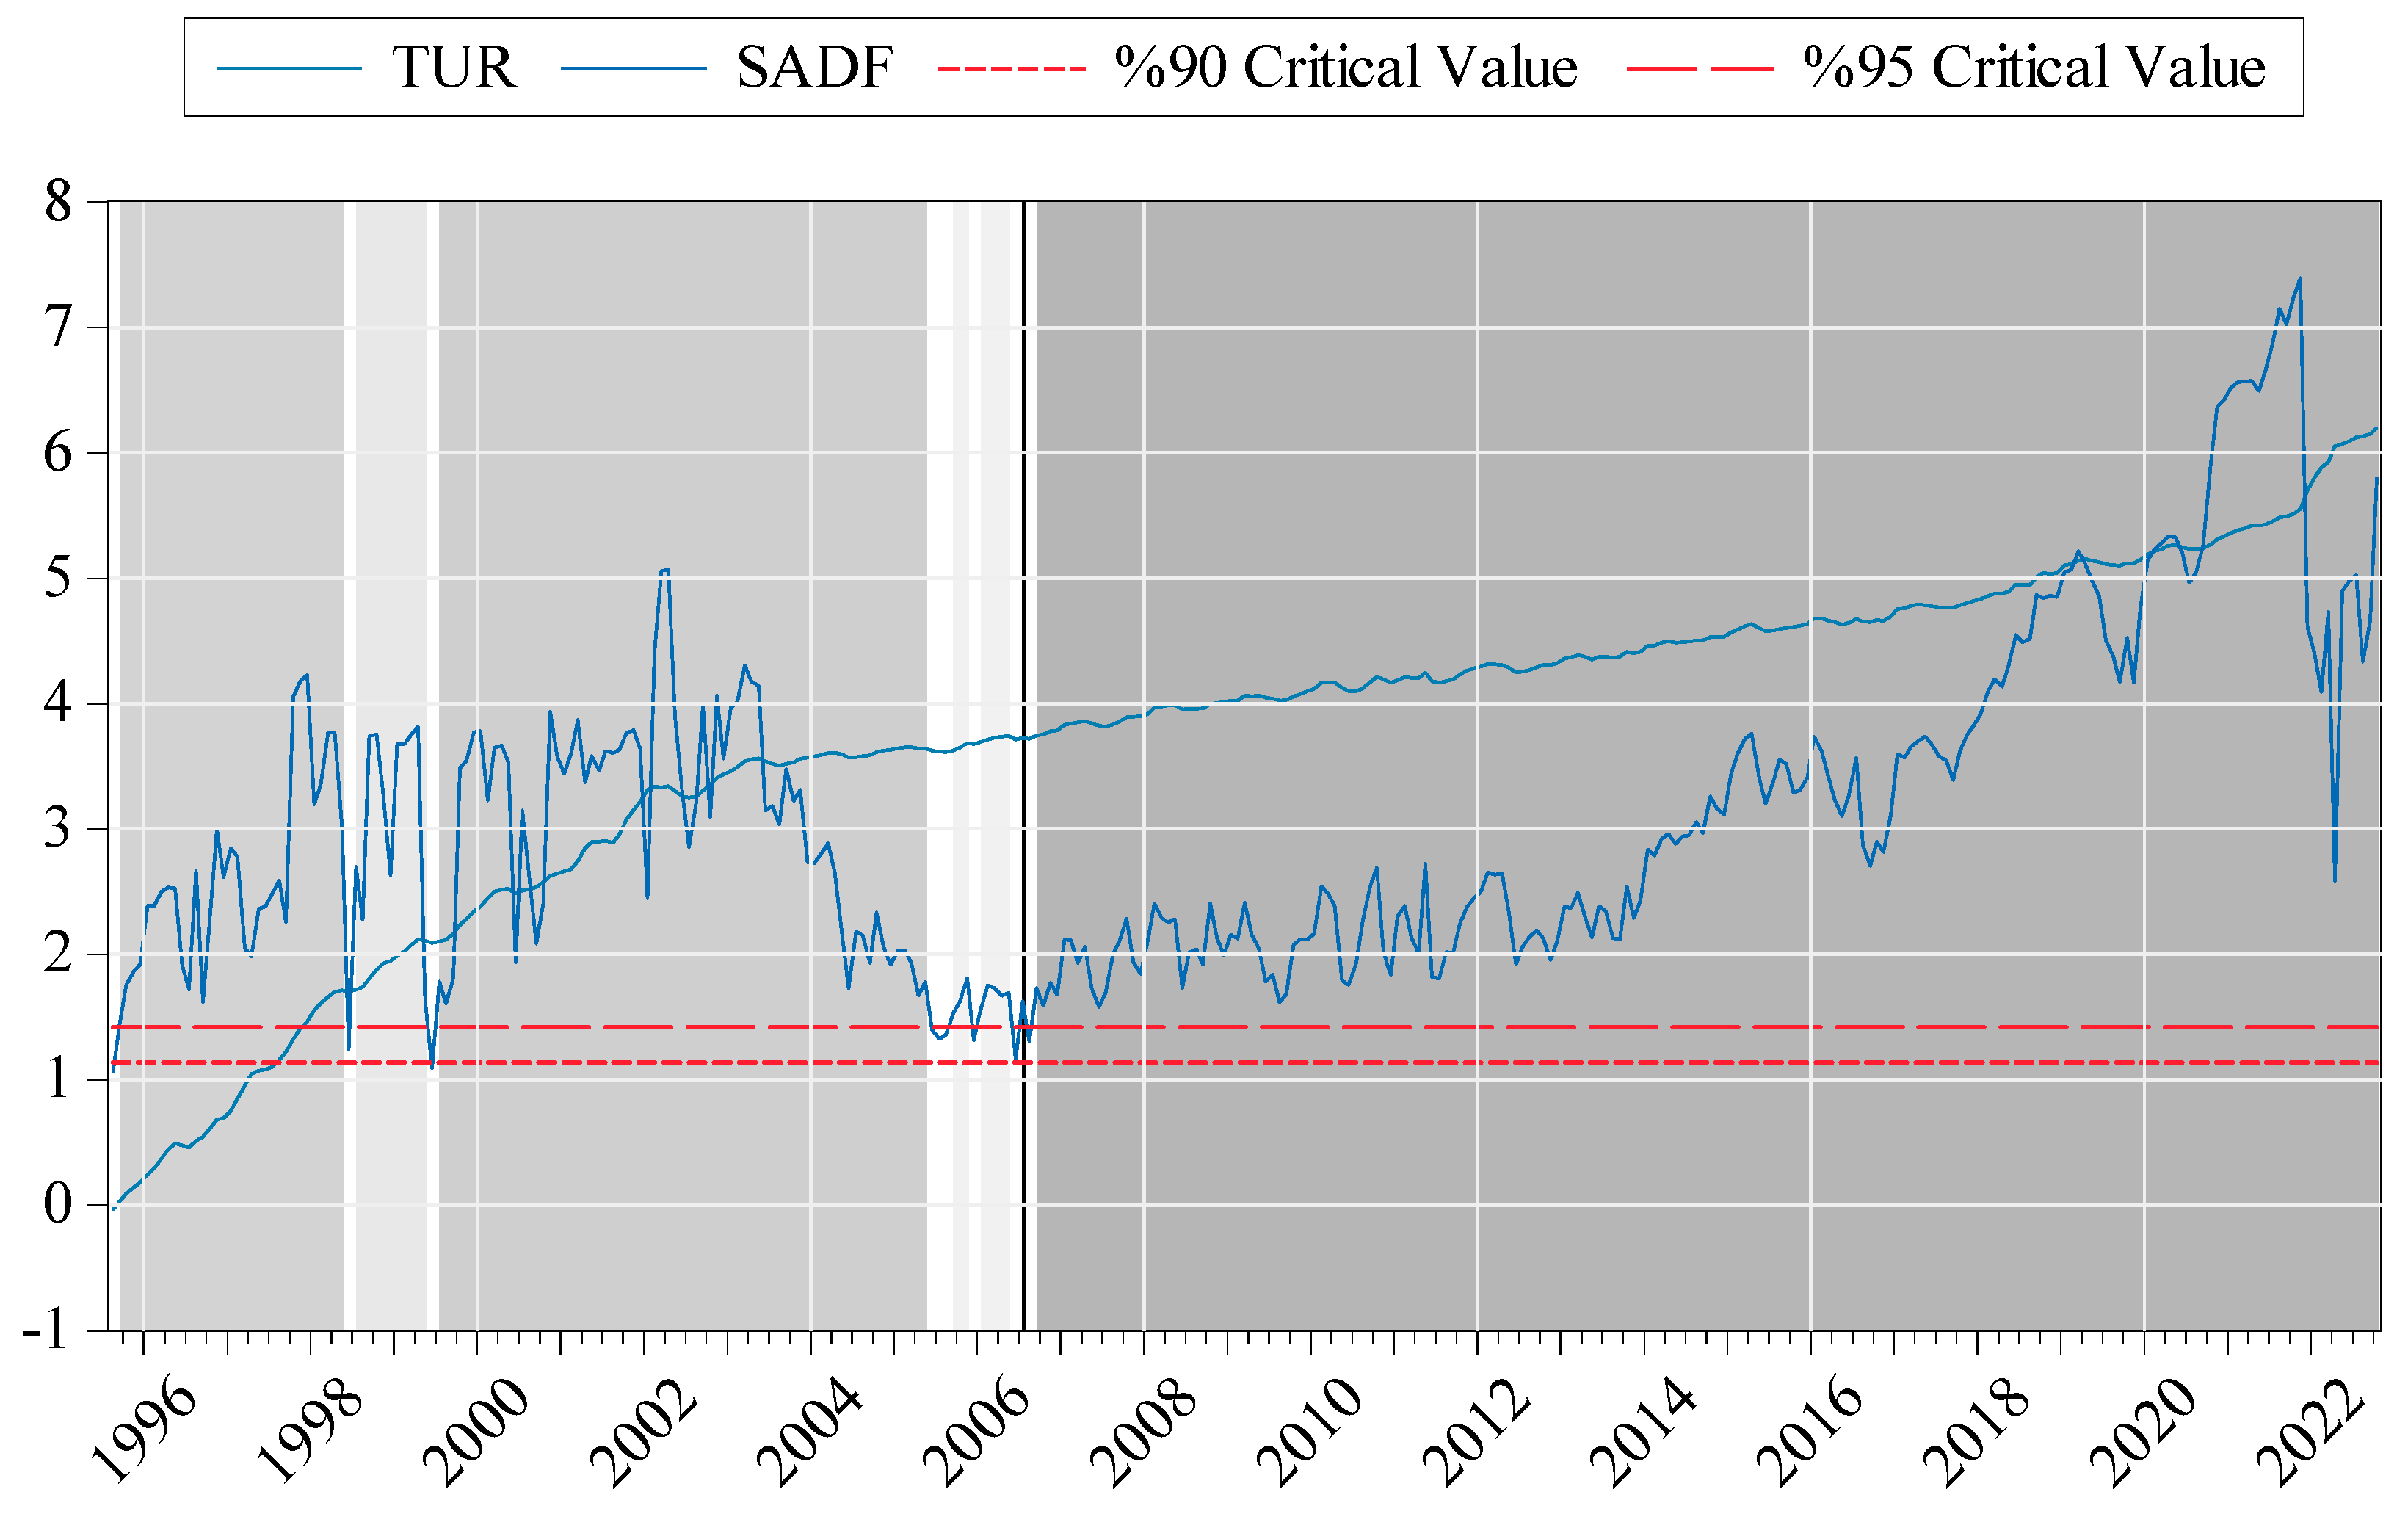
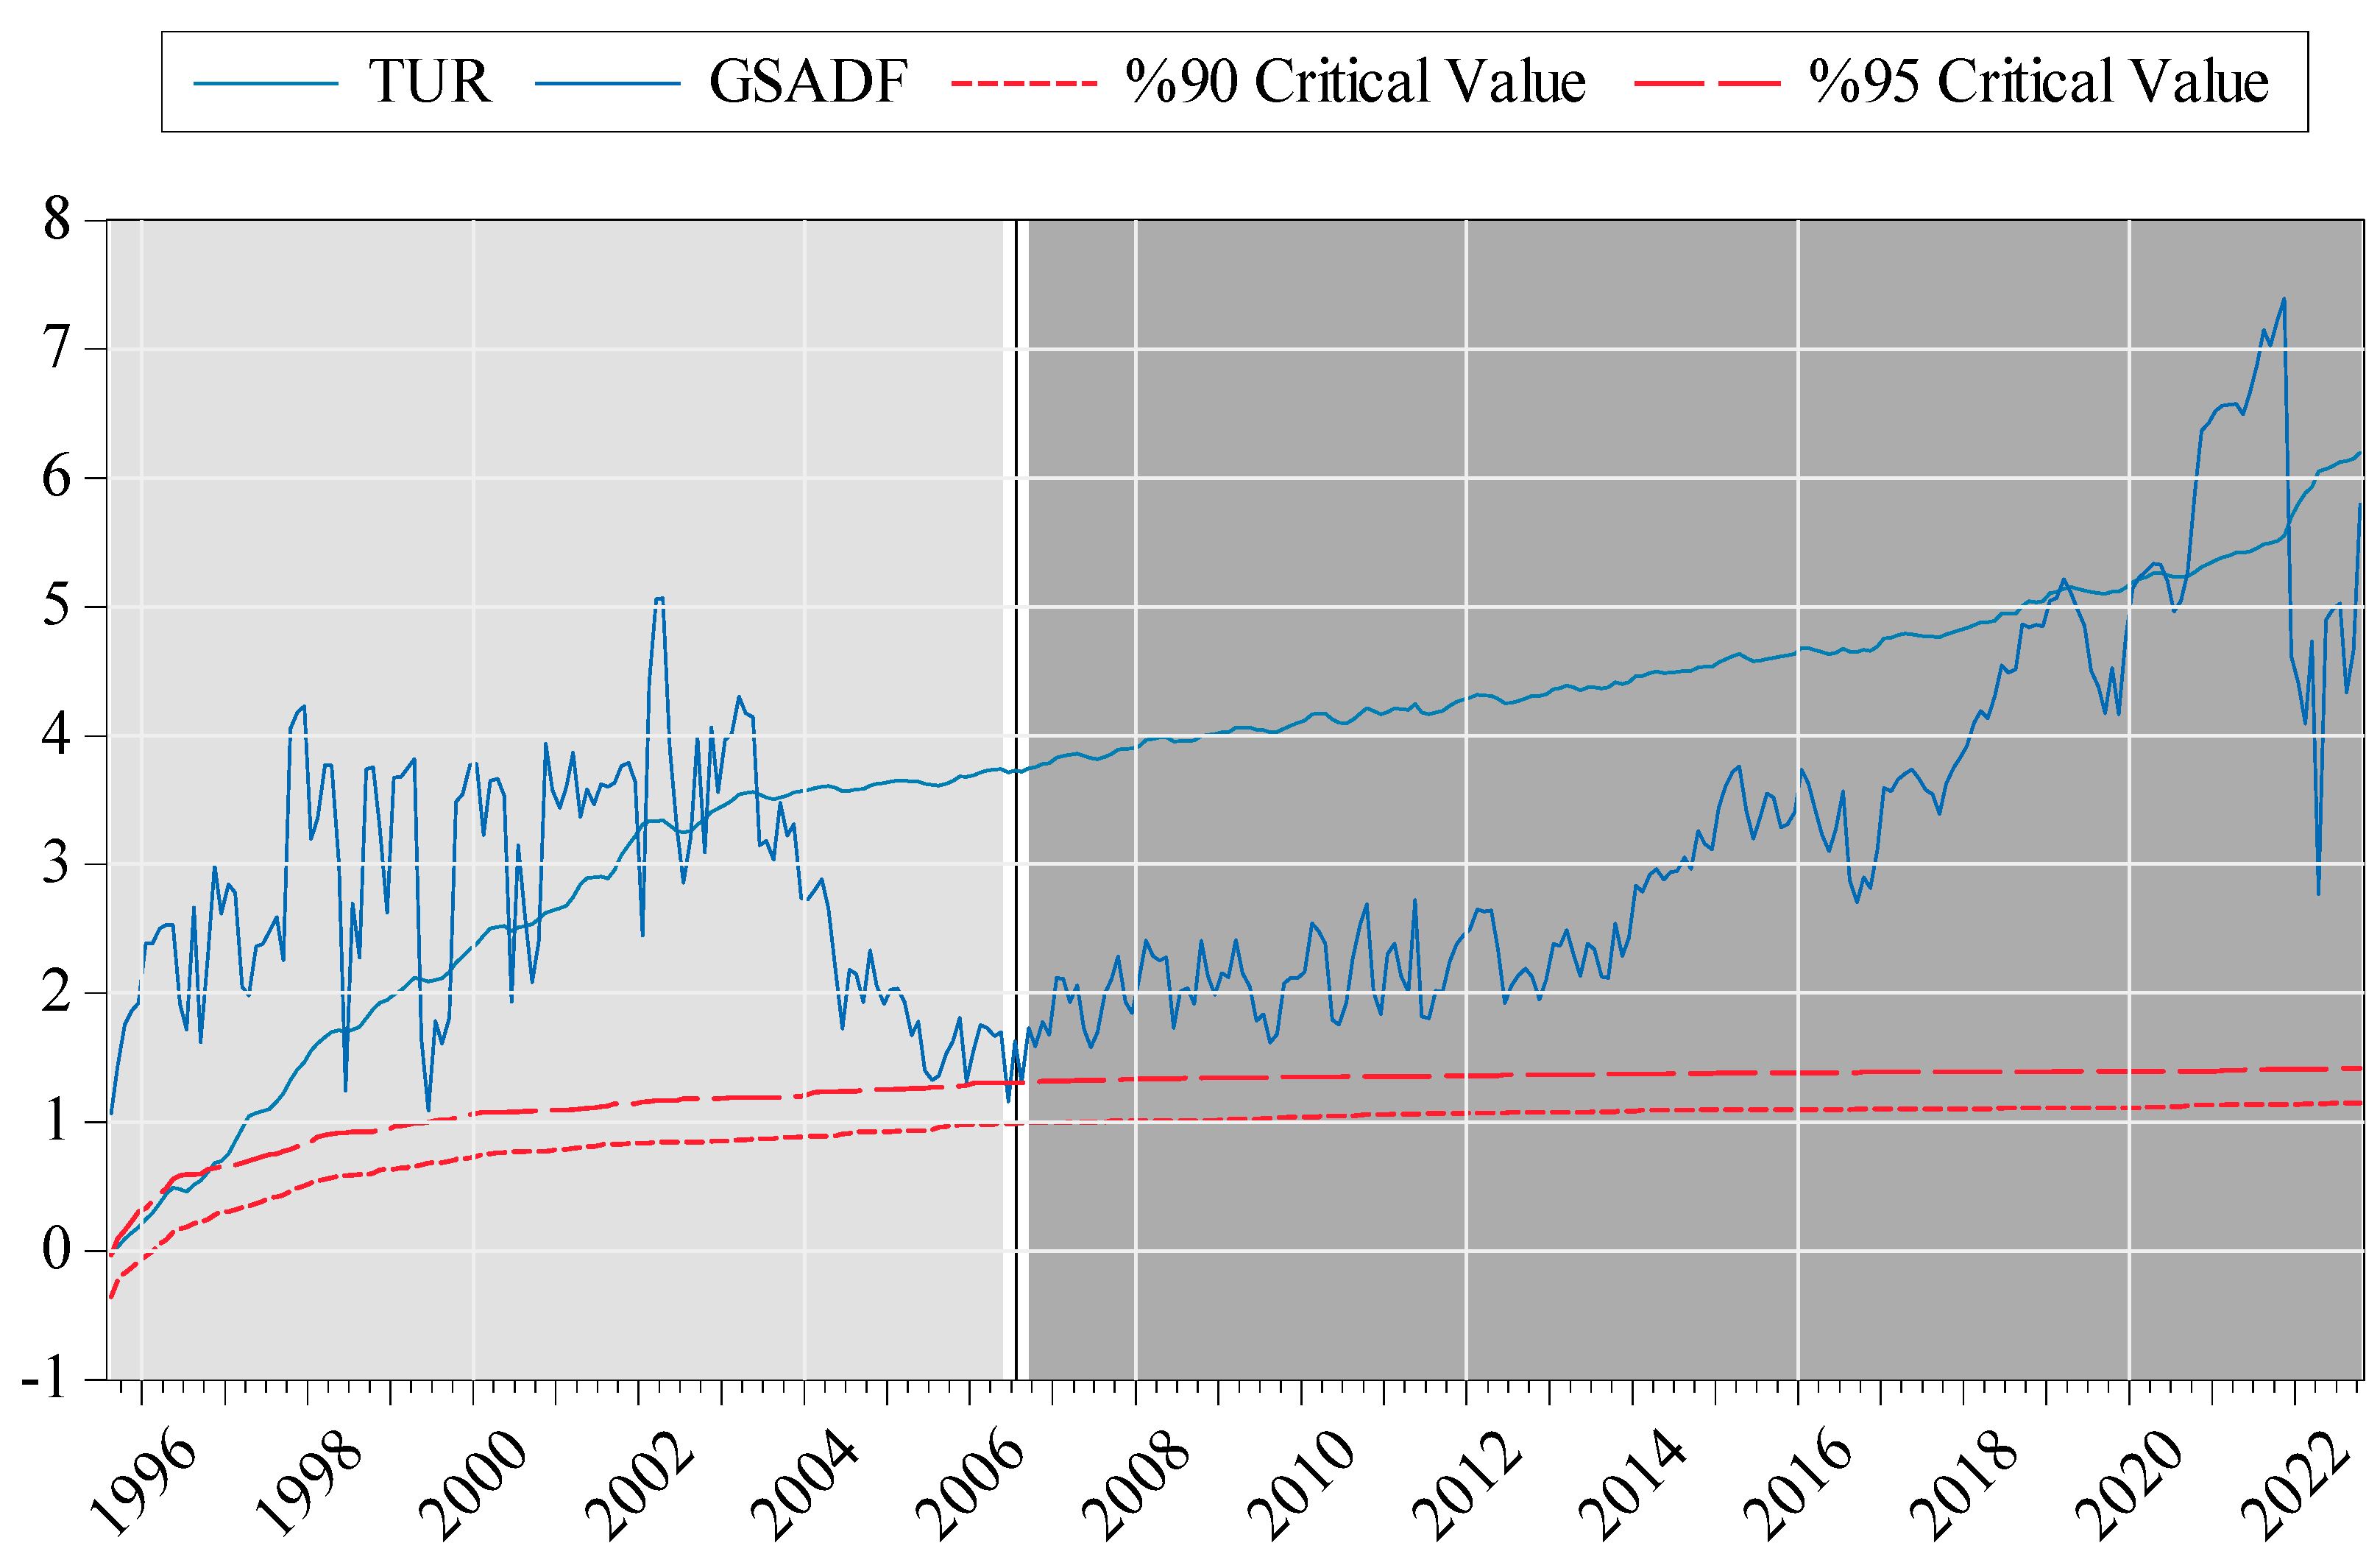
The original observation values of the TUR variable, the GSADF test statistics, the critical values at 90% and 95% confidence levels, and the bubble formation periods are visualized in
Figure 3.
When the figure is examined, the GSADF test statistic exceeded the Monte Carlo Wild-Bootstrap critical values calculated for the 95% confidence level, and bubble formation behavior was observed immediately after the selected window length, which is called the control period. When the bubble formations in the series are analyzed separately, a bubble formation lasting 130 periods (months) between August 1995 and May 2006 is followed by a one-period bubble formation in July 2006 and a 194-period bubble formation starting from September 2006 and continuing until the end of the study period. For the TUR variable, bubble behavior was observed in 325 out of 327 periods, excluding the control period during the study period. It is also observed that the bubble behavior for the variable in line with the SADF test is similar (
Figure A1).
For the FAO variable, the null hypothesis of no bubble formation in the series is rejected at the 90% level according to the SADF test and at the 95% level according to the GSADF test. More precisely, it can be said that there are statistically significant multiple bubble formations in the series throughout the period under consideration (SADF = 1.9379 > 1.9239, GSADF = 4.5981 > 4.1429).
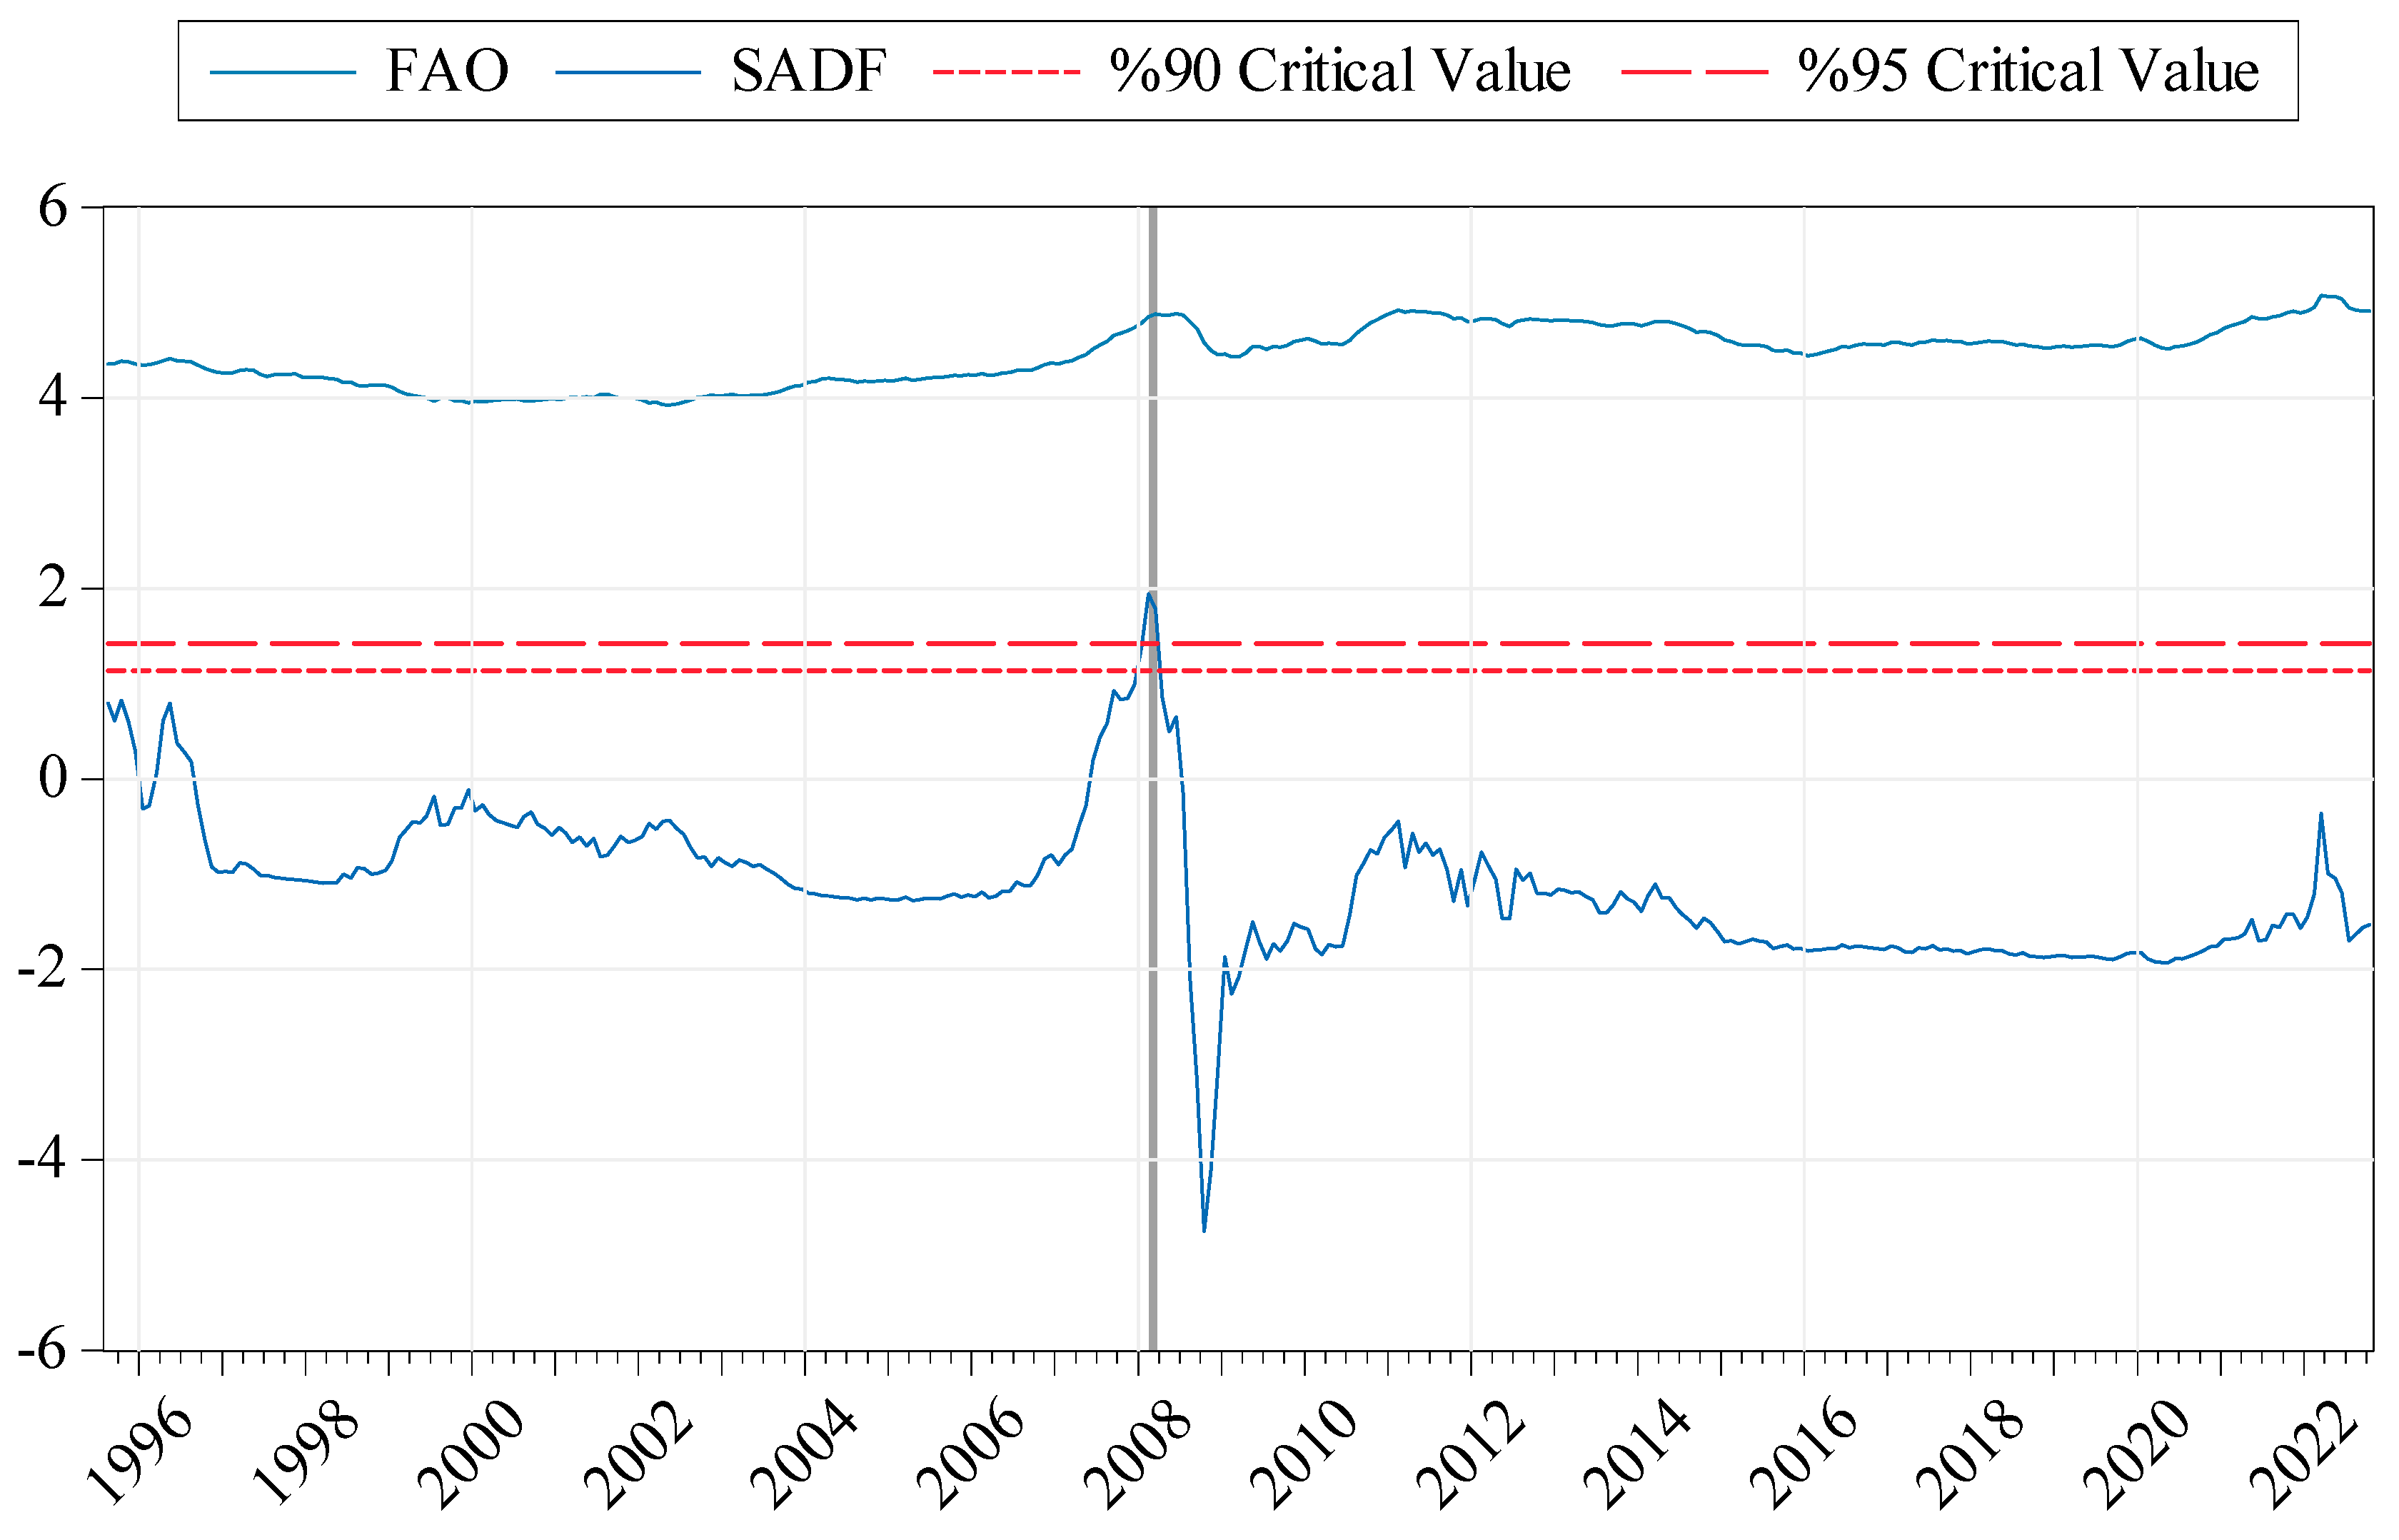
The original observation values of the FAO variable, the GSADF test statistics, the critical values at 90% and 95% confidence levels, and the bubble formation periods are visualized in
Figure 4.
The figure shows that eight bubble periods were observed in the FAO variable. These bubble periods are as follows: A five-period price bubble between August 1995 and December 1995, a two-period price bubble between April 1996 and May 1996, a one-period price bubble in April 1999, a two-period price bubble between June 1999 and July 1999, a thirteen-period price bubble between April 2007 and April 2008, a two-period price bubble between March 2015 and April 2015, a one-period price bubble in August 2015 and, a four-period price bubble between March 2022 and June 2022. For the FAO variable, bubble behavior was observed in 30 out of 327 periods, excluding the control period during the study period. When the bubble behavior for the FAO variable is analyzed in line with the SADF test, it is observed that there is no bubble except for a two-period bubble between February 2008 and March 2008 (
Figure A2).
For the OECD variable, the null hypothesis of no bubble formation in the series cannot be rejected at the 90% confidence level according to the SADF test, while it is rejected at the 90% level according to the GSADF test. More precisely, it can be said that there were statistically significant multiple bubble formations in the series throughout the period under consideration (SADF = 1.8036 < 2.5749, GSADF = 4.6435 > 4.5672).
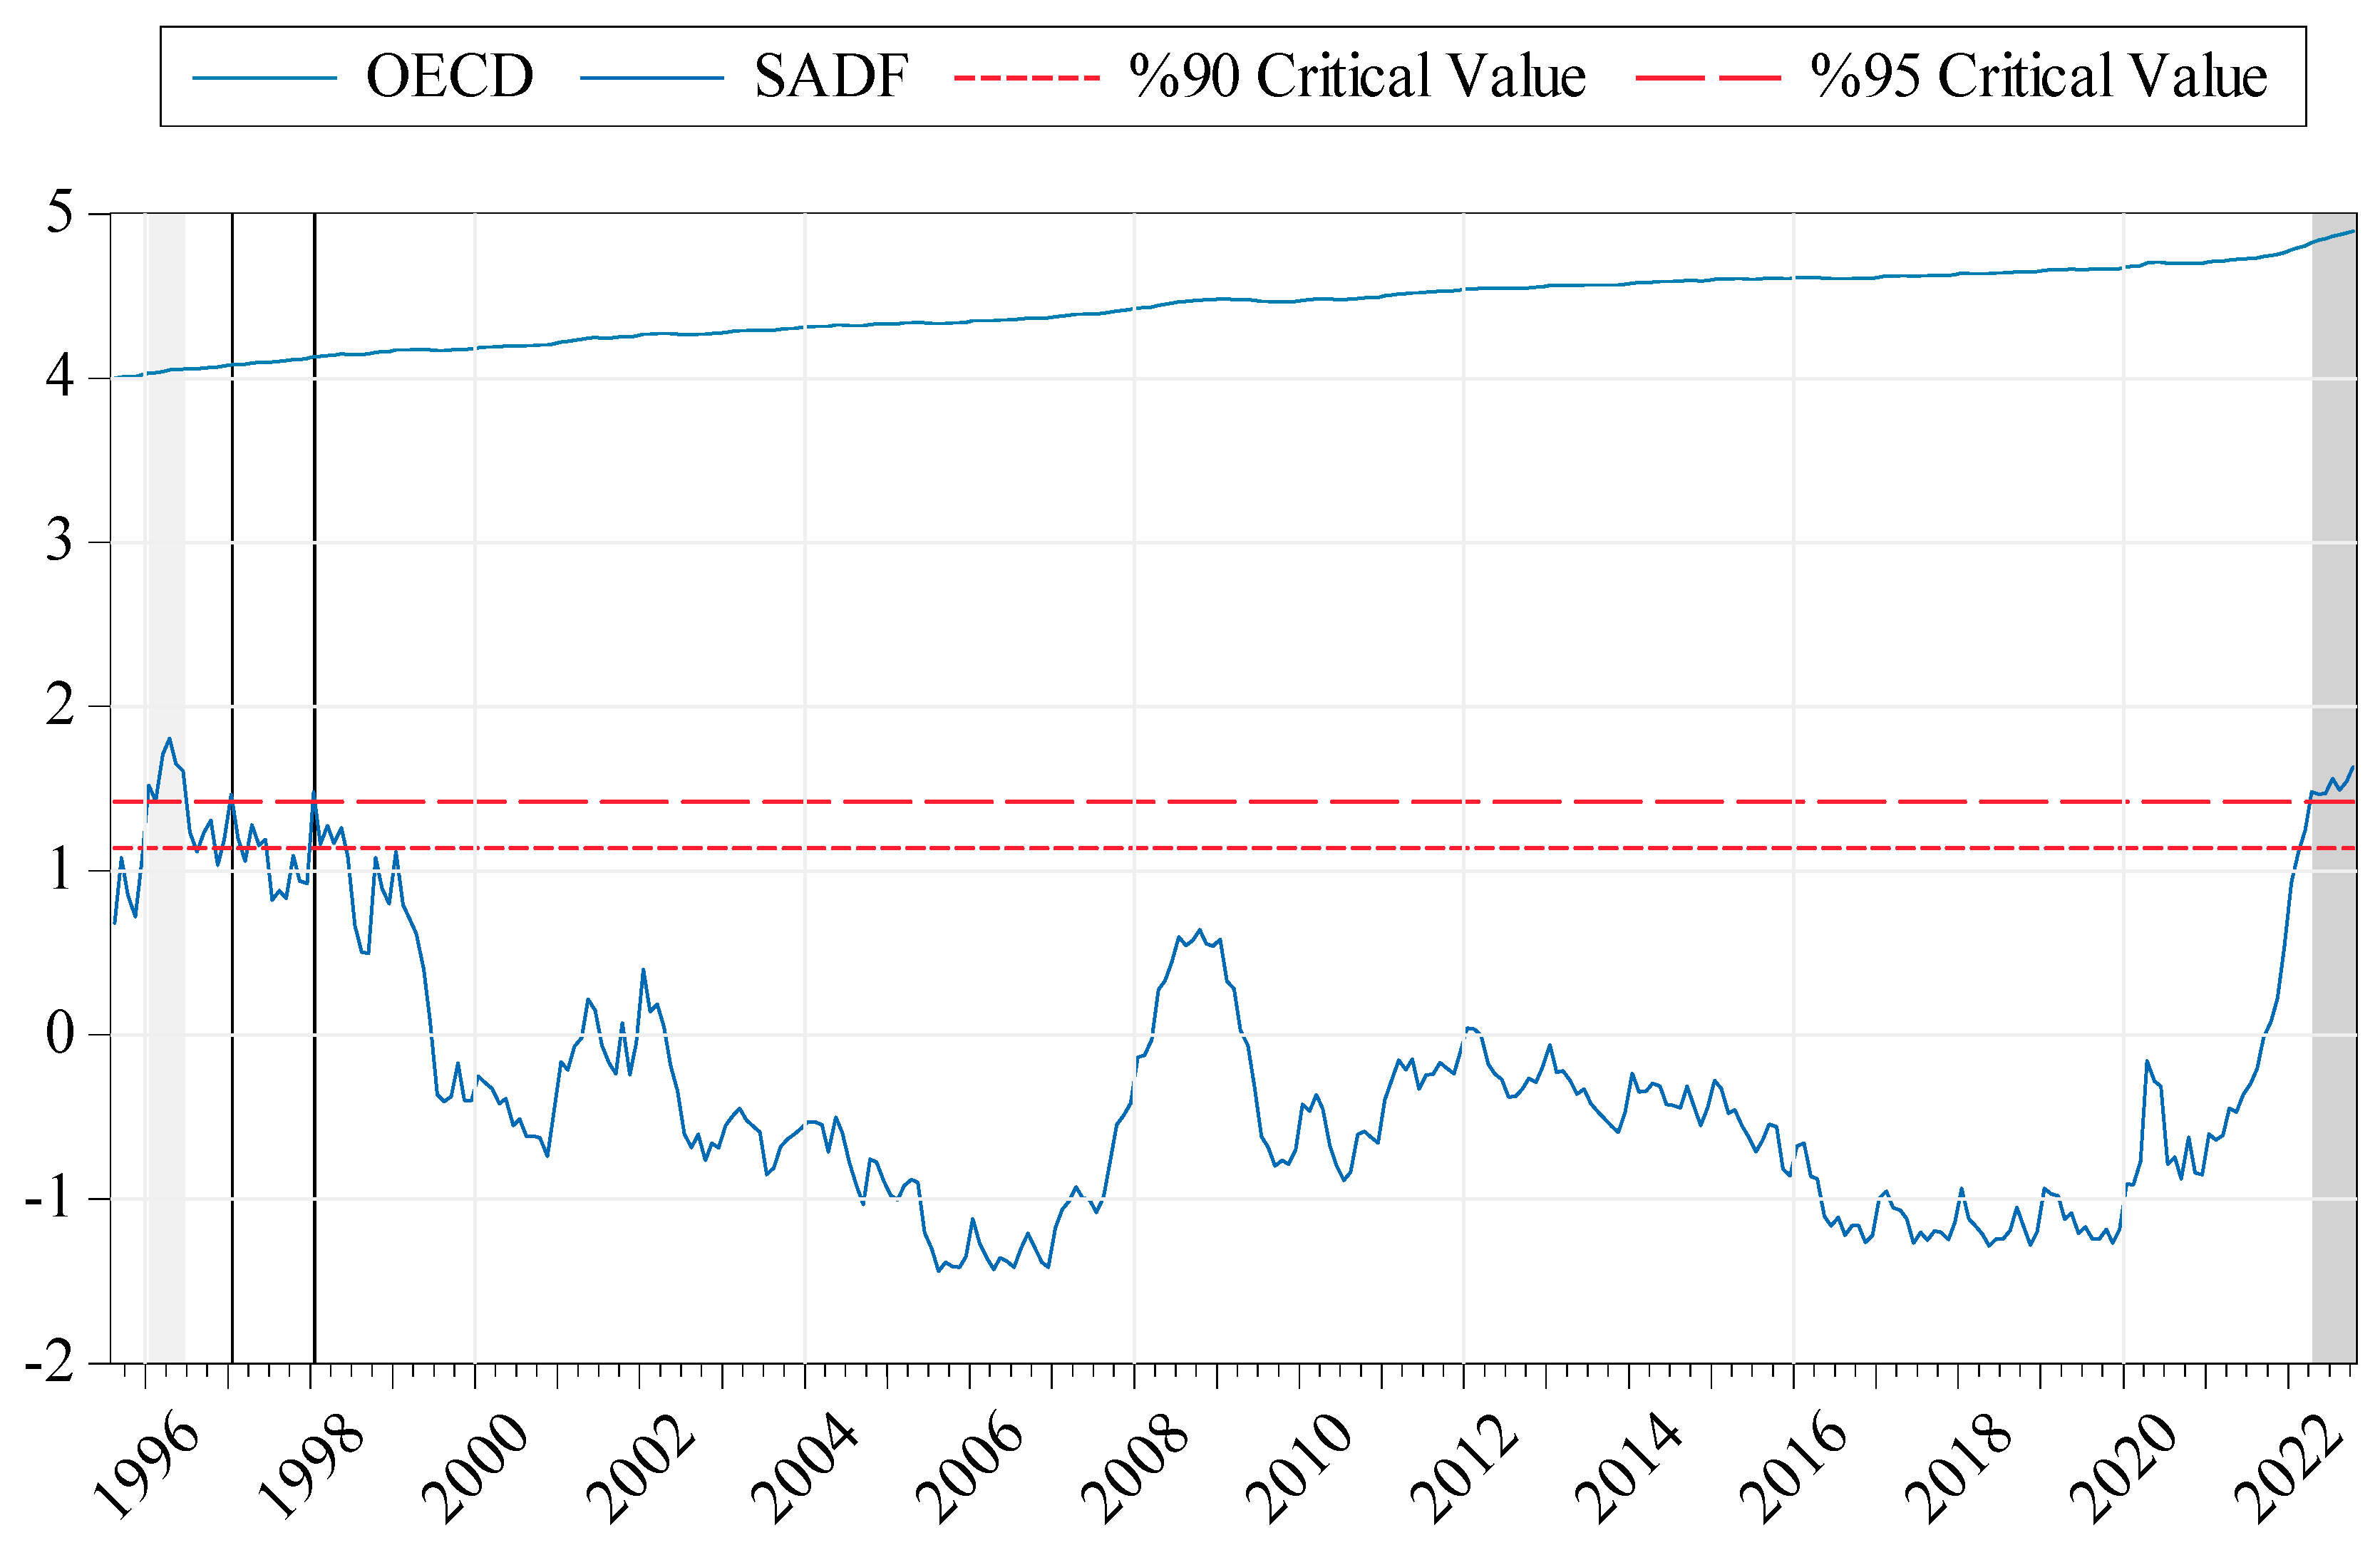
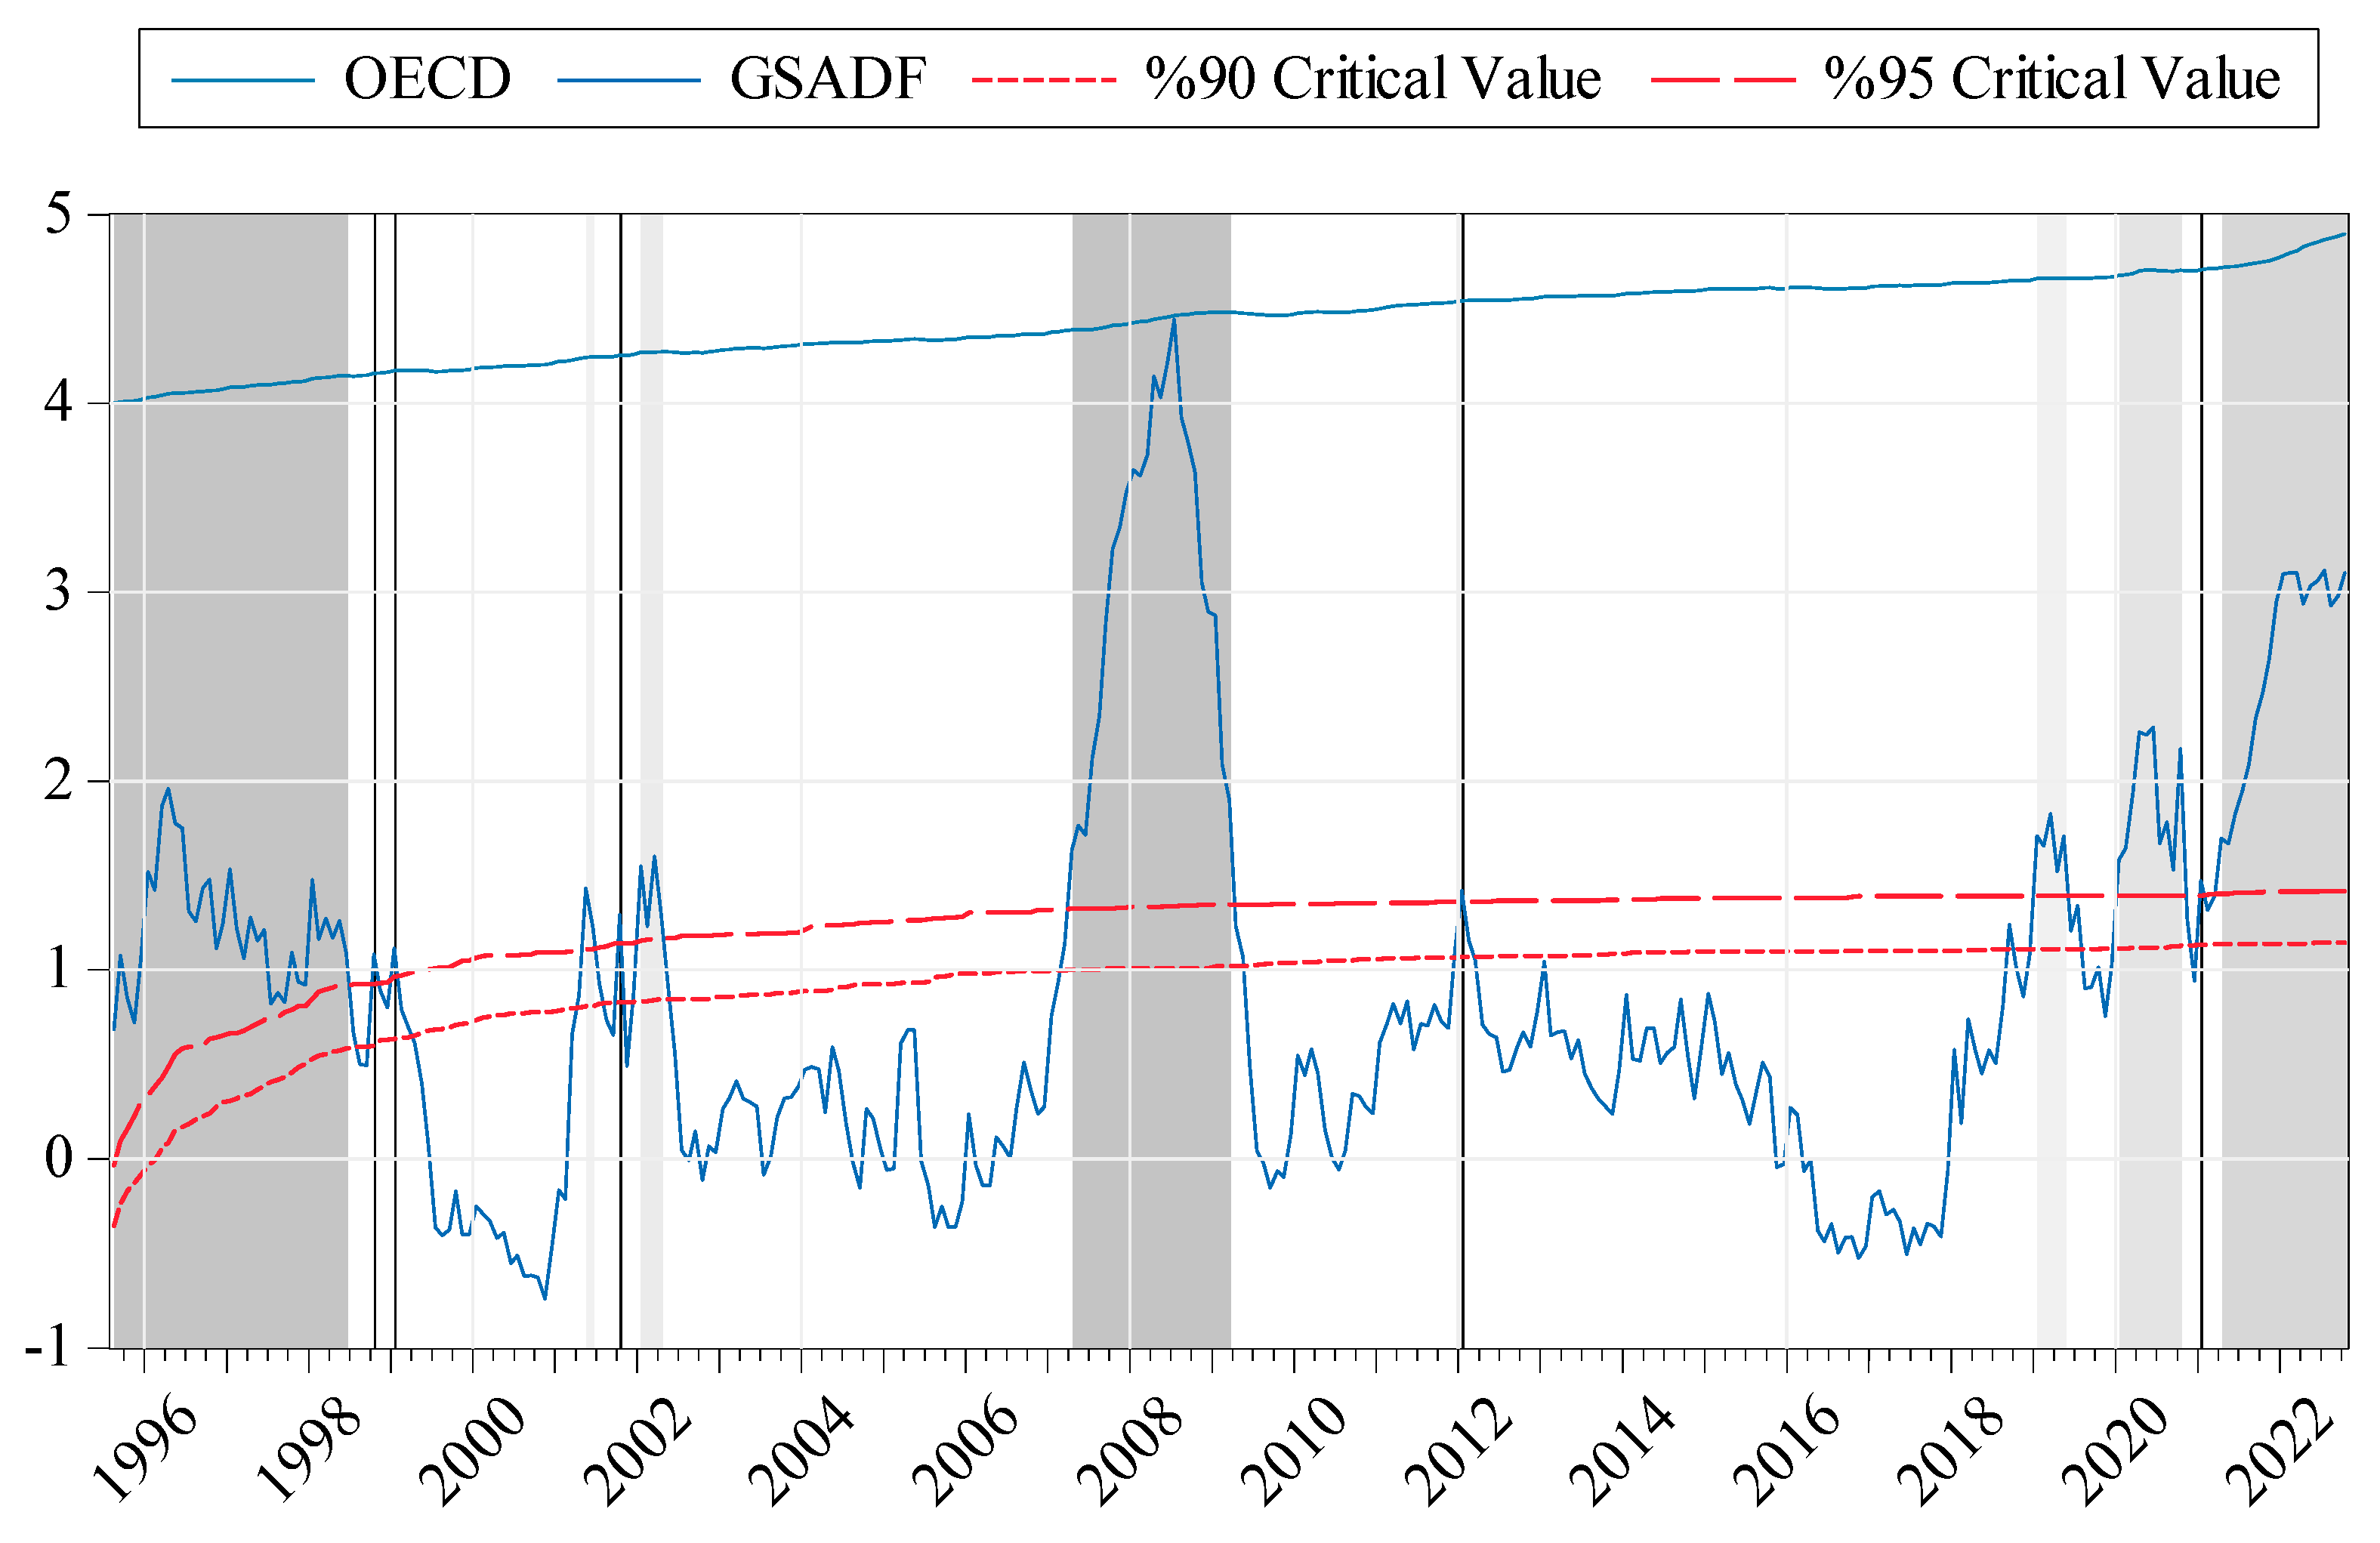
The original observation values of the OECD variable, the GSADF test statistics, the critical values at 90% and 95% confidence levels, and the bubble formation periods are visualized in
Figure 5.
An analysis of the bubble formation periods for the OECD variable reveals 12 different bubble formations. These bubble formations are as follows: 35 periods between August 1995 and July 1998, 1 period in October 1998, 1 period in January 1999, 2 periods between May 2001 and June 2001, 1 period in October 2001, 4 periods between January 2002 and April 2002, 24 periods between April 2007 and March 2009, 1 period in January 2012, 5 periods between January 2019 and May 2019, 10 periods between January 2020 and October 2020, 1 period in January 2021, and 19 periods between April 2021 and October 2022. For the OECD variable, bubble behavior was observed in 104 out of 327 periods, excluding the control period during the study period. When the bubble behavior for the OECD variable is analyzed in line with the SADF test, it is observed that only 14 of the bubbles identified by the GSADF were captured (
Figure A3.)
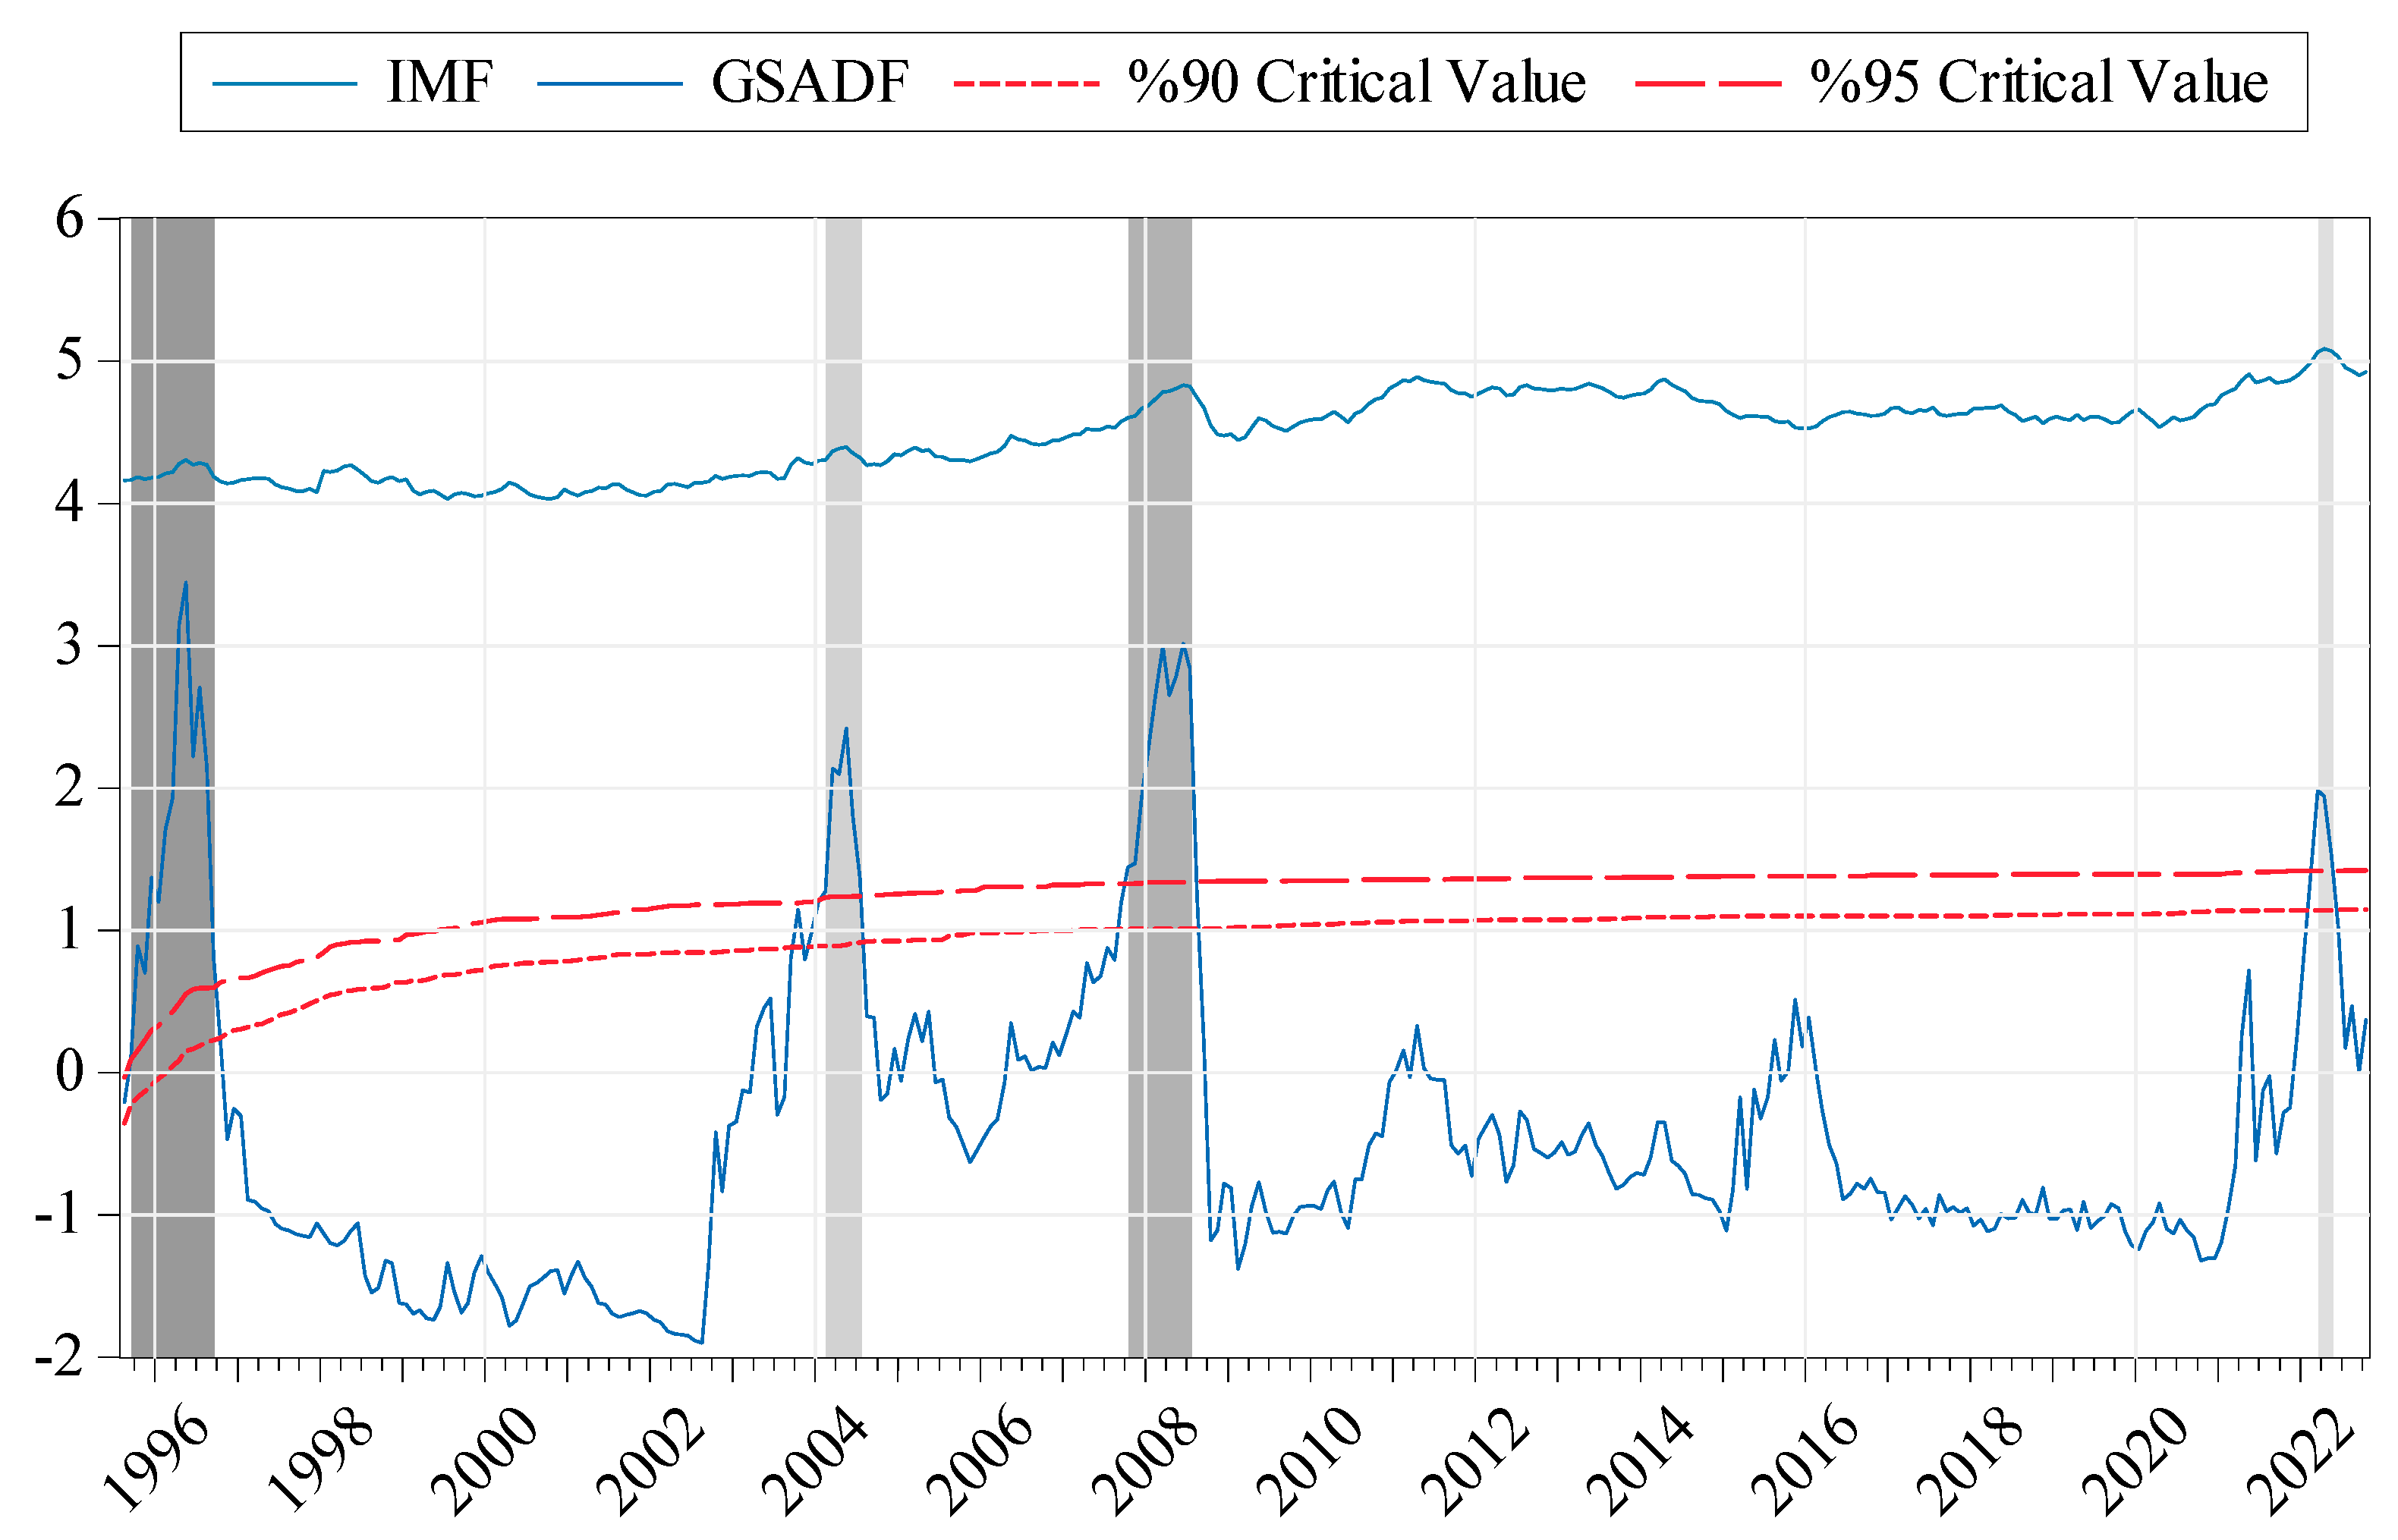
For the IMF variable, the null hypothesis of no bubble formation in the series cannot be accepted at the 99% confidence level according to the SADF test and at the 95% confidence level according to the GSADF test. More precisely, it can be said that statistically significant multiple bubble formation was observed in the series throughout the period under consideration (SADF = 3.1002 > 2.5073, GSADF = 3.4433 > 3.0527).
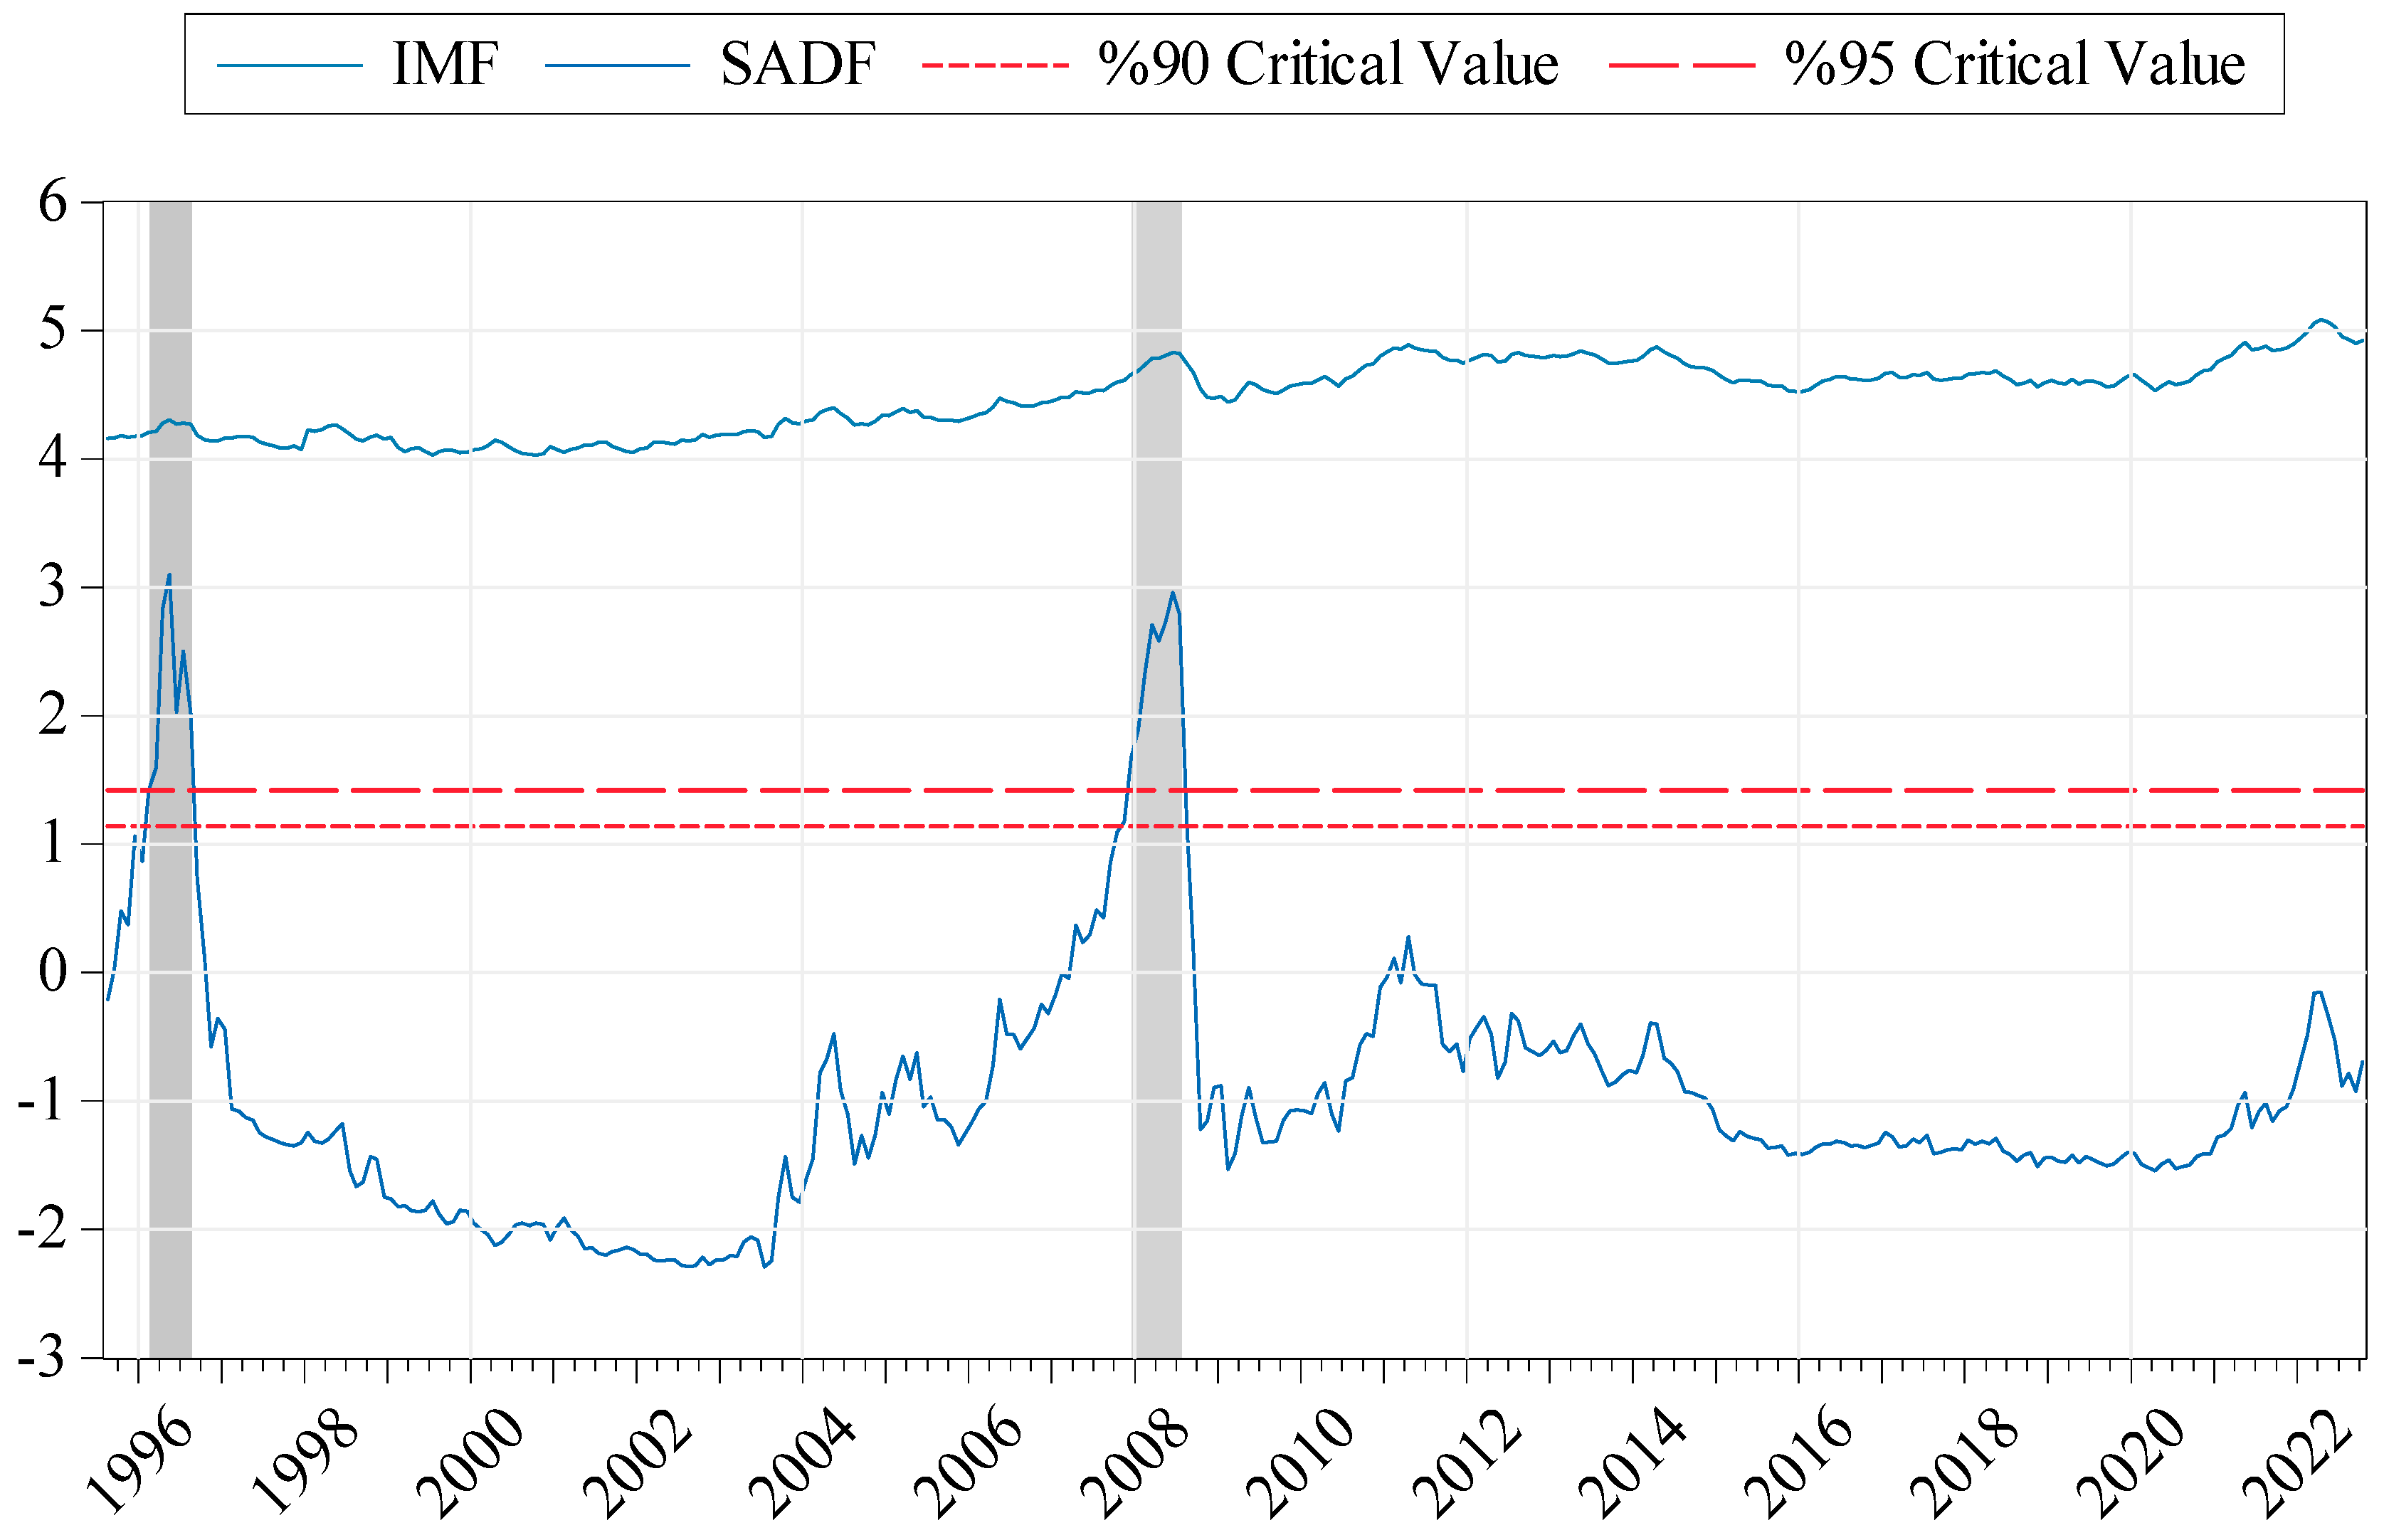
The original observation values of the IMF variable, GSADF test statistics, critical values at 90% and 95% confidence levels, and bubble formation periods are visualized in
Figure 6.
When the bubble formation periods for the IMF variable are analyzed, four different bubble formations are observed. The bubble formation periods calculated for the IMF series are as follows: 13 periods between September 1995 and September 1996, 6 periods between February 2004 and July 2004, 10 periods between October 2007 and July 2008, and 3 periods between March 2022 and May 2022. For the IMF variable, bubble behavior was observed in 32 out of 327 periods, excluding the control period. The bubble behavior for the variable in line with the SADF test is also similar (
Figure A4).
5. Discussion and Conclusions
According to Price et al. [
79], several elements contribute to price bubbles in food prices. Global food markets have become increasingly interconnected, and modifications in grant or demand in one location can rapidly affect costs in different areas (Kocak, Bilgili, Bulut, and Kuskaya [
25]; Ayan and Eken [
80]). Additionally, natural disasters such as droughts or floods can lead to an incredible drop in the food supply, which can cause expenditures to expand unexpectedly (De Gregorio [
81]; Yiu [
82]). The commodity market hypothesis can contribute to bubbles in food prices, as merchants try to find increased income from the upsurge (Li, Li and Chavas [
60]; Zigmont et al. [
83]). Governments and global groups have responded to price bubbles in food expenditures using various measures, including subsidies and price controls [
84]. One frequent coverage response is to supply food subsidies or money transfers to low-income households to assist them in buying meals throughout durations of high expenses (Kusz et al. [
85]). Additionally, some governments have applied price controls or import restrictions to stabilize food costs (Lerro et al. [
86]). However, these prevention policies can have unintended consequences, such as developing market distortions or decreasing incentives for farmers to invest in agriculture (Blasques et al. [
87]). Therefore, there is a need for research to identify good coverage responses to price bubbles in food prices and to enhance international food security. Overall, these studies recommend that sudden increases in food prices or price bubbles are a complicated phenomenon that can be influenced by a variety of factors, including grant and demand imbalances, speculation, government policies, adjustments in manufacturing costs, and market integration. It is crucial to develop effective policies and strategies to address these factors and prevent food price bubbles from negatively impacting global food security. Additionally, collaboration between governments, international organizations, and private sector entities can play a vital role in mitigating the effects of price bubbles on vulnerable populations.
The fact that academic and economic groups have recently taken food prices so seriously demonstrates how crucial this issue is for Turkey and the rest of the world. Examining a study period of January 1992 to October 2022, the research will look at how food price bubbles emerge in Turkey and around the world (Food and Agriculture Organization of the United Nations (FAO) food prices, Organization for Economic Cooperation and Development (OECD) food prices, and the International Monetary Fund (IMF)). In this context, the SADF (Supremum Augmented Dickey–Fuller) and GSADF (Generalized Supremum Augmented Dickey–Fuller) tests of the ADF right-tailed distribution are used to analyze bubble development for the food price variables for Turkey, the FAO, the OECD, and the IMF. When the price bubble formations in the series are examined separately using the TUR variable, 130 periods of bubble formation were identified. There were eight price bubble occurrences noted in the FAO variable. Twelve different bubble formations are revealed by the OECD variable. Four distinct bubble formations may be seen when the bubble formation times for the IMF variable are examined. Similar to [
1,
3,
59,
61,
62,
63,
64,
66,
68,
88,
89,
90,
91] the results of the study suggest that there were many food price bubbles in the period under consideration. A small number of studies [
16,
18,
60] in the literature failed to reach the bubble formations or concluded that very few bubbles formed. The findings suggest the presence of food price bubbles that exhibit deviations from their intrinsic values based on market fundamentals. The literature provides some insights into the possible reasons for the periods with bubbles and their relation to Turkey. Food production, CDS spreads, interest rates, fertilizer prices, and raw-material prices, exchange rates, oil prices, fastest growth in exports, low productivity, rising input costs (Agriculture-PPI 2015 = 100 April 2013 index value is 804.64), inflation expectations, demand-side pressures of a growing population, changing consumer preferences, and supply-side elements such as low productivity, dominant players in the retail industry preventing price competitiveness, cost of capital, migration and aging rural populations, low productivity, agricultural education, and problems in the food supply chain are some of the reasons for the formation of food price bubbles [
92,
93,
94,
95,
96,
97,
98]. Exchange rates have a strong impact on domestic food prices in countries that are highly dependent on imports of energy, fertilizers, and chemicals [
99]. Agricultural policies are seen as falling short of expectations, with import decisions and agricultural support causing harm to farmers and domestic production in the long run [
98]. In summary, the causes of price bubbles are diverse. The literature also highlights the importance of understanding the dynamics behind price spikes. There is a need to develop strategies to prevent and manage bubble formations in the food market.
The government should adopt various regulatory actions to stabilize agricultural prices depending on the characteristics and causes of the various types of agricultural price bubbles and focus on how policies and market processes work together in addressing the issue [
1,
62,
100,
101]. The following points summarize the suggestions in the literature to resolve food price bubbles in Turkey:
Preventing increases in agricultural input costs [
95];
By implementing necessary measures such as structural reform, Turkey can reduce the country risk that arises in economic, political, and financial areas, and thus, the adverse effects of country risk on domestic food prices can be eliminated [
93];
Fertilizer and oil prices should be managed carefully, and alternative energy sources such as solar and wind should be used to decrease dependence on energy imports [
102];
A comprehensive policy approach is required in Turkey to augment productivity, market linkages, and governmental support for price stabilization and agricultural productivity expansion. The adoption of digital technology and investments in research and development (R&D) are of paramount importance [
94];
It is recommended that Turkey considers the production of organic fertilizers and augments the domestic fertilizer supply in the context of food production [
93].
It is imperative for policymakers to consider the ramifications of worldwide food prices when devising policies, whereas investors can proactively predict fluctuations in food prices by closely monitoring macroeconomic indicators [
96]. Therefore, policymakers and economic agents should identify the correlation between domestic and international food prices to develop food policies and agricultural production plans. Policies should focus on increasing domestic food production to reduce the gap between domestic and international food prices. Stable food prices can positively impact the country’s economy and help lower-income citizens. To accomplish this, it is critical to prevent increases in agricultural input costs and to consider multiple factors and market fundamentals when analyzing agricultural price trends. Finally, it is essential to address multiple factors affecting food prices and to improve agricultural planning and policies to ensure long-term sustainability in the industry.
Future research should explore the impact of climate change, water accessibility, and technological innovations on food price bubbles. Future research should also focus on developing effective policies and strategies that appropriately address the complex factors that contribute to price bubbles without causing market distortions or decreasing incentives for farmers to invest in agriculture. In conclusion, it is essential to address the issue of food price bubbles as they can lead to food insecurity, malnutrition, poverty, and social unrest, particularly within vulnerable populations.
