
Linking Biodiversity and Human Wellbeing in Systematic Conservation Assessments of Working Landscapes

 , ,
, , 
Abstract
1. Introduction
2. Materials and Methods
2.1. Study Area
2.2. Stakeholder Engagement
2.2.1. Environmental Consultations
2.2.2. Health Consultations
2.2.3. Workshop
2.2.4. Marxan
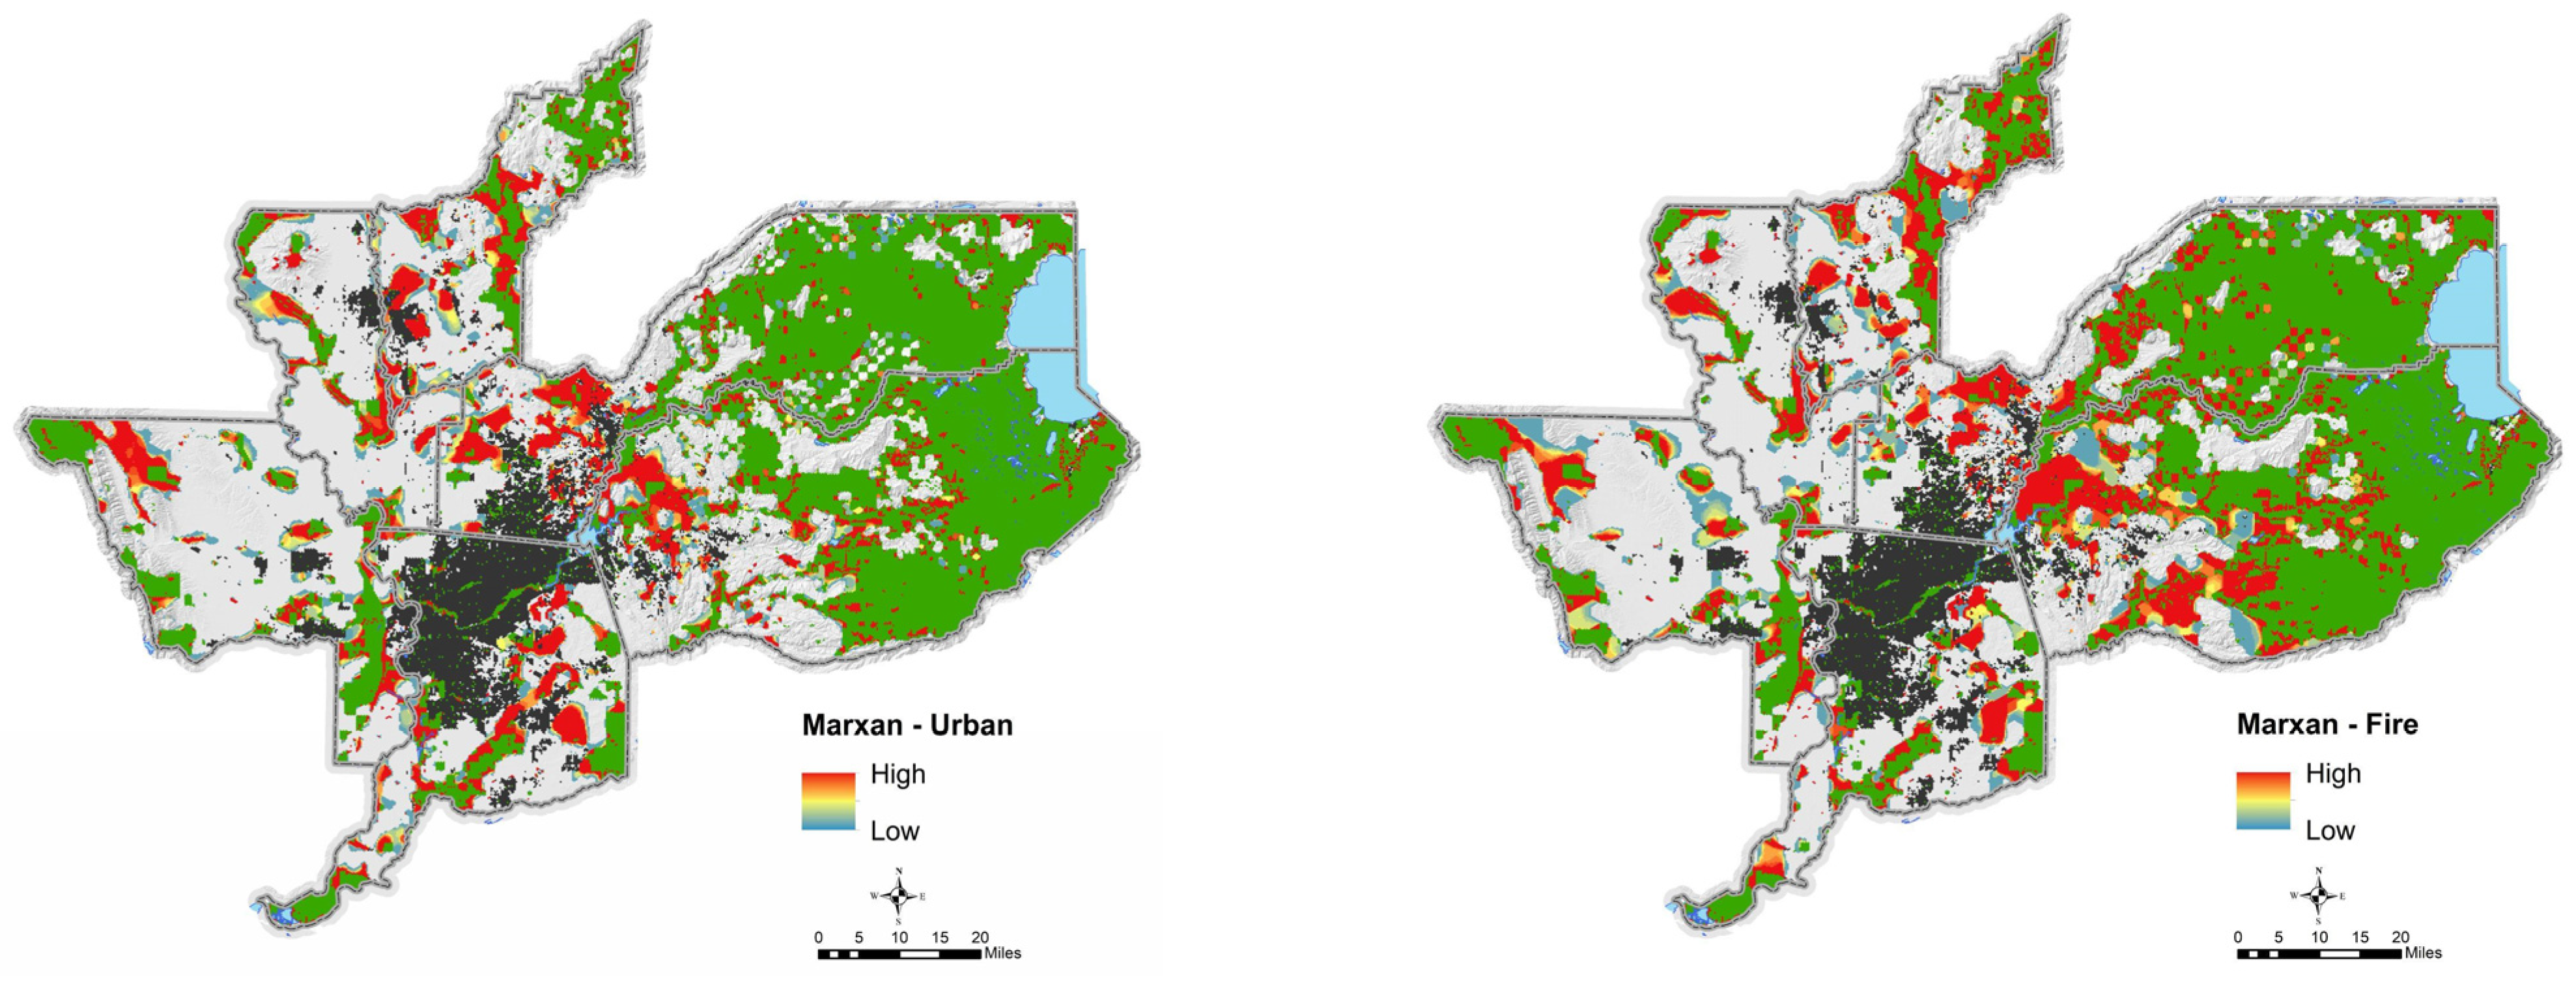
- Scenario 1—Access to Open Space
- Access to open space has many associated health benefits. In this scenario, a lower cost was given to PU in proximity to existing urban areas in order to favor those areas where possible while meeting the conservation goals. Proximity was assessed by calculating the density of urban land cover pixels within a 3-mile radius moving window. Cost was set by calculating the density of urban land cover pixels using a 3 km moving window. The cost of the planning unit was scaled so that cost = 0.1 for units with 100% urban pixels within them and cost = 1.0 for those with 0% urban pixels.
- Scenario 2—Fire Threat
- Wildfires can threaten human health through direct injury and mortality as well as through exposure to smoke particulates. In this scenario, a lower cost was assigned to PU with a high modeled fire threat. This approach assumes that future conservation of these lands will prevent new development, thereby reducing the number of regional residents exposed to high fire risk. Cost was calculated by scaling the California Department of Forestry and Fire Protection’s statewide Fire Threat model so that high fire threat pixels had cost = 0.1 and low threat had cost = 1.0. Mean scores were then calculated for each planning unit.
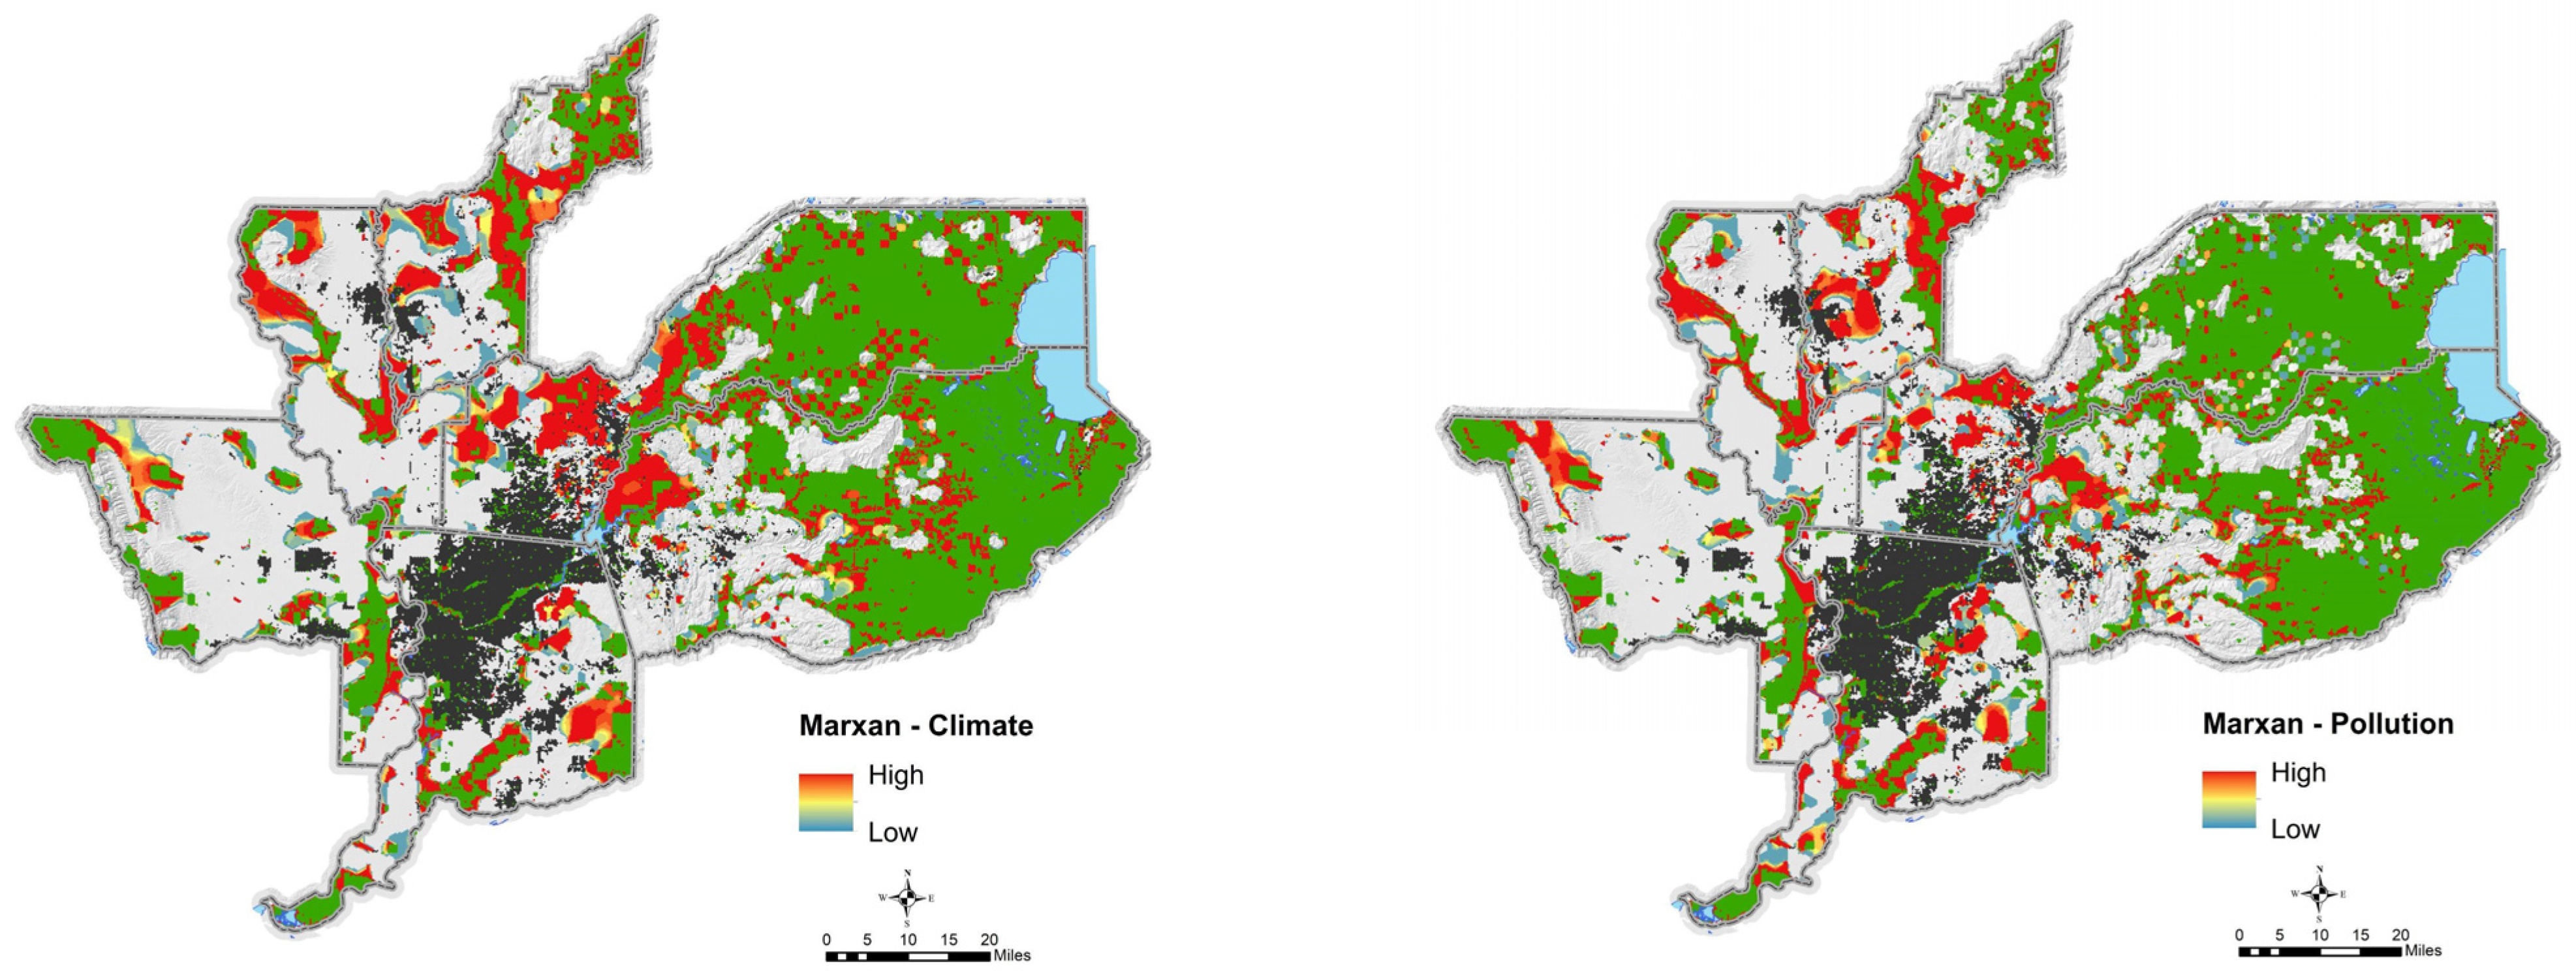
- Scenario 3—Climate Change Threat
- Climate change will likely adversely affect human health through rising temperatures, enhanced wildlife risk, and other environmental effects. We used a climate change exposure model developed by Conservation Biology Institute to represent the regional effects of climate change. The PU costs scores were calculated using Conservation Biology Institute’s California Climate Exposure model. Cost scores were scaled so that cost = 0.1 for high exposure pixels and cost = 1.0 for low exposure pixels.
- Scenario 4—Pollution risk
- Pollution poses a risk to human health, especially for communities that have a lesser capacity to ameliorate the risk. We used a California statewide index that combines pollution levels and social factors as an input to Marxan to steer future conservation areas towards these vulnerable regions. The goals are twofold: (1) provide more open space to disadvantaged communities, and (2) reduce future development within polluted areas. The PU cost scores were calculated using California EPA’s EnviroScreen composite score that combines pollution and population characteristics to identify areas of high potential pollution risk. Pollution values were scaled such that high index scores were given values of cost = 0.1 and low values at cost = 1.0.
- EnviroAtlas score (pollution + vulnerable communities, value = 0–1). (This US EPA tool is available at: https://www.epa.gov/enviroatlas (accessed on 19 June 2023)
- Existing density of tree canopies (scored 0–1, with 0 = 100% tree canopy and 1 = 0% canopy)
- Distance to existing public open space (scored 0–1, with 0 = 0.0 km to existing protected open space and 1 = 1.0 km or greater distance)
3. Results
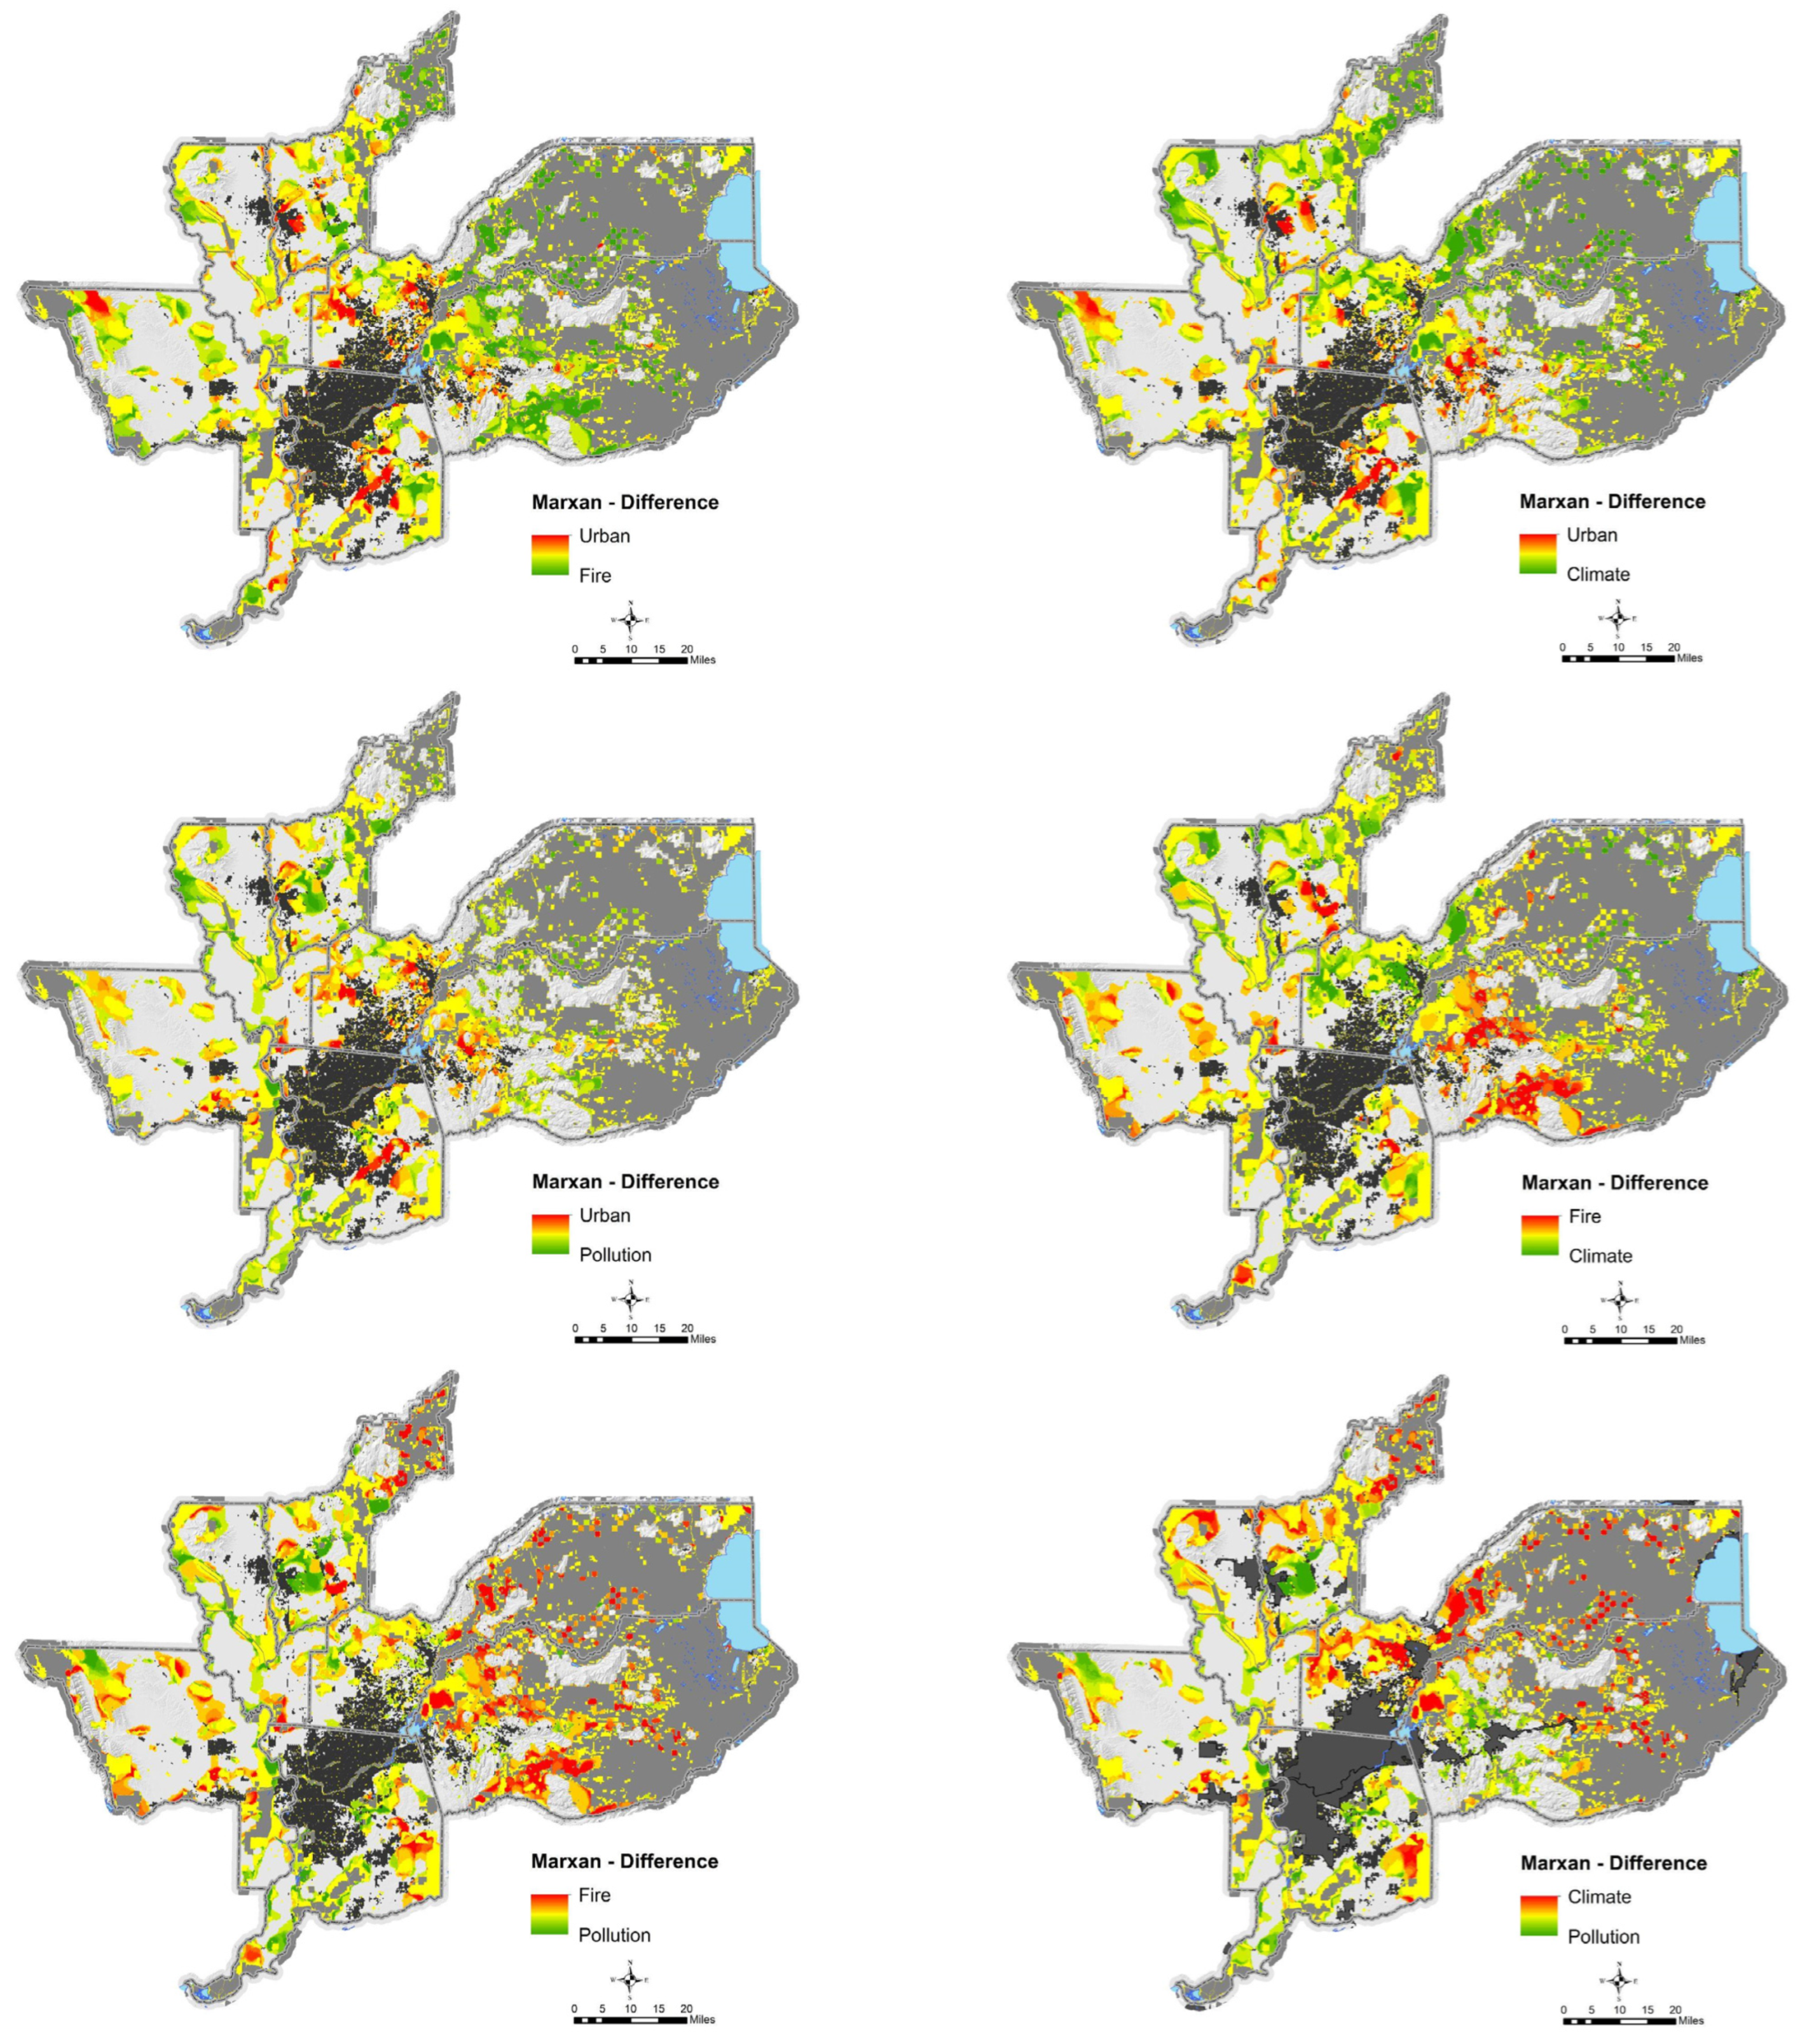
3.1. Marxan Outputs
3.2. Urban Greening
4. Discussion
5. Conclusions
Author Contributions
Funding
Institutional Review Board Statement
Informed Consent Statement
Data Availability Statement
Acknowledgments
Conflicts of Interest
References
- Tomich, T.P.; Hoy, C.; Dimock, M.R.; Hollander, A.D.; Huber, P.R.; Hyder, A.; Lange, M.C.; Riggle, C.M.; Roberts, M.T.; Quinn, J.F. Why Do We Need Food Systems Informatics? Introduction to This Special Collection on Smart and Connected Regional Food Systems. Sustainability 2023, 15, 6556. [Google Scholar] [CrossRef]
- Margules, C.R.; Pressey, R.L. Systematic conservation planning. Nature 2000, 405, 243–253. [Google Scholar] [CrossRef] [PubMed]
- Groves, C.R. Drafting a Conservation Blueprint: A Practitioner’s Guide to Planning for Biodiversity; Island Press: Washington, DC, USA, 2003; ISBN 1-55963-939-3. [Google Scholar]
- Gaines, S.D.; White, C.; Carr, M.H.; Palumbi, S.R. Designing marine reserve networks for both conservation and fisheries management. Proc. Natl. Acad. Sci. USA 2010, 107, 18286–18293. [Google Scholar] [CrossRef]
- Levy, S. The Lyme disease debate: Host biodiversity and human disease risk. Environ. Health Perspect. 2013, 121, A120–A125. [Google Scholar] [CrossRef]
- Haahtela, T.; Holgate, S.; Pawankar, R.; Akdis, C.A.; Benjaponpitak, S.; Caraballo, L.; Demain, J.; Portnoy, J.; von Hertzen, L. The biodiversity hypothesis and allergic disease: World Allergy Organization position statement. World Allergy Organ. J. 2013, 6, 3. [Google Scholar] [CrossRef]
- Kardan, O.; Gozdyra, P.; Misic, B.; Moola, F.; Palmer, L.J.; Paus, T.; Berman, M.G. Neighborhood greenspace and health in a large urban center. Sci. Rep. 2015, 5, 11610. [Google Scholar] [CrossRef]
- Raghupathi, W.; Raghupathi, V. An empirical study of chronic diseases in the United States: A visual analytics approach to public health. Int. J. Environ. Res. Public Health 2018, 15, 431. [Google Scholar] [CrossRef]
- CSDH (Commission on Social Determinants of Health). Closing the Gap in a Generation: Health Equity through Action on the Social Determinants of Health: Final Report of the Commission on Social Determinants of Health; World Health Organization: Geneva, Switzerland, 2008.
- Chetty, R.; Stepner, M.; Abraham, S.; Lin, S.; Scuderi, B.; Turner, N.; Bergeron, A.; Cutler, D. The association between income and life expectancy in the United States, 2001–2014. J. Am. Med. Assoc. 2016, 315, 1750–1766. [Google Scholar] [CrossRef] [PubMed]
- Huber, P.R.; Springer, N.S.; Hollander, A.D.; Brodt, S.; Tomich, T.P.; Quinn, J.F. Indicators of global sustainable sourcing as a set covering problem: An integrated approach to sustainability. Ecol. Health Sustain. 2015, 1, 1–8. [Google Scholar] [CrossRef]
- Springer, N.P.; Garbach, K.; Guillozet, K.; Haden, V.R.; Hedao, P.; Hollander, A.D.; Huber, P.R.; Ingersoll, C.; Langner, M.; Lipari, G.; et al. Sustainable sourcing of global agricultural raw materials: Assessing gaps in key impact and vulnerability issues and indicators. PLoS ONE 2015, 10, e0128752. [Google Scholar] [CrossRef]
- Ball, I.R.; Possingham, H.P.; Watt, M. Marxan and relatives: Software for spatial conservation prioritisation. In Spatial Conservation Prioritisation: Quantitative Methods and Computational Tools; Moilanen, A., Wilson, K.A., Possingham, H.P., Eds.; Oxford University Press: Oxford, UK, 2009; Chapter 14; pp. 185–195. [Google Scholar]
- Rondinini, C.; Stuart, S.; Boitani, L. Habitat suitability models and the shortfall in conservation planning for African vertebrates. Conserv. Biol. 2005, 19, 1488–1497. [Google Scholar] [CrossRef]
- Foresta, M.; Carranza, M.L.; Garfi, V.; Di Febbraro, M.; Marchetti, M.; Loy, A. A systematic conservation planning approach to fire risk management in Natura 2000 sites. J. Environ. Manag. 2016, 181, 574–581. [Google Scholar] [CrossRef]
- Zhang, L.; Xu, W.H.; Ouyang, Z.Y.; Zhu, C.Q. Determination of priority nature areas and human disturbances in the Yangtze River Basin, China. J. Nat. Conserv. 2014, 22, 326–336. [Google Scholar] [CrossRef]
- Winbourne, J.B.; Jones, T.S.; Garvey, S.M.; Harrison, J.L.; Wang, L.; Li, D.; Templer, P.H.; Hutyra, L.R. Tree transpiration and urban temperatures: Current understanding, implications, and future research directions. BioScience 2020, 70, 576–588. [Google Scholar] [CrossRef]
- Basu, R.; Gavin, L.; Pearson, D.; Ebisu, K.; Malig, B. Examining the association between apparent temperature and mental health-related emergency room visits in California. Am. J. Epidemiol. 2018, 187, 726–735. [Google Scholar] [CrossRef]
- Ulmer, J.M.; Wolf, K.L.; Backman, D.R.; Tretheway, R.L.; Blain, C.J.A.; O’Neil-Dunn, J.P.M.; Frank, L.D. Multiple health benefits of urban tree canopy: The mounting evidence for a green prescription. Health Place 2016, 42, 54–62. [Google Scholar] [CrossRef] [PubMed]
- Jiang, B.; Li, D.; Larsen, L.; Sullivan, W.C. A dose-response curve describing the relationship between urban tree cover density and self-reported stress recovery. Environ. Behav. 2016, 48, 607–629. [Google Scholar] [CrossRef]
- Tallis, M.; Taylor, G.; Sinnett, D.; Freer-Smith, P. Estimating the removal of atmospheric particulate pollution by the urban tree canopy of London, under current and future environments. Landsc. Urban Plan. 2011, 103, 129–138. [Google Scholar] [CrossRef]
- Greco, S.E.; Airola, D.A. The importance of native valley oaks (Quercus lobata) as stopover habitat for migratory songbirds in urban Sacramento, California, USA. Urban For. Urban Green. 2018, 29, 303–311. [Google Scholar] [CrossRef]
- Nowak, D.J.; Crane, D.E. Carbon storage and sequestration by urban trees in the USA. Environ. Pollut. 2002, 116, 381–389. [Google Scholar] [CrossRef] [PubMed]
- Bird, J.A.; Pettygrove, G.S.; Eadie, J.M. The impact of waterfowl foraging on the decomposition of rice straw: Mutual benefits for rice growers and waterfowl. J. Appl. Ecol. 2000, 37, 728–741. [Google Scholar] [CrossRef]
- Katz, J.V.E.; Jeffres, C.; Conrad, J.L.; Sommer, T.R.; Martinez, J.; Brumbaugh, S.; Corline, N.; Moyle, P.B. Floodplain farm fields provide novel rearing habitat for Chinook salmon. PLoS ONE 2017, 12, e0177409. [Google Scholar] [CrossRef] [PubMed]
- Diehl, J.A.; Kaur, H. Introduction: New forms of urban agriculture embedded in urban resources—Where is the evidence? In New Forms of Urban Agriculture: An Urban Ecology Perspective; Diehl, J.A., Kaur, H., Eds.; Springer: Singapore, 2021. [Google Scholar] [CrossRef]
- Posivakova, T.; Svajlenka, J.; Hromada, R.; Korim, P. Ecological urban agriculture from the point of view basic elements of sustainability. IOP Conf. Ser. Mater. Sci. Eng. 2019, 603, 022022. [Google Scholar] [CrossRef]
- Lengnick, L.; Miller, M.; Marten, G.G. Metropolitan foodsheds: A resilient response to the climate change challenge? J. Environ. Stud. Sci. 2015, 5, 573–592. [Google Scholar] [CrossRef]


| Type | Target | Current (%) | Goal (%) |
|---|---|---|---|
| Land cover | Alpine dwarf-shrub | 93.7 | 100 |
| Annual grassland | 16.6 | 25 | |
| Aspen | 70.3 | 100 | |
| Bitterbrush | 27.4 | 100 | |
| Blue oak-foothill pine | 18 | 50 | |
| Blue oak woodland | 17.7 | 50 | |
| Closed-cone pine-cypress | 82.8 | 100 | |
| Coastal oak woodland | 5.6 | 100 | |
| Coastal scrub | 18.2 | 100 | |
| Desert riparian | 0 | 100 | |
| Douglas fir | 44.9 | 50 | |
| Eastside pine | 43.7 | 75 | |
| Fresh emergent wetland | 64.2 | 75 | |
| Jeffrey pine | 59.4 | 75 | |
| Juniper | 79.5 | 100 | |
| Lodgepole pine | 82.7 | 90 | |
| Low sage | 96.5 | 100 | |
| Mixed chaparral | 47.4 | 50 | |
| Montane chaparral | 80.9 | 50 | |
| Montane hardwood | 39.9 | 50 | |
| Montane hardwood-conifer | 43.6 | 50 | |
| Montane riparian | 76.5 | 90 | |
| Perennial grassland | 50.2 | 75 | |
| Ponderosa pine | 42 | 50 | |
| Red fir | 89.8 | 90 | |
| Riverine | 24.3 | 50 | |
| Sagebrush | 47.4 | 100 | |
| Saline emergent wetland | 93.6 | 95 | |
| Sierran mixed conifer | 67.8 | 75 | |
| Subalpine conifer | 95.9 | 98 | |
| Valley foothill riparian | 24.9 | 50 | |
| Valley oak woodland | 7.3 | 75 | |
| Wet meadow | 73.6 | 80 | |
| White fir | 78.2 | 80 | |
| Corridors | Wildlife corridors | 13.8 | 30 |
| Habitats | Vernal pools—complex | 21 | 50 |
| Vernal pools—large pool | 16.1 | 75 | |
| Monarch butterfly | 24 | 50 | |
| Critical Habitat—CA red-legged frog | 32 | 50 | |
| Critical Habitat—CA tiger salamander | 24 | 50 | |
| Critical Habitat—Sacramento Orcutt grass | 37 | 50 | |
| Critical Habitat—slender Orcutt grass | 6 | 50 | |
| Critical Habitat—Sierra Nevada yellow-legged frog | 85 | 90 | |
| Critical Habitat—valley elderberry longhorn beetle | 89 | 95 | |
| Critical Habitat—vernal pool fairy shrimp | 31 | 50 | |
| Critical Habitat—vernal pool tadpole shrimp | 33 | 50 | |
| Critical Habitat—yellow-billed cuckoo | 82 | 90 | |
| Agriculture | Prime farmland | 6.4 | 25 |
| Rice | 6.8 | 25 | |
| Priority rangeland | 24 | 50 | |
| Other | Groundwater recharge potential | 8 | 25 |
| County | 0-Base | 1-Urban | 2-Fire | 3-Climate | 4-Pollution | Mean |
|---|---|---|---|---|---|---|
| El Dorado | 9.7 | 9.7 | 16.3 | 12.2 | 9.9 | 11.6 |
| Placer | 9.0 | 9.6 | 11.6 | 16.9 | 8.7 | 11.2 |
| Sacramento | 10.9 | 11.5 | 9.4 | 9.4 | 10.8 | 10.4 |
| Sutter | 9.9 | 9.4 | 10.9 | 13.8 | 14.5 | 11.7 |
| Yolo | 9.0 | 8.5 | 8.9 | 7.1 | 8.5 | 8.4 |
| Yuba | 16.1 | 16.4 | 20.7 | 22.9 | 21.0 | 19.4 |
| All Counties | 10.4 | 10.5 | 13.1 | 13.4 | 11.2 |
| Scenario A | Scenario B | Diff % |
|---|---|---|
| 1—Urban | 0—Base | 0.06 |
| 2—Fire | 0—Base | 2.92 |
| 3—Climate | 0—Base | 2.73 |
| 4—Pollution | 0—Base | 0.50 |
| 1—Urban | 4—Pollution | 0.81 |
| 2—Fire | 4—Pollution | 3.13 |
| 3—Climate | 4—Pollution | 2.63 |
| 1—Urban | 2—Fire | 3.23 |
| 1—Urban | 3—Climate | 3.10 |
| 2—Fire | 3—Climate | 1.92 |
| County | Res Area (ha) | Mean GNI | High (ha) | High (%) |
|---|---|---|---|---|
| El Dorado | 10,240 | 0.07 | 0 | 0.0 |
| Placer | 13,490 | 0.08 | 30 | 0.2 |
| Sacramento | 57,790 | 0.18 | 2910 | 5.0 |
| Sutter | 4100 | 0.29 | 470 | 11.5 |
| Yolo | 7030 | 0.13 | 160 | 2.3 |
| Yuba | 4050 | 0.33 | 1110 | 27.4 |
| All Counties | 96,700 | 0.16 | 4680 | 4.8 |
Disclaimer/Publisher’s Note: The statements, opinions and data contained in all publications are solely those of the individual author(s) and contributor(s) and not of MDPI and/or the editor(s). MDPI and/or the editor(s) disclaim responsibility for any injury to people or property resulting from any ideas, methods, instructions or products referred to in the content. |
© 2023 by the authors. Licensee MDPI, Basel, Switzerland. This article is an open access article distributed under the terms and conditions of the Creative Commons Attribution (CC BY) license (https://creativecommons.org/licenses/by/4.0/).
Share and Cite
Huber, P.R.; Baker, M.; Hollander, A.D.; Lange, M.; Miller, D.; Quinn, J.F.; Riggle, C.; Tomich, T.P. Linking Biodiversity and Human Wellbeing in Systematic Conservation Assessments of Working Landscapes. Sustainability 2023, 15, 9912. https://doi.org/10.3390/su15139912
Huber PR, Baker M, Hollander AD, Lange M, Miller D, Quinn JF, Riggle C, Tomich TP. Linking Biodiversity and Human Wellbeing in Systematic Conservation Assessments of Working Landscapes. Sustainability. 2023; 15(13):9912. https://doi.org/10.3390/su15139912
Chicago/Turabian StyleHuber, Patrick R., Matthew Baker, Allan D. Hollander, Matthew Lange, Daphne Miller, James F. Quinn, Courtney Riggle, and Thomas P. Tomich. 2023. "Linking Biodiversity and Human Wellbeing in Systematic Conservation Assessments of Working Landscapes" Sustainability 15, no. 13: 9912. https://doi.org/10.3390/su15139912
APA StyleHuber, P. R., Baker, M., Hollander, A. D., Lange, M., Miller, D., Quinn, J. F., Riggle, C., & Tomich, T. P. (2023). Linking Biodiversity and Human Wellbeing in Systematic Conservation Assessments of Working Landscapes. Sustainability, 15(13), 9912. https://doi.org/10.3390/su15139912