Article

Static Load Test Analysis of T-Beam Bridge Shear Strengthening by Prestressed Steel Wire Rope Embedded in Polyurethane Cement (PSWR-PUC)

1
School of Civil Engineering, Heilongjiang University, Harbin 150080, China
2
Key Laboratory of Functional Inorganic Material Chemistry, Heilongjiang University, Ministry of Education of the People’s Republic of China, Harbin 150080, China
*
Authors to whom correspondence should be addressed.
Sustainability 2023, 15(13), 10514; https://doi.org/10.3390/su151310514
Submission received: 24 May 2023 / Revised: 23 June 2023 / Accepted: 30 June 2023 / Published: 4 July 2023
(This article belongs to the Special Issue Sustainable Civil Engineering Structures and Construction Materials)

Abstract

:
Many bridges suffer from aging and deterioration problems and need to be strengthened. PSWR-PUC is an emerging structural strengthening technology that enhances the load-bearing capacity of concrete bridges by embedding prestressed steel wire ropes into polyurethane cement. This paper focuses on investigating the shear reinforcement effectiveness of PSWR-PUC. Firstly, the composition of PSWR-PUC is introduced. Subsequently, two T-beam bridges in similar service condition are selected, and shear strengthening schemes involving PSWR-PUC and externally bonded steel plates are devised. Lastly, static loading tests are conducted, and the deflection and strain data of the two bridges before and after reinforcement intervention are analyzed. The results indicate that both strengthening methods improve the bridge load-carrying capacity. However, compared to the bridge strengthened with the externally bonded steel plate method, the deflections in the bridge strengthened with PSWR-PUC decreased by 36.8% and 42.1%, the strains decreased by 18% and 23%, and the shear stiffness was improved to a greater extent. These results verified that the PSWR-PUC strengthening method is effective for improving structural capacity and performance. This study will contribute to an in-depth understanding of the performance characteristics and application scope of PSWR-PUC shear strengthening technology, and it provides a scientific basis and guidance for practical engineering applications.

1. Introduction

As key nodes in roads, bridges play an important role [1]. Bridge safety is the key to ensuring smooth traffic on roads [2,3]. However, bridge capacity is affected by a great many factors. For example, the external environment can lead to degradation of material properties, and increasing traffic load can accelerate bridge damage [4,5]. Bridge capacity will decrease with increasing traffic time [6], eventually developing into a dangerous situation (which can be called an unsafe bridge) after continuous attenuation of the bearing capacity [7,8].
If all unsafe bridges are demolished and rebuilt, this would interrupt road traffic and lead to expensive construction costs. Additionally, rebuilding all unsafe bridges has an adverse impact on economic development. The key points of unsafe bridge management are: scientific and reasonable evaluation of bridge safety grade, determination of bridge capacity after damage, and development of reliable and economical strengthening measures. The bearing capacity, durability, and service lives of bridges can be improved by strengthening [9,10].
Due to low design load in the early stage and serious overloading during operation, some bridges in China with concrete structures are suffering from various diseases at present [11]. Shear damage is mainly characterized by the development of inclined cracks in the shear span areas of bridges [12], which mostly appear near bridge bearings with thin webs, such as T-beams and long-span continuous box girders [13], as shown in Figure 1. Bending stiffness and shear stiffness both influence structural deformation, as shown in Figure 2. Shear stiffness can decrease after inclined cracks appear in thin webs, leading to an increase in shear deformation [14]. Therefore, the total deflection in a bridge can increase greatly [15,16].
In recent years, scholars worldwide have carried out a series of studies on bridge reinforcement, which can be divided into inorganic and organic material reinforcement methods according to the nature of the reinforcement materials. Inorganic reinforcement methods include steel jackets [17], wire mesh cement [18], externally bonded steel plates [19], and bolted anchored steel plates. By using inorganic materials to strengthen the main beam, the stiffness and strength of the beam are changed to effectively stop the structure from cracking. Organic reinforcement methods mainly include composite reinforcement (FRP) [20], polymer filling, and polymer-modified materials [21]. The use of organic materials for reinforcement and strengthening treatment of concrete structures not only improves the load-bearing capacity of bridges but also has the advantages of corrosion resistance and high toughness. Suitable reinforcement methods can be selected for different bridge forms and damage states.
The cross-sectional forms are different in actual bridge strengthening projects, but these bridges usually adopt T- or box-shaped cross-sections with thin webs [22,23]. Girders with thin webs are prone to developing inclined cracks and insufficient shear capacity. Generally, the thin web is rectangular and it mainly bears the shear force [24]. At present, the bonding steel plate and bonding FRP (fiber-reinforced polymer) methods are widely used in the shear strengthening of actual bridges [25].
In the last three decades, the externally bonded steel plate method has be widely used in strengthening projects of reinforced concrete structures [26]. This method has the advantages of lost cost and excellent strengthening effect [27]. It does not change the structural system and mechanical behavior of the original structure and causes little increase in dead load. Steel plates and concrete surfaces are bonded by epoxy resin adhesive [28]. The epoxy resin adhesive has a higher bonding strength than the tensile and shear strengths of the concrete. It can effectively connect the steel plate and original RC structure, and they can bear the load together [29]. Due to the fast curing time of the epoxy resin adhesive, this strengthening method can save construction time. The externally bonded steel plate method can effectively improve the rigidity and strength of the original RC structure and limit the development of existing cracks. Therefore, the capacity of the RC structure is effectively improved after strengthening. However, there are some shortcomings with the externally bonded steel plate method. Rust corrosion of the steel plate and aging failure of the epoxy resin adhesive are the two most common defects, shown in Figure 3. Aging failure of epoxy resin adhesive can lead to separation of the steel plate and concrete [30].
In recent years, a large number of studies on FRP (fiber-reinforced polymer) strengthening in civil engineering have been carried out by many researchers [31,32], and FRP has been widely used to strengthen reinforced concrete structures due to its high specific strength and corrosion resistance [33,34]. There are many types of FRP used for strengthening engineered structures, which are mainly divided into FRP sheets and bars [35]. Externally bonded FRP sheets is the most widely used strengthening measure among FRP strengthening measures. FRP sheets are bonded to the concrete surface by epoxy resin adhesive to strengthen the RC members so that the tensile stress of the FRP sheets can be transferred to the RC members, thereby improving capacity. The FRP strengthening method is simple in construction and has little impact on the original structure, and it is efficient and easy to control the strengthening quality. However, bonded FRP sheets have no obvious effect on structural stiffness. In the externally bonded FRP sheets method, brittle peeling failure at the interface between FRP sheets and concrete easily occurs, as shown in Figure 4, because of the lack of a good anchoring measure [36,37]. Debonding failure at the interface between FRP sheets and concrete can lower the FRP strength utilization ratio, leading to brittle failure of the structure with a random failure process [38].
The prestressed steel wire rope (PSWR) strengthening method is an innovative active strengthening method that anchors steel wire ropes on the beam and tension is applied [39,40]. It is easy to apply tension because of the small diameter of the steel wire rope [41,42], so tensioning construction can be carried out with simple devices. However, steel wire ropes easily rust in external environments [43,44]. To prevent the steel wire rope from corroding, composite mortar is bonded to the outer layer of the concrete. However, composite mortar easily cracks due to its low tensile strength. This problem can be solved by replacing the composite mortar with polyurethane cement (PUC) because PUC has the advantages of high strength and toughness.
In order to study the shear strengthening effect on an actual bridge using the PSWR-PUC method, compared with that achieved by the bonded steel plate method, the on-site application effect of PSWR-PUC was verified in a strengthening project involving two actual bridges. The original design loads of the two bridges were Vehicle-20 grade load. The superstructures had the same form, which was reinforced concrete T-beams with thin webs. The service times were similar, with completion and operation times of about 30 years. PSWR-PUC and bonded steel plates were used to strengthen the shear span areas of reinforced concrete T-beams to meet Highway Grade II Load requirements. Static load tests were carried out before and after strengthening of the two bridges, and deformation and strain data were collected during the tests. The strengthening effects were compared using deformation and strain analyses.

2. Prestressed Steel Wire Rope Embedded in Polyurethane Cement (PSWR-PUC) Strengthening Method

2.1. Characteristics of PSWR-PUC

Prestressed steel wire rope strengthening technology is a special prestressed strengthening method using small-diameter wire rope, and polyurethane cement strengthening technology is a special section-enlarging strengthening method. Prestressed steel wire rope embedded in polyurethane cement strengthening technology is an effective combination of indirect and direct strengthening, active and passive strengthening, and inorganic and organic strengthening. It gives full play to the advantages of two kinds of strengthening technology and can solve difficult problems in strengthening. The characteristics of PSWR-PUC are as follows:
(1)
The polyurethane cement strengthening layer can be used as a fixing material for steel wire rope. Firstly, the polyurethane cement layer can wrap the wire rope, providing a layer of protection and preventing the corrosion factors in the external environment (such as water, oxygen, chemical substances, etc.) from directly contacting the wire rope’s surface [45]. This can extend the service life of the steel wire rope and improve its corrosion resistance. Secondly, the polyurethane cement layer can evenly transfer the force applied to the wire rope to the concrete structure [46]. It provides a strong embedded layer, which enables the wire rope to effectively withstand forces such as tension and shear, thus ensuring a more efficient and stable force transmission effect. Finally, the polyurethane cement layer enhances the anchorage security of the wire rope through its bonding ability with the concrete [47]. It can form a strong bonding interface between the wire rope and concrete so that the wire rope can be effectively anchored in the concrete structure and provide sufficient pull-out and shear strength.
(2)
Prestressed steel wire ropes can increase the internal reinforcement of the polyurethane cement. On the one hand, by applying prestress, the steel wire rope enables the polyurethane cement layer to withstand greater tensile stress, thus increasing the overall structural strength [48]. On the other hand, the prestressing effect of the prestressed steel wire rope can effectively inhibit cracking in the polyurethane cement layer. When subjected to external loading, prestress of the steel wire rope can offset some or all of the stresses and reduce the strain in the polyurethane cement layer [49], thus reducing the risk of cracking. In addition, the prestressed wire rope can effectively reduce the thickness of the polyurethane cement layer by increasing the number of ropes while substantially increasing the structure’s load-bearing capacity. It can reduce the increase in structural weight and dead load by reducing the usage of polyurethane cement.
The PSWR-PUC method gives not only full play to the characteristics of active strengthening to reduce the structural internal force, but it also adopts a passive strengthening material to protect the steel wire rope. The combination of two strengthening technologies can greatly improve the structural capacity.

2.2. Components of PSWR-PUC

2.2.1. Polyurethane Cement

Polyurethane cement (PUC) is a kind of cement-based composite with high ductility and durability. The main components of PUC are polyurethane and cement, which both can be used as cementitious material alone. Polyurethane cement, a new type of organic and inorganic composite, achieves high strength and toughness by mixing polyurethane and cement, which has the advantages of the two materials, such as fast setting speed, high early strength, and high toughness. The compressive strength of the polyurethane cement used in this study’s actual bridge reinforcement project was 66.6 MPa, the compressive elastic modulus was 3087 MPa, and the flexural strength was 43.4 MPa.
Polyurethane is a two-component adhesive used in PUC, which is mainly prepared by polymethylene polyphenylene isocyanate and polyether combinations. Polymethylene polyphenylene isocyanate is abbreviated as PAPI, or crude MDI, commonly known as black material. It is a mixture of isocyanate and diphenylmethane diisocyanate containing a certain amount of higher functionality, which is a brown liquid at room temperature. The type of polymethylene polyphenylene isocyanate used in this experiment was WANNATE® PM-200 (Figure 5a). The main components of polyether combinations are polyether polyols, silicone oil, and epoxy catalyst EZ01, commonly known as white material, which is a colorless, transparent liquid at room temperature. The type of polyether combination used in this experiment was ES305 (Figure 5b). Dabco MixCO2 was used as a catalyst with a tertiary amine-containing Dabco structure (Figure 5c). 42.5R ordinary silicate cement was used in the PUC.
The raw materials for the polyurethane cement were polymerized by mixing at a mass ratio of isocyanates:polyether combination:silicate cement:catalyst = 1:1:2:0.02, as shown in Table 1. The manufacturing process of the polyurethane cement is as follows, and the preparation process is shown in Figure 5.
(1)
Drying and dehydration of cement. Firstly, the cement is put into the frying oven, then the frying oven is ignited and heated. The frying oven should be kept rotating at a constant speed during the heating process, as shown in Figure 5d. The stir-frying time is about 90~120 min at 200 °C at continuous high temperature. The purpose of drying is to eliminate the free and bound water in the cement as much as possible in order to prevent bubble generation during the reaction between the cement and polyurethane. At the same time, high-temperature frying can disperse the large-diameter particles in the cement, making it finer. The use of dehydrated cement can improve the quality of the prepared polyurethane cement. After stir-frying the cement, it should be immediately sealed and chilled to room temperature before being utilized for preparation.
(2)
Mixing polyurethane components well. Polymethylene polyphenylene isocyanate (WANNATE® PM-200) and polyether combination (ES305) are mixed according to a mass ratio of 1:1, as shown in Figure 5e. Stir thoroughly to ensure that the isocyanate and polyether can undergo the complete polymerization reaction. The mixing time can be reduced to 2~5 min using an electric mixer. The fully mixed polyurethane adhesive is a gray-black, semi-transparent colloid. It can be determined whether the two liquids are evenly mixed by observing whether the color of the adhesive solution after mixing is consistent.
(3)
Preparing polyurethane cement colloid. Firstly, the dried and dehydrated cement in step (1) and polyurethane adhesive solution in step (2) are mixed, as shown in Figure 5f. Once the polyurethane and cement are well mixed, add the Dabco MixCO2 catalyst (2% mass ratio, based on the weight of the polyurethane), and continue stirring. The addition of the catalyst will speed up the polymerization reaction and give off heat to warm up the mixture. In order to avoid curing the polyurethane cement, the mixing process should not exceed 3 min after addition of the catalyst.
(4)
Pouring and curing. The polyurethane cement colloid is poured into the prepared formwork, the mold is tapped to release small air bubbles formed during mixing and pouring, and the residual colloid is smoothed on the surface of the formwork, as shown in Figure 5h. The polyurethane cement colloid can be solidified for about 60 min, and the formwork can be removed after curing for 24 h at room temperature. The polyurethane cement composite material has good moldability. Various kinds of polyurethane cement specimens with different shapes can be prepared according to specimen molds to meet tests with different mechanical indexes.
The polyurethane cement sample prepared by drying the silicate cement had a smooth, flat surface with no bubbles or holes. It was a compact and uniform material, and its macroscopic water content and porosity were 0%.

2.2.2. Steel Wire Rope

Small-diameter wire rope with high strength, low creep rate, and good ductility was selected for this strengthening method. Galvanized steel wire rope (6 × 7 + IWS) with a diameter of 4 mm was used in actual bridge one. The cross-sectional area was 12.56 mm2, and the designed ultimate strength was 1250 MPa.
A tensile test was conducted on the steel wire rope, as shown in Figure 6. It could be seen that the failure process of the steel wire rope involved each component strand breaking in turn, which gave a scattered flower shape.

3. Details and Damage of Actual Bridges

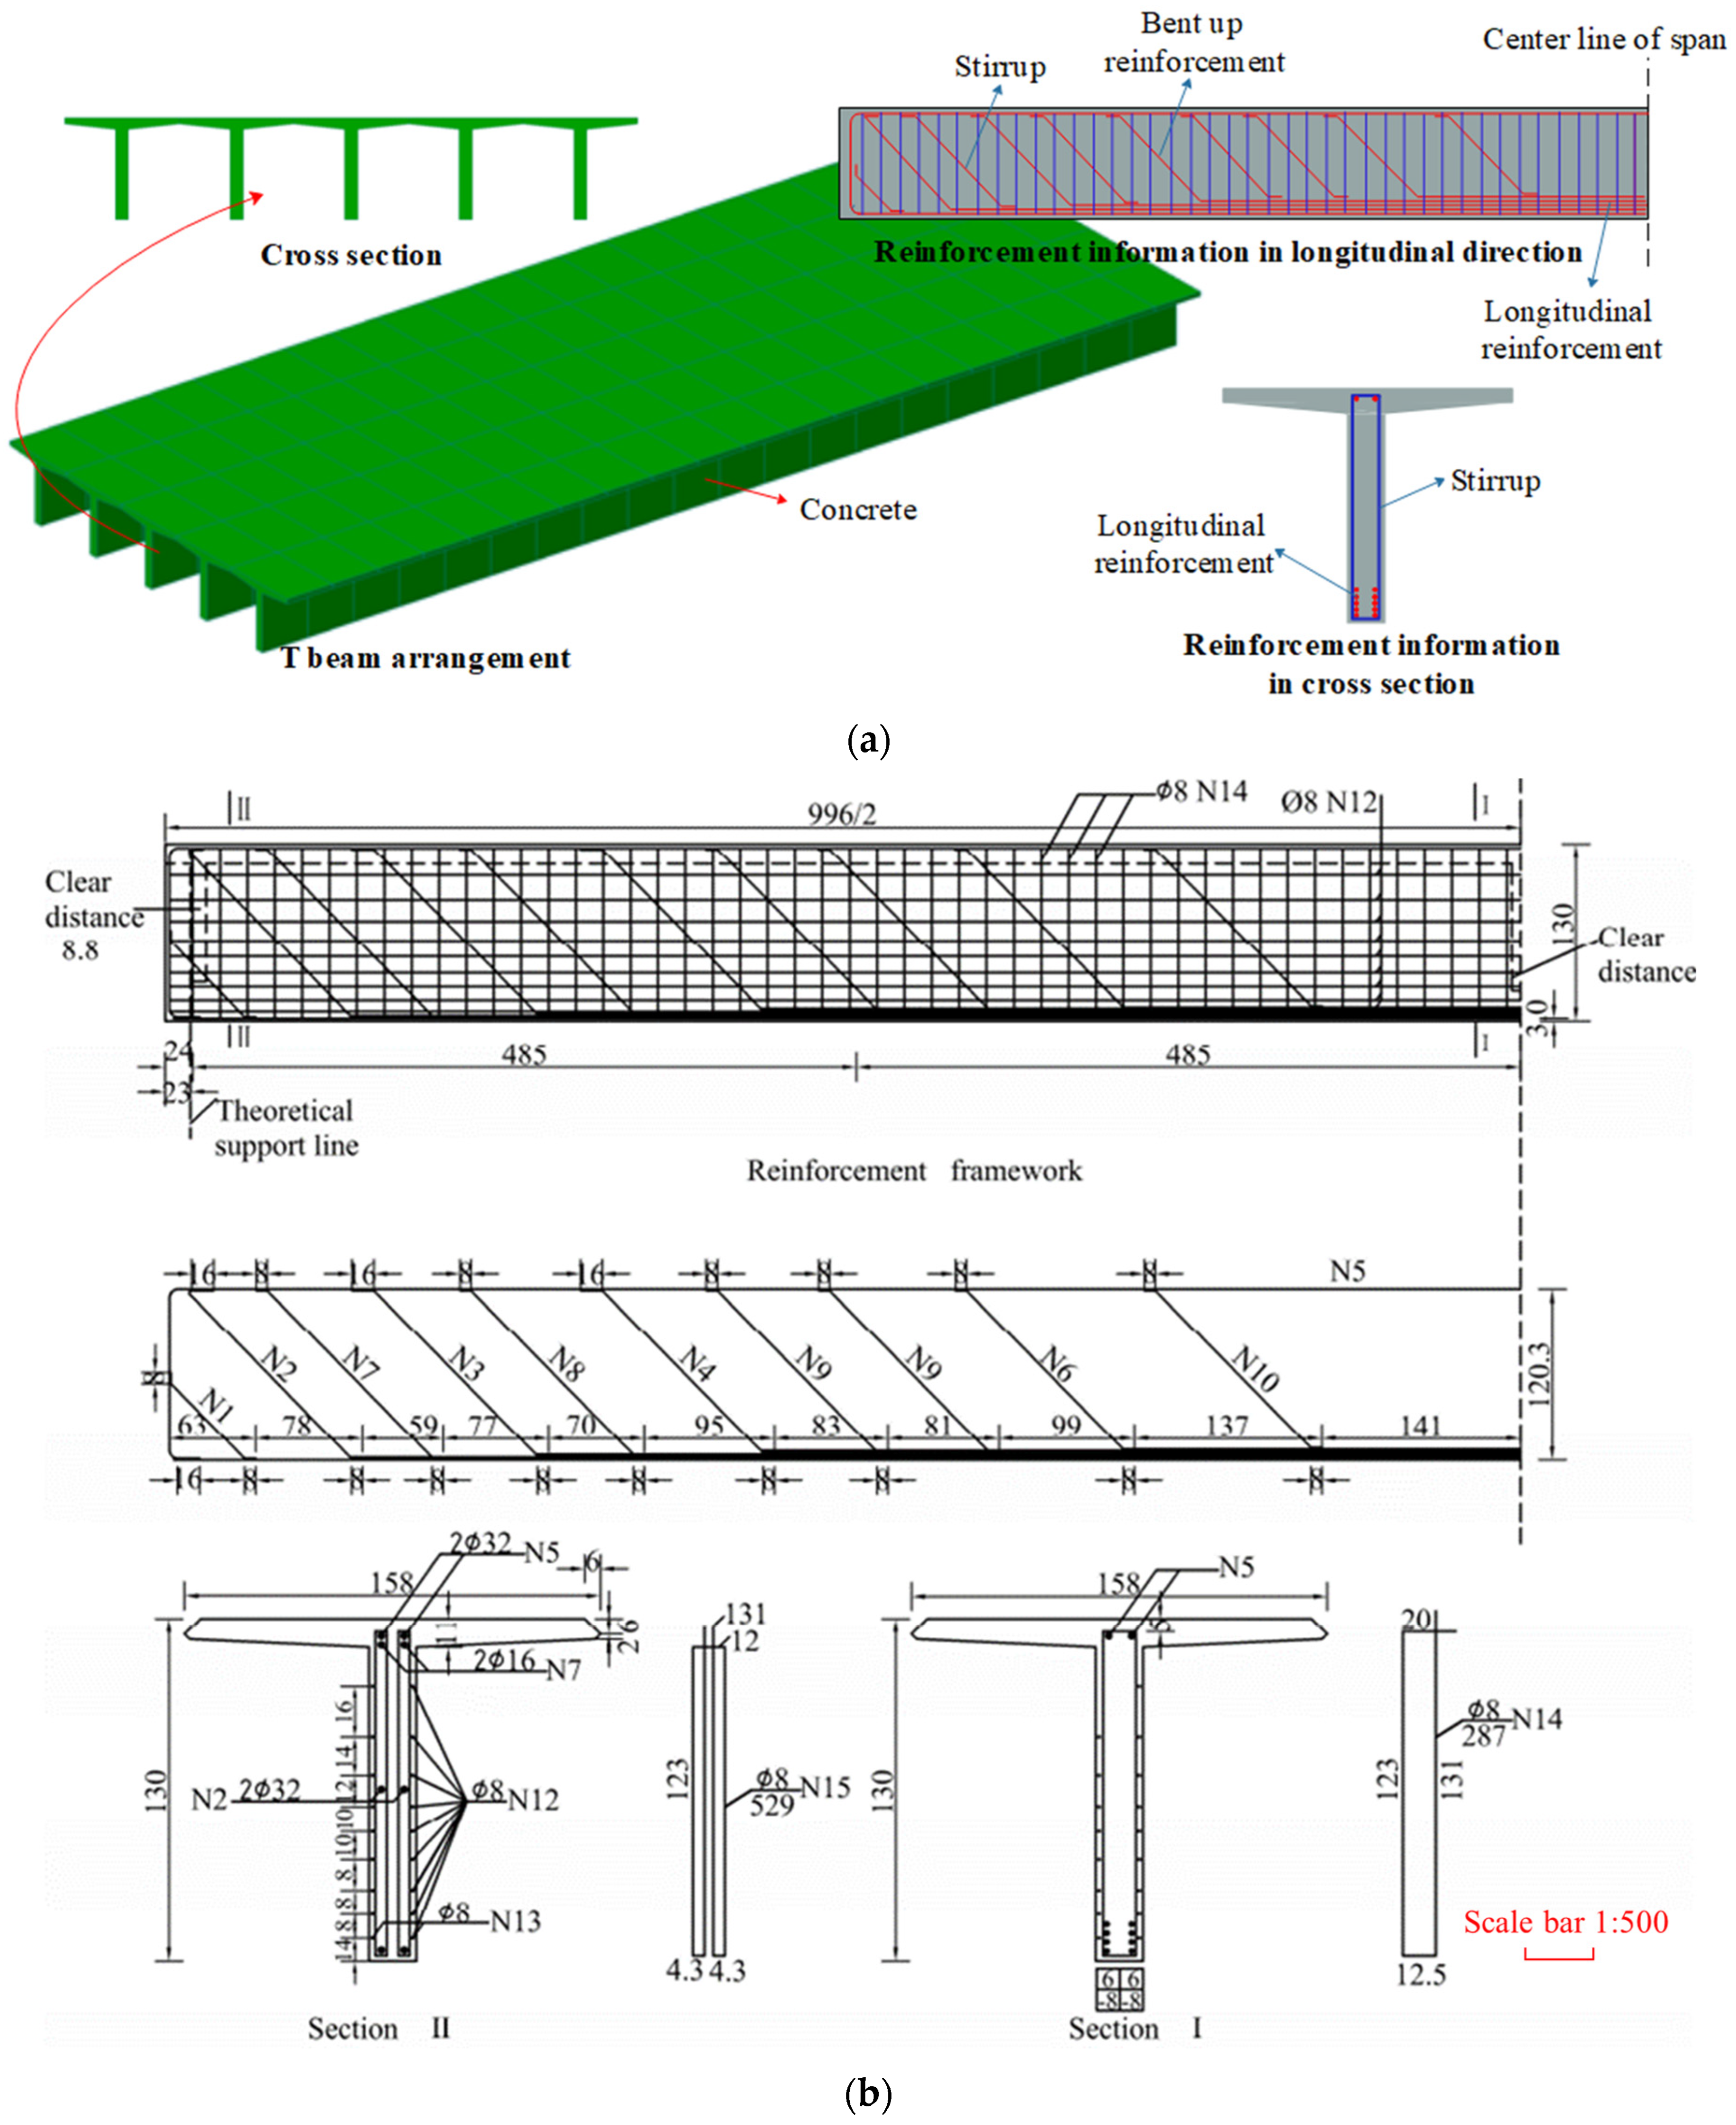
3.1. Project Overview of Actual Bridges

Actual bridge one was completed and opened to traffic in 1989, and the front and side views and layout of the bridge are shown in Figure 7. The total length of bridge one was 64.8 m with three spans, and the width of the bridge deck was 8 m with a 2 × 0.5 m guardrail and 7 m carriageway. The superstructure adopted prefabricated, reinforced-concrete, simply-supported T-shape beams, each with a span of 20 m. The substructure adopted piers (abutments) with one bend cap and two columns. Two bored piles were used for each pier (abutment) foundation. The bridge deck pavement adopted asphalt concrete with a thickness of 13 cm. The design load of actual bride one was Vehicle-20 grade load according to the General Specifications for Design of Highway Bridges and Culverts (JTJ 021-89) [50], as shown in Figure 8.
Actual bridge two was completed and opened to traffic in 1980s, and the front view and layout of bridge two is shown in Figure 9. The total length of bridge two was 144.8 m with seven spans, and the width of the bridge deck was 11.5 m with a 0.5 m guardrail, 9.5 m carriageway, and 1.5 m sidewalk. The superstructure adopted prefabricated, reinforced-concrete, simply-supported T-shape beams, each with a span of 20 m. The substructure adopted piers (abutments) with one bend cap and two columns. Two bored piles were used for each pier (abutment) foundation. The bridge deck pavement adopted asphalt concrete with a thickness of 10 cm. The design load of actual bridge two was Vehicle-20 grade load, as shown in Figure 8.
Through field measurement data and the original data of the two bridges, it could be seen that the cross-sectional size and reinforcement information of the T-beams of actual bridges one and two were the same. There were five and seven T-beams in actual bridges one and two in the transverse direction, respectively. The height of the T-beams was 1.3 m, the width of the top plate was 1.6 m, and the thickness of the web was 0.18 m. The layout of the T-beam structure (taking bridge one as an example) is shown in Figure 10a.
The strength of the concrete of the two actual bridges was about C35, which was determined using the rebound method.
The reinforcement details of the T-beams is shown in Figure 10b. Each T-beam was equipped with 8 steel bars with diameters of 32 mm and 2 steel bars of 16 mm in the longitudinal direction at the bottom, which were grade II type with a standard strength of 335 MPa. The numbers of the longitudinal steel bars were N1, N2, N3, N4, and N6. Two N1 bars passed through the bearing center of the T-beam end located at the lowest layer, and the remaining 8 bars (N2, N3, N4 and N6) were bent at corresponding positions according to the bending moment envelope in the longitudinal direction. N5 was the erection reinforcement located at the top, which was grade II type with a diameter of 32 mm. The stirrups of N14 and N15 were round bars with diameters of 8 mm, which were grade I type with a standard strength of 235 MPa. The stirrups were equipped with 2 numbers near the bearing and 1 number near the mid-span. The diagonal reinforcements of N7, N8, N9, N10, and N11 were equipped in the shear span areas according to the tensile principal stress, which were grade II type with a diameter of 16 mm.

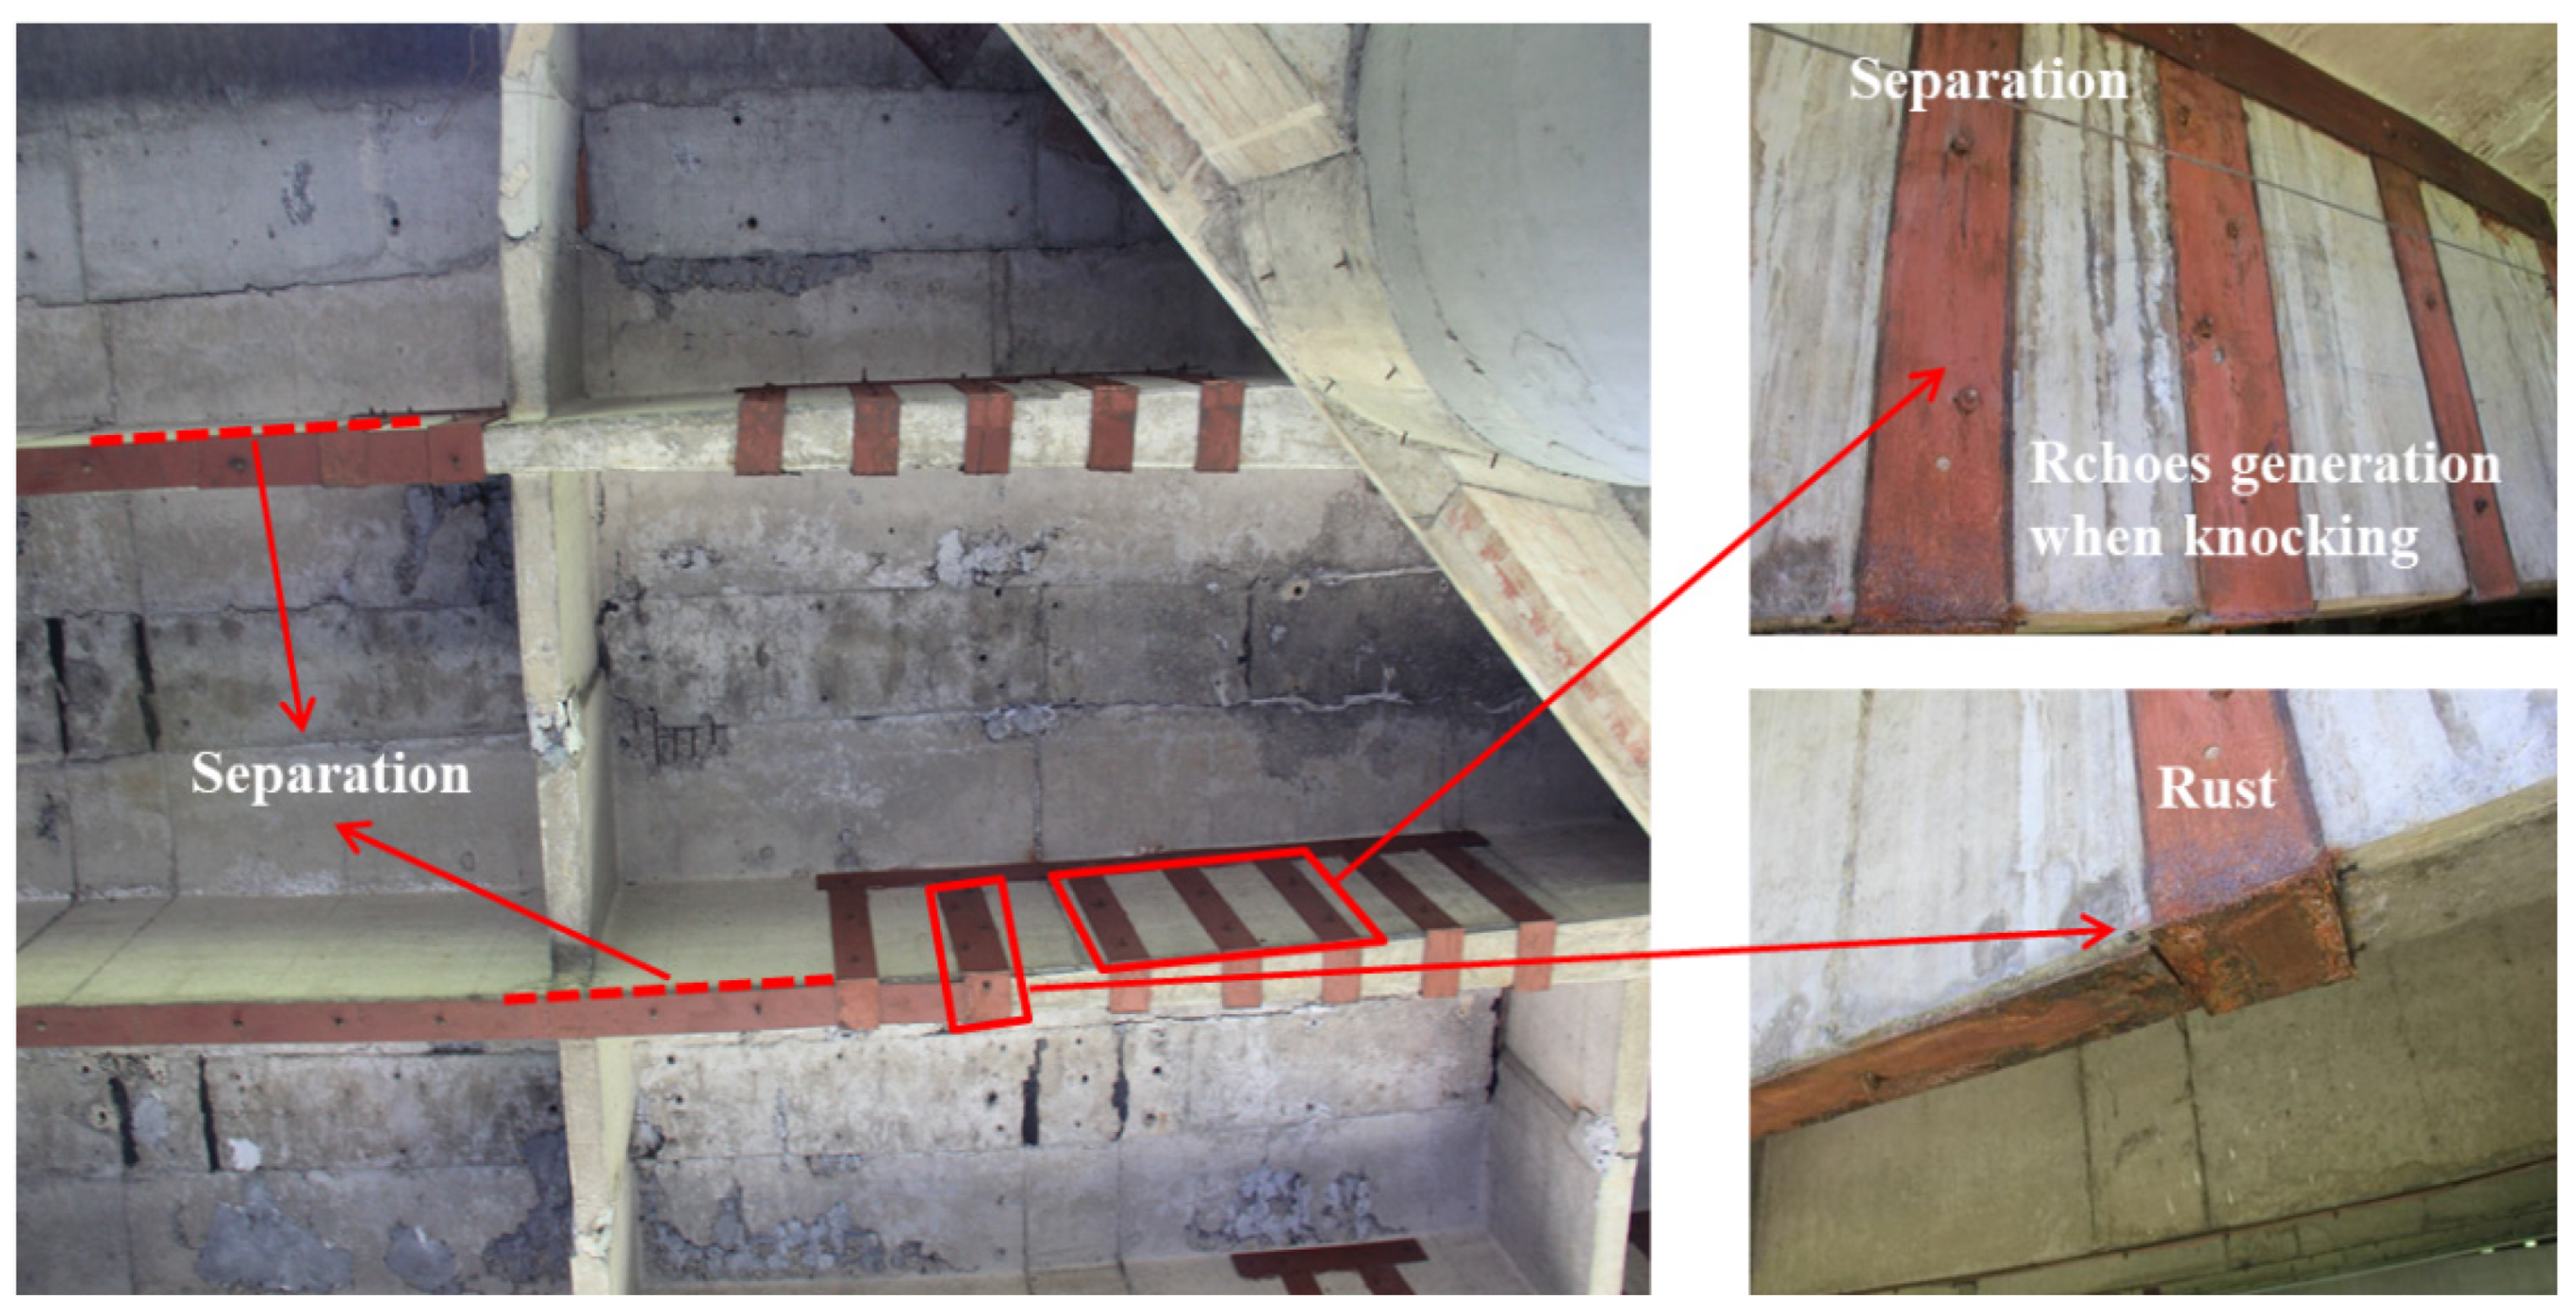
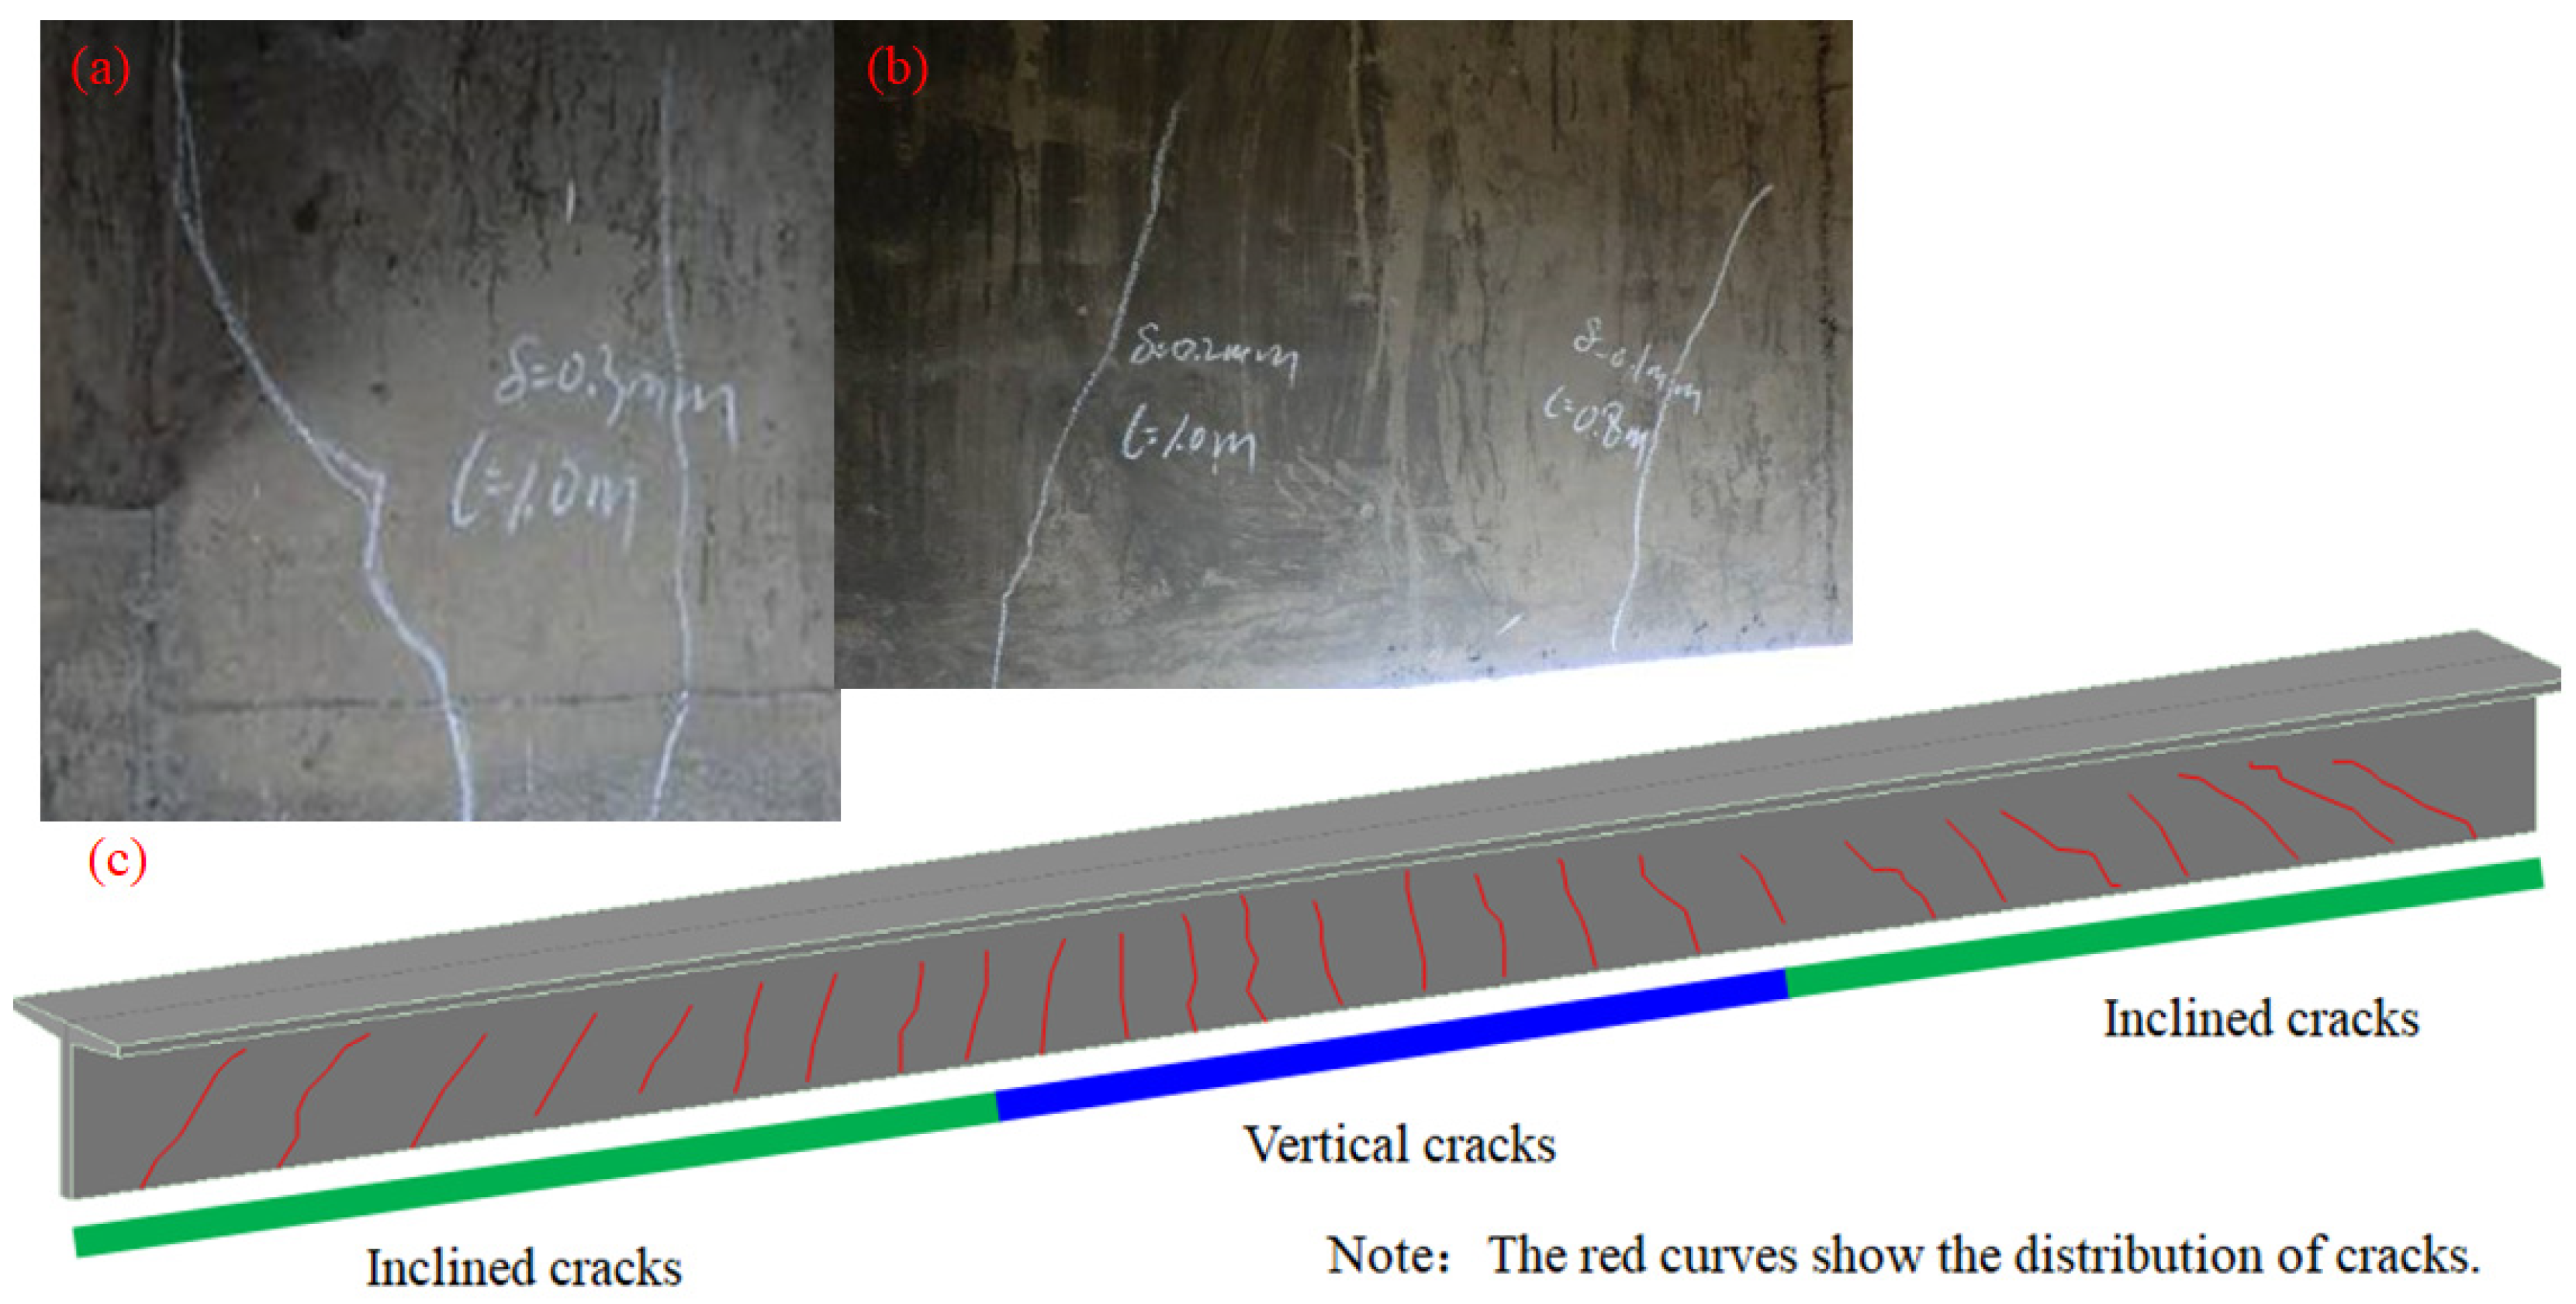
3.2. T-Beam Damage Condition of Actual Bridges

3.2.1. T-Beam Damage Condition of Actual Bridge One

There were inclined cracks in the shear span areas of the T-beams of actual bridge one, as shown in Figure 11. There was other damage in the T-beams, such as exposed reinforced bars and corrosion expansion of the reinforced bars. The angles of the inclined cracks were between 20° and 55° with spacing of 15 to 25 cm, and the crack width varied in the range of 0.15 to 0.4 mm. The inclined cracks were evenly distributed in the shear span areas, and the average crack spacing was 54 cm.

3.2.2. T-Beam Damage Condition of Actual Bridge Two

There were inclined cracks in the shear span areas of the T-beams of actual bridge two, as shown in Figure 12. There was other damage in the T-beams, such as exposed reinforced bars and corrosion. The angles of the inclined cracks were between 15° and 50° with spacing of 25 to 35 cm, and the crack width varied in the range of 0.11 to 0.3 mm. The inclined cracks were evenly distributed in the shear span areas, and the average crack spacing was 59 cm.
Comparing and analyzing the crack distributions of actual bridges one and two in Figure 11 and Figure 12 showed that the number of cracks in the T-beams of actual bridge one was much greater than that of actual bridge two, so it could be seen that the degree of damage to actual bridge one was greater than that to actual bridge two.

4. T-Beam Shear Strengthening Scheme of Actual Bridges

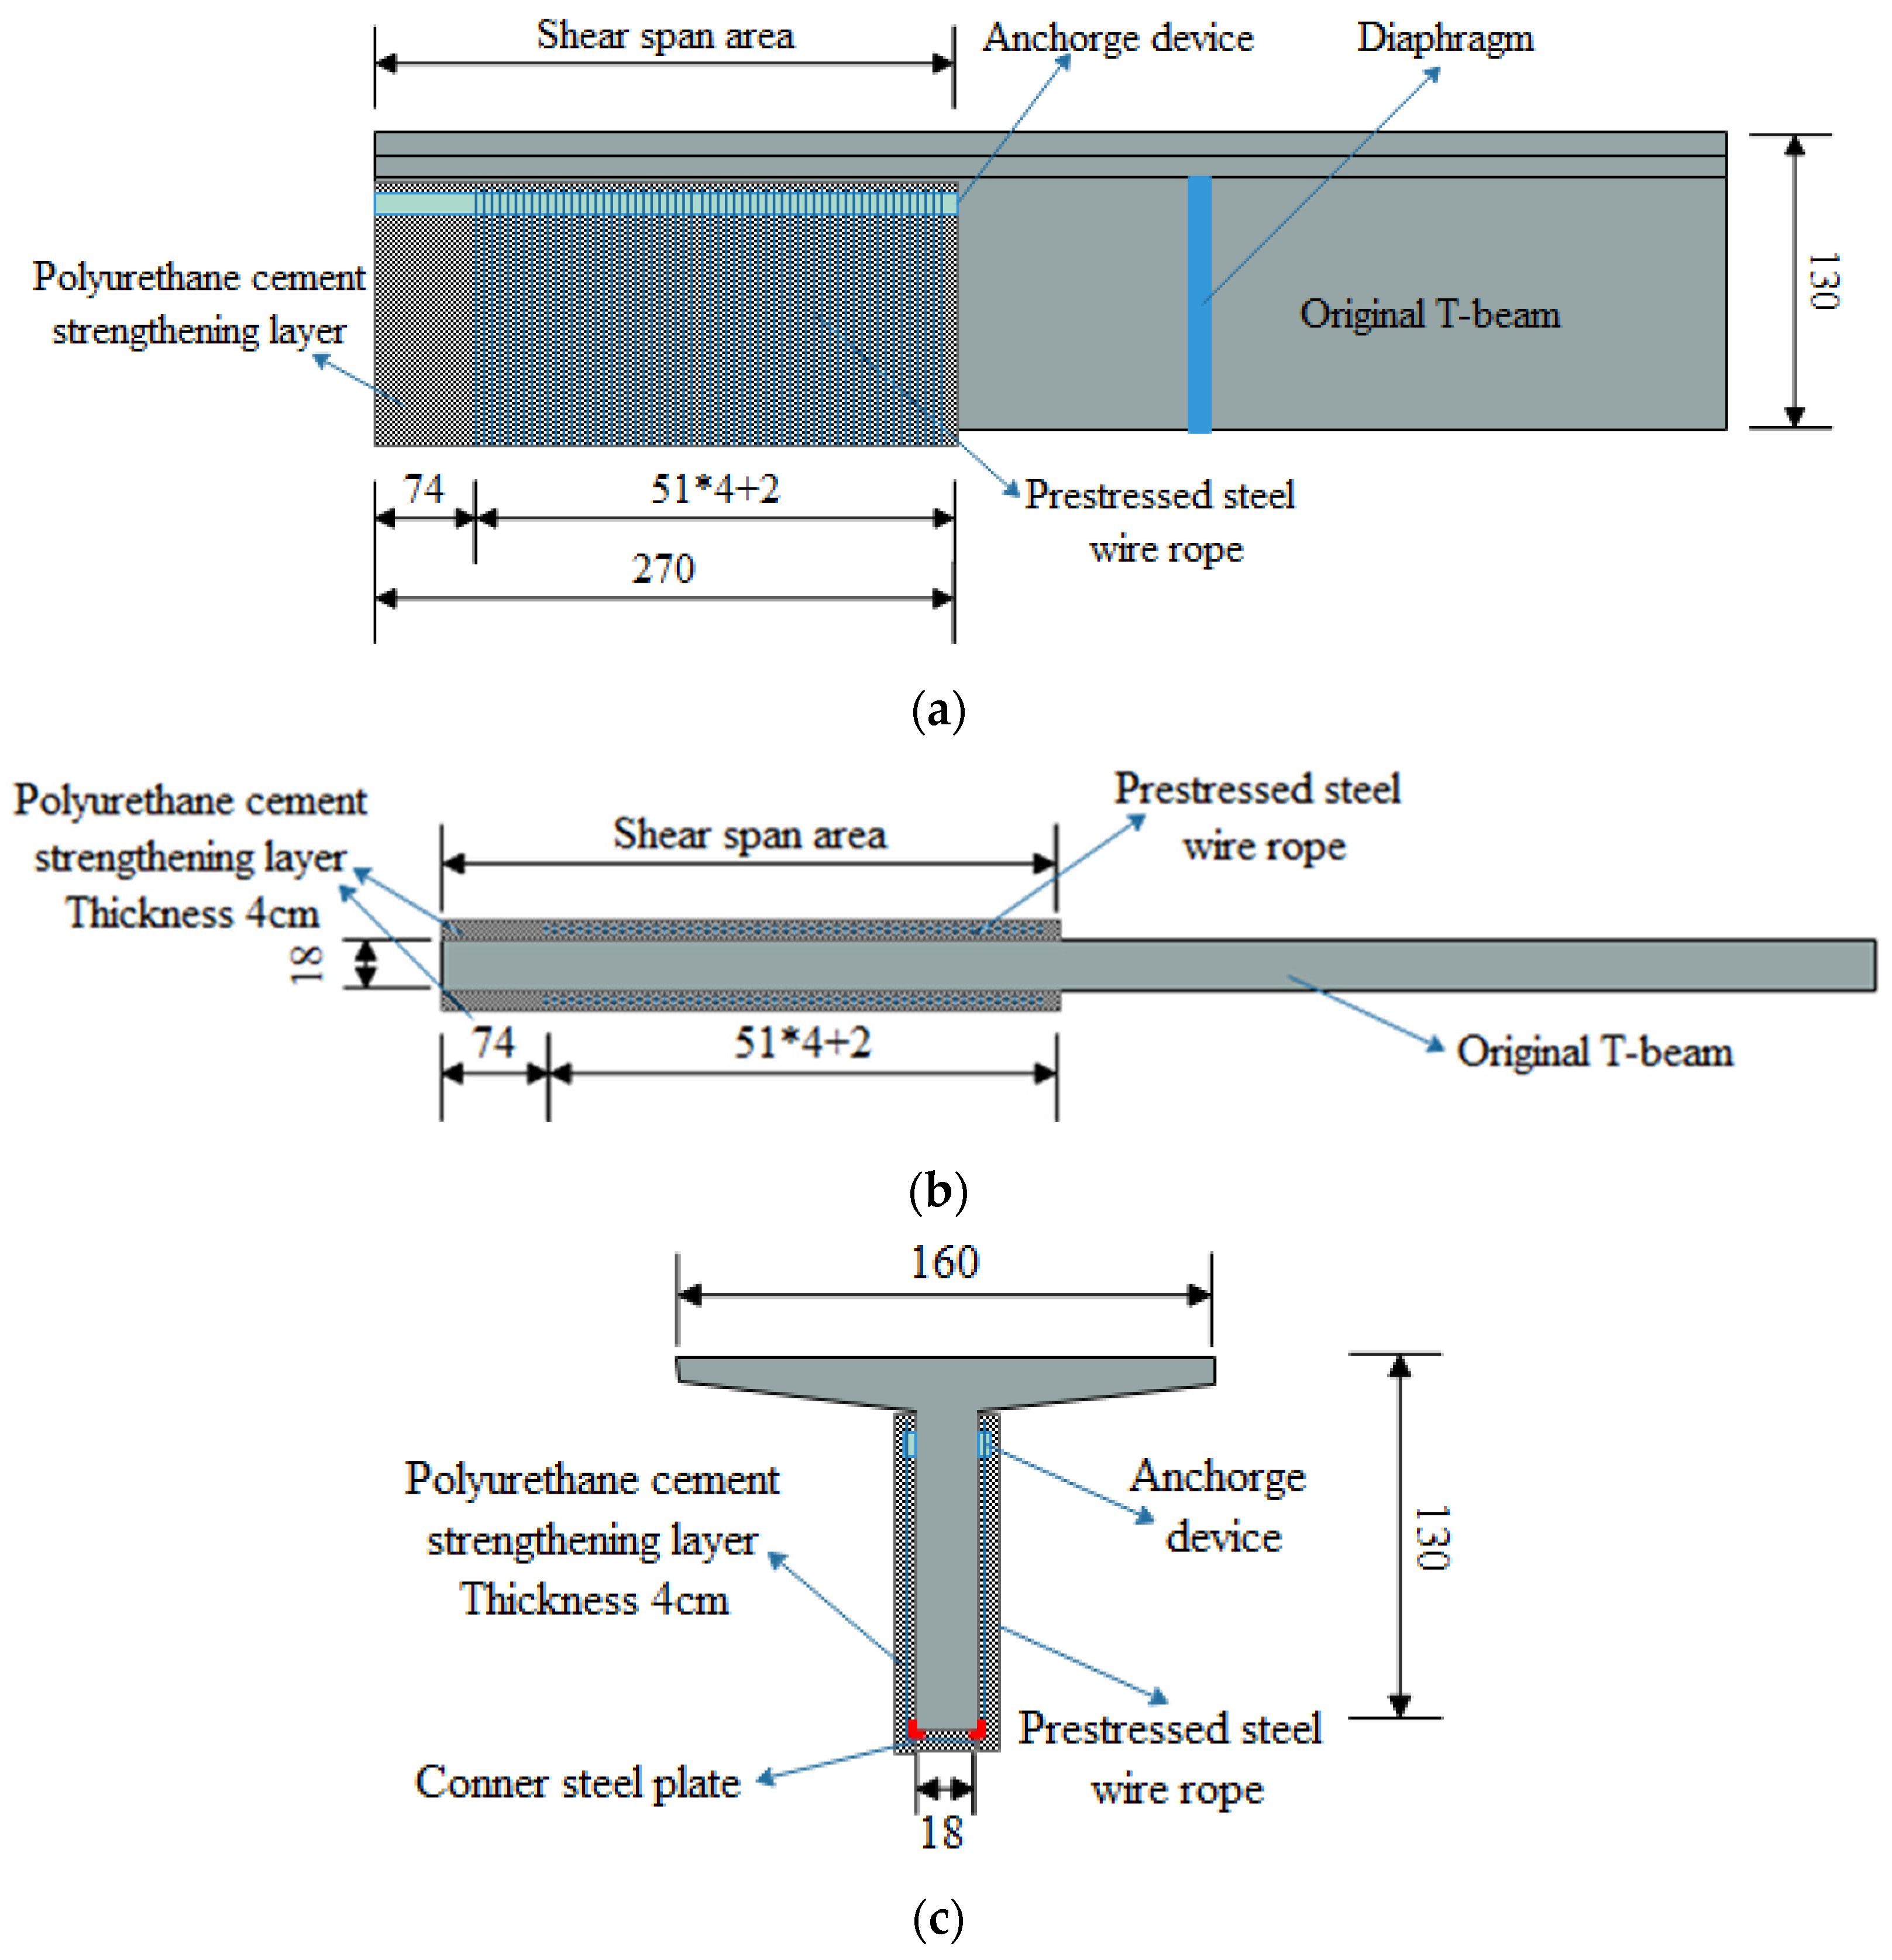
4.1. Strengthening Scheme of Actual Bridge One

Actual bridge one was strengthened by a composite method of prestressed steel wire rope embedded in polyurethane cement (PSWR-PUC). Prestressed steel wire ropes and polyurethane cement were added to the shear span areas of the T-beams, as shown in Figure 13. The main steps of the PSWR-PUC strengthening method in the shear span areas of actual bridge one were as follows:
(1)
Chiseling and installation of anchorage and conner plates. The concrete should be chiseled in the shear span areas, then anchorage devices and corner steel plates are installed at the tops and bottoms of the T-beam webs, respectively, as shown in Figure 14. For the convenience of tensioning the steel wire ropes, a distance is reserved between the anchorage device and the top plate of the T-beam.
(2)
Tensioning and anchoring of steel wire rope. The prestress level of the steel wire rope should be kept between 0.35 and 0.45. The steel wire rope is tensioned by hand-pulling a chain hoist crane (as shown in Figure 15b) and anchored with an aluminum sleeve anchor head (as shown in Figure 15a). The tensioning force is controlled by a tension sensor (as shown in Figure 15b). The model of tension display device is V4806, produced by Mingzhu Sensor Co., Ltd. in Bengbu, China
(3)
Pouring polyurethane cement. First, the polyurethane cement is prepared according to the requirements. Then, the polyurethane cement should be casted into the prepared formwork in the shear span area of the T-beam. The polyurethane cement can be cured in a natural environment at normal temperature, and the formwork can be removed after 24 h.

4.2. Strengthening Scheme of Actual Bridge Two

Actual bridge two was strengthened by the bonded steel plate method. Steel plate strips were pasted on both sides of the T-beam web in shear span area, as shown in Figure 16. The main steps of the bonded steel plate strengthening method in the shear span areas of actual bridge two were as follows:
(1)
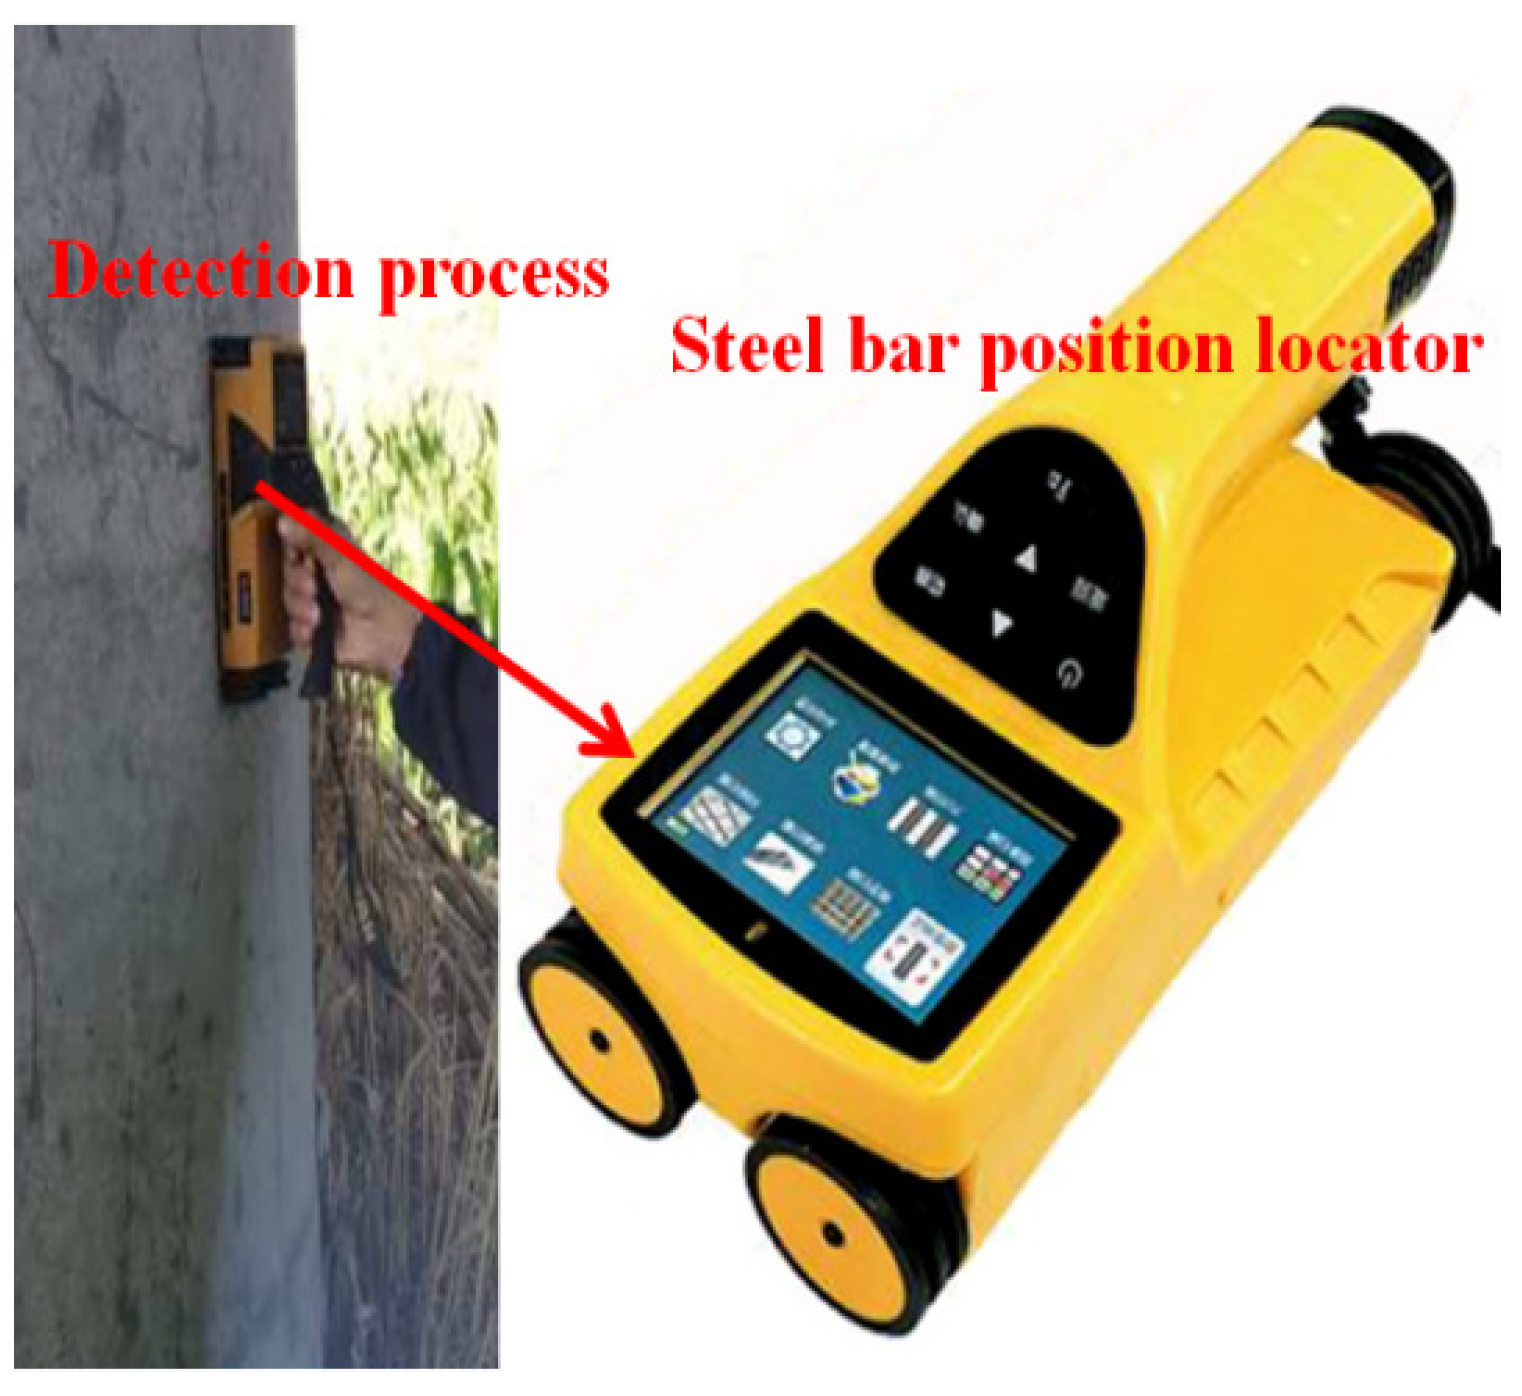
Concrete surface treatment and drilling in shear span areas. The concrete should be ground and roughened in the areas where the steel plates are pasted. An air drill is used for concrete drilling. In order to prevent the original beam’s reinforced bars from being damaged during drilling, the drilling position should kept away from the reinforced bars. A steel bar position locator (the model is HC-GY71S, produced by Haichuang High Technology Co., Ltd. in Beijing, China) can be used to detect the reinforced bars’ positions before drilling, as shown in Figure 17.
(2)
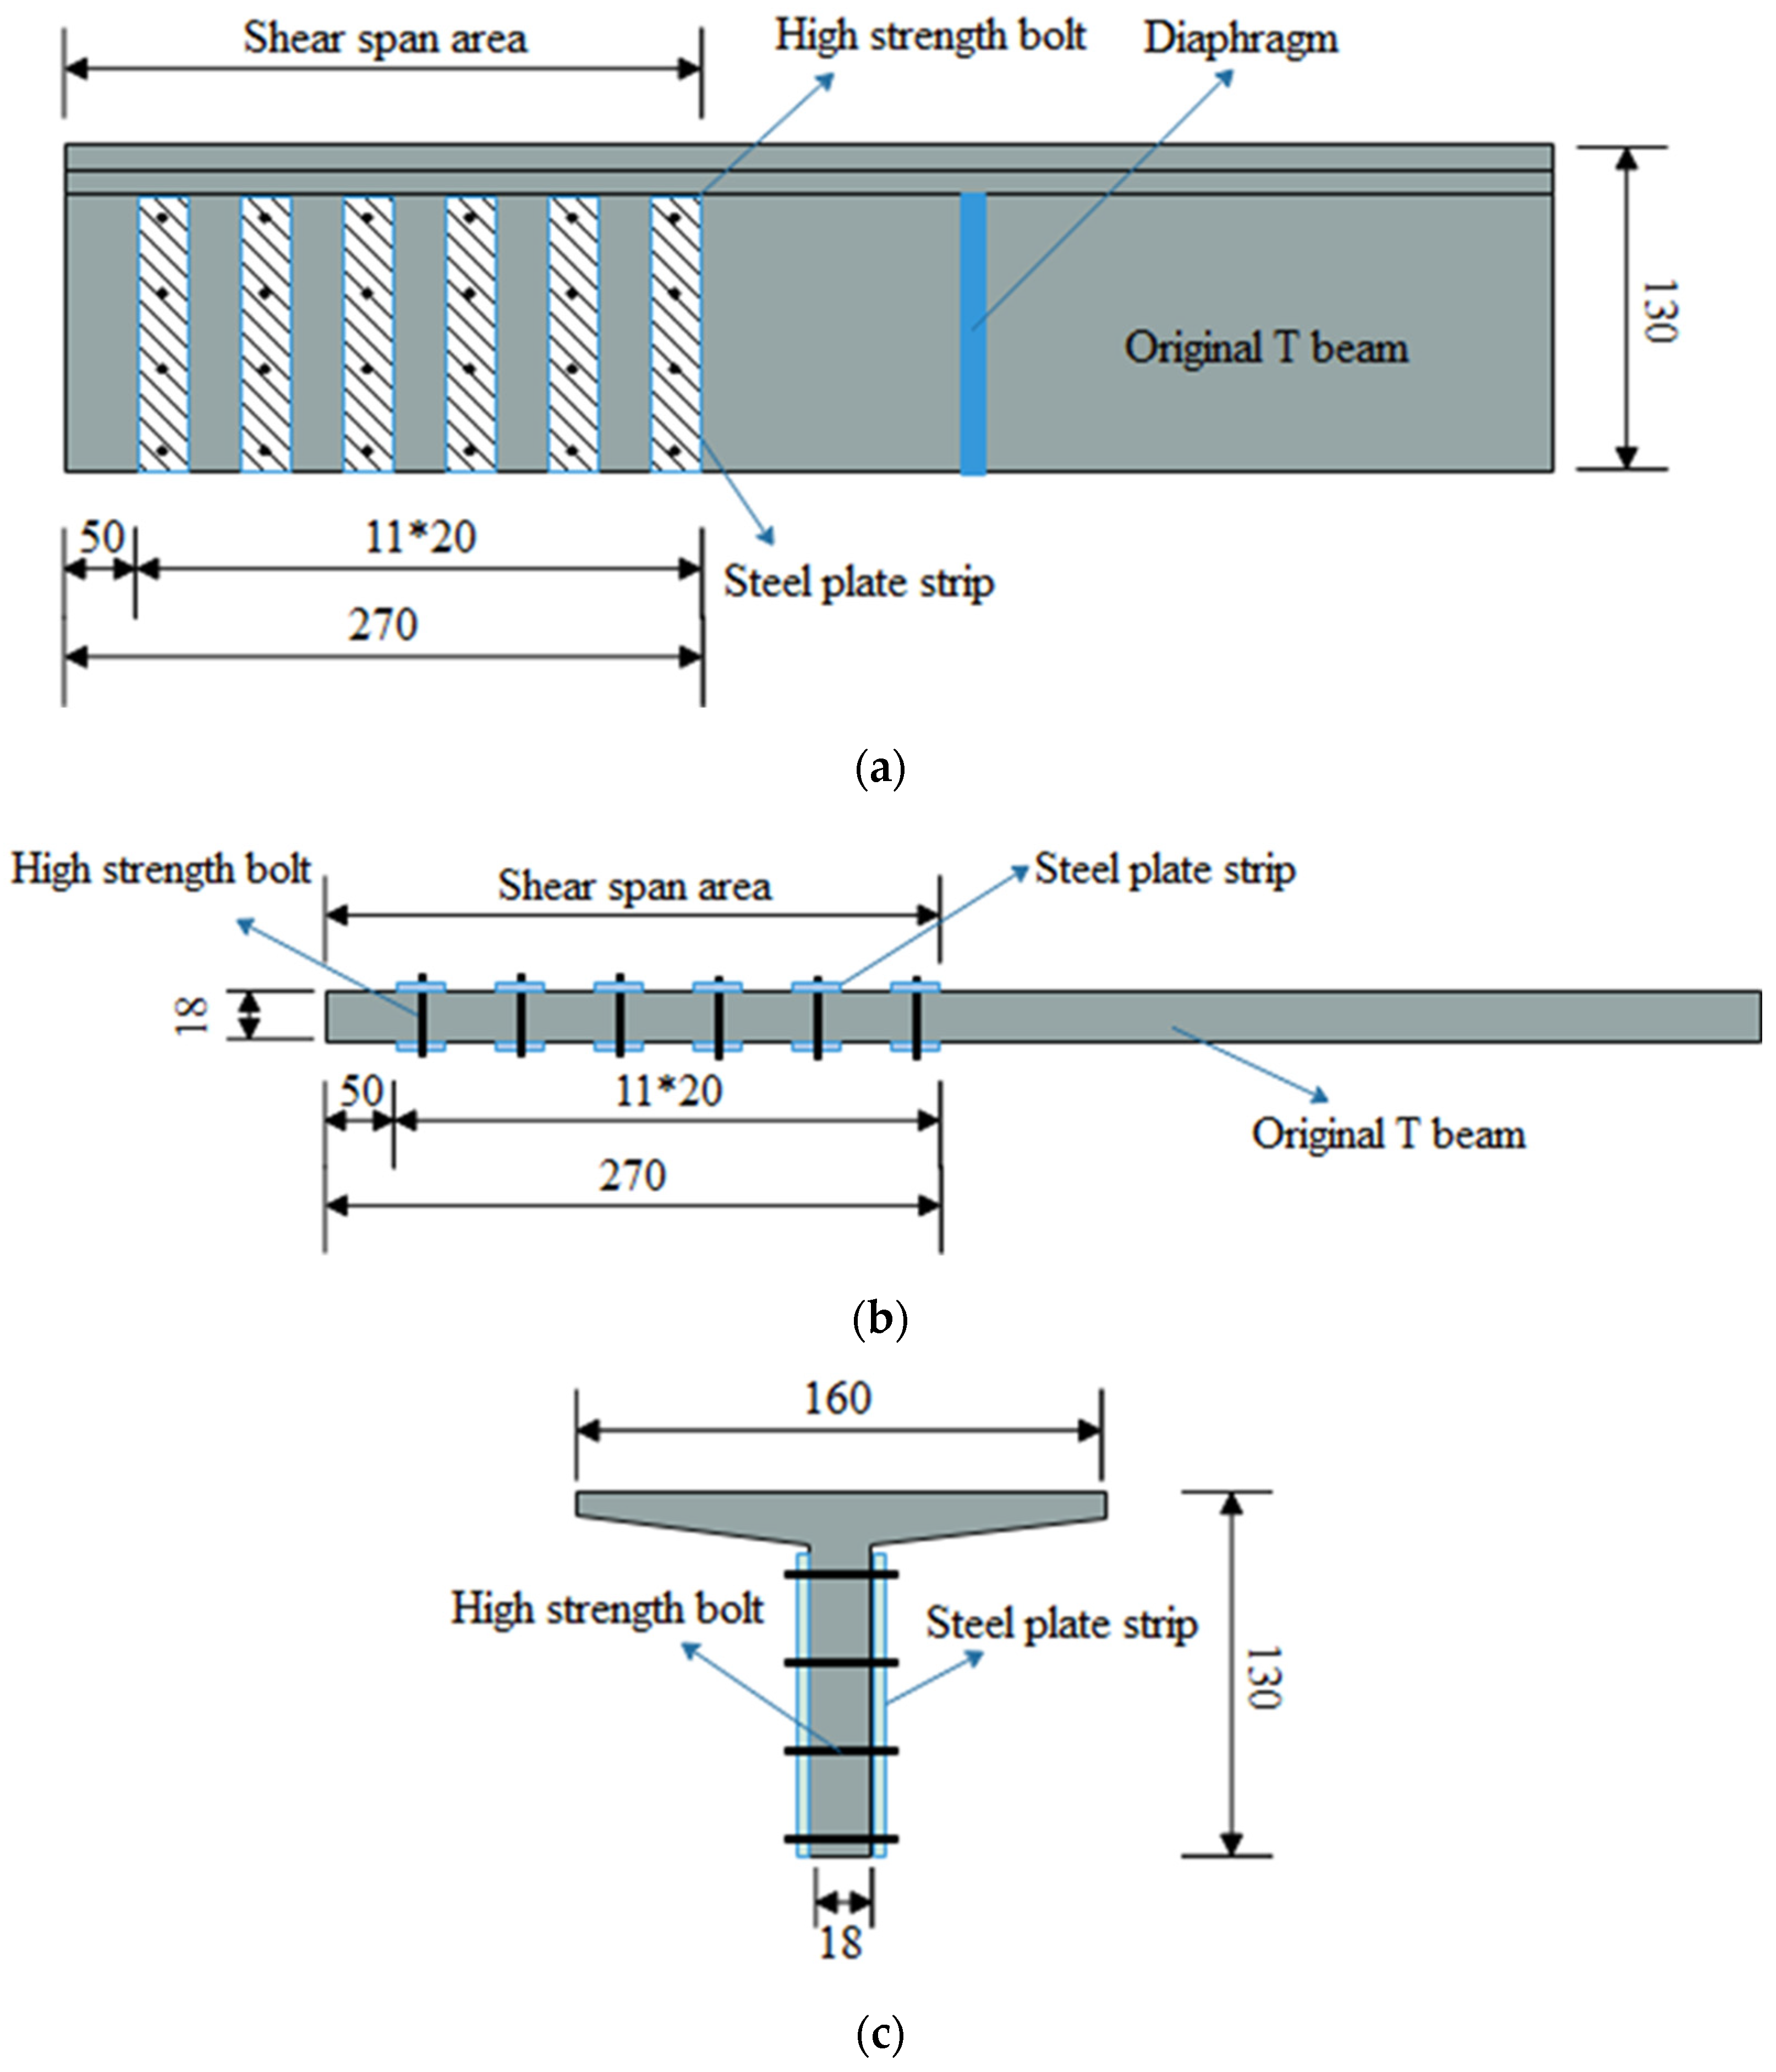
Bonding steel plates. First, steel plate strips are bonded to the concrete surface by epoxy resin adhesive, and then high-strength bolts should be tightened to anchor the steel plates, as shown in Figure 18.
(3)
Anticorrosion treatment of steel plates. After removing the oil and rust on the steel plate’s surface, antirust paint can be brushed on.
This study used a static load test, and the vibration amplitude of heavy vehicles was small and low frequency. At the same time, externally bonded steel plate reinforcement usually has high stiffness and strength and can withstand a certain degree of vibration and load. Therefore, the vehicle vibrations in this test will not produce a significant dynamic response to the strength of the externally bonded steel plate reinforcement and will not affect the accuracy of the test results.

5. Verification of Strengthening Effect

In order to comprehensively evaluate the mechanical performance of the two actual bridges, static load tests were carried out before and after strengthening. To verify the shear strengthening effect of the prestressed steel wire rope embedded in polyurethane cement and the bonded steel plates, it was necessary to compare the deflections and strains in the T-beams strengthened by the two different methods using static load tests. Deflection at mid-span and principal strain near the support point were measured during the static load tests.
To analyze the influence of temperature on the strengthening effect of prestressed steel wire rope embedded in polyurethane cement, static load tests were carried out under low- and high-temperature conditions on actual bridge one after strengthening.

5.1. Static Load Test Process

5.1.1. Test Item and Load

Reinforced concrete T-beams with spans of 20 m were used for the superstructures of the two actual bridges. Five and seven T-beams were arranged in bridges one and two in the transverse direction, respectively. According to the Load Test Method for Highway Bridge (JTG J21-01-2015) [51], static load tests were carried out. The first span was selected for the static load tests of the two actual bridges. Deflections and strains in the T-beams were measured during the static load tests. T-beam deflection at mid-span and principal strain of the concrete (polyurethane cement or steel plate) in the shear span area were the main test items. The test loading conditions and test contents are listed in Table 2.
In order to meet the requirements of the two bridges after strengthening, the two actual bridges were tested by Highway Grade II Load according to the General Specifications for Design of Highway Bridges and Culverts (JTG D60-2004) [52]. The Highway Grade II Loads for the two actual bridges are shown in Figure 19. The load test efficiency, η, should be between 0.95 and 1.05 during determination of the weight in the test load process. Three-axle trucks were used as the test loads during the static load tests. The loading tests were carried out with two three-axle trucks, as shown in Figure 20. MIDAS/Civil software version 2021 v1.1 (which is developed by MIDAS Information Technology Co., Ltd., in Beijing, China) (Supplementary Materials) was used to establish the spatial grid finite element models of the two actual bridges in order to determine the weights of the two trucks. The spatial grid finite element models are shown in Figure 21. The axle load and spacing of the test trucks are listed in Table 3.
This paper used a higher-order numerical analysis method in conjunction with MIDAS finite element analysis software to provide a more comprehensive and accurate structural analysis and solution. The Finite Difference Method was used to discretize the continuous domain [53], the Bezier Multi-Step Method was used to solve the initial value problems of ordinary differential equations [54], and the Differential Quadrature Method was used to transform differential equations into discrete algebraic equations [55]. These methods provided MIDAS with boundary conditions, constraints, initial conditions, and more accurate numerical solutions for the simulation and analysis of structures.

5.1.2. Test Loading and Measuring Point Arrangement

(1)
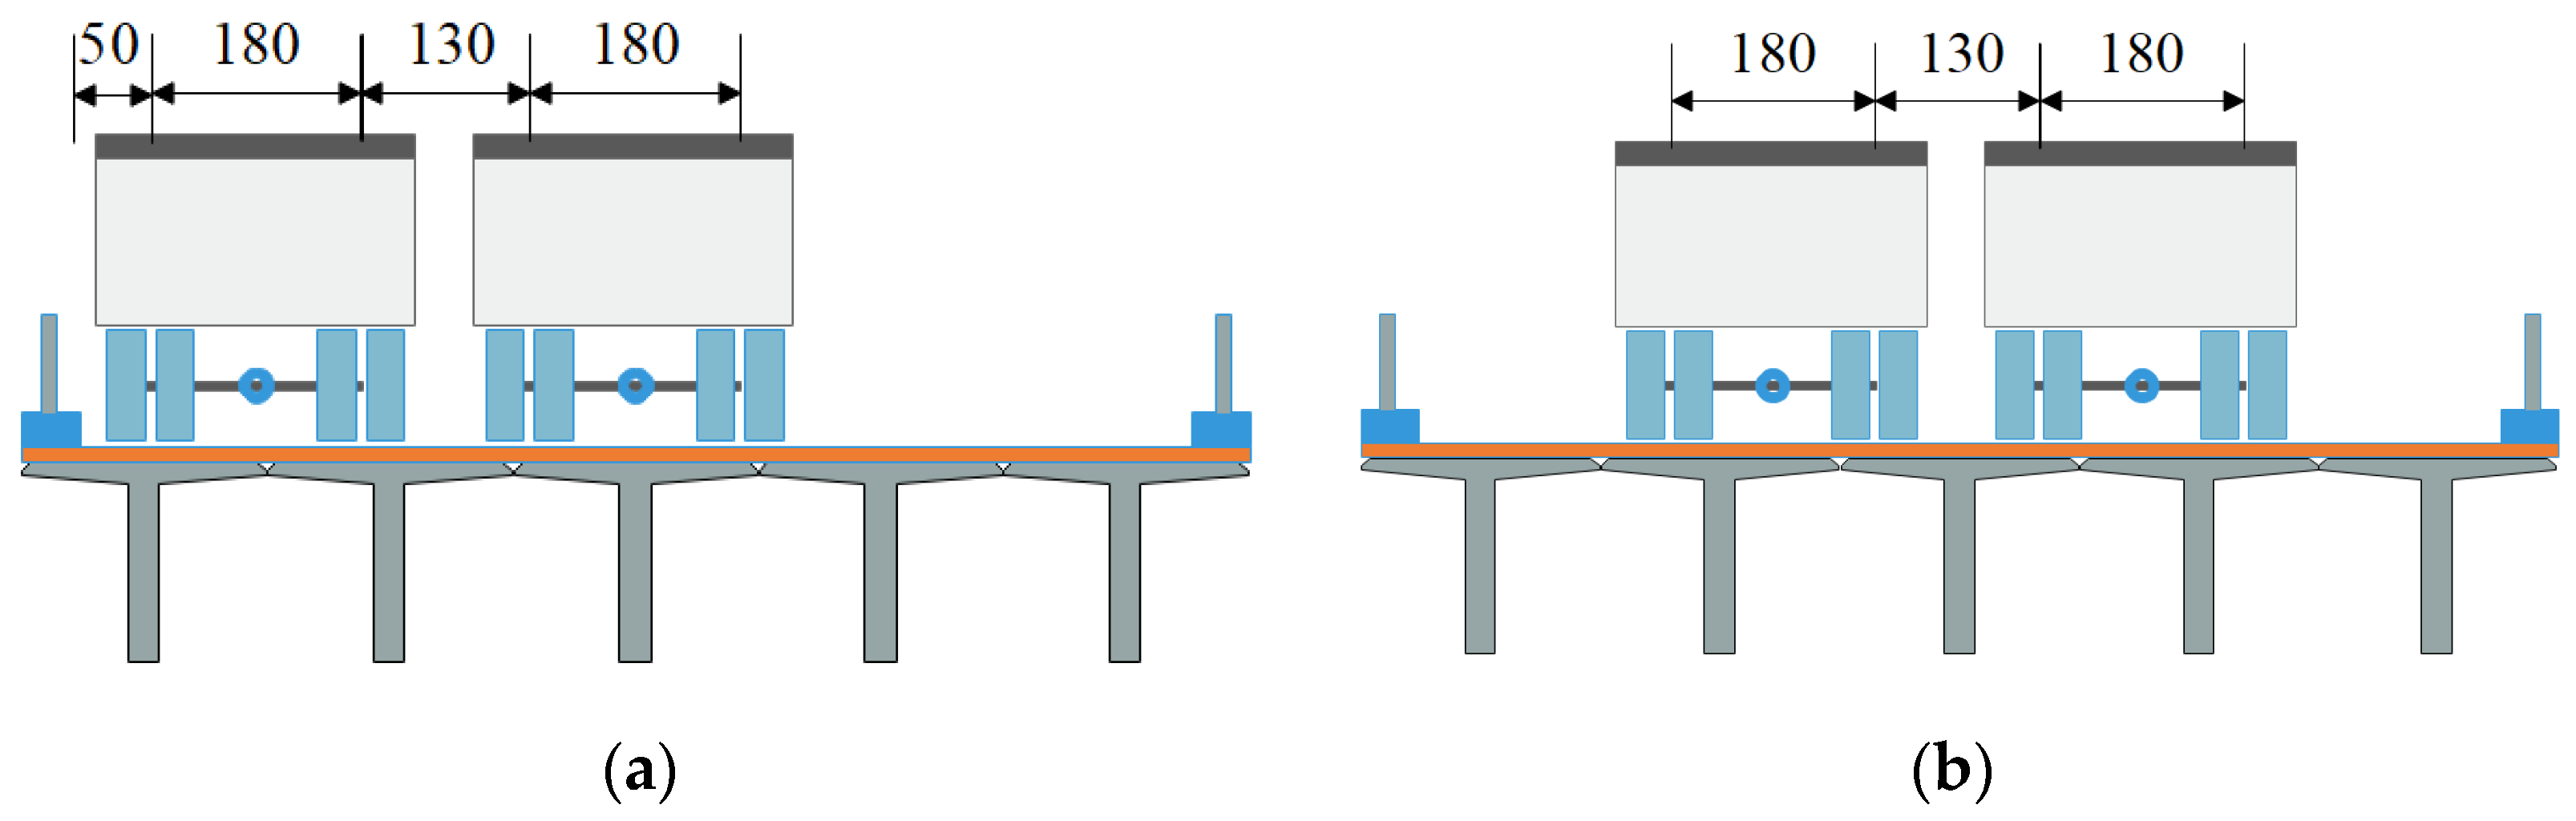
Test loading arrangement
The specific loading positions of the test trucks are shown in Figure 22, Figure 23, Figure 24 and Figure 25. Figure 22 shows the longitudinal loading positions of the test trucks. Deflection in the T-beam at mid-span position was measured when the central axes of the truck was in mid-span position. The principal strain in the shear span area of the T-beam was measured when the rear axes of the truck was 1 m away from the bearing of pier 1. Figure 23 and Figure 24 show the transverse loading positions of the test trucks on actual bridges one and two, respectively. Loading photos of actual bridges one and two are shown in Figure 25.
(2)
Measuring point arrangement
In order to obtain the change in deflection and principal strain in the T-beam before and after strengthening, displacement sensors were installed at the mid-span positions of the T-beams and strain sensors were installed in the middle of the T-beam webs near the bearings. Taking bridge one as an example, Figure 26 shows the relationship between the loading conditions and the measuring point positions. Figure 27 and Figure 28 show the layout of the deflection measuring points at mid-span and the principal strain measuring points near the bearings of actual bridges one and two, respectively.

5.2. Test Results Analysis and Discussion

5.2.1. Deflection Test Results

The deflection measurement results from the static load tests are listed in Table 4 and Table 5 for actual bridges one and two before and after strengthening. Comparisons of the deflection curves are shown in Figure 29 and Figure 30.
Actual bridge one was shear-strengthened by prestressed steel wire rope embedded in polyurethane cement (PSWR-PUC). As can be seen from Figure 29 and Table 4, deflections in the strengthened T-beams were reduced under the action of symmetric or eccentric load, but reduction degrees of different T-beams were different. Under symmetric load, deflections in the middle beam were the largest. Deflections in this middle beam were 9.2 and 7.2 mm before and after strengthening, respectively, showing a reduction of 28%. Under eccentric load, deflections in the loading side beams were larger. Deflections in beams 1# and 2# were 10.8 and 10.2 mm before strengthening, respectively. However, deflections decreased to 8.5 and 8.0 mm after strengthening, which were reductions of 27% and 28%, respectively.
Prestressed steel wire ropes can reduce the widths of inclined cracks in T-beam webs in shear span areas and can play a role in shear resistance similar to stirrups. The polyurethane cement layer can increase the shear stiffness by increasing the thicknesses of T-beam webs and can protect the steel wire ropes. It can limit the adverse effect of shear deformation on mid-span deflection, thus reducing deflections and improving T-beam capacity by using the prestressed steel wire rope embedded in polyurethane cement strengthening method.
Actual bridge two was shear-strengthened by bonded steel plates. As can be seen from Figure 30 and Table 5, deflections in the strengthened T-beams were reduced under the action of symmetric or eccentric load, but reduction degrees of different T-beams were different. Under symmetric load, deflections in the middle beam were the largest. Deflections in this middle beam were 10.2 and 8.8 mm before and after strengthening, respectively, showing a reduction of 16%. Under eccentric load, deflections in the loading side beams were larger. Deflections in beams 1# and 2# were 12.5 and 10.9 mm before strengthening, respectively. However, deflections decreased to 10.2 and 9.1 mm after strengthening, which were reductions of 23% and 20%, respectively.
Shear stiffness can be improved by bonded steel plates in shear span areas. This strengthening method can reduce the adverse effect of shear deformation on mid-span deflection. Therefore, it can reduce deflections and improve T-beam capacity.
The shear-strengthening effects of the two methods are compared by their deflection reduction rates in Figure 31. It can be seen from Figure 31 and Table 4 and Table 5 that the deflection reduction rates of actual bridge one strengthened with the PSWR-PUC system were greater than those of actual bridge two strengthened with bonded steel plates. Figure 32 shows a comparison of the average deflection reduction rates of the different strengthening methods. The average deflection reduction rates of actual bridge one were 0.26 and 0.27 under symmetrical and eccentric loads, respectively, but those of actual bridge two were both 0.19 under symmetrical and eccentric load. So the strengthening effects on actual bridge one were 36.8% and 42.1% higher than those on actual bridge two. Therefore, the PSWR-PUC method was better than the bonded steel plate method in terms of deflections.

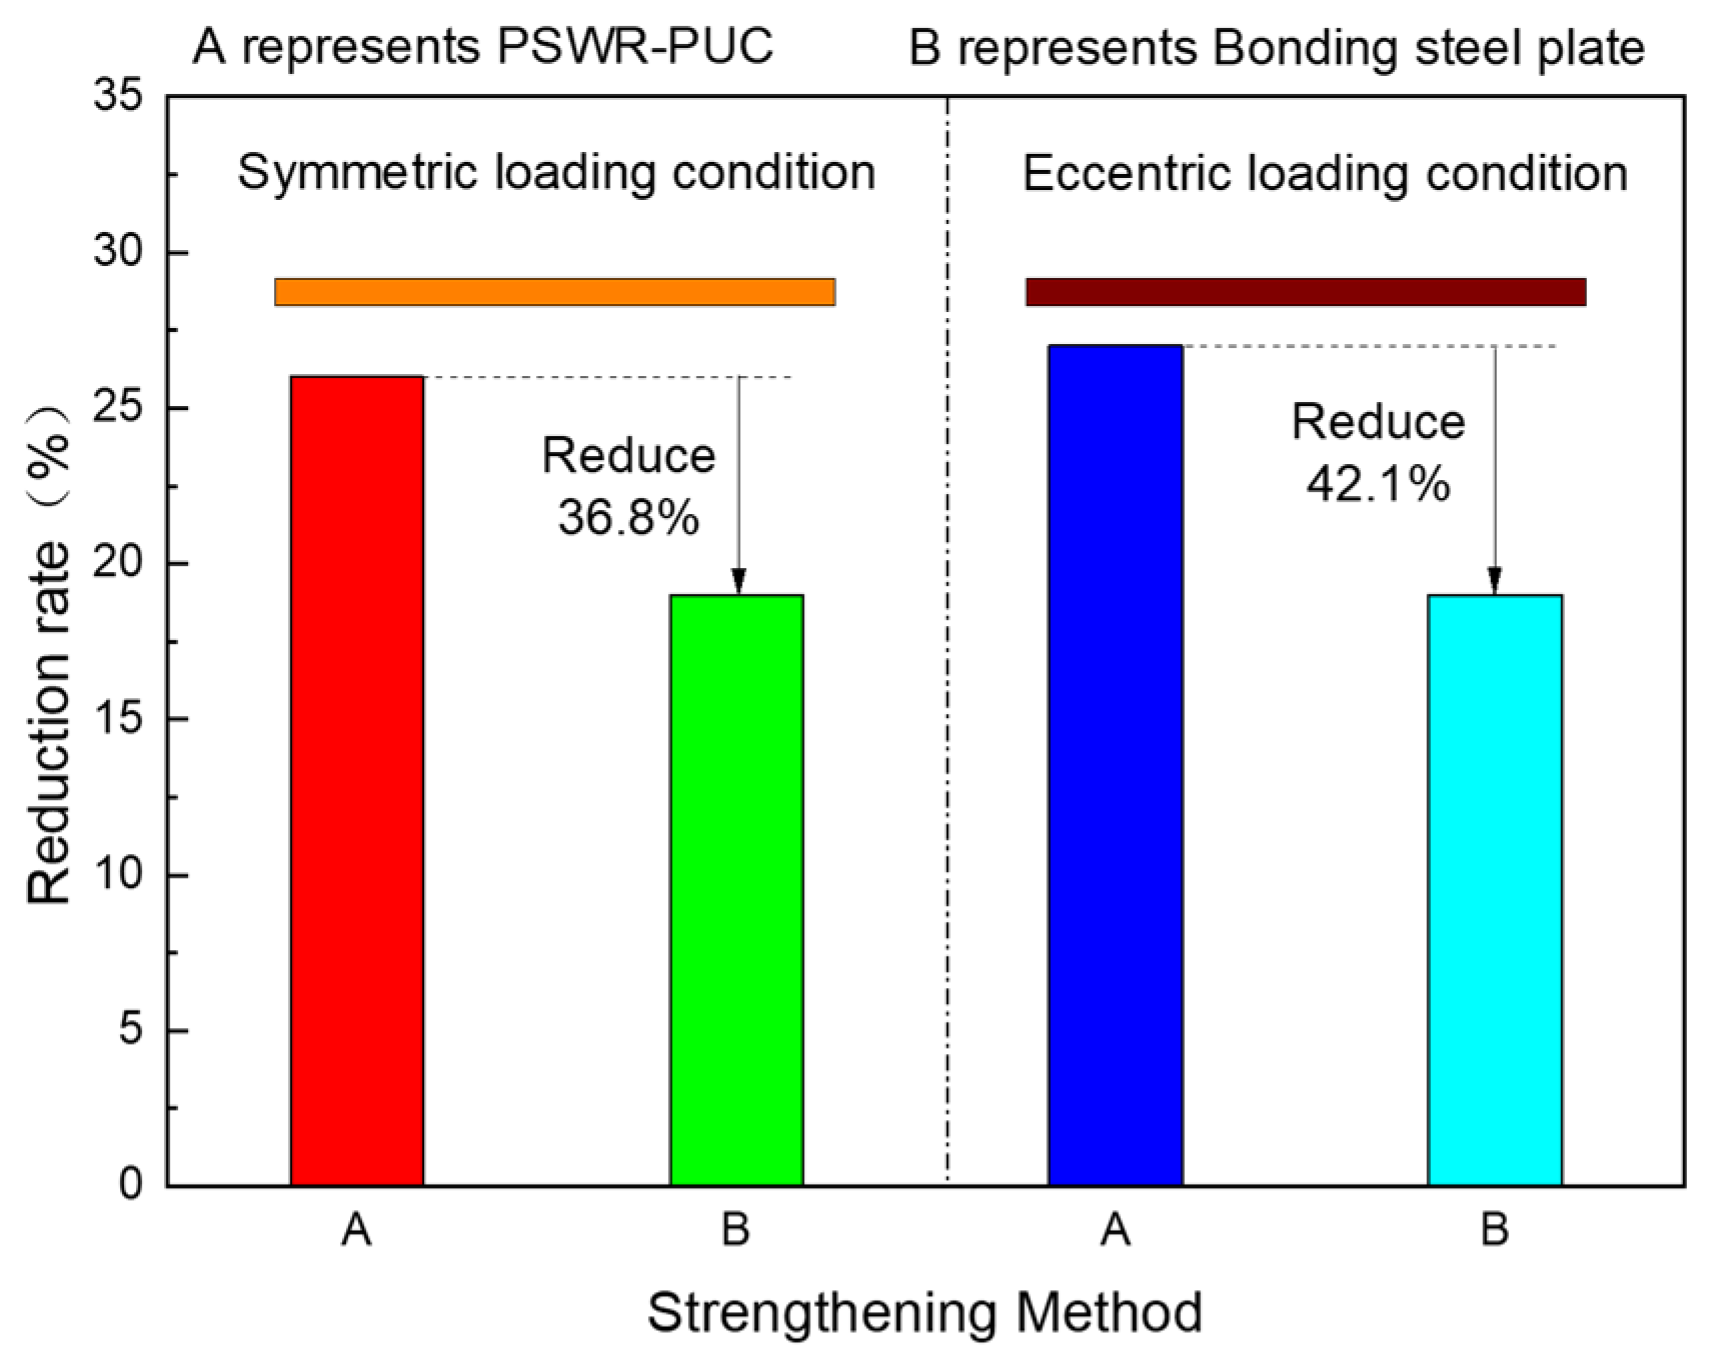
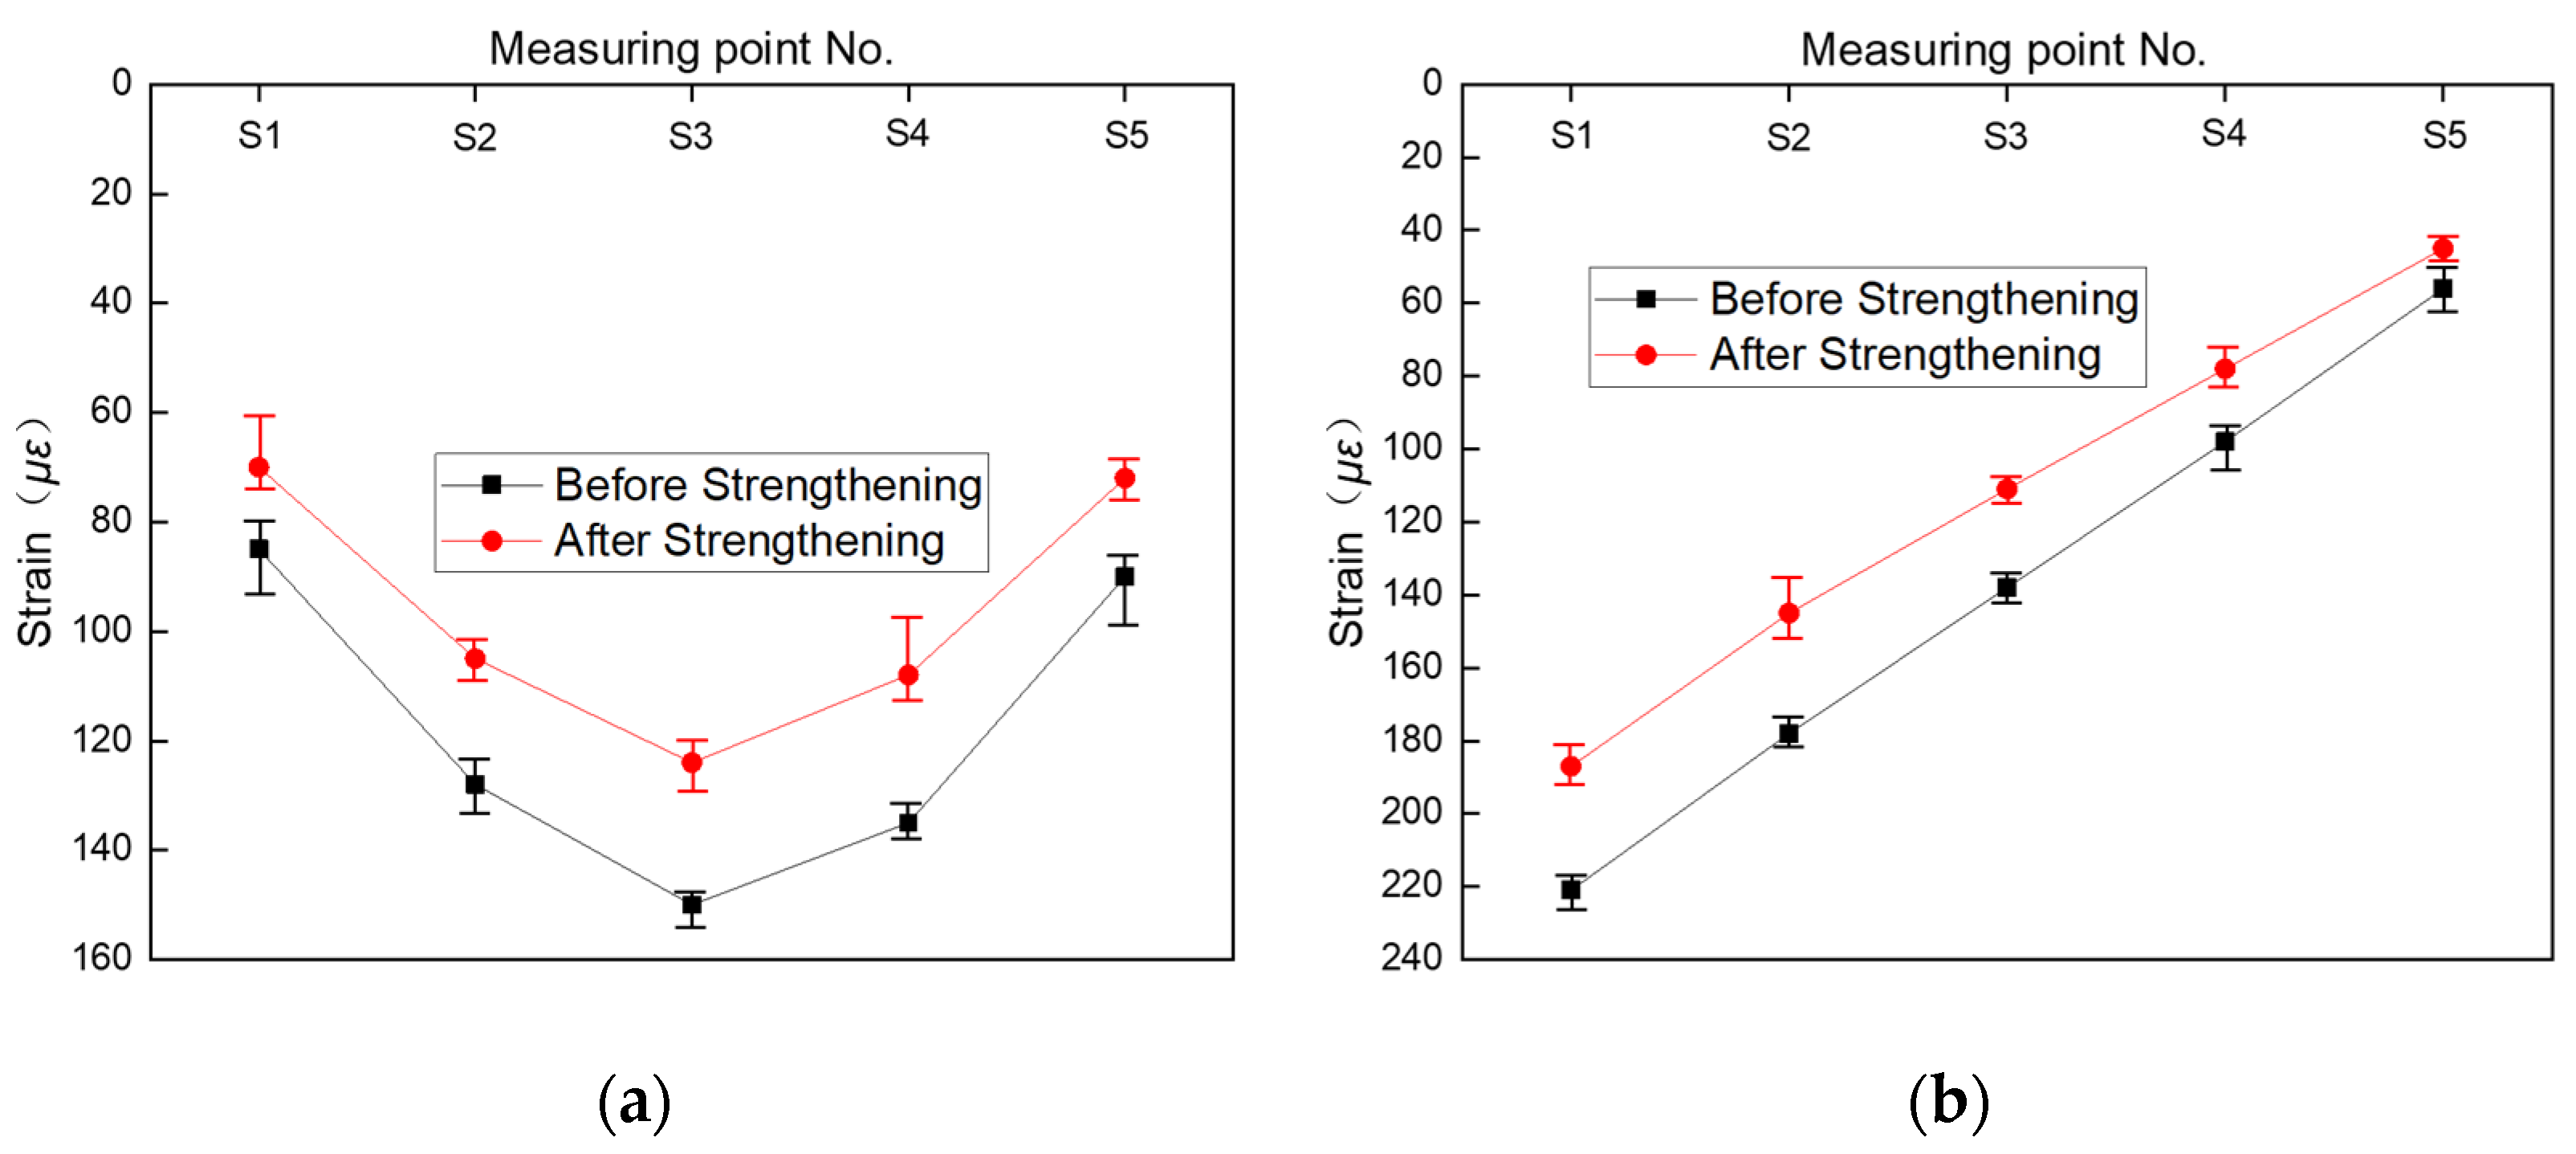
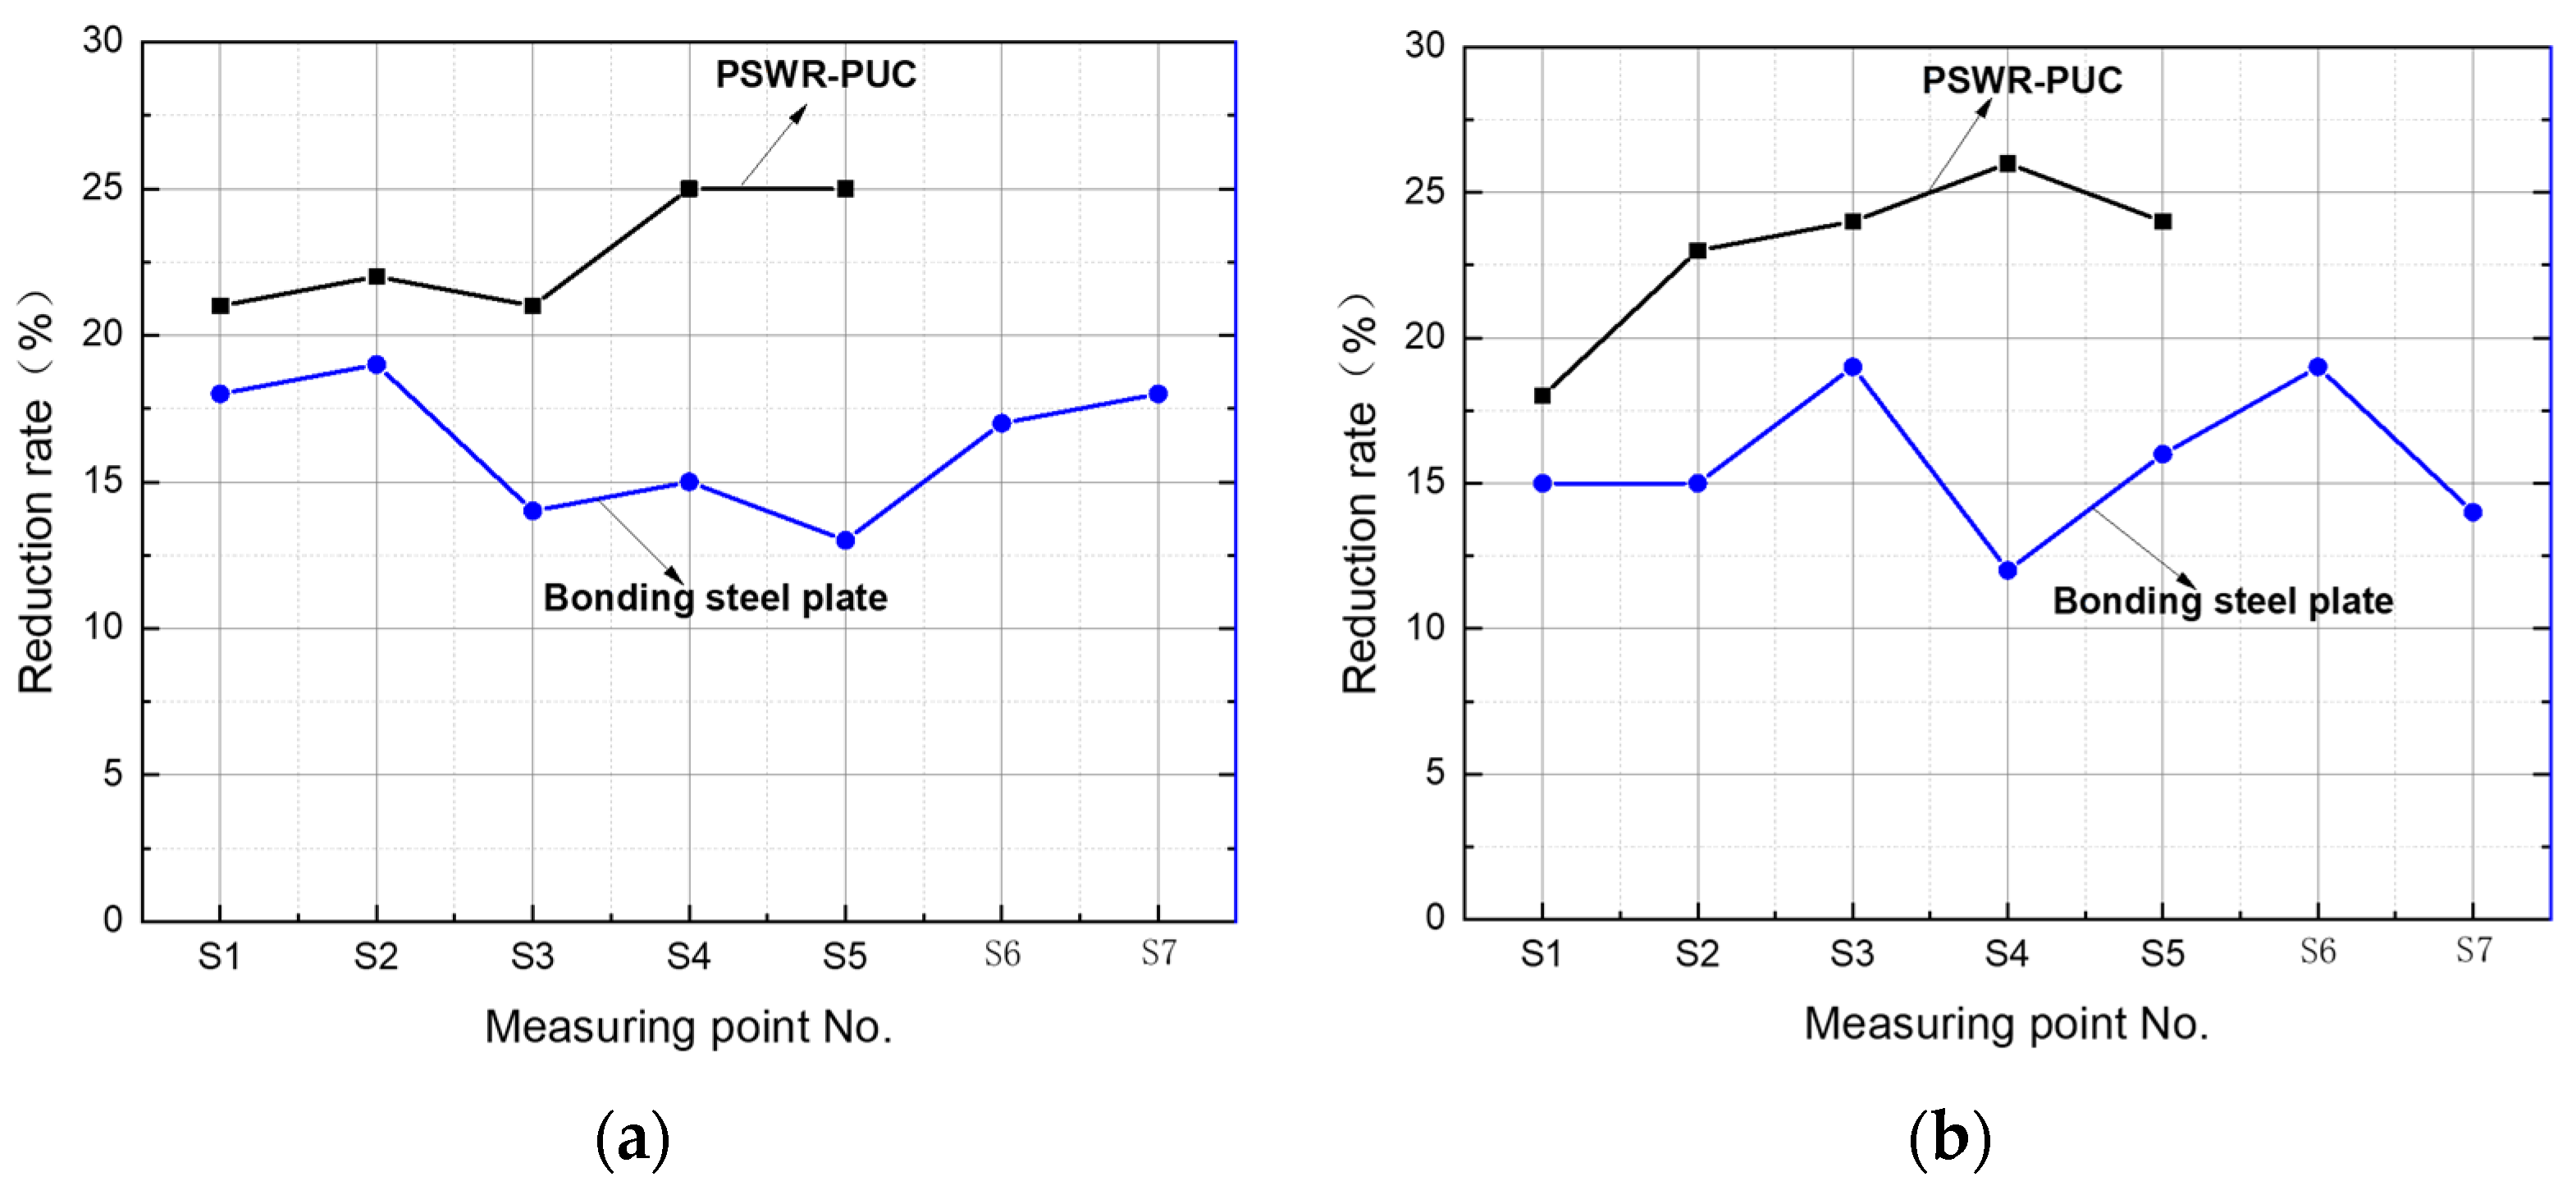
5.2.2. Principal Strain Test Results

The principal strain measurement results from the static load tests are listed in Table 6 and Table 7 for actual bridges one and two before and after strengthening. Comparisons of the principal strain curves are shown in Figure 33 and Figure 34.
Actual bridge one was shear-strengthened by prestressed steel wire rope embedded in polyurethane cement (PSWR-PUC). As can be seen from Figure 33 and Table 6, the principal strains in the strengthened T-beams were reduced under the action of symmetric or eccentric load, but the reduction degrees in the different T-beams were different. Under symmetric load, the principal strains in the middle beam were the largest. The principal strains in this middle beam were 150 and 124 με before and after strengthening, respectively, which showed a reduction of 21%. Under eccentric load, the principal strains in the loading side beams were larger. The principal strains in beams 1# and 2# were 221 and 178 με before strengthening, respectively. However, the principal strains decreased to 187 and 145 με after strengthening, which showed reductions of 18% and 23%, respectively. The principal strain reduction showed an increase in T-beam shear capacity using the prestressed steel wire rope embedded in polyurethane cement strengthening method.
Actual bridge two was shear-strengthened by bonded steel plates. As can be seen from Figure 34 and Table 7, the principal strains in the strengthened T-beams were reduced under the action of symmetric or eccentric load, but the reduction degrees in the different T-beams were different. Under symmetric load, the principal strains in the middle beam were the largest. The principal strains in this middle beam were 167 and 145 με before and after strengthening, respectively, which showed a reduction of 15%. Under eccentric load, the principal strains in the loading side beams were larger. The principal strains in beams 1# and 2# were 245 and 202 με before strengthening, respectively. However, the principal strains decreased to 213 and 176 με after strengthening, which showed reductions of 15%. The principal strain reduction showed an increase in T-beam shear capacity with the bonded steel plates.
The shear strengthening effects of the two methods are compared by their principal strain reduction rates in Figure 35. It can be seen from Figure 35 and Table 6 and Table 7 that the principal strain reduction rates of actual bridge one strengthened with the PSWR-PUC system were greater than those of actual bridge two strengthened with bonded steel plates. Figure 36 shows a comparison of the average principal strain reduction rates of the different strengthening methods. The average principal strain reduction rates of actual bridge one were both 0.23 under symmetrical and eccentric loading, but those of actual bridge two were 0.15 and 0.19, respectively. The strengthening effects on actual bridge one were 53.3% and 43.3% higher than those on actual bridge two. Therefore, the PSWR-PUC method was better than the bonded steel plates method in terms of principal strains.

5.2.3. Temperature Effect on T-Beam Strengthened by PSWR-PUC

In comparing the different strengthening methods, the static load test data were measured at noon. In order to analyze the temperature influence on the strengthening effect of PSWR-PUC, static load tests were carried out twice for actual bridge one under lower and higher temperature conditions after strengthening. The lower temperature condition was in the morning between 4:00 to 5:30 with a temperature of 9 °C, and the higher temperature condition was at noon between 12:00 to 13:30 with a temperature of 19 °C. Table 8 and Table 9 list the deflections and principal strains in the strengthened T-beams at different temperatures, respectively.
It can be seen from Table 8 that deflections in the strengthened T-beam increased with increasing temperature. Under the action of symmetric or eccentric load, the average values of the deflection increase rate were 2.3% and 2.9%, and the maximum values were 3.1% and 3.7%, respectively. The temperature influence on deflection was less than 5%.
It can be seen from Table 9 that the principal strains in the strengthened T-beams increased with increasing temperature. Under the action of symmetric or eccentric load, the average values of principal strain increase rate were 2.9% and 3.8%, and the maximum values were 4.3% and 4.7%, respectively. The temperature influence on principal strain was also less than 5%.
The temperature influences on deflection and principal strain in T-beams strengthened with PSWR-PUC were less than 5%. Therefore, the influence of temperature was slight.

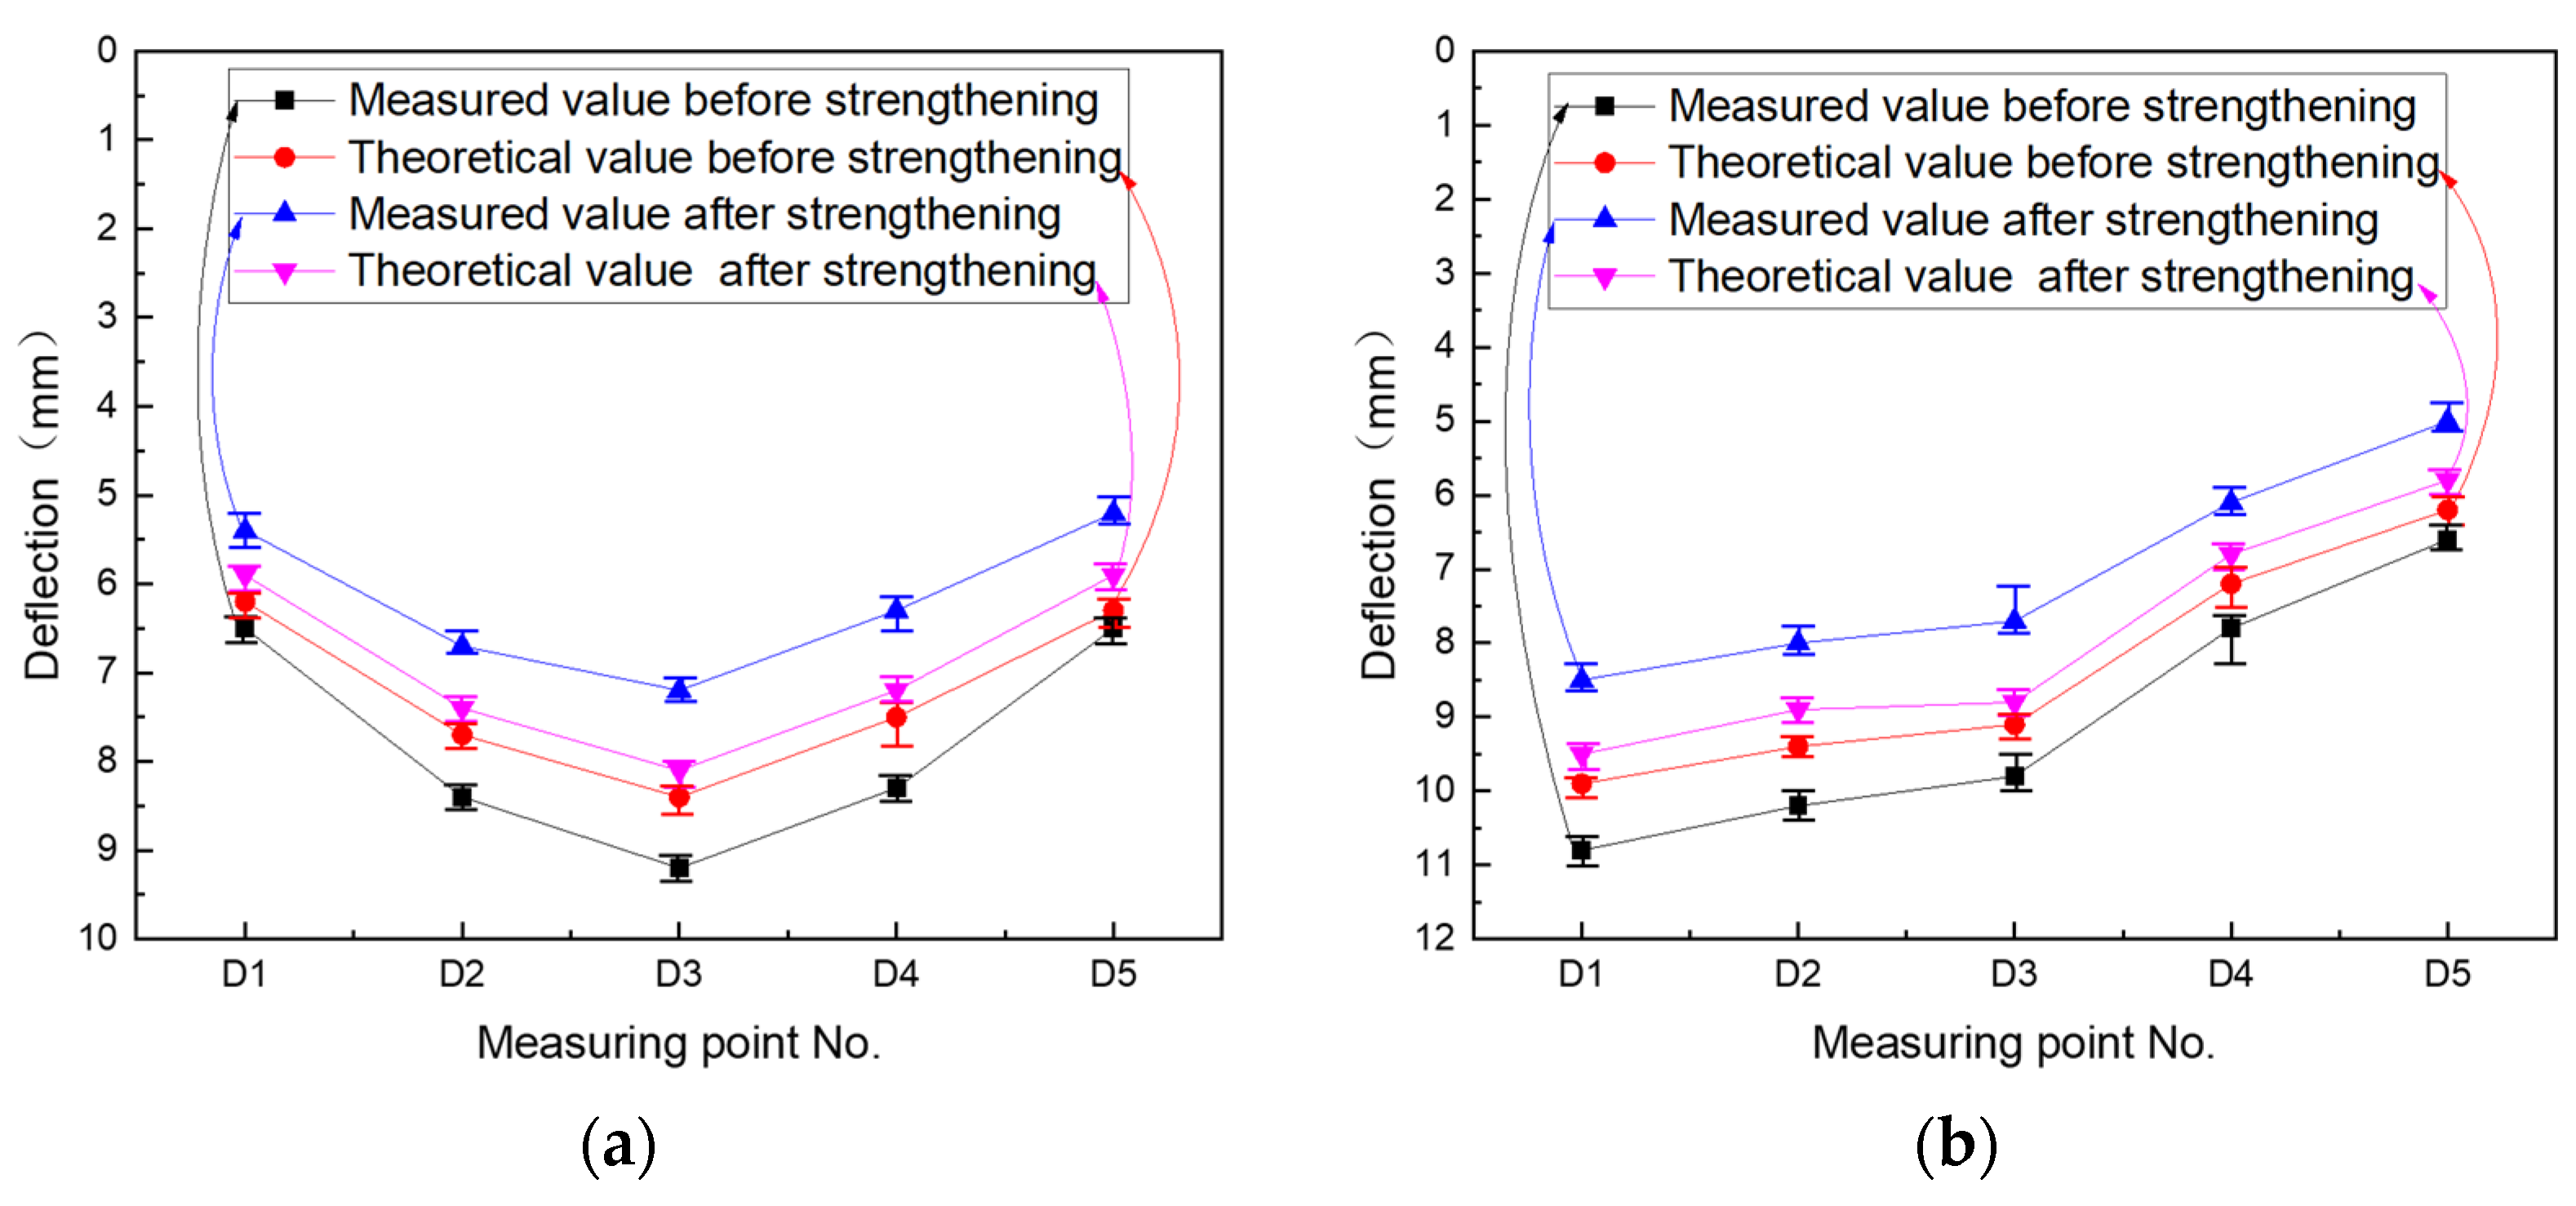
5.2.4. Theoretical Value Analysis of T-Beam Strengthened by PSWR-PUC

Above, the measured values of actual bridges one and two were compared, and the strengthening effects of the two different strengthening methods were verified. However, the theoretical values of actual bridge one strengthened with PSWR-PUC were not analyzed. Table 10 and Table 11 list the theoretical and measured values of deflections and principal strains in actual bridge one before and after strengthening.
The theoretical and measured deflection values of actual bridge one before and after strengthening are compared and analyzed in Table 10 and Figure 37. Under the action of symmetric or eccentric load, the theoretical values were less than the measured values of the actual bridge before strengthening. Additionally, the ratios between the theoretical and measured values were 0.90~0.97 under symmetric load and 0.92~0.94 under eccentric load, respectively. The results showed that the bearing capacity of actual bridge one did not meet Highway Grade II Load requirements before strengthening.
However, the theoretical values were larger than the measured values of actual bridge one after strengthening under the action of symmetric or eccentric load, and the ratios between the theoretical and measured values were 1.09~1.14 under symmetric load and 1.11~1.16 under eccentric load, respectively. The results showed that the bearing capacity of actual bridge one could meet Highway Grade II Load requirements after strengthening.
The theoretical and measured principal strain values of actual bridge one before and after strengthening are compared and analyzed in Table 12 and Figure 38. Under the action of symmetric or eccentric load, the theoretical values were less than the measured values of actual bridge one before strengthening. Additionally, the ratios between the theoretical and measured values were 0.89~0.94 under symmetric load and 0.90~0.92 under eccentric load, respectively. The results showed that the bearing capacity of actual bridge one could not meet Highway Grade II Load requirements before strengthening.
However, the theoretical values were larger than the measured values of actual bridge one after strengthening under the action of symmetric or eccentric load, and the ratios between the theoretical and measured values were 1.05~1.07 under symmetric load and 1.04~1.09 under eccentric load, respectively. The results showed that the bearing capacity of actual bridge one could meet Highway Grade II Load requirements after strengthening.
Comparing the theoretical values of deflection and principal strain before and after strengthening, the theoretical values after strengthening were less than those before strengthening, which showed that the bearing capacity of the reinforced concrete T-beams was improved after strengthening.

6. Conclusions

Development and implementation of a novel PSWR-PUC system for bridge shear strengthening were presented. Two actual bridges were shear-strengthened by the PSWR-PUC system and externally bonded steel plates, respectively. Static load tests were carried out before and after strengthening. Deflections and principal strains were compared for the two strengthening methods.
(1)
Deflections and principal strains in T-beams were significantly reduced after strengthening by the PSWR-PUC system and externally bonded steel plates. The two strengthening methods showed great improvements in shear capacity.
(2)
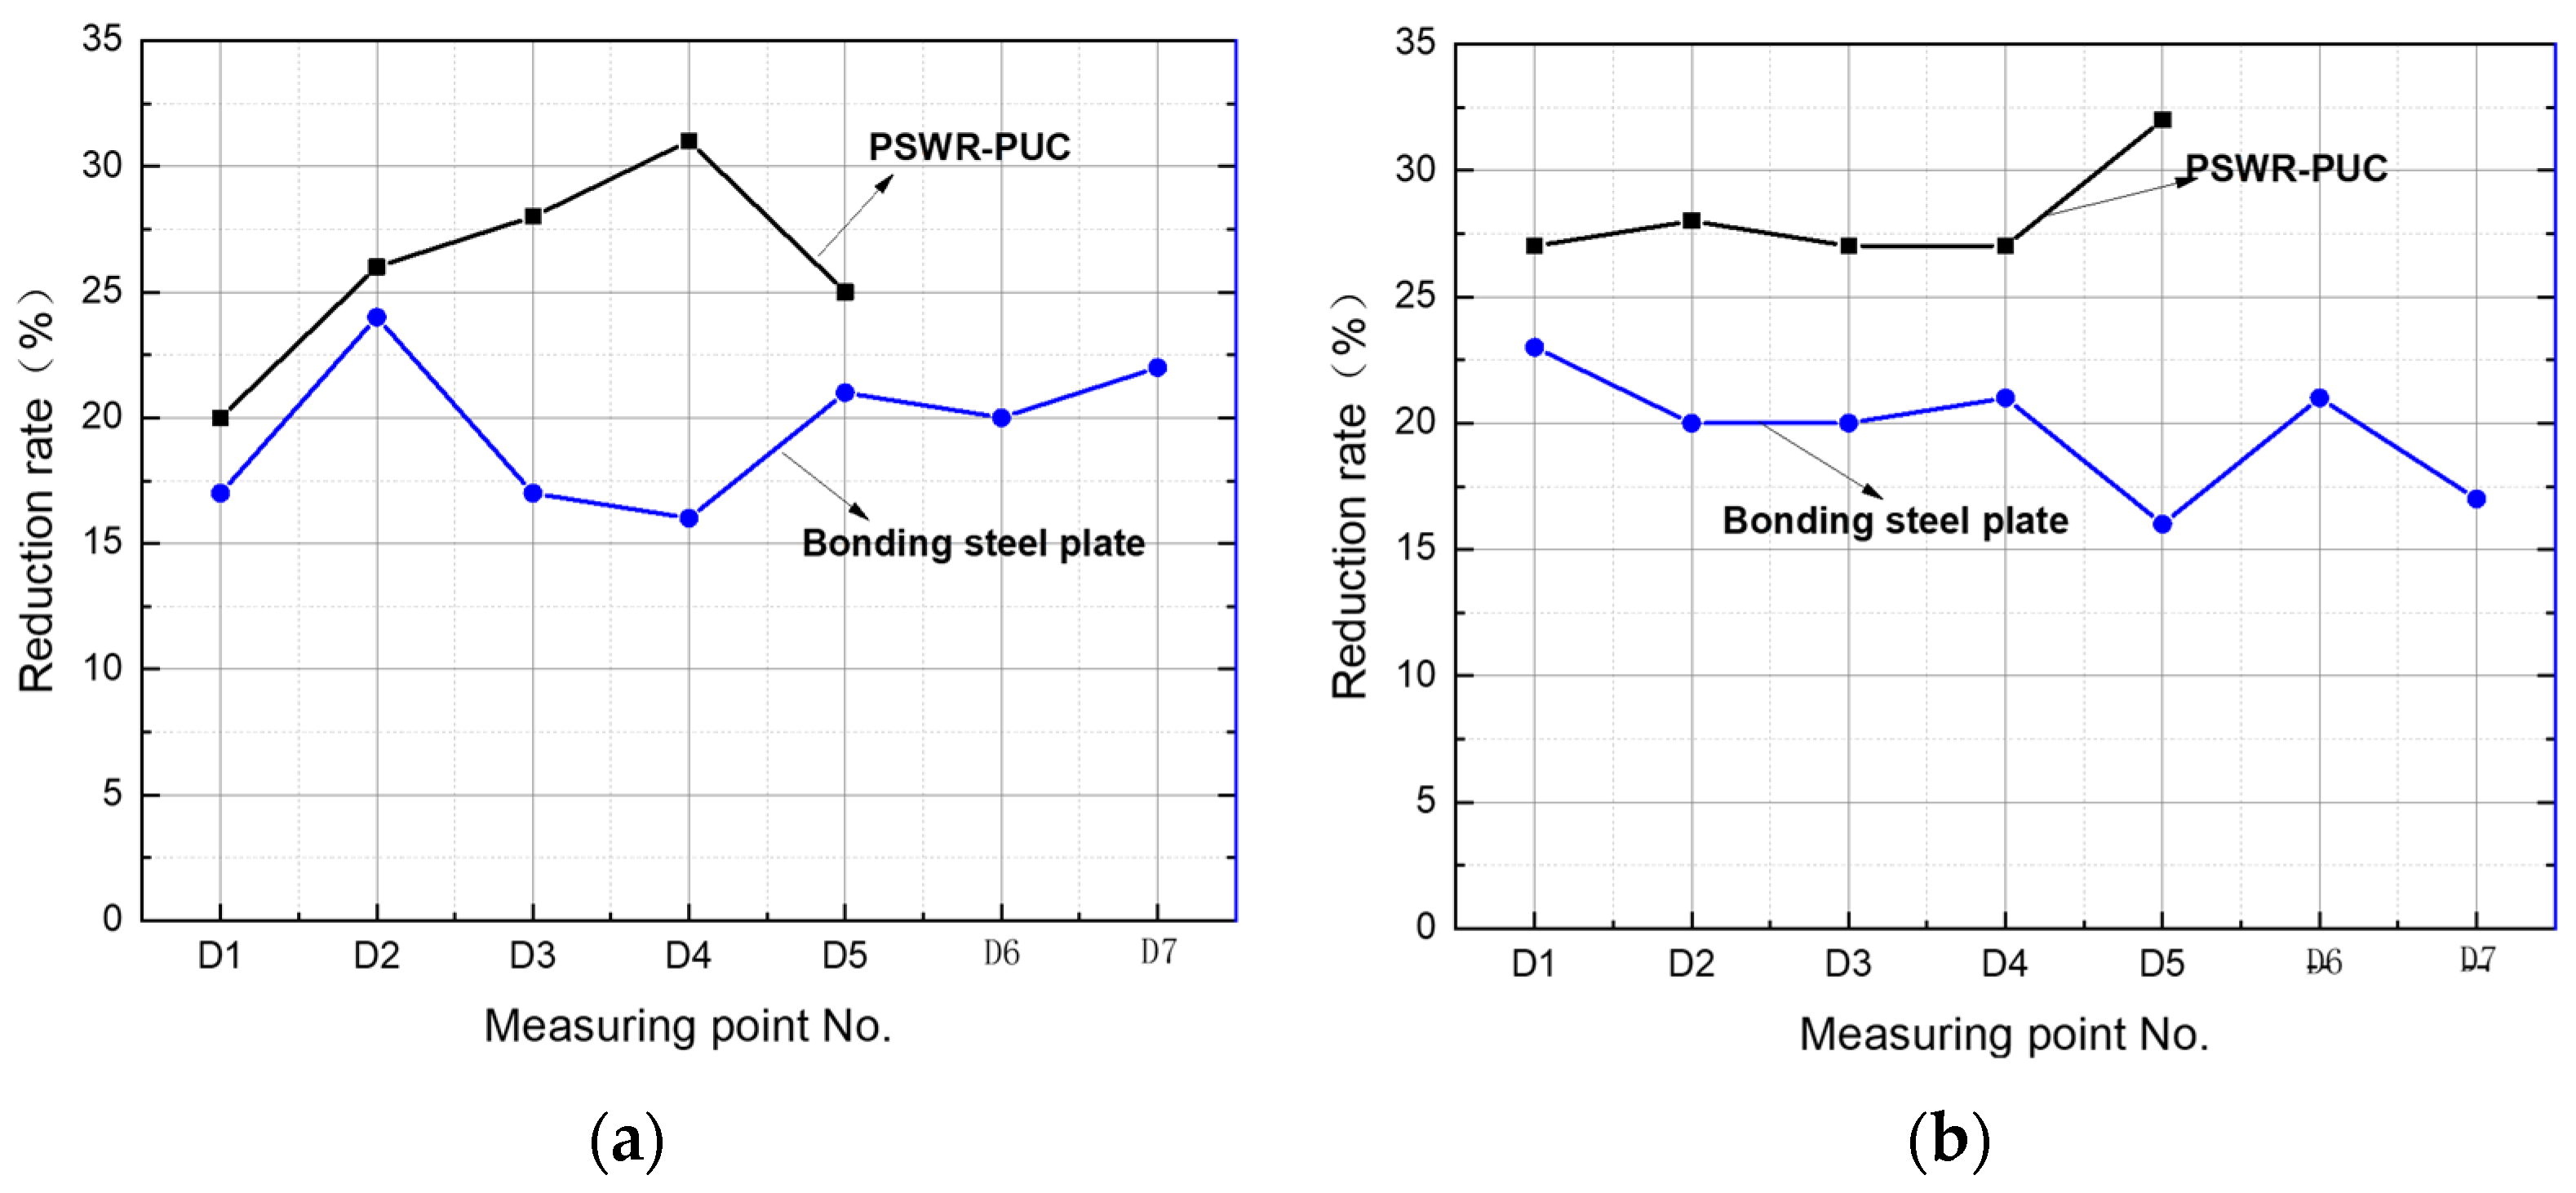
Compared to T-beams strengthened by externally bonded steel plates, the deflection and principal strain reduction rates were larger in T-beams strengthened by the PSWR-PUC system. The shear strengthening effect of the PSWR-PUC system was better than that of externally bonded steel plates. The strengthening efficiency of the PSWR-PUC method was significantly improved compared with the traditional method of bonded steel plates.
(3)
T-beams reinforced by the PSWR-PUC system will see an increase in deflection and strain when the temperature rises, but this increase is less than 5% and will not have an impact on the reinforcement’s effectiveness. Environmental temperature has little effect on the strengthening effect of the PSWR-PUC system.
(4)
The measured and theoretical bridge deflection and strain values were compared before and after PSWR-PUC strengthening. Deflection and strain after reinforcement had theoretical values that were higher than the measured ones. Bridges made of reinforced concrete now have a much higher bearing capacity thanks to the PSWR-PUC system.
In this study, the shear strengthening effect of PSWR-PUC was investigated by conducting static load tests on T-girder bridges. The fact that bridge structures usually have long service lives allows further research on the durability and long-term behavior of the reinforced structures, considering the effects of material aging and environmental factors on structural performance.

Supplementary Materials

The following supporting information can be downloaded at: https://www.mdpi.com/article/10.3390/su151310514/s1, Subroutine code for Midas of bridge 1; Subroutine code for Midas of bridge 2.

Author Contributions

Conceptualization, B.L., H.L. and H.G.; Methodology, B.L.; Software, B.L.; Validation, H.G.; Formal analysis, B.L.; Investigation, J.J.; Data curation, J.J.; Writing—original draft, B.L.; Writing—review and editing, B.L. and H.G.; Supervision, H.L.; Funding acquisition, H.L. and H.G. All authors have read and agreed to the published version of the manuscript.

Funding

The authors acknowledge the financial support provided by basic scientific research expenses at Heilongjiang Provincial College and University (2022-KYYWF-1094, 2021-KYYWF-0033), the National Natural Science Foundation of China (51678221), Key Laboratory of Functional Inorganic Material Chemistry (Heilongjiang University), Ministry of Education and Heilongjiang Provincial Universities Central Support Local Universities Reform and Development Funding, and the Key Research and Development Plan Guidance Project in Heilongjiang Province (GZ20220083).

Institutional Review Board Statement

Not applicable.

Informed Consent Statement

Not applicable.

Data Availability Statement

Data derived from the current study can be provided to readers upon request.

Conflicts of Interest

The authors declare no conflict of interest.

References

  1. Fiorillo, G.; Ghosn, M. Risk-Based Importance Factors for Bridge Networks under Highway Traffic Loads. Struct. Infrastruct. Eng. 2019, 15, 113–126. [Google Scholar] [CrossRef]
  2. Mandić Ivanković, A.; Skokandić, D.; Žnidarič, A.; Kreslin, M. Bridge Performance Indicators Based on Traffic Load Monitoring. Struct. Infrastruct. Eng. 2019, 15, 899–911. [Google Scholar] [CrossRef]
  3. Kamaitis, Z. Influence of Functionally Obsolete Bridges on the Efficiency of Road Network. Part I: Obsolescence Characteristics and Assessment. Balt. J. Road Bridge Eng. 2012, 7, 173–180. [Google Scholar] [CrossRef]
  4. Alipour, A.; Shafei, B.; Shinozuka, M.S. Capacity Loss Evaluation of Reinforced Concrete Bridges Located in Extreme Chloride-Laden Environments. Struct. Infrastruct. Eng. 2013, 9, 8–27. [Google Scholar] [CrossRef]
  5. Chen, S.Z.; Wu, G.; Feng, D.C. Damage Detection of Highway Bridges Based on Long-Gauge Strain Response under Stochastic Traffic Flow. Mech. Syst. Signal Process. 2019, 127, 551–572. [Google Scholar] [CrossRef]
  6. Guo, A.; Li, H.; Ba, X.; Guan, X.; Li, H. Experimental Investigation on the Cyclic Performance of Reinforced Concrete Piers with Chloride-Induced Corrosion in Marine Environment. Eng. Struct. 2015, 105, 1–11. [Google Scholar] [CrossRef]
  7. Li, Y.; Yu, Z.; Liu, Y. Experimental and Numerical Study of the Ultimate Flexural Capacity of a Full-Size Damaged Prestressed Concrete Box Girder Strengthened with Bonded Steel Plates. Materials 2023, 16, 2476. [Google Scholar] [CrossRef] [PubMed]
  8. Šomodíková, M.; Lehký, D.; Doležel, J.; Novák, D. Modeling of Degradation Processes in Concrete: Probabilistic Lifetime and Load-Bearing Capacity Assessment of Existing Reinforced Concrete Bridges. Eng. Struct. 2016, 119, 49–60. [Google Scholar] [CrossRef]
  9. Ali, O.; Bigaud, D.; Ferrier, E. Comparative Durability Analysis of CFRP-Strengthened RC Highway Bridges. Constr. Build. Mater. 2012, 30, 629–642. [Google Scholar] [CrossRef] [Green Version]
  10. Gao, H.; Li, B.; Jian, J.; Yu, T.; Liu, H. Integral Jacking of Concrete Continuous Box Beam Bridge. Structures 2023, 54, 1026–1045. [Google Scholar] [CrossRef]
  11. Zhou, X.; Zhang, X. Thoughts on the Development of Bridge Technology in China. Engineering 2019, 5, 1120–1130. [Google Scholar] [CrossRef]
  12. Kaiqi, Z. Influence of Diagonal Cracking on Shear Behaviors of Concrete Beam Bridges; Southeast University: Nanjing, China, 2017. [Google Scholar]
  13. Zhao, A. Study on the Shear Deformation of Thin-Web RC Beams in Elastic Stage and after the Formation of Diagonal Cracks; Southeast University: Nanjing, China, 2014. [Google Scholar]
  14. Barr, P.J.; Asce, A.M.; Amin, N. Shear Live-Load Distribution Factors for I-Girder Bridges. J. Bridge Eng. 2006, 11, 197–204. [Google Scholar] [CrossRef]
  15. Shrestha, R.; Maharjan, L.; Cross, B.; Panahshahi, N.; Vaughn, B.; Petermeier, D.; Siow, Y. Analytical and Experimental Investigation of Shear Distribution Factors. In Proceedings of the Structures Congress: New Horizons and Better Practices, Long Beach, CA, USA, 16–19 May 2007; pp. 154–163. [Google Scholar] [CrossRef]
  16. Shu, J.; Bagge, N.; Plos, M.; Johansson, M.; Yang, Y.; Zandi, K. Shear Capacity of a RC Bridge Deck Slab: Comparison between Multilevel Assessment and Field Test. J. Struct. Eng. 2018, 144, 04018081. [Google Scholar] [CrossRef]
  17. He, Y.; Wang, K.; Cao, Z.; Zheng, P.; Xiang, Y. Reinforcement Analysis of an Old Multi-Beam Box Girder Based on a New Embedded Steel Plate (ESP) Strengthening Method. Materials 2022, 15, 4353. [Google Scholar] [CrossRef] [PubMed]
  18. Xiong, G.J.; Wu, X.Y.; Li, F.F.; Yan, Z. Load Carrying Capacity and Ductility of Circular Concrete Columns Confined by Ferrocement Including Steel Bars. Constr. Build. Mater. 2011, 25, 2263–2268. [Google Scholar] [CrossRef]
  19. Aykac, S.; Kalkan, I.; Aykac, B.; Karahan, S.; Kayar, S. Strengthening and Repair of Reinforced Concrete Beams Using External Steel Plates. J. Struct. Eng. 2013, 139, 929–939. [Google Scholar] [CrossRef]
  20. Chellapandian, M.; Prakash, S.S.; Mahadik, V.; Sharma, A. Experimental and Numerical Studies on Effectiveness of Hybrid FRP Strengthening on Behavior of RC Columns under High Eccentric Compression. J. Bridge Eng. 2019, 24, 04019048. [Google Scholar] [CrossRef]
  21. Han, T.; Nagarajan, S.; Zhao, H.; Sun, C.; Wen, S.; Zhao, S.; Zhao, S.; Zhang, L. Novel Reinforcement Behavior in Nanofilled Natural Rubber (NR)/Butadiene-Acrylonitrile Rubber (NBR) Blends: Filling-Polymer Network and Supernanosphere. Polymer 2020, 186, 122005. [Google Scholar] [CrossRef]
  22. Tesar, A. Shear Lag in the Behaviour of Thinwalled Box Bridges. Comput. Struct. 1996, 59, 607–612. [Google Scholar] [CrossRef]
  23. Tomàs, D.; Lozano-Galant, J.A.; Ramos, G.; Turmo, J. Structural System Identification of Thin Web Bridges by Observability Techniques Considering Shear Deformation. Thin-Walled Struct. 2018, 123, 282–293. [Google Scholar] [CrossRef] [Green Version]
  24. Xie, H.; Wang, Y.; Zou, R. Reliability Analysis of RC T-Beam Highway Bridges in China Based on a Virtual Bridge Dataset. Eng. Struct. 2015, 104, 133–140. [Google Scholar] [CrossRef]
  25. Zhou, S.-J. Shear Lag Analysis in Prestressed Concrete Box Girders. J. Bridge Eng. 2011, 16, 500–512. [Google Scholar] [CrossRef]
  26. Lin, Y.; Yan, J.; Wang, Y.; Fan, F.; Zou, C. Shear Failure Mechanisms of SCS Sandwich Beams Considering Bond-Slip between Steel Plates and Concrete. Eng. Struct. 2019, 181, 458–475. [Google Scholar] [CrossRef]
  27. Oh, B.H.; Cho, J.Y.; Park, D.G. Static and Fatigue Behavior of Reinforced Concrete Beams Strengthened with Steel Plates for Flexure. J. Struct. Eng. 2003, 129, 527–535. [Google Scholar] [CrossRef]
  28. Song, J.; Wang, W.; Su, S.; Ding, X.; Luo, Q.; Quan, C. Experimental Study on the Bond-Slip Performance between Concrete and a Corrugated Steel Plate with Studs. Eng. Struct. 2020, 224, 111195. [Google Scholar] [CrossRef]
  29. Tang, H.; Peng, J.; Zhang, J. Influence of Further Corrosion on Structural Behavior of Corroded Reinforced-Concrete Beam Strengthened with Steel Plate Using Different Strengthening Schemes. J. Perform. Constr. Facil. 2020, 34, 04019117. [Google Scholar] [CrossRef]
  30. Hamoush, B.S.A.; Ahmad, S.H. Debonding of Steel-Plate-Strengthened Concrete Beams. J. Struct. Eng. 1990, 116, 356–371. [Google Scholar] [CrossRef]
  31. Al-Saawani, M.A.; El-Sayed, A.K.; Al-Negheimish, A.I. Effect of Shear-Span/Depth Ratio on Debonding Failures of FRP-Strengthened RC Beams. J. Build. Eng. 2020, 32, 101771. [Google Scholar] [CrossRef]
  32. Godat, A.; Hammad, F.; Chaallal, O. State-of-the-Art Review of Anchored FRP Shear-Strengthened RC Beams: A Study of Influencing Factors. Compos. Struct. 2020, 254, 112767. [Google Scholar] [CrossRef]
  33. Saeed, Y.M.; Aules, W.A.; Rad, F.N.; Raad, A.M. Tensile Behavior of FRP Anchors Made from CFRP Ropes Epoxy-Bonded to Uncracked Concrete for Flexural Strengthening of RC Columns. Case Stud. Constr. Mater. 2020, 13, e00435. [Google Scholar] [CrossRef]
  34. Slaitas, J.; Valivonis, J. Concrete Cracking and Deflection Analysis of RC Beams Strengthened with Prestressed FRP Reinforcements under External Load Action. Compos. Struct. 2021, 255, 113036. [Google Scholar] [CrossRef]
  35. Tang, W.; Li, S.; Lu, Y.; Li, Z. Combined Effects of Wetting–Drying Cycles and Sustained Load on the Behaviour of FRP-Strengthened RC Beams. Eng. Struct. 2020, 213, 110570. [Google Scholar] [CrossRef]
  36. Liu, X.; Jiang, J.; Wang, G.; Wang, J.; Xu, R. Debonding Analysis of Curved RC Beams Externally Bonded with FRP Plates Using CZM. Eng. Struct. 2020, 205, 110103. [Google Scholar] [CrossRef]
  37. Sun, W.; Peng, X.; Liu, H.; Qi, H. Numerical Studies on the Entire Debonding Propagation Process of FRP Strips Externally Bonded to the Concrete Substrate. Constr. Build. Mater. 2017, 149, 218–235. [Google Scholar] [CrossRef] [Green Version]
  38. Zhang, P.; Lei, D.; Ren, Q.; He, J.; Shen, H.; Yang, Z. Experimental and Numerical Investigation of Debonding Process of the FRP Plate-Concrete Interface. Constr. Build. Mater. 2020, 235, 117457. [Google Scholar] [CrossRef]
  39. Kim, S.Y.; Yang, K.H.; Byun, H.Y.; Ashour, A.F. Tests of Reinforced Concrete Beams Strengthened with Wire Rope Units. Eng. Struct. 2007, 29, 2711–2722. [Google Scholar] [CrossRef]
  40. Li, X.; Wu, G.; Shafiq Popal, M.; Jiang, J. Experimental and Numerical Study of Hollow Core Slabs Strengthened with Mounted Steel Bars and Prestressed Steel Wire Ropes. Constr. Build. Mater. 2018, 188, 456–469. [Google Scholar] [CrossRef]
  41. Miao, W.; Guo, Z.X.; Ye, Y.; Basha, S.H.; Liu, X.J. Flexural Behavior of Stone Slabs Strengthened with Prestressed NSM Steel Wire Ropes. Eng. Struct. 2020, 222, 111046. [Google Scholar] [CrossRef]
  42. Misnon, N.A.; Giaretton, M.; Shedde, D.; Ingham, J.; Dizhur, D. Shear Testing of URM Wallettes Retrofitted with NSM Steel Wire Rope. Structures 2020, 27, 1613–1622. [Google Scholar] [CrossRef]
  43. Yang, K.H.; Byun, H.Y.; Ashour, A.F. Shear Strengthening of Continuous Reinforced Concrete T-Beams Using Wire Rope Units. Eng. Struct. 2009, 31, 1154–1165. [Google Scholar] [CrossRef] [Green Version]
  44. Yuan, F.; Chen, M.; Pan, J. Flexural Strengthening of Reinforced Concrete Beams with High-Strength Steel Wire and Engineered Cementitious Composites. Constr. Build. Mater. 2020, 254, 119284. [Google Scholar] [CrossRef]
  45. Li, B.; Liu, H.; Jian, J.; Duan, H.; Gao, H. Experimental Study on Flexural Properties of Polyurethane–Cement Composites under Temperature Load. Appl. Sci. 2022, 12, 12799. [Google Scholar] [CrossRef]
  46. Zhang, K.; Shen, X.; Liu, J.; Teng, F.; Zhang, G.; Wang, J. Flexural Strengthening of Reinforced Concrete T-Beams Using a Composite of Prestressed Steel Wire Ropes Embedded in Polyurethane Cement (PSWR-PUC): Theoretical Analysis. Structures 2022, 44, 1278–1287. [Google Scholar] [CrossRef]
  47. Gao, H.; Sun, Q. Static Field Test on Flexural Behavior of Reinforced Concrete T-Beam Bridge Strengthened with MPC-PSWR. Int. J. Struct. Integr. 2020, 11, 515–531. [Google Scholar] [CrossRef]
  48. Zhang, K. Flexural Simulation Analysis of Rc T-Girders Strengthed With Polyurethane Cement-Prestressed Steel Wire Ropes. Stavební Obz. Civ. Eng. J. 2021, 30, 890–906. [Google Scholar] [CrossRef]
  49. Wu, G.; Wu, Z.S.; Jiang, J.B.; Tian, Y.; Zhang, M. Experimental Study of RC Beams Strengthened with Distributed Prestressed High-Strength Steel Wire Rope. Mag. Concr. Res. 2010, 62, 253–265. [Google Scholar] [CrossRef]
  50. JTJ 021-89; General Specifications for Design of Highway Bridges and Culverts. Ministry of Transport of the People’s Republic of China: Beijing, China, 1989.
  51. JTG/T J21-01-2016; Load Test Methods for Highway Bridge. Ministry of Transport of the People’s Republic of China: Beijing, China, 2016.
  52. JTG D60-2004; General Specifications for Design of Highway Bridges and Culverts. Ministry of Transport of the People’s Republic of China: Beijing, China, 2004.
  53. Gu, Y.; Hua, Q.; Zhang, C.; He, X. The Generalized Finite Difference Method for Long-Time Transient Heat Conduction in 3D Anisotropic Composite Materials. Appl. Math. Model. 2019, 71, 316–330. [Google Scholar] [CrossRef]
  54. Kabir, H.; Aghdam, M.M. A Robust Bézier Based Solution for Nonlinear Vibration and Post-Buckling of Random Checkerboard Graphene Nano-Platelets Reinforced Composite Beams. Compos. Struct. 2019, 212, 184–198. [Google Scholar] [CrossRef]
  55. Bert, C.W.; Malik, M. Differential Quadrature: A Powerful New Technique for Analysis of Composite Structures. Compos. Struct. 1997, 39, 179–189. [Google Scholar] [CrossRef]
Figure 1. Bridge with thin webs: (a) T-beam; (b) box girder beam.
Sustainability 15 10514 g001
Figure 2. Deformation composition of a beam: (a) bending deformation; (b) shear deformation.
Sustainability 15 10514 g002
Figure 3. Damage to externally bonded steel plates.
Sustainability 15 10514 g003
Figure 4. Debonding of externally bonded FRP sheets.
Sustainability 15 10514 g004
Figure 5. Preparation process of polyurethane cement.
Sustainability 15 10514 g005
Figure 6. Tensile test of steel wire rope: (a) tensile test process; (b) failure mode.
Sustainability 15 10514 g006
Figure 7. Layout of actual bridge one (cm).
Sustainability 15 10514 g007
Figure 8. Vehicle-20 grade load.
Sustainability 15 10514 g008
Figure 9. Layout of actual bridge two (cm).
Sustainability 15 10514 g009
Figure 10. Structure layout and reinforcement information of T-beam: (a) T-beam structure layout; (b) reinforcement details (cm).
Sustainability 15 10514 g010
Figure 11. Typical crack distribution in T-beams of actual bridge one. (a) Oblique crack distribution 1; (b) oblique crack distribution 2; (c) typical fracture distribution of actual bridge one.
Sustainability 15 10514 g011
Figure 12. Typical crack distribution in T-beams of actual bridge two. (a) Oblique crack distribution 1; (b) oblique crack distribution 2; (c) typical fracture distribution of actual bridge two.
Sustainability 15 10514 g012
Figure 13. Strengthening scheme of actual bridge one (cm): (a) elevation layout; (b) bottom layout; (c) cross-section layout.
Sustainability 15 10514 g013
Figure 14. Conner plate and anchorage: (a) corner steel plate; (b)anchorage.
Sustainability 15 10514 g014
Figure 15. Tensioning process: (a) steel wire rope and anchor head; (b) tensioning the steel wire rope.
Sustainability 15 10514 g015
Figure 16. Strengthening scheme of actual bridge two (cm): (a) elevation layout; (b) bottom layout; (c) cross-section layout.
Sustainability 15 10514 g016
Figure 17. Steel bar position detection.
Sustainability 15 10514 g017
Figure 18. Bonded steel plate.
Sustainability 15 10514 g018
Figure 19. Lane load of Highway Grade II Load.
Sustainability 15 10514 g019
Figure 20. Schematic diagram of three-axle truck.
Sustainability 15 10514 g020
Figure 21. Finite element model of actual bridges: (a) actual bridge one; (b) actual bridge two.
Sustainability 15 10514 g021
Figure 22. Longitudinal loading position of test truck (cm): (a) loading position of mid-span deflection test; (b) loading position of principal strain near bearing.
Sustainability 15 10514 g022
Figure 23. Transverse loading position of actual bridge one (cm): (a) eccentric loading in transverse direction; (b) symmetric loading in transverse direction.
Sustainability 15 10514 g023
Figure 24. Transverse loading position of actual bridge two (cm): (a) eccentric loading in transverse direction; (b) symmetric loading in transverse direction.
Sustainability 15 10514 g024
Figure 25. The loading test process of actual bridges: (a) the loading test process of actual bridge one; (b) the loading test process of actual bridge two.
Sustainability 15 10514 g025
Figure 26. Relationship between loading conditions and measuring point positions.
Sustainability 15 10514 g026
Figure 27. Layout of deflection and principal strain measuring points of bridge one: (a) arrangement of deflection measuring points; (b) arrangement of principal strain measuring points.
Sustainability 15 10514 g027
Figure 28. Layout of deflection and principal strain measuring points of actual bridge two: (a) arrangement of deflection measuring points; (b) arrangement of principal strain measuring points.
Sustainability 15 10514 g028
Figure 29. Comparison of deflections before and after strengthening of actual bridge one: (a) mid-span deflections under symmetric loading; (b) mid-span deflections under eccentric loading.
Sustainability 15 10514 g029
Figure 30. Comparison of deflection before and after strengthening of actual bridge two: (a) mid-span deflections under symmetric loading; (b) mid-span deflections under eccentric loading.
Sustainability 15 10514 g030
Figure 31. Comparison of strengthening effect (deflection) of different strengthening methods: (a) deflection reduction rates under symmetric loading; (b) deflection reduction rates under eccentric loading.
Sustainability 15 10514 g031
Figure 32. Comparison of deflection reduction rates of different strengthening methods.
Sustainability 15 10514 g032
Figure 33. Comparison of principal strains before and after strengthening of actual bridge one: (a) principal strains near bearings under symmetric loading; (b) principal strains near bearings under eccentric loading.
Sustainability 15 10514 g033
Figure 34. Comparison of principal strains before and after strengthening of actual bridge two: (a) principal strains near bearings under symmetric loading; (b) principal strains near bearings under eccentric loading.
Sustainability 15 10514 g034
Figure 35. Comparison of strengthening effect (principal strain) of different strengthening methods: (a) principal strain reduction rates under symmetric loading; (b) principal strain reduction rates under eccentric loading.
Sustainability 15 10514 g035
Figure 36. Comparison of principal strain reduction rates of different strengthening methods.
Sustainability 15 10514 g036
Figure 37. Comparison of deflections in actual bridge one before and after strengthening: (a) mid-span deflections under symmetric loading; (b) mid-span deflections under eccentric loading.
Sustainability 15 10514 g037
Figure 38. Comparison of principal strains in actual bridge one before and after strengthening: (a) principal strains near bearings under symmetric loading; (b) principal strains near bearings under eccentric loading.
Sustainability 15 10514 g038
Table 1. The mixing ratio of each raw material for this test(kg/m3).
Serial NumberRaw MaterialsMix Ratio
1WANNATE® PM-200390
2ES305 polyether combination390
3Dabco MixCO2 catalyst7.5
4Silicate cement800
Table 2. Loading conditions and test contents.
No.Loading ConditionLoading LocationTest Contents
1Eccentric loadingMid-spanDeflection
2Symmetric loadingMid-spanDeflection
3Eccentric loadingArea near bearingPrincipal strain
4Symmetric loadingArea near bearingPrincipal strain
Table 3. Test truck parameters before and after strengthening of actual bridge one.
Truck No.Load (kN)Wheelbase (m)
P1P2P3Pabc
Before strengthening180.0160.0160.04003.951.351.8
281.0162.0162.04053.951.351.8
After strengthening181.6163.2163.24083.951.351.8
279.6159.2159.23983.951.351.8
Table 4. Test truck parameters before and after strengthening of actual bridge two.
Truck No.Load (kN)Wheelbase (m)
P1P2P3Pabc
Before strengthening184.2168.4168.44213.51.351.8
283.6167.2167.24183.51.351.8
After strengthening184.8169.6169.64243.51.351.8
283.0166.0166.04153.51.351.8
Table 5. Deflections in actual bridge one before and after strengthening.
Measuring Point No.Symmetric Loading Condition (mm)Eccentric Loading Condition (mm)
Before StrengtheningAfter StrengtheningReduction RateBefore StrengtheningAfter StrengtheningReduction Rate
D16.55.40.2010.88.50.27
D28.46.70.2610.28.00.28
D39.27.20.289.87.70.27
D48.36.30.317.86.10.27
D56.55.20.256.65.00.32
Average value 0.26 0.27
Table 6. Principal strains in actual bridge two before and after strengthening.
Measuring Point No.Symmetric Loading Condition (mm)Eccentric Loading Condition (mm)
Before StrengtheningAfter StrengtheningReduction RateBefore StrengtheningAfter StrengtheningReduction Rate
D16.35.40.1712.510.20.23
D27.86.30.2410.99.10.20
D39.58.10.179.88.20.20
D410.28.80.168.26.80.21
D59.47.80.217.16.10.16
D67.86.50.205.84.80.21
D76.75.50.224.94.20.17
Average value 0.19 0.19
Table 7. Principal strains in actual bridge one before and after strengthening.
Measuring Point No.Symmetric Loading Condition (με)Eccentric Loading Condition (με)
Before StrengtheningAfter StrengtheningReduction RateBefore StrengtheningAfter StrengtheningReduction Rate
S185700.212211870.18
S21281050.221781450.23
S31501240.211381110.24
S41351080.2598780.26
S590720.2556450.24
Average value 0.23 0.23
Table 8. Principal strains in actual bridge two before and after strengthening.
Measuring Point No.Symmetric Loading Condition (με)Eccentric Loading Condition (με)
Before StrengtheningAfter StrengtheningReduction RateBefore StrengtheningAfter StrengtheningReduction Rate
S180680.182452130.15
S2112940.192021760.15
S31381210.141621360.19
S41671450.151231100.12
S51401240.1389770.16
S6112960.1757480.19
S778660.1832280.14
Average value 0.15 400.16
Table 9. Deflections in actual bridge one at different temperatures after strengthening.
Measuring Point No.Symmetric Loading Condition (mm)Eccentric Loading Condition (mm)
9 °C19 °CRate of Change9 °C19 °CRate of Change
D15.35.41.9%8.28.53.7%
D26.56.73.1%7.88.02.6%
D37.07.22.9%7.57.72.7%
D46.26.31.6%5.96.13.4%
D55.15.22.0%4.95.02.0%
Average value 2.3% 2.9%
Table 10. Principal strains in actual bridge one at different temperatures after strengthening.
Measuring Point No.Symmetric Loading Condition (με)Eccentric Loading Condition (με)
9 °C19 °CRate of Change9 °C19 °CRate of Change
S168702.9%1811873.3%
S21031051.9%1391454.3%
S31211242.5%1081112.8%
S41051082.9%75784.0%
S569724.3%43454.7%
Average value 2.9% 3.8%
Table 11. Measured and theoretical deflections in actual bridge one before and after strengthening.
Measuring
Point No.
Loading CaseBefore Strengthening (mm)After Strengthening (mm)
Measured Value Theoretical
Value
Theoretical
Value/Measured Value
Measured ValueTheoretical
Value
Theoretical
Value/Measured Value
D1Symmetric loading condition6.56.20.955.45.91.09
D28.47.70.926.77.41.10
D39.28.40.917.28.11.13
D48.37.50.906.37.21.14
D56.56.30.975.25.91.13
D1Eccentric loading condition10.89.90.928.59.51.12
D210.29.40.928.08.91.11
D39.89.10.937.78.81.14
D47.87.20.926.16.81.11
D56.66.20.945.05.81.16
Table 12. Measured and theoretical principal strains in actual bridge one before and after strengthening.
Measuring
Point No.
Loading CaseBefore Strengthening (με)After Strengthening (με)
Measured Value Theoretical
Value
Theoretical
Value/Measured Value
Measured ValueTheoretical
Value
Theoretical
Value/Measured Value
S1Symmetric loading condition85800.9470751.07
S21281200.941051101.05
S31501400.931241321.06
S41351200.891081151.06
S590800.8972761.06
S1Eccentric loading condition2212000.901871951.04
S21781640.921451551.07
S31381250.911111181.06
S498900.9278851.09
S556510.9145481.07
Disclaimer/Publisher’s Note: The statements, opinions and data contained in all publications are solely those of the individual author(s) and contributor(s) and not of MDPI and/or the editor(s). MDPI and/or the editor(s) disclaim responsibility for any injury to people or property resulting from any ideas, methods, instructions or products referred to in the content.

