Article

Spatial Distribution of Soil Organic Carbon in Relation to Land Use, Based on the Weighted Overlay Technique in the High Andean Ecosystem of Puno—Peru

1
Facultad de Ciencias Agrarias, Escuela Profesional de Ingeniería Agronómica, Universidad Nacional del Altiplano, Puno 21001, Peru
2
Facultad de Ciencias Agrarias, Escuela Profesional de Ingeniería Topográfica y Agrimensura, Universidad Nacional del Altiplano, Puno 21001, Peru
3
Facultad de Industrias Alimentarias, Universidad Nacional Agraria La Molina, Av. La Molina s/n, Lima 15024, Peru
4
Escuela Profesional de Ingeniería Civil, Grupo de Investigación en Ingeniería Civil, Universidad Nacional de Moquegua, Moquegua 18001, Peru
5
Facultad de Ingeniería, Escuela Profesional Ingeniería Forestales y Ambiental, Universidad Nacional de Jaén, Cajamarca 034, Peru
6
Carrera Profesional de Ingeniería de Minas, Universidad Nacional Micaela Bastidas de Apurímac, Abancay 03001, Peru
*
Author to whom correspondence should be addressed.
Sustainability 2023, 15(13), 10316; https://doi.org/10.3390/su151310316
Submission received: 31 May 2023 / Revised: 16 June 2023 / Accepted: 27 June 2023 / Published: 29 June 2023

Abstract

:
Soil organic carbon (SOC) is a crucial component of the planet and is essential for agriculture development. Our region is known for its livestock and agricultural activities. Hence, understanding the spatial distribution of SOC is crucial for sustainable land management of soils in the mountain ecosystems in the Andes. The methodology consisted of obtaining 53 soil samples from depths of 0 to 105 cm, which were analyzed to obtain SOC (Kg/m2) and organic matter (OM) (%). Ordinary kriging, a geostatistical method, was used to determine SOC. Pearson’s statistical method was applied to determine the association between SOC and precipitation, temperature, altitude, and organic matter and gave acceptable correlations of 0.38, −0.32, 0.40, and 0.59. These results were used to apply weighting criteria for climatological and environmental variables. The weighted overlay tool was used for modeling and mapping the spatial variability of SOC. The estimated spatial distribution of SOC in the micro-watershed reveals an increasing trend from south to north, specifically within the 0–20 cm depth profile. The study confirmed through the spatial analysis that regions with intensive agriculture have low reserves (<3 Kg/m2) of SOC, and areas without agricultural activity but with grazing have average resources of 3 Kg/m2 to 5 Kg/m2 of SOC. Finally, in the upper micro-watersheds where there is no agricultural activity, the reserves are high (5 Kg/m2 to 6.8 Kg/m2). Accordingly, we can promote sustainable and responsible land use practices that support long-term productivity, environmental protection, and societal well-being by prioritizing efficient land utilization, soil conservation, biodiversity conservation, land restoration, and informed land use planning in the high Andean ecosystem of Puno–Peru.

1. Introduction

Soils are potentially suitable sinks for atmospheric carbon and can contribute to mitigating global climate change; understanding the spatial distribution of SOC content is crucial for effective soil management and carbon sequestration strategies [1]. Sustainable soil management practices are essential to address the threat of decreasing SOC content [2]. These include techniques such as conservation tillage, cover cropping, crop rotation, organic amendments, and agroforestry. Soil is a significant carbon reservoir whose storage capacity can vary depending on land use type and altitude factors. In mountain ecosystems, there is often a notable variation in soil organic carbon (SOC) stock due to diverse soil types, climatic conditions, vegetation patterns, and elevational gradients, and it plays a vital role in the global carbon cycle [3,4].
Consequently, the fate of soil organic carbon (SOC) becomes a matter of great concern when considering climate change, land use, and management changes [5]. Changes in land use, such as deforestation or conversion to agriculture, can lead to the loss of deep of SOC due to increased erosion, reduced organic matter input, and soil structure disturbance [6]. Models of soil organic carbon (SOC) are valuable tools for projecting the impacts of land management changes on SOC stocks over time. These models simulate the processes involved in SOC dynamics, such as carbon input from plant residues, root biomass, and organic amendments, as well as carbon losses through decomposition and erosion. By considering various factors such as climate, soil properties, vegetation type, and management practices, these models can estimate the potential changes in SOC stocks under different scenarios [7,8]. Landscape topography influences soil properties and processes by affecting the movement of water, nutrients, and other substances both at the surface and within the soil profile. Understanding the topographic controls on soil dynamics is crucial for managing soil resources, optimizing water use efficiency, and mitigating erosion and nutrient loss in a landscape [9].
The typological approach is a method used to estimate soil organic carbon (SOC) density on a national or regional scale. This approach involves calculating SOC density within soil profiles, typically up to a depth of 1 m, by utilizing soil profile data and spatial databases [10]. Geographic information systems (GIS) and remote sensing (RS), combined with the availability of soil characteristics information, allow more quantitative approaches to predict the spatial distribution of soil organic carbon as a function of soil formation factors [11,12,13]. The combination of remote sensing and GIS provides valuable tools for understanding the spatiotemporal dynamics of croplands and studying soil organic carbon density. These approaches help to assess the impact of land cover changes, vegetation dynamics, and environmental factors on soil carbon dynamics. They can inform land management strategies for mitigating carbon sequestration and climate change [2,14]. Fortunately, some soil properties exhibit spatial relationships with environmental factors. By studying the ecological factors and their spatial patterns, we can make reasonable inferences about the distribution of soil properties without needing many samples [13,15,16]. Some soil organic carbon (SOC) distribution studies employ various methods and techniques to assess and map SOC content across landscapes. These studies often consider factors like sampling methodology, the accuracy of results, and data interpolation techniques to understand SOC distribution patterns comprehensively. Interpolation methods, such as linear regression, are commonly used to estimate SOC values at unsampled locations based on observed data [17].
The geostatistical method is a powerful approach for estimating soil carbon reserves by leveraging spatial relationships and interpolation techniques. It allows for more accurate estimations at medium and minor scales, mainly when sample data are limited, and can provide valuable information for land management and carbon sequestration assessments [18]. The spatial soil organic carbon (SOC) distribution from point survey data can be estimated using various interpolation methods and incorporating additional spatial variables [19]. Geographically weighted regression kriging (GWRK) is an interpolation method that includes spatial parametric non-stationarity, the relationship between target and explanatory variables, and the spatial autocorrelation of residuals. It is a popular approach for addressing spatial variability and capturing local spatial patterns in the data [20]. One such method is ordinary kriging (OK), which combines the principles of regression analysis and geostatistical analysis. Additionally, spatial variables such as normalized difference vegetation index (NDVI), vegetation temperature, and digital elevation model (DEM) are utilized to improve the accuracy of SOC estimation [21,22]. Soil organic carbon (SOC) in croplands is essential for mitigating food security and climate change [23]. The presence of SOC in cropland soils significantly impacts crop productivity and yield stability, with implications for global food production and agricultural sustainability. The aim of this study is (1) to determine the mapping of spatial distribution of soil organic carbon using the ordinary kriging (OK) method; (2) to use the weighted overlay tool for spatial modeling of soil organic carbon between environmental variables and climatological data; and (3) to analyze the spatial distribution of soil organic carbon with the land use map in the high Andean ecosystem of Puno–Peru.

2. Materials and Methods

2.1. Study Site

The study was carried out in the Colpanemayo micro-watershed, jurisdiction of the J. D. Choquehuanca district, province of Azángaro, Departamento de Puno (UTM WGS84 19S coordinates N = 8,346,000 m and E = 356,000 m), located in the high Andean ecosystem of Peru, with an area of 1690.09 hectares, and altitudes ranging from 3942 to 4695 masl (Figure 1). The average annual precipitation in the Andean varies from 689 to 824 mm, and the average temperature ranges from 5.6 to 8.2 °C [24]. It is in the subtropical humid montane–subtropical forest life zone [25]. The sources of information collected are shown in (Table 1). The principal activities are cattle ranching and agriculture. Because of the frigid and subhumid climate, the dominant vegetation in the upper part is dense ichu grassland and dense chiji grassland. In the middle part, lush crespillo grassland and dense ichu grassland predominate. The lower part, with more excellent anthropic activity and multiple land use, contains semi-dense ichu grassland, semi-dense crespillo grassland, semi-dense tisna ichu grassland, and semi-dense chilligua grassland, among crops of forage oats, lucerne, and potato [26,27]. The geology of the region is characterized by its origin (Quaternary and Cretaceous periods), formed by sedimentary deposits of limestones, dolomites, clayey sands, and conglomerates and igneous rock volcanic deposits, and granite [28].

2.2. SOC, Environmental Variables, and Climatic Data Processing Workflow

Data were processed to determine and map the spatial distribution of soil organic carbon. The methodology flowchart is shown as Figure 2.

2.3. Soil Organic Carbon (SOC) Estimation

The method of selection of the sampling sites was by free mapping according to the guidelines of (D.S.) N° 013-2010-AG [29]. Twenty sampling points were obtained from three soil depths of 0–20 cm, 20–45 cm, and 45–105 cm (Figure 3 and Table 2), and were calculated using Equation (1):
N u m b e r   o f   s a m p l e s = 0.30 × A r e a   h a 100 × 2
Systematic sampling aims to design and produce a map of the points selected on the base map. A sample of two kilograms of topsoil was taken from the surface layer (0 to 20 cm); half of this sample was separated for physicochemical analysis, and the other half for evaluating the stoniness correction factor. The coordinates of each point were georeferenced with a Global Positioning System (GPS), and the land use and type of management at each site were recorded. Soil samples were dried at ambient temperature in the shade and sent to the laboratory for analysis of organic matter, pH, and apparent density (pipette method). Organic matter was assessed by the soil organic carbon oxidation method [30]. This method detects between 70 and 84% of total organic carbon, so it is necessary to incorporate a correction factor, which may vary from soil to soil. Total organic carbon was estimated by dividing the percentage of organic matter (%OM) by the Van Bemmelen factor (1.724137931), which results from the assumption that OM contains 58% of organic carbon, as shown in Equation (2):
% O C = % OM 1.724137931 × 0.01
The soil organic carbon reserves (SOCr) were calculated for mineral soils by Equation (3):
S O C r = p × A D × O C × C F p d
where, SOCr = soil organic carbon reserve of the horizon or layer thickness (Kg/m2); OC = organic carbon concentration, obtained from laboratory analysis (g/g soil); p = horizon depth or layer thickness (m); AD = apparent density (Kg/m3); and CFpd = Stoniness correction factor (1 − % stones)/100), which represents particles larger than 2 mm in the layer (gravels and stones), which was applied on samples that presented this particle size [31].

2.4. Geostatistical Analysis and SOC Prediction by Ordinary Kriging

The spatial interpolation method of ordinary kriging finds the best linear estimate of a random variable with second-order stationarity with a constant unknown mean [32]. Equation (4):
Z ^ x 0 = i 1 n λ i Z x i ,   i 1 n λ i = 1
where, Z ^ x 0 is the kriging estimated value at an unsampled point x 0 ; Z x i is a fundamental value at an equine point x i ; and λ i is the weight of the factor Z x i .
Its estimation error R x 0 , is given by Equation (5):
R x 0 = Z ^ x 0 Z x 0 = i 1 n λ i Z x i Z x 0
where, Z x 0 is the actual value at the point x 0 .
This method derives a single semivariogram from all the data, representing the spatial covariance structure within the study area. Assuming the stationarity of process, the prediction is limited to observations in the neighborhood of any unknown point. Its weights are obtained by minimizing its prediction error under an unbiased condition [33] The variance of the prediction σ 2 ( x 0 ) (the minimized mean squared error), is calculated at each location by Equation (6):
σ 2 x 0 = 𝛹 + i 1 n λ i γ x i , x 0
where, 𝛹 is the Lagrange multiplier, and 𝛾 () is the semivariogram model.
The ordinary kriging method assumes an unknown constant average. Data points need to be sampled from a continuous phenomenon in space. Important parameters include a suitable transformation, a possible trend elimination surface, covariance/semivariogram models, and similar searches [34]. The ArcGIS geostatistical analysis tool allows changes to be applied to the data to aid in making variances more constant and normalizing data; in this case, the log transformation is applied to the measured organic carbon data, a condition closer to a normal distribution [35].
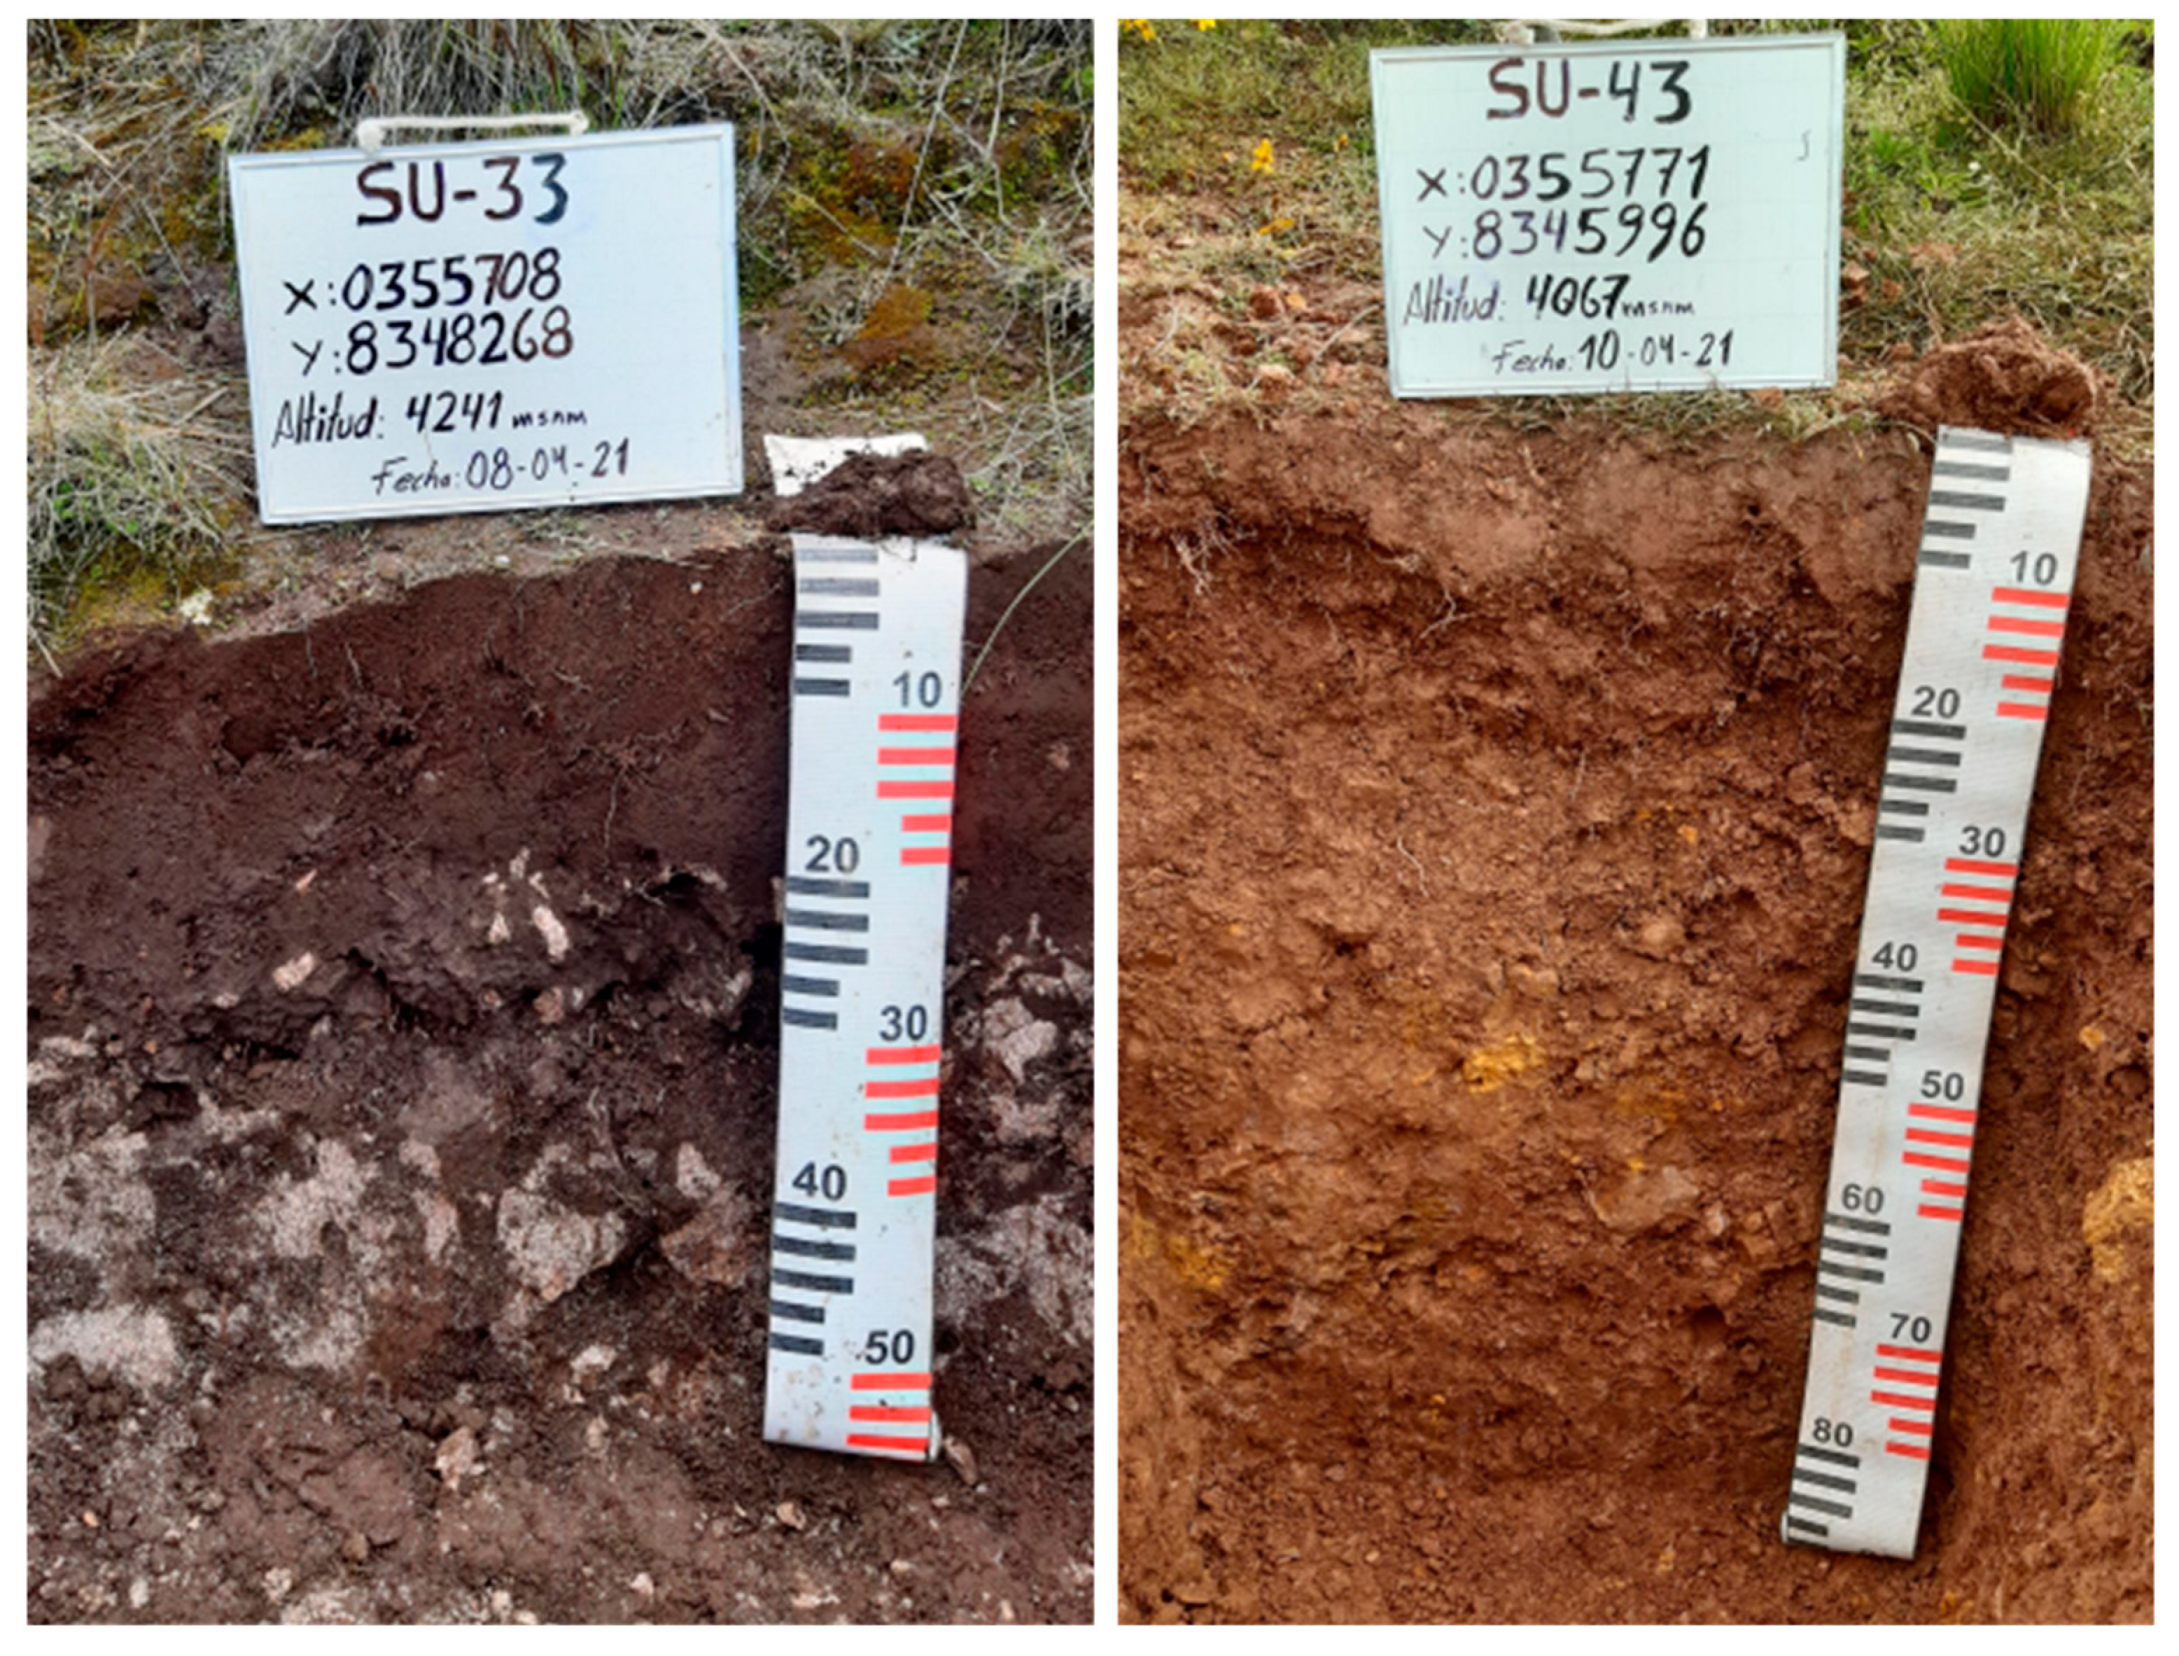
Based on the information provided, Figure 3 shows the process of sampling a test pit. The test pit was excavated within a timeframe of approximately ten hours by two individuals. The subsequent steps involved in the process, including sampling and obtaining some characteristics and parameters, were conducted at a rate of around one and a half hours per pit.

2.5. Climate Data Processing

The information corresponds to Servicio Nacional de Meteorología e Hidrología (SENAMHI) from 1981 to 2021. The data were downloaded in raster format with a spatial resolution of 100 m, with climatic information in each cell for each climatic variable of precipitation and temperature. For the analysis of these climatological data, we have taken into consideration the dominant factors that modulate rainfall at the national level, which include atmospheric circulation systems on a synoptic scale, sea surface temperature patterns and ocean currents, as well as local topographic, orographic, and hydrographic factors.

2.6. Landsat 8 OLI Data Processing

Landsat 8 acquires data over the Earth’s surface every 16 days with an 8-day offset from Landsat 7. This study selected four consecutive pairs of Landsat 8 OLI and Landsat 7 ETM + Level 1 terrain-corrected (L1T) products over Azangaro–Puno [36].
The normalized difference vegetation index (NDVI) can be defined as a parameter calculated from reflectance values at different wavelengths and is relatively susceptible to vegetation cover [37]. Equation (7):
N D V I = I R R I R + R
IR = infrared band pixel values; R = red band pixel values, and NDVI was calculated from Landsat 8 OLI satellite images with algebraic operations of spectral bands 4 and 5 of 30 m spatial resolution.

2.7. Pearson Correlation SOC, Environmental Variables, and Climate Data

To evaluate the degree of linear association between the soil organic carbon (SOC) content and the variables that explain the distribution and spatial variability [38], the Pearson correlation coefficient is calculated. This measures the statistical relationship between two continuous variables, ranging from +1 to −1. A value of 0 indicates that there is no association between two variables; values >0 indicate a positive association, i.e., as the value of one variable increases, so does the value of the other; a value <0 indicates a negative relationship, i.e., as the value of one variable increases, the value of the latter decreases.

2.8. Terrain Attribute Derivation

A digital terrain model (DTM) aids in understanding the spatial distribution of SOC by providing elevation data. Soil properties, including SOC content, are often influenced by topographic factors such as slope aspect, position, and drainage patterns [39]. By integrating the DTM with soil sampling and analysis, researchers can assess the relationship between SOC content and topographic variables. This information helps make informed decisions about and use agricultural practices and carbon management [40].
To predict the terrain attributes related to soil organic carbon (SOC), a total of 7 sets of terrain derivatives were employed. These derivative variables were derived from a digital elevation model (DEM) with acquired data produced by PALSAR, one of three instruments on the Advanced Land Observing Satellite-1 (ALOS), also known as DAICHI, which was developed to contribute to the fields of mapping, precise regional land-coverage observation, disaster monitoring, and resource surveying. Data are available at (https://search.asf.alaska.edu/, accessed on 4 February 2023) with a spatial resolution of 12.5 m. The derivatives are elevation slope (in %) processed with GIS Tools.

2.9. Weighted Overlay Technique

The weighted overlay is one method of modeling suitability. GIS uses the following process for this analysis. Assigning a weight to each raster in the overlay process allows the user to control the influence of different criteria in the suitability model.
The weighted overlay technique is a spatial modeling approach that combines multiple layers of spatial data, assigning weights to each layer to analyze their combined influence on a specific phenomenon, such as soil organic carbon (SOC) content. The weighted overlay analysis for identifying suitable locations utilizes a scale from 1 to 9, where 9 represents the best, and 1 is the worst suitability for each category [41]. The weighted overlay analysis facilitates the identification of suitable locations by generating a composite suitability map in different applications in raster data.

3. Results

3.1. Spatial Distribution of Soil Organic Carbon

Table 3 displays the results obtained from laboratory analysis of soil organic carbon (SOC), organic matter (OM), climatological data variables, and elevation. Soil organic carbon is partially controlled by exposure to physical and environmental conditions such as land use, slope, altitude, and climatology [42,43,44]. Geostatistical analysis helps us understand the distribution of soil organic carbon stocks and their spatial distribution [34]. Figure 4a allows us to visualize the result of the spatial distribution of SOC between 0 and 20 cm depth in the upper part of the micro-watershed. In the upper part, the highest amount of SOC stock is observed between 4.53 Kg/m2 and 6.81 Kg/m2, which represents an area of 531.51 hectares. In the middle part of the micro-watershed, the SOC stock is between the values of 3.88 Kg/m2 and 4. 53 Kg/m2 and represents an area of 780.72 hectares. In the lower part of the watershed, the SOC values decrease from 1.93 Kg/m2 to 3.88 Kg/m2 and represent an area of 377.85 hectares. The results indicate that altitude and climatological variables such as precipitation and temperature play important roles in assessing SOC storage. The spatial distribution of SOC stocks corresponds to different altitudinal zones within the micro-watershed, suggesting that altitude influences SOC accumulation.
Nevertheless, the consistent pattern of decreasing SOC reserves with increasing soil depth aligns with the general understanding of SOC dynamics. It can provide valuable insight into land management and soil conservation strategies. It highlights the need to focus on preserving and enhancing SOC reserves in the surface layers, where they are more abundant, and adopting practices that minimize SOC depletion in deeper soil horizons.
The upper part of the micro-watershed shows the highest SOC stocks, ranging from 2.71 Kg/m2 to 4.17 Kg/m2, covering an area of 250.04 hectares. The middle part has SOC stocks ranging from 1.97 Kg/m2 to 2.71 Kg/m2, covering an area of 856.56 hectares. The lower part of the watershed has decreasing SOC values, ranging from 0.79 Kg/m2 to 1.97 Kg/m2, covering an area of 583.43 hectares.

3.2. Environmental and Climate Data Variables on Soil Organic Carbon

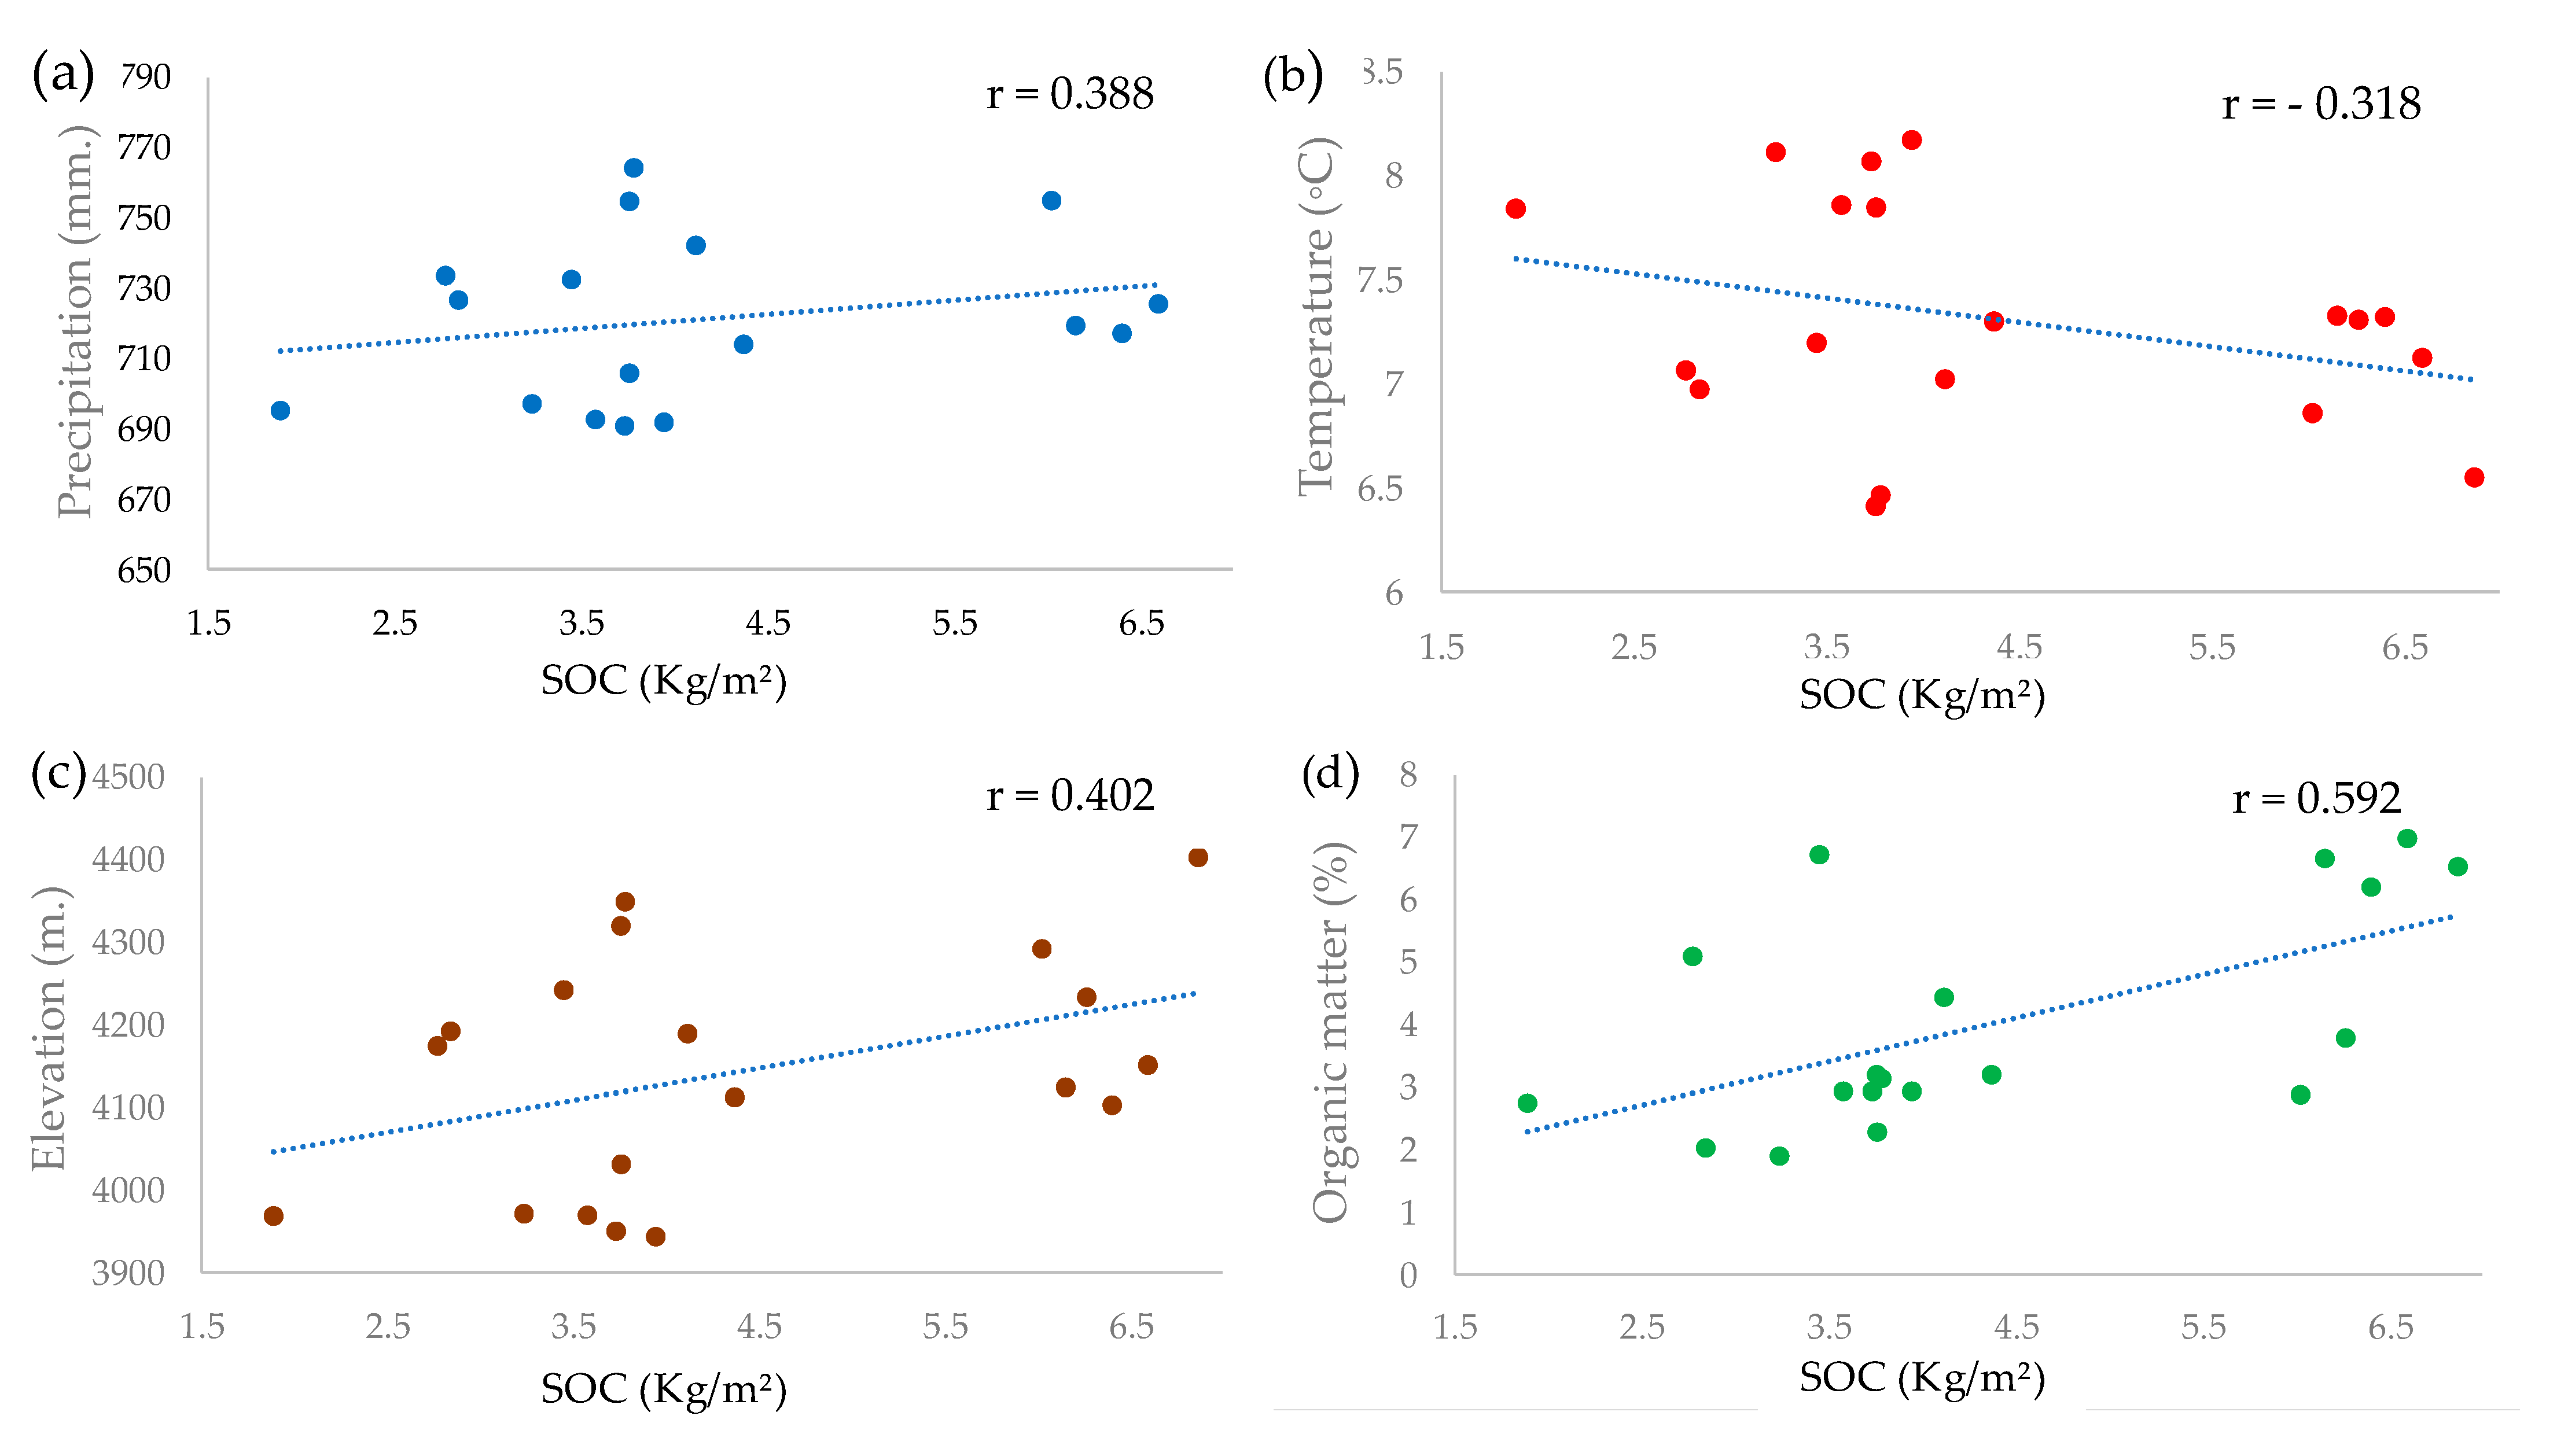
Figure 5a shows a direct relationship between precipitation and SOC (carbon organic soil) content, as indicated by Pearson’s linear correlation coefficient of (r = 0.388), confirming the positive trend that higher precipitation is associated with higher SOC content in the soil. The figure shows the trend of increasing SOC with rising precipitation, which promotes a higher accumulation of SOC due to the development of vegetation and other physical factors promoted by the same Figure 6a. On flat, undulating land of moderate slope, the predominant vegetation is mainly perennial grasses due to precipitation and higher humidity Figure 6b. The percentage of bare soil is lower, and the vegetation cover is higher [45]. Precipitation is a primary water source for vegetation and is crucial in supporting plant growth and productivity. Adequate water availability allows plants to photosynthesize and produce organic matter, eventually contributing to the soil’s build-up of SOC. (Figure 6c) shows the spatial variability of precipitation.
Figure 5b, regarding the relationship between temperature and soil organic carbon, shows a weak inverse linear relationship (r = −0.318), which indicates that the lower the soil temperature, the higher the accumulation of SOC, facilitating the formation of the surface layer of the grassland soil [46]. The results obtained agree with the findings, which indicate that the variation in soil carbon stocks is mainly related to the decrease in temperature [47]. Figure 6d shows the spatial variability of temperature.
Figure 5c shows a direct linear correlation (r = 0.402) between SOC storage and altitude, indicating a relationship between these variables in the study area. Specifically, it suggests that the SOC content also increases as altitude increases. A study assessed higher carbon stocks in shrubland ecosystems at higher altitudes and lower carbon stocks at lower altitudes, with a correlation of (r = 0.75), and this suggests a strong relationship between elevation and carbon stocks in shrubland ecosystems [46]. The finding of higher SOC (carbon organic soil) stock in forests and lower SOC stock in grasslands, along with a decreasing trend in SOC from higher to lower altitudes, aligns with several factors that influence organic carbon storage patterns [48]. The finding that the soil organic carbon (SOC) storage capacity of high Andean natural grasslands is controlled by the altitudinal gradient and soil temperature, with higher altitudes associated with higher SOC storage capacity, is consistent with other factors [49].
Figure 5d, shows the correlation result of (r = 0.592) between soil organic matter and SOC (carbon organic soil) content, indicating a moderate positive relationship between these two factors. This means there is a general tendency for the SOC content to increase as the soil organic matter content increases.

3.3. Modelling of Soil Organic Carbon Weighted Overlay Technique

To carry out the weighted overlay technique, we assigned weights to each factor based on climate data analysis and environmental variables to assess the appropriate spatial distribution of soil organic carbon (Table 4). The weights should add up to 100%. Factors with higher relevance receive higher weights, while factors with lower relevance receive lower weights (Table 5).
The results of spatial modeling and weighted overlay analysis were conducted to determine the spatial distribution of soil organic carbon (SOC) in the high Andean ecosystem of Puno–Peru, Peru. The research used various thematic maps and variables, including land use, precipitation, temperature, and slope. The objective was to understand the distribution of SOC across different soil profiles. Figure 7a represents the soil profile of 0–20 cm and shows coherent results based on the weightings assigned to the variables. In the lower part of the basin, where intense agricultural activities by the original population have occurred, SOC values are less than 3 Kg/m2. In the middle portion of the study area, which experiences minimum agricultural activity, SOC values range from 3 Kg/m2 to 5 Kg/m2. As expected, the upper parts of the micro-watershed, with no agricultural activity, exhibit the highest SOC reserves, ranging from 5 Kg/m2 to 6.8 Kg/m2. The mean values represent over 50% of the total study area. For the soil profile of 20–45 cm (Figure 8b), SOC reserves decrease throughout the site. This decline is attributed to the absence of direct vegetation cover and the limited impact of the variables used, considering the depth of this horizon. SOC values in this profile range from less than 2 Kg/m2 to 4.2 Kg/m2.
Regarding the 45–105 cm horizon, SOC values across the area range from 0.87 Kg/m2 to 2.65 Kg/m2. These results indicate that deeper soil layers have fewer carbon reserves.
The results include sampling points and corresponding SOC values for two soil depths. The spatial distribution of these values aligns with the determined SOC values, thereby validating the efficiency and accuracy of the modeling approach and weightings used. These findings contribute to a better understanding of the soils in the Puno region, enabling improved management and sustainable use of agricultural and livestock activities. Overall, the study provides insights into the spatial distribution of SOC in different soil profiles, which can guide decision-making processes for soil management and sustainable agricultural practices in the high Andean ecosystem of Puno–Peru.
Additionally, climatological variables, particularly precipitation and temperature, contribute to the observed patterns. In the same way, regarding the spatial distribution of SOC at 20–45 cm depth (Figure 7b), the organic carbon reserves have decreased concerning the results of the SOC of the first horizon of 45–105 cm. Figure 7c provides a visualization of the spatial distribution of SOC stocks in the micro-watershed.

3.4. Land Use and SOC Spatial Distribution

Over time, land use change and soil organic carbon (SOC) stock depletion pose significant environmental challenges worldwide. These challenges are close to global warming and the need to ensure food production for a growing global population [50]. The interrelationship of land use and SOC dynamics is significant for recommending sound land management practices and mitigating the impact of climate change at local and regional levels [51].
Research conducted on changes of use in ecosystems of the highlands points out that changes in vegetation cover make the soil vulnerable to degradation by compaction, erosion, and carbon dioxide emissions associated with an increased anthropogenic activity. Because of this behavior, it is essential to indicate that land use and management are among the most critical determinants of the SOC stock [52]. The results are in agreement with another study which means as limiting factors in carbon sequestration, the net primary production, forest composition, and climate (temperature and humidity); and reducing factors, including erosion, deforestation, and land use, which can decrease the accumulation of carbon in the soil [53].
The lowest COS content rates were found in the lower part of the micro-watershed, ranging from 1.93 Kg/m2 to 3.88 Kg/m2, and this was assessed in the alluvial part, located in the southern part of the study area and representing 22.4% of the total area. The soils are moderately deep, with an apparent density of compaction that varies from 1.32 to 1.54 g/cc. Of intensive use, especially for agriculture that has generated less SOC content, apart from the existence of wetlands, grasslands, and rocky outcrops, its altitudes vary from 3942 to 4186 m, the annual precipitation is the lowest in the micro-basin that varies between 689.55 and 726.25 mm (Figure 6c).
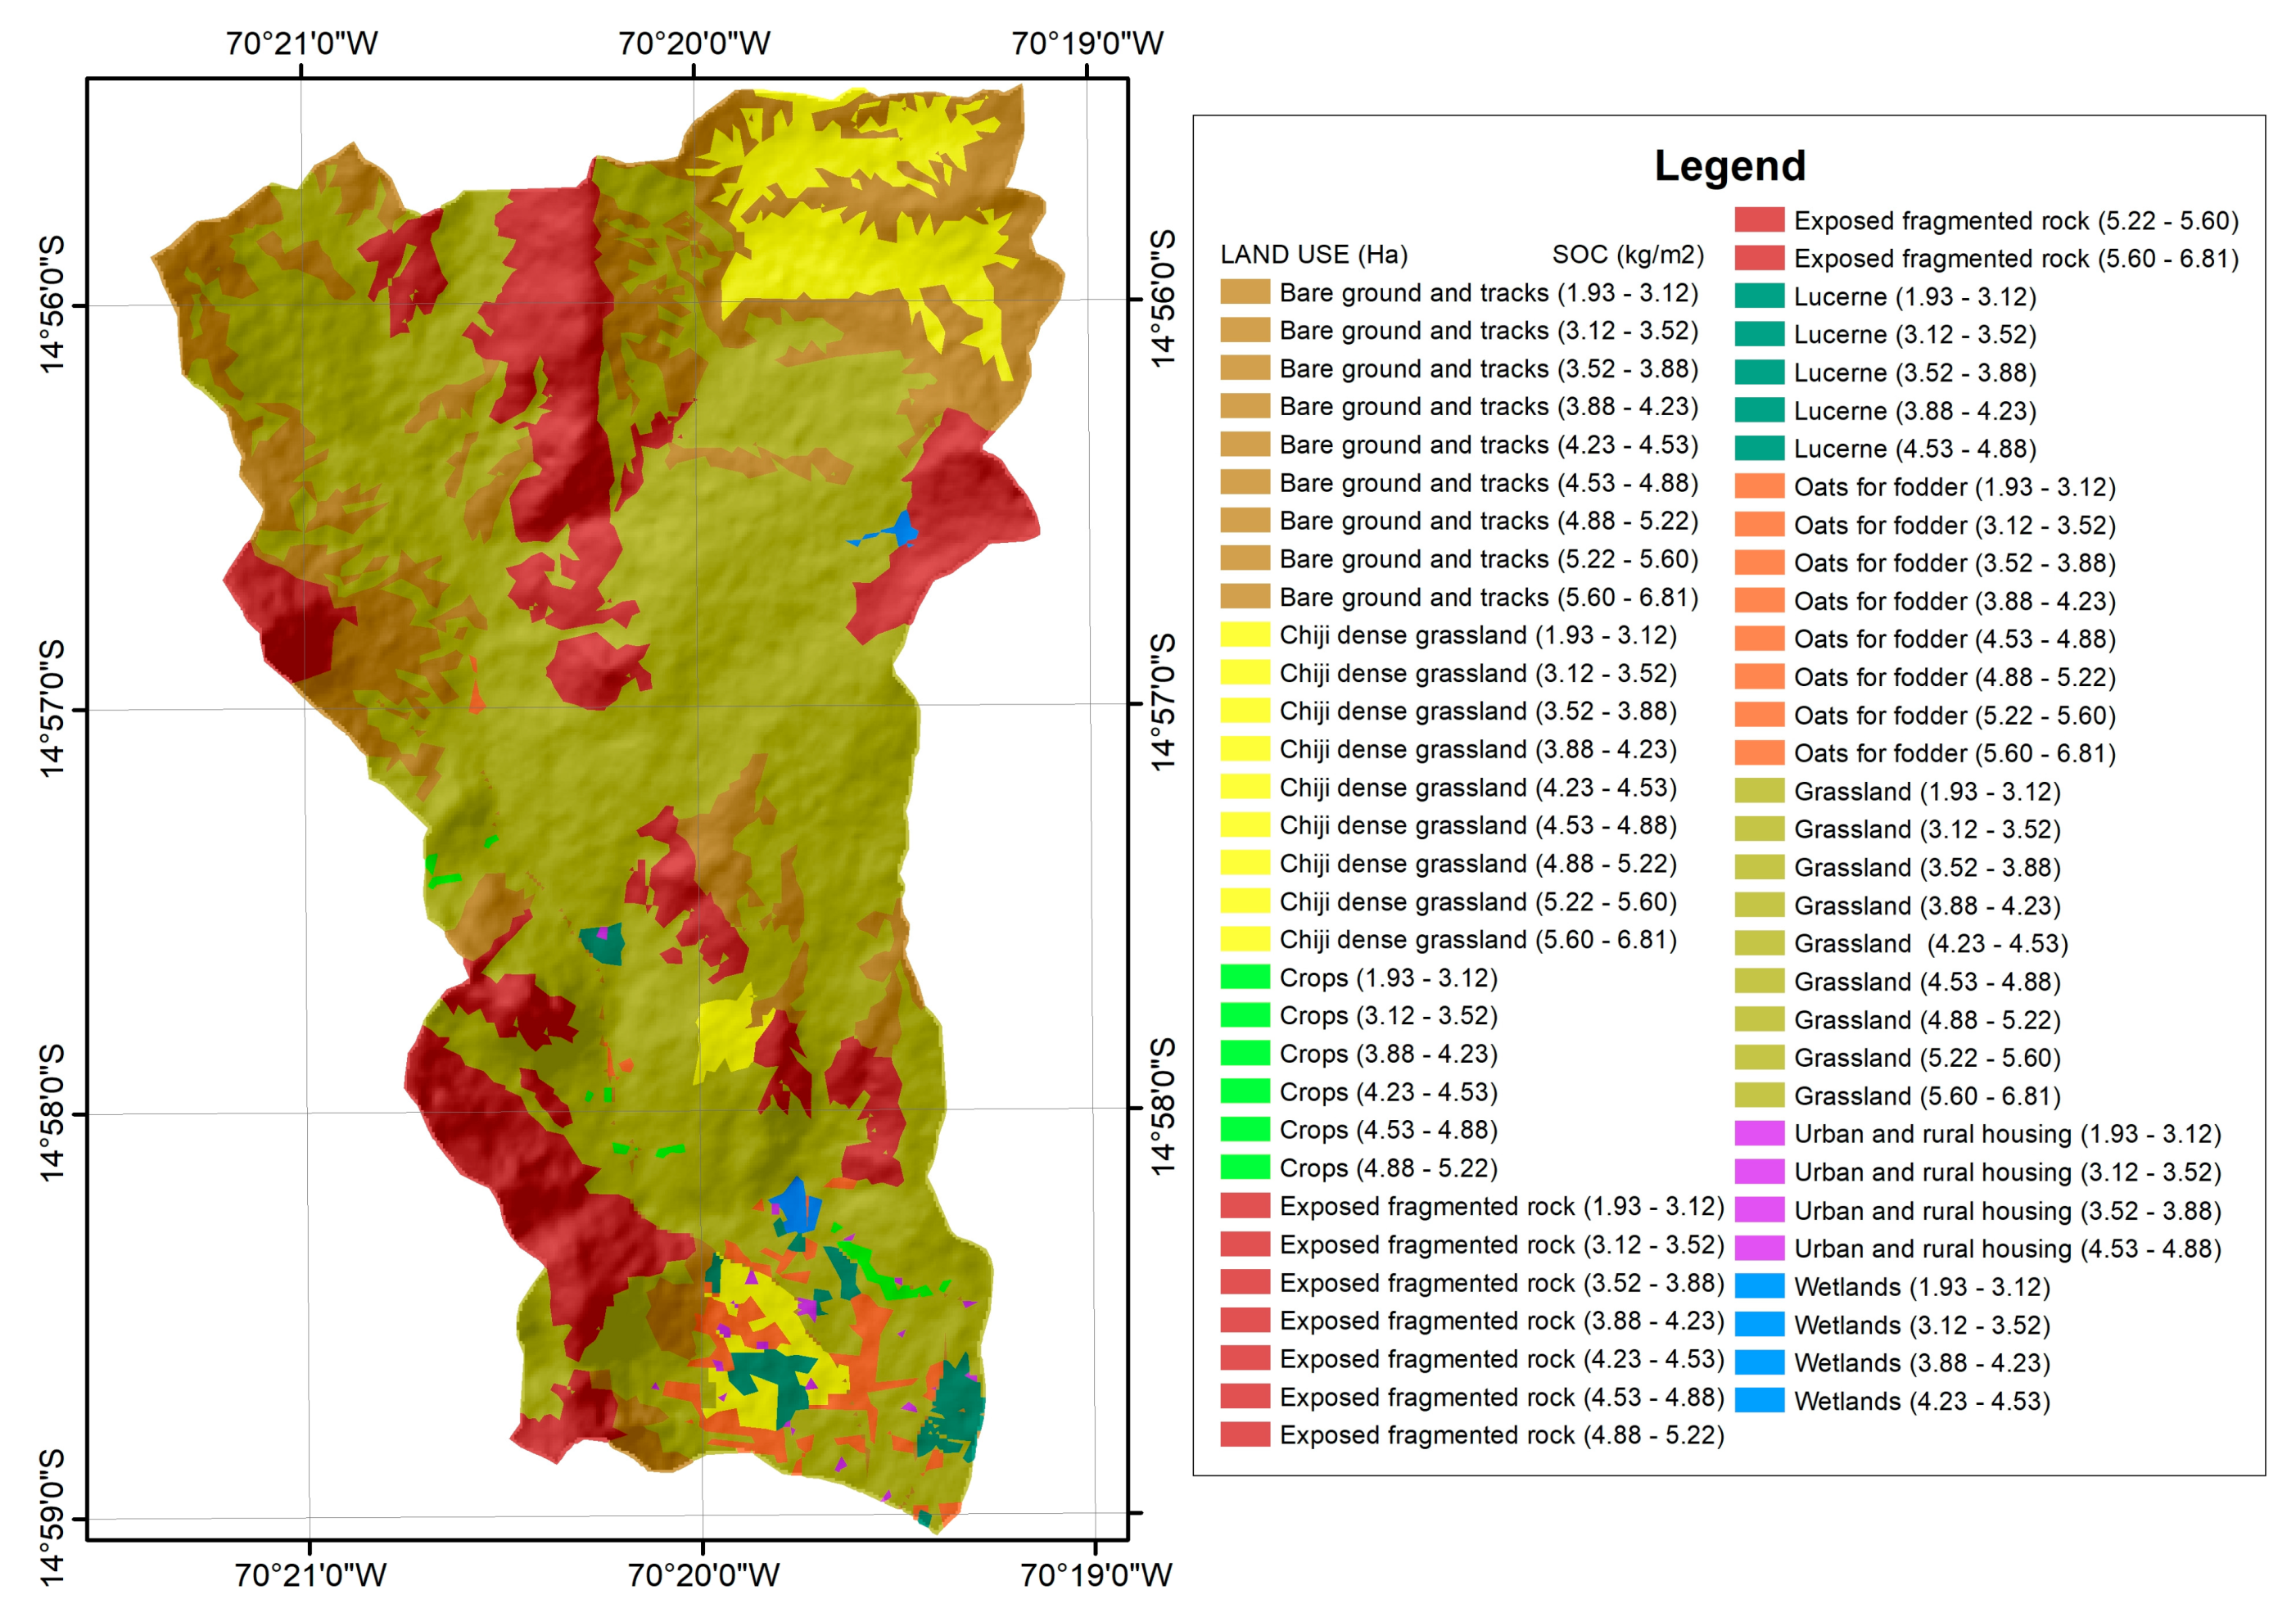
On the other hand, in the middle part of the study area, the SOC rate varies from 3.88 Kg/m2 to 4.88 Kg/m2, is considered an intermediate rate, and occupies 46.20% of the total area. The soils are superficial to medium deep, with less intensive use than the alluvial or lower part; due to the limited anthropic activity and the frigid climate, it has generated and captured a moderate SOC content, extending from 4255 m to 4400 m with a marked increase of the average annual precipitation between 726.25 and 760.85 mm and an evident decrease of the average temperature from 3.88 to 4.88 °C. In this zone, anthropic intervention decreases significantly, and land use is limited to pastures, dense ichu grassland, dense crespillo grassland, sparse tisna ichu grassland, semi-dense tisna ichu grassland, wetland, semi-dense ichu grassland, and fodder oats that occupy small areas, as well as shrublands and bare soil that are decreasing (Figure 8).
And finally, the SOC rate in the upper part of the micro-basin varies from 4.88 Kg/m2 to 6.81 Kg/m2, which covers 31.40% of the total area. The soils are superficial, with less intensive use due to the limited anthropic activity and frigid climate and have generated and captured a high content of SOC. The area extends from 4400 m to 4695 m of altitude, and with an average annual rainfall of 760.85 to 823.91 mm is considered the highest for the micro-watershed. The mean annual temperature varies from 7.36 to 8.17 °C. In this zone, anthropic intervention decreases significantly, and land use is limited to pastures such as dense ichu grassland, dense chiji grassland, sparse tisna ichu grassland, and the area of wasteland decreases considerably. In this way, it is conceived that areas with little anthropogenic intervention do not alter the composition and structure of the ecosystem and thus increase the provision of ecosystem services and SOC (Figure 8).

4. Discussion

Soil organic carbon (SOC) is crucial in global carbon cycling and climate regulation. However, quantifying the amount of SOC in agricultural soils can be challenging due to the inherent spatial distribution [54,55]. Identifying soil organic carbon (SOC) levels and assessing the potential of SOC storage in ecosystems that are challenging to sample and study are crucial for understanding the global reserves of SOC [56].
The soil organic carbon (SOC) in the deeper layers of soil in the studied ecosystem can be attributed to some factors, including the temperatures associated with high-altitude environments, which can have a significant impact on SOC storage. Cold temperatures slow down microbial activity and decomposition processes leading to the preservation of organic matter in the soil; the reduced decomposition rates allow for the accumulation of SOC over time, particularly in the deeper layers where microbial activity is further limited [57,58].
Climatological and environmental factors play a crucial role in shaping ecosystems, influencing weather patterns, and affecting the overall well-being of organisms on Earth.
The findings confirm the significant influence of climatological variables on SOC distribution. Higher altitudes, more considerable precipitation, and lower temperatures are associated with increased SOC content; these factors create favorable conditions for biomass production, organic matter accumulation, and SOC retention.

4.1. Vegetation Cover

Land use practices that maintain or enhance vegetation cover, such as forests and grasslands, generally support higher levels of SOC [59]. Plant biomass and organic residues contribute to increased organic matter input and subsequent SOC accumulation.
SOC estimates using statistical methods have been instrumental in identifying that the Andean areas, specifically the studied region, exhibit significant variations in soil organic carbon (SOC) [60,61]. Using Pearson’s statistical method, we determined the association between SOC and precipitation, temperature, altitude, and organic matter have acceptable correlations in our study of 0.38, −0.32, 0.40, and 0.59. These results were used to apply weighting criteria for climatological and environmental variables to model the spatial variability of SOC reserves. Computational modeling plays a significant role in predicting and understanding the effects of land use changes on soil organic carbon (SOC) dynamics [62].

4.2. Geostatistical Analysis

Using the ordinary kriging geostatistical method enables the spatial characterization of SOC across the study area [20]. This technique allows for interpolating SOC values between sampling points, providing a continuous representation of SOC distribution. This information is valuable for identifying hotspots of high SOC stocks and areas with lower SOC content, which can inform land management decisions and targeted conservation efforts. ArcGIS weighted overlay tool is handy for analyzing, mapping, and assessing spatial variability in different applications of the environment [63]. In this case, it has been used to determine soil organic carbon (SOC) by integrating multiple factors and providing a local understanding of the spatial distribution of SOC in the high Andean ecosystem of Puno–Peru.
The results of interpolating the three soil profiles show a consistent pattern concerning the sampling points and the depth of the soil profiles. The following observations can be made for depth-wise variation: soil organic carbon (SOC) values vary with soil depth. Moving from the surface (0–20 cm) to deeper horizons (20–45 cm and 45–105 cm), there is a decreasing trend in SOC reserves. This observation aligns with the general understanding that SOC content tends to decrease with increasing soil depth. Spatial variability interpolated values indicate spatial variability in SOC reserves within the micro-watershed of the study area. The range of values for each depth interval (0–20 cm, 20–45 cm, and 45–105 cm) suggests that there are areas with higher SOC reserves (e.g., 6.81 Kg/m2 at 0–20 cm) and regions with lower SOC reserves (e.g., 1.93 Kg/m2 at 0–20 cm). This spatial variability could be influenced by various factors such as land use, vegetation cover, soil management practices, landscape characteristics, and depth-dependent trend. The decreasing trend in SOC reserves with increasing soil depth aligns with the general understanding of soil dynamics and organic matter decomposition. Surface layers typically receive more organic input (e.g., plant residues) and experience higher biological activity, leading to higher SOC content. Moving deeper into the soil profile, organic input diminishes, and decomposition processes dominate, resulting in lower SOC reserves.
Understanding the relationship between altitude, land use, and SOC content is crucial for land management and carbon sequestration efforts [49]. It highlights the potential of grasslands and abandoned arable land in storing carbon and emphasizes the need for sustainable land-use practices to maintain and enhance SOC stocks, particularly in higher altitude regions [64]. The estimated spatial variability of SOC (carbon organic soil) in the micro-watershed reveals an increasing trend from south to north, specifically within the 0–20 cm depth profile. In this region, SOC values range from 1.93 Kg/m2 to 6.81 Kg/m2. The mountainous part of the micro-watershed, characterized by the presence of Stipa ichu grasslands, exhibits high SOC values. For the profile horizons of 0–45 cm and 45–105 cm, the behavior of the SOC content is similar, indicating that the distribution and trends of SOC accumulation are consistent across both horizons.
Regarding soil degradation, intensive agriculture often involves over-tillage, intensive agrochemicals, and monoculture, which can degrade soil quality and fertility [65]. Soil erosion, nutrient depletion, and compaction are expected consequences of intensive agricultural practices, affecting the lack of soil organic carbon stocks [66].
These findings highlight the importance of considering local variations in SOC content, which are influenced not only by vegetation type but also by land use and management practices. Sustainable land management practices that promote organic matter accumulation, such as agroforestry, conservation agriculture, and improved grazing management, can help restore and enhance SOC levels in areas affected by land use changes and anthropogenic activities.

5. Conclusions

The study collected 53 soil samples from 0–105 cm depths. These samples were analyzed to determine the soil organic carbon (SOC) content in Kg/m2 and percentage of organic matter (OM) content.
The study employed a weighted overlay analysis using ArcMap version 10.5 software. Weighting criteria were applied to the climatological and environmental variables, taking into account the correlations obtained from the statistical analysis. This approach helps model and map the spatial variability of SOC in Kg/m2 across the study area.
The correlation results provided insights into the relationships between SOC and the mentioned variables. However, correlation does not imply causation, and other factors not included in the analysis could also influence SOC levels. It is important to consider the complexities of soil systems and the interactions among multiple environmental variables when interpreting these correlations.
The impact of agricultural activity indicates that areas with intensive agrarian use exhibit lower SOC stocks, with values ranging from 0–3 Kg/m2. This suggests that agricultural practices may have led to carbon loss, including soil disturbance, reduced organic matter input, and the influence of land use. Areas without agricultural activity, likely representing natural ecosystems, showed higher carbon stocks ranging from 3 to 7 Kg/m2. Highlights are the importance of preserving these areas to maintain SOC levels and promote carbon sequestration. The study’s implications and significance contribute to understanding the spatial distribution of SOC in the high Andean ecosystems of Puno, Peru. It provides valuable insights for sustainable land management, highlighting the impact of agricultural activity on SOC stocks and the importance of considering climatological and environmental factors in SOC modeling and mapping. The findings emphasize the need for informed land use decisions, conservation strategies, and practices that enhance SOC storage and promote ecosystem health.
Finally, the study contributes to understanding of SOC dynamics in the Peruvian Andes, emphasizing the role of land use, climatic factors, and organic matter content in shaping SOC distribution. The results underscore the importance of sustainable land management practices to preserve and enhance SOC stocks, which affect the region’s agricultural productivity, carbon sequestration, and ecosystem sustainability.

Author Contributions

Conceptualization, D.C., E.C., W.C. and F.C.; Investigation, E.C., D.C., W.C., W.H. and O.C.; Methodology, E.C., D.C. and C.C.; Formal analysis, D.C., E.C., W.C., W.H. and C.C.; Data curation, E.C., W.C., F.C. and C.C.; Validation, E.C., C.C. and O.C.; Project administration, E.C., W.H. and C.M.; Visualization, E.C., D.C., F.C., C.M., O.C. and W.H.; Resources, E.C., F.C., C.M. and C.C.; Software, E.C., D.C. and C.C.; Supervision, E.C., D.C. and F.C.; Funding acquisition, E.C., D.C., F.C., O.C., C.M., C.C. and W.H.; Writing—original draft, E.C., D.C., W.C. and W.H.; Writing—review and editing, E.C., D.C., W.C., F.C., O.C., C.M., C.C. and W.H. All authors have read and agreed to the published version of the manuscript.

Funding

This research received no external funding.

Institutional Review Board Statement

Not applicable.

Informed Consent Statement

Not applicable.

Data Availability Statement

Not applicable.

Acknowledgments

The authors thank Servicio Nacional de Meteorología e Hidrología–Perú (SENAMHI). Also, it is always important to acknowledge the contributions and support of individuals and organizations who have helped to complete a research project or manuscript. The authors appreciate the support of the Universidad Nacional del Altiplano–Puno (UNA-PUNO). Finally, the authors express their gratitude to Elmer Calizaya.

Conflicts of Interest

The authors declare no conflict of interest.

References

  1. Dhakal, S.; Koirala, M. Effect of Land Use Change on Soil Organic Carbon Stock in Balkhu Khola Watershed Southwestern Part of Kathmandu Valley, Central Nepal ClimateHimalaya View Project Development of Sustainable Energy for Rangelands in the HKH Region View Project Eklabya Sharma International Centre for Integrated Mountain Development. In Proceedings of the WASET ICEESD 2010: International Conference on Energy, Environment, Sustainable Development, Paris, France, 28 June 2010. [Google Scholar] [CrossRef]
  2. Žížala, D.; Minarík, R.; Zádorová, T. Soil Organic Carbon Mapping Using Multispectral Remote Sensing Data: Prediction Ability of Data with Different Spatial and Spectral Resolutions. Remote Sens. 2019, 11, 2947. [Google Scholar] [CrossRef]
  3. Pandian, E.; Ravichandran, P. Altitudinal Variation of Soil Organic Carbon Stock in Tropical Forest of Courtallam Hills, Southern Western Ghats of India. Trop. Plant Res. 2020, 7, 702–714. [Google Scholar] [CrossRef]
  4. Gebrehiwot, K.; Desalegn, T.; Woldu, Z.; Demissew, S.; Teferi, E. Soil Organic Carbon Stock in Abune Yosef Afroalpine and Sub-Afroalpine Vegetation, Northern Ethiopia. Ecol. Process. 2018, 7, 1–9. [Google Scholar] [CrossRef] [Green Version]
  5. Gross, C.D.; Harrison, R.B. The Case for Digging Deeper: Soil Organic Carbon Storage, Dynamics, and Controls in Our Changing World. Soil Syst. 2019, 3, 28. [Google Scholar] [CrossRef] [Green Version]
  6. Hobley, E.; Baldock, J.; Hua, Q.; Wilson, B. Land-Use Contrasts Reveal Instability of Subsoil Organic Carbon. Glob. Chang. Biol. 2017, 23, 955–965. [Google Scholar] [CrossRef] [Green Version]
  7. Ontl, T.A.; Aa, A.A. Soil Carbon Storage. Nat. Educ. Knowl. 2012, 3, 35. [Google Scholar]
  8. Wiltshire, S.; Beckage, B. Soil Carbon Sequestration through Regenerative Agriculture in the U.S. State of Vermont. PLoS Clim. 2022, 1, e0000021. [Google Scholar] [CrossRef]
  9. Li, X.; McCarty, G.W.; Du, L.; Lee, S. Use of Topographic Models for Mapping Soil Properties and Processes. Soil Syst. 2020, 4, 32. [Google Scholar] [CrossRef]
  10. Schimel, D.S.; House, J.I.; Hibbard, K.A.; Bousquet, P.; Ciais, P.; Peylin, P.; Braswell, B.H.; Apps, M.J.; Baker, D.; Bondeau, A.; et al. Recent Patterns and Mechanisms of Carbon Exchange by Terrestrial Ecosystems. Nature 2001, 414, 169–172. [Google Scholar] [CrossRef]
  11. Zhu, A.X.; Liu, J.; Du, F.; Zhang, S.J.; Qin, C.Z.; Burt, J.; Behrens, T.; Scholten, T. Predictive Soil Mapping with Limited Sample Data. Eur. J. Soil. Sci. 2015, 66, 535–547. [Google Scholar] [CrossRef]
  12. Ferraz, A.; Saatchi, S.; Mallet, C.; Jacquemoud, S.; Gonçalves, G.; Silva, C.A.; Soares, P.; Tomé, M.; Pereira, L. Airborne Lidar Estimation of Aboveground Forest Biomass in the Absence of Field Inventory. Remote Sens. 2016, 8, 653. [Google Scholar] [CrossRef] [Green Version]
  13. Kumar, S. Soil Organic Carbon Mapping at Field and Regional Scales Using GIS and Remote Sensing Applications. Adv. Crop Sci. Technol. 2013, 1, 1. [Google Scholar] [CrossRef]
  14. Man, W.; Yu, H.; Li, L.; Liu, M.; Mao, D.; Ren, C.; Wang, Z.; Jia, M.; Miao, Z.; Lu, C.; et al. Spatial Expansion and Soil Organic Carbon Storage Changes of Croplands in the Sanjiang Plain, China. Sustainability 2017, 9, 563. [Google Scholar] [CrossRef] [Green Version]
  15. Chai, X.; Shen, C.; Yuan, X.; Huang, Y. Spatial Prediction of Soil Organic Matter in the Presence of Different External Trends with REML-EBLUP. Geoderma 2008, 148, 159–166. [Google Scholar] [CrossRef]
  16. Minasny, B.; McBratney, A.B. The Matérn Function as a General Model for Soil Variograms. Geoderma 2005, 128, 192–207. [Google Scholar] [CrossRef]
  17. Zhang, Z.; Zhou, Y.; Huang, X. Applicability of GIS-Based Spatial Interpolation and Simulation for Estimating the Soil Organic Carbon Storage in Karst Regions. Glob. Ecol. Conserv. 2020, 21, e00849. [Google Scholar] [CrossRef]
  18. Yang, L.; Luo, P.; Wen, L.; Li, D. Soil Organic Carbon Accumulation during Post-Agricultural Succession in a Karst Area, Southwest China. Sci. Rep. 2016, 6, 1–8. [Google Scholar] [CrossRef]
  19. Bhunia, G.S.; Shit, P.K.; Maiti, R. Comparison of GIS-Based Interpolation Methods for Spatial Distribution of Soil Organic Carbon (SOC). J. Saudi Soc. Agric. Sci. 2018, 17, 114–126. [Google Scholar] [CrossRef] [Green Version]
  20. Ye, H.; Huang, W.; Huang, S.; Huang, Y.; Zhang, S.; Dong, Y.; Chen, P. Effects of Different Sampling Densities on Geographically Weighted Regression Kriging for Predicting Soil Organic Carbon. Spat. Stat. 2017, 20, 76–91. [Google Scholar] [CrossRef]
  21. Mondal, A.; Khare, D.; Kundu, S.; Mondal, S.; Mukherjee, S.; Mukhopadhyay, A. Spatial Soil Organic Carbon (SOC) Prediction by Regression Kriging Using Remote Sensing Data. Egypt. J. Remote Sens. Space Sci. 2017, 20, 61–70. [Google Scholar] [CrossRef] [Green Version]
  22. Fang, X.; Xue, Z.; Li, B.; An, S. Soil Organic Carbon Distribution in Relation to Land Use and Its Storage in a Small Watershed of the Loess Plateau, China. Catena 2012, 88, 6–13. [Google Scholar] [CrossRef]
  23. Lal, R. Soil Carbon Sequestration Impacts on Global Climate Change and Food Security. Science 2004, 304, 1623–1627. [Google Scholar] [CrossRef] [Green Version]
  24. Calizaya, E.; Laqui, W.; Sardón, S.; Calizaya, F.; Cuentas, O.; Cahuana, J.; Min-5 Dani, C.; Huacani, W. Snow Cover Temporal Dynamic Using MODIS Product, and Its 2 Relationship with Precipitation and Temperature in the Tropi-3 Cal Andean Glaciers in the Alto Santa Sub-Basin (Peru) 4. Sustainability 2023, 15, 7610. [Google Scholar] [CrossRef]
  25. Tovar, C.; Seijmonsbergen, A.C.; Duivenvoorden, J.F. Monitoring land use and land cover change in mountain regions: An example in the Jalca grasslands of the Peruvian Andes. Landsc. Urban Plan. 2013, 112, 40–49. [Google Scholar] [CrossRef]
  26. Galán-De-mera, A.; Campos-De-la-cruz, J.; Linares-Perea, E.; Montoya-Quino, J.; Torres-Marquina, I.; Vicente-Orellana, J.A. A Phytosociological Study on Andean Rainforests of Peru, and a Comparison with the Surrounding Countries. Plants 2020, 9, 1654. [Google Scholar] [CrossRef] [PubMed]
  27. Alberto, J.; Becerra, B.; Dantas Bitencourt, M.; Bustamante, J.A.B.; Bitencourt, M.D. Ecological Zoning of an Andean Grasslands (Puna) at the Manu Biosphere Reserve, Peru. Int. J. Environ. Sustain. Dev. 2007, 6, 357–372. [Google Scholar]
  28. De la Cruz Bustamante, N.S. Geología de Los Cuadrángulos de Velille, Yauri, Ayaviri y Azángaro, Hojas: 30-s, 30-t, 30-u y 30-v–[Boletín A 58]. 1995. Available online: https://repositorio.ingemmet.gob.pe/handle/20.500.12544/179 (accessed on 12 May 2023).
  29. MIDAGRI Reglamento Para La Ejecución de Levantamiento de Suelos. 2010. Available online: https://www2.congreso.gob.pe/sicr/cendocbib/con2_uibd.nsf/5E437D4A059A261F052575C4006BE90D/$FILE/ds033_85_ag_reglamento_eje_levantamiento_suelos.pdf (accessed on 30 May 2023).
  30. Shamrikova, E.V.; Kondratenok, B.M.; Tumanova, E.A.; Vanchikova, E.V.; Lapteva, E.M.; Zonova, T.V.; Lu-Lyan-Min, E.I.; Davydova, A.P.; Libohova, Z.; Suvannang, N. Transferability between Soil Organic Matter Measurement Methods for Database Harmonization. Geoderma 2022, 412, 115547. [Google Scholar] [CrossRef]
  31. Penman, J.; Gytarsky, K.S.K.K. Intergovernmental Panel on Climate Change. National Greenhouse Gas Inventories Programme. In Good Practice Guidance for Land Use, Land-Use Change and Forestry; Institute for Global Environmental Strategies for the IPCC: Geneva, Switzerland, 2003; ISBN 4887880030. [Google Scholar]
  32. John, K.; Abraham, I.I.; Kebonye, N.M.; Agyeman, P.C.; Ayito, E.O.; Kudjo, A.S. Soil Organic Carbon Prediction with Terrain Derivatives Using Geostatistics and Sequential Gaussian Simulation. J. Saudi Soc. Agric. Sci. 2021, 20, 379–389. [Google Scholar] [CrossRef]
  33. Bangroo, S.A.; Bhat, M.I.; Wani, J.A.; Rasool, R.; Madhi, S.S.; Bashir, O.; Shah, T.I. Mapping Soil Properties Using Geostatistical Methods for Mid to High Altitude Temperate Zone of Kashmir Himalayas. J. Indian Soc. Soil Sci. 2023, 71, 1–12. [Google Scholar] [CrossRef]
  34. Chabala, L.M.; Mulolwa, A.; Lungu, O. Application of Ordinary Kriging in Mapping Soil Organic Carbon in Zambia. Pedosphere 2017, 27, 338–343. [Google Scholar] [CrossRef]
  35. Dai, F.; Zhou, Q.; Lv, Z.; Wang, X.; Liu, G. Spatial Prediction of Soil Organic Matter Content Integrating Artificial Neural Network and Ordinary Kriging in Tibetan Plateau. Ecol. Indic. 2014, 45, 184–194. [Google Scholar] [CrossRef]
  36. Ke, Y.; Im, J.; Lee, J.; Gong, H.; Ryu, Y. Characteristics of Landsat 8 OLI-Derived NDVI by Comparison with Multiple Satellite Sensors and in-Situ Observations. Remote Sens. Environ. 2015, 164, 298–313. [Google Scholar] [CrossRef]
  37. Zaitunah, A.; Samsuri, S.; Ahmad, A.; Safitri, R. Normalized difference vegetation index (ndvi) analysis for land cover types using landsat 8 oli in besitang watershed, Indonesia. IOP Conf. Ser. Earth Environ. Sci. 2018, 126, 012112. [Google Scholar] [CrossRef]
  38. Carré, F.; Girard, M.C. Quantitative mapping of soil types based on regression kriging of taxonomic distances with landform and land cover attributes. Geoderma 2002, 110, 241–263. [Google Scholar] [CrossRef]
  39. Gibson, A.J.; Hancock, G.R.; Bretreger, D.; Cox, T.; Hughes, J.; Kunkel, V. Assessing Digital Elevation Model Resolution for Soil Organic Carbon Prediction. Geoderma 2021, 398, 115106. [Google Scholar] [CrossRef]
  40. Wang, H.; Zhang, X.; Wu, W.; Liu, H. Prediction of Soil Organic Carbon under Different Land Use Types Using Sentinel-1/-2 Data in a Small Watershed. Remote Sens. 2021, 13, 1229. [Google Scholar] [CrossRef]
  41. Nguyen, H.T.G.; Lyttek, E.; Lal, P.; Wieczerak, T.; Luong, T. Evaluating Loblolly Pine Bioenergy Development Potential Using AHP Integrated Weighted Overlay and Network Optimization in Virginia, USA. Trees For. People 2022, 8, 100271. [Google Scholar] [CrossRef]
  42. Almulla, A.A.; Jones, D.; Roberts, P. Substrate Influences Temperature Sensitivity of Dissolved Organic Carbon (DOC) and Nitrogen (DON) Mineralization in Arid Agricultural Soils. Soil. Syst. 2018, 2, 28. [Google Scholar] [CrossRef] [Green Version]
  43. Choudhary, B.K.; Majumdar, K.; Datta, B.K. Effects of Land Use on the Soil Organic Carbon Storage Potentiality and Soil Edaphic Factors in Tripura, Northeast India. Am. J. Clim. Chang. 2016, 5, 417–429. [Google Scholar] [CrossRef] [Green Version]
  44. Jakšić, S.; Ninkov, J.; Milić, S.; Vasin, J.; Živanov, M.; Perović, V.; Banjac, B.; Vučković, S.; Dozet, G.; Komlen, V. Topographic Position, Land Use and Soil Management Effects on Soil Organic Carbon (Vineyard Region of Niš, Serbia). Agronomy 2021, 11, 1438. [Google Scholar] [CrossRef]
  45. Florez Martínez, A. Manual de Pastos y Forrajes Altoandinos; UNAlm: Lima, Peru, 2005; ISBN 9972471152. Available online: https://funsepa.net/soluciones/pubs/MjY=.pdf (accessed on 14 May 2023).
  46. Solano, M.; Ramón, P.; Gusmán, E.; Burneo, J.I.; Quichimbo, P.; Jiménez, L.; Solano, M.; Ramón, P.; Gusmán-M, E.; Burneo, J.I.; et al. Effect of the Altitudinal Gradient on Soil Carbon and Nitrogen Reserves in a Dry Scrub in Ecuador. Ecosistemas 2018, 27, 116–122. [Google Scholar]
  47. Hunt, J.G.; Celestina, C.; Kirkegaard, J.A. The Realities Of Climate Change, Conservation Agriculture and Soil Carbon Sequestration. Glob. Chang. Biol. 2020, 6, 3188–3189. [Google Scholar] [CrossRef] [Green Version]
  48. Maja, M.; Ranko, Č. Bishal Sitaula Soil Organic Carbon in Serbian Mountain Soils: Effects of Land Use and Altitude. Pol. J. Environ. Stud. 2010, 20, 977. [Google Scholar]
  49. Huamán-Carrión, M.L.; Espinoza-Montes, F.; Barrial-Lujan, A.I.; Ponce-Atencio, Y. Influence of Altitude and Soil Characteristics on Organic Carbon Storage Capacity of High Andean Natural Pastures. Sci. Agropecu. 2021, 12, 83–90. [Google Scholar] [CrossRef]
  50. Nabiollahi, K.; Shahlaee, S.; Zahedi, S.; Taghizadeh-Mehrjardi, R.; Kerry, R.; Scholten, T. Land Use and Soil Organic Carbon Stocks—Change Detection over Time Using Digital Soil Assessment: A Case Study from Kamyaran Region, Iran (1988–2018). Agronomy 2021, 11, 597. [Google Scholar] [CrossRef]
  51. Witing, F.; Volk, M.; Franko, U. Modeling Soil Organic Carbon Dynamics of Arable Land across Scales: A Simplified Assessment of Alternative Management Practices on the Level of Administrative Units. Agronomy 2023, 13, 1159. [Google Scholar] [CrossRef]
  52. Lis-Gutiérrez, M.; Rubiano-Sanabria, Y.; Usuga, J.C.L. Soils and Land Use in the Study of Soil Organic Carbon in Colombian Highlands Catena. Acta Univ. Carol. Geogr. 2019, 54, 15–23. [Google Scholar] [CrossRef] [Green Version]
  53. Food and Agriculture Organization of the United Nations. Sistemas de Uso de La Tierra En Los Trópicos Húmedos y La Emisión y Secuestro de CO2; FAO: Rome, Italy, 2000; ISBN 92-5-304412-8. [Google Scholar]
  54. Yang, Y.Y.; Goldsmith, A.; Herold, I.; Lecha, S.; Toor, G.S. Assessing Soil Organic Carbon in Soils to Enhance and Track Future Carbon Stocks. Agronomy 2020, 10, 1139. [Google Scholar] [CrossRef]
  55. Fathizad, H.; Taghizadeh-Mehrjardi, R.; Hakimzadeh Ardakani, M.A.; Zeraatpisheh, M.; Heung, B.; Scholten, T. Spatiotemporal Assessment of Soil Organic Carbon Change Using Machine-Learning in Arid Regions. Agronomy 2022, 12, 628. [Google Scholar] [CrossRef]
  56. Beltrán-Dávalos, A.A.; Ayala Izurieta, J.E.; Echeverria Guadalupe, M.M.; Van Wittenberghe, S.; Delegido, J.; Otero Pérez, X.L.; Merino, A. Evaluation of Soil Organic Carbon Storage of Atillo in the Ecuadorian Andean Wetlands. Soil. Syst. 2022, 6, 92. [Google Scholar] [CrossRef]
  57. Paz, F.; Etchevers, J. Distribución a Profundidad del Carbono Orgánico en Los Suelos de México. Terra Latinoam. 2016. Available online: http://www.scielo.org.mx/scielo.php?script=sci_arttext&pid=S0187-57792016000300339&lng=es&nrm=iso (accessed on 16 June 2023).
  58. Acosta-Mireles, M.; Paz-Pellat, F.; Hidalgo-Moreno, C.; Etchevers-Barra, J.D. Soil Organic Carbon Depth Distribution Patterns in Different Land Uses and Management. Terra Latinoam. 2022, 40, 1321. [Google Scholar] [CrossRef]
  59. Laganière, J.; Augusto, L.; Hatten, J.A.; Spielvogel, S. Editorial: Vegetation Effects on Soil Organic Matter in Forested Ecosystems; Frontiers in Forests and Global Change: Lausanne, Switzerland, 2022; Volume 4. [Google Scholar]
  60. Batjes, N.H. Harmonized Soil Property Values for Broad-Scale Modelling (WISE30sec) with Estimates of Global Soil Carbon Stocks. Geoderma 2016, 269, 61–68. [Google Scholar] [CrossRef]
  61. Castañeda-Martín, A.E.; Montes-Pulido, C.R. Carbono Almacenado En Páramo Andino. Entramado 2017, 13, 210–221. [Google Scholar] [CrossRef]
  62. Wiltshire, S.; Grobe, S.; Beckage, B. A Historically Driven Spinup Procedure for Soil Carbon Modeling. Soil Syst. 2023, 7, 35. [Google Scholar] [CrossRef]
  63. Arumugam, T.; Kinattinkara, S.; Velusamy, S.; Shanmugamoorthy, M.; Murugan, S. GIS Based Landslide Susceptibility Mapping and Assessment Using Weighted Overlay Method in Wayanad: A Part of Western Ghats, Kerala. Urban Clim. 2023, 49, 101508. [Google Scholar] [CrossRef]
  64. Wang, F.; Wang, X.; Yao, B.; Zhang, Z.; Shi, G.; Ma, Z.; Chen, Z.; Zhou, H. Effects of Land-Use Types on Soil Organic Carbon Stocks: A Case Study across an Altitudinal Gradient within a Farm-Pastoral Area on the Eastern Qinghai-Tibetan Plateau, China. J. Mt. Sci. 2018, 15, 2693–2702. [Google Scholar] [CrossRef]
  65. Francaviglia, R.; Almagro, M.; Vicente-Vicente, J.L. Conservation Agriculture and Soil Organic Carbon: Principles, Processes, Practices and Policy Options. Soil. Syst. 2023, 7, 17. [Google Scholar] [CrossRef]
  66. Gerke, J. The Central Role of Soil Organic Matter in Soil Fertility and Carbon Storage. Soil Syst. 2022, 6, 33. [Google Scholar] [CrossRef]
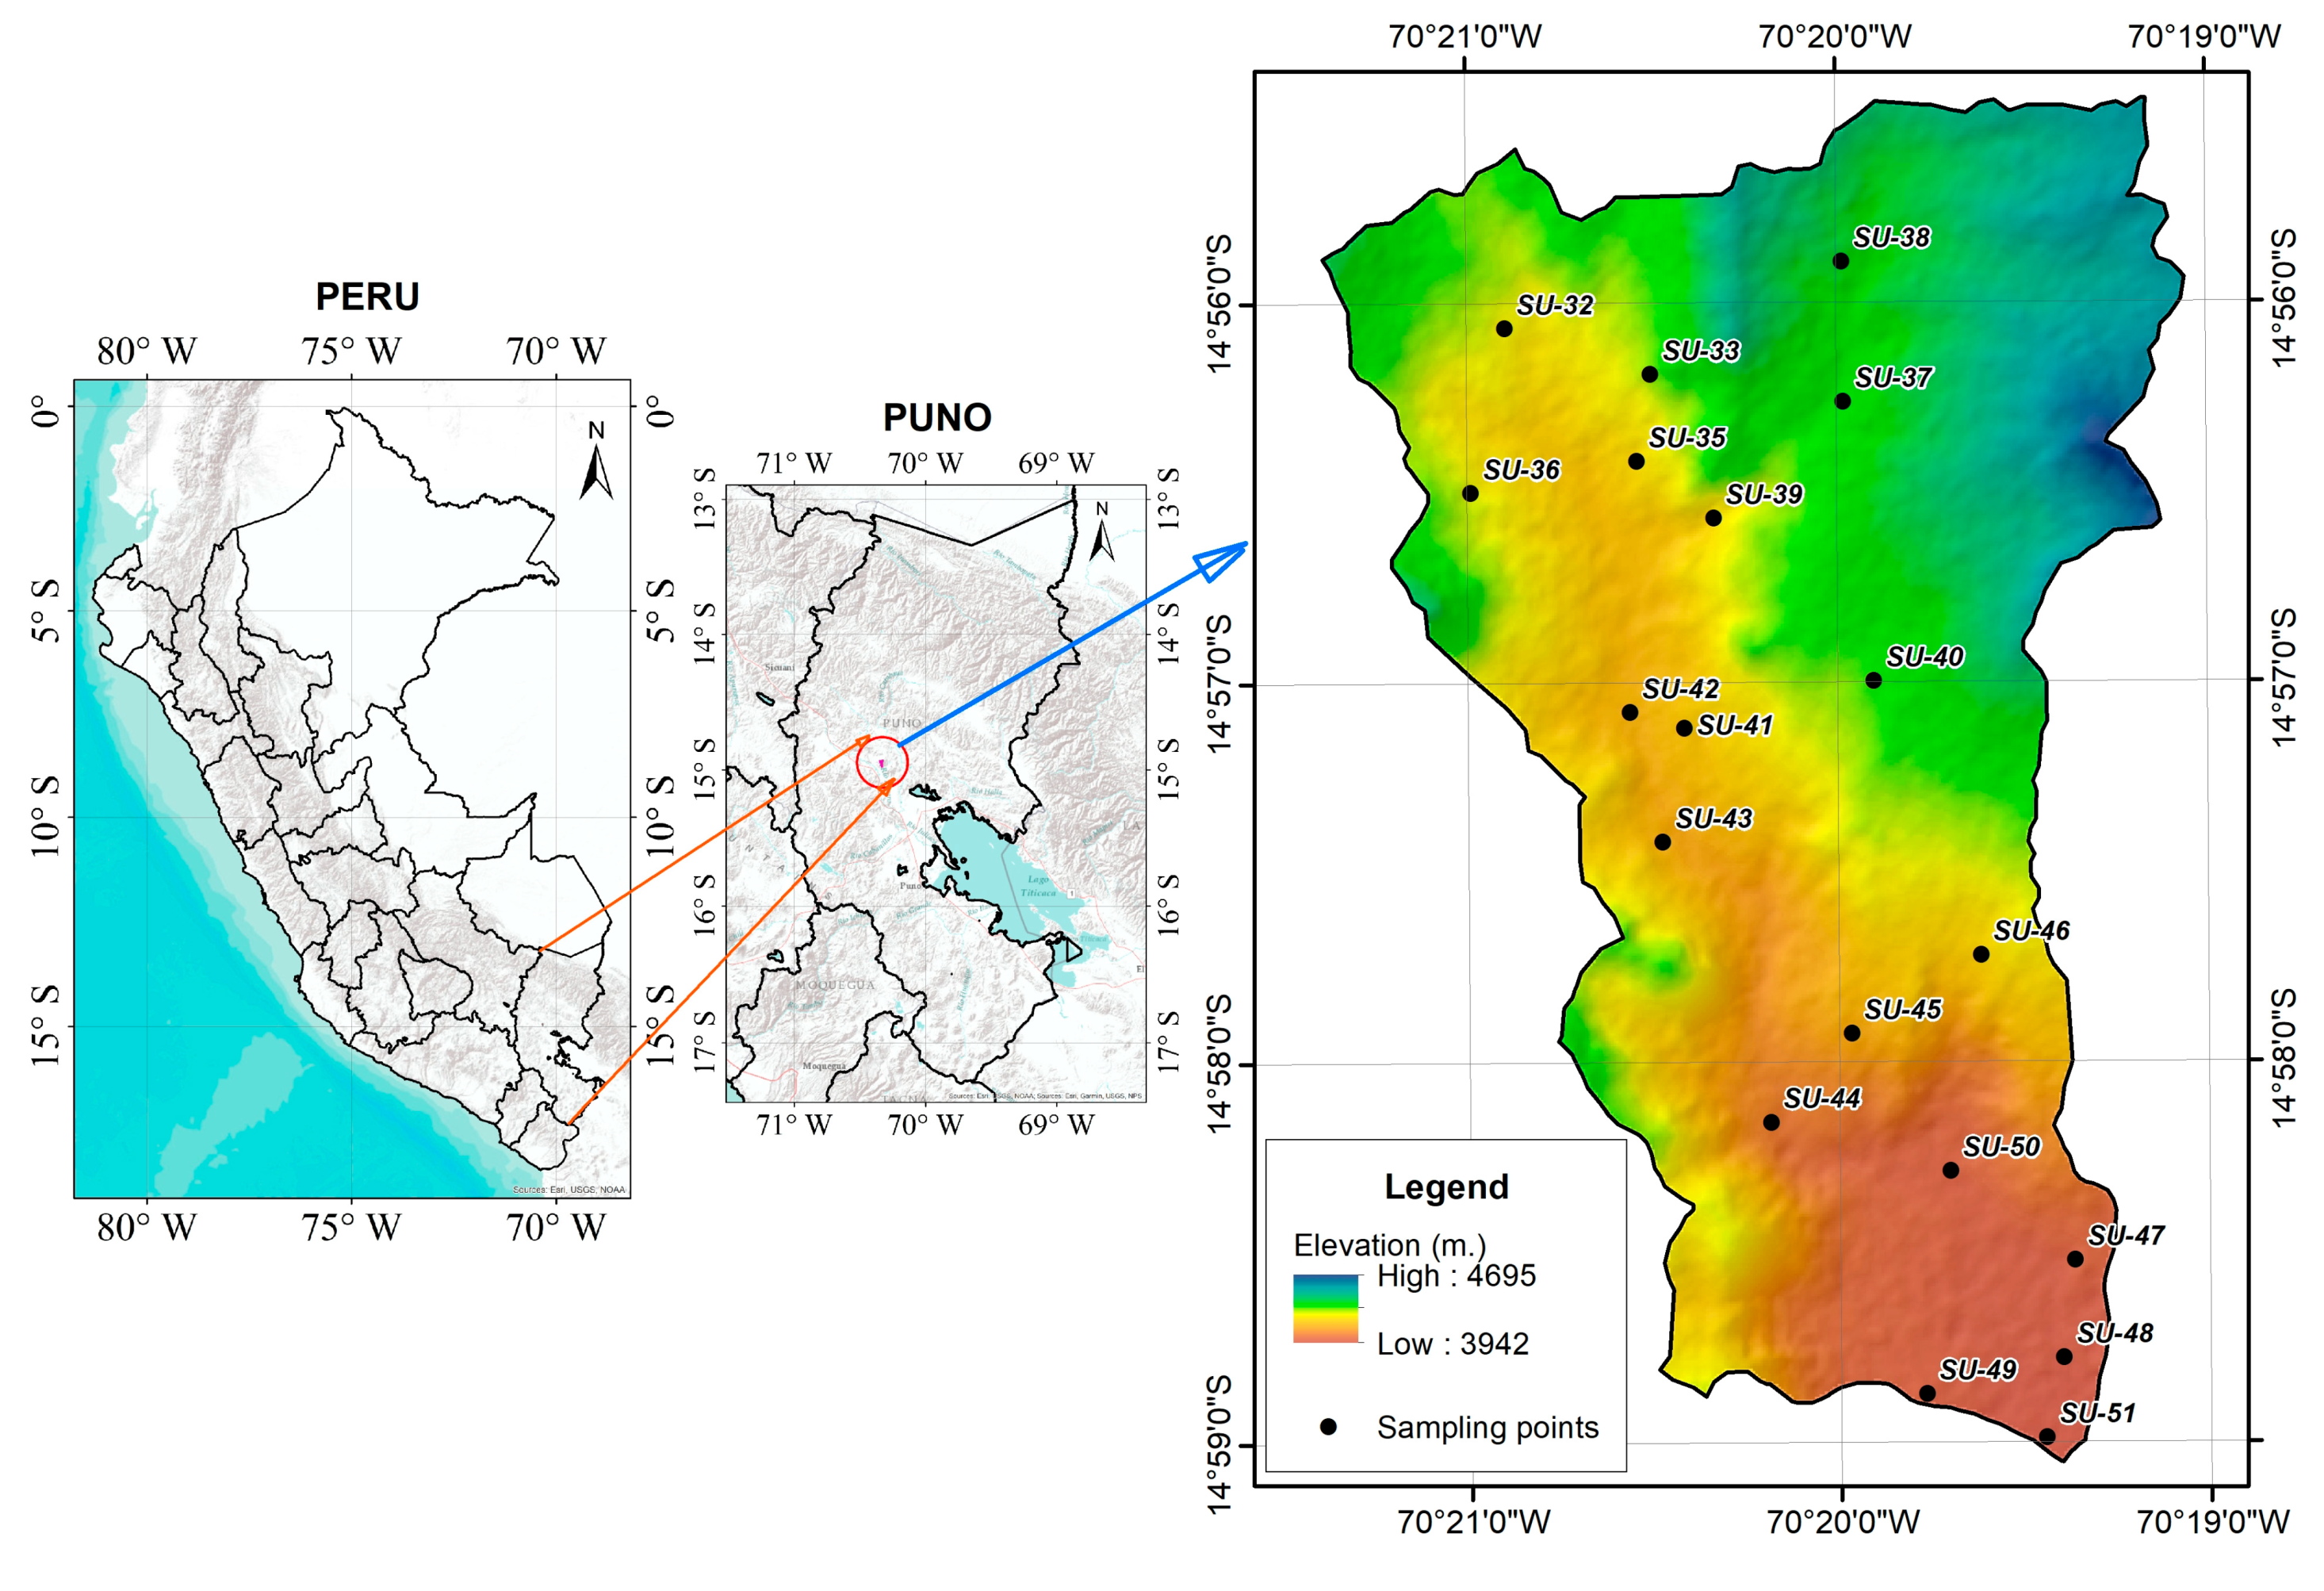
Figure 1. Location of the study area and soil organic carbon (SOC) samples in the high Andean ecosystem of Puno–Peru.
Sustainability 15 10316 g001
Figure 2. Flowchart of methodology for obtaining climatological information, environmental variables, geostatistical processing, and modeling using GIS tools.
Sustainability 15 10316 g002
Figure 3. Pictures of soil sampling and characterization in test pits SU-43 and SU-33 by the specialist and supporters to assess the SOC of the study area.
Sustainability 15 10316 g003
Figure 4. (a) Spatial distribution of soil organic carbon by ordinary kriging interpolation method at 0–20 cm; (b) Spatial distribution of soil organic carbon by ordinary kriging interpolation method at 20–45 cm; (c) Spatial distribution of soil organic carbon by ordinary kriging interpolation method at 45–105 cm.
Sustainability 15 10316 g004
Figure 5. (a) Correlation coefficients between SOC accumulation and mean annual precipitation; (b) Correlation coefficients between SOC accumulation and mean annual temperature; (c) Correlation coefficients between SOC accumulation and elevation; (d) Correlation coefficients between SOC accumulation and organic matter at a significant level of 95% (p < 0.05).
Sustainability 15 10316 g005
Figure 6. (a) Spatial variability of the environmental thematic map and land use characteristics (ha); (b) Spatial variability of the environmental thematic map of slopes (%) and (ha); (c) Climatological spatial variability of mean annual precipitation (mm); (d) Climatological spatial variability of mean annual temperature (°C).
Sustainability 15 10316 g006
Figure 7. (a) Weighted overlay modeling and spatial distribution of soil organic carbon, precipitation, temperature, and slope at 0–20 cm depth; (b) Weighted overlay modeling and spatial distribution of soil organic carbon, precipitation, temperature, slope, and land use at 0–45 cm depth; (c) Weighted overlay modeling and spatial distribution of soil organic carbon, precipitation, temperature, slope, and land use at 45–105 cm depth.
Sustainability 15 10316 g007
Figure 8. Spatial variability between land use and soil organic carbon content in Kg/m2.
Sustainability 15 10316 g008
Table 1. Source of climatological and cartographic information for development of the research.
InformationType of DataSpatial Resolution (m)SourceLink
Digital Elevation ModelRaster12.5Open Science Earthdata (NASA)ASF Data Search (https://www.alaska.edu; accessed on 4 February 2023)
Satellite image: Landsat 8 (Bands 4 and 5)Raster30United States Geological Survey (USGS)EarthExplorer (https://earthexplorer.usgs.gov/; accessed on 10 February 2023)
Precipitation (mm)Raster100Servicio Nacional de Meteorología e Hidrología del Perú
(SENAMHI)
https://www.gob.pe/senamhi accessed on 8 March 2023
Temperature (°C)Raster100Servicio Nacional de Meteorología e Hidrología del Perú
(SENAMHI)
https://www.gob.pe/senamhi accessed on 8 March 2023
Table 2. Characteristics and location of soil organic carbon (SOC) sampling points of soil (SU) at different depths in the study area.
SampleUTM–WGS84–19S (m)SOC (Kg/m2)–Depths
EastNorthElevation0–20 cm20–45 cm45–105 cm
SU-31355,3638,347,4904113--13.37
SU-32355,0028,348,48942026.271.951.45
SU-33355,7088,348,26842416.03--
SU-35355,6418,347,84641434.123.351.62
SU-36354,8388,347,68842093.45-0.19
SU-37356,6428,348,13643033.782.324.60
SU-38356,6358,348,81743496.871.682.95
SU-39356,0168,347,57141522.844.1811.14
SU-40356,7948,346,78142713.762.331.10
SU-41355,8768,346,54841116.602.701.02
SU-42355,6118,346,62540686.162.981.80
SU-43355,7718,345,99640674.370.800.94
SU-44356,2978,344,63939843.760.920.29
SU-45356,6888,345,06940666.411.180.79
SU-46357,3158,345,45141342.773.081.97
SU-47357,7728,343,97439293.58-0.17
SU-48357,7188,343,50138983.73-1.31
SU-49357,0548,343,32239073.240.790.84
SU-50357,1678,344,40739671.891.334.40
SU-51357,6368,343,11338953.951.303.50
Table 3. Results from laboratory analysis of soil organic carbon (SOC), organic matter (OM), climatological data variables, and elevation.
Sample PointSOC (Kg/m2)Pp. (mm)Tem. (°C)Elevation (m)OM (%)
SU-326.869764.556.5544036.54
SU-336.268738.647.3142333.79
SU-356.027755.106.8642922.88
SU-363.783764.376.4743493.14
SU-374.118742.347.0241894.44
SU-383.450732.607.2042426.73
SU-392.842726.806.9741922.03
SU-403.759754.936.4143203.20
SU-416.598725.687.1341516.99
SU-426.156719.537.3341246.67
SU-434.373714.147.3041123.20
SU-442.772733.687.0741745.10
SU-456.405717.297.3241036.21
SU-463.761705.977.8540312.29
SU-471.888695.257.8439682.75
SU-483.579692.717.8639692.94
SU-493.734690.918.0739502.94
SU-503.238697.238.1239711.90
SU-513.946691.888.1739432.94
Table 4. COS correlation analysis, percentage weights and weightings for each climatological and environmental variable.
VariablesSOC (r)Weighting (1 to 9)Weighted Overlay (%)
SOC 1 to 950
Precipitation0.3881 to 910
Temperature−0.3189 to 110
Land use-1 to 920
Elevation0.4021 to 910
Organic matter0.592-
Slope-1 to 8
Total100%
Table 5. Weights were obtained from climatological and environmental variables according to the correlation between soil and organic carbon for modeling using the weighted overlay tool.
SOC (Kg/m2)–Depths (cm)VariablesClimate Data
0–2020–4545–105Land UseSlope (%)PrecipitationTemperatureW
1.93–3.120.79–1.200.87–1.19Exposed fragmented rock0–2689.55–701.327.95–8.171
3.12–3.521.20–1.571.19–1.37Urban and rural housing2–4701.32–714.027.64–7.952
3.52–3.881.57–1.971.37–1.50Bare ground and tracks4–8714.02–726.257.36–7.643
3.88–4.231.97–2.251.50–1.61Pajonales8–15726.25–737.887.13–7.364
4.23–4.532.25–2.461.61–1.72Lucerne15–25737.88–748.726.86–7.135
4.53–4.882.46–2.711.72–1.85Chiji dense grassland25–50748.72–760.856.58–6.866
4.88–5.222.71–3.061.85–2.04Oats for fodder50–75760.85–773.846.31–6.587
5.22–5.603.06–3.472.04–2.34Wetlands>75773.84–788.426.01–6.318
5.60–6.813.47–4.172.34–2.65Crops-788.42–823.915.63–6.019
Disclaimer/Publisher’s Note: The statements, opinions and data contained in all publications are solely those of the individual author(s) and contributor(s) and not of MDPI and/or the editor(s). MDPI and/or the editor(s) disclaim responsibility for any injury to people or property resulting from any ideas, methods, instructions or products referred to in the content.