

Economic and Spatial Restructuring in the Aras Economic Zone: The Impact of Cross-Border Cooperation

Abstract
1. Introduction
2. Literature Review
3. Theoretical Framework
4. Materials and Methods
4.1. Study Area: General Situation and Importance of the Study Area
4.2. In-Depth Interviews
4.3. Fieldworks
4.4. Measurement of Regional Variables: Index Calculation of AFTZ
4.5. Genetic Algorithm: Optimal Values for Most Suitable Spatial Development
4.6. Spatial Visualization and Mapping
4.7. Data Analysis
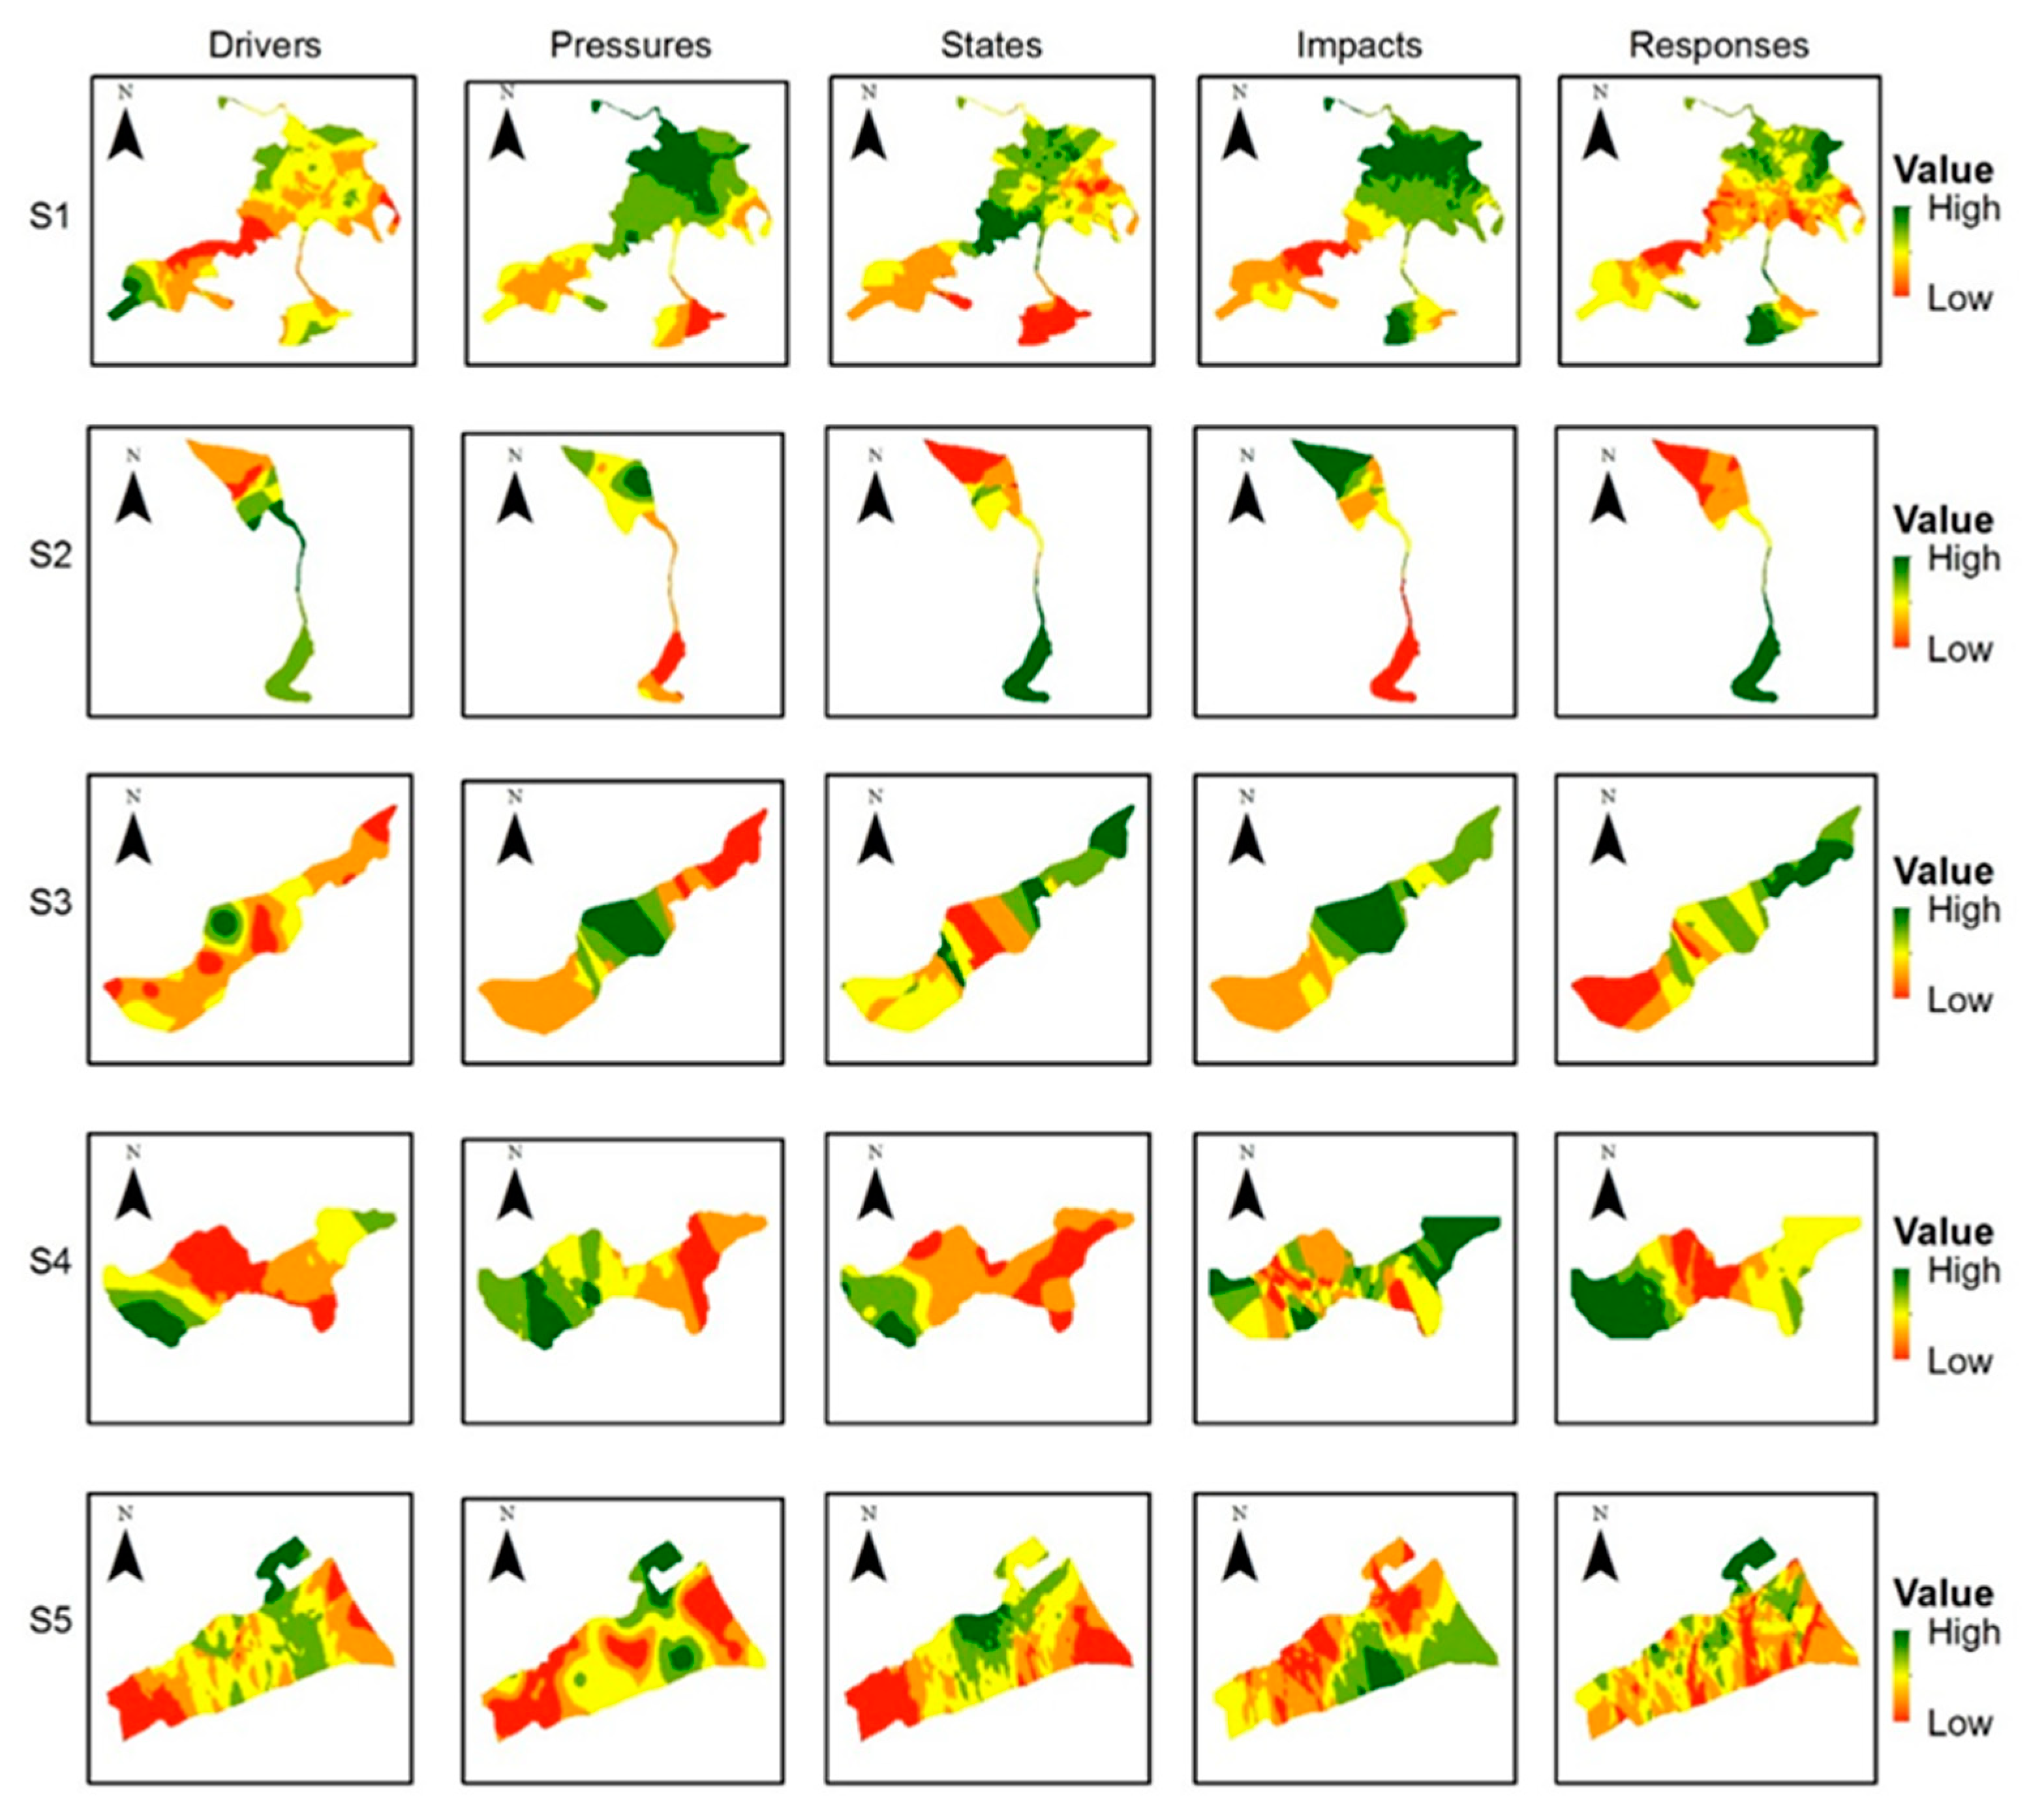
5. Results
Empirical Outcomes
6. Discussion
7. Conclusions
- (1)
- Regardless of further specialized approaches to regional planning, to ensure alignment with CBC and planning strategies, it is imperative to develop comprehensive engagement among locals and include their interests. The economic and spatial performance of SEZs is strongly influenced by CBC, and this study provides a useful orientation for policymakers to understand that all CBC dimensions relate to local approaches, regional development, FDI-driven restructuring expansion in related actions, and economic development as a foundation for this regional growth. As a result, our research could have a significant impact on BRI projects and ensure the integrity of planning processes, helping to avoid radical effects.
- (2)
- We approached the link between CBC and economic-spatial changes in SEZ from a local perspective. Here, financial and spatial restructuring is calculated based on the D-score, P-score, S-score, I-score, and R-score. The index system was implemented using in-depth interview data for 322 Iranian households, representing 5 distinct sections of CBC influence since 2013. In our analysis of social, economic, and spatial restructuring indicators, we found that improved levels of CBC and cooperation with locals are rewarded by higher acceptance of BRI strategies. Through collaboration, this research contributes to the CBC debate by showing that competition and cooperation complement one another. However, we found that there were fewer challenges and levels of resistance associated with FDI.
- (3)
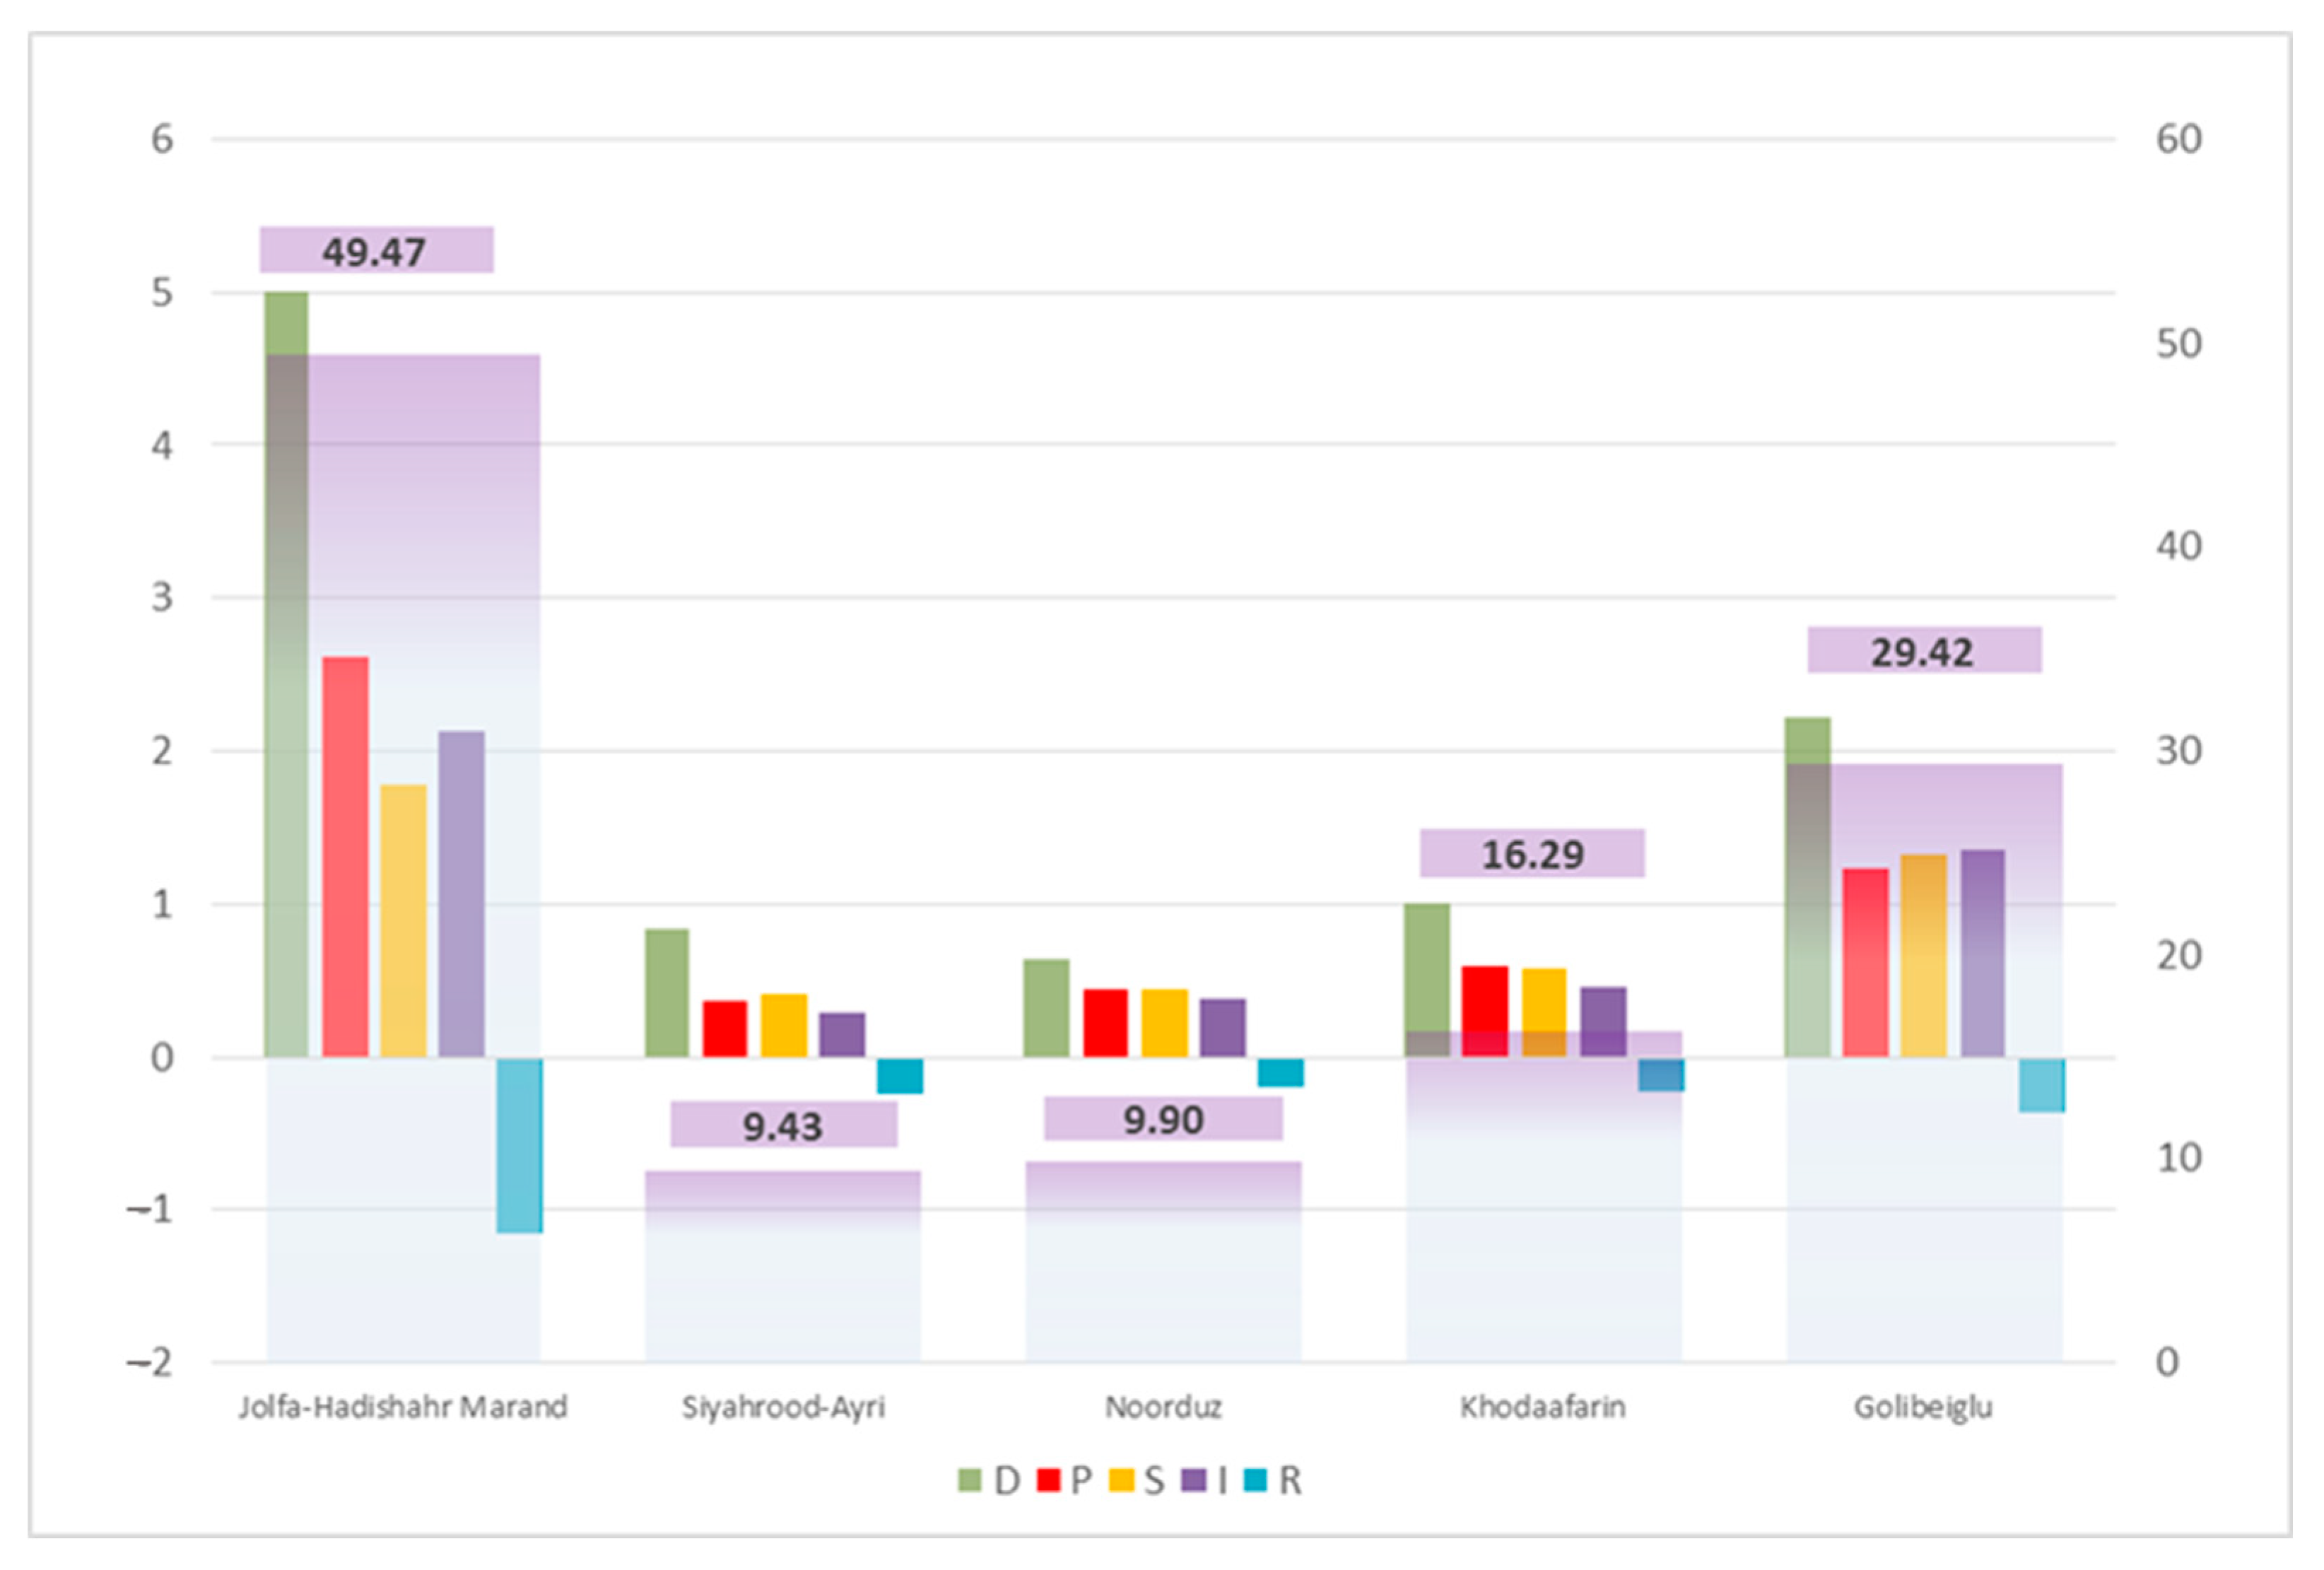
- Preliminary results indicate that regional imbalances have a negative effect on CBC. In particular, by more closely examining the effect of BRI-driven FDI via the DPSIR framework, the results reveal that regional imbalances due to spatial performance disparities are slightly over the optimal values, and due to the increased pressure of CBC and local responses (P-score and R-score) to spatial restructuring, they promote common planning and strategies for higher drivers, states and impact areas. These results provide evidence that SEZs should continue their CBC and optimize economic change and spatial restructuring. This will result in an increase in foreign direct investment. In case BRI-driven FDI leads to uncontrolled development, it creates dramatic imbalances within inner special economic zones that can negatively impact regional balances. For this reason, BRI strategies should prioritize the social and spatial dimensions of CBC over economic and industrial dimensions that directly affect stakeholders.
Author Contributions
Funding
Institutional Review Board Statement
Informed Consent Statement
Data Availability Statement
Acknowledgments
Conflicts of Interest
Nomenclature
| Symbol | Nomenclature |
| n | Number of interviewees |
| SSDI | Socio-Spatial Development Index |
| Driver indicators | |
| Pressure indicators | |
| States indicators | |
| Impact indicators | |
| Response indicators | |
| Maximum feasible driving index | |
| Maximum feasible states index | |
| The maximum feasible response index | |
| Relative frequency | |
| Frequency of factor | |
| Number of observations | |
| Percentage frequency | |
| Weight of driving factor | |
| Driving force index numerical value | |
| Restructured Socio-Spatial Development Index | |
| The maximum feasible pressure index | |
| Maximum feasible impact index |
References
- Le Gallo, J.; Ertur, C. Exploratory spatial data analysis of the distribution of regional per capita GDP in Europe, 1980–1995. Pap. Reg. Sci. 2003, 82, 175–201. [Google Scholar] [CrossRef]
- Church, A.; Reid, P. Urban power, international networks and competition: The example of cross-border cooperation. Urban Stud. 1996, 33, 1297–1318. [Google Scholar] [CrossRef]
- Rall, E.; Hansen, R.; Pauleit, S. The added value of public participation GIS (PPGIS) for urban green infrastructure planning. Urban For. Urban Green. 2019, 40, 264–274. [Google Scholar] [CrossRef]
- Bagheri, H.; Zarghami, E. Assessing the relationship between housing characteristics and children’s independent mobility by PPGIS method. J. Hous. Built Environ. 2022, 37, 1883–1899. [Google Scholar] [CrossRef]
- Sullivan-Wiley, K.; Teller, A. The integrated socio-perceptual approach: Using ecological mental maps and future imaginaries to understand land use decisions. Glob. Environ. Chang. 2020, 64, 102151. [Google Scholar] [CrossRef]
- Song, T.; Liu, W.; Liu, Z.; Wuzhati, Y. Chinese overseas industrial parks in Southeast Asia: An examination of policy mobility from the perspective of embeddedness. J. Geogr. Sci. 2018, 28, 1288–1306. [Google Scholar] [CrossRef]
- Han, H.; Lin, S. Government size and regional capital flows in China. Sustainability 2019, 11, 6653. [Google Scholar] [CrossRef]
- Alshboul, O.; Shehadeh, A.; Hamedat, O. Governmental Investment Impacts on the Construction Sector Considering the Liquidity Trap. J. Manag. Eng. 2022, 38, 4021099. [Google Scholar] [CrossRef]
- Shehadeh, A.; Alshboul, O.; Hamedat, O. A Gaussian mixture model evaluation of construction companies’ business acceptance capabilities in performing construction and maintenance activities during COVID-19 pandemic. Int. J. Manag. Sci. Eng. Manag. 2022, 17, 112–122. [Google Scholar] [CrossRef]
- Mallinson, D.J. Cooperation and conflict in state and local innovation during COVID-19. Am. Rev. Public Adm. 2020, 50, 543–550. [Google Scholar] [CrossRef]
- Carter, T.R.; Benzie, M.; Campiglio, E.; Carlsen, H.; Fronzek, S.; Hildén, M.; Reyer, C.P.O.; West, C. A conceptual framework for cross-border impacts of climate change. Glob. Environ. Chang. 2021, 69, 102307. [Google Scholar] [CrossRef]
- WCED Special Working Session. World commission on environment and development. Our Common Future 1987, 17, 1–91. [Google Scholar]
- Hazakis, K.J. The rationale of special economic zones (SEZs): An Institutional approach. Reg. Sci. Policy Pract. 2014, 6, 85–101. [Google Scholar] [CrossRef]
- Gulakov, I.; Vanclay, F.; Arts, J. Modifying social impact assessment to enhance the effectiveness of company social investment strategies in contributing to local community development. Impact Assess. Proj. Apprais. 2020, 38, 382–396. [Google Scholar] [CrossRef]
- Haghparast, Q. Evaluation of the sustainable urban development in the Mashhad Metropolis using Ecological Footprint Method. Comput. Ecol. Softw. 2018, 8, 75. [Google Scholar]
- Long, Y.; Zhai, W.; Shen, Y.; Ye, X. Understanding uneven urban expansion with natural cities using open data. Landsc. Urban Plan. 2018, 177, 281–293. [Google Scholar] [CrossRef]
- Sarvestani, M.S.; Ibrahim, A.L.; Kanaroglou, P. Three decades of urban growth in the city of Shiraz, Iran: A remote sensing and geographic information systems application. Cities 2011, 28, 320–329. [Google Scholar] [CrossRef]
- Soffianian, A.; Nadoushan, M.A.; Yaghmaei, L.; Falahatkar, S. Mapping and analyzing urban expansion using remotely sensed imagery in Isfahan, Iran. World Appl. Sci. J. 2010, 9, 1370–1378. [Google Scholar]
- Batunova, E.; Perucca, G. Population shrinkage and economic growth in Russian regions 1998–2012. Reg. Sci. Policy Pract. 2020, 12, 595–609. [Google Scholar] [CrossRef]
- Falahat, S.; Shirazi, M.R. New urban developments in Safavid Isfahan continuity or disjuncture? Plan. Perspect. 2012, 27, 611–624. [Google Scholar] [CrossRef]
- Rafiee, R.; Mahiny, A.S.; Khorasani, N.; Darvishsefat, A.A.; Danekar, A. Simulating urban growth in Mashad City, Iran through the SLEUTH model (UGM). Cities 2009, 26, 19–26. [Google Scholar] [CrossRef]
- Wang, M.Y.; Meng, X. Global-local initiatives in FDI: The experience of Shenzhen, China. Asia Pac. Viewp. 2004, 45, 181–196. [Google Scholar] [CrossRef]
- Cheung, P.T.Y. The politics of regional cooperation in the Greater Pearl River Delta. Asia Pac. Viewp. 2012, 53, 21–37. [Google Scholar] [CrossRef]
- Zhao, P. Building knowledge city in transformation era: Knowledge-based urban development in Beijing in the context of globalisation and decentralisation. Asia Pac. Viewp. 2010, 51, 73–90. [Google Scholar] [CrossRef]
- Li, Y.; Wu, F. Towards new regionalism? Case study of changing regional governance in the Yangtze River Delta. Asia Pac. Viewp. 2012, 53, 178–195. [Google Scholar] [CrossRef]
- Chan, R.C.K.; Xian, S. Assessing the incentives in regional city-to-city cooperation: A case study of Jiangyin-Jingjiang Industrial Park of Jiangsu Province in the Yangtze River Delta region. Asia Pac. Viewp. 2012, 53, 56–69. [Google Scholar] [CrossRef]
- Posas, P.J. Climate change in SEA: Learning from English local spatial planning experience. Impact Assess. Proj. Apprais. 2011, 29, 289–302. [Google Scholar]
- Sánchez-Moral, S.; Vale, M.; Arellano, A. Skill-Relatedness and Regional Economic Development in Spain during the International Crisis and the Post-Crisis Period. Pap. Reg. Sci. 2022, 101, 573–602. [Google Scholar] [CrossRef]
- Xu, S.; Liu, Q.; Sun, H. Economic coordination development from the perspective of cross-regional urban agglomerations in China. Reg. Sci. Policy Pract. 2022, 14, 36–59. [Google Scholar] [CrossRef]
- Cui, X.; Wang, X. Review on studies of urban spatial behavior and urban planning from the perspective of big data. In ICCREM 2015; ASCE: Reston, VA, USA, 2015; pp. 521–531. [Google Scholar]
- Wang, L. Spatial Planning and Governance: Literature Review. In Changing Spatial Elements in Chinese Socio-Economic Five-Year Plan: From Project Layout to Spatial Planning; Springer: Singapore, 2019; pp. 7–44. [Google Scholar]
- Trejo Nieto, A. Regional disparities in Mexico and the spatially cumulative effects of national development and economic cycles, 1940–2013. Reg. Sci. Policy Pract. 2021, 13, 1283–1296. [Google Scholar] [CrossRef]
- Asadolahi, Z.; Salmanmahiny, A.; Sakieh, Y.; Mirkarimi, S.H.; Baral, H.; Azimi, M. Dynamic trade-off analysis of multiple ecosystem services under land use change scenarios: Towards putting ecosystem services into planning in Iran. Ecol. Complex. 2018, 36, 250–260. [Google Scholar] [CrossRef]
- Zou, L.; Liu, Y.; Yang, J.; Yang, S.; Wang, Y.; Hu, X. Quantitative identification and spatial analysis of land use ecological-production-living functions in rural areas on China’s southeast coast. Habitat Int. 2020, 100, 102182. [Google Scholar] [CrossRef]
- Simeonova, V. Environmental policy integration in urban spatial planning: The approach of Rotterdam. WIT Trans. Ecol. Environ. 2006, 93, 219–228. [Google Scholar]
- Heijman, W.J.M.; Leen, A.R. On Austrian regional economics. Pap. Reg. Sci. 2004, 83, 487–493. [Google Scholar] [CrossRef]
- Garcia-López, M.; Muñiz, I. Urban spatial structure, agglomeration economies, and economic growth in Barcelona: An intra-metropolitan perspective. Pap. Reg. Sci. 2013, 92, 515–534. [Google Scholar] [CrossRef]
- Kim, Y.; Choi, M.J. Contracting-out public-private partnerships in mega-scale developments: The case of New Songdo City in Korea. Cities 2018, 72, 43–50. [Google Scholar] [CrossRef]
- Pereira, R.H.M. Transport legacy of mega-events and the redistribution of accessibility to urban destinations. Cities 2018, 81, 45–60. [Google Scholar] [CrossRef]
- Maiello, A.; Pasquinelli, C. Destruction or construction? A (counter) branding analysis of sport mega-events in Rio de Janeiro. Cities 2015, 48, 116–124. [Google Scholar] [CrossRef]
- Rodríguez-Pose, A.; Bartalucci, F.; Frick, S.A.; Santos-Paulino, A.U.; Bolwijn, R. The challenge of developing special economic zones in Africa: Evidence and lessons learnt. Reg. Sci. Policy Pract. 2022, 14, 456–481. [Google Scholar] [CrossRef]
- Oakes, T. The Belt and Road as method: Geopolitics, technopolitics and power through an infrastructure lens. Asia Pac. Viewp. 2021, 62, 281–285. [Google Scholar] [CrossRef]
- Turner, M.; Jang, H.; Kwon, S.; O’Donnell, M. Does history repeat itself? Economic development and policy convergence in Vietnam and South Korea. Asian-Pacific Econ. Lit. 2019, 33, 27–43. [Google Scholar] [CrossRef]
- Ahmad, F.; Draz, M.U.; Yang, S. China’s economic development: Does exchange rate and FDI nexus matter? Asian-Pacific Econ. Lit. 2019, 33, 81–93. [Google Scholar] [CrossRef]
- Adeleke, A.I. FDI-growth nexus in Africa: Does governance matter? J. Econ. Dev. 2014, 39, 111. [Google Scholar] [CrossRef]
- Shen, J.; Li, L. Host countries’ growth opportunities and China’s outward FDI. Asian-Pac. Econ. Lit. 2017, 31, 78–95. [Google Scholar] [CrossRef]
- Jago-on, K.A.B.; Kaneko, S.; Fujikura, R.; Fujiwara, A.; Imai, T.; Matsumoto, T.; Zhang, J.; Tanikawa, H.; Tanaka, K.; Lee, B. Urbanization and subsurface environmental issues: An attempt at DPSIR model application in Asian cities. Sci. Total Environ. 2009, 407, 3089–3104. [Google Scholar] [CrossRef]
- Qu, S.; Hu, S.; Li, W.; Wang, H.; Zhang, C.; Li, Q. Interaction between urban land expansion and land use policy: An analysis using the DPSIR framework. Land Use Policy 2020, 99, 104856. [Google Scholar] [CrossRef]
- Xie, M.; Wang, J.; Yang, A.; Chen, K. DPSIR model-based evaluation index system for geographic national conditions. Wuhan Univ. J. Nat. Sci. 2017, 22, 402–410. [Google Scholar] [CrossRef]
- Shi, W.; Xia, P. Application of DPSIR model and improved entropy method in environmental impact assessment of land use planning in Tianshui region. In Proceedings of the 2011 International Symposium on Water Resource and Environmental Protection, Xi’an, China, 20–22 May 2011. [Google Scholar]
- Liu, S.; Ding, P.; Xue, B.; Zhu, H.; Gao, J. Urban Sustainability Evaluation Based on the DPSIR Dynamic Model: A Case Study in Shaanxi Province, China. Sustainability 2020, 12, 7460. [Google Scholar] [CrossRef]
- Spanò, M.; Gentile, F.; Davies, C.; Lafortezza, R. The DPSIR framework in support of green infrastructure planning: A case study in Southern Italy. Land Use Policy 2017, 61, 242–250. [Google Scholar] [CrossRef]
- Hou, Y.; Zhou, S.; Burkhard, B.; Müller, F. Socioeconomic influences on biodiversity, ecosystem services and human well-being: A quantitative application of the DPSIR model in Jiangsu, China. Sci. Total Environ. 2014, 490, 1012–1028. [Google Scholar] [CrossRef]
- Huang, Z.; Li, G.; Li, Y.; Chang, Y. Evaluation and analysis of sustainable development in Beijing based on DPSIR model. Urban Dev. 2016, 9, 20–24. [Google Scholar]
- Carr, E.R.; Wingard, P.M.; Yorty, S.C.; Thompson, M.C.; Jensen, N.K.; Roberson, J. Applying DPSIR to sustainable development. Int. J. Sustain. Dev. World Ecol. 2007, 14, 543–555. [Google Scholar] [CrossRef]
- Soeriaatmadja, A.R.; Wulanningsih, R. A set of sustainable urban landscape indicators and parameters to evaluate urban green open space in Bandung City. In IOP Conference Series: Earth and Environmental Science; IOP Publishing: Bristol, UK, 2018; Volume 179, p. 12016. [Google Scholar]
- Malmir, M.; Javadi, S.; Moridi, A.; Neshat, A.; Razdar, B. A new combined framework for sustainable development using the DPSIR approach and numerical modeling. Geosci. Front. 2021, 12, 101169. [Google Scholar] [CrossRef]
- Keesstra, S.D.; Bouma, J.; Wallinga, J.; Tittonell, P.; Smith, P.; Cerdà, A.; Montanarella, L.; Quinton, J.N.; Pachepsky, Y.; Van Der Putten, W.H. The significance of soils and soil science towards realization of the United Nations Sustainable Development Goals. Soil 2016, 2, 111–128. [Google Scholar] [CrossRef]
- Tomislav, K. The concept of sustainable development: From its beginning to the contemporary issues. Zagreb Int. Rev. Econ. Bus. 2018, 21, 67–94. [Google Scholar]
- Zebardast, L.; Salehi, E.; Afrasiabi, H. Application of DPSIR Framework for Integrated Environmental Assessment of Urban Areas: A Case Study of Tehran. Int. J. Environ. Res. 2015, 9, 445–456. [Google Scholar]
- Staff, O. OECD Environmental Indicators 2001: Towards Sustainable Development; Organization for Economic Cooperation & Development: Paris, France, 2001; ISBN 9264187189. [Google Scholar]
- Bidone, E.D.; Lacerda, L.D. The use of DPSIR framework to evaluate sustainability in coastal areas. Case study: Guanabara Bay basin, Rio de Janeiro, Brazil. Reg. Environ. Change 2004, 4, 5–16. [Google Scholar] [CrossRef]
- Afrakhteh, H. The problems of regional development and border cities: A case study of Zahedan, Iran. Cities 2006, 23, 423–432. [Google Scholar] [CrossRef]
- Peng, T.; Jin, Z.; Xiao, L. Evaluating low-carbon competitiveness under a DPSIR-Game Theory-TOPSIS model—A case study. Environ. Dev. Sustain. 2022, 24, 5962–5990. [Google Scholar] [CrossRef]
- Li, W.; Yi, P.; Zhang, D. Sustainability evaluation of cities in northeastern China using dynamic TOPSIS-entropy methods. Sustainability 2018, 10, 4542. [Google Scholar] [CrossRef]
- Li, Y.; Sun, M.; Yuan, G.; Zhou, Q.; Liu, J. Study on development sustainability of atmospheric environment in Northeast China by rough set and entropy weight method. Sustainability 2019, 11, 3793. [Google Scholar] [CrossRef]
- Jin, H.; Qian, X.; Chin, T.; Zhang, H. A global assessment of sustainable development based on modification of the human development index via the entropy method. Sustainability 2020, 12, 3251. [Google Scholar] [CrossRef]
- Pan, A.; Wang, Q.; Yang, Q. Assessment on the coordinated development oriented to Green City in China. Ecol. Indic. 2020, 116, 106486. [Google Scholar] [CrossRef]
- Dezani, H.; Bassi, R.D.S.; Marranghello, N.; Gomes, L.; Damiani, F.; Da Silva, I.N. Optimizing urban traffic flow using Genetic Algorithm with Petri net analysis as fitness function. Neurocomputing 2014, 124, 162–167. [Google Scholar] [CrossRef]
- Munyati, C.; Sinthumule, N.I. Comparative suitability of ordinary kriging and Inverse Distance Weighted interpolation for indicating intactness gradients on threatened savannah woodland and forest stands. Environ. Sustain. Indic. 2021, 12, 100151. [Google Scholar] [CrossRef]
- Kamińska, J.A.; Sciavicco, G.; Kazak, J.K. Sustainable Cities and Regions—Statistical Approaches. Sustainability 2023, 15, 7607. [Google Scholar] [CrossRef]
- Toscano-Valle, A.; Sianes, A.; Santos-Carrillo, F.; Fernández-Portillo, L.A. Can the Rational Design of International Institutions Solve Cooperation Problems? Insights from a Systematic Literature Review. Sustainability 2022, 14, 7866. [Google Scholar] [CrossRef]
- Tjia, D.; Coetzee, S. Geospatial information needs for informal settlement upgrading—A review. Habitat Int. 2022, 122, 102531. [Google Scholar] [CrossRef]
- Dlabac, O.; Zwicky, R.; Hoole, C.; Chu, E.; O’Farrell, L. The Democratic Foundations of the Just City: Key Insights from a European Comparative Study. disP–Plan. Rev. 2021, 57, 84–99. [Google Scholar] [CrossRef]
- Pasquinelli, C.; Vuignier, R. Place marketing, policy integration and governance complexity: An analytical framework for FDI promotion. Eur. Plan. Stud. 2020, 28, 1413–1430. [Google Scholar] [CrossRef]
- Schenkel, W.; Plüss, L. Spatial Planning and Metropolitan Governance in Switzerland: A Condensed Overview. disP–Plan. Rev. 2021, 57, 4–11. [Google Scholar] [CrossRef]
- Zasina, J.; Sokołowicz, M.E.; Nogalski, S. Lodz City Tour: The changing nature of the urban restructuring of a post-socialist industrial city. disP–Plan. Rev. 2020, 56, 8–19. [Google Scholar] [CrossRef]
- Chen, H.; Yan, W.; Li, Z.; Wende, W.; Xiao, S.; Wan, S.; Li, S. Spatial patterns of associations among ecosystem services across different spatial scales in metropolitan areas: A case study of Shanghai, China. Ecol. Indic. 2022, 136, 108682. [Google Scholar] [CrossRef]
- Wang, M.; Zhang, F.; Wu, F. Governing urban redevelopment: A case study of Yongqingfang in Guangzhou, China. Cities 2022, 120, 103420. [Google Scholar] [CrossRef]


| DPSIR | Number | Key Points and Their Purposes/Insights |
|---|---|---|
| Drivers | 7 | The driving power of BRI-driven FDI and economic changes on spatial development, BRI strategies, capital entry process, economic vitality and performance, technology transfers, etc. |
| Pressure | 15 | The pressure of economic changes on spatial development, livability, transit, land availability and pricing, spatial quality and development, housing, changes in the population, etc. |
| States | 4 | States of economic changes and spatial development, sort, combination, and geographic location of spatial restructuring based on local approaches; the perception of local on social, economic, and spatial changes, etc. |
| Impact | 9 | Impact of economic changes on spatial development and the impact of AFTZ transformation. Operating conditions, the composition of local groups, the relationship with the project-leading enterprise, the benefits and damages of AFTZ development, the use of land, changes in AFTZ space, etc. |
| Response | 6 | Responses to economic changes and spatial development; attitudes to spatial restructuring, incentives, spatial regulation, etc. |
| Individual Level Variables | n (%) | n (%) | |
|---|---|---|---|
| Gender | Number of co-occupants | ||
| Male | 298 (92.55%) | Less than three | 28 (8.70%) |
| Female | 9 (2.80%) | Four or five | 142 (44.10%) |
| Missing | 15 (4.66%) | More than five | 10 (3.11%) |
| Age (years) | Single | 64 (19.88%) | |
| 20 to 30 | 50 (15.53%) | Missing | 78 (24.22%) |
| 31 to 40 | 107 (33.23%) | Monthly income level * | |
| 41 to 60 | 105 (32.61%) | IRR 0–1,000,000 (USD 0–77.41) | 1 (0.31%) |
| Missing | 60 (18.63%) | IRR 1,000,000–2,000,000 (USD 77.42–154.82) | 12 (3.73%) |
| Residing duration | IRR 2,000,000–3,000,000 (USD 154.823–232.23) | 64 (19.88%) | |
| 1 to 5 | 2 (0.62%) | IRR 3,000,000–4,000,000 (USD 232.24–309.65) | 7 (2.17%) |
| 5 to 10 | 1 (0.31%) | IRR 4,000,000+ (USD 309.65+) | 7 (2.17%) |
| More than 10 | 296 (91.93%) | Missing | 232 (72.05%) |
| Missing | 23 (7.14%) | The primary source of income | |
| Education | Trade | 53 (16.46%) | |
| Primary school | 1 (0.31%) | Industry | 81 (25.16%) |
| Middle school | 1 (0.31%) | Service | 119 (36.96%) |
| High school | 25 (7.76%) | Agriculture, Aquaculture, and livestock | 23 (7.14%) |
| Collage/university | 234 (72.67%) | Missing | 99 (30.75%) |
| Missing | 62 (19.25%) | ||
| Residency situation | |||
| Own | 144 (44.72%) | ||
| Kinsfolks | 67 (20.81%) | ||
| Rented | 69 (21.43%) | ||
| Missing | 42 (13.34%) |
| Criterion | Indicator | Weights |
|---|---|---|
| Drivers | ||
| Driving power of economic changes on spatial development | 0.0093 | |
| Export-driven business and industry growth | 0.0090 | |
| Equity and Income GDP | 0.0116 | |
| Economic vitality and development | 0.0176 | |
| Economic performance | 0.0247 | |
| Technology transfers for Industrial structure | 0.0230 | |
| FDI and Strengthening of Enterprises | 0.0280 | |
| Pressures | ||
| The pressure of economic changes on spatial development | 0.0322 | |
| Planning Communities for all age | 0.0130 | |
| Livability level and pleasant public Spaces | 0.0138 | |
| Transit and pedestrian accessibility | 0.0242 | |
| Green space area | 0.0278 | |
| Built form representation | 0.0321 | |
| Spatial quality in public spaces | 0.0314 | |
| Local spatial growth | 0.0170 | |
| Greening coverage in a built-up area | 0.0244 | |
| Spatial organization | 0.0263 | |
| Land consumption per capita | 0.0355 | |
| New housing developments | 0.0177 | |
| Land cost | 0.0098 | |
| Availability and pricing of lands | 0.0340 | |
| Affordable housing | 0.0304 | |
| States | ||
| States of economic changes and spatial development | 0.0660 | |
| Sort of spatial development | 0.0176 | |
| Combination of spatial development | 0.0350 | |
| Location of spatial development | 0.0508 | |
| Impacts | ||
| The impact of economic changes on spatial development | 0.0165 | |
| Inequality level | 0.0100 | |
| Geographic Distribution of FDI | 0.0208 | |
| Locals’ well-being | 0.0201 | |
| Population growth | 0.0247 | |
| Depopulation and emigration from the region | 0.0449 | |
| Social capital (networking, shared values, and trust) | 0.0346 | |
| Social Cohesion and regional identity | 0.0193 | |
| Public participation in the decision-making process | 0.0224 | |
| Responses | ||
| Response to economic changes and spatial development | 0.0143 | |
| Access to land resource | 0.0184 | |
| Environmental pollutions | 0.0180 | |
| Social Traditions, beliefs, and Identity | 0.0222 | |
| Emigrants and expatriates’ community | 0.0238 | |
| Other locals’ interest | 0.0277 |
| Linear Equations | Mean | SD | Min | Max | Weights | Optimal | Tendencies | |
|---|---|---|---|---|---|---|---|---|
| Drivers | D = 0.2499 × P + 0.0084 | 0.012 | 0.007 | 0.0009 | 0.0443 | 0.178 | 0.019 | + |
| Pressure | P= 0.037 × S + 0.012 | 0.011 | 0.008 | 0.0005 | 0.0454 | 0.371 | 0.012 | − |
| States | S = 0.7377 × I + 0.023 | 0.013 | 0.006 | 0.0013 | 0.0288 | 0.082 | 0.044 | + |
| Impact | I = 0.1541 × R + 0.0065 | 0.033 | 0.014 | 0.0007 | 0.0682 | 0.253 | 0.017 | + |
| Response | R= 0.125 × D + 0.0099 | 0.012 | 0.006 | 0.0006 | 0.0269 | 0.147 | 0.010 | − |
| D | P | S | I | R | Index | Sum | |
|---|---|---|---|---|---|---|---|
| S1 | 1.74 | 1.84 | 2.21 | 5.29 | 1.86 | SSDI | 18.10 |
| 2.59 | 1.6 | 2.58 | 2.26 | 1.33 | Optimal | 16.27 | |
| 6.75 | 4.46 | 3.99 | 7.42 | 0.71 | RSSDI | 67.56 | |
| S2 | 0.31 | 0.20 | 0.38 | 0.64 | 0.38 | SSDI | 1.03 |
| 0.49 | 0.30 | 1.11 | 0.43 | 0.25 | Optimal | 3.06 | |
| 1.15 | 0.57 | 0.79 | 0.94 | 0.14 | RSSDI | 10.47 | |
| S3 | 0.34 | 0.34 | 0.44 | 1.02 | 0.33 | SSDI | 1.36 |
| 0.51 | 0.31 | 1.15 | 0.44 | 0.26 | Optimal | 3.18 | |
| 0.97 | 0.79 | 0.88 | 1.40 | 0.13 | RSSDI | 11.27 | |
| S4 | 0.48 | 0.34 | 0.45 | 1.19 | 0.41 | SSDI | 3.14 |
| 0.84 | 0.52 | 1.90 | 0.73 | 0.43 | Optimal | 5.26 | |
| 1.48 | 0.93 | 1.03 | 1.65 | 0.18 | RSSDI | 19.43 | |
| S5 | 1.10 | 1.03 | 0.58 | 2.33 | 0.76 | SSDI | 4.08 |
| 1.83 | 1.13 | 4.16 | 1.60 | 0.94 | Optimal | 11.50 | |
| 3.32 | 2.25 | 1.90 | 3.68 | 0.40 | RSSDI | 33.49 |
Disclaimer/Publisher’s Note: The statements, opinions and data contained in all publications are solely those of the individual author(s) and contributor(s) and not of MDPI and/or the editor(s). MDPI and/or the editor(s) disclaim responsibility for any injury to people or property resulting from any ideas, methods, instructions or products referred to in the content. |
© 2023 by the authors. Licensee MDPI, Basel, Switzerland. This article is an open access article distributed under the terms and conditions of the Creative Commons Attribution (CC BY) license (https://creativecommons.org/licenses/by/4.0/).
Share and Cite
Jafarzadeh, H.; Feng, Y. Economic and Spatial Restructuring in the Aras Economic Zone: The Impact of Cross-Border Cooperation. Sustainability 2023, 15, 10289. https://doi.org/10.3390/su151310289
Jafarzadeh H, Feng Y. Economic and Spatial Restructuring in the Aras Economic Zone: The Impact of Cross-Border Cooperation. Sustainability. 2023; 15(13):10289. https://doi.org/10.3390/su151310289
Chicago/Turabian StyleJafarzadeh, Hamid, and Yangdong Feng. 2023. "Economic and Spatial Restructuring in the Aras Economic Zone: The Impact of Cross-Border Cooperation" Sustainability 15, no. 13: 10289. https://doi.org/10.3390/su151310289
APA StyleJafarzadeh, H., & Feng, Y. (2023). Economic and Spatial Restructuring in the Aras Economic Zone: The Impact of Cross-Border Cooperation. Sustainability, 15(13), 10289. https://doi.org/10.3390/su151310289