Abstract
The promotion of electric mobility has the potential to reduce several impacts of the road transport sector, such as increased emissions of greenhouse gas (GHG) and air pollutants and natural resource depletion. As such, decision makers and other stakeholders around the world have invested significant efforts in the transition to sustainable urban mobility based on the use of electric vehicles. However, there are few studies that investigate the potential benefits of electric mobility in all its facets; i.e., most focus on analyzing the benefits of replacing conventional cars while leaving aside other means of transportation with greater use and, consequently, higher emissions, such as, primarily, public transport and freight transport vehicles. Thus, this study aims to develop an action plan focused on electric mobility—APOEM, which stipulates gradual implementation steps in a time horizon of 5 years. For this purpose, a city with potential for electric mobility implementation called Atibaia, in the countryside of the State of São Paulo, in Brazil, is investigated. The results show that, in an ambitious scenario of electric vehicle deployment in the City of Atibaia, which presents energy supply compatible with demand, it would be possible to reduce a total of 30,788.70 tons of GHG in 5 years, and, as for emissions of air pollutants, it would be possible to reduce 140.38 tons of CO, 36.38 tons of NMHC, 1.58 tons of RCHO, 130.20 tons of NOx, 3.54 tons of MP and 0.75 tons of SO2 in 5 years. It is also worth noting that, in order for electrification to generate a greater contribution to the environment, it is necessary that electric mobility be generated from renewable energy sources.
1. Introduction
The transportation sector accounts for a large share of greenhouse gas (GHG) emissions because of its historical reliance on the use of petroleum-based fuels, emitting 8.7 Gt CO2eq in 2019, about 5.0 Gt CO2eq more than observed in 1990. This represents 23% of global energy-related CO2 emissions, where the road transport sector, which is highly dependent on the use of petroleum-based fuels, accounts for 70% of this total [1]. Thus, policy makers and other stakeholders have been looking for demand management solutions, combined with new technologies and emerging options in advanced biofuels and hydrogen-based fuels, in order to reduce these climate-changing emissions as global warming continues [2,3]. One of the most promising technologies is electric mobility, which consists of the use of vehicles, such as scooters, bicycles, cars, buses and trucks, that use electricity as a primary energy source [4,5] for the daily commuting of passengers and freights, which should be supported by sustainable energy production (cleaner power generation) for recharging (e.g., wind, solar, photovoltaic, etc.) [6,7]. Battery electric vehicles, for instance, have lower life cycle GHG emissions than internal combustion engine vehicles when charged with low-carbon (high-reliability) electricity [1,8].
Electric mobility not only significantly reduces energy consumption due to the high efficiency of electric motors and GHG emissions, and thus global warming and climate change [2], but also increases energy security and decreases public health expenditures from reduced air pollution [9], especially in large urban areas [10]. In addition, electric mobility provides lower noise levels than traditional vehicles [11]. However, as with any new technology, electric and hybrid vehicles also face barriers to large-scale adoption [12], such as low rates of diffusion and acceptance [9], need to build, expand or upgrade charging infrastructure [13], anxiety about adopting new production [14], high costs for consumers and producers [15], etc.
Furthermore, road transport electrification is part of an energy and technological transition, involves significantly higher initial financial investment than in the case of conventional technology and depends on specific conditions that favor the success of this initiative (choice) [2]. It thus becomes necessary to suggest/adopt a methodology (or procedure) that allows guiding decision makers on what is the best strategy (path) to follow for the introduction of electric mobility in cities. Thus, this paper serves this purpose by developing and applying the action plan focused on electric mobility—APOEM that fits the region/city under analysis. In order to demonstrate the usefulness of the plan, a case study city, called Atibaia, located in the countryside of the state of São Paulo, in Brazil, with great potential for deployment of electric mobility, is used through the use of data from various Brazilian entities and the city hall in question. It is worth noting, however, that the plan developed can be applied in other cities of similar size.
It is worth noting that this paper is aligned with the Sustainable Development Goals (SDGs) of the United Nations’ 2030 Agenda for Sustainable Development [16], and in particular to SDG 7—Clean and affordable energy: ensure access to affordable, reliable, sustainable and renewable energy for all; SDG 9—Industry, innovation and infrastructure: build resilient infrastructure, promote inclusive and sustainable industrialization, and foster innovation; SDG 11—Sustainable cities and communities: make cities and human settlements inclusive, safe, resilient and sustainable; SDG 12—Responsible consumption and production: ensure sustainable patterns of production and consumption; SDG 13—Action against global climate change: take urgent action to combat climate change and its impacts; SDG 17—Partnerships and means of implementation: strengthen the means of implementation and revitalize the global partnership for sustainable development.
This research is divided into five sections. Section 1 presents an introduction to the issue of environmental benefits of electric mobility and the main challenges in terms of governance. Section 2 provides an overview of the theoretical assumptions of electric mobility and action plans. Section 3 presents the research methodology as well as the development of the tool. Section 4 describes the application of APOEM and provides a discussion related to the issue, while Section 5 defines the conclusion, including recommendations for future studies.
2. Theoretical Background
Driven by environmental and economic issues, the urban mobility sector is undergoing significant changes worldwide. One of the main solutions is the implementation of electric vehicles as an alternative to fossil fuels. In this context, this section addresses urban mobility issues, including challenges and opportunities, as well as studies dealing with the implementation of action plans for the deployment of electric mobility, which aim to promote sustainability and energy efficiency. Together, these topics provide a comprehensive overview of the current trends in urban mobility and the strategies needed to successfully transition to a more sustainable transport system.
2.1. Urban Electric Mobility
Currently, no plan, project or public policy direction regarding the transportation sector mentions the concept of electricity-focused mobility [17]. A transition in passenger and freight mobility is becoming evident in cities around the world [18]. Thus, electric mobility is viewed by many as a promising option that plays an important role in many visions of the future. Low-carbon mobilities [19] have the potential to respond to long-term environmental and energy problems [20], especially in large urban areas, due to the characteristics of electric road vehicles (autonomy, walk-and-stop operation profile, etc.) and the challenges that are more concentrated in these regions [10,21], leading to an environmentally friendly image [15] with less of an impact on the quality of life of the urban population [6].
It is worth noting that the actions taken and the policies implemented by national, regional and local authorities have great relevance in the development of urban mobility focused on electric vehicles, making its promotion different from city to city and being important to exchange the lessons learned. However, a special interest in the electrification of mobility has been noted in several cities around the world, especially in developed countries [5]. In the literature, it was possible to identify that research with different focuses has been developed in recent years. In their study, Su Miao and Wang [22] provide an in-depth examination of the development trajectory of low-carbon cities, eco-cities and smart cities in Japan and China. The research delves into the coordinated advancement of intelligent environmental protection measures across various domains, such as government policies, transportation, energy utilization, resource recovery and community management. Furthermore, a comparative analysis of the smart city development characteristics between Japan and China is presented. The study explores measures for enhancing energy utilization, urban transportation and urban operations, which encompass the establishment of renewable energy systems, efficient energy utilization and the implementation of citizen participation policies. The insights gained from these experiences offer viable approaches for the construction of smart cities in Asia, contributing significantly to sustainable urban applications and practices. By means of literature review, Ruggieri et al. [23] studied the strategies that six smart cities (London, Hamburg, Oslo, Milan, Florence and Bologna) have implemented to encourage the transition to electric mobility. The analysis showed, in general, that the policies have worked, inducing reductions in air pollutants and consequently improving air quality for the population of these urban centers. In particular, the cities that showed the most significant reduction in pollutants (above 20%) were Hamburg (−28% PM2.5 and −26% NO2), Milan (−25% PM2.5 and −52% NO2) and London (−26% NO2). Within the Latin American context, Filho et al. [24] provide a comprehensive description of the policy measures implemented to promote the development of electromobility in specific regions of South America, including Buenos Aires (Argentina), São Paulo (Brazil), Santiago (Chile) and Bogotá (Colombia). Through the selected case studies, the study highlights the significance of institutional robustness for facilitating sustainable transition initiatives. The findings shed light on the current trajectories observed in South America, revealing several key aspects: (i) the prominence of the electric bus segment in the regions, driven by a combination of private sector initiatives and governmental policy support, has led to the emergence of new businesses and projects centered around technological experimentation; (ii) the examination of political considerations related to involvement in the lithium production chain for batteries indicates a potential path towards economic integration and (iii) the technological dependency observed in the light vehicle and two-wheeler segments, underscoring the need for advancements in this area.
Leal Filho et al. [6] conducted a comprehensive literature review and provided a detailed analysis of the current development of electric mobility in Europe, assessing aspects related to the tripod of sustainability (i.e., the economic, social and environmental spheres) in a circular economy context. The results show that creating an electric mobility agenda that does not consider the circular economy will be less successful in unlocking the medium-term co-benefits of decarbonization of transport, construction and energy sectors. In a study conducted by Kresnawan et al. [25], an assessment was carried out to determine the readiness for the introduction of electric mobility in Southeast Asia, with a particular focus on the supporting policy perspective. The study uses the PEST framework (political, economic, social, technological) to evaluate the readiness of these policies. Through a comprehensive analysis and identification of critical factors influencing the implementation of electric mobility, the study presents policy recommendations aimed at facilitating its successful adoption and integration. Piazza et al. [26] developed a methodology to optimally define and design electric services for a local energy community that receives power from a microgrid based on the exploitation of renewable energy sources and storage systems. From the analysis of the results of a survey created to identify the needs of end users, the model determines the optimal configuration of the electric mobility system consisting of buses, cars, bicycles and charging points. The optimization model also investigates the opportunity to upgrade the set of renewable energy and storage technologies present in the campus microgrid to which the electric mobility infrastructures will be connected.
Carteni et al. [7] sought to critically analyze the weaknesses and strengths and fields of application of electric mobility in Italy. The results indicate that the electric vehicle today has high production costs, low autonomy and no “zero” environmental impacts from the production, movement and recycling of the vehicle. However, “local emissions” are zero and this makes this technology useful for urban mobility, where high population density often occurs. Skrúcaný et al. [27] addressed the issue of electric vehicle operation from the point of view of the environmental impact of electricity production, and specifically the energy efficiency of its production using primary sources of energy production, by comparing parameters measured for individual countries chosen from the Central European region. The results show that quantification of the positive environmental consequences of increased electric mobility varies widely across different countries, meaning that its large-scale deployment necessarily delivers the transportation sustainability expected of it. Held and Geritts [28] conducted a qualitative comparative analysis (QCA) whose aim was to identify configurations of urban electric mobility policies in 15 European cities at national and local levels that lead to the successful promotion of electric vehicles. The results show that policies that have a stronger effect on the total cost of ownership of electric vehicles, in conjunction with encouraging the installation of home chargers or charging points in private parking spaces, and the deployment of a public charging network in conjunction with push-factors that discourage the use of conventional cars lead to favorable results.
Biresselioglu, Kaplan and Yilmaz [9] sought to identify and map the motivators and barriers to the diffusion of electric mobility through three levels of decision making: (i) formal social units; (ii) collective decision making units and (iii) individual units. The results identify that the main barriers are lack of charging infrastructure; economic constraints and cost concerns; technical and operational constraints; lack of trust; lack of information and knowledge; limited supply of electricity and raw materials and practicality concerns. The main motivators are the environmental, economic and technical benefits associated with electric vehicles, as well as personal and demographic factors. Ajanovic and Haas [29] identified the main impact factors for the wider spread of electric vehicles in urban areas by comparing and analyzing fourteen cities from nine different countries that are active in the spread of this type of vehicle. The results show that all monetary and non-monetary promotion measures implemented should depend on the environmental benignity of the electricity generation mix; i.e., it only makes sense if it is ensured that most of the electricity will be generated from renewable sources. Comodi et al. [30] performed a techno-economic analysis of a local utility’s investment in a central Italian region taking into account medium- and long-term forecasts of electricity and fuel prices, as well as electric car market share and economic risk. The results showed that an investment in urban charging station infrastructure in Italy can be profitable even without incentives, with a payback period of 4 to 5 years.
In their review of the literature, Ajanovic, Siebenhofer and Haas [5], however, point out that there are still few contributions that address electric mobility in all its facets; i.e., there are many papers focusing on electric cars despite their lower relevance in relation to high-use vehicles, such as public transportation, e.g., subways and streetcars. To make matters worse, studies on the electrification of freight transport, such as light commercial vehicles and trucks (light, medium and heavy), which even cause more serious environmental and health problems than passenger transport, and the policies needed for their implementation are even scarcer [31].
The study conducted by Gruber, Kihm and Lenz [32] sheds light on the promising utilization of electric cargo bikes as a new solution for urban freight transportation. This research emphasizes the potential benefits and feasibility of incorporating electric cargo bikes into existing logistics systems, offering an environmentally friendly and efficient alternative for urban delivery operations. Furthermore, Giglio, Musmanno and Palmieri [33] highlighted that the choice of bike model plays a significant role in determining profit and profitability. Notably, combining cargo bikes and tricycles yielded the highest levels of profit and profitability. Additionally, the electrification of these vehicles was found to extend the reach of micromobility. Moreover, a mix of trailers, tricycles and cargo bikes was identified as a promising approach for achieving high volumes and market shares.
2.2. Action Plan for Electric Mobility
Considering all the negative impacts of the transport sector on sustainable development, it is increasingly necessary to implement action plans for the deployment of electric mobility in cities. These plans seek to promote sustainability and energy efficiency in the transport sector, as well as to reduce air and noise pollution in cities. However, studies on this topic are still scarce in the scientific literature. In an attempt to minimize this gap, Lombardi et al. [34] indicate that an action plan focusing on electric mobility should:
- Take a multisectoral and market-specific approach: To address new mobility patterns with more intelligent and environmentally friendly energy systems, it is recommended to adopt a market-specific approach that takes into account all relevant stakeholders. This includes energy, mobility and infrastructure companies, as well as policy makers, regulators and urban planners, who can collaboratively establish a new model for cities. Since investment and infrastructure requirements for promoting electric mobility differ significantly across locations, any strategy must be tailored to the market in question. When planning for electrification, local stakeholders should consider the unique features of the area, such as infrastructure and urban design, the energy system, mobility culture and patterns.
- Prioritize high-use vehicles: To maximize the impact of efforts to reduce CO2eq and air pollutant emissions in cities, the emphasis should be on electrifying public fleets (such as public or private transport) and commercial fleets (such as freight transport). These fleets typically travel longer distances and rely heavily on diesel, resulting in significant emissions. Studies show, for instance, that, in Brazil, buses represent only 0.6% of the circulating road fleet; however, they are responsible for half (50%) of the passenger activity and 11% of the energy demand. In addition, trucks used in urban freight transport (UUT) represent only 1.3% of the circulating fleet and about 10% of freight activity and energy demand [35].
- Deploy critical charging infrastructure today while anticipating the transformation of mobility: In order to meet the growing demand for electric vehicles and alleviate range anxiety concerns, the installation of charging infrastructure is necessary, particularly along highways, at destinations and near public transportation hubs. This infrastructure should be coupled with advanced grid technologies, such as decentralized generation, storage, microgrids and smart buildings, and integrated into smart grids to fully leverage the flexibility of electric vehicles while ensuring power system stability. Digitalization can simplify and enhance the customer experience, support efficient infrastructure deployment and management and also enable new services associated with electric, shared and autonomous mobility. Furthermore, charging stations can be transformed into smart city service centers.
By joining forces, public and private stakeholders can adapt these principles to optimally converge mobility and energy and consequently enable cities to better meet climate goals, support energy efficiency, promote service and infrastructure innovation and generate economic growth, ultimately providing great benefits to citizens [34]. Special attention should also be afforded to the low number of studies that address this perspective in developing countries. Thus, a systemic view on the topic is needed, which is crucial for policy makers in these countries to understand the barriers and opportunities related to different types of electric vehicles [14].
In this regard, Galuszka et al. [36] investigated what policy-level and stakeholder solutions are established in the context of electric mobility in Dar es Salaam (Tanzania), Kigali (Rwanda), Kisumu (Kenya) and Nairobi (Kenya), and also in what ways they attempt to address the implementation of electric mobility solutions. The results show that, despite a growing number of policies (especially in Rwanda and Kenya), a number of financial and technical barriers persist, such as high upfront investment costs for vehicles and charging infrastructure, as well as a perceived lack of competitiveness with fossil fuel vehicles that restrict the adoption of electric mobility initiatives.
3. Materials and Methods
The methodology employed to develop the action plan focused on electric mobility—APOEM involved the following steps, as also presented in Figure 1: (i) literature review on the theme; (ii) discussion among experts focused on establishing steps for electrification of mobility; (iii) creation of the APOEM itself; (iv) estimation of greenhouse gas emissions avoided with the application of each of the APOEM steps, as well as emissions of air pollutants avoided; (v) estimation of the amount of electricity demanded from the grid and comparison with the data provided by the energy supply company and (vi) sensitivity analysis of the results given the implementation of APOEM.
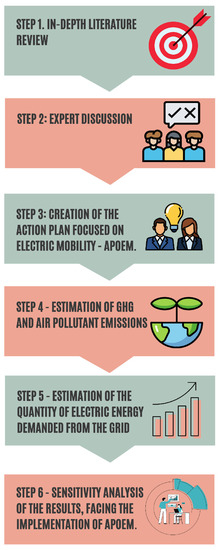
Figure 1.
Steps of the methodology.
Step 1 consisted of using databases such as Web of Science, ScienceDirect and Scopus in order to search studies that seek to ascertain how electric mobility can be gradually implemented in cities and regarding the apparatus that must exist for its promotion (such as the use of smart grids and the Internet of Things). It is also worth noting that, in this step, a verification of the study’s relevance was also performed. It is important to evaluate whether the study provides new contributions to the research field and whether it can have a significant impact in the area. The reason for such evaluation is that articles with objectives already investigated in the literature may not provide new inputs to the scientific literature.
In Step 2, a group of experts specializing in transportation, particularly in the field of electric mobility, conducted a brainstorming session to identify the most effective steps for the electrification of mobility. The objective was to determine not only which sectors should be prioritized for electrification but also the optimal sequence for implementing these electrification measures. It is important to highlight that the literature review conducted in Step 1 provided valuable support and insights for this decision making process. During the brainstorming session, the experts leveraged their extensive knowledge and experience to evaluate various factors, such as feasibility, impact and potential benefits associated with the electrification of different sectors. Through collaborative discussions and exchange of ideas, the group identified the key steps and proposed a strategic sequence for the electrification process. The utilization of the literature review in Step 1 played a crucial role in informing the brainstorming session. It provided a foundation of existing research, case studies and best practices, which served as a valuable resource for the experts. This comprehensive understanding of the current state of the field enabled them to make informed decisions and identify the most appropriate steps for the electrification of mobility.
With the application of Steps 1 and 2, we move on to Step 3, which consists of the development of the APOEM itself. It is believed that the implementation of an action plan focused on electric mobility at the city level should follow the following order, as shown in Figure 2: (1) electrification of the public collective transport fleet and the urban freight transport fleet; (2) electrification of the city hall’s own fleet; (3) electrification of public individual transport (cabs) and private individual transport (ridesharing through the use of applications); (4) electrification of micromobility; (5) electrification of private vehicles and (6) integration of all systems through smart grids and Internet of Things. It is important to mention that this electrification prioritization order was also obtained through brainstorming and literature review.
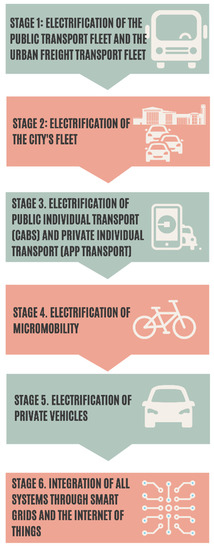
Figure 2.
APOEM implementation stages.
Following the methodology, a quantification of avoidable GHG emissions and air pollutants with the implementation of APOEM is the objective of Step 4. There are two methods for calculating emissions in the road transport sector, i.e., the simple method and the detailed method [37,38]. The choice of the method mainly depends on the availability of data [39].
The simple method is based on vehicle type and fuel consumption. Aggregated sectoral fuel consumption data are considered basic requirements [39]. Total emissions for each pollutant species and fuel type are calculated based on Equation (1).
where
= Vehicle type;
= Pollutant emissions () from vehicle type ();
= Fuel consumption of vehicle type j and
= Emission factor of pollutant for vehicle type ().
In the detailed method, total emissions are calculated by considering activity data for each vehicle category and appropriate emission factors. These emission factors vary according to the input data (driving situations, weather conditions, etc.). The expression for calculating emissions in the detailed method is presented in Equation (2).
where
= Class of vehicle () and type of road ()—urban or rural;
= Emissions of pollutant in grams (g) during the reference year by vehicle class () driven on type roads;
= Number of vehicles (veh.) of class in circulation in the reference year;
= Annual mileage per vehicle (km/veh.) driven on type road by vehicle class () and
= Baseline emission factor representative of the fleet average in g/km for pollutant , for vehicle class , operated on road type .
The simple method (Equation (1)) requires fewer variables than the detailed method (Equation (2)) and has the advantage of enabling the elimination of the dependence on engine size. However, fuel consumption statistics have greater uncertainties compared to total distance traveled. In this regard, if the data are available, the detailed method is strongly suggested. Otherwise, the Emission Inventory Manual of the United Nations Environment Programme also provides guidance on how to calculate emissions using the fuel-mass-based approach [39].
During Step 5 of the process, a crucial aspect is to assess the feasibility of electricity supply from power distribution companies within the project horizon. This entails conducting a comprehensive evaluation of the energy demand associated with the electrification of the city’s fleet and comparing it with the capacity that these companies can provide. This analysis plays a vital role in demonstrating the practicality and effectiveness of the plan as it ensures that the required energy resources are in line with the electrification goals. To accurately estimate the energy demand, factors such as the size and composition of the city’s fleet, charging infrastructure requirements and anticipated future growth must be taken into consideration. By quantifying the expected energy consumption, it becomes possible to assess the compatibility of the planned electrification goals with the capacity of the power distribution companies. This assessment serves as a critical checkpoint in the process, enabling decision makers to gauge the feasibility of the proposed plan and make informed choices. It ensures that the necessary infrastructure and resources are available to support the envisioned electrification of the city’s fleet. In cases where the energy demand exceeds the current capacity, proactive measures can be taken, such as upgrading infrastructure, increasing generation capacity or implementing demand management strategies.
Moving forward to Step 6, a sensitivity analysis is conducted, which involves the valuable input of esteemed specialists in the field. This analysis allows for a comprehensive examination of potential variations and uncertainties, taking into account key factors and variables that may influence the successful implementation of the plan. By incorporating the expertise of these specialists, the plan is further enhanced, considering various scenarios and ensuring its robustness in different circumstances.
These steps collectively contribute to the comprehensive and reliable nature of the plan, enabling decision makers to make informed choices, address potential challenges and optimize the implementation of electric mobility initiatives in the city. By adopting the APOEM framework, decision makers can benefit from a structured and comprehensive approach that facilitates the planning and implementation of electric mobility initiatives. This methodology provides a step-by-step guide for assessing the current state of electric mobility, identifying key stakeholders, evaluating infrastructure requirements and formulating a strategic roadmap for successful integration.
4. Results
In order to represent the methodology presented in Section 3, this study considered a city located in the State of São Paulo called Atibaia, which has a high potential for implementation of electric mobility, including the use of smart grids. To this end, the emission calculation methods, the data survey, the adopted assumptions as well as the main results obtained with the quantification of GHG emissions and air pollutants (CO, NMHC, RCHO, NOx, PM and SO2) are presented. In addition, an analysis was performed to verify if the energy demand would be supplied to the city under analysis with the current electrical grid.
4.1. Data Survey in the Reference City
Firstly, some essential information/data inputs of the region under study were required, such as the estimation of the vehicle fleet (number of vehicles in the fleet) in the region, sorted by type of vehicle and type of fuel used, as exposed in Table 1. This table was developed using raw data from CETESB [40] and enabled to determine total emissions of GHG and air pollutants by the road transport sector in Atibaia using the methodological approaches and emission calculation methods presented in Section 3.

Table 1.
Historical estimate of Atibaia’s vehicle fleet.
In order to obtain results that demonstrate the benefits of applying APOEM, which is one of this project’s objectives, it was also necessary to estimate the future fleet of vehicles as of 2022 so that the scenarios of incorporation of electric vehicles (from 2022 to 2026) represent reality more faithfully. Thus, the unconditional demand forecast method by geometric or exponential projection was used, as shown in Equation (3).
where
= demand in year “”;
= demand in the baseline year;
= annual growth rate and
= number of years elapsed after the baseline year.
By applying the method, it was possible to estimate future demand (unit equals number of vehicles in the fleet) by vehicle type and fuel type, as shown in Table 2.
Table 2.
Estimate of the future vehicle fleet in Atibaia—Baseline Scenario.
After applying the method, an analysis was performed by specialists on all the results obtained for future years in order to verify their consistency. In this sense, it is believed that, for car, light commercial vehicle, bus and motorcycle fleets, the results can be represented by the method of unconditional demand forecast by geometric or exponential projection using the historical growth rate. However, it was considered pertinent to adjust the historical growth rate of the fleet of trucks of all types (semi-light, light, medium, semi-heavy and heavy trucks) considering a possible growth of 1.9% due to the growth in urban freight delivery experienced in the last few years because of the COVID-19 pandemic.
4.2. Premises Made
With the future motor vehicle fleet of Atibaia—Baseline Scenario, it is possible to estimate the future fleet of electric vehicles. For this, it is necessary to determine the electric vehicle fleet that will be introduced in Atibaia considering APOEM steps. Thus, in Table 3, the assumptions adopted for each step are presented. It is noteworthy that the APOEM foresees the incorporation of 1497 electric vehicles in a 5-year horizon, i.e., from 2022 to 2026.
Table 3.
Electrified fleet by APOEM step.
Before presenting the results of the GHG emission estimates for Atibaia considering the chosen scenarios, it is worth highlighting some assumptions related to these estimates, as indicated in Table 4 and Table 5.
Table 4.
Premises related to the estimates of GHG emissions.
Table 5.
Premises related to air pollutant emission estimates.
4.3. Quantification of Emissions
The scenarios used for the application of APOEM are presented in Table 6. It is noteworthy that the proposed scenarios present as a limitation the non-consideration of Step 4—Micromobility Electrification as a possibility of replacing short and medium trips made by cars with bicycles. This occurs due to the lack of information and data on demand and supply of trips in the shared bicycle system in Atibaia and its connection with other modes.
Table 6.
Proposed scenarios.
With the establishment of scenarios, the quantification of emissions is carried out, according to the reasoning exposed in Section 4.1 and Section 4.2. The results related to GHG emissions are indicated in Figure 3, while the results related to air pollutants are presented in Figure 4, Figure 5, Figure 6, Figure 7, Figure 8 and Figure 9.
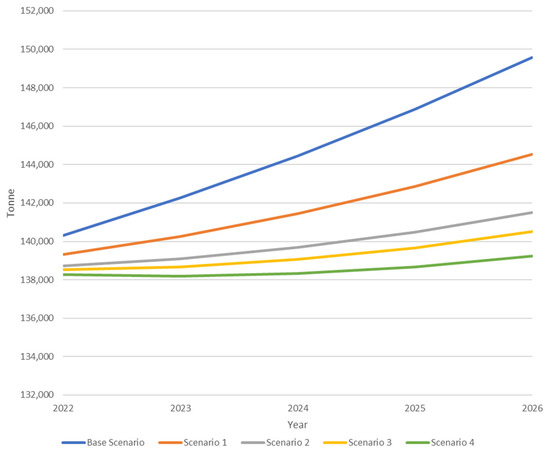
Figure 3.
Estimated GHG emissions (tons/year) of Atibaia by scenario.
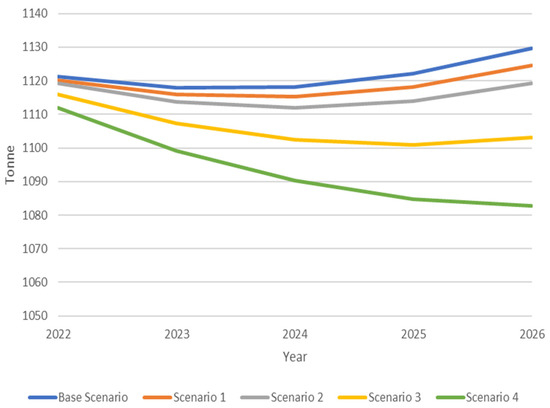
Figure 4.
Estimate of Atibaia’s CO emissions (tons/year) by scenario.
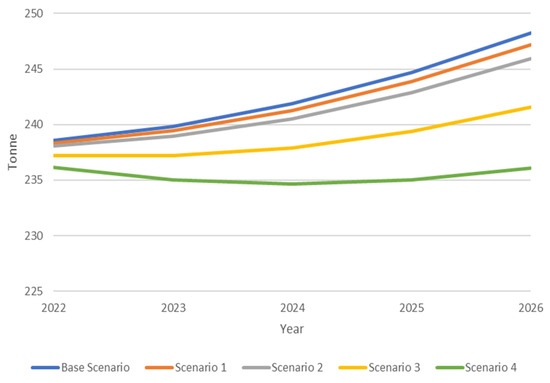
Figure 5.
Estimate of NMHC emissions (tons/year) of Atibaia by scenario.
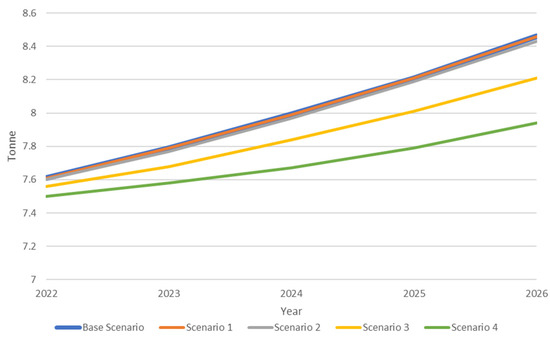
Figure 6.
Estimate of RCHO emissions (tons/year) of Atibaia by scenario.
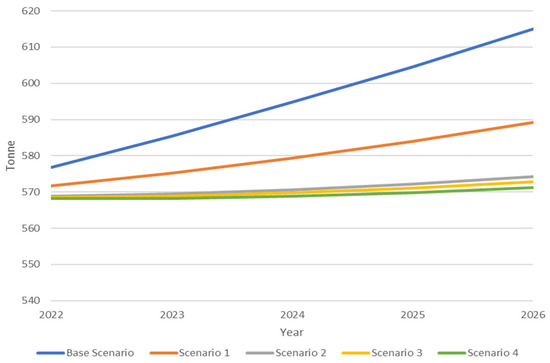
Figure 7.
Estimate of NOx emissions (tons/year) of Atibaia by scenario.
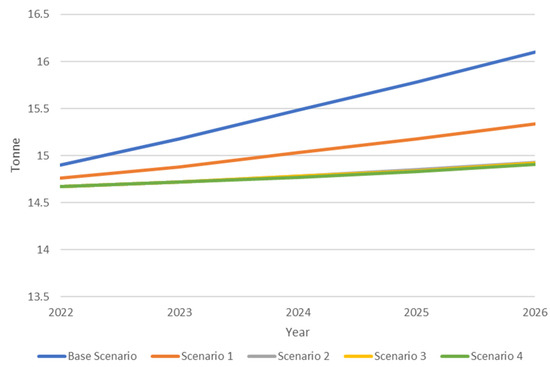
Figure 8.
Estimated PM emissions (tons/year) of Atibaia by scenario.
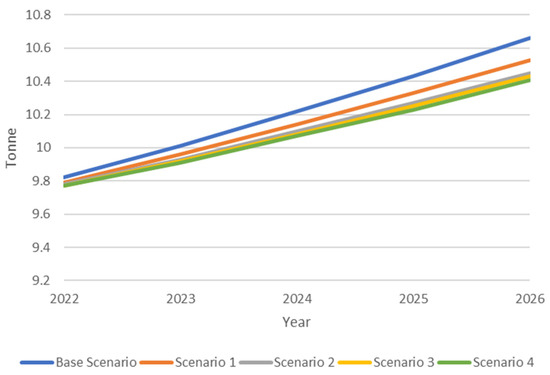
Figure 9.
Estimate of Atibaia’s SO2 emissions (tons/year) by scenario.
Regarding GHG emissions specifically, as shown in Figure 3, it is observed that, among all scenarios, as expected, each time a step is implemented, gradual reductions are realized, highlighting the differences between the Baseline Scenario and Scenario 1. In order to exemplify the electrification of freight and passenger transportation, we observed (i) 0.71% of emissions in 2022; (ii) 1.41% of emissions in 2023; (iii) 2.08% of emissions in 2024; (iv) 2.72% of emissions in 2025 and (v) 3.36% of emissions in 2026. This corresponds to 15,046.08 total tons in 5 years with the application of Scenario 1 compared to the Baseline Case. Furthermore, considering the emissions of Scenario 4, the most electrified scenario, relative to the Baseline Scenario (the non-electrified scenario), results in 30,788.70 total tons in 5 years.
As for the CO emissions by scenario, one can notice, according to Figure 4, that the largest emission reductions happen between Scenarios 2 and 3 (addition of Step 3) and Scenarios 3 and 4 (the effect of adding Step 5). This is because, between these scenarios, there is a greater electrification of light vehicles (cars) that consume gasoline, which release high loads of CO into the atmosphere. It is also noteworthy that, with the application of all steps, 140.38 tons (2.50% of the total) of CO would be reduced in 5 years in relation to the Baseline Scenario.
Analyzing Figure 5, it is identified that, as well as CO emissions, NMHC emissions are higher between Scenarios 2 and 3 and Scenarios 3 and 4. In addition, with the electrification of all steps, 36.38 tons of NMHC would be reduced in 5 years.
In Figure 6, following the same reasoning of Figure 4 and Figure 5, the largest RCHO reductions occur with the electrification of light vehicles (cars) between Scenarios 2 and 3 and Scenarios 3 and 4. In fact, among the other scenarios, almost no variations were observed. It is also noteworthy that 1.58 tons of RCHO would be reduced in 5 years with the application of all steps (Scenario 4).
By analyzing Figure 7, among all scenarios, the largest reductions in NOx are between the Baseline Scenario and Scenario 1 and Scenarios 1 and 2, with no significant variations in the other scenarios. The application of all steps generates 130.20 tons (4.37% of the total) of NOx in 5 years.
A behavior similar to that of NOx also occurs concerning PM (Figure 8), with larger reductions between the Baseline Scenario and Scenario 1 (most representative) and Scenarios 1 and 2. Furthermore, in the 5 years of progressive electrification, there is a possible reduction of 3.54 tons (4.57% of the total) of PM between the Baseline Scenario and Scenario 4.
Finally, by Figure 9, it is believed that 0.75 tons (1.46% of the total) of SO2 would be reduced in 5 years, and a large portion of this contribution happens between the baseline and Scenario 1 (implementation of Step 1) and Scenarios 1 and 2.
4.4. Comparison of the Results with the Energy Made Available in the Grid by Neoenergia
In order to identify the potential of the additional energy demand with the implementation of the action plan steps to impact the annual energy supply of Neoenergia Elektro, the company that supplies energy to the case study region, it was considered pertinent to compare this additional demand by scenarios, according to what is presented in Table 7, with the company’s supply in the years 2020 and 2021, as presented in Figure 10.
Table 7.
Estimated electric energy consumption per year (kWh) per scenario.
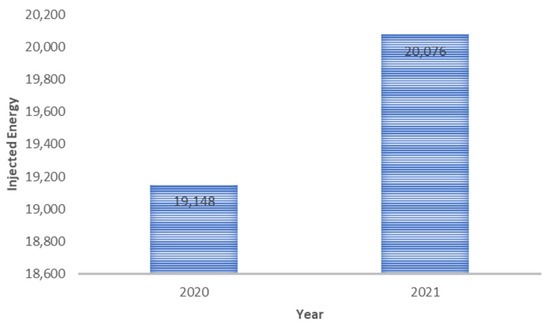
Figure 10.
Injected energy (GWh) per year referring to Neoenergia Elektro. Source: Neoenergia [46].
With the data presented in Figure 10, one can see that, in the most comprehensive scenario (Scenario 4) of APOEM, the energy demand reaches 19,468,956 kWh or 19.5 GWh in 2026, which represents less than 0.1% of the energy supplied by Neoenergia Elektro in 2021. Assuming that this supply will grow until 2026, it is understood that the impact of the electrification of mobility in terms of energy demand would be low for Neoenergia Elektro’s current and future supply patterns.
4.5. Evaluation of the Consistency of the Emission Inventory Results in the Reference Comparison between Energy Demanded and Supplied
For the evaluation of the consistency of the results, a consultation with experts directly related to the area under investigation was carried out in order to obtain information and qualitative opinions regarding the steps of the research. Thus, the calculation tables, as well as the complete article, were sent to these specialists, who were able to evaluate the material within a period of one week. With the feedback from the evaluators, it was possible to ascertain the validity of the procedure, as well as to refine analyses.
4.6. Discussion
In addition to the consulting experts, other measures were taken to ensure the robustness and reliability of the research findings. Firstly, a comprehensive literature review was conducted to gather existing knowledge and insights related to the area of investigation. This allowed for a solid theoretical foundation and helped to identify any existing gaps in the research.
In this regard, it is important to highlight the alignment of this paper with the findings of Lombardi et al. [34], which emphasize the prioritization of high-use vehicles as a key principle in the realm of electric mobility. The research conducted by Lombardi et al. [34] resonates with the present study as both emphasize the significant environmental benefits that can be achieved by prioritizing vehicles such as the ones used in public transport fleets and urban freight transport.
The findings of this study confirm the notion that prioritizing high-use vehicles, such as the ones used in public transport fleets and urban freight transport, has the potential to yield substantial reductions in GHG emissions, as well as in the emission of air pollutants such as NOx, PM and SO2. These emissions reductions are of utmost importance given their detrimental impacts on both air quality and public health.
Furthermore, the research methodology employed rigorous data collection techniques. Primary data were collected through surveys and interviews depending on the nature of the study. Careful attention was afforded to sampling techniques in order to ensure representative and diverse participants and consequently increase the generalizability of the findings.
The collected data were then analyzed by using either appropriate statistical or qualitative analysis techniques depending on the research goals and the nature of the data. The analytical methods selected were validated through consultation with experts in the field, ensuring that the data were interpreted correctly and accurately.
Moreover, the research findings were presented and discussed during meetings, allowing for peer review and constructive feedback from other Brazilian researchers. This iterative process of presenting and refining the research findings contributed to the overall credibility of the study.
By employing these rigorous research practices, including expert consultation, thorough literature review, robust data collection, careful analysis and peer review, the research aimed to ensure the consistency and validity of the results. The feedback and insights provided by the experts who evaluated the material further contributed to refine the analyses and to strengthen the overall conclusions of the research.
As with any study, it is crucial to recognize certain limitations that may affect the generalizability and impact of the research findings. In this regard, it is important to acknowledge that the scope of this study is confined to a specific area or context. Consequently, the direct applicability of the obtained results to other regions or situations may be limited. Thus, it is imperative to conduct further studies in diverse settings to validate and reinforce the outcomes.
By acknowledging this limitation, we emphasize the need for caution when extrapolating the findings beyond the specific area or context of this study. While the insights and conclusions drawn from this research contribute valuable knowledge, their wider applicability may depend on the unique characteristics and circumstances of different regions or situations.
To enhance the robustness and reliability of future studies, it is recommended to undertake research in various settings, encompassing different geographic areas, socio-economic contexts and cultural backgrounds. This approach would enable a more comprehensive understanding of the subject matter and facilitate the development of strategies and interventions that are tailored to specific contexts.
Additionally, it is worth noting that this study did not quantify pollution emissions associated with electricity supply. However, it is crucial to consider the source of electricity, prioritizing renewable sources such as wind and solar energy, in order to minimize environmental impacts. The inclusion of electricity-related emissions would provide a more comprehensive understanding of the overall environmental footprint of the analyzed system.
Moreover, apart from the environmental aspects, it is imperative to recognize the necessity for an economic analysis in order to assess the financial feasibility of implementing APOEM stages. While APOEM holds potential for emission reduction and environmental benefits, it is essential to evaluate its cost-effectiveness and practicality within the existing economic framework. This evaluation would entail a thorough examination of upfront investment costs, operational expenses, potential revenues and the overall economic sustainability of implementing different stages of APOEM.
By conducting a comprehensive economic analysis, policy makers and stakeholders will be able to gain insight into the financial implications and potential challenges associated with the widespread implementation of APOEM stages. This assessment would facilitate informed decision making, considering both environmental and economic factors, in order to determine the viability and long-term sustainability of incorporating APOEM into existing systems.
The development and application of the APOEM in this paper serve a crucial purpose. By addressing the specific needs and characteristics of the region or city under analysis, APOEM provides a valuable framework for guiding decision makers on the implementation of electric mobility initiatives. The case study conducted in Atibaia, a city located in the countryside of the State of São Paulo (Brazil), exemplifies the plan’s usefulness and practicality.
Atibaia, chosen due to its significant potential for electric mobility deployment, serves as a tangible example that demonstrates the effectiveness of APOEM. The data gathered from various Brazilian entities and the city hall further support the applicability and relevance of the plan. It is important to emphasize that the plan developed is not limited to Atibaia but can also be adapted and implemented in other cities of similar size, fostering sustainable and efficient electric mobility solutions across different urban contexts.
By employing the APOEM framework, decision makers can navigate the complexities associated with the introduction of electric mobility, resulting in a well-informed and well-executed transition plan. This approach aims to maximize the benefits of electric mobility while minimizing potential risks and obstacles, thereby facilitating the sustainable and efficient integration of this technology into urban environments.
5. Conclusions
Given the need for vehicle electrification to reduce the environmental burden of the road transport sector and achieve sustainable urban mobility, this paper sought to develop an action plan for the implementation of electric mobility, taking as a case study a city called Atibaia in the State of São Paulo in Brazil.
An analysis regarding GHG reduction shows that, if all steps were implemented, there would be a reduction of 30,788.70 tons of total GHG emissions in 5 years. It emphasizes Step 1, which corresponds to the electrification of freight transport vehicles (light commercial vehicles and trucks) and public transport (mainly buses). This confirms the results of other studies, such as Lombardi et al. [34], which suggest that a prioritization of high-use vehicles should be carried out in order to achieve a greater impact because they have a higher number of kilometers traveled and use diesel as their main fuel.
As for the emissions of atmospheric pollutants, the results show that (i) for CO, the most significant reductions occur with the implementation of Scenarios 3 and 4; (ii) for NOx, the most significant reductions occur with the implementation of Scenarios 1 and 2; (iii) for PM, the most significant reductions occur with the implementation of Scenarios 1 and 2, with a negligible participation of the other scenarios and (iv) for SO2, the most significant reductions occur with the implementation of Scenarios 1 and 2.
It is worth mentioning that, for the promotion of sustainable urban mobility through electric mobility, it is necessary to adopt policies at all government levels that encourage its use, such as subsidies for the purchase of electric vehicles, implementation of electric vehicle sharing systems and charging stations for private and public vehicles and for passengers and freight as well as the implementation of smart grids and Internet of Things. Furthermore, the electricity supply must be generated through renewable sources so that the environmental burden generated by transportation in the region is minimal.
It is believed that this paper serves as a tool for transportation decision makers to highlight the importance of implementing electric mobility through a quantitative study, with a focus on high-use vehicles, in order to minimize the impacts of the transportation sector on emissions of GHG and air pollutants. Through its implementation, it is believed that countries such as Brazil, whose transportation sector accounts for more than half of the fossil fuel consumption and for almost half of the energy sector GHG emissions, will be able reach their global goals established during the Paris Climate Conference (COP21).
The development and application of the APOEM methodology represent a significant contribution to the field of electric mobility planning. Its robustness lies in its tailored approach, ensuring that decision makers have access to a reliable and effective tool for devising and implementing strategies that promote the widespread adoption of electric mobility in cities.
Author Contributions
Conceptualization, V.H.S.D.A.; Data curation, V.H.S.D.A.; Formal analysis, V.H.S.D.A.; Investigation, V.H.S.D.A.; Methodology, V.H.S.D.A., M.d.A.D. and A.C.M.A.; Project administration, M.d.A.D. and L.G.M.; Resources, M.d.A.D.; Supervision, M.d.A.D., A.C.M.A. and L.G.M.; Validation, V.H.S.D.A., M.d.A.D., A.C.M.A., L.G.M. and P.J.P.C.; Visualization, V.H.S.D.A.; Writing—original draft, V.H.S.D.A.; Writing—review and editing, V.H.S.D.A. and P.J.P.C. All authors have read and agreed to the published version of the manuscript.
Funding
The authors of this study would like to express their gratitude for the generous support provided by NeoEnergia Company during the execution of the “Externalities of Smart Electricity Networks—Case Study Atibaia, Sprint 2—Electric Mobility” project. This work was partially supported by the National Council for Scientific and Technological Development (CNPq), under grant #405538/2022-7 (CNPq/FNDCT/MCTI 15/2022) and #305697/2020-0 (research productivity—PQ). This work was supported by Carlos Chagas Filho Foundation for Research Support of the State of Rio de Janeiro, under grant #2021007191.
Institutional Review Board Statement
Not applicable.
Informed Consent Statement
Not applicable.
Data Availability Statement
Not applicable.
Conflicts of Interest
The authors declare no conflict of interest.
References
- IPCC. Climate Change 2022: Impacts, Adaptation and Vulnerability; Working Group II Technical Support Unit, Cambridge University Press: Cambridge, UK, 2022. [Google Scholar]
- Santos, A.S.; de Abreu, V.H.S.; de Assis, T.F.; Ribeiro, S.K.; Ribeiro, G.M. An Overview on Costs of Shifting to Sustainable Road Transport: A Challenge for Cities Worldwide. In Environmental Footprints and Eco-Design of Products and Processes; Springer: Singapore, 2021; pp. 93–121. [Google Scholar] [CrossRef]
- de Assis, T.F.; Ricci, L.M.; Monteiro, T.G.M.; de Abreu, V.H.S.; D’Agosto, M.d.A.; Santos, A.S. Sustainable Transport Indicators and Mitigation Actions Applied to the Green Bond Principles. In Carbon Footprints of Manufacturing and Transportation Industries; Springer: Singapore, 2022; pp. 139–169. [Google Scholar] [CrossRef]
- Cartenì, A.; Henke, I.; Molitierno, C.; Di Francesco, L. Strong Sustainability in Public Transport Policies: An e-Mobility Bus Fleet Application in Sorrento Peninsula (Italy). Sustainability 2020, 12, 7033. [Google Scholar] [CrossRef]
- Ajanovic, A.; Siebenhofer, M.; Haas, R. Electric Mobility in Cities: The Case of Vienna. Energies 2021, 14, 217. [Google Scholar] [CrossRef]
- Leal Filho, W.; Abubakar, I.R.; Kotter, R.; Grindsted, T.S.; Balogun, A.L.; Salvia, A.L.; Aina, Y.A.; Wolf, F. Framing Electric Mobility for Urban Sustainability in a Circular Economy Context: An Overview of the Literature. Sustainability 2021, 13, 7786. [Google Scholar] [CrossRef]
- Carteni, A.; Henke, I.; Molitierno, C.; Errico, A. Towards E-Mobility: Strengths and Weaknesses of Electric Vehicles. In Proceedings of the Workshops of the International Conference on Advanced Information Networking and Applications, Caserta, Italy, 15–17 April 2020. [Google Scholar] [CrossRef]
- da Costa, M.G.; de Abreu, V.H.S.; de Assis, T.F.; da Costa, V.X.; de Almeida D’Agosto, M.; Santos, A.S. Life Cycle Assessment and Circular Economy Strategies for Electric Vehicle: A Systematic Review on Mitigating Climate Change and Reducing Resource Depletion in Road Transportation. In Carbon Footprints of Manufacturing and Transportation Industries; Springer: Singapore, 2022; pp. 113–137. [Google Scholar] [CrossRef]
- Biresselioglu, M.E.; Demirbag Kaplan, M.; Yilmaz, B.K. Electric Mobility in Europe: A Comprehensive Review of Motivators and Barriers in Decision Making Processes. Transp. Res. Part A Policy Pract. 2018, 109, 1–13. [Google Scholar] [CrossRef]
- Ferrara, M.; Monechi, B.; Valenti, G.; Liberto, C.; Nigro, M.; Biazzo, I. A Simulation Tool for Energy Management of E-Mobility in Urban Areas. In Proceedings of the MT-ITS 2019—6th International Conference on Models and Technologies for Intelligent Transportation Systems, Kraków, Poland, 5–7 June 2019; Institute of Electrical and Electronics Engineers Inc.: Piscataway, NJ, USA, 2019. [Google Scholar]
- Laib, F.; Braun, A.; Rid, W. Modelling Noise Reductions Using Electric Buses in Urban Traffic. A Case Study from Stuttgart, Germany. Transp. Res. Procedia 2019, 37, 377–384. [Google Scholar] [CrossRef]
- Higueras-Castillo, E.; Liébana-Cabanillas, F.J.; Muñoz-Leiva, F.; García-Maroto, I. Evaluating Consumer Attitudes toward Electromobility and the Moderating Effect of Perceived Consumer Effectiveness. J. Retail. Consum. Serv. 2019, 51, 387–398. [Google Scholar] [CrossRef]
- Augenstein, K. Analysing the Potential for Sustainable E-Mobility—The Case of Germany. Environ. Innov. Soc. Transit. 2015, 14, 101–115. [Google Scholar] [CrossRef]
- Rajper, S.Z.; Albrecht, J. Prospects of Electric Vehicles in the Developing Countries: A Literature Review. Sustainability 2020, 12, 1906. [Google Scholar] [CrossRef]
- Herrmann, F.; Rothfuss, F. 1—Introduction to Hybrid Electric Vehicles, Battery Electric Vehicles, and off-Road Electric Vehicles. In Advances in Battery Technologies for Electric Vehicles; Woodhead Publishing: Sawston, UK, 2015. [Google Scholar]
- United Nations. Transforming Our World: The 2030 Agenda for Sustainable Development-A/RES/70/1; General Assembly, United Nations: New York, NY, USA, 2015. [Google Scholar]
- Gallo, M.; Marinelli, M. Sustainable Mobility: A Review of Possible Actions and Policies. Sustainability 2020, 12, 7499. [Google Scholar] [CrossRef]
- Figueroa, M.J.; Lah, O. What Do We Know about the Role the Human Dimension Plays in Shaping a Sustainable Low-Carbon Transport Transition? In Energy and Behaviour: Towards a Low Carbon Future; Academic Press: Cambridge, MA, USA, 2020. [Google Scholar] [CrossRef]
- Behrendt, F. Why Cycling Matters for Electric Mobility: Towards Diverse, Active and Sustainable e-Mobilities. Mobilities 2018, 13, 64–80. [Google Scholar] [CrossRef]
- Kannan, R.; Hirschberg, S. Interplay between Electricity and Transport Sectors—Integrating the Swiss Car Fleet and Electricity System. Transp. Res. Part A Policy Pract. 2016, 94, 514–531. [Google Scholar] [CrossRef]
- Katona, M.; Radnai, R. Primary Energy Consumption and CO2 Emission of Internal Combustion Engine and Electric Vehicles. In Proceedings of the 2017 6th International Youth Conference on Energy, IYCE 2017, Budapest, Hungary, 21–24 June 2017; Institute of Electrical and Electronics Engineers Inc.: Piscataway, NJ, USA, 2017. [Google Scholar]
- Su, Y.; Miao, Z.; Wang, C. The Experience and Enlightenment of Asian Smart City Development—A Comparative Study of China and Japan. Sustainability 2022, 14, 3543. [Google Scholar] [CrossRef]
- Ruggieri, R.; Ruggeri, M.; Vinci, G.; Poponi, S. Electric Mobility in a Smart City: European Overview. Energies 2021, 14, 315. [Google Scholar] [CrossRef]
- Filho, A.A.D.O.; Bermúdez-Rodríguez, T.; Navarro, A.C.; Consoni, F.L.; Barassa, E.; Lacusta, E., Jr. Institutional Framework and the Advance of Electromobility: The Case of South America. Int. J. Automot. Technol. Manag. 2022, 22, 277–304. [Google Scholar] [CrossRef]
- Kresnawan, M.R.; Yurnaidi, Z.; Bilqis, A.; Wijaya, T.N.; Suryadi, B. Electric Vehicle Readiness in Southeast Asia: A PEST Policy Review. In IOP Conference Series: Earth and Environmental Science; IOP Publishing Ltd.: Bristol, UK, 2022; Volume 997. [Google Scholar]
- Piazza, G.; Bracco, S.; Delfino, F.; Siri, S. Optimal Design of Electric Mobility Services for a Local Energy Community. Sustain. Energy Grids Netw. 2021, 26, 100440. [Google Scholar] [CrossRef]
- Skrúcaný, T.; Kendra, M.; Stopka, O.; Milojević, S.; Figlus, T.; Csiszár, C. Impact of the Electric Mobility Implementation on the Greenhouse Gases Production in Central European Countries. Sustainability 2019, 11, 4948. [Google Scholar] [CrossRef]
- Held, T.; Gerrits, L. On the Road to Electrification—A Qualitative Comparative Analysis of Urban e-Mobility Policies in 15 European Cities. Transp. Policy 2019, 81, 12–23. [Google Scholar] [CrossRef]
- Ajanovic, A.; Haas, R. Dissemination of Electric Vehicles in Urban Areas: Major Factors for Success. Energy 2016, 115, 1451–1458. [Google Scholar] [CrossRef]
- Comodi, G.; Caresana, F.; Salvi, D.; Pelagalli, L.; Lorenzetti, M. Local Promotion of Electric Mobility in Cities: Guidelines and Real Application Case in Italy. Energy 2016, 95, 494–503. [Google Scholar] [CrossRef]
- Mirhedayatian, S.M.; Yan, S. A Framework to Evaluate Policy Options for Supporting Electric Vehicles in Urban Freight Transport. Transp. Res. D Transp. Environ. 2018, 58, 22–38. [Google Scholar] [CrossRef]
- Gruber, J.; Kihm, A.; Lenz, B. A New Vehicle for Urban Freight? An Ex-Ante Evaluation of Electric Cargo Bikes in Courier Services. Res. Transp. Bus. Manag. 2014, 11, 53–62. [Google Scholar] [CrossRef]
- Giglio, C.; Musmanno, R.; Palmieri, R. Cycle Logistics Projects in Europe: Intertwining Bike-Related Success Factors and Region-Specific Public Policies with Economic Results. Appl. Sci. 2021, 11, 1578. [Google Scholar] [CrossRef]
- Lombardi, M.; Panerali, K.; Rousselet, S.; Scalise, J. Electric Vehicles for Smarter Cities: The Future of Energy and Mobility. In Proceedings of the World Economic Forum, Davos, Switzerland, 23–26 January 2018. [Google Scholar]
- IBTS. Ônibus Elétricos A Bateria (Plug-In). Uma Primeira Avaliação Da Viabilidade Econômica e Do Impacto Na Tarifa Para o Uso Nas Cidades Brasileiras; IBTS: Amsterdam, The Netherlands, 2017. [Google Scholar]
- Galuszka, J.; Martin, E.; Nkurunziza, A.; Oginga, J.A.; Senyagwa, J.; Teko, E.; Lah, O. East Africa’s Policy and Stakeholder Integration of Informal Operators in Electric Mobility Transitions—Kigali, Nairobi, Kisumu and Dar Es Salaam. Sustainability 2021, 13, 1703. [Google Scholar] [CrossRef]
- IPCC. National Greenhouse Gas Inventories Programme. 2006 IPCC Guidelines for National Greenhouse Gas Inventories; IPCC: Geneva, Switzerland, 2006. [Google Scholar]
- EEA. Emep/Eea Air Pollutant Emission Inventory Guidebook—2009; EEA: Copenhagen, Denmark, 2009; ISSN 1725-2237. [Google Scholar]
- Shrestha, R.M.; Kim Oanh, N.T.; Shrestha, R.P.; Rupakheti, M.; Rajbhandari, S.; Permadi, D.A.; Kanabkaew, T.; Iyngararasan, M. Atmospheric Brown Cloud (ABC) Emission Inventory Manual, United Nations Environment Programme, Nairobi, Kenya; UNEP: Nairobi, Kenya, 2012. [Google Scholar]
- CETESB. Emissões Veiculares No Estado São Paulo; CETESB: São Paulo, Brazil, 2019. [Google Scholar]
- Prefeitura da Estância de Atibaia. Atibaia Investe Em Tecnologia Para Ampliar a Fiscalização Da Prestação de Serviço Do Transporte Público. Available online: https://www.atibaia.sp.gov.br/?news=atibaia-investe-em-tecnologia-para-ampliar-a-fiscalizacao-da-prestacao-de-servico-do-transporte-publico (accessed on 30 May 2020).
- Saneamento Ambiental de Atibaia—SAAE Coleta De Lixo. Available online: http://www.saaeatibaia.com.br/Pagina.php?id=36 (accessed on 1 May 2020).
- Clima e Desenvolvimento: Visões Para o Brasil 2030; Centro Clima: Sofia, Bulgaria; Instituto Talanoa: Rio de Janeiro, Brazil, 2021.
- Secretaria de Mobilidade e Planejamento Urbano Banco De Dados Ambientais De Atibaia—2018. Available online: http://www.peasistemas.com.br/mobilidadeeplanejamentourbano/index.asp?centro=legislacao (accessed on 4 May 2020).
- Prefeitura da Estância de Atibaia. Available online: https://www.atibaia.sp.gov.br/ (accessed on 4 March 2020).
- Neoenergia Apresentação de Resultados; 4T21 e 2021; Neoenergia: São Paulo, Brazil, 2022.
Disclaimer/Publisher’s Note: The statements, opinions and data contained in all publications are solely those of the individual author(s) and contributor(s) and not of MDPI and/or the editor(s). MDPI and/or the editor(s) disclaim responsibility for any injury to people or property resulting from any ideas, methods, instructions or products referred to in the content. |
© 2023 by the authors. Licensee MDPI, Basel, Switzerland. This article is an open access article distributed under the terms and conditions of the Creative Commons Attribution (CC BY) license (https://creativecommons.org/licenses/by/4.0/).