
Modeling Structural Changes in Intra-Asian Maritime Container Shipping Networks Considering Their Characteristics


Abstract
1. Introduction
2. Literature Review
2.1. Development of MCS Network in East Asia
2.2. Analysis of MCS Network
2.3. Link Prediction Models and Applications to MCS Network
3. Trends in Intra-Asian Container Shipping
3.1. Data Overview
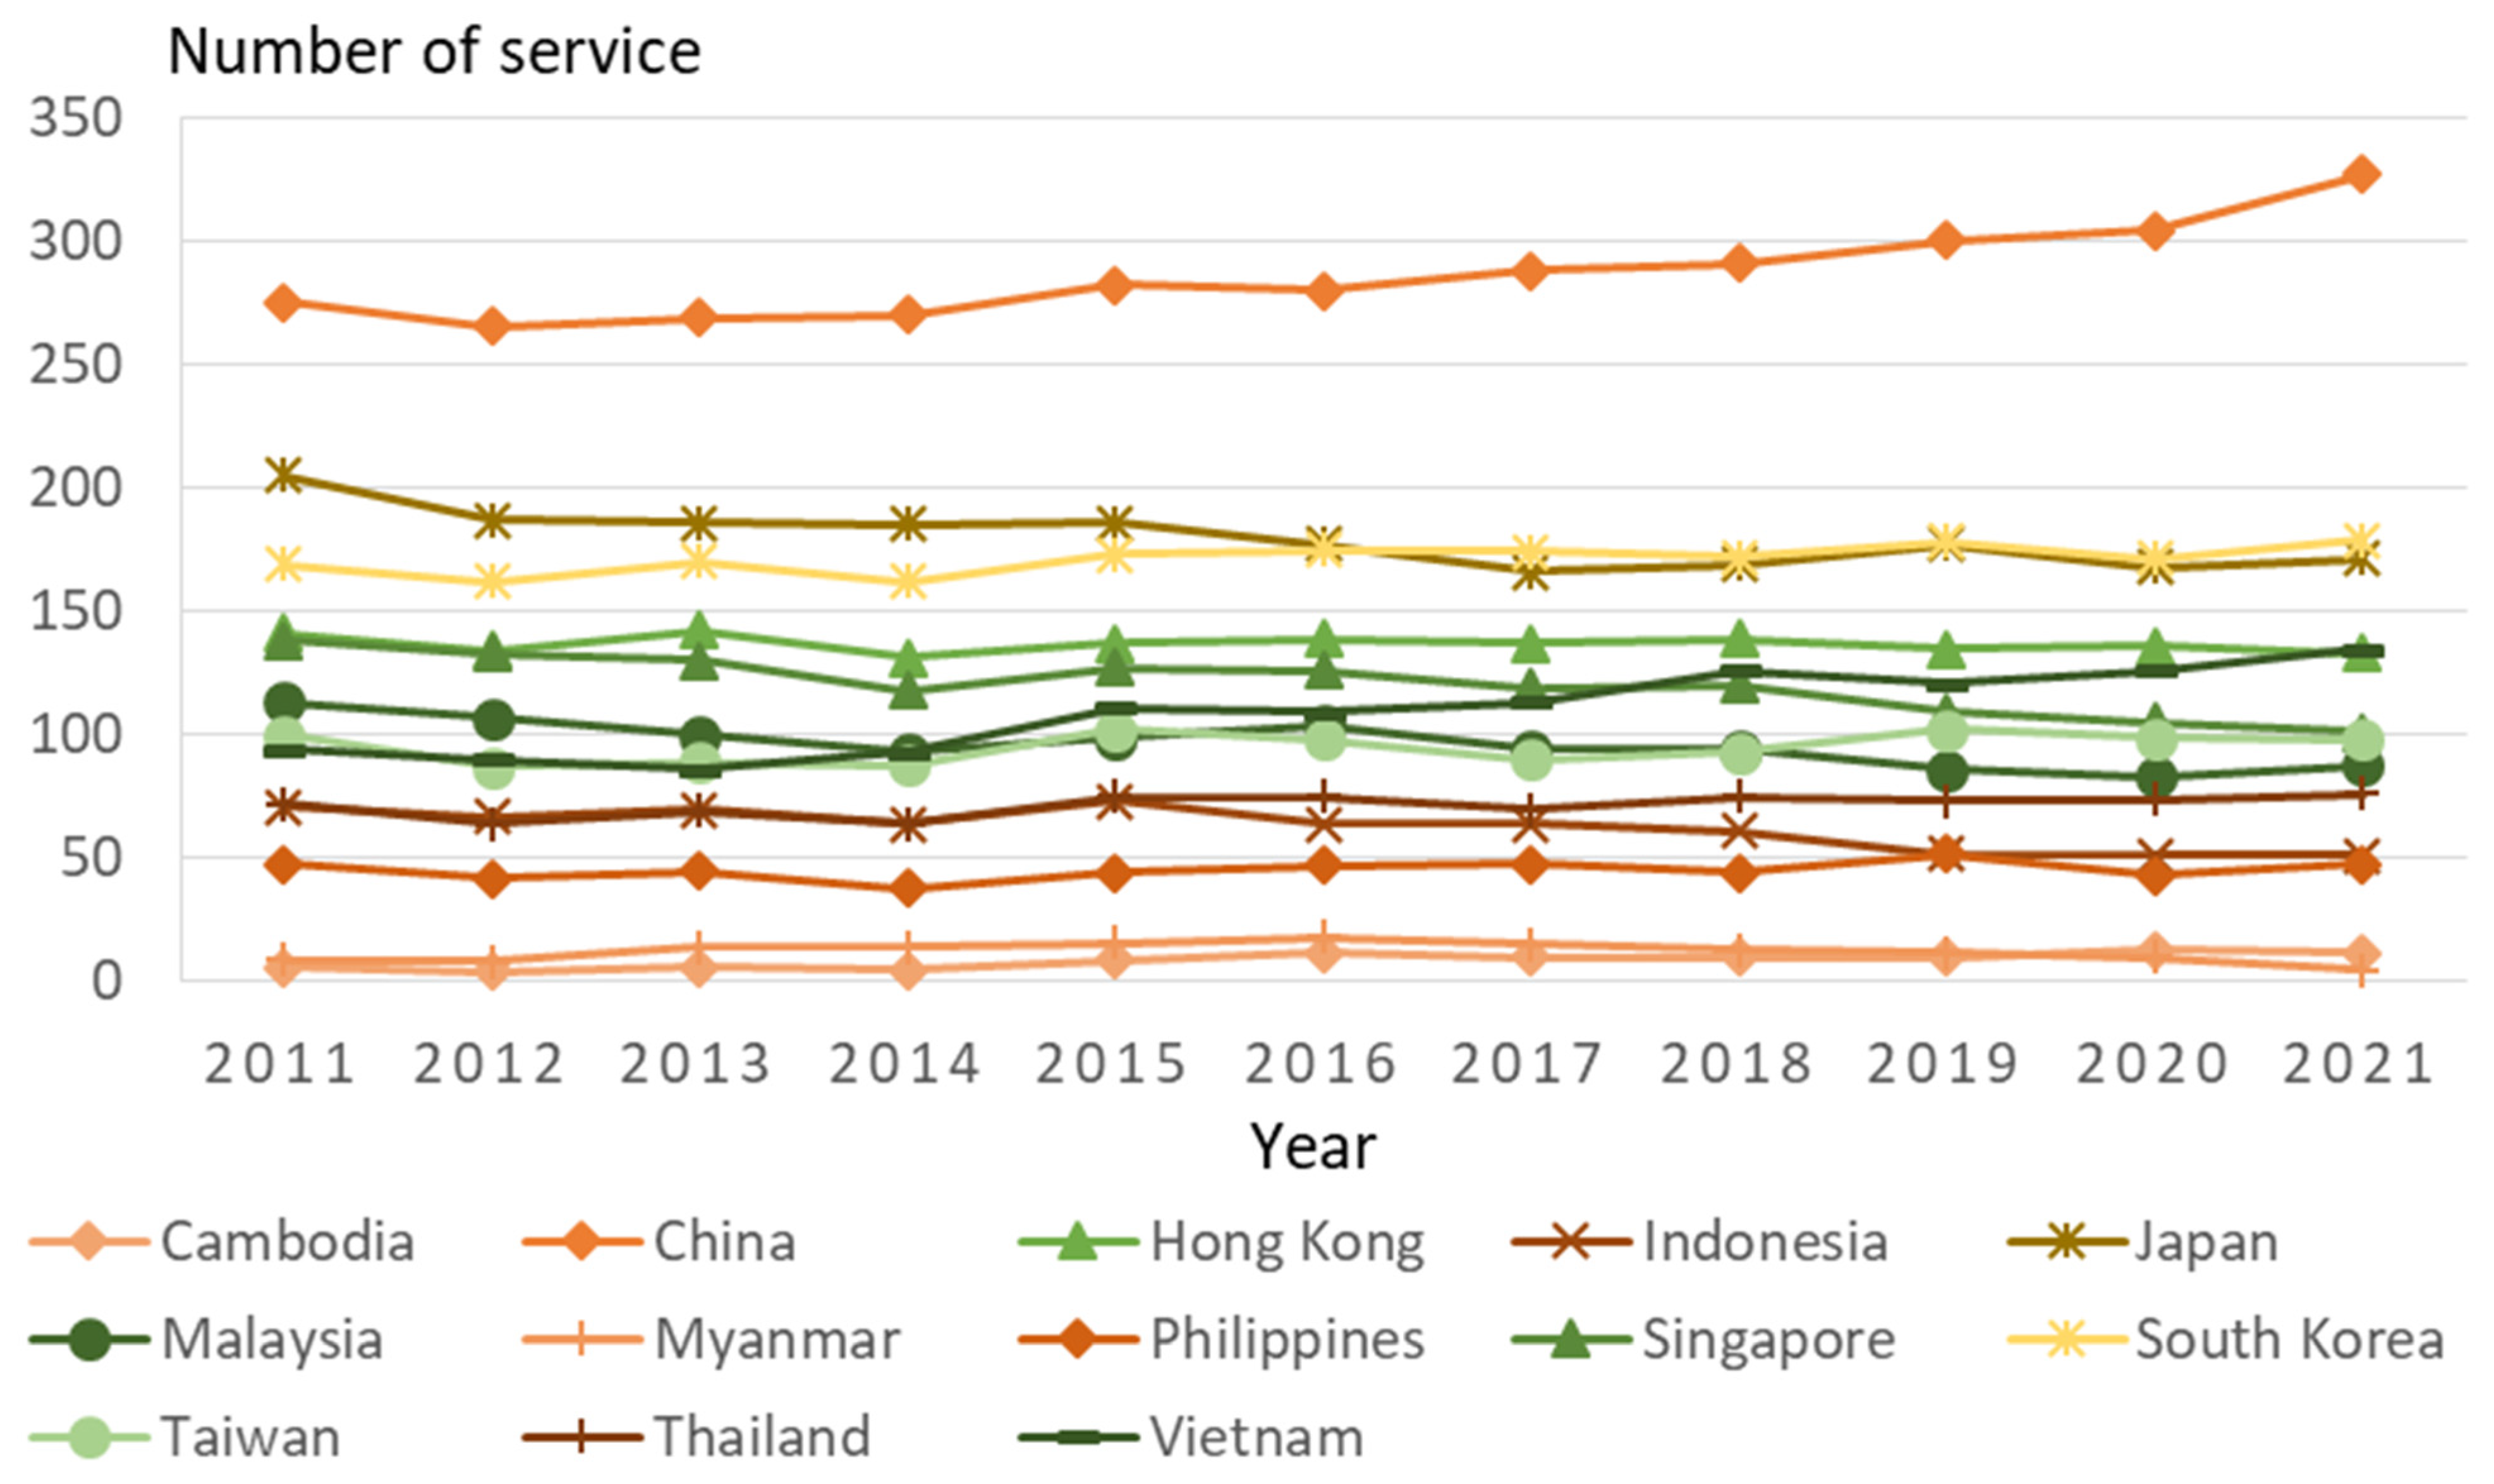
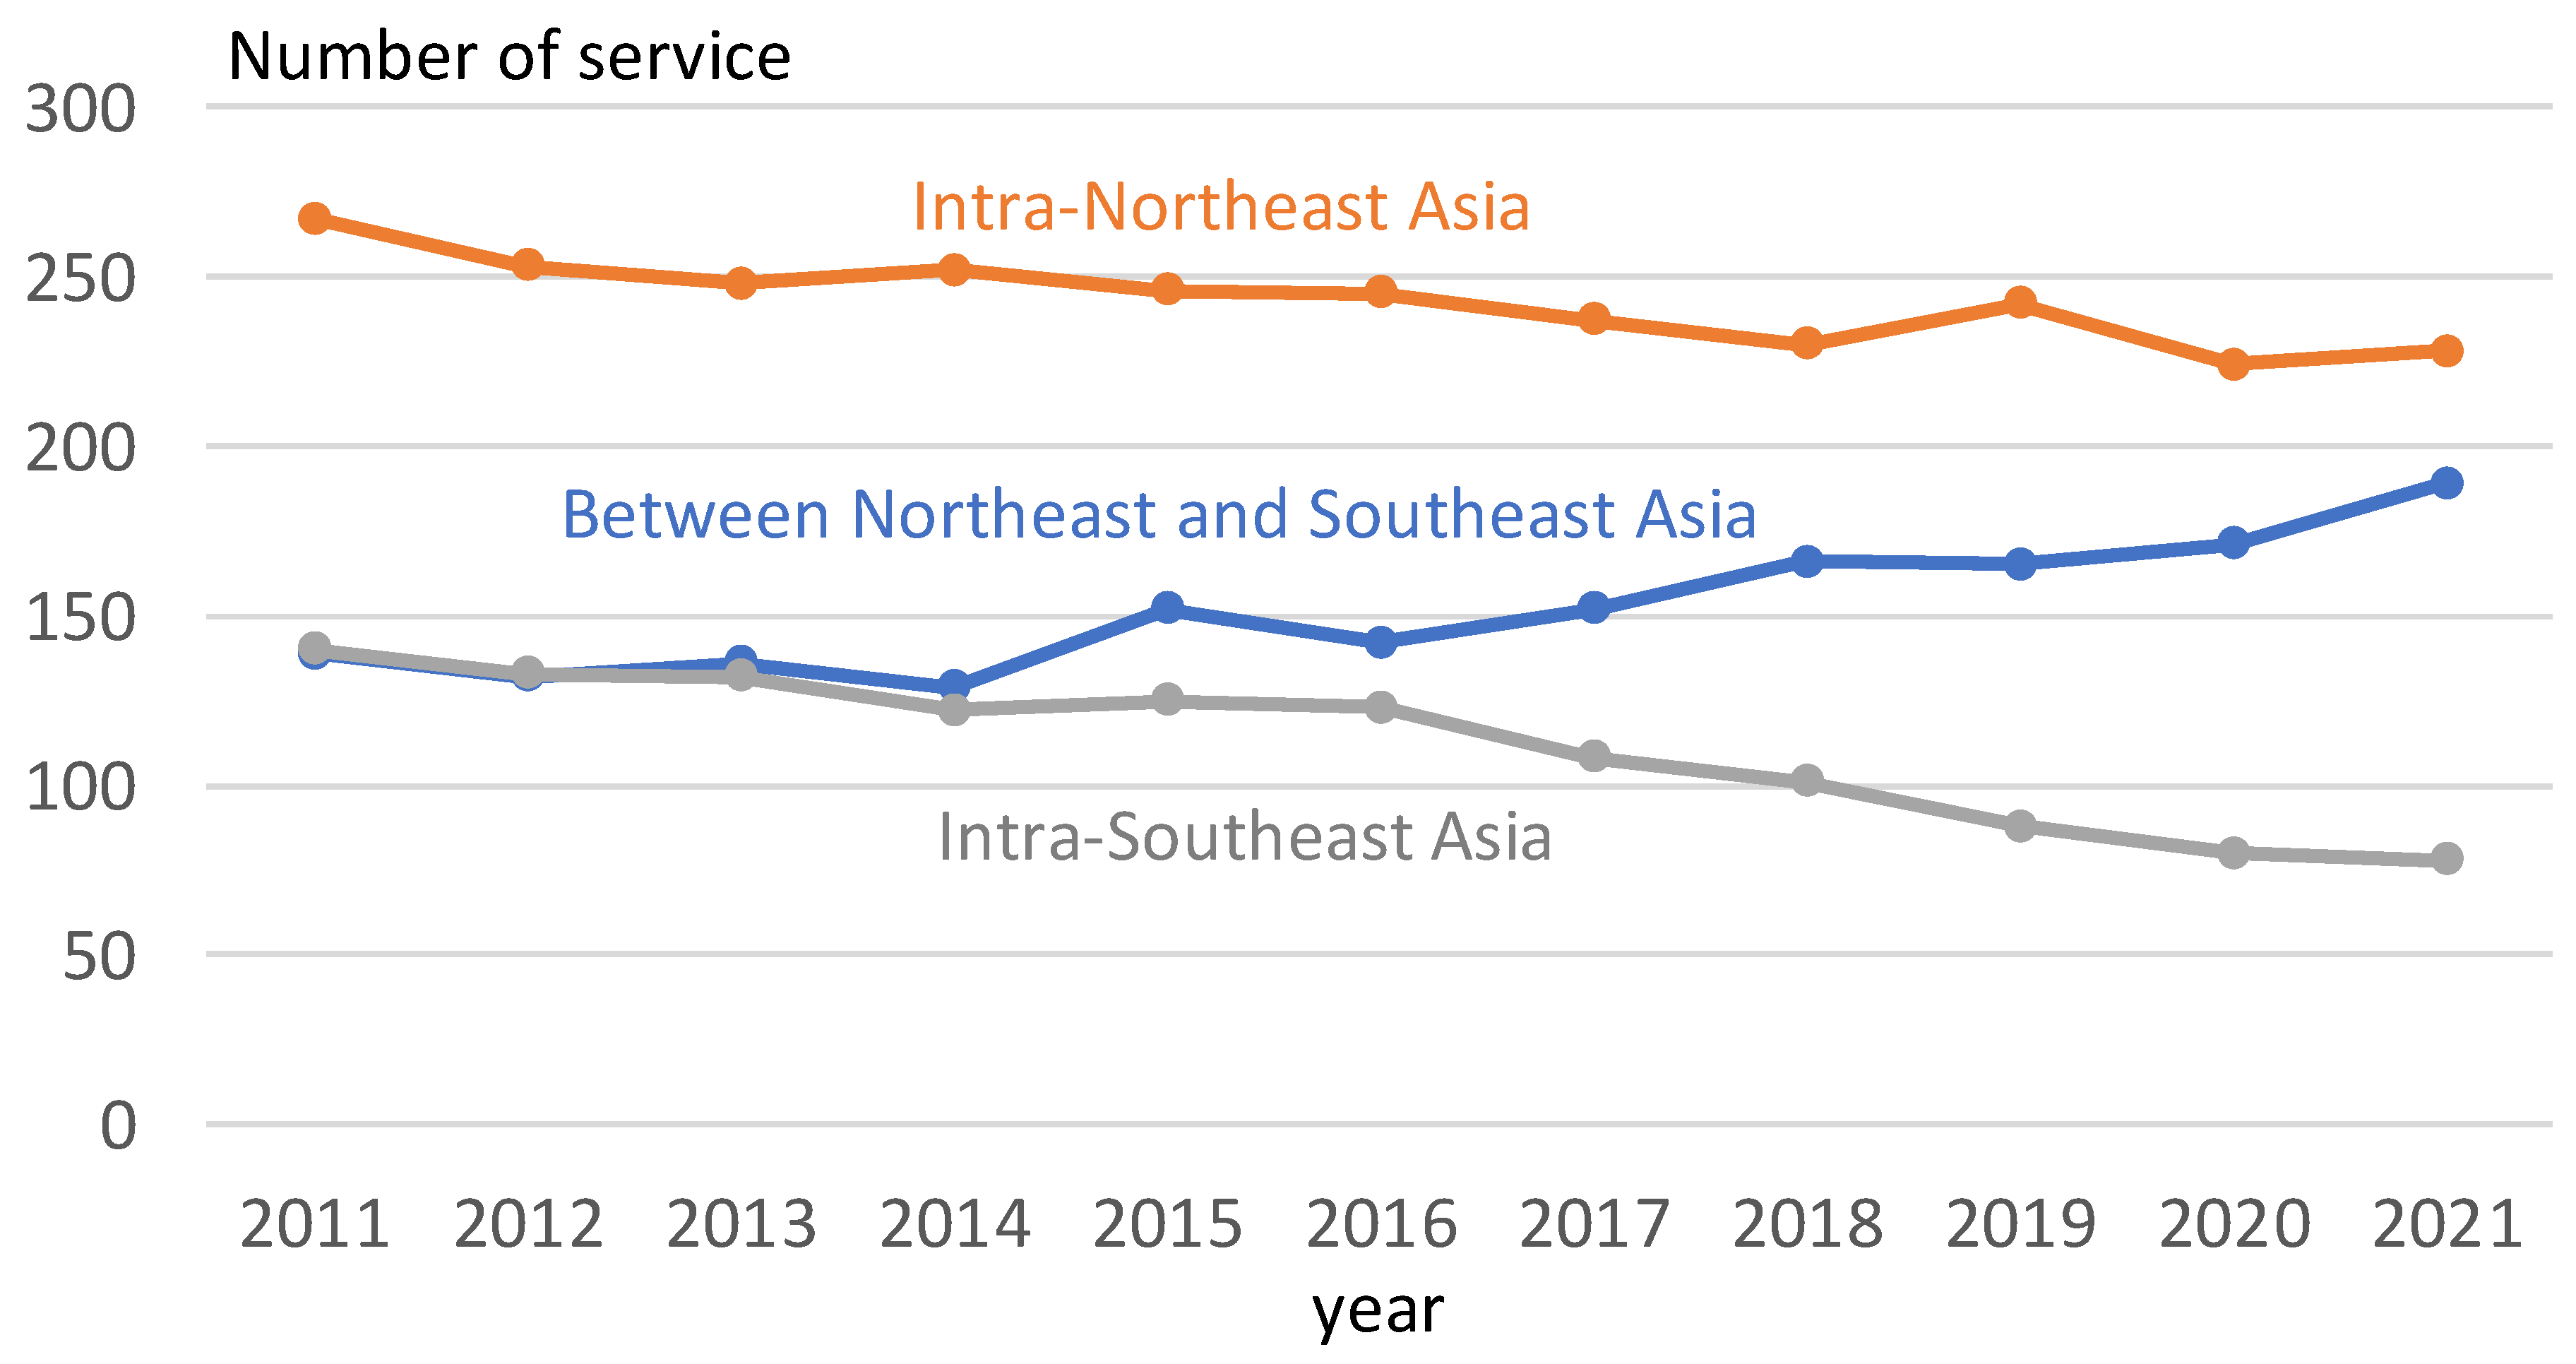
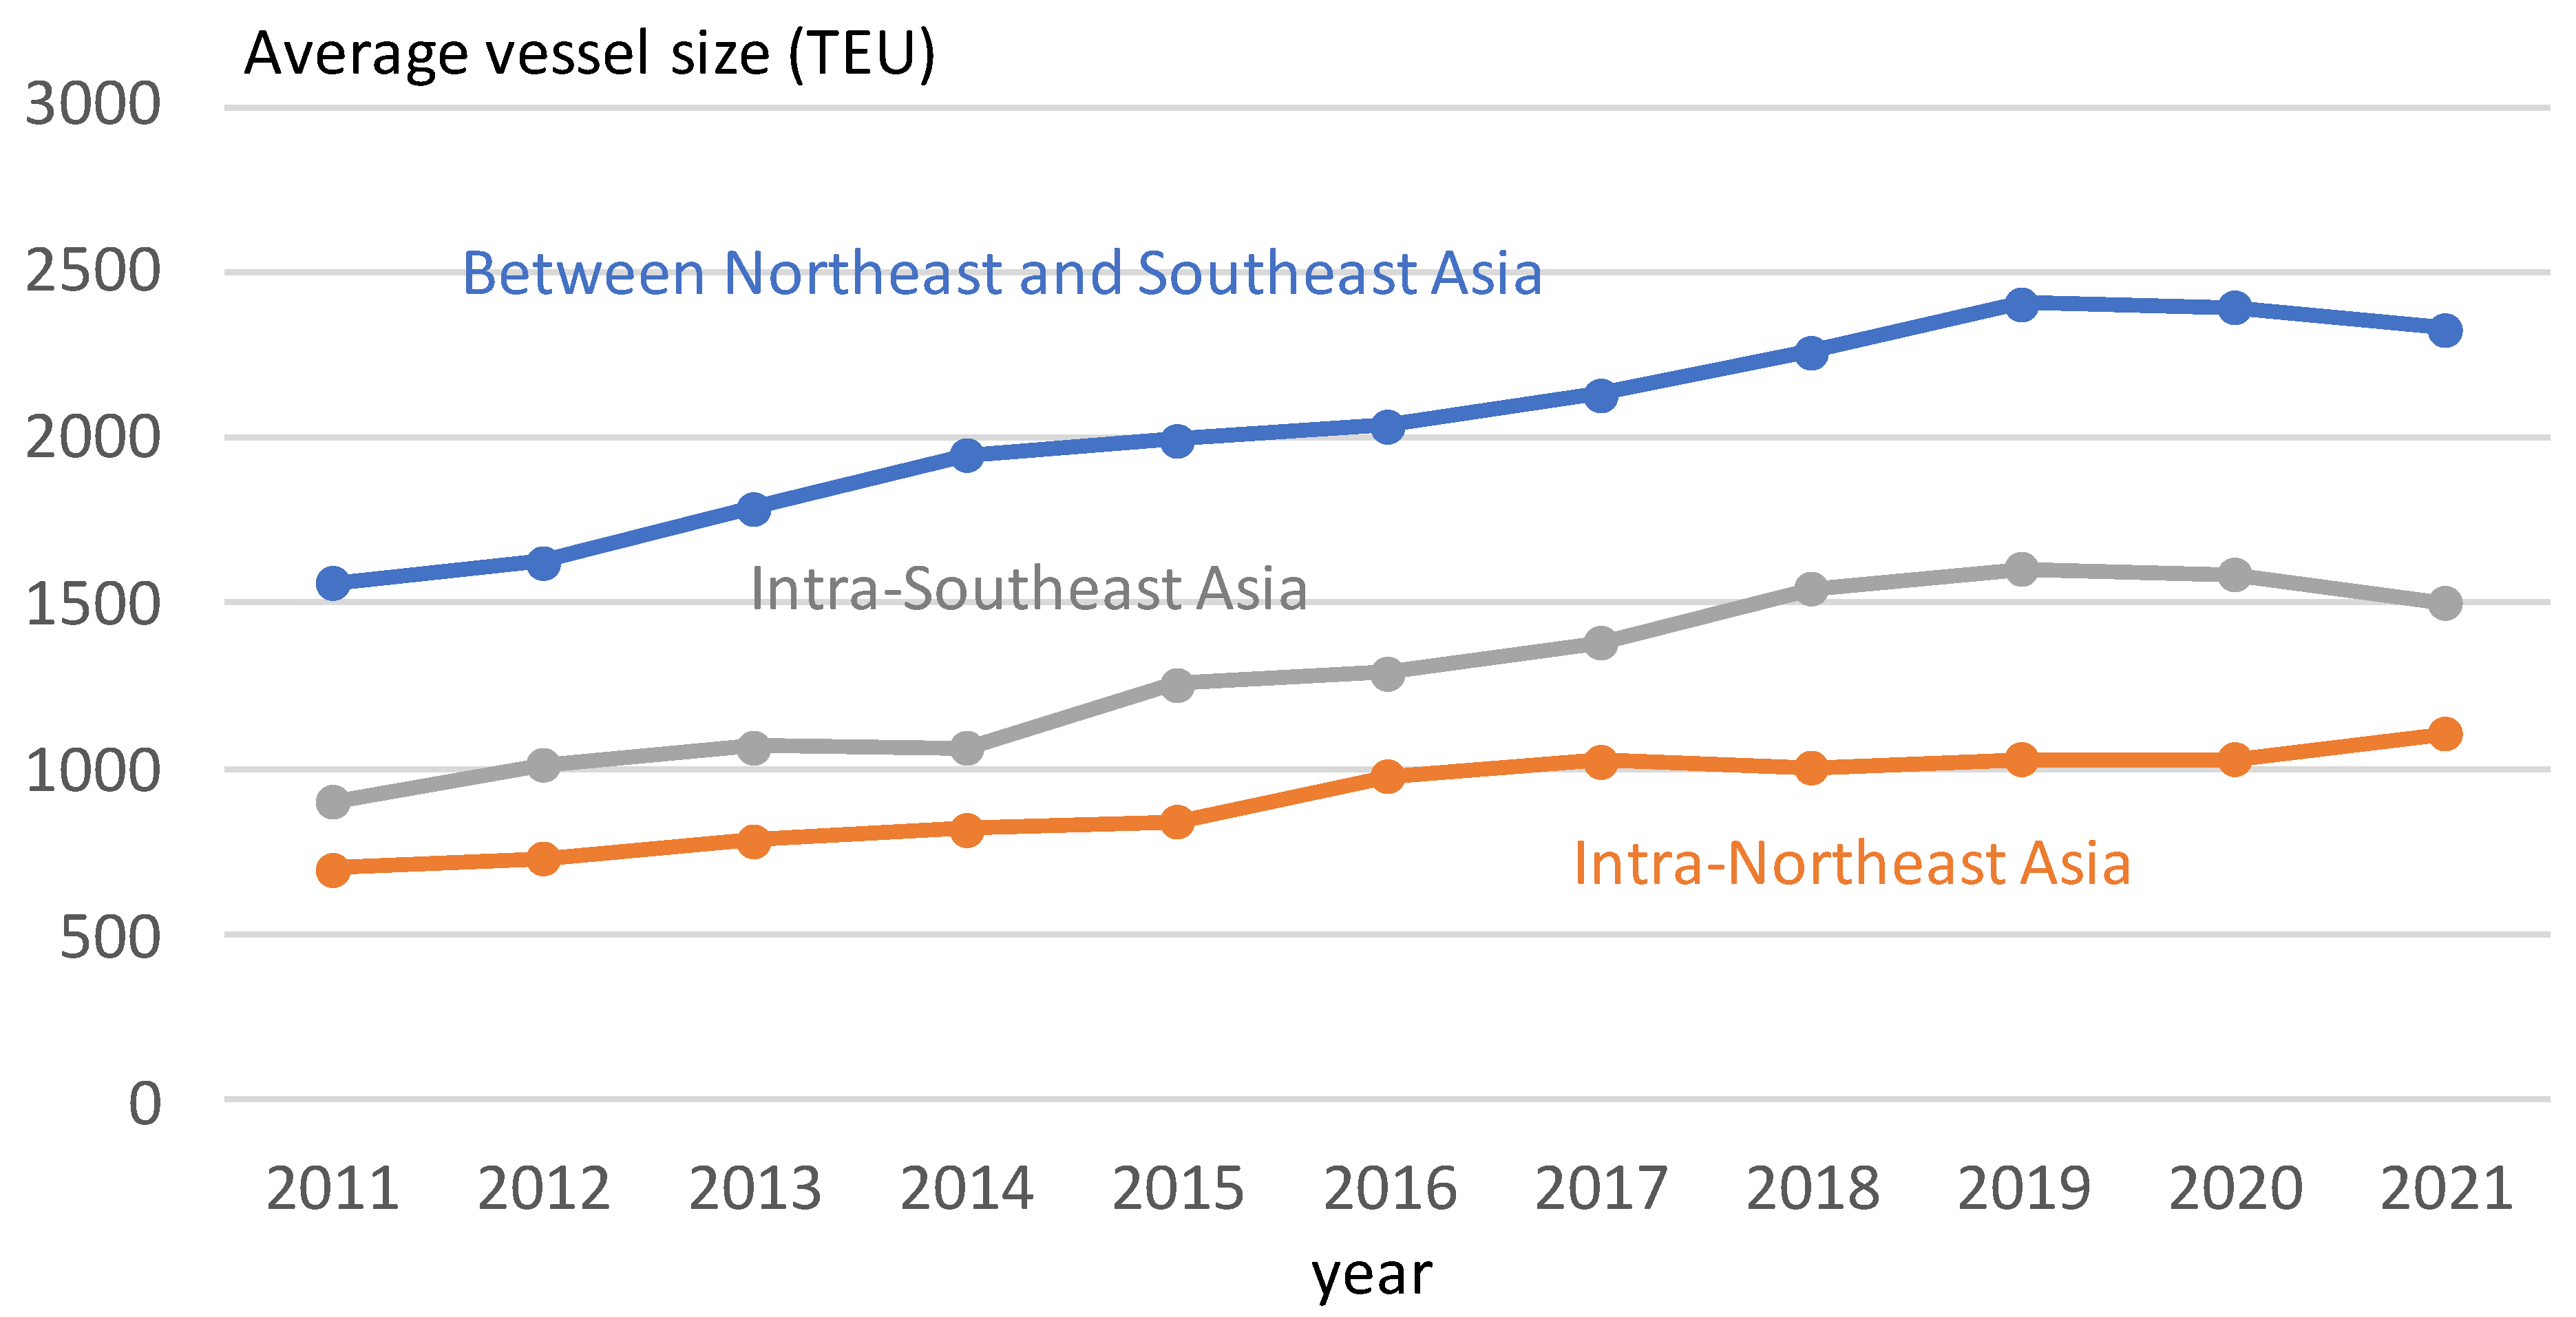
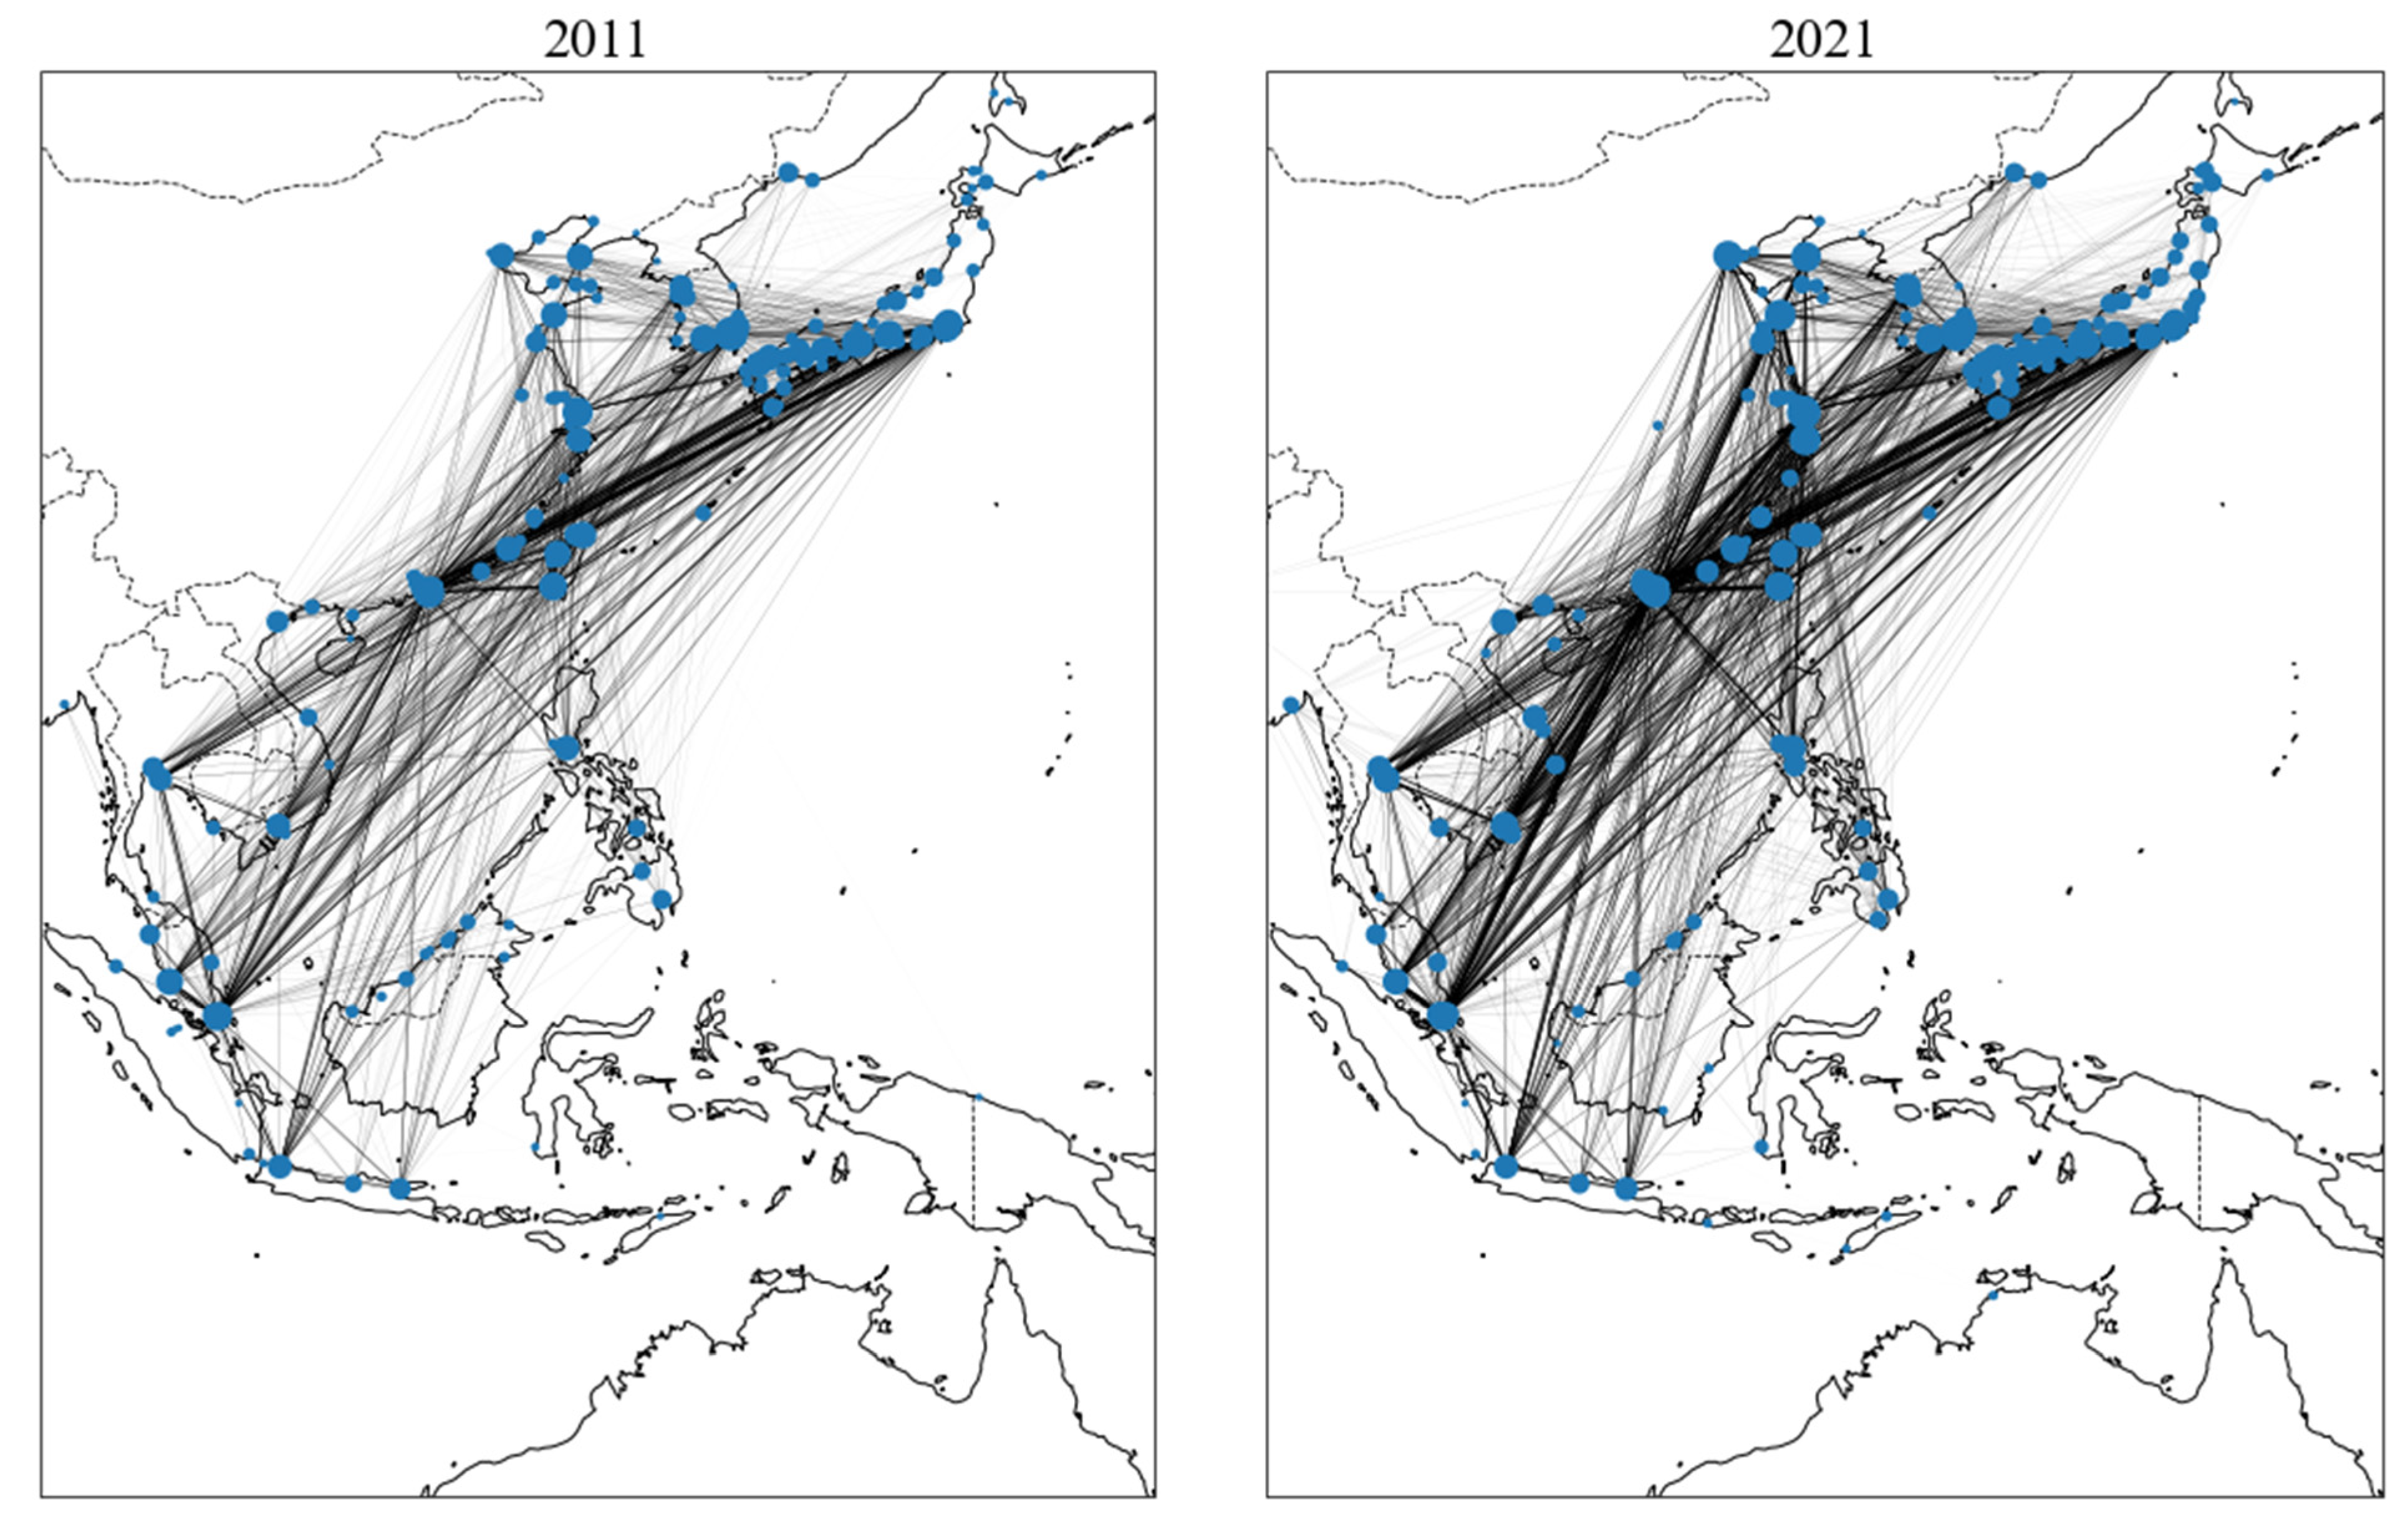
3.2. Trend Analysis
4. Model
4.1. Network Topologies
4.2. Link Prediction Models
4.2.1. Existing Models
4.2.2. A New Model for MCS Network Analysis
- Regarding the shipping distance between ports in port group A, the distances used in the GLINS model are adopted.
- Regarding the shipping distance between port pA of port group A and port pB of port group B, let p′A be the port in port group A that is closest to port pB in port group B. is expressed as
- Regarding the shipping distance between ports pB1 and pB2 of port group B, let p′A1 be the closest port in port group A to port pB1 in port group B and p′A2 be the closest port in port group A to port pB2 in port group B. is expressed as
4.3. Model Evaluation Methodology
5. Results
5.1. Basic Configurations of the MCS Network
5.2. Model Calibration
5.3. Link Prediction Results
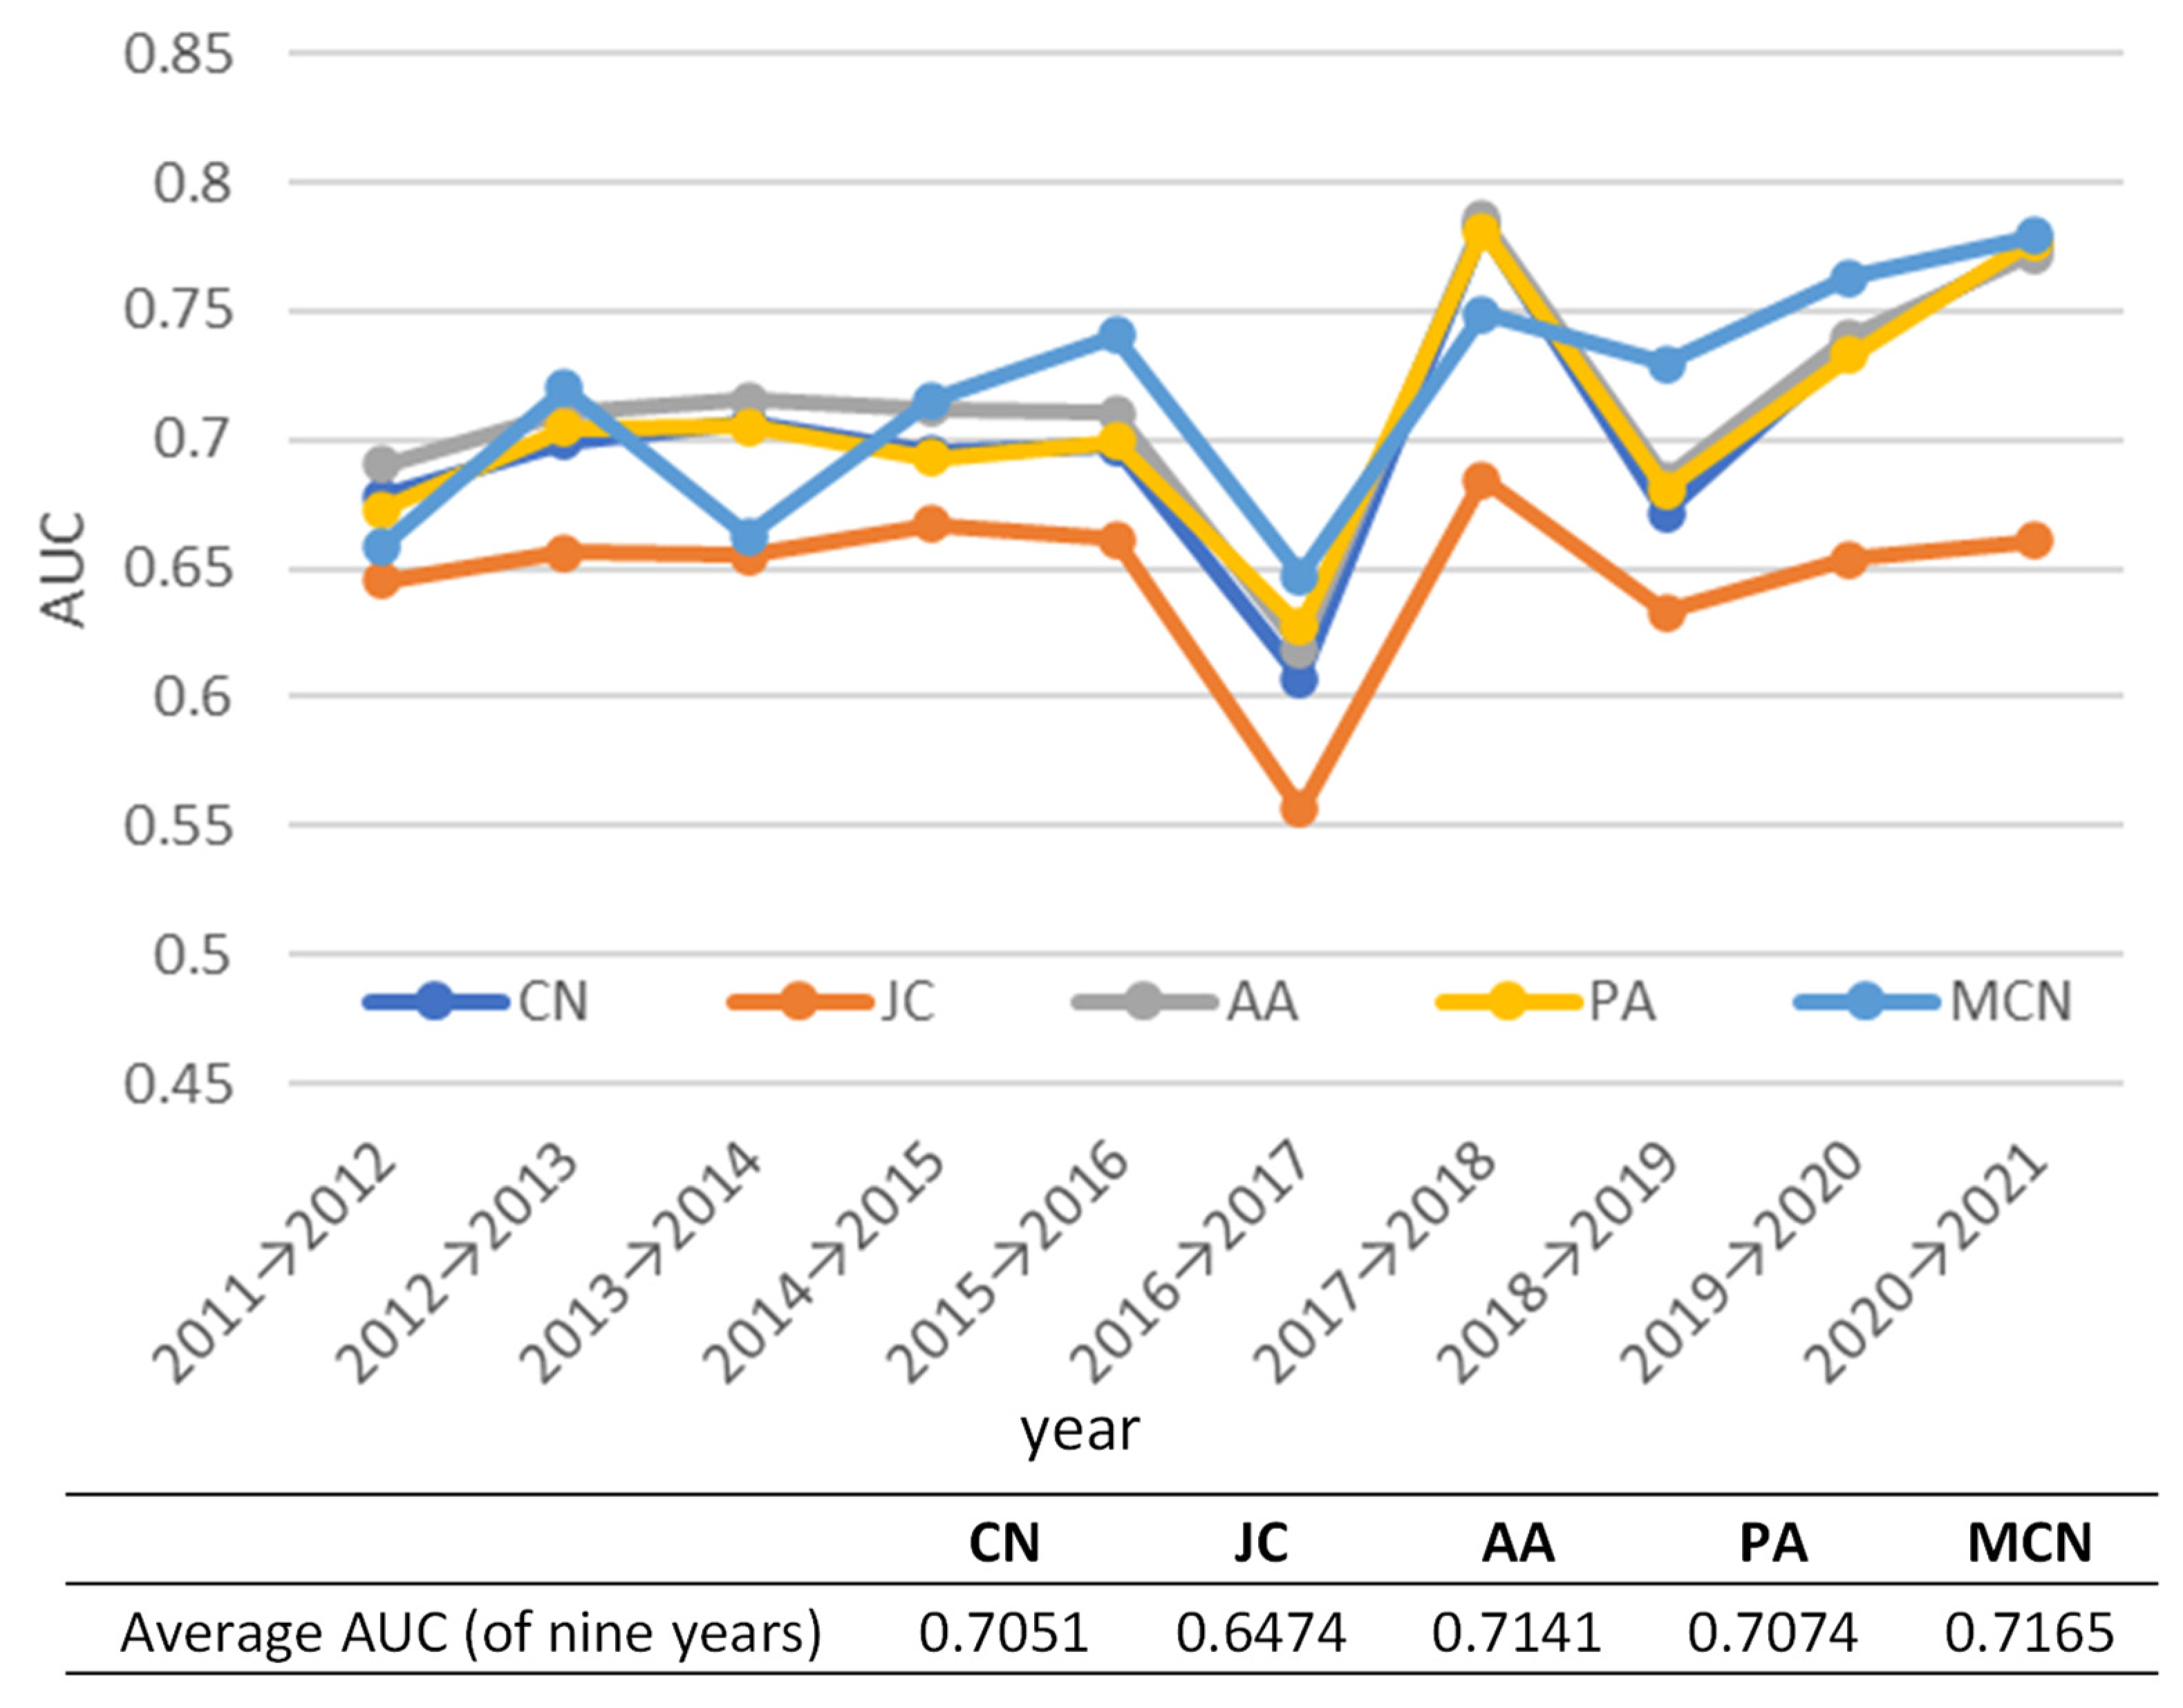
5.3.1. Prediction of the Entire Network
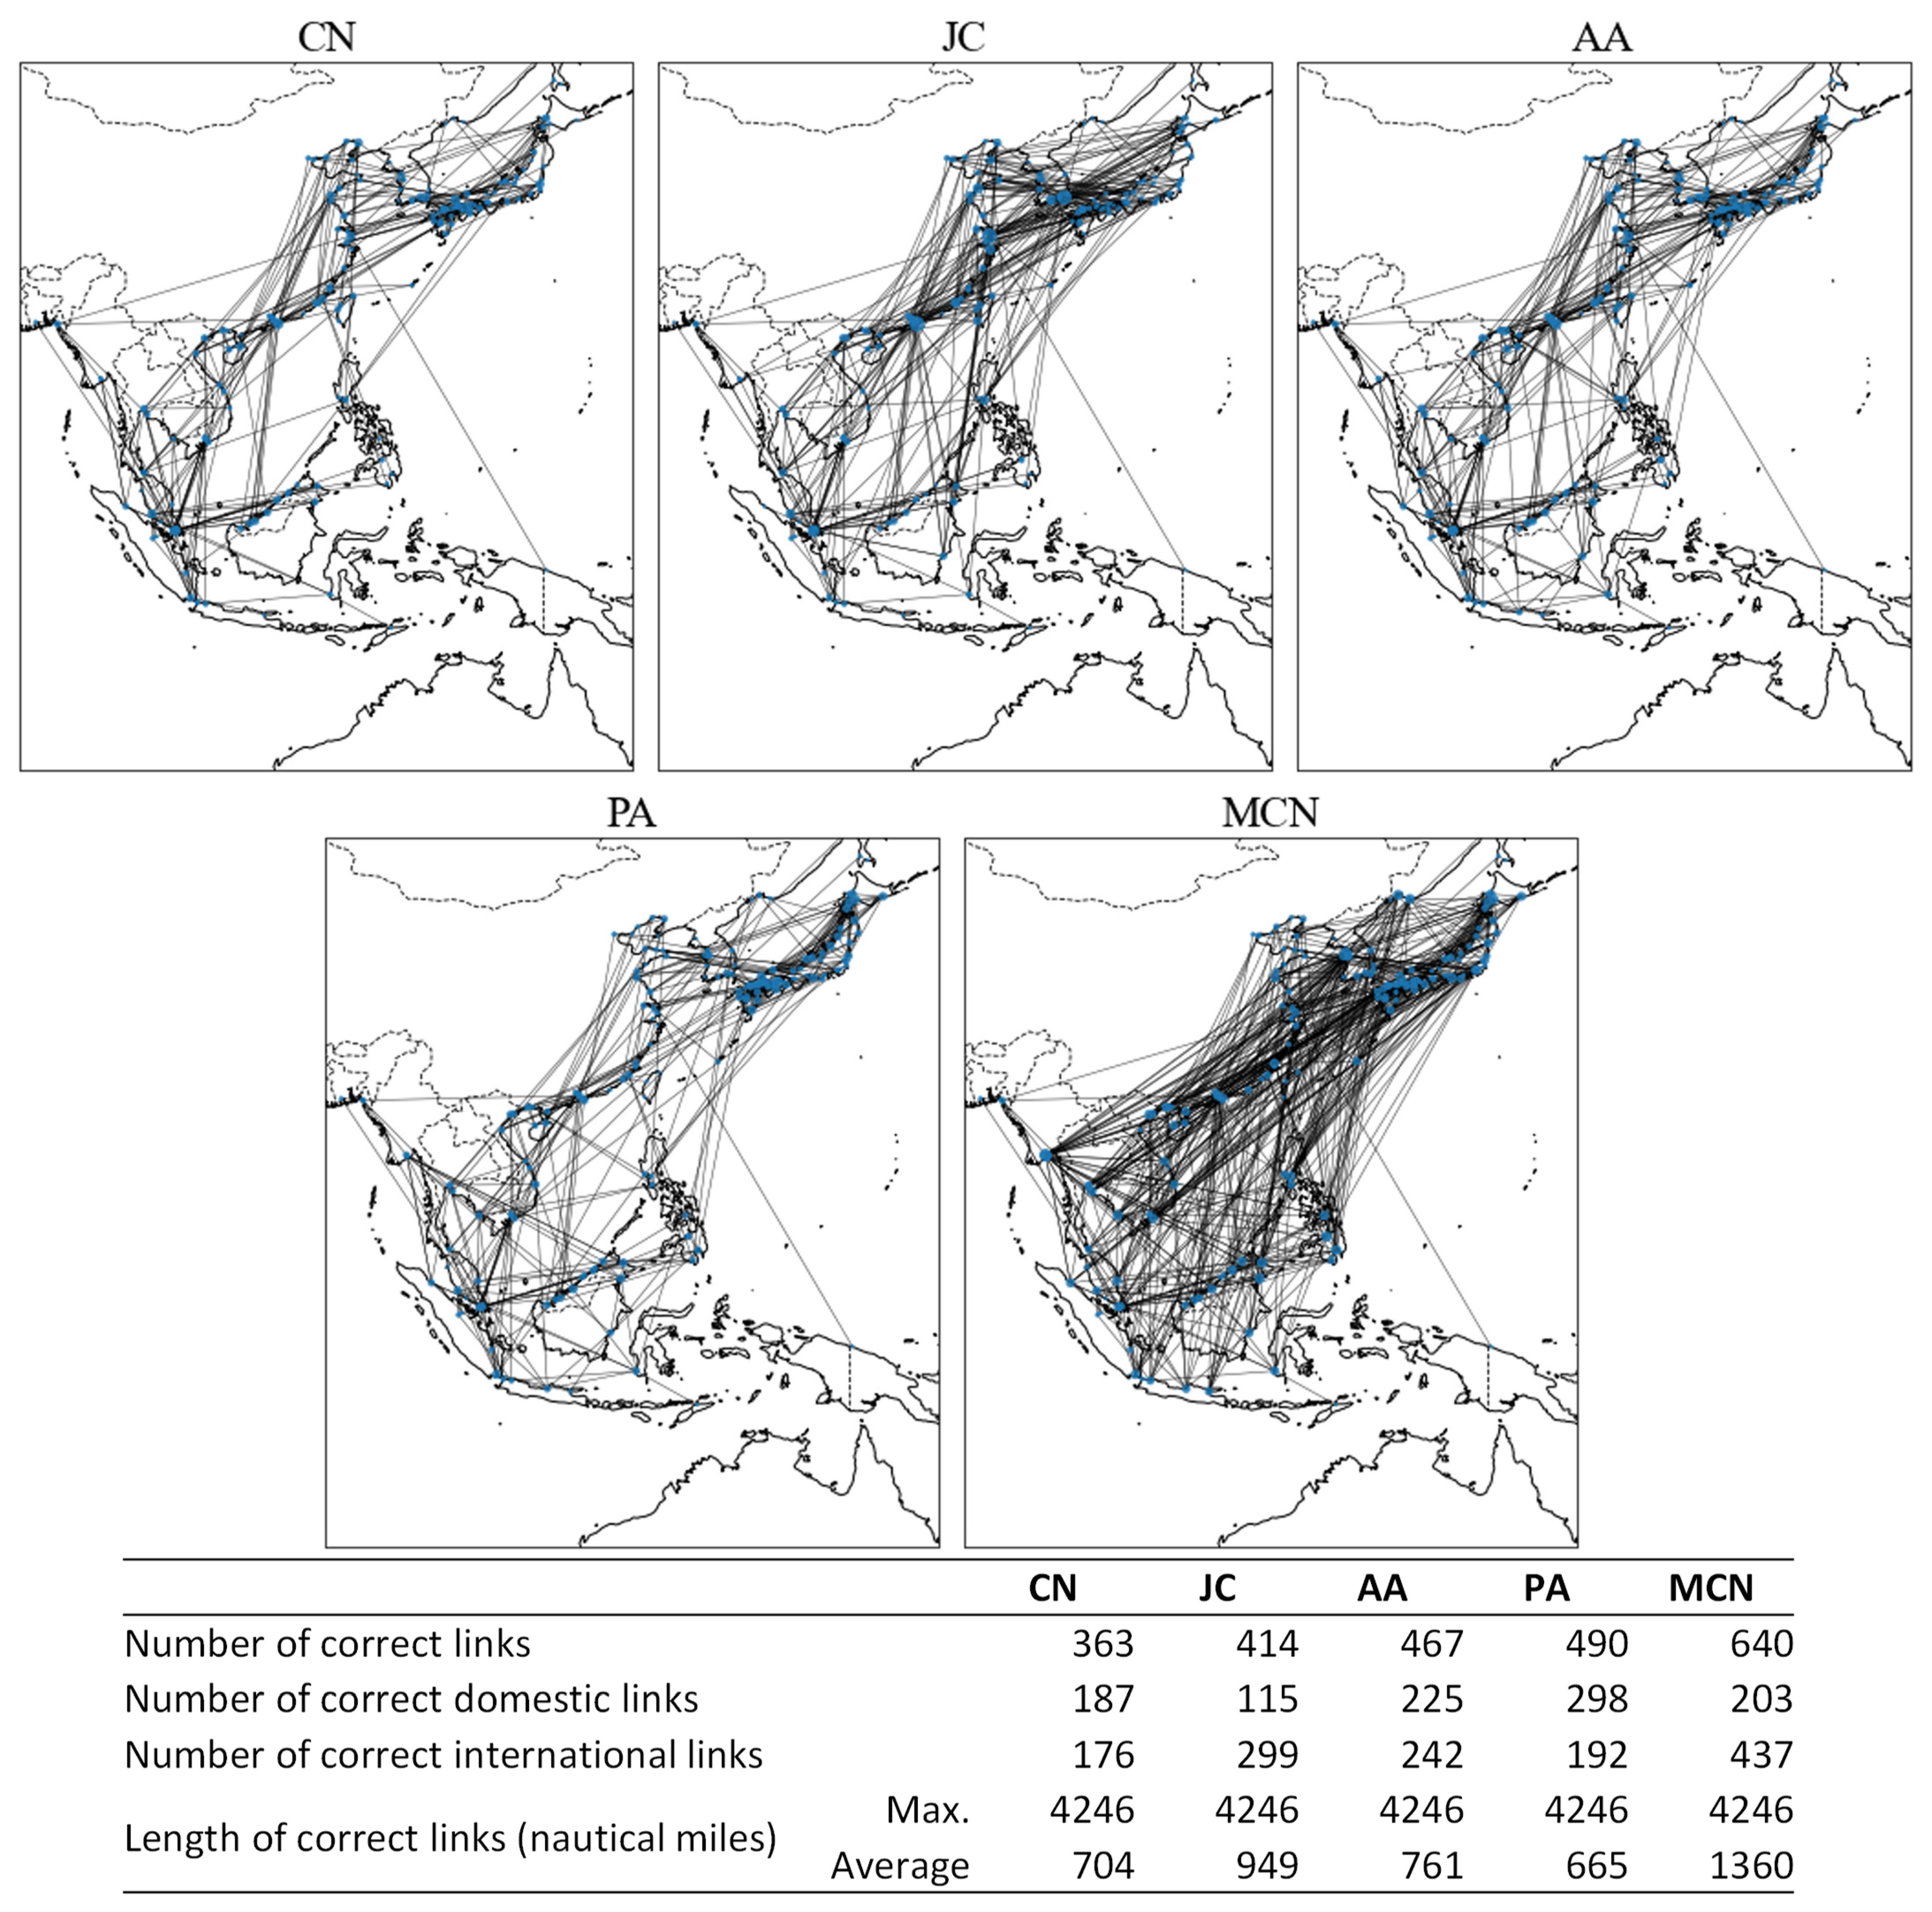
5.3.2. Prediction of New Links
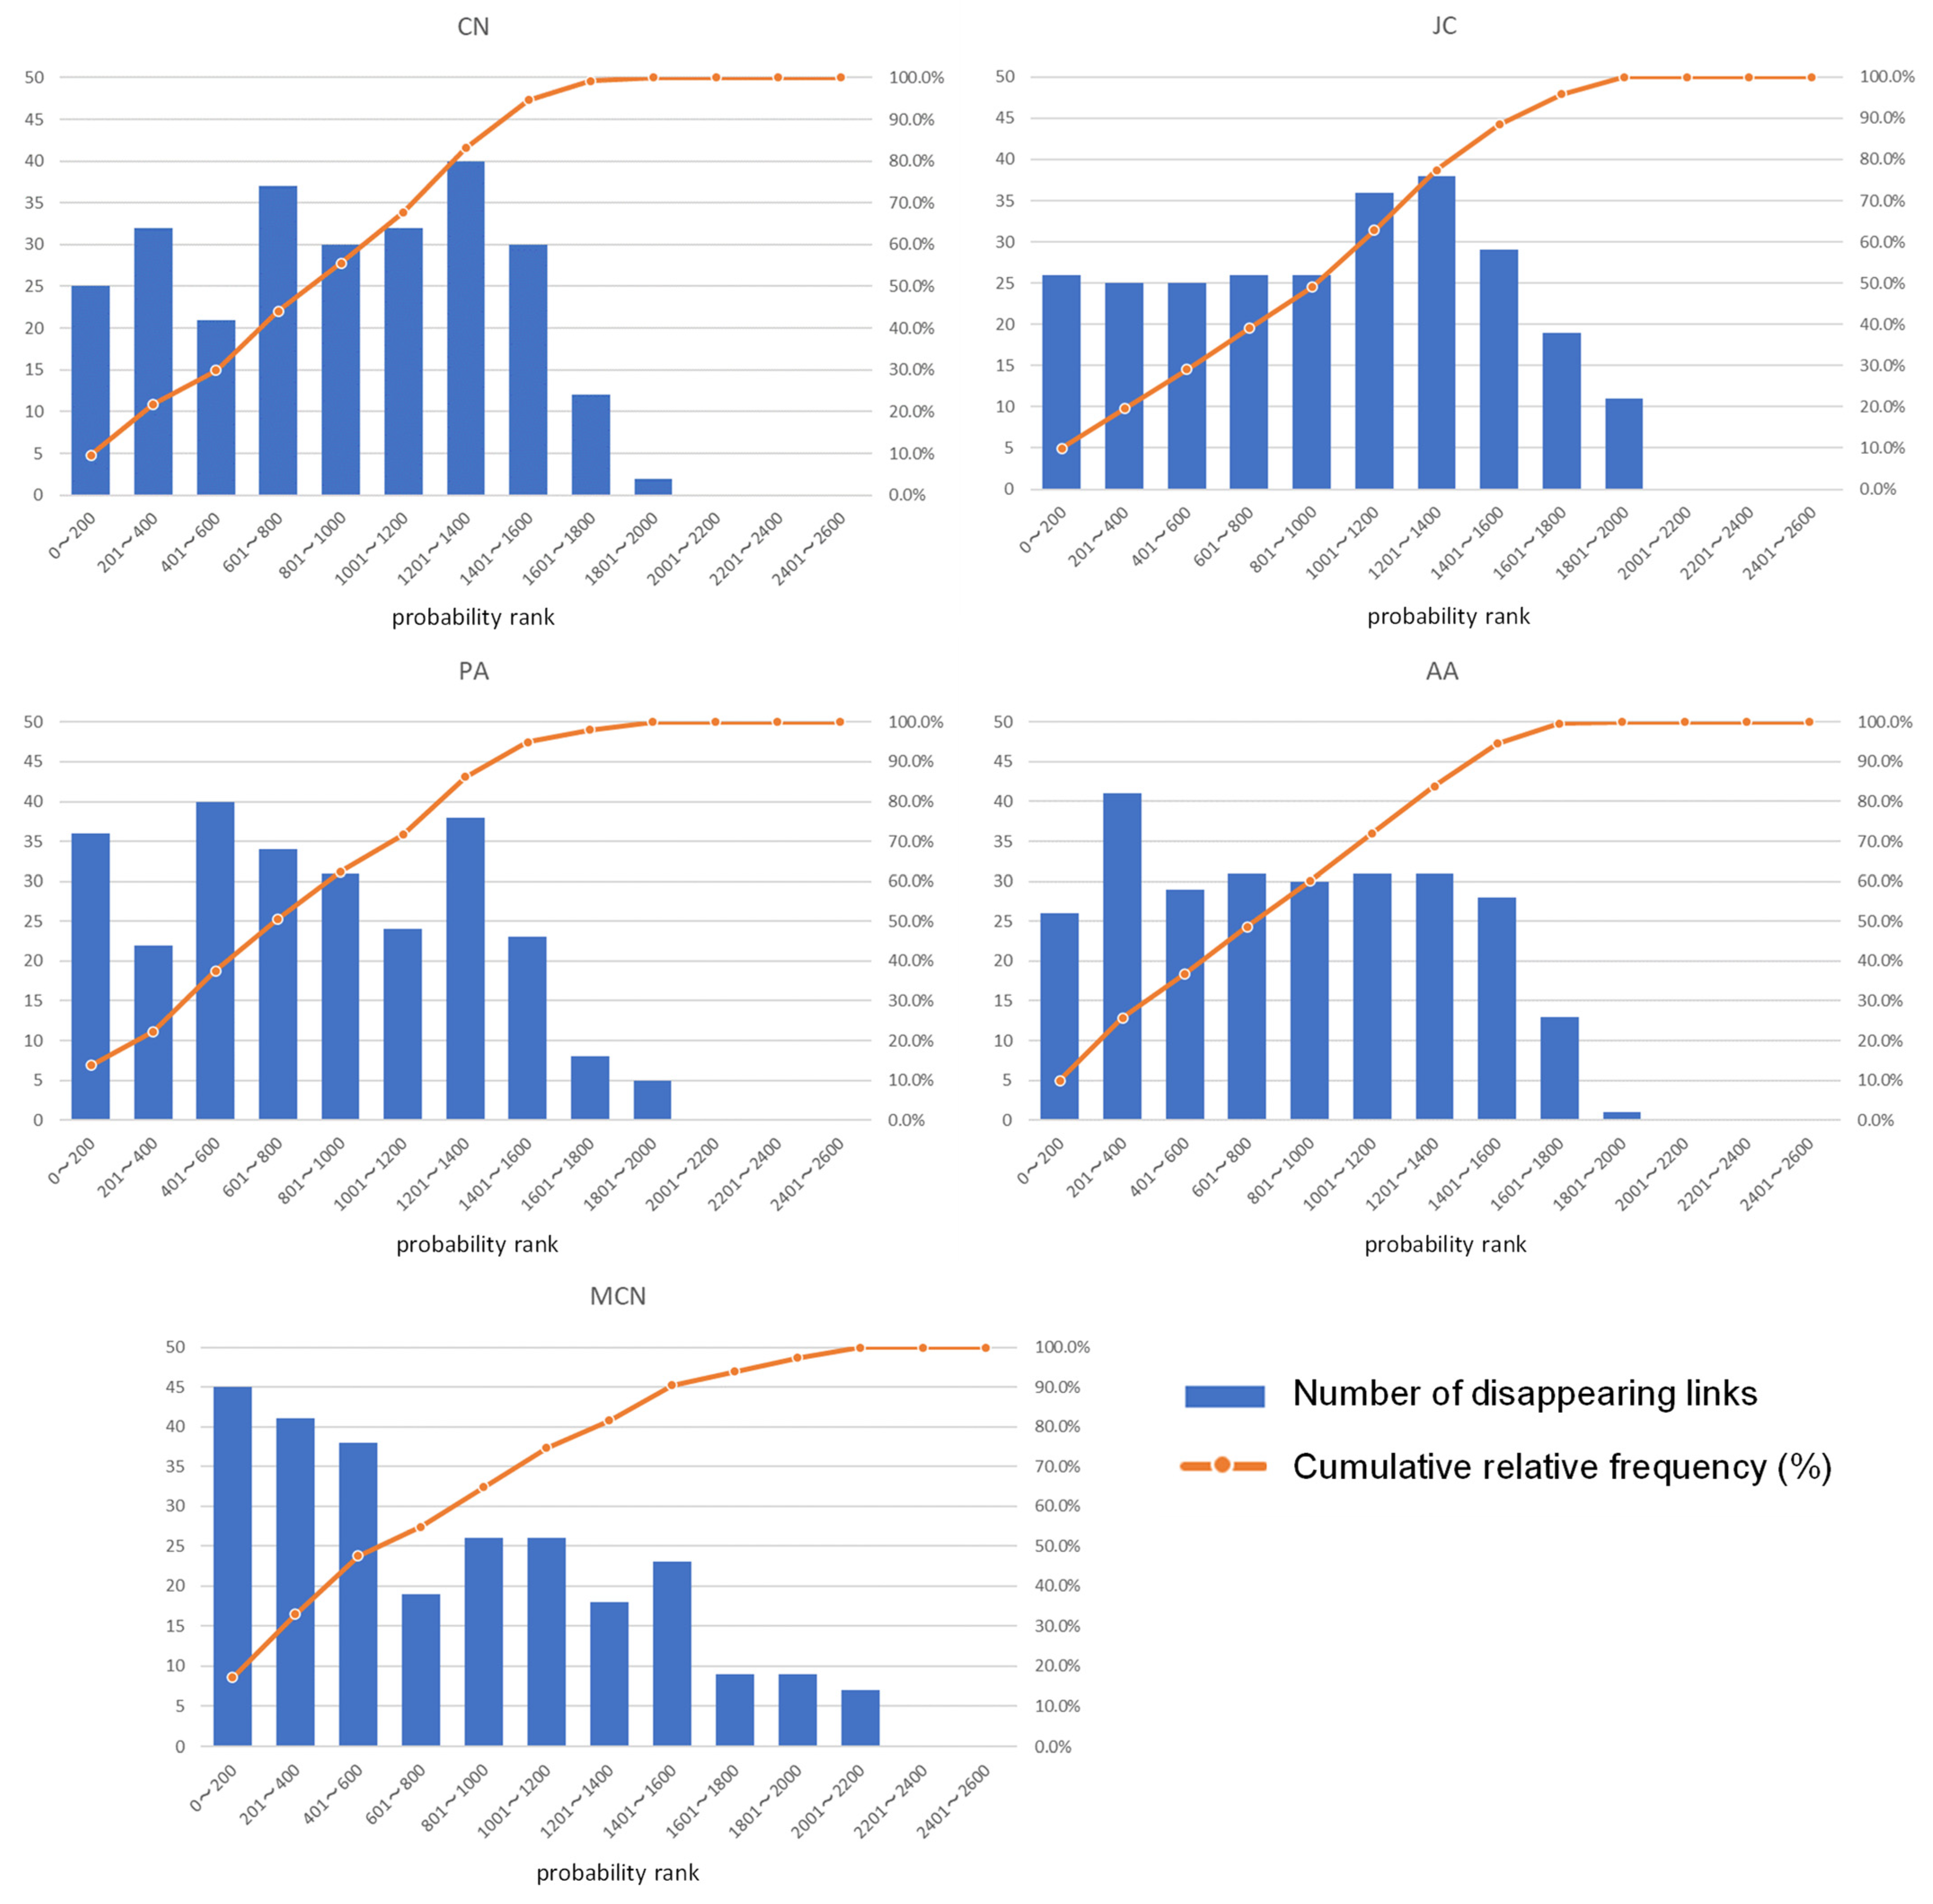
5.3.3. Prediction of Disappearing Links
5.4. Discussion
6. Conclusions
- (1)
- The intra-Asian oceangoing MCS networks have expanded from 2011 to 2021 as the trading partners and trade volume have increased.
- (2)
- The assumptions of the MCN model that new links are likely to be generated between closer or larger ports were suitable as a link prediction method. In particular, the MCN model is good at predicting the new links between ports with short distances. Unlike Kosowska-Stamirowska [7], the MCN model showed the highest prediction accuracy, indicating that the link prediction model should be created with the geographical characteristics for both nodes and links of the region to which it is applied, especially for those having a high concentration of ports with relatively homogeneous economies such as the intra-Asian shipping network.
- (3)
- Regarding the prediction of disappearing links, the accuracy of all the models remained an issue because of a high proportion of small ports characterized by the hub-and-spoke shipping network.
- (1)
- Adding other variables
- (2)
- Improvement of accuracy of shipping distance data between ports
- (3)
- Analysis using time-series data
- (4)
- Improvement of the structure of the MCN model
Author Contributions
Funding
Institutional Review Board Statement
Informed Consent Statement
Data Availability Statement
Conflicts of Interest
References
- United Nations Conference on Trade and Development, 2021. Maritime Transport Indicators—UNCTAD Handbook of Statistics 2021. Available online: https://hbs.unctad.org/maritime-transport-indicators/ (accessed on 4 May 2023).
- Stopford, M. Maritime Economics, 3rd ed.; Routledge: Abingdon, UK, 2009. [Google Scholar]
- Saito, T.; Shibasaki, R.; Murakami, S.; Tsubota, K.; Matsuda, T. Global maritime container shipping networks 1969–1981: Emergence of container shipping and reopening of the Suez Canal. J. Mar. Sci. Eng. 2022, 10, 602. [Google Scholar] [CrossRef]
- Ducruet, C. Maritime Networks: Spatial Structures and Time Dynamics; Routledge: Abingdon, UK, 2015. [Google Scholar]
- Barabási, A.L.; Albert, R. Emergence of scaling in random networks. Science 1999, 286, 509–512. [Google Scholar] [CrossRef]
- Kaluza, P.; Kolzsch, A.; Gastner, M.T.; Blasius, B. The complex network of global cargo ship movements. J. R. Soc. Interface 2010, 7, 1093–1103. [Google Scholar] [CrossRef]
- Kosowska-Stamirowska, Z. Network effects govern the evolution of maritime trade. Proc. Natl. Acad. Sci. USA 2020, 117, 12719–12728. [Google Scholar] [CrossRef] [PubMed]
- Meng, Q.; Wang, S. Liner shipping service network design with empty container repositioning. Transp. Res. Part E 2011, 47, 695–708. [Google Scholar] [CrossRef]
- Notteboom, T.E.; Parola, F.; Satta, G.; Pallis, A.A. The relationship between port choice and terminal involvement of alliance members in container shipping. J. Transp. Geogr. 2017, 64, 158–173. [Google Scholar] [CrossRef]
- Panayides, P.M.; Wiedmer, R. Strategic alliances in container liner shipping. Res. Transp. Econ. 2011, 32, 25–38. [Google Scholar] [CrossRef]
- Ministry of Land Infrastructure Transport and Tourism in Japan. Statistics. Available online: https://www.mlit.go.jp/statistics/details/port_list.html (accessed on 10 February 2022).
- Tavasszy, L.; Minderhoud, M.; Perrin, J.F.; Notteboom, T. A strategic network choice model for global container flows: Specification, estimation and application. J. Transp. Geogr. 2011, 19, 1163–1172. [Google Scholar] [CrossRef]
- Lee, C.-Y.; Meng, Q. Handbook of Ocean Container Transport Logistics; Springer International Publishing: Cham, Switzerland, 2015. [Google Scholar] [CrossRef]
- Shibasaki, R.; Kato, H.; Ducruet, C. Global Logistics Network Modelling and Policy: Quantification and Analysis for International Freight; Elsevier: Amsterdam, The Netherlands, 2020. [Google Scholar] [CrossRef]
- Álvarez, N.G.; Adenso-Díaz, B.; Calzada-Infante, L. Maritime traffic as a complex network: A systematic review. Netw. Spat. Econ. 2021, 21, 387–417. [Google Scholar] [CrossRef]
- Hu, Y.; Zhu, D. Empirical analysis of the worldwide maritime transportation network. Physica A 2009, 388, 2061–2071. [Google Scholar] [CrossRef]
- Ducruet, C.; Lee, S.W.; Ng, A.K.Y. Centrality and vulnerability in liner shipping networks: Revisiting the Northeast Asian port hierarchy. Marit. Pol. Manag. 2010, 37, 17–36. [Google Scholar] [CrossRef]
- Ducruet, C.; Rozenblat, C.; Zaidi, F. Ports in multi-level maritime networks: Evidence from the Atlantic (1996–2006). J. Transp. Geogr. 2010, 18, 508–518. [Google Scholar] [CrossRef]
- Liu, C.; Wang, J.; Zhang, H. Spatial heterogeneity of ports in the global maritime network detected by weighted ego network analysis. Marit. Pol. Manag. 2018, 45, 89–104. [Google Scholar] [CrossRef]
- Liu, C.; Wang, J.; Zhang, H.; Yin, M. Mapping the hierarchical structure of the global shipping network by weighted ego network analysis. Int. J. Ship. Transp. Logist. 2018, 10, 6386. [Google Scholar] [CrossRef]
- Fang, Z.; Yu, H.; Lu, F.; Feng, M.; Huang, M. Maritime network dynamics before and after international events. J. Geogr. Sci. 2018, 28, 937–956. [Google Scholar] [CrossRef]
- Yu, H.; Fang, Z.; Lu, F.; Murray, A.T.; Zhang, H.; Peng, P.; Mei, Q.; Chen, J. Impact of oil price fluctuations on tanker maritime network structure and traffic flow changes. Appl. Energ. 2019, 237, 390–403. [Google Scholar] [CrossRef]
- Ducruet, C.; Notteboom, T. The worldwide maritime network of container shipping: Spatial structure and regional dynamics. Glob. Netw. 2012, 12, 395–423. [Google Scholar] [CrossRef]
- Li, Z.; Xu, M.; Shi, Y. Centrality in global shipping network basing on worldwide shipping areas. GeoJournal 2015, 80, 47–60. [Google Scholar] [CrossRef]
- Wang, L.; Hong, Y.; Lin, Y. Complex network analysis of cross-strait container flows. In Advances in Shipping Data Analysis and Modeling; Ducruet, C., Ed.; Routledge: Abingdon, UK, 2017; pp. 53–68. [Google Scholar]
- Wang, L.; Zhu, Y.; Ducruet, C.; Bunel, M.; Lau, Y. From hierarchy to networking: The evolution of the “twenty-first-century Maritime Silk Road” container shipping system. Transp. Rev. 2018, 38, 416–435. [Google Scholar] [CrossRef]
- Sugimura, Y.; Akakura, Y.; Yotsushima, T.; Kawasaki, T. Evaluation of Japanese port policies through network analysis. Transp. Pol. 2023, 135, 59–70. [Google Scholar] [CrossRef]
- Newman, M.E.J. Clustering and preferential attachment in growing networks. Phys. Rev. E 2001, 64, 025102. [Google Scholar] [CrossRef]
- Jaccard, P. Étude comparative de la distribution florale dans une portion des Alpes et du Jura. B. Soc. Vaud. Sci. Nat. 1901, 37, 547–579. (in French). [Google Scholar] [CrossRef]
- Gu, S.; Li, K.; Liang, Y.; Yan, D. A transportation network evolution model based on link prediction. Int. J. Mod. Phys. B 2021, 35, 2150316. [Google Scholar] [CrossRef]
- Ge, J.; Wang, X.; Shi, W. Link prediction of the world container shipping network: A network structure perspective. Chaos 2021, 31, 113123. [Google Scholar] [CrossRef] [PubMed]
- Adamic, L.A.; Adar, E. Friends and neighbors on the Web. Soc. Netw. 2003, 25, 211–230. [Google Scholar] [CrossRef]
- Jeon, J.W.; Duru, O.; Yeo, G.T. Cruise port centrality and spatial patterns of cruise shipping in the Asian market. Marit. Pol. Manag. 2019, 46, 257–276. [Google Scholar] [CrossRef]
- Kanrak, M.; Nguyen, H.O. Structure, characteristics and connectivity analysis of the Asian–Australasian cruise shipping network. Marit. Pol. Manag. 2022, 49, 882–896. [Google Scholar] [CrossRef]
- Tagawa, H.; Kawasaki, T.; Hanaoka, S. Evaluation of international maritime network configuration and impact of port cooperation on port hierarchy. Transp. Pol. 2022, 123, 14–24. [Google Scholar] [CrossRef]
- Shibasaki, R. Expansions of the Suez and Panama Canals and their impacts on global logistics network. Transp. Econ. 2018, 78, 44–54. (In Japanese) [Google Scholar]
- Boccaletti, S.; Latora, V.; Moreno, Y.; Chavez, M.; Hwang, D.U. Complex networks: Structure and dynamics. Phys. Rep. 2006, 424, 175–308. [Google Scholar] [CrossRef]
- Toriumi, S. Pattern analysis of containerships using maritime shipping network. J. Oper. Res. Soci. Japan 2010, 55, 359–367. (In Japanese) [Google Scholar]


| Year | |||||||||||
|---|---|---|---|---|---|---|---|---|---|---|---|
| 2011 | 2012 | 2013 | 2014 | 2015 | 2016 | 2017 | 2018 | 2019 | 2020 | 2021 | |
| Australia | 0 | 0 | 0 | 0 | 0 | 0 | 0 | 0 | 0 | 1 | 1 |
| Bangladesh | 0 | 1 | 1 | 1 | 2 | 2 | 2 | 1 | 0 | 0 | 1 |
| Brunei | 2 | 2 | 2 | 2 | 2 | 2 | 1 | 1 | 1 | 1 | 1 |
| Cambodia | 1 | 1 | 1 | 1 | 1 | 1 | 1 | 1 | 1 | 1 | 1 |
| China | 40 | 41 | 38 | 37 | 39 | 40 | 43 | 37 | 40 | 42 | 39 |
| East Timor | 1 | 1 | 1 | 1 | 1 | 1 | 1 | 1 | 1 | 1 | 1 |
| Hong Kong | 1 | 1 | 1 | 1 | 1 | 1 | 1 | 1 | 1 | 1 | 1 |
| Indonesia | 11 | 9 | 12 | 13 | 13 | 13 | 13 | 12 | 12 | 12 | 12 |
| Japan | 58 | 59 | 60 | 58 | 62 | 62 | 60 | 59 | 63 | 60 | 63 |
| Malaysia | 14 | 15 | 14 | 14 | 15 | 14 | 12 | 12 | 12 | 11 | 9 |
| Myanmar | 1 | 1 | 1 | 1 | 1 | 1 | 1 | 2 | 2 | 2 | 2 |
| North Korea | 1 | 1 | 0 | 0 | 0 | 0 | 0 | 0 | 0 | 0 | 0 |
| Papua New Guinea | 1 | 1 | 1 | 0 | 0 | 0 | 0 | 0 | 0 | 0 | 0 |
| Philippines | 7 | 7 | 8 | 7 | 7 | 7 | 7 | 7 | 7 | 7 | 7 |
| Russia | 4 | 3 | 4 | 5 | 5 | 5 | 6 | 5 | 5 | 4 | 3 |
| Singapore | 1 | 1 | 1 | 1 | 1 | 1 | 1 | 1 | 1 | 1 | 1 |
| South Korea | 12 | 12 | 10 | 10 | 10 | 11 | 10 | 11 | 12 | 11 | 11 |
| Taiwan | 5 | 5 | 5 | 4 | 4 | 4 | 4 | 4 | 4 | 4 | 4 |
| Thailand | 3 | 4 | 5 | 4 | 4 | 3 | 3 | 4 | 4 | 4 | 4 |
| Vietnam | 6 | 6 | 5 | 7 | 7 | 7 | 6 | 8 | 6 | 7 | 7 |
| Total | 169 | 171 | 170 | 167 | 175 | 175 | 172 | 167 | 172 | 170 | 168 |
| Year | |||||||||||
|---|---|---|---|---|---|---|---|---|---|---|---|
| 2011 | 2012 | 2013 | 2014 | 2015 | 2016 | 2017 | 2018 | 2019 | 2020 | 2021 | |
| Number of nodes (N) | 169 | 171 | 170 | 167 | 175 | 175 | 172 | 167 | 172 | 170 | 168 |
| Number of links (L) | 1765 | 1780 | 1756 | 1818 | 2025 | 2118 | 2068 | 2105 | 2222 | 2227 | 2329 |
| Average degrees (ki) | 20.888 | 20.819 | 20.659 | 21.772 | 23.143 | 24.206 | 24.047 | 25.210 | 25.837 | 26.200 | 27.726 |
| Average betweenness centrality (bi) | 0.007 | 0.007 | 0.007 | 0.007 | 0.006 | 0.006 | 0.006 | 0.006 | 0.006 | 0.006 | 0.006 |
| Average strength (si) (10,000) | 541 | 503 | 573 | 596 | 667 | 757 | 761 | 867 | 926 | 979 | 1015 |
| Average disparity quantity (vi) | 0.188 | 0.181 | 0.190 | 0.180 | 0.166 | 0.153 | 0.154 | 0.148 | 0.142 | 0.142 | 0.131 |
| Max. degrees | 107 | 108 | 104 | 100 | 115 | 114 | 115 | 117 | 125 | 109 | 113 |
| Max. betweenness centrality | 0.201 | 0.202 | 0.190 | 0.177 | 0.182 | 0.182 | 0.195 | 0.206 | 0.216 | 0.160 | 0.154 |
| Max. strength | 6510 | 6286 | 7578 | 6851 | 7853 | 8890 | 8895 | 9306 | 9817 | 10,892 | 10,283 |
| a | b | AUC |
|---|---|---|
| 1 | 1 | 0.9202 |
| 1 | 2 | 0.9271 |
| 1 | 3 | 0.9161 |
| 1 | 4 | 0.8982 |
| 1 | 5 | 0.8792 |
| 2 | 1 | 0.9062 |
| 2 | 2 | 0.9202 |
| 2 | 3 | 0.9267 |
| 2 | 4 | 0.9271 |
| 2 | 5 | 0.9230 |
Disclaimer/Publisher’s Note: The statements, opinions and data contained in all publications are solely those of the individual author(s) and contributor(s) and not of MDPI and/or the editor(s). MDPI and/or the editor(s) disclaim responsibility for any injury to people or property resulting from any ideas, methods, instructions or products referred to in the content. |
© 2023 by the authors. Licensee MDPI, Basel, Switzerland. This article is an open access article distributed under the terms and conditions of the Creative Commons Attribution (CC BY) license (https://creativecommons.org/licenses/by/4.0/).
Share and Cite
Shibuya, K.; Shibasaki, R. Modeling Structural Changes in Intra-Asian Maritime Container Shipping Networks Considering Their Characteristics. Sustainability 2023, 15, 10055. https://doi.org/10.3390/su151310055
Shibuya K, Shibasaki R. Modeling Structural Changes in Intra-Asian Maritime Container Shipping Networks Considering Their Characteristics. Sustainability. 2023; 15(13):10055. https://doi.org/10.3390/su151310055
Chicago/Turabian StyleShibuya, Keigo, and Ryuichi Shibasaki. 2023. "Modeling Structural Changes in Intra-Asian Maritime Container Shipping Networks Considering Their Characteristics" Sustainability 15, no. 13: 10055. https://doi.org/10.3390/su151310055
APA StyleShibuya, K., & Shibasaki, R. (2023). Modeling Structural Changes in Intra-Asian Maritime Container Shipping Networks Considering Their Characteristics. Sustainability, 15(13), 10055. https://doi.org/10.3390/su151310055