Abstract
Currently, there is limited research in the field of micro-scale foggy weather highway lane-change driving assistance systems. This study focuses on the development of a lane-change driving assistance system for vehicles on foggy highways. The system is designed to address the need for lane changes in various scenarios, such as lane number variations, vehicle malfunctions, and vehicle departure from the highway, which are commonly encountered during foggy weather conditions on highways. According to the development trend of the high-precision BeiDou positioning system and electronic map, a lane positioning technology based on vertical iterative methods for lane changes of vehicles driving on foggy highways that relies on V2V technology to study the safe distance of lane changing, in addition to lane-changing warning rules, is proposed; the network performance of the system was tested through a physical design. The experimental results show that the network performance of the system is stable when driving on a foggy highway, with low latency (below 30 ms) and high data throughput (above 550 kb/s at a 300 m communication distance) ensuring fast and effective sending and receiving of information on vehicle driving status. This study can improve the capacity of vehicles on foggy highways and achieve the purpose of “less speed reduction, less road closure”.
1. Quotes
Since the first motorways were built in the 1920s and the 1930s, traffic accidents and congestion caused by extreme weather conditions on highways have remained an unresolved issue. Traffic police departments basically take traffic control (including road closure) measures to cope with highway vehicle passage, especially in foggy environments. This not only restricts the full functioning of the highway, but also, in a sense, transfers accidents from the highway to other roads [1]. Therefore, it is essential to develop a driving assistance system for lane changes that can guide drivers to drive on multiple lanes in foggy motorway environments.
Extensive research has been carried out in an attempt to solve the problem of low traffic passage rates in foggy environments. Huang Y [2] proposed driving as a convoy under unused fog visibility and travel speed control restrictions to establish a car-following model; the real-time adjustment of the following distance of the model then ensures that the vehicles in the foggy environment are safely driving. Qiu YS [3] proposed an object detection algorithm for low-to-light traffic environments, combining image defogging and enhancement methods to detect and identify obstacles in foggy environments, thereby allowing drivers to obtain real-time information about the movement of neighboring vehicles. Tan JH [4] presented an extended model of car tracking on a sloped highway to judge driver misjudgment of car-following distance and active speed reduction behavior in low visibility conditions and correcting driving behavior in dense fog conditions.
Most of the aforementioned studies on driving assistance systems on foggy highways are based on overall vehicle driving. Few studies have been conducted on driving assistance systems focusing on lane changes on foggy highways. However, lane-changing operations on motorways are one of the main traffic actions and can significantly improve the traffic passage rate. Studying driving assistance systems for lane changes on foggy highways is vital for analyzing traffic safety [5] and exploiting detailed traffic flow characteristics [6]. Research on driving assistance systems for lane changes is equally topical. Kusuma A [7] proposed a random utility formulation to study the lane-change mechanism for different lanes, using maximum likelihood estimation techniques and vehicle trajectory data to calibrate the model parameters. Hou Y [8] developed a decentralized cooperative lane-change controller using proximal policy optimization and proposed a cooperative lane-change solution based on deep reinforcement learning, networking, and automated vehicle technology to provide lane-change solutions for different highway traffic conditions. He YM [9] established a lateral acceleration model and a collision avoidance model with minimum safety spacing using a five-polynomial lane-change trajectory model and employed simulation methods to verify the accuracy of the model. The results showed that the safety of vehicles driving on the highway was effectively improved. Xu T [10] developed a hybrid model for highway lane-change detection by extracting feature parameters associated with lane-change behavior from track records and using vision techniques to identify lane-change behavior. Zhang Q [11] studied a deep learning, image processing-based vehicle lane-change warning algorithm to detect vehicle lane-change behavior on a highway from a first-person perspective. The results showed that the lane change detection accuracy was 94.5%. Wang JY [12] proposed an automatic lane-change system for arbitrary lane-change scenarios in highway driving, implementing dual-target tracking via an adaptive cruise controller that used a low-level controller to track trajectories and predict vehicle motion, in addition to the use of environmental envelopes and maneuvers as constraints. Liu W et al. [13,14,15] conducted a series of studies on lane-changing driving assistance systems, using a global navigation satellite system (GNSS) to measure the speed and position of the vehicle and lane-line information obtained from cameras equipped in the vehicle. Additionally, they proposed a visual lane-changing assistance system incorporating GNSS and vision technologies. The abovementioned studies were all based on vision sensor technology for highway lane-change driving assistance systems under normal weather conditions. Nevertheless, in foggy conditions, the vision sensors on the vehicles are subject to changes in the environment, resulting in reduced recognition of the surrounding environment, which in turn affects the safety of lane-change driving.
Therefore, in response to these research gaps, a lane positioning technology, based on vertical iterative methods for vehicle lane-change driving on foggy highways, is proposed. The rapid development trend of centimeter-level positioning and high-precision electronic map technologies enables vehicles to obtain real-time lane information in foggy motorway conditions. Owing to vehicle-to-vehicle (V2V) technology, research on lane-change safety distance and warning rules ensures the safety of vehicles when changing lanes on foggy highways to achieve the purpose of foggy highway multi-lane traffic and improve the efficiency of foggy highway traffic.
2. Trends in BeiDou Positioning System, High-Precision Electronic Maps, and In-Vehicle Network Communication Technology
2.1. Introduction to Lane Positioning Technology
Road positioning technology is currently the most widely used vehicle positioning navigation technology, as shown in Figure 1a. It can realize road speed limits, violation photo alerts, map data searches, route planning, and real-time map displays. However, owing to the limitations of ordinary GPS positioning accuracy (error greater than 2 m) and electronic map accuracy (error greater than 5 m), roads are often abstracted into lines of undifferentiated width, and only road-level positioning can be achieved. As a result, this technology does not cater to the needs of lane positioning for vehicle lane changes.

Figure 1.
Schematic comparison of road positioning and lane positioning. (a) Example of road positioning technology; (b) example of lane positioning technology.
Lane positioning technology combines the high-precision BeiDou positioning system (error less than 10 cm) and a high-precision electronic map (error less than 20 cm) to accurately identify the lane in which the vehicle is moving and calculate the lateral distance between the vehicle and lane line, as shown in Figure 1b. Further improving the perception of the driver regarding the driving condition in his/her surroundings is crucial for achieving lane-level positioning.
2.2. Development of the BeiDou Positioning System
Currently, the BeiDou Navigation Satellite System (BDS) has achieved remarkable results in the field of intelligent transportation and is strongly advocated for application by the state [16]. Consequently, relevant departments are accelerating the development of BDS to steadily improve the performance of the system in terms of positioning accuracy, capacity, and resistance to radio wave interference. The high-precision positioning service platform 2.0 of BeiDou has improved the civil positioning accuracy to 1.2 m. With all the BeiDou satellites in the sky and continuously operating reference stations set up extensively across the country, a positioning system with a centimeter-level accuracy will eventually be established and widely used in areas such as intelligent transportation [17]. The highly reliable BDS can provide world-standard timing services and highly accurate, dynamic, real-time positioning information for lane positioning technology. Furthermore, it is not affected by extreme weather, unlike sensors such as millimeter-wave radar and infrared and high-definition cameras. It is also a positioning technology developed independently in China. This shows that research on lane positioning technology based on centimeter-level BDS is feasible and promising.
2.3. Development of High-Precision Electronic Maps
To achieve precise positioning of vehicles in foggy motorway environments, technical support from the BeiDou positioning system alone is not sufficient; it must also be combined with data from a high-precision onboard map. At present, some domestic companies have already started to experiment with the production and manufacture of high-precision maps and cooperate with electronic navigation map production and car companies to jointly develop a high-precision onboard map covering national highways and containing road traffic information including lanes, lane boundaries, lane centerlines, lane numbers, curvature data, heading angles, ramp degrees, and traffic signs. Through research and development, a relative accuracy of 10 to 20 cm can be achieved. Literature [18] shows that from a technical point of view, the positioning accuracy of high-precision electronic maps can be 5 cm at this stage. The development trend indicates that the exploitation of lane positioning technology will soon provide technical support for high-precision maps.
2.4. Development of V2V Technology
Vehicle-to-vehicle (V2V) communication is a wireless communication technology that enables vehicles to transmit information, including vehicle position, speed, direction, and acceleration, to each other in a 5.9 GHz band. Because V2V technology is a good solution to the problem of the driver perceiving the driving conditions around a vehicle in a foggy driving environment, it has gradually become a priority for research institutes, government departments, and the automotive industry [19]. At this stage, V2V technology has a very promising market, and car manufacturers, such as General Motors, Ford, and Volvo, have started pilot projects in cities in the US and Europe to test the effectiveness and feasibility of this technology. According to several reports, the global V2V market will grow rapidly in the coming years and is expected to reach billions of dollars by 2025. The development trend shows that V2V technology can provide technical support for the construction of a foggy motorway lane-change assistance system [20].
3. Foggy Weather Driving Rules and Positioning Accuracy Requirements
3.1. Design of Rules for Driving in Foggy Weather
Considering the complex effects of lane-change driving on traffic accidents, low visibility on driver psychology, and road humidity on vehicle braking distance, the following rules were designed for vehicles equipped with lane-change driving assistance systems to ensure driving safety: (1) The BeiDou positioning system signal receiver was installed on the longitudinal bisector of the vehicle. (2) Under normal circumstances, the vehicle followed the speed and safety distance set by the formation according to the visibility of the road in the area of travel; the vehicle enters lane-change driving mode according to actual demand in the event of special circumstances such as changes in the number of lanes, vehicle breakdowns, or vehicles leaving the motorway. The vehicle will be guided to drive along the centerline of the lane when not changing lanes and prohibited from excessively deviating from the centerline of the lane. Considering the overall safety of the vehicle driving in foggy weather and the ability of the driver, the permitted lateral deviation distance between all driving vehicles and the lane centerline was specified as 40 cm in this study.
3.2. Analysis of Positioning Accuracy Requirements
The accuracy of lane positioning technology depends on the combined accuracy of the BDS positioning and electronic map accuracies. To realize lane positioning, there are certain requirements for the accuracy of the positioning system and the electronic map. The positioning accuracy of the positioning system and electronic map is and , respectively. The positioning accuracy requirement analysis is shown in Figure 2.
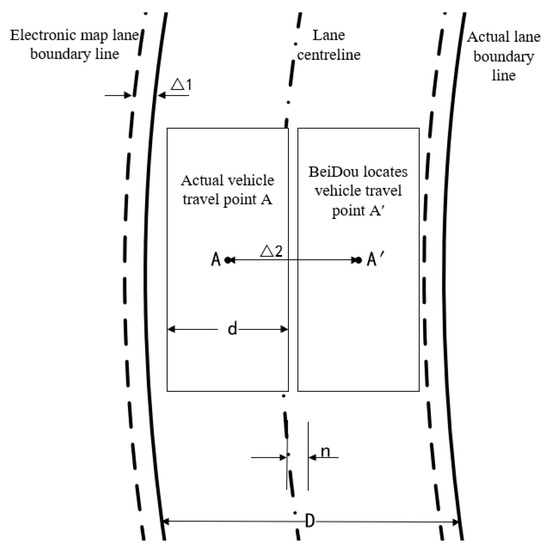
Figure 2.
Lane positioning technology accuracy analysis diagram.
Figure 2 shows an accuracy analysis diagram for lane positioning technology. To achieve lane positioning, and must satisfy the following conditions:
where d is the width of the vehicle, n is the permitted lateral offset between the vehicle and the centerline of the lane, and D is the width of the motorway lane.
The highway lane width in China is ; according to the driving rule design, ; vehicle width is generally ; by considering ,
From Equation (2), it can be seen that for vehicles of 1.6 to 2.5 m width, to achieve lane-level positioning, the accuracy must be less than 22.5 cm.
4. Vehicle Lane Recognition
As can be seen in Figure 3, when a vehicle is driven to a certain location on the road, the flow of the driving assistance system for the lane-change onboard unit determines the lane the vehicle is in. The system first determines whether the driver is making a lane-change operation based on the CAN bus or onboard unit. If the CAN bus collects a turn signal or the onboard unit receives a signal indicating the driver intends to change lanes, the vehicle performs or prepares to perform a lane-change operation, and the onboard unit sends a lane-change message to the surrounding vehicles and performs the lane-change operation. At this point, the lane positioning technology obtains the information of the current midpoint of the front and rear axle centerlines (vehicle center) through a high-precision BDS, including the position coordinates of the vehicle center in the plane coordinate system, heading angle, and other data. The information stored in the high-precision map, such as the lane boundary, lane centerline, lane number, and heading angle of the highway where the vehicle is currently driving, is retrieved, and the onboard unit projects the real-time BDS data of the vehicle center onto the high-precision map of the present road section of the moving vehicle, obtains the real-time position and heading angle of the vehicle center on the high-precision map during the lane-change driving process, and then measures the lateral distance between the vehicle center on the high-precision map and the centerline of the nearest lane on the left and right sides using the vertical iteration method, determines the lane number, and sends the information to the surrounding vehicles simultaneously. It seems obvious that the real-time calculation of the lateral distance between the center point of the vehicle and the centerline of the nearest lane on the left and right sides is the core technology for lane discrimination in vehicle driving.
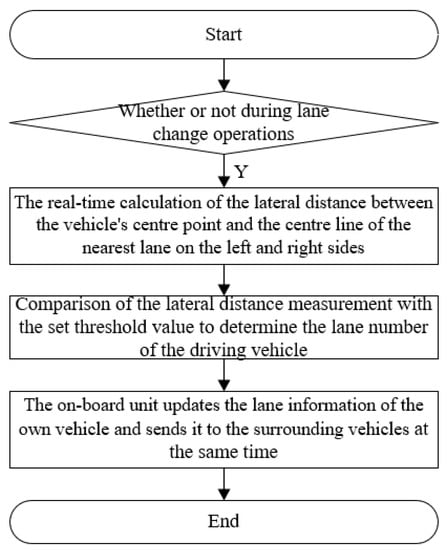
Figure 3.
Flow chart of the vehicle lane-change driving lane positioning method.
In this study, the vertical iterative method was used to calculate the lateral distance between the vehicle center point and the centerline of the nearest lane on the left and right sides. The specific method for solving for the lateral distance using the vertical iterative method is shown in Figure 4 and Figure 5.
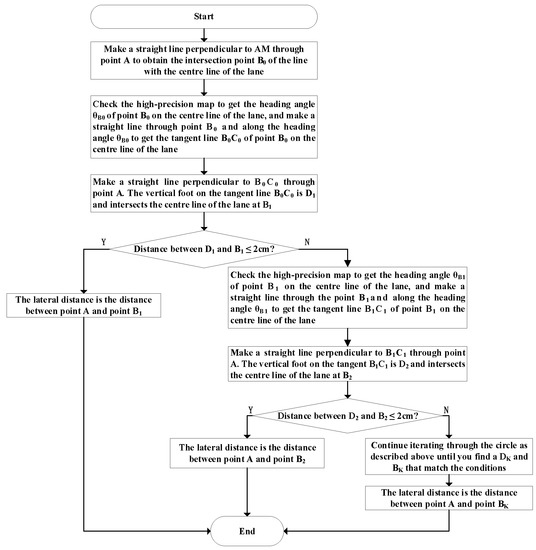
Figure 4.
Transverse distance solving process.
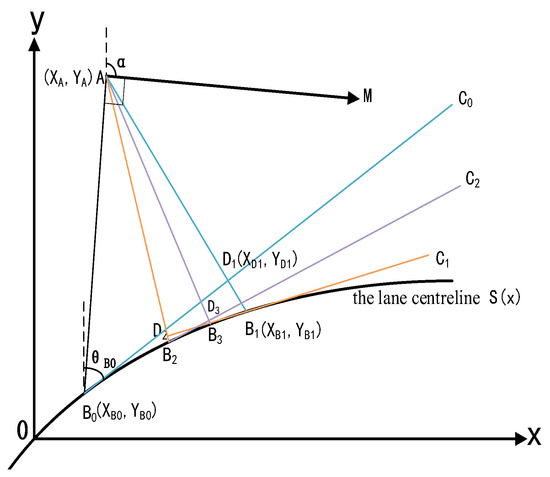
Figure 5.
Schematic diagram of the iterative method of solving for transverse distances.
According to Figure 5, assuming that in the plane coordinate system [21], the coordinates of the projection point A of the vehicle center on the electronic map are , the heading direction is , the heading angle is , the expression of the lane centerline is , the expression for the lane centerline heading angle is [16], the error threshold is set to , and the specific calculations of the vertical iterative method to solve the lateral distance are as follows:
(1) A straight line through point A and perpendicular to is drawn, the equation of which is as follows:
(2) The equation of the line in Equation (3) is combined with the equation of the lane centerline to find the coordinates of the intersection point , and the coordinates of the intersection point are then substituted into the lane centerline heading angle equation to obtain the heading angle at point on the lane centerline .
(3) A straight line is drawn through point and along the heading angle , the equation of which is as follows:
Another straight line is drawn through point and perpendicular to line , the equation of which is as follows:
(4) Equation (5) is combined with Equation (4) of the line to find the coordinates of the intersection ; Equation (5) is combined with the equation of the lane centerline to find the coordinates of the intersection . Finally , the distance between and is calculated as follows:
If , then let , , and go to Step (8).
(5) If , the coordinates () of intersection are substituted into the equation for the heading angle of the lane centerline to obtain the heading angle at point on the lane centerline , and a straight line is drawn along the heading angle through point , the equation of which is
A straight line through point and perpendicular to line is drawn, the equation of which is as follows:
(6) Equation (8) is combined with Equation (7) of the line to find the coordinates of the intersection point ; Equation (8) is combined with the equation of the lane centerline to find the coordinates of the intersection point . Finally, of the distance between and is calculated as follows:
If , then let , , and go to Step (8).
(7) If , continue to calculate according to Steps (5) and (6) until Step K is iterated. For the intersection of the line passing through point and perpendicular to the line with line at point , the intersection of a line passing through point A and perpendicular to the line with the lane centerline at point , when the distance of between and , let , , and go to Step (8).
(8) The lateral distance D between point A and the lane centerline is as follows:
It should be noted that as the permitted lateral deviation distance “n” between all vehicles and the centerline of the lane is set at 40 cm, and the positioning accuracy of the positioning system and of the electronic map need to be less than or equal to 22.5 cm, the lateral distance of the vehicles in the car-following scenario should be within 40 + 22.5 = 62.5 cm. When the vehicle changes lanes from lane to lane , if the lateral distance between the center of the vehicle and the centerline of the nearest lane on the left and right sides (lanes and ) is measured on the high-precision map as and , respectively, and if is less than or equal to the set threshold value of 62.5 cm, the lane number is judged to be . If is less than or equal to the set threshold value of 62.5 cm, then the lane number is judged to be . Otherwise, the vehicle is judged to be in the lane-change state.
5. Safety Distance for Lane Change and Design of Lane-Change Warning Rules
5.1. Determination of Safe Distances for Changing Lanes
As the foggy highway driving environment is more complex, this study, based on the theory of minimum safe distance, considers the psychological impact of the foggy environment on the driver and the impact of communication delay in a vehicle–vehicle communication environment, and determines the safe distance for vehicle lane change on foggy highways. A simplified graph of the car braking time versus car braking acceleration when the driver performs a braking operation under emergency conditions is shown in Figure 6 [22].
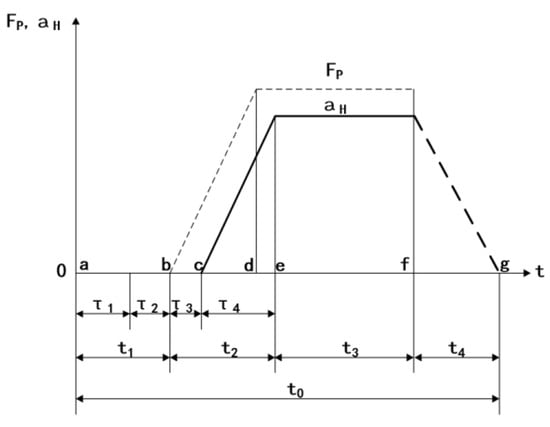
Figure 6.
Vehicle braking, simplified process.
As shown in the diagram, the braking distance S of the car under normal conditions is calculated as follows:
where is the braking distance (m), is the reaction time of the driver, is the pedal change time of the driver, is the time for the brake to act, is the time for the braking force to be applied, is the starting braking speed (km/h), is the braking deceleration (m/s2).
Studies [23] have opined that after the driver has stopped safely, a distance d needs to be retained between the front and rear vehicles to ensure absolute safety, generally taken as a distance of 2–5 m. Depending on the actual situation, the time from point to point b is the reaction time between the driver discovering the situation and taking braking action, which is generally 0.3–1.0 s for a normal person. Point b to point e is the time between the brake starting to generate braking force and reaching the maximum braking deceleration, generally 0.2–0.9 s. Considering that the vision of a driver is restricted in a foggy environment, is 1 s, is 0.1 s, is 0.4 s, and d is 5 m [24], Equation (11) can be simplified as follows:
In addition, considering the time-division multichannel communication mechanism used by V2V technology, it takes 100 ms to complete an effective communication, while a single vehicle can, at most, record the driving information of eight nearby vehicles [25]; therefore, the longest time of communication cycle (communication delay time) of two vehicles associated with each other is 800 ms. By adding the distance traveled by the vehicle during the communication delay time (i.e., the delay time multiplied by the initial vehicle speed) to Equation (12), the following equation is obtained:
To fully and reasonably improve the capacity of the highway in foggy weather, the system sets the upper limit of the driving speed for different visibility conditions: the lower the visibility, the slower the specified traveling speed, and the greater the distance maintained between vehicles. From Equation (13), a summary table of the safety distance parameters is generated, as shown in Table 1:

Table 1.
Summary table of safety distance parameters (unit: m).
5.2. Design of Lane-Change Warning Rules
When a vehicle needs to perform a lane-change operation, required because of a change in the number of lanes, vehicle breakdown, vehicle leaving the motorway, etc., occurring while the vehicle is traveling on the highway, the driving assistance system for lane changes should provide an appropriate warning strategy based on the four following states of lane-changing vehicles and other related vehicles. The warning strategy is illustrated in Figure 7.
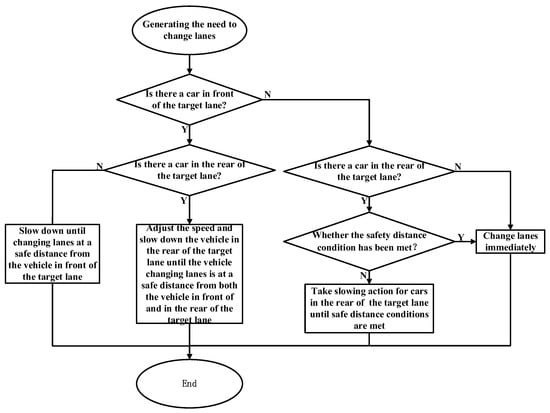
Figure 7.
Lane-change control process.
Status 1: No other vehicles within the communication range of the target lane.
Status 2: Presence of a potentially dangerous vehicle in front of the target lane
Status 3: Presence of a potentially dangerous vehicle at the rear of the target lane.
Status 4: Presence of potentially dangerous vehicles in front of and at the rear of the target lane.
For status 1, there are no other vehicles traveling within the communication range in the target lane, and the lane-change operation can be performed directly with the assistance of the onboard unit.
For status 2, if the distance between the vehicle in the target lane ahead of the lane-change vehicle and the lane-change vehicle satisfies the lane-change safety distance requirements, the lane-change operation can be performed directly with the assistance of the onboard unit. If the distance between the vehicle in the target lane ahead of the lane-change vehicle and the lane-change vehicle does not satisfy the lane-change safety distance requirements, the lane-change vehicle performs a deceleration operation until the lane-change safety distance condition is satisfied.
For status 3, if the distance between the vehicle in the target lane at the rear of the lane-change vehicle and the lane-change vehicle satisfies the lane-change safety distance requirements, the lane-change operation can be performed directly with the assistance of the onboard unit. If the distance between the vehicle in the target lane at the rear of the lane-change vehicle and the lane-change vehicle does not satisfy the lane-change safety distance condition, the vehicle in the target lane at the rear of the lane-change vehicle performs a deceleration operation until the lane-change safety distance condition is satisfied.
For status 4, if the distance between the vehicles in the target lane in front of and in the rear of the lane-change vehicle and the lane-change vehicle satisfies the lane-change safety distance condition, the lane-change operation can be exercised directly with the assistance of the onboard unit; if the distance between the vehicles in the target lane in front of the lane-change vehicle and the lane-change vehicle does not satisfy the lane-change safety distance condition, the vehicles at the rear of the lane-change vehicle and the lane-change vehicle simultaneously perform deceleration operation until the lane-change safety distance condition is satisfied; if the distance between the vehicle at the rear of the lane-change vehicle and the lane-change vehicle does not satisfy the lane-change safety distance condition, the vehicle at the rear performs the deceleration operation until it satisfies the lane-change safety distance condition; if both the distances between the vehicle in front of and at the rear of the lane-change vehicle and the lane-change vehicle do not satisfy the lane-change safety distance condition, the vehicle at the rear and the lane-change vehicle perform the deceleration operation at the same time, giving priority to satisfying the lane-change safety distance condition between the lane-change vehicle and the vehicle in front, and then the situation is analyzed according to the distance between the vehicle at the rear and the lane-change vehicle until both satisfy the lane-change safety distance condition.
6. System Design and Network Performance Testing and Analysis
6.1. System Design
The driving assistance system for lane changes on a foggy highway consists of a main control chip (STM32F4 embedded chip), a BDS positioning module, an onboard wireless data transmission and reception modules, a data storage module, and a power management unit. As shown in Figure 8, on the left-hand side of the main control unit (MCU) STM32 chip in the block diagram are FLASH memory devices, DDR2L memory devices, EMMC memory devices, and Temp Sensor temperature sensors, where the memory devices are used for data calculation and storage and the temperature sensors are used to detect and control the operating temperature inside the MCU; on the right side is the CAN communication and USB_OTG interface for device upgrade; below is the power supply module of the system and JTAG program download module; above is the UB480 (with RTK centimeter-level positioning accuracy) BeiDou navigation and positioning board and SAF5100 (based on IEEE WAVE communication protocol) onboard wireless communication module; the data transmission of the system communication module is transmitted by the USB-Hub, and the remaining connections and communication methods are shown above the connection lines in the block diagram.
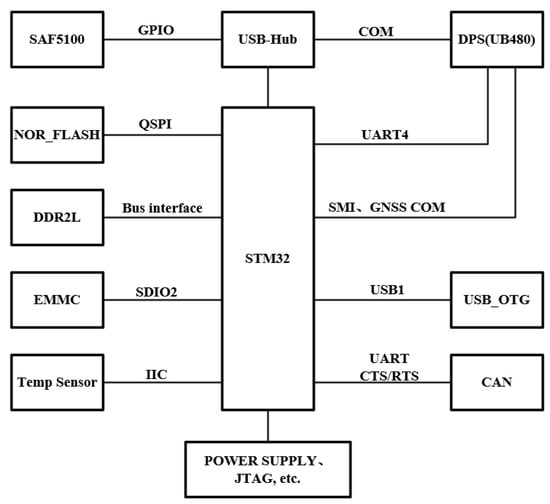
Figure 8.
Overall system block diagram.
6.2. Network Performance Testing and Analysis
The performance testing of the driving assistance system for lane changes on foggy highways studied in this paper needs to be carried out at a test site supported by technologies such as centimeter-level BDS and high-precision electronic maps; however, owing to the limited test conditions, this study conducted testing and analysis of the vehicle–vehicle communication network performance.
6.2.1. The Construction of Vehicle–Vehicle Communication Network
- Selection of Physical Layer Parameters
The role of the physical layer is to ensure that the original data can be transmitted consistently and efficiently over a variety of physical media. The orthogonal frequency division multiplexing (OFDM) technology used in this system can achieve a transmission rate of 27 Mb/s over a distance of 300~1000 m in a bandwidth of 10 MHz, and a WAVE device with such performance can already meet the needs of a large number of applications in the car networking environment. The basic parameters of a 10 MHz OFDM channel are shown in Table 2.

Table 2.
Basic Parameters of OFDM Channel.
Forward error correction (FEC) is used to ensure the accuracy of data transmission in the physical layer of the system; however, the increase in the length of useless data somewhat reduces the rate of effective data transmission. The eight modulation methods of OFDM are shown in Table 3. For example, if a three-quarter coding rate is used in QSPK, there are 9 bits of user data and 24 bits of coded data in a 72-bit OFDM signal. Because OFDM has a signal period of 8 μs and thus a data rate of 9 Mb/s, the system was analyzed using QPSK modulation and a 1/2 coding rate to ensure good channel loading and a stable signal-to-noise ratio.

Table 3.
Eight Modulation Methods for OFDM.
- 2.
- Select Parameters at the MAC Layer
The MAC layer, the media intervention control layer, defines how data frames are transmitted over the medium. The MAC data frame format used in this system is shown in Figure 9.

Figure 9.
Data Frame Format.
The first two bytes of data represent the control part of the frame, consisting mainly of the type of protocol, the type of frame, and a few other bits, while Dur represents the time part of the frame, which sets the duration of the frame or controls the duration of data transmission to the physical layer. Addr1, Addr2, and Addr3 indicate the address and wildcard of the transmitter and receiver. The last four bits are the frame validation bits, consisting of a 4-bit cyclic redundancy code (CRC) to ensure the accuracy of the data transmitted in the frame. In the Frame Body section, 0–2304 bytes are allocated to store the transmitted data information, which in this system represents the travel information of the adjacent vehicles, mainly including position, speed, and vehicle travel lane ID. Qos Ctr1 is used to ensure the security of the data transmission.
For two devices to establish communication, the traditional MAC layer wireless access mechanism is carrier sense multiple access/collision avoidance (CSMA/CA), but it has the drawback of excessive delay, so this paper adopts the OFDMA-CSMA time–frequency two-dimensional hybrid access mechanism, whose frequency and time domain resources are divided as shown in Figure 10.
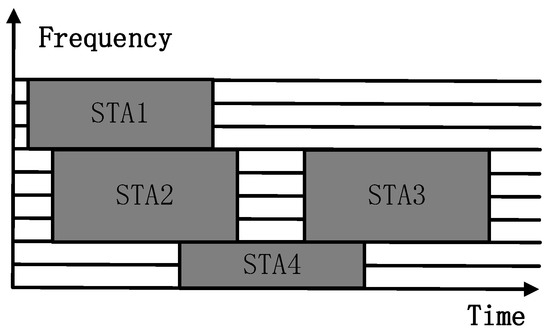
Figure 10.
Resource Partitioning Under OFDM-CSMA Access Mechanism.
- 3.
- Selecting the Multichannel Switching Mode
A new feature of the MAC layer is the multichannel switching mechanism, provided by IEEE 1609.4, which guarantees perfect reception of all messages, such as secure messages and entertainment messages, on different channels.
In order to improve the accuracy of data transmission and to reduce the latency of data transmission, the time division multichannel switching mechanism is adopted. IEEE 1609.4 has developed a special time division multichannel switching mechanism for the WAVE stack, which is implemented by breaking up every 100 ms into sync periods (SPs), which are divided into 50 ms of control channel time (CCH) and service channel time (SCH) within each sync period, with the CCH and SCH separated by a guard interval of 4ms, and the devices use the guard interval to receive data until the next GI arrives before continuing to transmit data, during which time all devices assume that the neighboring devices are performing channel translation operations. The timing of the division mechanism is shown in Figure 11.
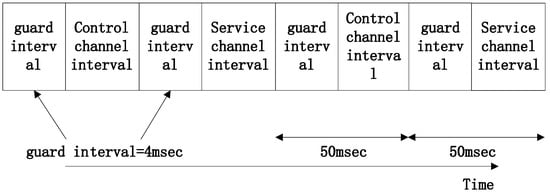
Figure 11.
Time Division Mechanism.
6.2.2. Network Performance Testing in a Car-Following Scenario
- Experimental procedure
- (1)
- Hardware tools as shown in Table 4:
 Table 4. Car-Following Scenario Hardware tools.
 - (2)
- Software tools:
Windows operating system, vehicle–vehicle communication test software (V1.0).
- (3)
- Personnel arrangements:
Two people in each vehicle: one for driving and the other for operating the equipment and overall coordination.
- (4)
- Experimental procedures:
- (1)
- As shown in Figure 12: The condition of the vehicle before the experiment is checked to ensure good performance. The experimental equipment is loaded, the testing software is started, the folder where the data will be saved at 30 km/h is set, and the start of the test is coordinated. Both Cars A and B were car following at approximately 30 km/h, and the distance between the two vehicles was maintained at a safe distance. The test was repeated for several sets of data and then stopped.
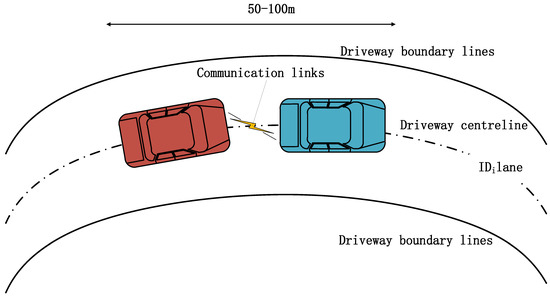 Figure 12. Schematic Diagram of Network Test in the Context of Car Following.
 - (2)
- After exiting the above test process, the program sets the folder for the software test to save data at 40 km/h, and the start of the test is coordinated. Both Cars A and B were car following at approximately 40 km/h, and the distance between the two vehicles was maintained at a safe distance. The test was repeated for several sets of data and then stopped.
- (3)
- After exiting the above test process, the program sets the folder for the software test to save data at 50 km/h, and the start of the test is coordinated. Both Cars A and B were car following at approximately 50 km/h, and the distance between the two vehicles was maintained at a safe distance. The test was repeated for several sets of data and then stopped.
- (4)
- After exiting the above test process, the program sets the folder for the software test to save data at 60 km/h, and the start of the test is coordinated. Both Cars A and B were car following at approximately 60 km/h, and the distance between the two vehicles was maintained at a safe distance. The test was repeated for several sets of data and then stopped.
- (5)
- Back up the folder and copy it out.
- 2.
- Data analysis
The network performance test in the car-following scenario mainly includes the relationship between the delay in sending and receiving data and the speed of the car-following vehicle, and the relationship between the data transfer throughput and the speed of the car-following vehicle. The speed of the test was not higher than 60 km/h because it simulated a foggy highway-driving environment. The test data are listed in Table 5 and Table 6, and the following conclusions can be drawn from the data analysis:

Table 5.
Throughput in relation to speed in a car-following scenario (unit: kb/s).

Table 6.
Latency in relation to speed in a car-following scenario (unit: ms).
- (1)
- In the tested speed range, owing to the Doppler effect, the maximum value of network delay increases with the vehicle driving speed, reaching a maximum of 30 ms, which is in line with the international standard for vehicle–vehicle communication delay (less than 100 ms) [26] and can satisfy the demand for real-time network performance in a car-following environment.
- (2)
- As the speed of the test vehicle increased, the standard deviation of the data transmission delay increased slightly, indicating that the stability of the network was related to the speed of the vehicle (the faster the speed, the more unstable the network), but within reasonable limits.
- (3)
- The average value of the delay data follows the opposite trend to the rest of the data; that is, as the speed of the vehicle increases, the average network delay decreases. This is mainly because the receiving antennas are directional, resulting in faster signal fading at close range and decreasing real-time performance.
- (4)
- The system test found a large difference between the maximum value of the throughput test and the average value, indicating that the in-vehicle communication network of this system is not suitable for the direct transmission of high-throughput data. Nevertheless, the minimum throughput of 800 kB/s is sufficient to meet the requirements for small data transfer of vehicle driving status information.
6.2.3. Network Performance Testing in Lane-Change Scenarios
- Experimental procedure
- (1)
- Hardware toolsas shown in Table 7:
 Table 7. Lane-Change Scenarios Hardware tools.
 - (2)
- Software tools:
Windows operating system, vehicle–vehicle communication test software.
- (3)
- Personnel arrangements:
Two people in each vehicle: one for driving and the other for operating the equipment and overall coordination.
- (4)
- Experimental procedures:
- (1)
- As shown in Figure 13: The condition of the vehicle before the experiment is checked to ensure good performance. The experimental equipment is loaded, the testing software is started, the folder where the data will be saved at 30 km/h is set, and the start of the test is coordinated. Both Cars A and B travel along the experimental site at approximately 30 km/h, and the test is carried out when Car A performs a lane-change operation. The test was repeated several times and then stopped.
- (2)
- After exiting the above test process, the program sets the folder for the software test to save data at 40 km/h, and the start of the test is coordinated. Both Cars A and B travel along the experimental site at approximately 40 km/h, and the test is carried out when Car A performs a lane-change operation. The test was repeated several times and then stopped.
- (3)
- After exiting the above test process, the program sets the folder for the software test to save data at 50 km/h, and the start of the test is coordinated. Both Cars A and B travel along the experimental site at approximately 50 km/h, and the test is carried out when Car A performs a lane-change operation. The test was repeated several times and then stopped.
- (4)
- After exiting the above test process, the program sets the folder for the software test to save data at 60 km/h, and the start of the test is coordinated. Both Cars A and B travel along the experimental site at approximately 60 km/h, and the test is carried out when Car A performs a lane-change operation. The test was repeated several times and then stopped.
- (5)
- Back up the folder and copy it out.
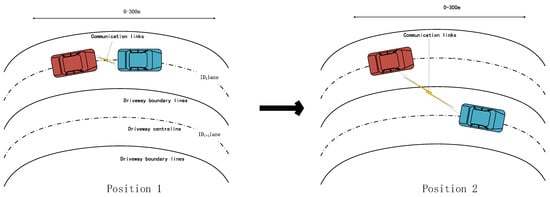
Figure 13.
Schematic Diagram of Network Test in Lane-Change Scenarios.
- 2.
- Data analysis
The network performance tests in the lane-change scenario mainly include delay in data sending and receiving versus relative speed, and data sending and receiving throughput versus relative speed. The test data are listed in Table 8 and Table 9 and Figure 14 and Figure 15, and the following conclusions were drawn from the analysis of the results:

Table 8.
Throughput in relation to speed for lane-change scenarios (unit: kb/s).

Table 9.
Latency in relation to speed for lane-change scenarios (unit: ms).
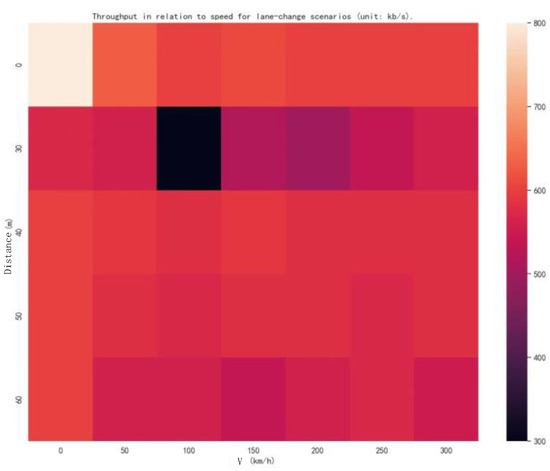
Figure 14.
Throughput in relation to speed for lane-change scenarios.
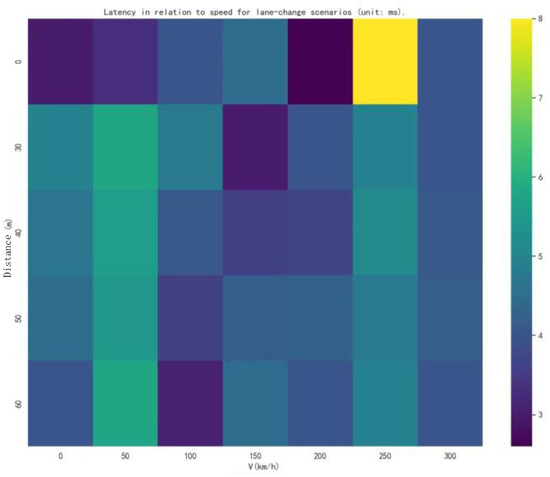
Figure 15.
Latency in relation to speed for lane-change scenarios.
The first set of data in Table 8 and Figure 14 shows the quantitative relationship between the distance and data transmission throughput for vehicle-to-vehicle communication in the stationary state of the vehicle. It can be seen that there is not much change in the static communication throughput from 50 m to 300 m, indicating that in the stationary state, the level of the throughput is independent of the distance. In the dynamic motion scenario, on the other hand, the faster the vehicle speed, the lower the throughput, and the fluctuations start to increase, leading to a decrease in system stability. Nevertheless, a minimum throughput of 550 kB/s is sufficient to meet the requirements of the transmission of vehicle driving status information.
The test results of the RTT time delay are listed in Table 7 andFigure 12. In general, the results of testing different vehicle speeds show that the time delays are all unstable and fluctuate; however, they are all stable within 10 ms, which can ensure the reliability of the vehicle–vehicle communication system.
6.2.4. Summary of Test Results
Combining the above test results, we conclude the following:
- (1)
- In general, the vehicle–vehicle communication network of the system performs well in terms of RTT latency and can maintain stability under foggy weather lane-change scenarios, with an average system transmission latency within 5 ms and the highest latency within 30 ms, which can fully meet the demand.
- (2)
- Good communication performance was maintained within a communication distance of 300 m.
- (3)
- The throughput of the in-vehicle unit during data transmission will fluctuate slightly with changes in the external environment, such as distance and speed. However, as an application category for information interaction that does not require large amounts of data transmission, communication is also guaranteed.
- (4)
- From the actual test scenario, the data at a speed of 30 km/h are not optimal, and the repeated tests are similar, which is related to the directionality of the antenna of the data transceiver.
7. Conclusions
In this paper, in order to develop a driving assistance system for lane changes that can guide drivers to drive in multiple lanes in a foggy highway environment, according to the rapid development trend of centimeter-level positioning technology and high-precision electronic map technology, a lane-change driving lane positioning technology based on the vertical iterative method for foggy highway vehicles is proposed, enabling vehicles to identify real-time driving lane information in a foggy highway environment, relying on V2V technology, lane-change safety distance research, and lane-change warning rules, to ensure that vehicles can safely change lanes when driving in a foggy highway environment. This solution can effectively solve the problem of a low traffic passage rate due to low visibility in foggy highway environments, to meet the needs of vehicles that have to change lanes on the motorway in the event of a change in the number of lanes, a sudden breakdown of a moving vehicle, or a vehicle leaving the motorway.
Author Contributions
In the creation of this thesis, W.S.’s main contributions were: interpreting and analyzing concepts; acquiring and processing analytical data; and completing the chapter. Y.M.’s main contributions were: critically revising the important intellectual content of the article. All authors have read and agreed to the published version of the manuscript.
Funding
This research received no external funding.
Institutional Review Board Statement
Not applicable.
Informed Consent Statement
Informed consent was obtained from all subjects in-volved in the study.
Data Availability Statement
The authors declare no new data was created during the creation of this article.
Conflicts of Interest
The authors declare no conflict of interest.
References
- Chen, P.; Min, Y.J.; Cheng, Z.G.; Zhu, Q.H.; Pan, Y.Y. Design and implementation of auxiliary driving system on foggy expressway. For. Eng. 2018, 34, 59–65. (In Chinese) [Google Scholar]
- Huang, Y.; Yan, X.; Li, X.; Duan, K.; Rakotonirainy, A.; Gao, Z. Improving car-following model to capture un-observed driver heterogeneity and following distance features in fog condition. Transp. A Transp. Sci. 2022, 229559. [Google Scholar] [CrossRef]
- Qiu, Y.; Lu, Y.; Wang, Y.; Jiang, H. IDOD-YOLOV7: Image-Dehazing YOLOV7 for Object Detection in Low-Light Foggy Traffic Environments. Sensors 2023, 23, 1347. [Google Scholar] [CrossRef]
- Tan, L. An extended car-following model considering the low visibility in fog on a highway with slopes. Int. J. Mod. Phys. C Phys. Comput. 2019, 30, 1950090. [Google Scholar] [CrossRef]
- Ramanujam, V. Lane Changing Models for Arterial Traffic; Massachusetts Institute of Technology: Cambridge, MA, USA, 2007. [Google Scholar]
- Tomer, T.; Zohar, D. Modeling duration of lane changes. Transp. Res. Rec. J. Transp. Res. Board 2007, 1999, 71–78. [Google Scholar]
- Kusuma, A.; Liu, R.; Choudhury, C. Modelling lane-changing mechanisms on motorway weaving sections. Transp. B Transp. Dyn. 2019, 8, 1–21. [Google Scholar] [CrossRef]
- Hou, Y.; Graf, P. Decentralized cooperative lane changing at freeway weaving areas using multi-agent deep re-inforcement learning. arXiv 2021, arXiv:2110.08124. [Google Scholar]
- He, Y.; Feng, J.; Wei, K.; Cao, J.; Chen, S.; Wan, Y. Modeling and simulation of lane-changing and collision avoiding autonomous vehicles on superhighways. Phys. A Stat. Mech. Its Appl. 2023, 609, 128328. [Google Scholar] [CrossRef]
- Xu, T.; Wen, C.; Zhao, L.; Liu, M.; Zhang, X. The Hybrid Model for Lane-Changing Detection at Freeway Off-Ramps Using Naturalistic Driving Trajectories. IEEE Access 2019, 7, 103716–103726. [Google Scholar] [CrossRef]
- Zhang, Q.; Sun, Z.; Shu, H. Research on Vehicle Lane Change Warning Method Based on Deep Learning Image Processing. Sensors 2022, 22, 3326. [Google Scholar] [CrossRef] [PubMed]
- Wang, J.; Zheng, H.; Zong, C. Longitudinal and lateral dynamics control of automatic lane change system. Trans. Inst. Meas. Control. 2019, 41, 4322–4338. [Google Scholar] [CrossRef]
- Liu, W.; Xia, X.; Xiong, L.; Lu, Y.; Gao, L.; Yu, Z. Automated Vehicle Sideslip Angle Estimation Considering Signal Measurement Characteristic. IEEE Sens. J. 2021, 21, 21675–21687. [Google Scholar] [CrossRef]
- Xiong, L.; Xia, X.; Lu, Y.; Liu, W.; Gao, L.; Song, S.; Yu, Z. IMU-Based Automated Vehicle Body Sideslip Angle and Attitude Estimation Aided by GNSS Using Parallel Adaptive Kalman Filters. IEEE Trans. Veh. Technol. 2020, 69, 10668–10680. [Google Scholar] [CrossRef]
- Liu, W.; Xiong, L.; Xia, X.; Lu, Y.; Gao, L.; Song, S. Vision-aided intelligent vehicle sideslip angle estimation based on a dynamic model. IET Intell. Transp. Syst. 2020, 14, 1183–1189. [Google Scholar] [CrossRef]
- Wang, P.; Liu, H.; Yang, Z.; Shu, B.; Xu, X.; Nie, G. Evaluation of Network RTK Positioning Performance Based on BDS-3 New Signal System. Remote Sens. 2021, 14, 2. [Google Scholar] [CrossRef]
- Li, M.; Qu, L.; Zhao, Q.; Guo, J.; Su, X.; Li, X. Precise Point Positioning with the BeiDou Navigation Satellite System. Sensors 2014, 14, 927–943. [Google Scholar] [CrossRef] [PubMed]
- Zuo, W.; Guo, C.; Liu, J.; Peng, X.; Yang, M. A Police and Insurance Joint Management System Based on High Precision BDS/GPS Positioning. Sensors 2018, 18, 169. [Google Scholar] [CrossRef] [PubMed]
- Togou, M.A.; Khoukhi, L.; Hafid, A. Performance analysis and enhancement of wave for v2v non-safety ap-plications. IEEE Trans. Intell. Transp. Syst. 2018, 19, 2603–2614. [Google Scholar] [CrossRef]
- Joshi, A.; James, M.R. Generation of Accurate Lane-Level Maps from Coarse Prior Maps and Lidar. IEEE Intell. Transp. Syst. Mag. 2015, 7, 19–29. [Google Scholar] [CrossRef]
- Atia, M.M.; Hilal, A.R.; Stellings, C.; Hartwell, E.; Toonstra, J.; Miners, W.B.; Basir, O.A. A Low-Cost Lane-Determination System Using GNSS/IMU Fusion and HMM-Based Multistage Map Matching. IEEE Trans. Intell. Transp. Syst. 2017, 18, 3027–3037. [Google Scholar] [CrossRef]
- Sivaraman, S.; Trivedi, M.M. Dynamic Probabilistic Drivability Maps for Lane Change and Merge Driver Assistance. IEEE Trans. Intell. Transp. Syst. 2014, 15, 2063–2073. [Google Scholar] [CrossRef]
- Wang, J.H.; Wang, Y.C.; Ding, H.F.; Xie, F. Research on Evasion Control of Vehicle Anti-Collision Warning System. Appl. Mech. Mater. 2013, 365–366, 407–411. [Google Scholar] [CrossRef]
- Chen, Y.-L.; Wang, C.-A. Vehicle Safety Distance Warning System: A Novel Algorithm for Vehicle Safety Distance Calculating Between Moving Cars. In Proceedings of the 2007 IEEE 65th Vehicular Technology Conference—VTC2007-Spring, Dublin, Ireland, 22–25 April 2007; pp. 2570–2574. [Google Scholar] [CrossRef]
- Amaro-Ramos, A.; Munoz-Rodriguez, D.; Vargas-Rosales, C. Geometrical channel model for vehicle-to-vehicle systems. AEUE Int. J. Electron. Commun. 2014, 68, 779–782. [Google Scholar] [CrossRef]
- Tandon, R.; Gupta, P.K. Sv2vcs: A secure vehicle-to-vehicle communication scheme based on lightweight au-thentication and concurrent data collection trees. J. Ambient. Intell. Humaniz. Comput. 2021, 12, 9791–9807. [Google Scholar] [CrossRef]
Disclaimer/Publisher’s Note: The statements, opinions and data contained in all publications are solely those of the individual author(s) and contributor(s) and not of MDPI and/or the editor(s). MDPI and/or the editor(s) disclaim responsibility for any injury to people or property resulting from any ideas, methods, instructions or products referred to in the content. |
© 2023 by the authors. Licensee MDPI, Basel, Switzerland. This article is an open access article distributed under the terms and conditions of the Creative Commons Attribution (CC BY) license (https://creativecommons.org/licenses/by/4.0/).